Article

Theoretical Prediction and Experimental Synthesis of Zr3AC2 (A = Cd, Sb) Phases

1
Key Laboratory of Advanced Technologies of Materials, Ministry of Education, School of Materials Science and Engineering, Southwest Jiaotong University, Chengdu 610031, China
2
School of Materials Science and Engineering, Zhengzhou University, Zhengzhou 450001, China
*
Authors to whom correspondence should be addressed.
These authors contributed equally to this work.
Materials 2024, 17(7), 1556; https://doi.org/10.3390/ma17071556
Submission received: 26 February 2024 / Revised: 26 March 2024 / Accepted: 26 March 2024 / Published: 28 March 2024

Abstract

:
MAX phases have great research value and application prospects, but it is challenging to synthesize the MAX phases containing Cd and Sb for the time being. In this paper, we confirmed the existence of the 312 MAX phases of Zr3CdC2 and Zr3SbC2, both from theoretical calculations and experimental synthesis. The Zr3AC2 (A = Cd, Sb) phase was predicted by the first-principles calculations, and the two MAX phases were confirmed to meet the requests of thermal, thermodynamic, and mechanical stabilities using formation energy, phonon dispersion, and the Born–Huang criteria. Their theoretical mechanical properties were also systematically investigated. It was found that the elastic moduli of Zr3CdC2 and Zr3SbC2 were 162.8 GPa and 164.3 GPa, respectively. Then, differences in the mechanical properties of Zr3AC2 (A = Cd, In, Sn, and Sb) were explained using bond layouts and charge transfers. The low theoretical Vickers hardness of the Zr3CdC2 (5.4 GPa) and Zr3SbC2 (4.3 GPa) phases exhibited excellent machinability. Subsequently, through spark plasma sintering, composites containing Zr3CdC2 and Zr3SbC2 phases were successfully synthesized at the temperatures of 850 °C and 1300 °C, respectively. The optimal molar ratio of Zr:Cd/Sb:C was determined as 3:1.5:1.5. SEM and the EDS results analysis confirmed the typical layered microstructure of Zr3CdC2 and Zr3SbC2 grains.

1. Introduction

Nowotny discovered the H-phases in 1967, and Barsoum defined this kind of material as the Mn+1AXn phase (MAX phase) until 2000 [1,2,3,4]. Mn+1AXn phases are a family of hexagonal, ternary layered compounds. Generally, M-site elements are early transition metals, A-site elements mainly come from ⅢA-ⅤA elements, and X-site elements are C, N, or B. All MAX phases have a hexagonal crystal structure, and their space group belongs to P63/mmc. The X atom is located at the center of the octahedron composed of M atoms, and the entire crystal structure is composed of densely packed M6X octahedron layers and A layers, which are alternated periodically. According to the difference in the number of M layers between two A layers, MAX phases can be generally divided into 211 (n = 1), 312 (n = 2), and 413 (n = 3) phases [5,6,7,8,9,10,11,12,13]. The MAX phase contains covalent, ionic, and metallic bonds and has both ceramic and metallic properties [14]. The strong covalent and ionic bonds between MX atoms contribute to the thermodynamic and mechanical stability of the MAX phase [15]. The weak covalent bonds and metal bonds exist between MA atoms, and metal bonds exist between MM atoms. The special nanolayered crystal structure endows them with a high elastic modulus, high strength, and excellent machinability, as well as high electrical conductivity and high thermal conductivity. Therefore, MAX phases are promising to be high-temperature structural materials, electrode brush materials, chemical resistant materials, high-temperature heating materials, etc. [16,17].
Nowadays, MAX phases are becoming popular research materials due to their excellent properties and wide range of potential applications [18]. In recent years, more and more 312 MAX phases have been discovered and studied. For instance, 312 MAX phases containing In and Sn as A-position elements have been successfully synthesized recently. Lapauw et al. successfully synthesized Zr3SnC2 by spark plasma sintering with Fe, Co, or Ni additives in 2017 and proposed the mechanism for the synthesis of Zr3SnC2 [19,20]. Most recently, an indium-containing MAX phase of Zr3InC2 was also successfully sintered by spark plasma sintering [21]. In the periodic table of elements, Cd and Sb are in the same period of In and Sn, and these four elements are located next to each other. However, perhaps due to the challenging synthesis of MAX phases in which the A elements are Cd and Sb, we found that previous research reports on MAX phases containing Cd and Sb were uncommon. For example, Ti2CdC was successfully sintered at 750 °C by Nowotny in 1964 [22]. The crystal structure, chemical bonding, and elastic properties of Ti2CdC were investigated by first-principles calculations, and this cadmium-containing MAX phase was predicted to have potential applications as electric friction materials [23,24]. Therefore, theoretical prediction and experimental synthesis of Zr3AC2 (A = Cd, Sb) MAX phases is a necessary and meaningful endeavor. To the best of our knowledge, this article is the first report on Zr3CdC2 and Zr3SbC2 phases. The discovery of these two MAX phases may provide ideas for the synthesis of high-purity Zr3CdC2 and Zr3SbC2 phases and new options in the field of electrically and thermally conductive materials.
In this work, the new 312 MAX phases of Zr3AC2 (A = Cd, Sb) were predicted to be stable by using the first-principles calculations, and their basic mechanical properties were systematically calculated. Furthermore, by adopting spark plasma sintering, the Zr3CdC2 and Zr3SbC2 phases were successfully synthesized, and their laminar microstructures were well determined.

2. Experimental Procedures

2.1. First-Principles Calculation

In this work, all the calculations were performed by the density functional theory (DFT) calculations in a framework of generalized gradient approximation with the projector augmented-wave method implemented in the Vienna ab initio simulation package (VASP.5.4.4, Hafner Group, University of Vienna, Vienna, Austria), where the Perdew–Burke–Ernzerhof (PBE) functional has been adopted for exchange-correlation potential [25,26]. The convergence criteria for energy and force were set to 10−6 eV and 0.01 eV/Å, respectively. The plane-wave basis set cutoff was 450 eV after the convergent test, and the special k-points sampling integration over the Brillouin zone was employed using the Monkhorst–Pack method with 12 × 2 × 2 spatial k-points mesh. The elastic constants, mechanical moduli, and phonon dispersion were calculated through the finite displacement method. In order to obtain an accurate acoustic vibration mode, we first optimized the lattice structure of the MAX phase. Secondly, the mechanical constants were calculated using density functional perturbation theory (DFPT). Finally, lattice vibration and thermodynamic properties were extracted from the VASP output by the Phonopy post-processing 2.17.1 software. Because MAX phases had a layered structure, the van der Waals force was involved through the Grimme-D3 scheme to correctly address the interactions between layers. This method can more accurately describe the weak interaction between molecules by introducing additional van der Waals terms [27]. Additionally, the crystal structures of the Zr3AC2 (A = Cd, Sb) phases were visualized by using the VESTA-gtk3 software [28].

2.2. Synthesis of Zr3CdC2 and Zr3SbC2 Phases

Commercial powders of zirconium (99.5% purity, 500 mesh; Eno High-Tech Material Development Co., Ltd., Qinhuangdao, China), cadmium (99.5% purity, 300 mesh; Eno High-Tech Material Development Co., Ltd., China), antimony (99.9% purity, 500 mesh; Eno High-Tech Material Development Co., Ltd., China), and graphite (99.95%, 500 mesh; Eno High-Tech Material Development Co., Ltd., China) were used as the initial materials. To successfully synthesize the Zr3CdC2 and Zr3SbC2 phases, different sintering temperatures and molar ratios were designed. The powders were weighed using an electric balance with an accuracy of 10−4 g and mixed in a plastic bottle for 12 h at 50 rpm. Then, the mixture was placed into a graphite die with a diameter of 20 mm. The sintering process was carried out in a spark plasma sintering furnace (SPS-20T-10, Shanghai Chenhua Technology Co., Ltd., Shanghai, China). The heating rate was 50 °C/min, and the applied pressure was 30 MPa. After sintering, the samples were cooled down to ambient temperature with the furnace. The surface contaminations of samples were removed by a diamond grinding wheel.

2.3. Composition and Microstructure Characterization

X-ray diffraction (XRD) (Ultima IV, Rigaku, Japan) with a Cu-Kα radiation source in the 2θ range of 5–75° was used for the composition analyses of the Zr3CdC2 and Zr3SbC2 phases. The theoretically calculated X-ray diffraction patterns of Zr3CdC2 and Zr3SbC2 were determined by the Materials Studio 8.0 software (Accelrys Software Inc., San Diego, CA, USA) using the optimized lattice parameters of Zr3CdC2 and Zr3SbC2 as the input. The microstructure features and elemental compositions of the fracture surfaces of sintered samples were monitored using a scanning electron microscope (SEM) (Apreo 2C, Thermo Fisher Scientific, Brno, Czech Republic) equipped with an energy dispersive spectroscope (EDS) (Oxford ultim Max 65, Oxford Ins., Oxford, UK).

3. Results and Discussion

3.1. Stability Calculation of Zr3CdC2 and Zr3SbC2 Phases

The crystal structures of experimentally synthesized Zr3SnC2 and Zr3InC2 are both P63/mmc [19,21]. Since Cd, In, Sn, and Sb belong to the same period in the periodic table of the elements, it was predicted that the properties and crystal structures of Zr3CdC2 and Zr3SbC2 are similar to those of Zr3SnC2 and Zr3InC2, and therefore, they were modeled and calculated according to the P63/mmc space group. Figure 1 shows the crystal structures of two new 312 MAX phases of Zr3CdC2 and Zr3SbC2. The optimized lattice parameters of Zr3AC2 (A = Cd, In, Sn, Sb) were calculated and are listed in Table 1. For comparison, the experimental parameters of two synthesized 312 phases of Zr3InC2 and Zr3SnC2 are also listed. It is clearly determined that when the M and X sites are identical, the planar lattice parameter a shows a monotonic increase from 3.319 to 3.367 Å with the increasing order of the atomic number of A-site elements, while the vertical lattice parameter c shows a decrease simultaneously from 20.393 to 19.413 Å, indicating that the bonds within the (0001) plane become weaker and the interlayer interactions become stronger when the A-site elements go from Cd to In to Sn and further to Sb. Additionally, it is known that if the crystals of Zr3CdC2 and Zr3SbC2 are stable, they must meet the requests of thermal, thermodynamic, and mechanical stabilities. Therefore, the thermal stability was quantized by the formation energy:
Δ H = H c r y s t a l l H M m H A n H X l + m + n
where M, A, and X are composite elements; l, m, n are the number of each element in the unit cell; Hcrystal is the enthalpy of the unit cell; and HM, HA, and HX are the corresponding enthalpies of the composite atom in the MAX phases of Zr3CdC2 and Zr3SbC2. The calculated formation energies (ΔH) of the Zr3CdC2 and Zr3SbC2 phases were −1.104 and −1.306 eV/atom, respectively. Therefore, both the formation energies of the Zr3CdC2 and Zr3SbC2 phases are negative, corresponding to the thermal stability.
Furthermore, the thermodynamic stability of the Zr3CdC2 and Zr3SbC2 phases was investigated by calculating the phonon dispersion, as shown in Figure 2. The phonon dispersion curve can reflect the dynamic stability of materials to a certain extent. In the first-principles calculation, high symmetry points were selected in the Brillouin zone according to the crystal structure to calculate the mechanical constants. The calculation results showed that there was no negative frequency (imaginary frequency) in the Brillouin zone, which means that the dynamic stability of materials is studied under standard pressure. The minor softness around the Γ and I points are deemed to be caused by the numerical error in calculations but not by the solid-state physics theory. It is observed that Zr3SbC2 has a smaller maximum frequency than Zr3CdC2, which means that Zr3CdC2 has a higher melting point, i.e., the highest frequency mode is more difficult to activate for Zr3CdC2 [29]. The calculated melting point of Zr3CdC2 (1548.344 K) is higher than that of Zr3SbC2 (1451.880 K). In addition, it is known that the Debye temperature is connected to the lattice vibration, thermal expansion coefficient, specific heat, and melting point of the crystal. As the maximum frequency mode of vibration, the calculated TD using elastic modulus is specified as one of the standard approaches [30,31]. The calculated Debye temperatures of Zr3CdC2 and Zr3SbC2 are 392.7 K and 386.2 K, respectively, lower than those of Zr3InC2 (488.9 K) and Zr3SnC2 (493.7 K).
On the other hand, the crystals of Zr3CdC2 and Zr3SbC2 are also mechanically stable and are confirmed to meet the Born–Huang criteria (Equation (2)), where Cij is presenting the elastic constants and is listed in Table 2 [32]:
C 11 > | C 12 | , 2 C 13 2 < C 33 ( C 11 + C 12 ) , C 44 > 0
It is seen that the pure shear elastic constants of C44 are lower than the unidirectional elastic constants of C11 and C33. This result means that the shear deformation is easier to occur in comparison with linear compression along the crystallographic a- and c-axes. The unequal values of C11, C33, and C44 (C11 ≠ C33 ≠ C44) imply different atomic arrangements and hence, different bonding strengths along the a-axis, c-axis, and shear planes. The combination of C12 and C13 leads to functional stress along the crystallographic a-axis when a uniaxial strain exists in both the b- and c-axes. The low values of these constants imply that the Zr3CdC2 and Zr3SbC2 phases will accept shear deformation along the b- and c-axes when adequate stress is applied to the a-axis of the crystals.

3.2. Theoretical Mechanical Properties of Zr3CdC2 and Zr3SbC2 Phases

In order to clearly understand the mechanical properties of the Zr3CdC2 and Zr3SbC2 phases, the bulk modulus (B), shear modulus (G), Young’s modulus (E), Pugh’s ratio, and Vickers hardness (H) were calculated based on the equations (S is the elastic softness constant) [33,34,35,36,37,38,39,40,41]:
B V = ( 2 ( C 11 + 2 C 12 + 4 C 13 + C 33 ) / 9
B R = 1 / ( 2 S 11 + 2 S 12 + 4 S 13 + S 33 )
G V = ( 3.5 C 11 2.5 C 12 2 C 13 + C 33 + 6 C 44 ) / 15
G R = 15 / ( 8 S 11 10 S 12 8 S 13 + 4 S 33 + 6 S 44 )
B = ( B V + B R ) / 2
G = ( G V + G R ) / 2
H V G = 0.1769 G 2.899
The calculated bulk moduli, shear moduli, and Vickers hardnesses of the Zr3CdC2 and Zr3SbC2 phases are listed in Table 3, compared to those of the Zr3InC2 and Zr3SnC2 phases. Also, the changing tendencies of the bulk moduli, shear moduli, Young’s moduli, and Vickers hardness of the Zr3AC2 (A = Cd, In, Sn, and Sb) phases are shown in Figure 3. It is seen that the bulk modulus shows a monotonic increase from 137.942 to 160.068 GPa when the A-site element goes from Cd to In and finally to Sn (Figure 3a). For the Zr3SnC2 and Zr3SbC2 phases, they have larger bulk moduli of 160.068 and 159.913 GPa, respectively. Whereas for the shear modulus, the Zr3SbC2 and Zr3CdC2 phases have lower values of 61.810 and 62.477 GPa than those of Zr3InC2 and Zr3SnC2 of 95.251 and 102.306 GPa, respectively. According to the calculated Pugh’s ratio, Zr3CdC2 (2.208) and Zr3SbC2 (2.587) are the ductile phases (B/G > 1.75), while Zr3InC2 (1.455) and Zr3SnC2 (1.565) belong to the brittle phases. As a result, the Zr3InC2 (15.842 GPa) and Zr3SnC2 (14.625 GPa) phases have higher Vickers hardnesses than those of Zr3CdC2 (5.488 GPa) and Zr3SbC2 (4.309 GPa), as shown in Figure 3b.
Additionally, the bond length, bond population, and Bader charge (ΔQ) of the Zr3CdC2 and Zr3SbC2 phases were calculated, as listed in Table 4. Here, Zr1 is an atom far away from the atomic layer A, and Zr2 is an atom near the atomic layer A. It can be seen that the comprehensive bond populations of A-site atoms In (0.87 and 1.24) and Sn (0.87 and 1.23) are all larger than those containing Cd atoms (0.85 and 1.24), indicating that the covalent interaction between Zr and In/Sn elements is strong. Because Zr3InC2 and Zr3SnC2 crystals have stronger covalent bonds inside, they show a higher elastic modulus and Vickers hardness. Whereas, for the Zr3SbC2 phase, though its interatomic population number is larger (0.88 and 1.24), its interatomic bond length (2.384 Å and 2.268 Å) is larger than those of Zr3InC2 (2.383 Å and 2.245 Å) and Zr3SnC2 (2.380 Å and 2.260 Å). Generally speaking, the longer the bond length, the lower the bond energy and the lower the Vickers hardness. Additionally, the total electron gain/loss of electrons in the crystals of Zr3CdC2 (1.692 and 2.726) and Zr3SbC2 (1.700 and 2.658) is greater than those of Zr3InC2 (1.698 and 2.703) and Zr3SnC2 (1.577 and 2.526), which indicates that their ionic properties are stronger and their covalent properties are weaker; that is, their Vickers hardness values are lower than those of Zr3InC2 and Zr3SnC2. The relatively high atomic charge transfer indicates the main ionic bond characteristics. The number of charges transferred by Zr1 is higher than that transferred by Zr2, which indicates that its covalence is weak. Interestingly, this conclusion is self-consistent with the long bond length and weak bond energy of Zr1-C [42].

3.3. Synthesis and Microstructure Characterization of Zr3CdC2 and Zr3SbC2 Phases

Initially, in an attempt to synthesize the Zr3CdC2 and Zr3SbC2 phases by spark plasma sintering, mixed powders with the molar ratio of Zr:Cd/Sb:C = 3:1.5:1.5 were sintered based on the consideration of easy evaporation of Cd/Sb and C deficiency in the P63/mmc hexagonal crystals. Considering the synthesis temperature of Ti2CdC (750 °C [22]), Zr3InC2 (1400 °C [21]) and Zr3SnC2 (1200 °C [19]), the sintering temperatures of complexes were initially designed as 850 °C and 1300 °C, respectively. The examined X-ray diffraction (XRD) patterns acquired from the synthesized samples are displayed in Figure 4a and Figure 5a. In Figure 4a, in combination with the PDF cards, it is determined that a large amount of Zr, ZrC, ZrCd2, and unknown phases exist in the cadmium-containing sample; while, in Figure 5a, it is judged that ZrC, Zr2Sb3, Zr2Sb, and unknown phases are in the antimony-containing sample. Significantly, in comparison with the theoretical XRD patterns, as shown in Figure 4b and Figure 5b, the (002) and (004) diffraction peak positions of Zr3CdC2 and Zr3SbC2 have a similar degree of rightward shift. This might be due to the occurrence of crystal defects in the Zr3CdC2 and Zr3SbC2 phases, resulting in smaller lattice parameters. Anyhow, the (002) and (004) diffraction planes of Zr3CdC2 and Zr3SbC2 can still be presumed to be in greater accord with the theoretical results. Therefore, it is expected that the Zr3CdC2 and Zr3SbC2 phases have been synthesized. Furthermore, in order to enhance the purity of the samples, the mixture powders were sintered at different temperatures, and the different molar ratios of the mixture powders were designed and annealed at the optimal temperature for comparison. Figure S1 shows the XRD patterns of the cadmium-containing samples synthesized at 650–1050 °C with the molar ratio of Zr:Cd:C = 3:1.5:1.5. And Figure S2 shows the XRD patterns of the antimony-containing samples synthesized at 900–1400 °C with the molar ratio of Zr:Sb:C = 3:1.5:1.5. By comparing the XRD patterns in Figure S1, it can be found that only at 850 °C does the cadmium-containing sample have the least impurity phases, and the XRD pattern is closest to the theoretical result in Figure 4b. Therefore, 850 °C is considered to be the optimum sintering temperature for the Zr3CdC2 phase. Similarly, the optimum sintering temperature for synthesizing the Zr3SbC2 phase was determined as 1300 °C. Continuously, for the Zr3CdC2 phase, the mixed powders with the molar ratios of Zr:Cd:C = 3:(1.4–1.8):2 were sintered at 850 °C, and the examined XRD patterns are shown in Figure S3. It is seen that no obvious existence of the Zr3CdC2 phase could be determined. Then, the molar ratios of the mixture powders were modified to be 3:1.5:(1.5–2.25), and the samples were sintered at the optimum temperature of 850 °C. It is seen that there is no remarkable enhancement of purity of the Zr3CdC2 phase, as shown in Figure S4. It seems that the optimal molar ratio is 3:1.5:1.5 to synthesize the Zr3CdC2 phase. Similarly, for the Zr3SbC2 phase, the mixed powders with the molar ratios of Zr:Sb:C = 3:(1.5–1.95):2 were sintered at 1300 °C. By comparing the XRD patterns of samples sintered with the different molar ratios, the purity of the Zr3SbC2 phase was not obviously enhanced, as shown in Figure S5. Therefore, the optimized molar ratio of synthesizing the Zr3SbC2 phase is confirmed as Zr:Sb:C = 3:1.5:1.5. Owing to the existence of too many impurities in the sintered samples, it is difficult to refine the obtained XRD patterns by using the Rietveld method. Anyhow, in order to richen the information of the new phases of Zr3CdC2 and Zr3SbC2, the theoretical crystal constants, atomic positions, and the XRD data are given and listed in Tables S1–S3.
In addition, in order to characterize the Zr3CdC2 and Zr3SbC2 grains in the sintered samples, the fracture surfaces of sintered bulks that underwent the shear loading were observed by using the scanning electron microscope, as shown in Figure 6 and Figure 7. Clearly, the grains with a typical nanolaminar character of MAX phases in the sintered bulks are the Zr3CdC2 and Zr3SbC2 phases (Figure 6a–f and Figure 7a–f), which are the same as other typical MAX phases of Ti3AlC2 and Ti3SiC2 [43,44]. Obvious bending and twisting phenomena were observed in these grains. Many equiaxed carbide grains are nearby. Additionally, the testing positions of the energy dispersive spectroscopy (EDS) analysis are labeled by white crosses in Figure 6 and Figure 7b,d,f, and the results are displayed in Table 5 and Table 6. It is confirmed that the average element ratios are Zr:Cd = 3:0.976 for Zr3CdC2 grains and Zr:Sb = 3:1.012 for Zr3SbC2 grains, respectively, very close to the ratio of 3:1. Here, no data of the C element was collected, as the EDS analysis could not guarantee the accuracy of the C element.
Therefore, based on the above results, it is believed that the Zr3CdC2 and Zr3SbC2 phases could stably exist and be successfully synthesized. Combined with the above theoretical calculations, the pure Zr3CdC2 and Zr3SbC2 MAX phases are shown to have excellent machinability. However, due to the limitation of sintering, it is rather difficult to purify the Zr3CdC2 and Zr3SbC2 phases, and it is greatly worth it for us to explore new synthesis methods to improve the purity of the two MAX phases.

4. Conclusions

Two new ternary laminar MAX phases of Zr3CdC2 and Zr3SbC2 were predicted and synthesized. The obtained results are listed as follows:
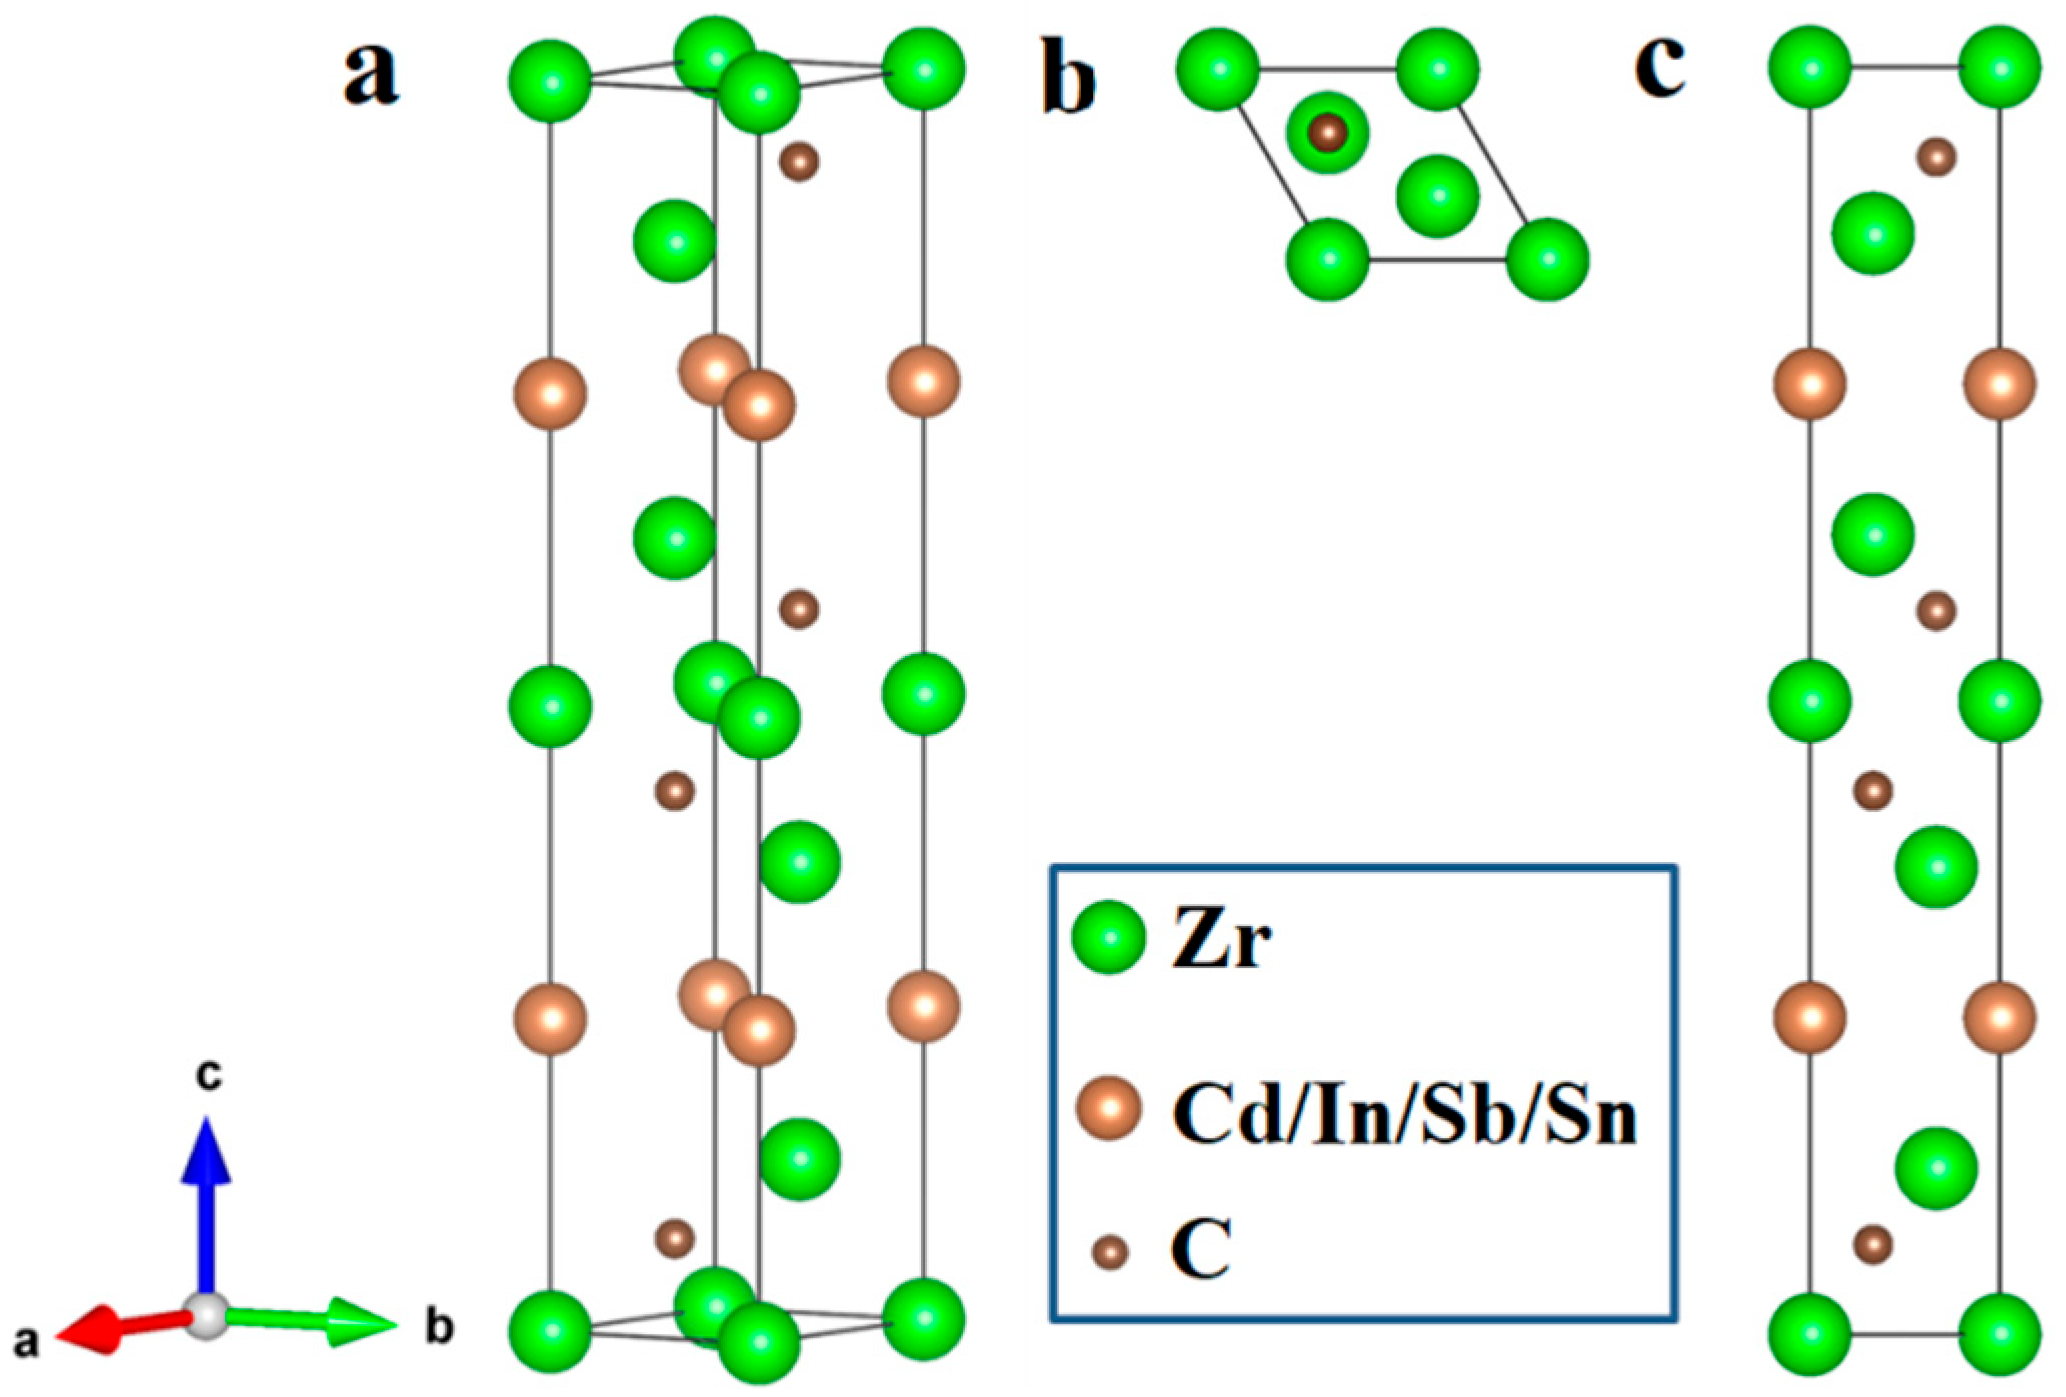
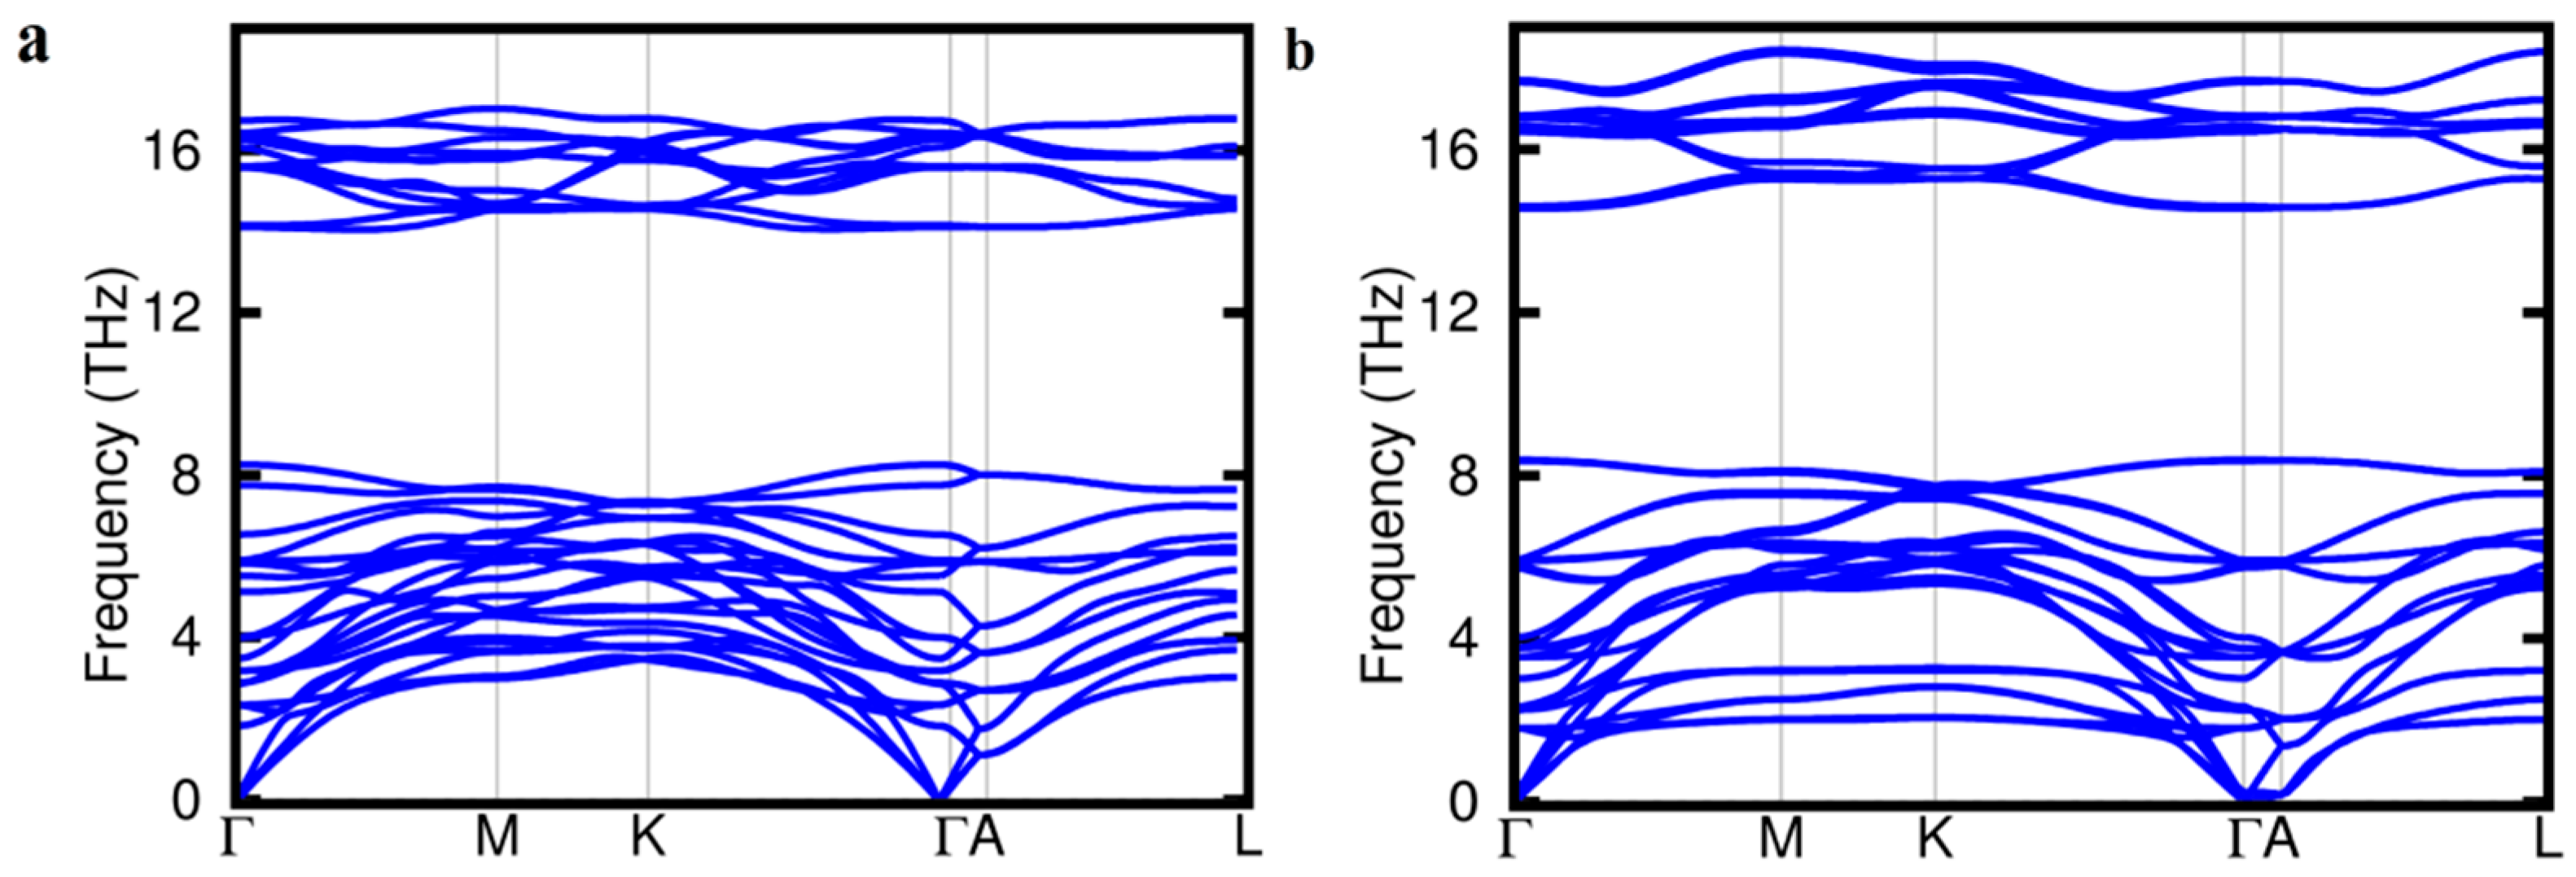
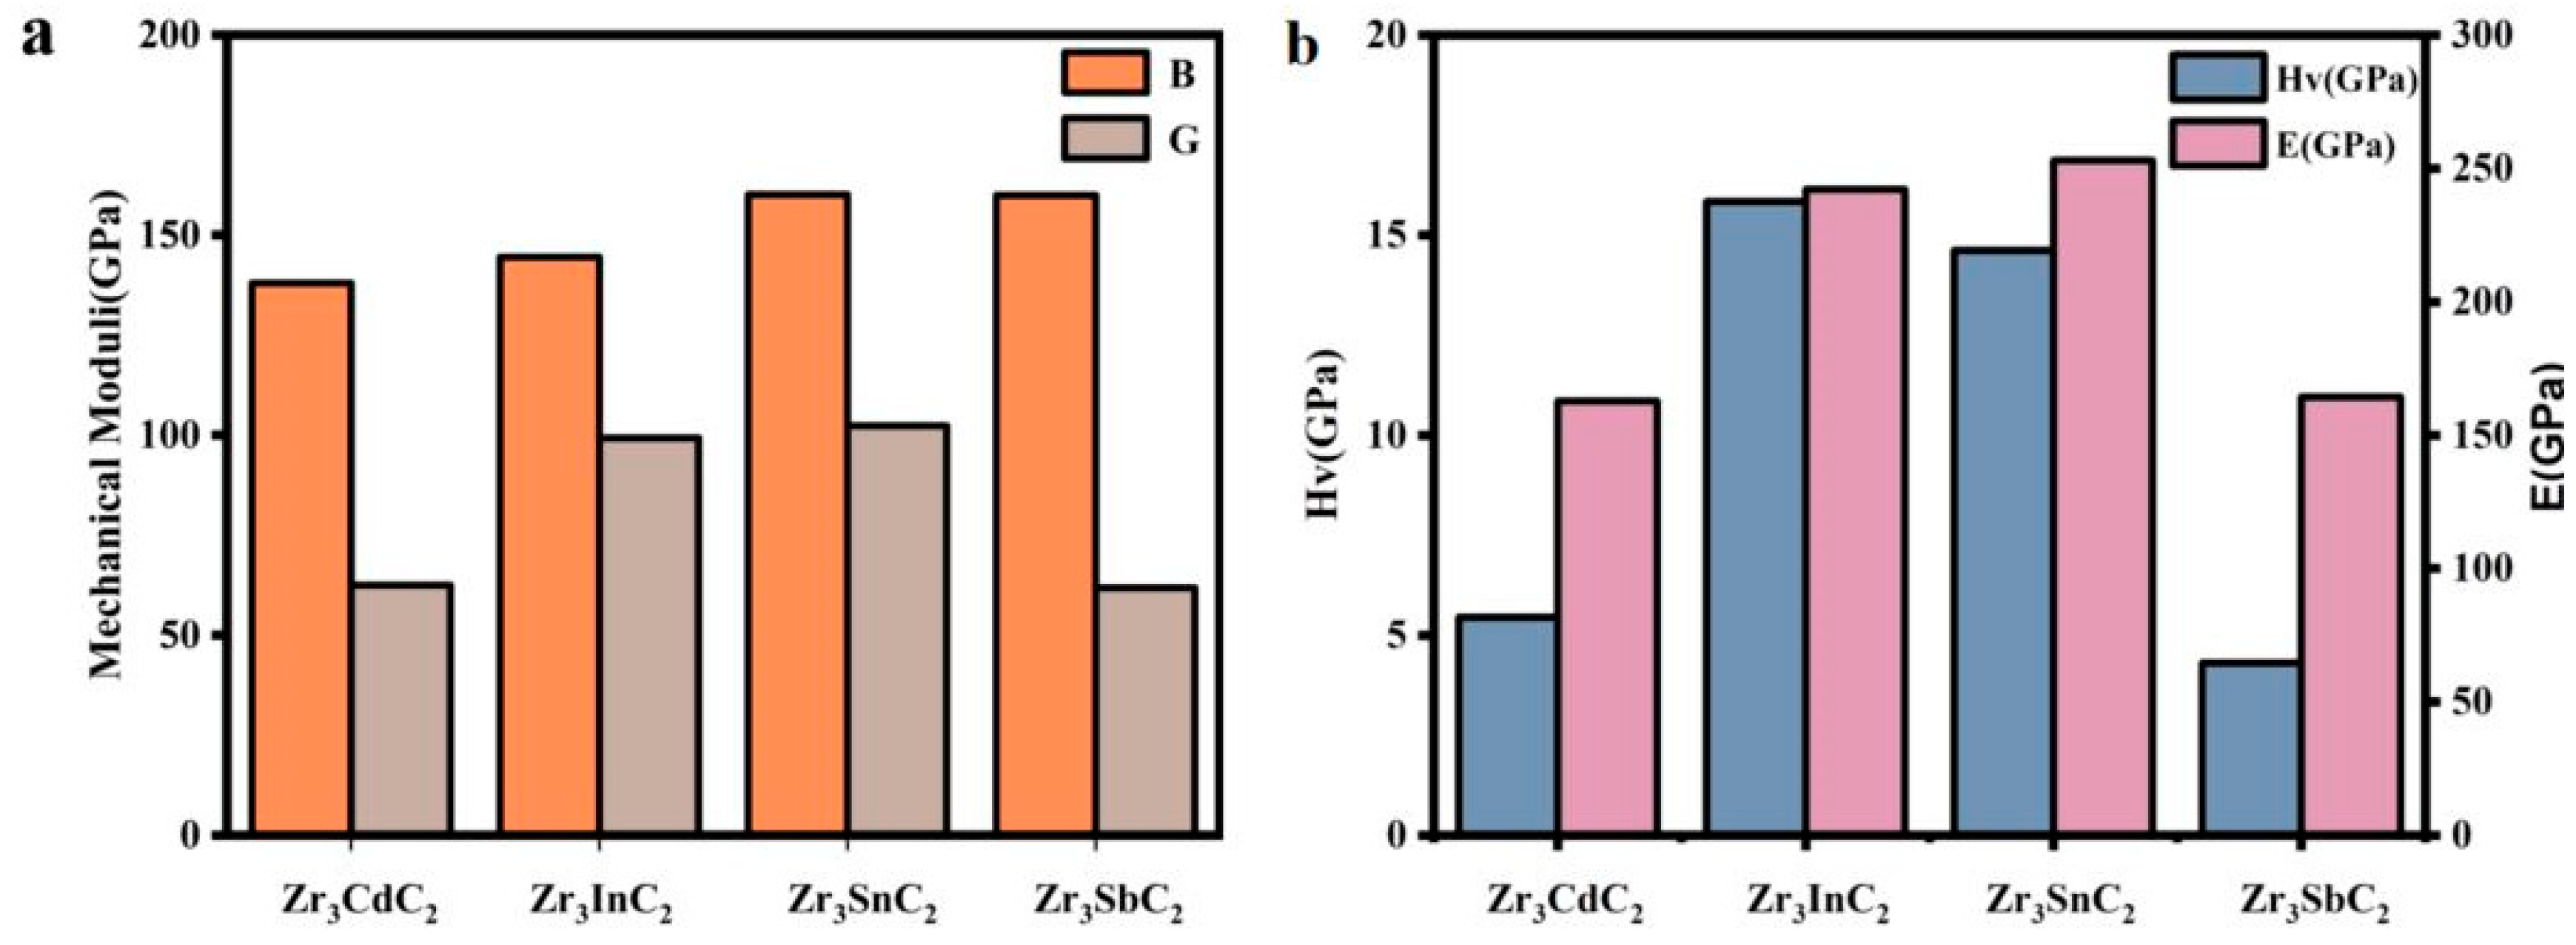
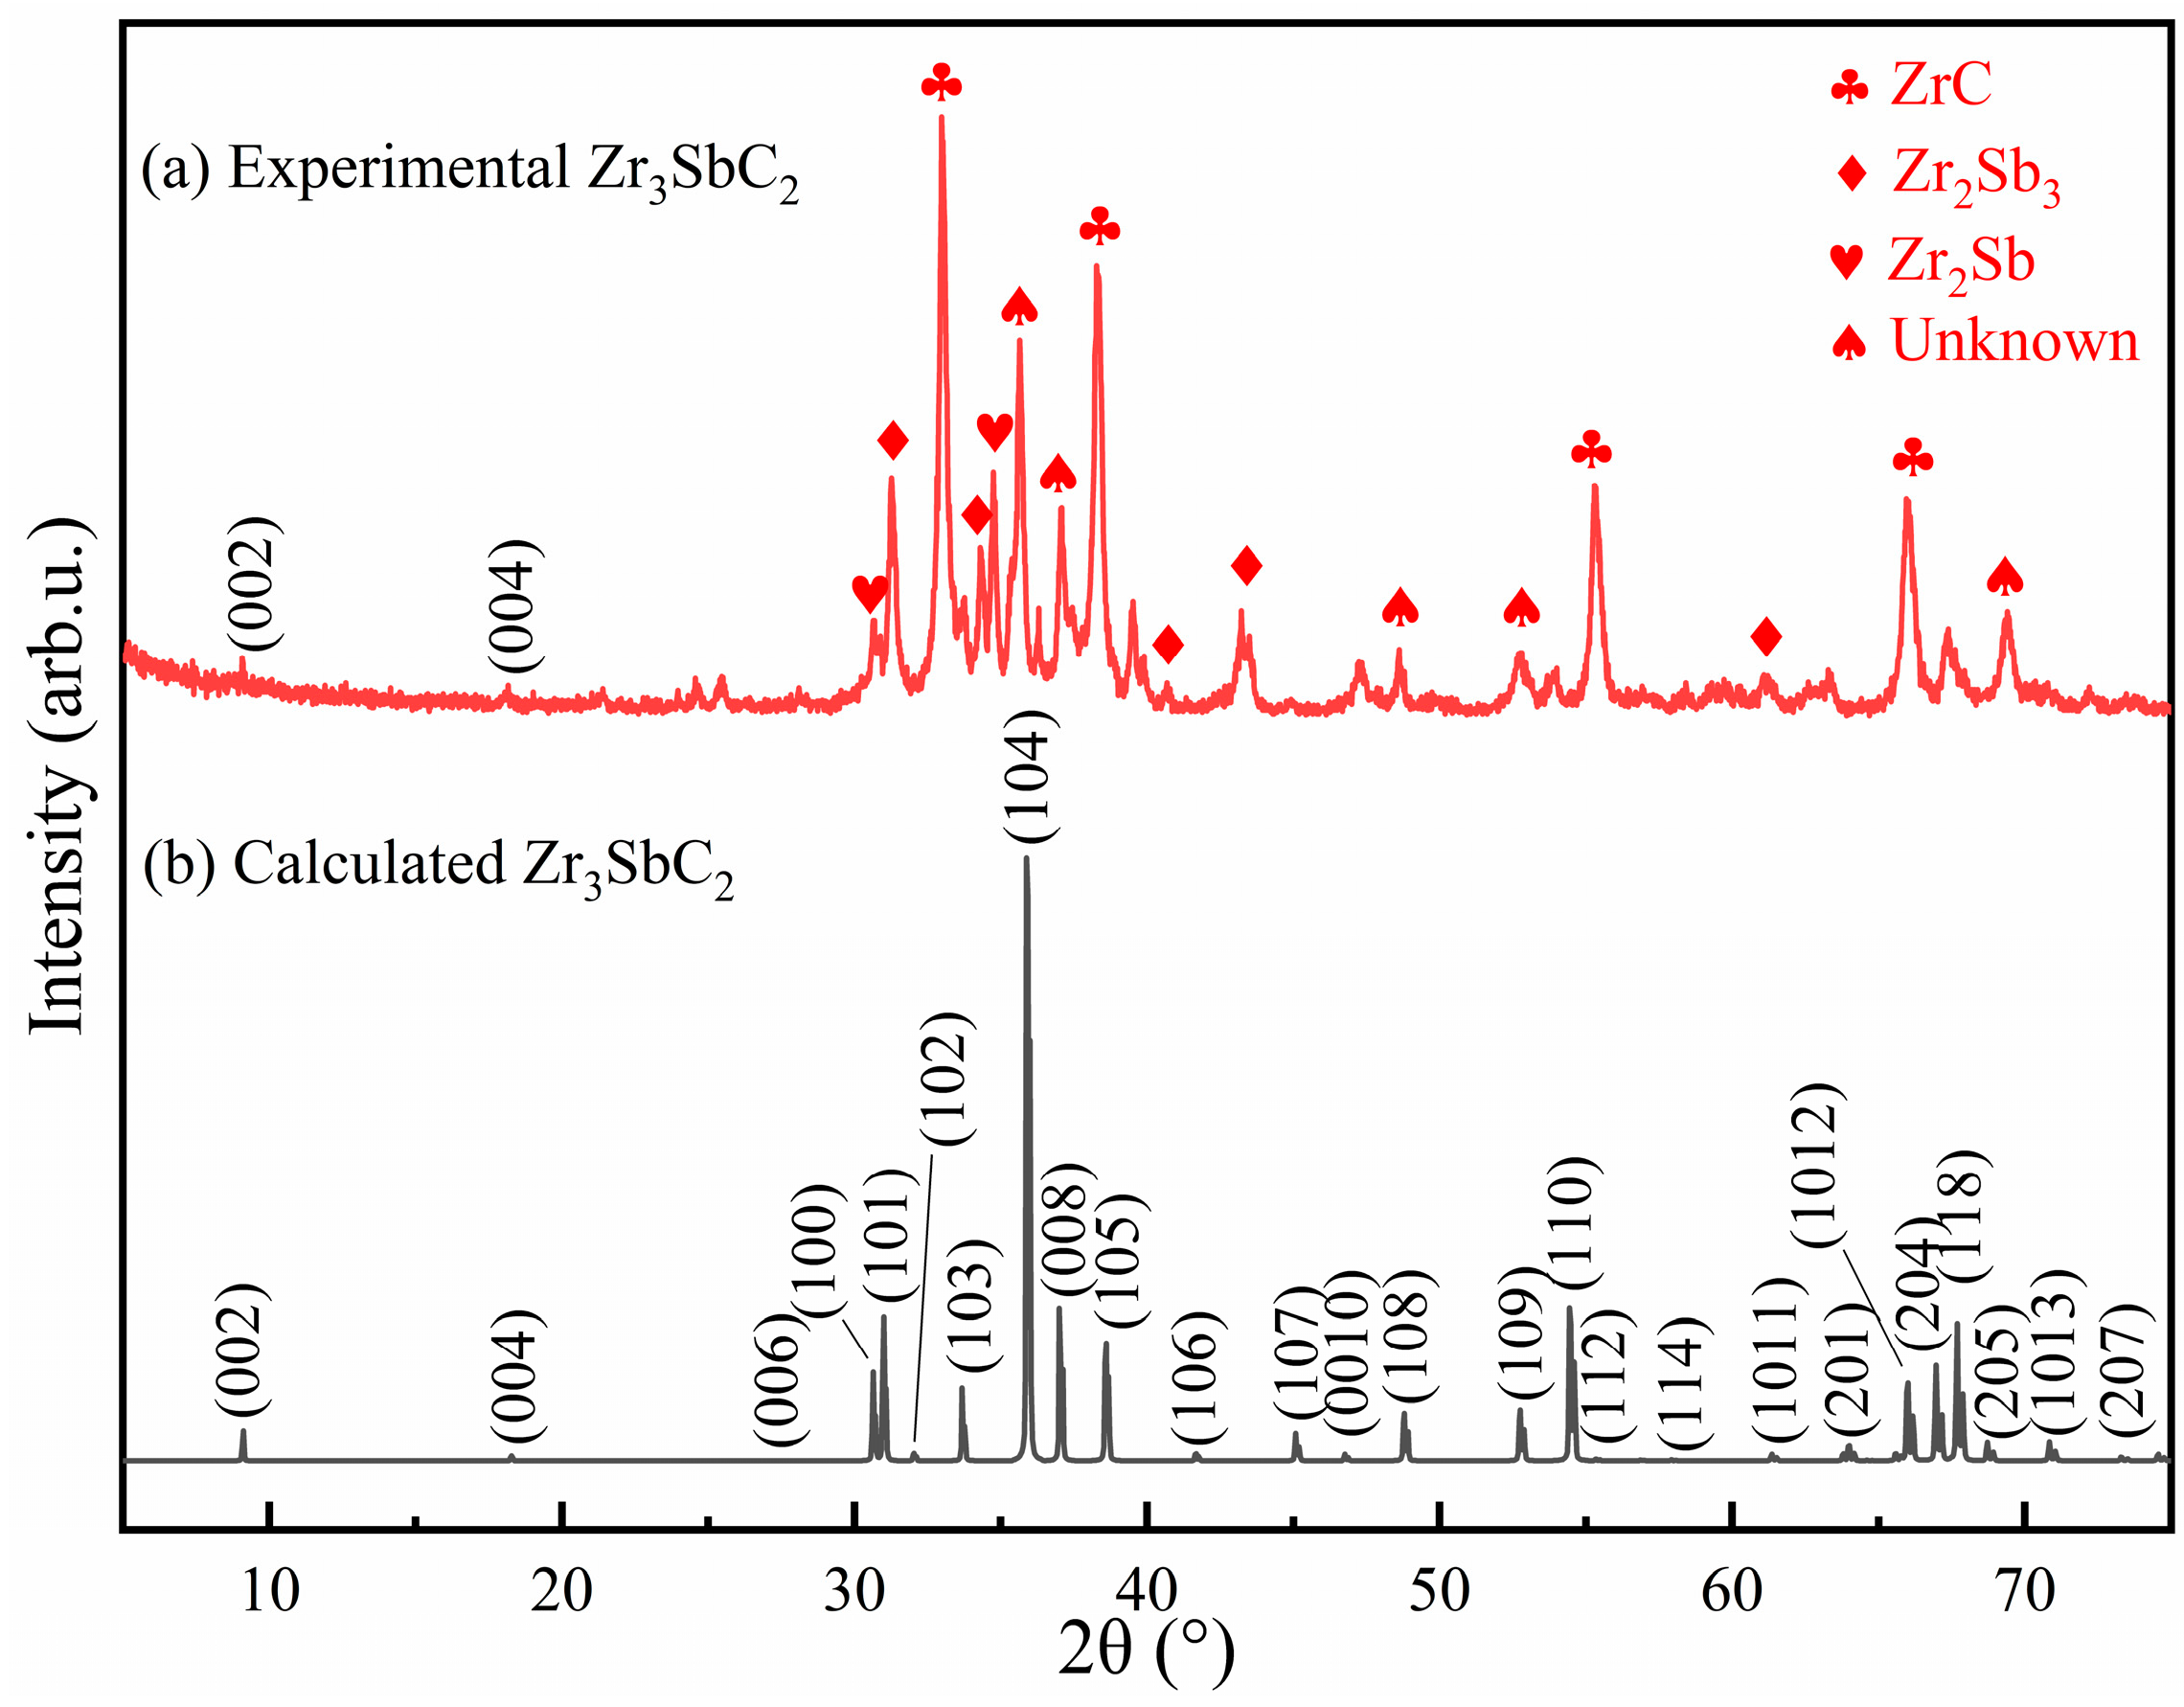
  • It was confirmed that the Zr3CdC2 and Zr3SbC2 phases belonged to the space group of P63/mmc with the hexagonal crystal structure. The calculated crystal parameters of Zr3CdC2 were a = 3.319 Å and c = 20.393 Å, and those of Zr3SbC2 were a = 3.367 Å and c = 19.413 Å. The calculated formation energies of Zr3CdC2 and Zr3SbC2 were −1.104 and −1.306 eV/atom, respectively, which confirm the thermal stability of the two phases. The absence of imaginary frequencies in the acoustic branches of the phonon band structure and the calculation results using the Born–Huang criterion confirmed the thermodynamic and mechanical stability of the two MAX phases. Additionally, the calculated Young’s moduli of Zr3CdC2 and Zr3SbC2 were 162.846 GPa and 164.265 GPa, respectively. The theoretical Vickers hardnesses of the Zr3CdC2 (5.448 GPa) and Zr3SbC2 (4.309 GPa) phases were low due to the weaker covalent bonds, exhibiting excellent potential machinability.
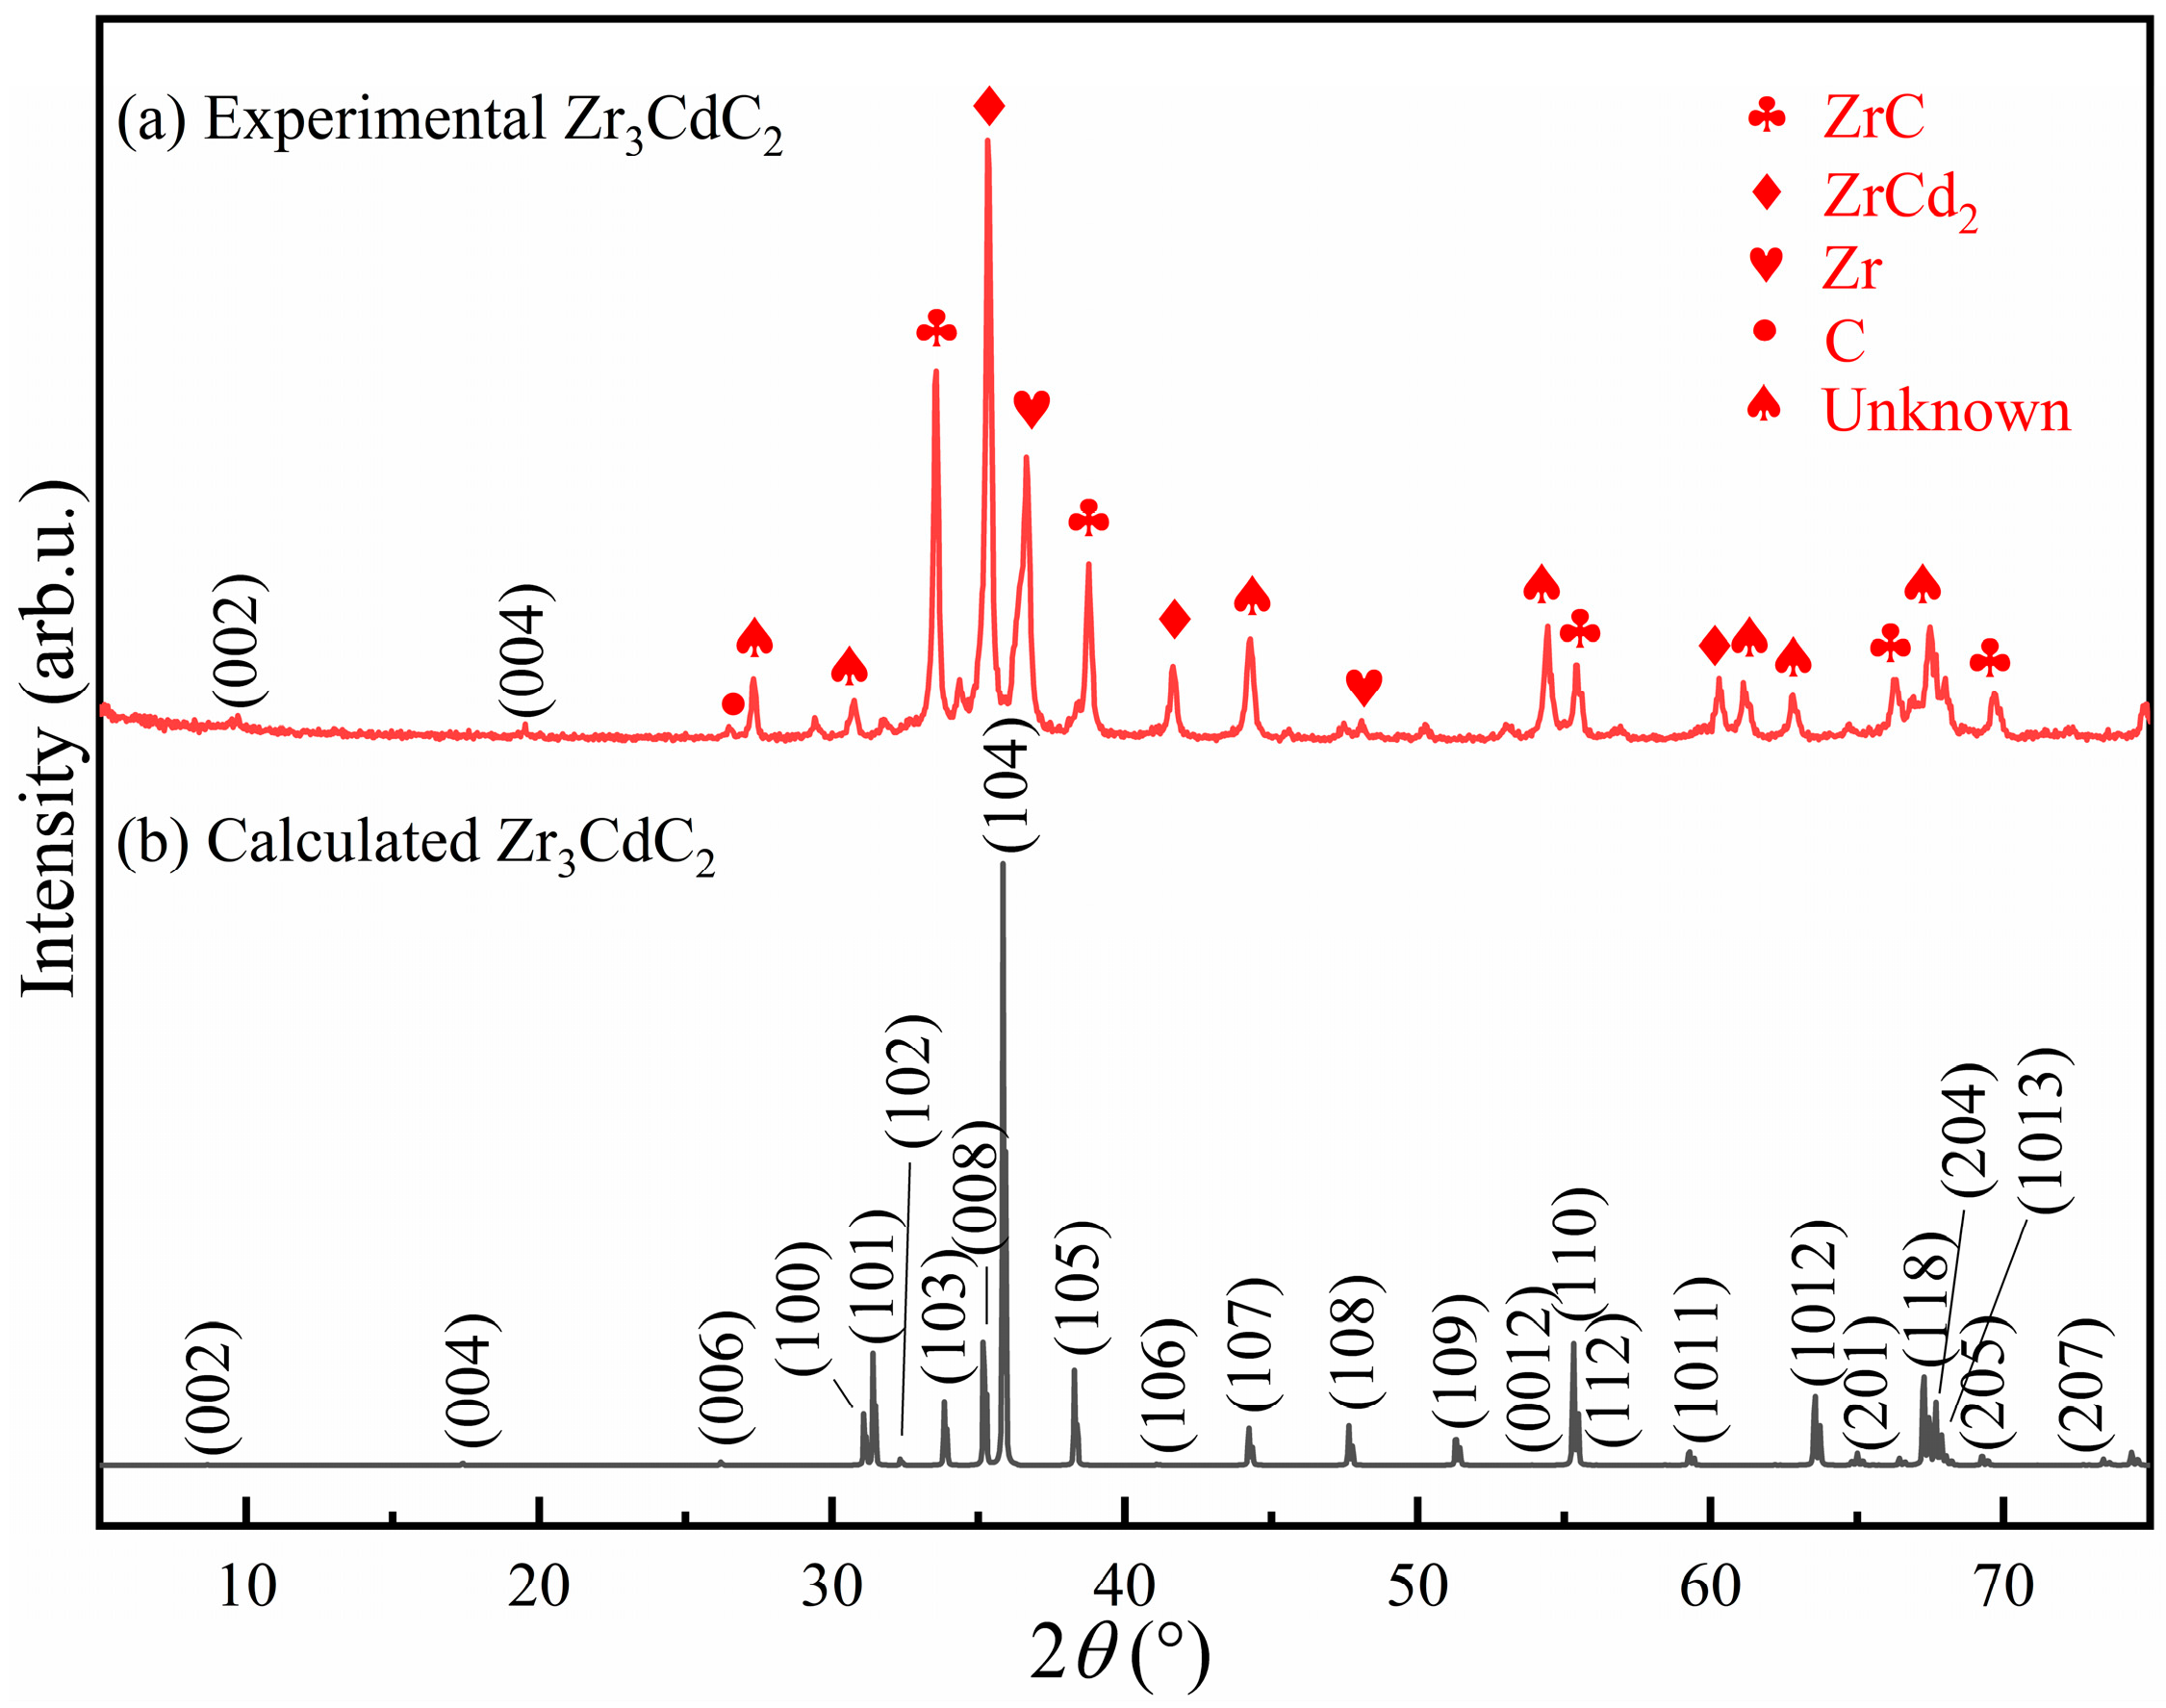
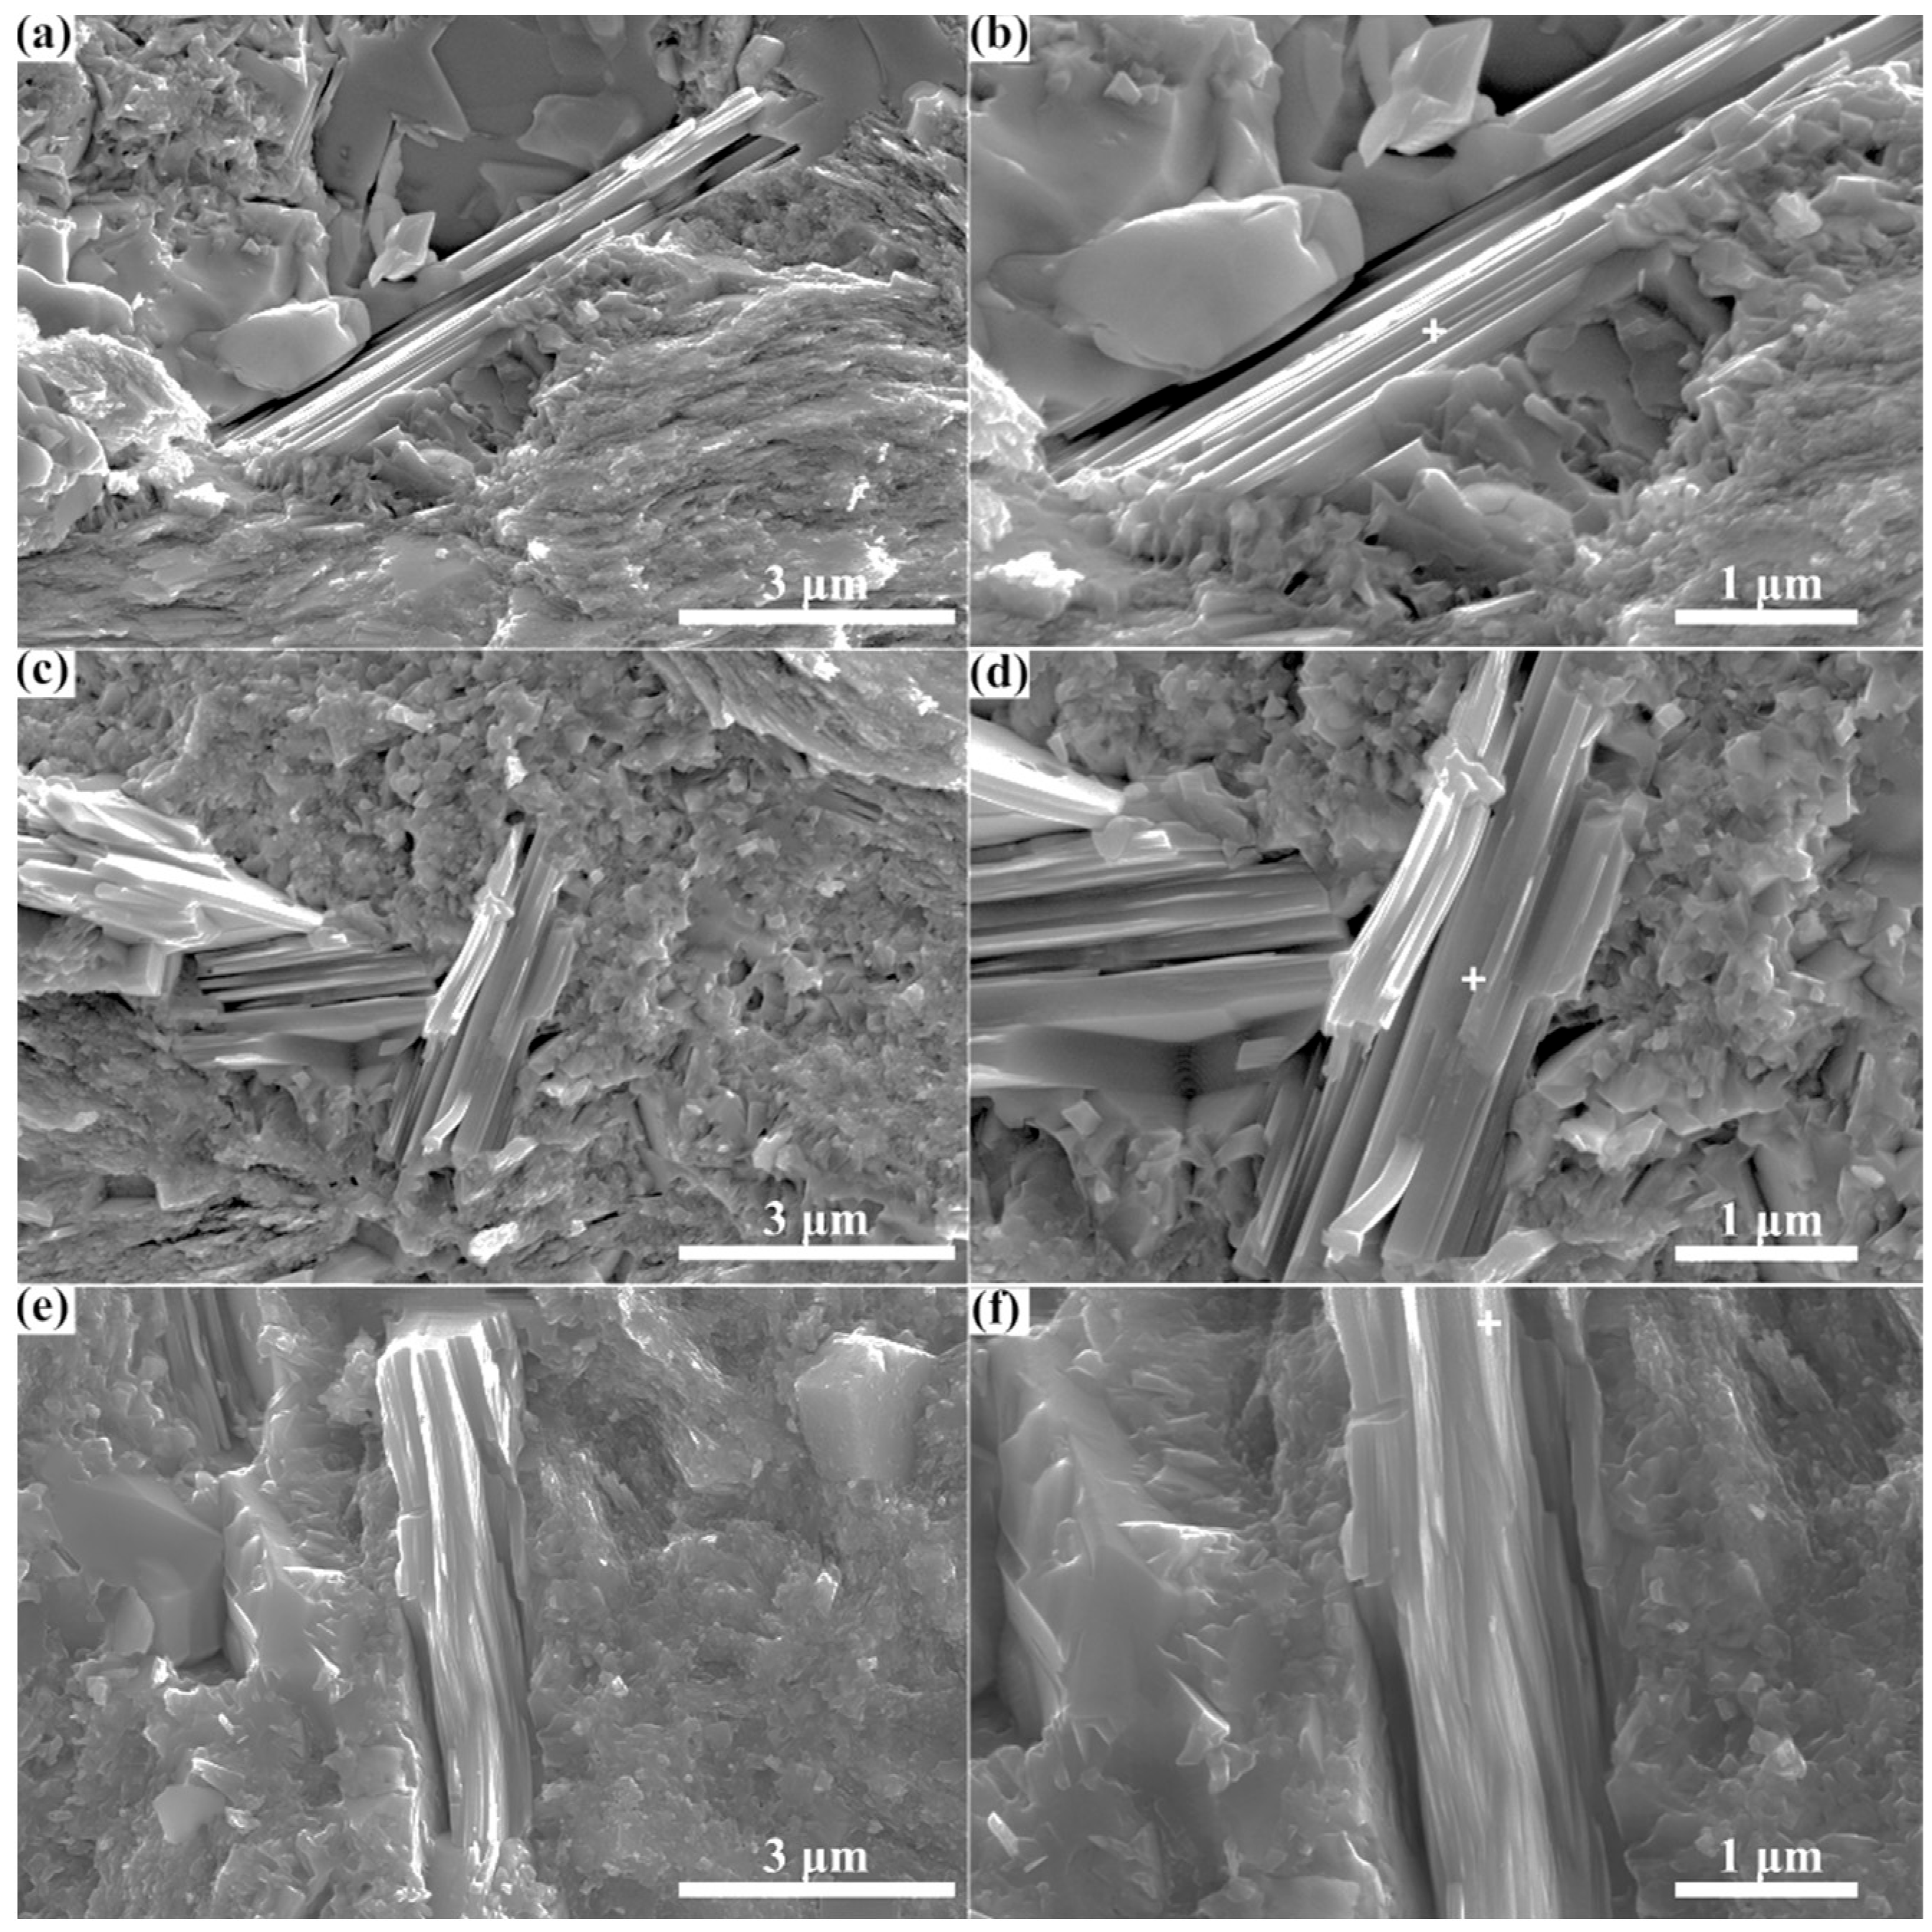
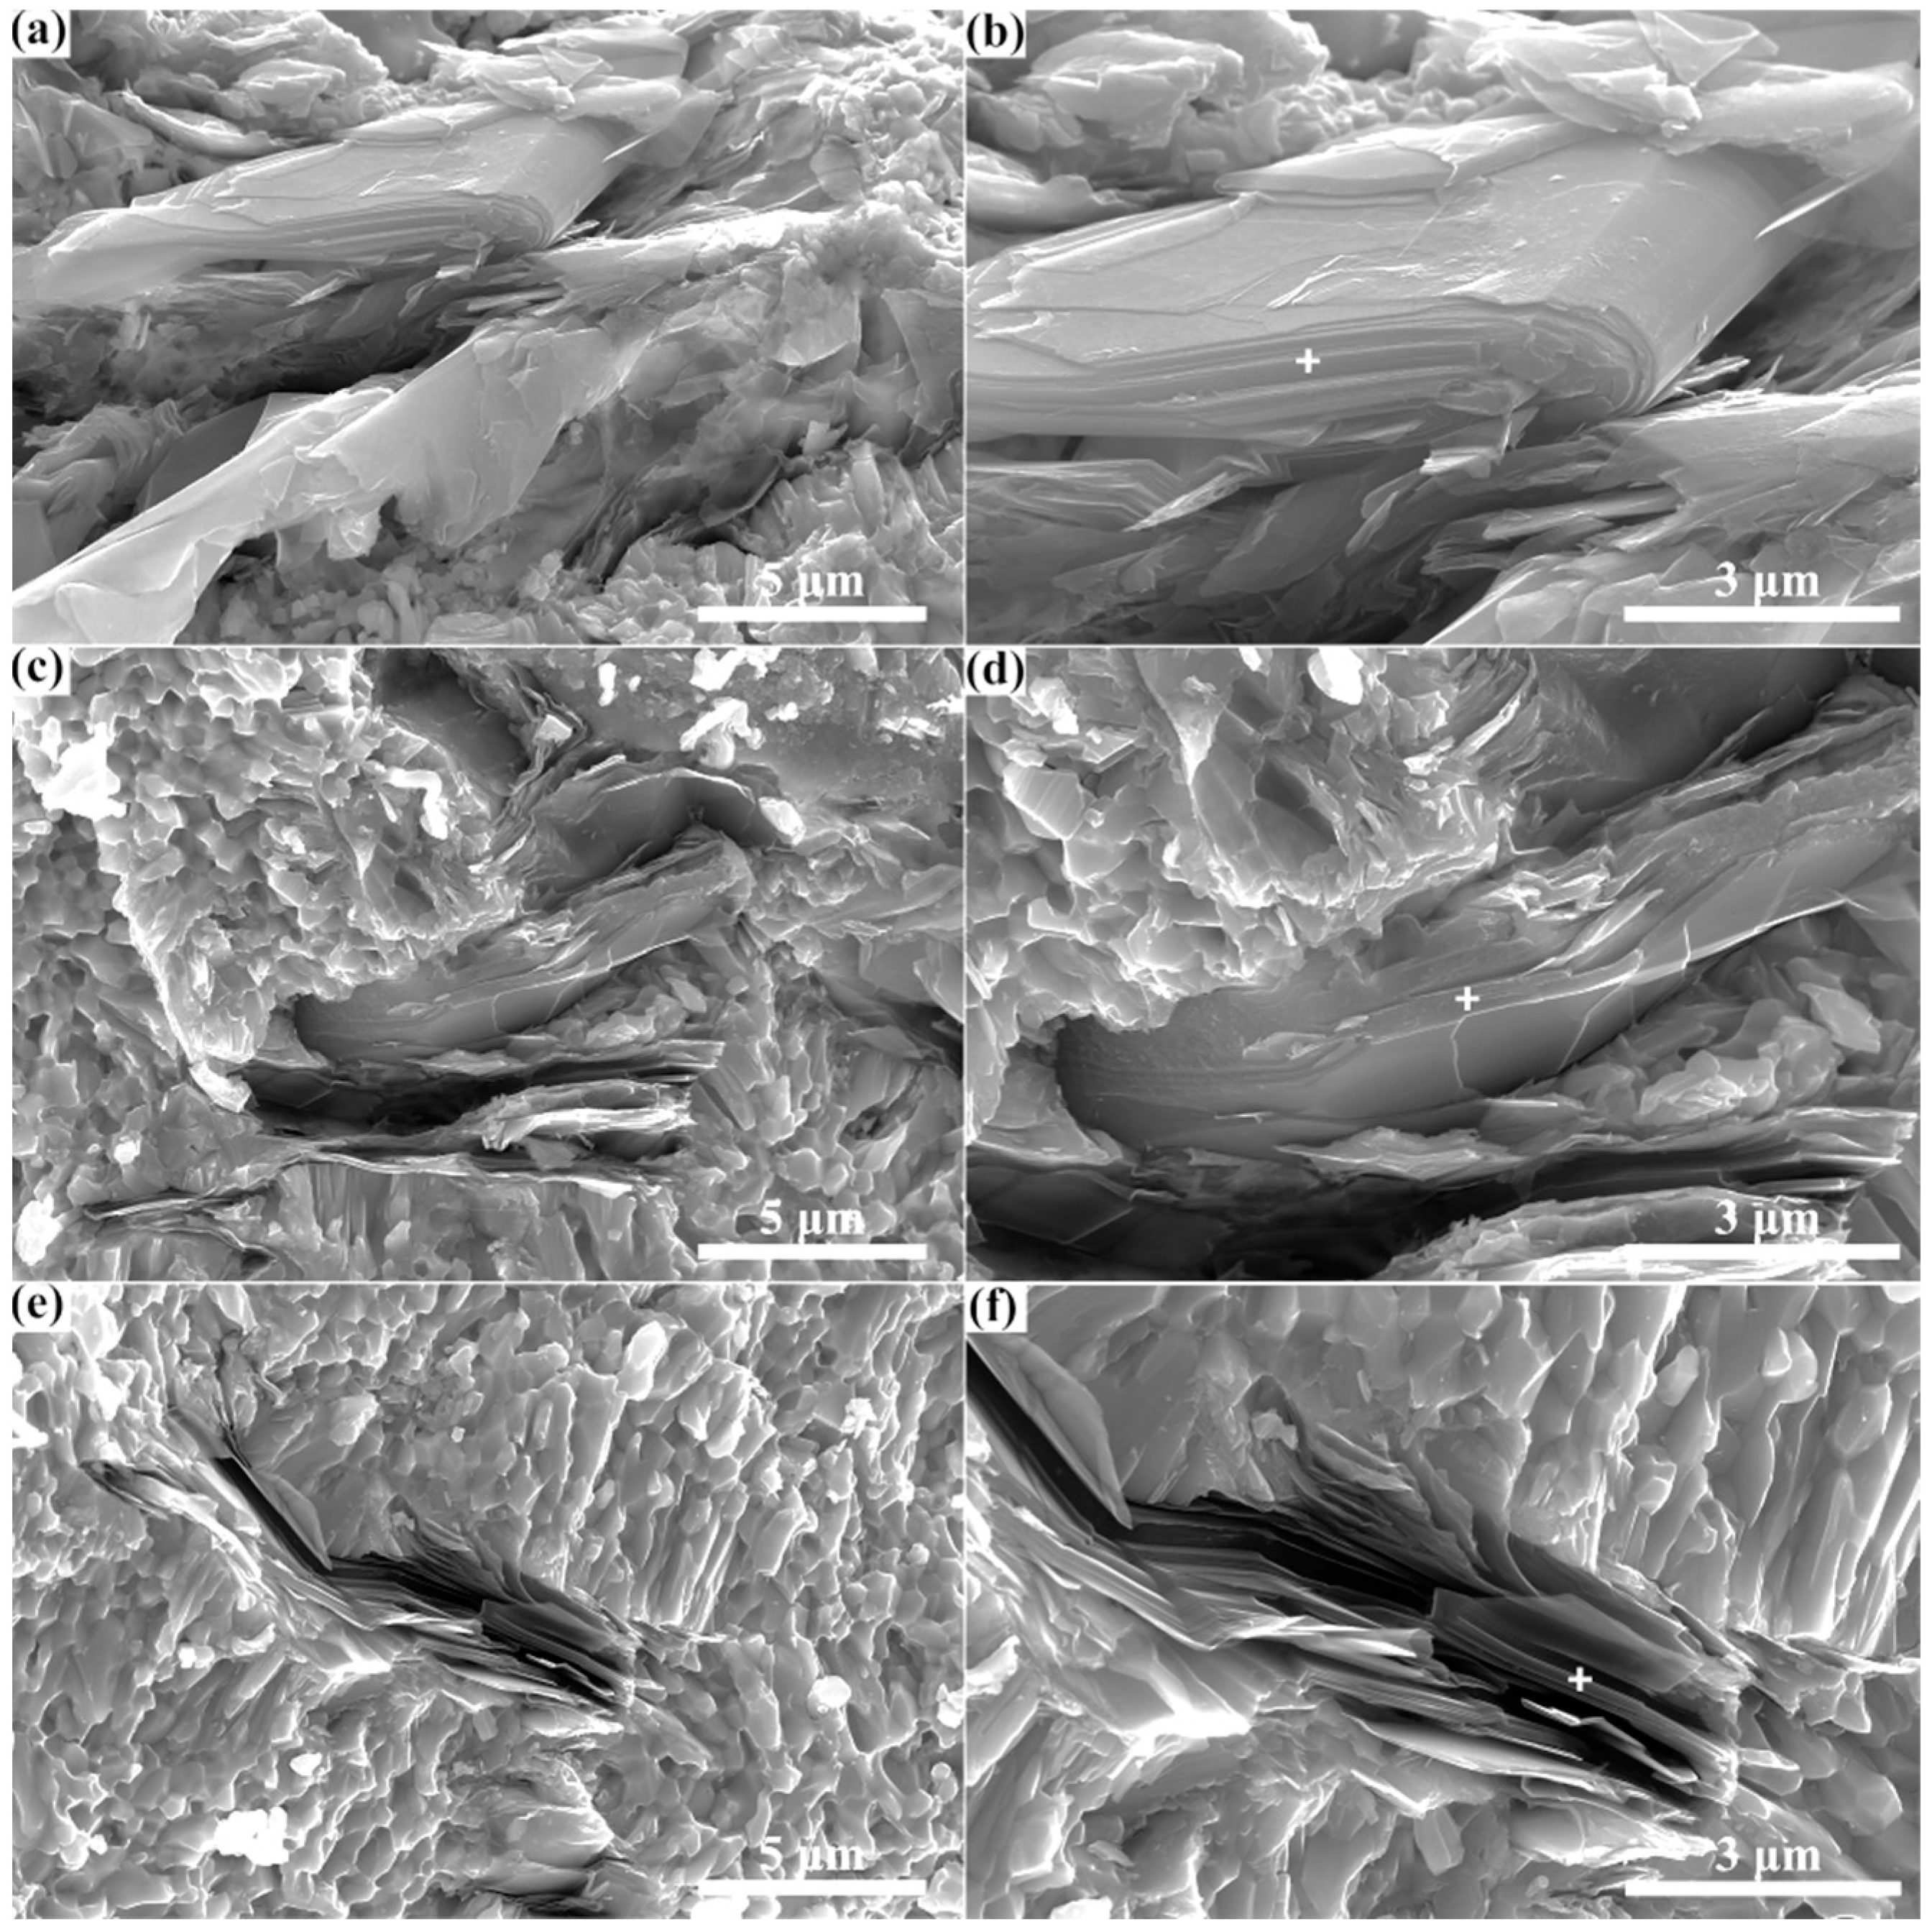
  • Through spark plasma sintering, composites containing the Zr3CdC2 and Zr3SbC2 phases could be synthesized at temperatures of 850 °C and 1300 °C, respectively. The optimal molar ratio of Zr:Cd/Sb:C was determined as 3:1.5:1.5. Based on the SEM micrographs, the nanolayered characters of the Zr3CdC2 and Zr3SbC2 grains were determined. The average element ratios were Zr:Cd = 3:0.976 for Zr3CdC2 grains and Zr:Sb = 3:1.012 for Zr3SbC2 grains, respectively, very close to the ratio of 3:1.

Supplementary Materials

The following supporting information can be downloaded at: https://www.mdpi.com/article/10.3390/ma17071556/s1. Figure S1: XRD patterns of Zr3CdC2 samples with the molar ratio of Zr:Cd:C = 3:1.5:1.5 synthesized at the different sintering temperature: (a) 1050 °C, (b) 950 °C, (c) 850 °C, (d) 750 °C, and (e) 650 °C. Figure S2: XRD patterns of Zr3SbC2 samples with the molar ratio of Zr:Sb:C = 3:1.5:1.5 synthesized at the different sintering temperature: (a) 1400 °C, (b) 1300 °C, (c) 1200 °C, (d) 1100 °C, (e) 1000 °C, and (f) 900 °C. Figure S3: XRD patterns of Zr3CdC2 samples synthesized at 850 °C with the different molar ratio of Zr, Cd, and C: (a) 3:1.8:2, (b) 3:1.7:2, (c) 3:1.6:2, (d) 3:1.5:2, and (e) 3:1.4:2. Figure S4: XRD patterns of Zr3CdC2 samples synthesized at 850 °C with the different molar ratio of Zr, Cd, and C: (a) 3:1.5:2.25, (b) 3:1.5:2, (c) 3:1.5:1.75, and (d) 3:1.5:1.5. Figure S5: XRD patterns of Zr3SbC2 samples synthesized at 1300 °C with the different molar ratio of Zr, Sb, and C: (a) 3:1.95:1.5, (b) 3:1.8:1.5, (c) 3:1.6:1.5, and (d) 3:1.5:1.5. Table S1: Theoretical crystal parameters and atomic positons of Zr3CdC2 and Zr3SbC2 phases. Table S2: Calculated data of reflections, 2θ, d-spacing, and intensities of Zr3CdC2 phase. Table S3: Calculated data of reflections, 2θ, d-spacing, and intensities of Zr3SbC2 phase.

Author Contributions

J.L., B.W. and Q.Z. provided the experimental ideas; J.L. and B.W. conceived and implemented the experiment; F.Z. made the theoretical calculations; L.C., Y.Z., Q.F. and C.H. provided desirable guidance; C.H. provided financial support; J.L. and F.Z. co-wrote the manuscript. All authors have read and agreed to the published version of the manuscript.

Funding

This work was supported by the National Natural Science Foundation of China (52072311) and the Sichuan Science and Technology Program (2022YFH0089). The computations were performed on the High-Performance Computing Platform of Southwest Jiaotong University.

Institutional Review Board Statement

Not applicable.

Informed Consent Statement

Not applicable.

Data Availability Statement

All data that support the findings of this study are available from the corresponding author.

Conflicts of Interest

The authors declare no conflict of interest.

References

  1. Barsoum, M.W.; El-Raghy, T. Synthesis and Characterization of a Remarkable Ceramic: Ti3SiC2. J. Am. Ceram. Soc. 1996, 79, 1953–1956. [Google Scholar] [CrossRef]
  2. Nowotny, V. Strukturchemie einiger Verbindungen der Übergangsmetalle mit den elementen C, Si, Ge, Sn. Prog. Solid State Chem. 1971, 5, 27–70. [Google Scholar] [CrossRef]
  3. Barsoum, M.W.; Radovic, M. Elastic and Mechanical Properties of the MAX Phases. Annu. Rev. Mater. Res. 2011, 41, 195–227. [Google Scholar] [CrossRef]
  4. Zhang, Q.; Wen, B.; Luo, J.; Zhou, Y.; San, X.; Bao, Y.; Chu, L.; Feng, Q.; Grasso, S.; Hu, C. Synthesis of new lead-containing MAX phases of Zr3PbC2 and Hf3PbC2. J. Am. Ceram. Soc. 2023, 106, 6390–6397. [Google Scholar] [CrossRef]
  5. Barsoum, M.W.; El-Raghy, T.; Ali, M. Processing and characterization of Ti2AlC, Ti2AlN, and Ti2AlC0.5N0.5. Metall. Mater. Trans. A 2000, 31, 1857–1865. [Google Scholar] [CrossRef]
  6. Fattahi, M.; Zarezadeh Mehrizi, M. Formation mechanism for synthesis of Ti3SnC2 MAX phase. Mater. Today Commun. 2020, 25, 101623. [Google Scholar] [CrossRef]
  7. Hossein-Zadeh, M.; Mirzaee, O.; Mohammadian-Semnani, H. An investigation into the microstructure and mechanical properties of V4AlC3 MAX phase prepared by spark plasma sintering. Ceram. Int. 2019, 45, 7446–7457. [Google Scholar] [CrossRef]
  8. Zhang, Q.; Wen, B.; Luo, J.; Zhou, Y.; San, X.; Bao, Y.; Feng, Q.; Grasso, S.; Hu, C. Synthesis of new rare earth containing ternary laminar Sc2PbC ceramic. J. Eur. Ceram. Soc. 2023, 43, 1735–1739. [Google Scholar] [CrossRef]
  9. Zhang, Q.; Zhou, Y.; San, X.; Li, W.; Bao, Y.; Feng, Q.; Grasso, S.; Hu, C. Zr2SeB and Hf2SeB: Two new MAB phase compounds with the Cr2AlC-type MAX phase (211 phase) crystal structures. J. Adv. Ceram. 2022, 11, 1764–1776. [Google Scholar] [CrossRef]
  10. Cuskelly, D.T.; Richards, E.R.; Kisi, E.H.; Keast, V.J. Ti3GaC2 and Ti3InC2: First bulk synthesis, DFT stability calculations and structural systematics. J. Solid State Chem. 2015, 230, 418–425. [Google Scholar] [CrossRef]
  11. Sokol, M.; Natu, V.; Kota, S.; Barsoum, M.W. On the chemical diversity of the MAX phases. Trends Chem. 2019, 1, 210–223. [Google Scholar] [CrossRef]
  12. Zhou, Y.; Xiang, H.; Hu, C. Extension of MAX phases from ternary carbides and nitrides (X = C and N) to ternary borides (X = B, C, and N): A general guideline. Int. J. Appl. Ceram. Technol. 2023, 20, 803–822. [Google Scholar] [CrossRef]
  13. Lapauw, T.; Tunca, B.; Cabioc’h, T.; Lu, J.; Persson, P.O.; Lambrinou, K.; Vleugels, J. Synthesis of MAX phases in the Hf–Al–C System. Inorg. Chem. 2016, 55, 10922–10927. [Google Scholar] [CrossRef] [PubMed]
  14. Zha, X.-H.; Ma, X.; Du, S.; Zhang, R.-Q.; Tao, R.; Luo, J.-T.; Fu, C. Role of the A-element in the structural, mechanical, and electronic properties of Ti3AC2 MAX phases. Inorg. Chem. 2022, 61, 2129–2140. [Google Scholar] [CrossRef] [PubMed]
  15. Nair, V.G.; Birowska, M.; Bury, D.; Jakubczak, M.; Rosenkranz, A.; Jastrzębska, A.M. 2D MBenes: A novel member in the flatland. Adv. Mater. 2022, 34, 2108840. [Google Scholar] [CrossRef] [PubMed]
  16. Zhou, A.; Liu, Y.; Li, S.; Wang, X.; Ying, G.; Xia, Q.; Zhang, P. From structural ceramics to 2D materials with multi-applications: A review on the development from MAX phases to MXenes. J. Adv. Ceram. 2021, 10, 1194–1242. [Google Scholar] [CrossRef]
  17. Fu, L.; Xia, W. MAX phases as nanolaminate materials: Chemical composition, microstructure, synthesis, properties, and applications. Adv. Eng. Mater. 2021, 23, 2001191. [Google Scholar] [CrossRef]
  18. Zhang, T.; Shuck, C.E.; Shevchuk, K.; Anayee, M.; Gogotsi, Y. Synthesis of three families of titanium carbonitride MXenes. J. Am. Chem. Soc. 2023, 145, 22374–22383. [Google Scholar] [CrossRef] [PubMed]
  19. Lapauw, T.; Tunca, B.; Cabioc’h, T.; Vleugels, J.; Lambrinou, K. Reactive spark plasma sintering of Ti3SnC2, Zr3SnC2 and Hf3SnC2 using Fe, Co or Ni additives. J. Eur. Ceram. Soc. 2017, 37, 4539–4545. [Google Scholar] [CrossRef]
  20. Hadi, M.A.; Christopoulos, S.-R.G.; Naqib, S.H.; Chroneos, A.; Fitzpatrick, M.E.; Islam, A.K.M.A. Physical properties and defect processes of M3SnC2 (M = Ti, Zr, Hf) MAX phases: Effect of M-elements. J. Alloys Compd. 2018, 748, 804–813. [Google Scholar] [CrossRef]
  21. Zhang, Q.; Luo, J.; Wen, B.; Zhou, Y.; Chu, L.; Feng, Q.; Hu, C. Determination of new α-312 MAX phases of Zr3InC2 and Hf3InC2. J. Eur. Ceram. Soc. 2023, 43, 7228–7233. [Google Scholar] [CrossRef]
  22. Jeitschko, W.; Nowotny, H.; Benesovsky, F. Die H-Phasen: Ti2CdC, Ti2GaC, Ti2GaN, Ti2InN, Zr2InN und Nb2GaC. Monatshefte Chem. 1964, 95, 178–179. [Google Scholar] [CrossRef]
  23. Bai, Y.; He, X.; Li, M.; Sun, Y.; Zhu, C.; Li, Y. Ab initio study of the bonding and elastic properties of Ti2CdC. Solid State Sci. 2010, 12, 144–147. [Google Scholar] [CrossRef]
  24. Roknuzzaman, M.; Hadi, M.A.; Nasir, M.T.; Naqib, S.H.; Islam, A.K.M.A. Structural, elastic and electronic properties of nitride Ti2 CdN phase in comparison with the carbide Ti2CdC phase from First-principles Study. J. Phys. Conf. Ser. 2021, 1718, 012019. [Google Scholar] [CrossRef]
  25. Kresse, G.; Furthmüller, J. Efficient iterative schemes for ab initio total-energy calculations using a plane-wave basis set. Phys. Rev. B 1996, 54, 11169–11186. [Google Scholar] [CrossRef] [PubMed]
  26. Perdew, J.P.; Burke, K.; Ernzerhof, M. Generalized gradient approximation made simple. Phys. Rev. Lett. 1996, 77, 3865–3868. [Google Scholar] [CrossRef] [PubMed]
  27. Grimme, S.; Antony, J.; Ehrlich, S.; Krieg, H. A consistent and accurate ab initio parametrization of density functional dispersion correction (DFT-D) for the 94 elements H-Pu. J. Chem. Phys. 2010, 132, 154104. [Google Scholar] [CrossRef] [PubMed]
  28. Momma, K.; Izumi, F. VESTA 3 for three-dimensional visualization of crystal, volumetric and morphology data. J. Appl. Crystallogr. 2011, 44, 1272–1276. [Google Scholar] [CrossRef]
  29. Anderson, O.L. A simplified method for calculating the debye temperature from elastic constants. J. Phys. Chem. Solids 1963, 24, 909–917. [Google Scholar] [CrossRef]
  30. Islam, J.; Hossain, A.K.M.A. Investigation of physical and superconducting properties of newly synthesized CaPd2P2 and SrPd2P2. J. Alloys Compd. 2021, 868, 159199. [Google Scholar] [CrossRef]
  31. Fine, M.E.; Brown, L.D.; Marcus, H.L. Elastic constants versus melting temperature in metals. Scr. Met. 1984, 18, 951–956. [Google Scholar] [CrossRef]
  32. Born, M. On the stability of crystal lattices. I. Math. Proc. Camb. Philos. Soc. 1940, 36, 160–172. [Google Scholar] [CrossRef]
  33. Pugh, S.F. XCII. Relations between the elastic moduli and the plastic properties of polycrystalline pure metals. Lond. Edinb. Dublin Philos. Mag. J. Sci. 1954, 45, 823–843. [Google Scholar] [CrossRef]
  34. Jiang, X.; Zhao, J.; Jiang, X. Correlation between hardness and elastic moduli of the covalent crystals. Comput. Mater. Sci. 2011, 50, 2287–2290. [Google Scholar] [CrossRef]
  35. Teter, D.M. Computational Alchemy: The Rational Design of New Superhard Materials. Ph.D. Thesis, Virginia Tech, Blacksburg, VA, USA, 1998. [Google Scholar]
  36. Jiang, X.; Zhao, J.; Wu, A.; Bai, Y.; Jiang, X. Mechanical and electronic properties of B12-based ternary crystals of orthorhombic phase. J. Phys. Condens. Matter 2010, 22, 315503. [Google Scholar] [CrossRef] [PubMed]
  37. Miao, N.; Sa, B.; Zhou, J.; Sun, Z. Theoretical investigation on the transition-metal borides with Ta3B4-type structure: A class of hard and refractory materials. Comput. Mater. Sci. 2011, 50, 1559–1566. [Google Scholar] [CrossRef]
  38. Chen, X.-Q.; Niu, H.; Li, D.; Li, Y. Modeling hardness of polycrystalline materials and bulk metallic glasses. Intermetallics 2011, 19, 1275–1281. [Google Scholar] [CrossRef]
  39. Jamal, M.; Jalali Asadabadi, S.; Ahmad, I.; Rahnamaye Aliabad, H.A. Elastic constants of cubic crystals. Comput. Mater. Sci. 2014, 95, 592–599. [Google Scholar] [CrossRef]
  40. Shein, I.R.; Ivanovskii, A.L. Elastic properties of superconducting MAX phases from first-principles calculations: Elastic properties of superconducting MAX phases. Phys. Status Solidi B 2011, 248, 228–232. [Google Scholar] [CrossRef]
  41. Wang, X.H.; Zhou, Y.C. Layered machinable and electrically conductive Ti2AlC and Ti3AlC2 ceramics: A review. J. Mater. Sci. Technol. 2010, 26, 385–416. [Google Scholar] [CrossRef]
  42. Henkelman, G.; Arnaldsson, A.; Jónsson, H. A fast and robust algorithm for Bader decomposition of charge density. Comput. Mater. Sci. 2006, 36, 354–360. [Google Scholar] [CrossRef]
  43. Shuck, C.E.; Han, M.; Maleski, K.; Hantanasirisakul, K.; Kim, S.J.; Choi, J.; Reil, W.E.B.; Gogotsi, Y. Effect of Ti3AlC2 MAX phase on structure and properties of resultant Ti3C2Tx MXene. ACS Appl. Nano Mater. 2019, 2, 3368–3376. [Google Scholar] [CrossRef]
  44. Wozniak, J.; Petrus, M.; Cygan, T.; Adamczyk-Cieślak, B.; Moszczyńska, D.; Olszyna, A.R. Synthesis of Ti3SiC2 phases and consolidation of MAX/SiC composites—Microstructure and mechanical properties. Materials 2023, 16, 889. [Google Scholar] [CrossRef] [PubMed]
Figure 1. Crystal structures of Zr3SbC2 and Zr3CdC2 phases: (a) 3-dimensional image, (b) top view image ((0001) plane), and (c) side view image ((1–100) plane).
Materials 17 01556 g001
Figure 2. Calculated phonon dispersion of (a) Zr3SbC2 and (b) Zr3CdC2 phases.
Materials 17 01556 g002
Figure 3. Variation trend of (a) bulk moduli (B) and shear moduli (G), and (b) Young’s moduli (E) and Vickers hardnesses (Hv) of Zr3AC2 (A = Cd, In, Sn, and Sb) phases.
Materials 17 01556 g003
Figure 4. (a) Experimental and (b) theoretically calculated X-ray diffraction (XRD) patterns of Zr3CdC2 samples. The sample was synthesized at 850 °C with the molar ratio of Zr:Cd:C = 3:1.5:1.5.
Materials 17 01556 g004
Figure 5. (a) Experimental and (b) theoretically calculated XRD patterns of Zr3SbC2 samples. The sample was synthesized at 1300 °C with the molar ratio of Zr:Sb:C = 3:1.5:1.5.
Materials 17 01556 g005
Figure 6. (af) Scanning electron microscopy (SEM) images of fracture surface of the Zr3CdC2 sample. The testing positions of energy dispersive spectroscopy (EDS) analysis are labeled by white cross in images (b,d,f).
Materials 17 01556 g006
Figure 7. (af) SEM images of fracture surface of Zr3SbC2 sample. The testing positions of EDS analysis are labeled by the white cross in images (b,d,f).
Materials 17 01556 g007
Table 1. Calculated lattice parameters (Å) and formation energies (eV/atom) of Zr3AC2 (A = Cd, In, Sn, and Sb) phases.
Phasea (Å)c (Å)ΔH (eV/atom)
Zr3CdC23.31920.393−1.104
Zr3InC23.337
3.352 [21]
20.251
20.252 [21]
−1.220
Zr3SnC23.348
3.359 [19]
19.870
19.876 [19]
−1.282
Zr3SbC23.36719.413−1.306
Table 2. Calculated elastic constants of Cij of Zr3AC2 (A = Cd, In, Sn, and Sb) phases.
PhaseC11 (GPa)C12 (GPa)C33 (GPa)C13 (GPa)C44 (GPa)
Zr3CdC2283.71794.155228.79567.10833.936
Zr3InC2310.37281.969248.67968.84684.965
Zr3SnC2286.005109.654290.24289.750118.166
Zr3SbC2239.549108.369252.822126.18362.190
Table 3. Calculated mechanical moduli of B, E, G, Pugh’s ratio of B/G, Vickers hardness of HV, melting point of Tm, and Debye temperatures of TD of Zr3AC2 (A = Cd, In, Sn, and Sb) phases.
PhaseB (GPa)G (GPa)E (GPa)B/GHV (GPa)Tm (K)TD (K)
Zr3CdC2137.94262.477162.8462.2085.4481548.344392.7
Zr3InC2144.43795.251242.2621.45515.8421658.135488.9
Zr3SnC2160.068102.306253.0131.56514.6251647.378493.7
Zr3SbC2159.91361.810164.2652.5874.3091451.880386.2
Table 4. The calculated bond length, bond population, and Bader charge (ΔQ) of Zr3AC2 (A = Cd, In, Sn, and Sb) phases.
PhaseZr1-C Length (Å)Zr1-C PopulationZr2-C Length (Å)Zr2-C PopulationΔQZr1ΔQZr2ΔQC
Zr3CdC22.3770.852.2421.241.5911.135−1.692
Zr3InC22.3830.872.2451.241.5921.111−1.698
Zr3SnC22.3800.872.2601.231.5780.948−1.577
Zr3SbC22.3840.882.2681.241.6421.016−1.700
Table 5. EDS analysis results of Zr3CdC2 grains at the test positions in Figure 6b,d,f.
ElementAt.% in Figure 6bAt.% in Figure 6dAt.% in Figure 6f
Zr75.6775.3175.38
Cd24.3324.6924.62
Table 6. EDS analysis results of Zr3SbC2 grains at the test positions in Figure 7b,d,f.
ElementAt.% in Figure 7bAt.% in Figure 7dAt.% in Figure 7f
Zr74.4874.1075.74
Sb25.5225.9024.26
Disclaimer/Publisher’s Note: The statements, opinions and data contained in all publications are solely those of the individual author(s) and contributor(s) and not of MDPI and/or the editor(s). MDPI and/or the editor(s) disclaim responsibility for any injury to people or property resulting from any ideas, methods, instructions or products referred to in the content.

