

Evaluating the Impact of Sample Irregularities on the Dynamic Stiffness of Polyurethane: Insights from Experimental and FEM Analysis


Abstract
1. Introduction
2. Methodology
2.1. Test Equipment and Procedure
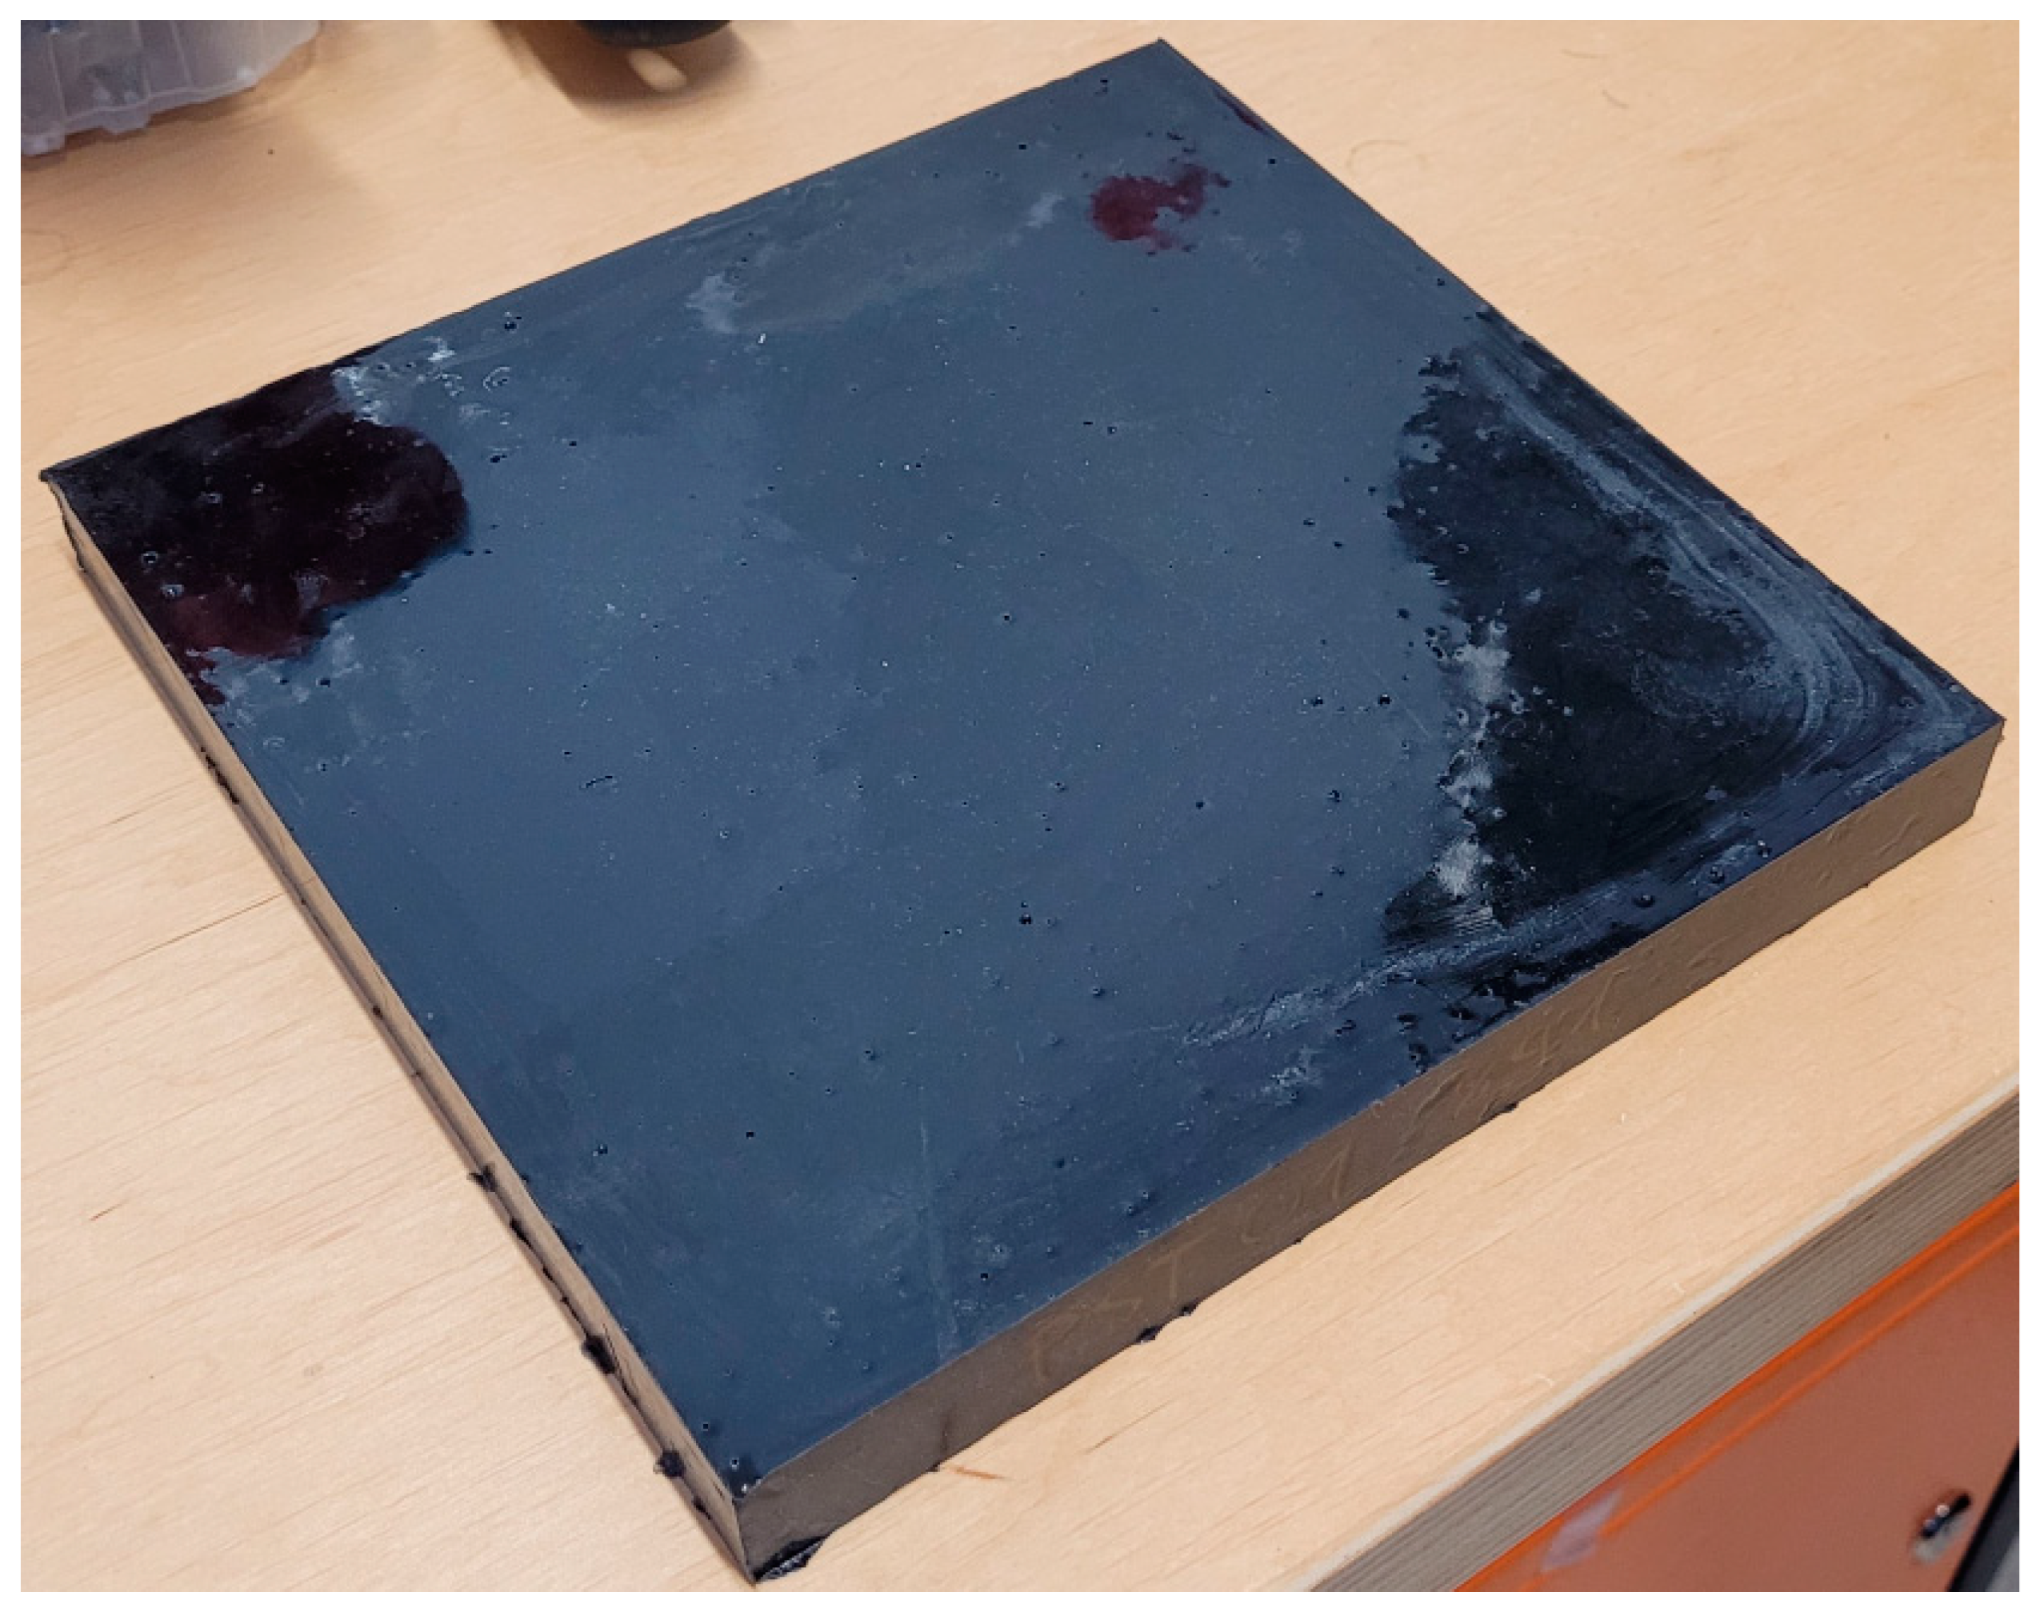
2.2. Material and Test Samples
2.3. FEM Model
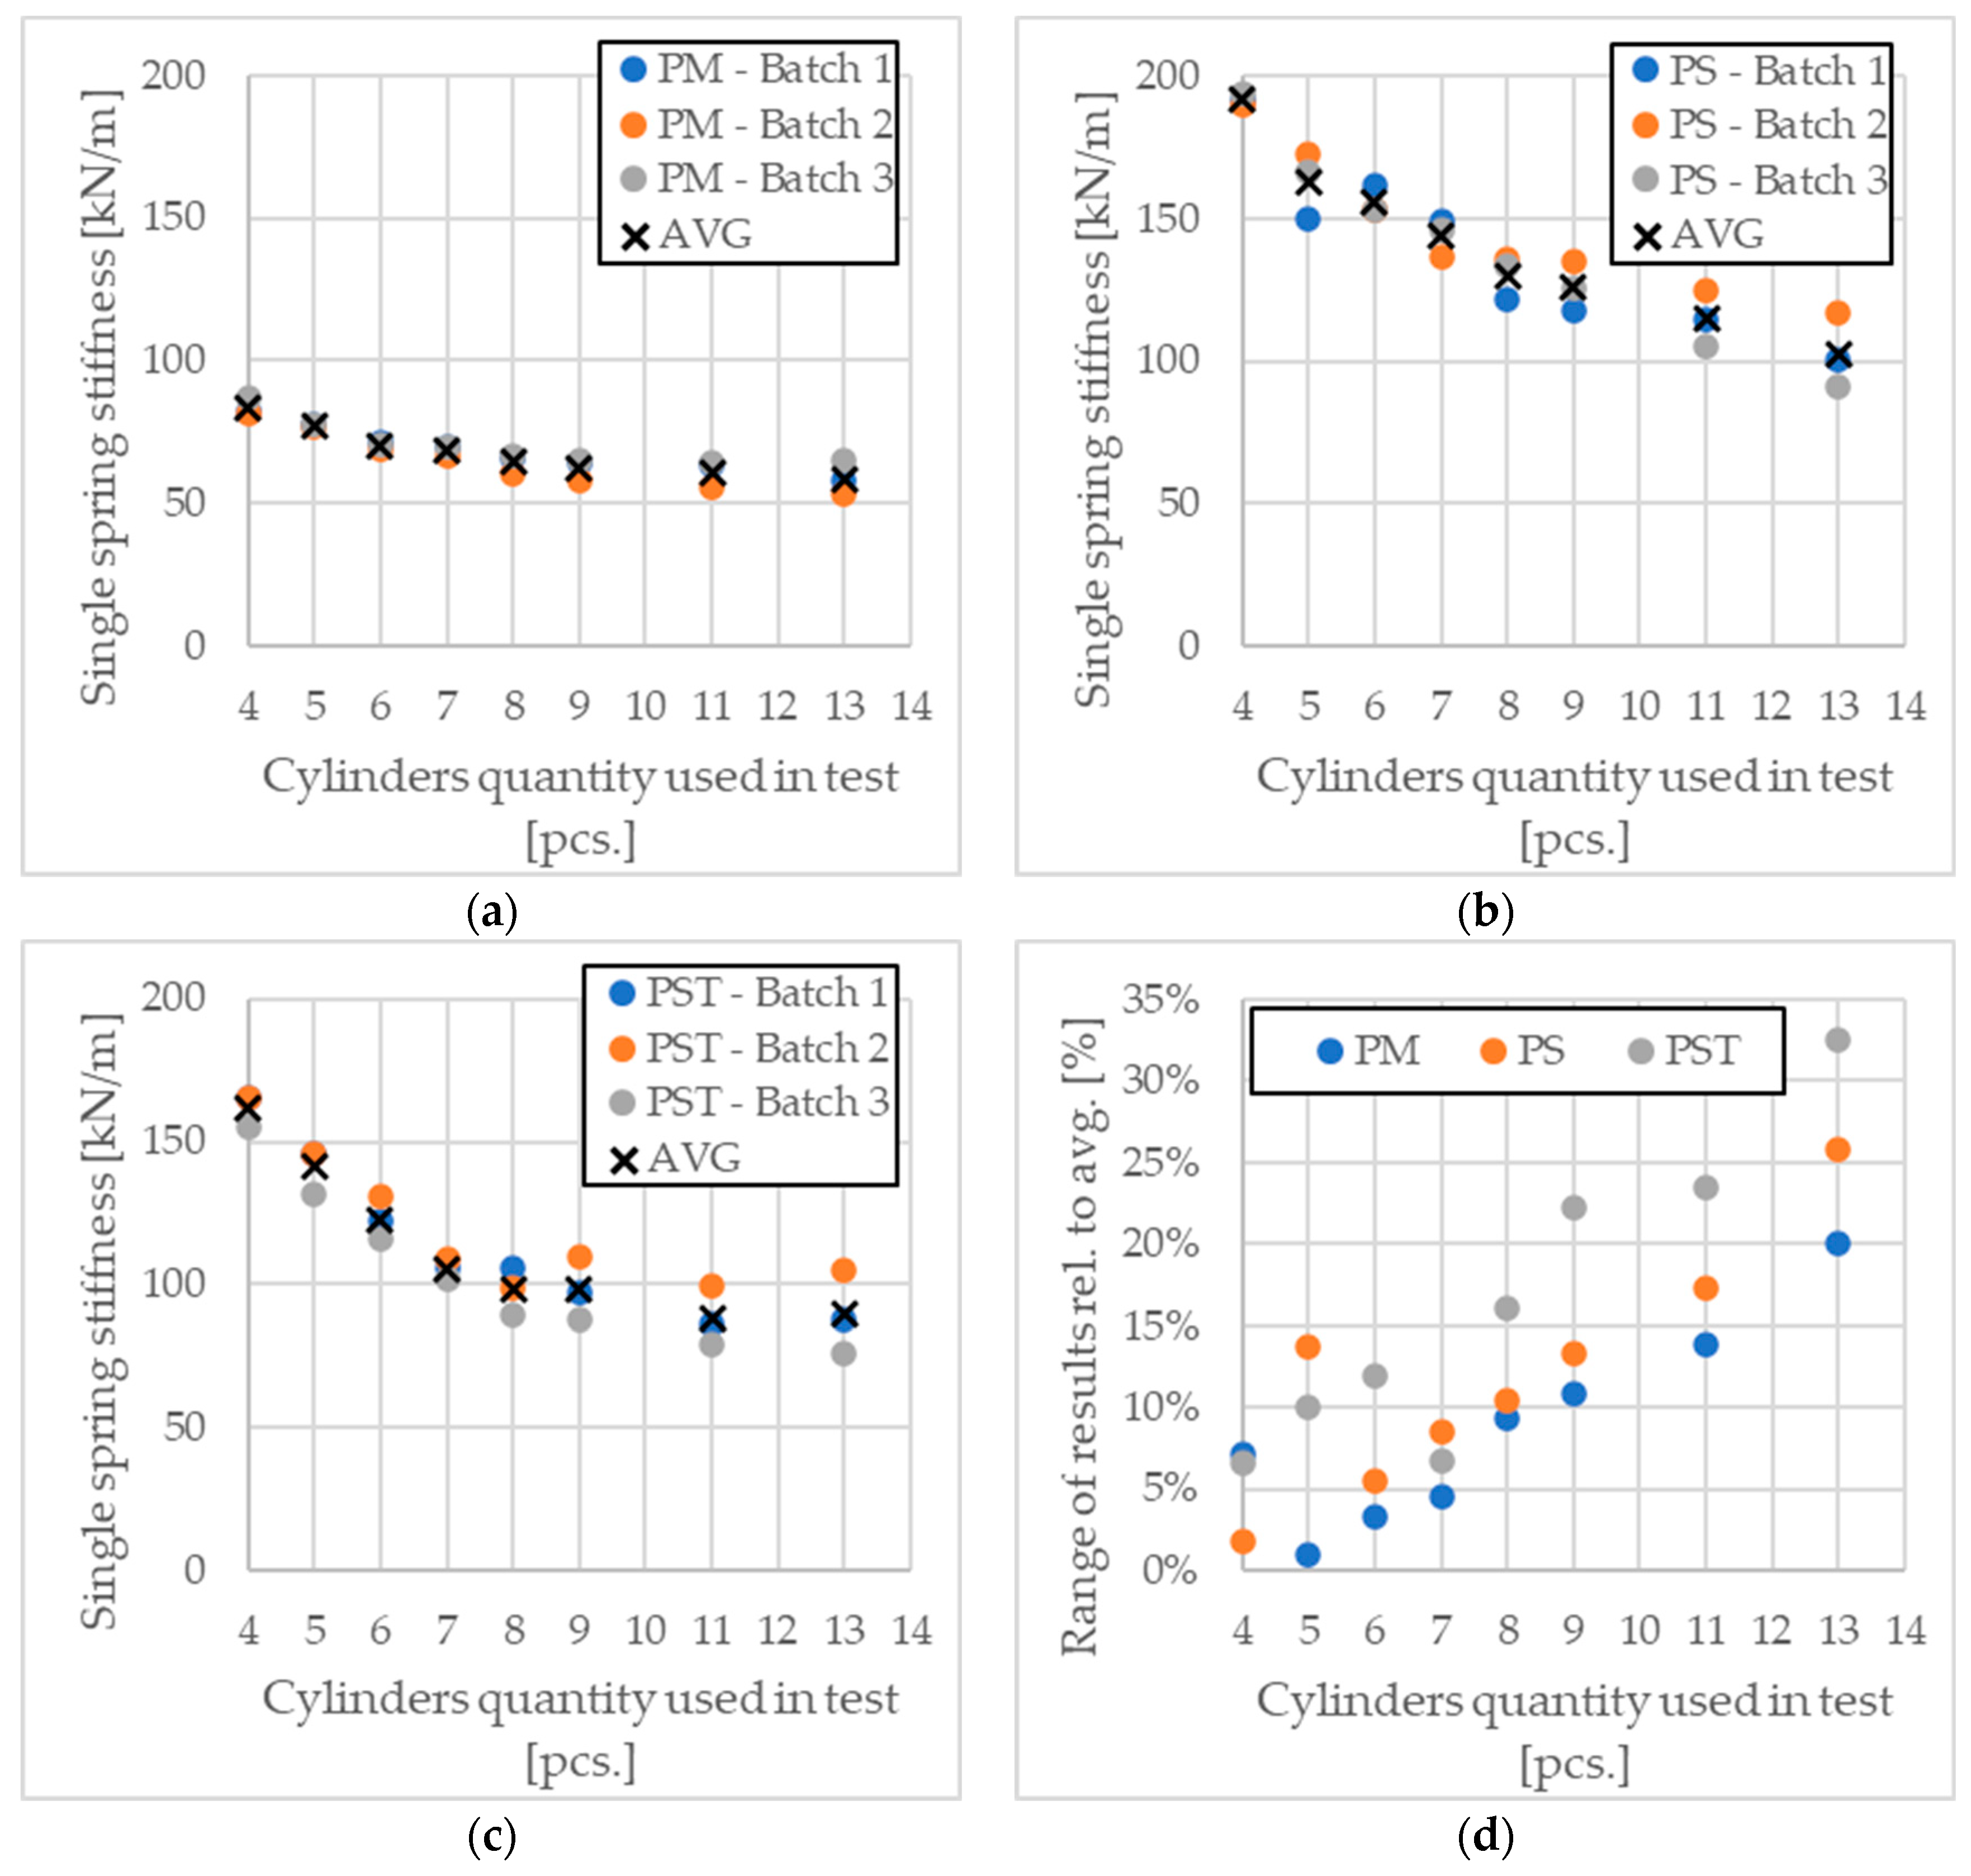
3. Results
4. Discussion
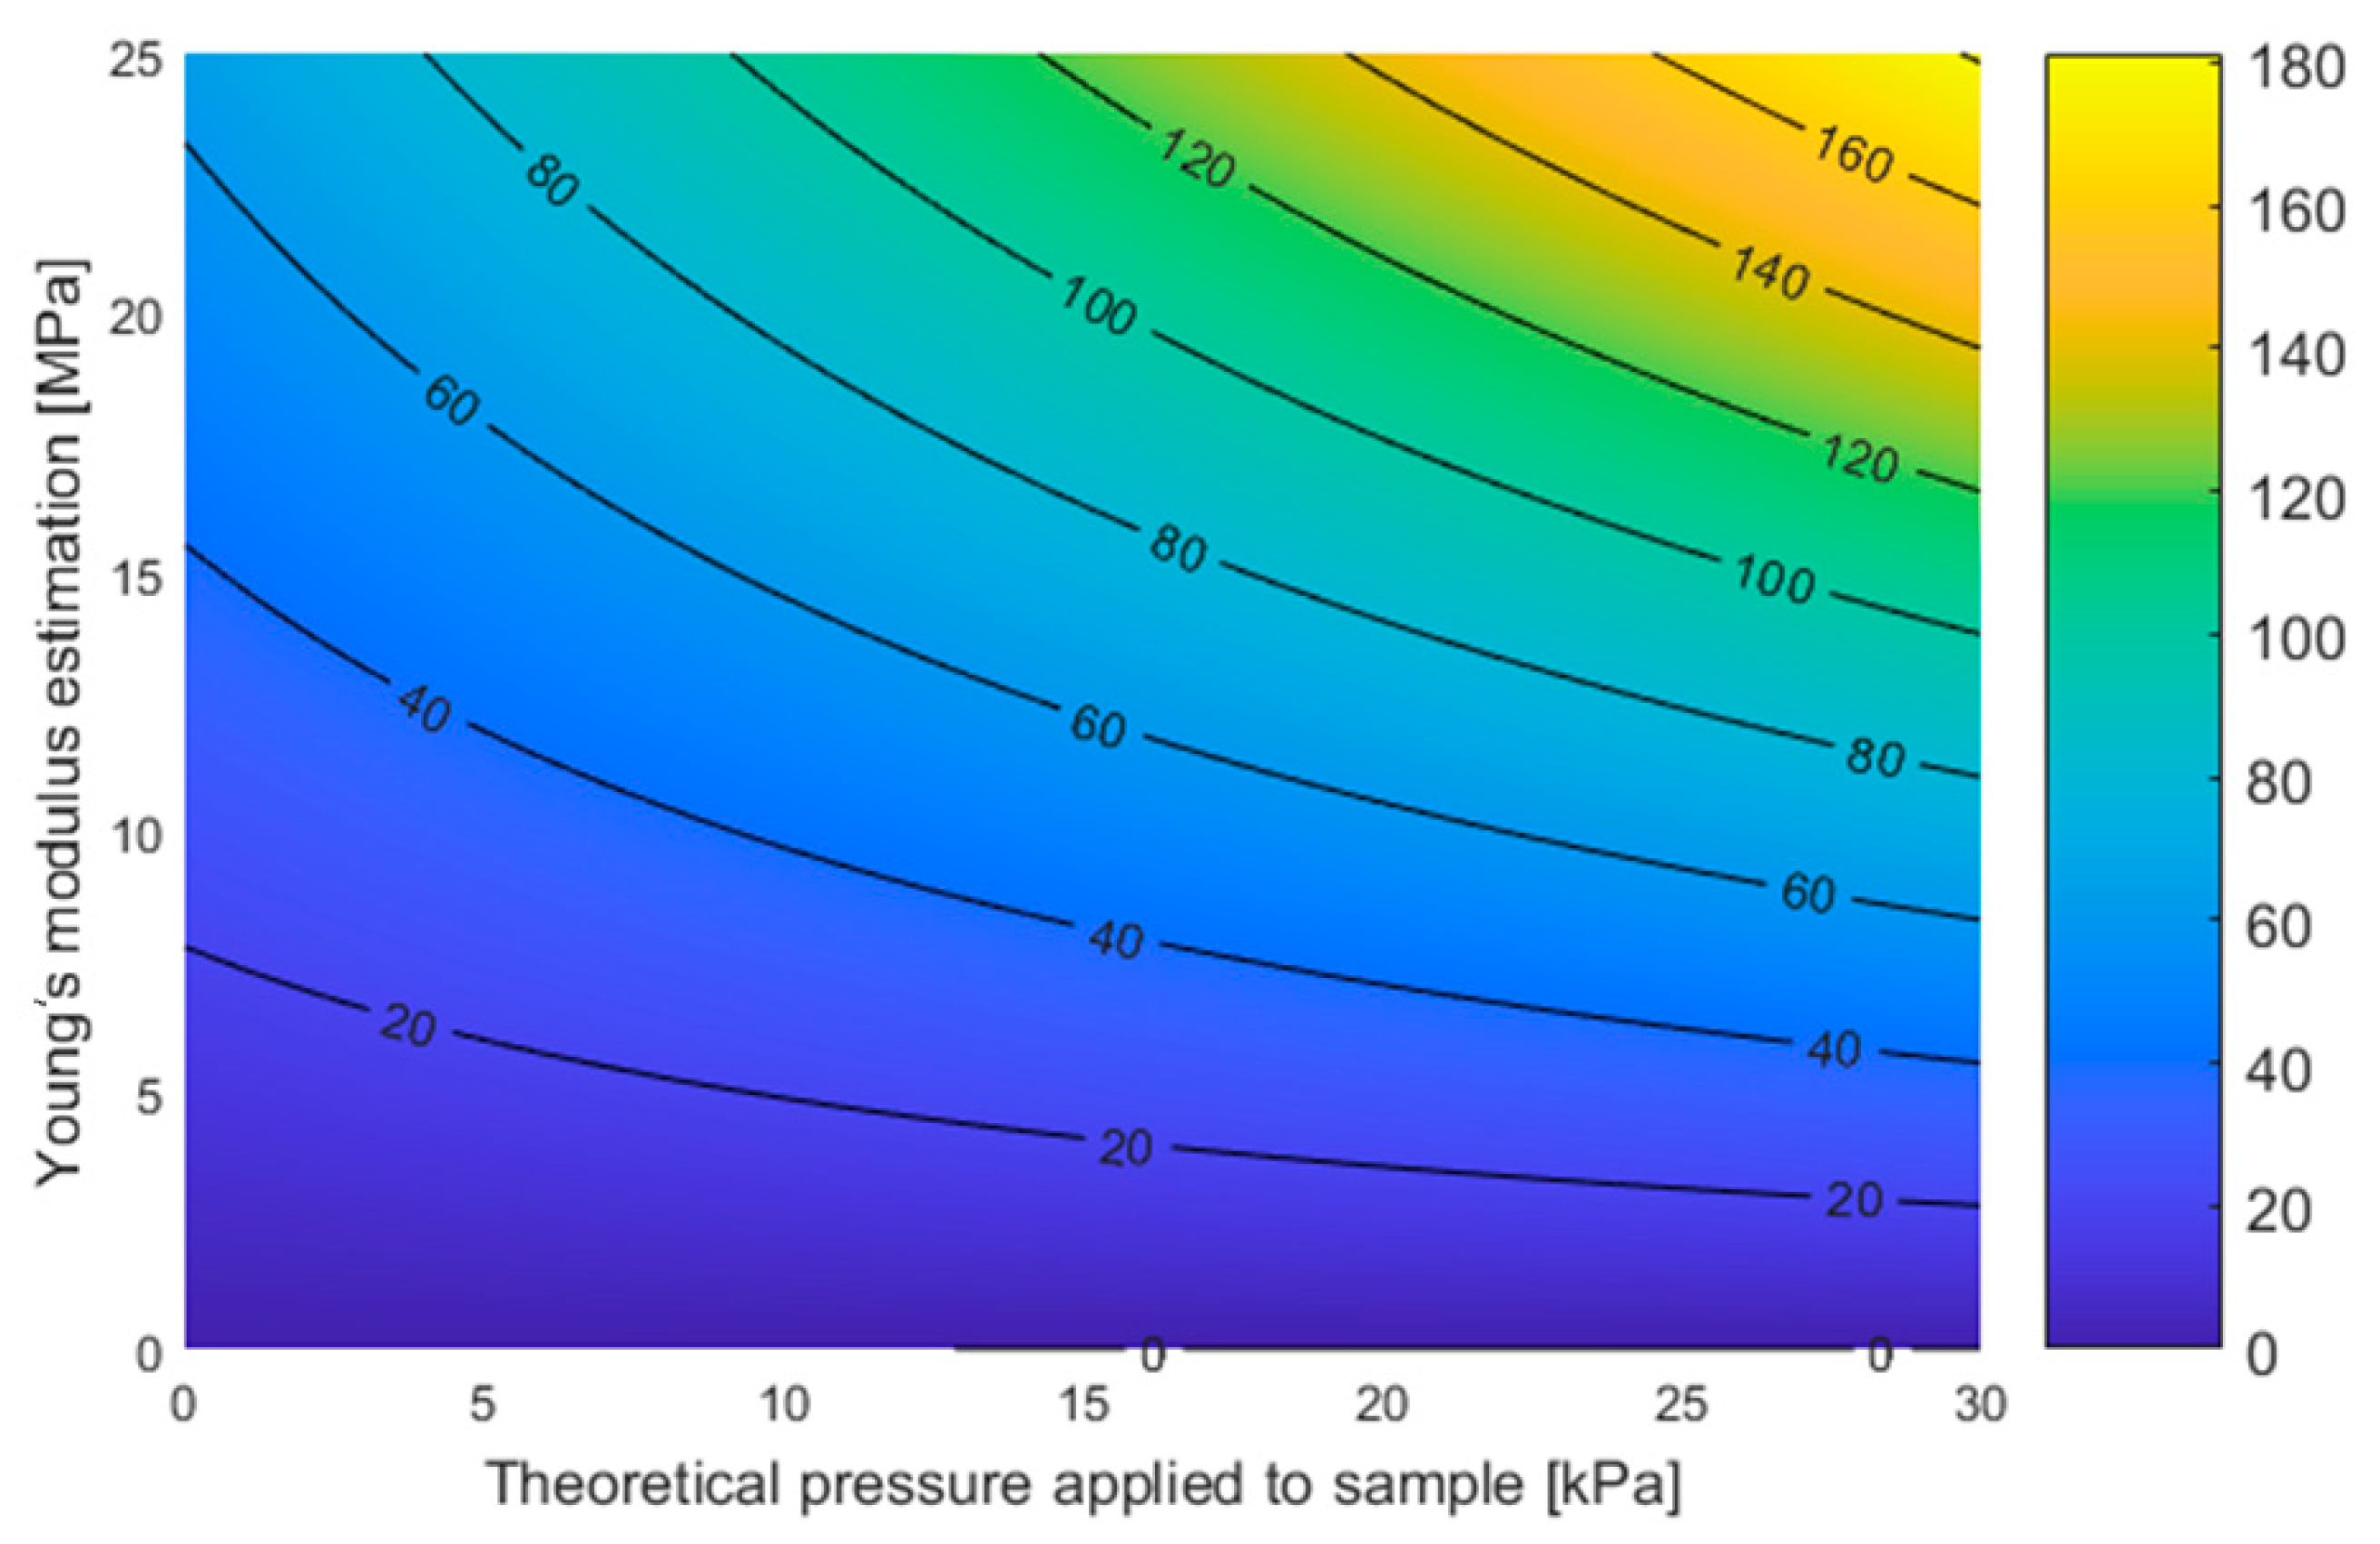
4.1. Theoretical Normal Pressure Applied to Sample and Single Cylinder Stiffness Estimation
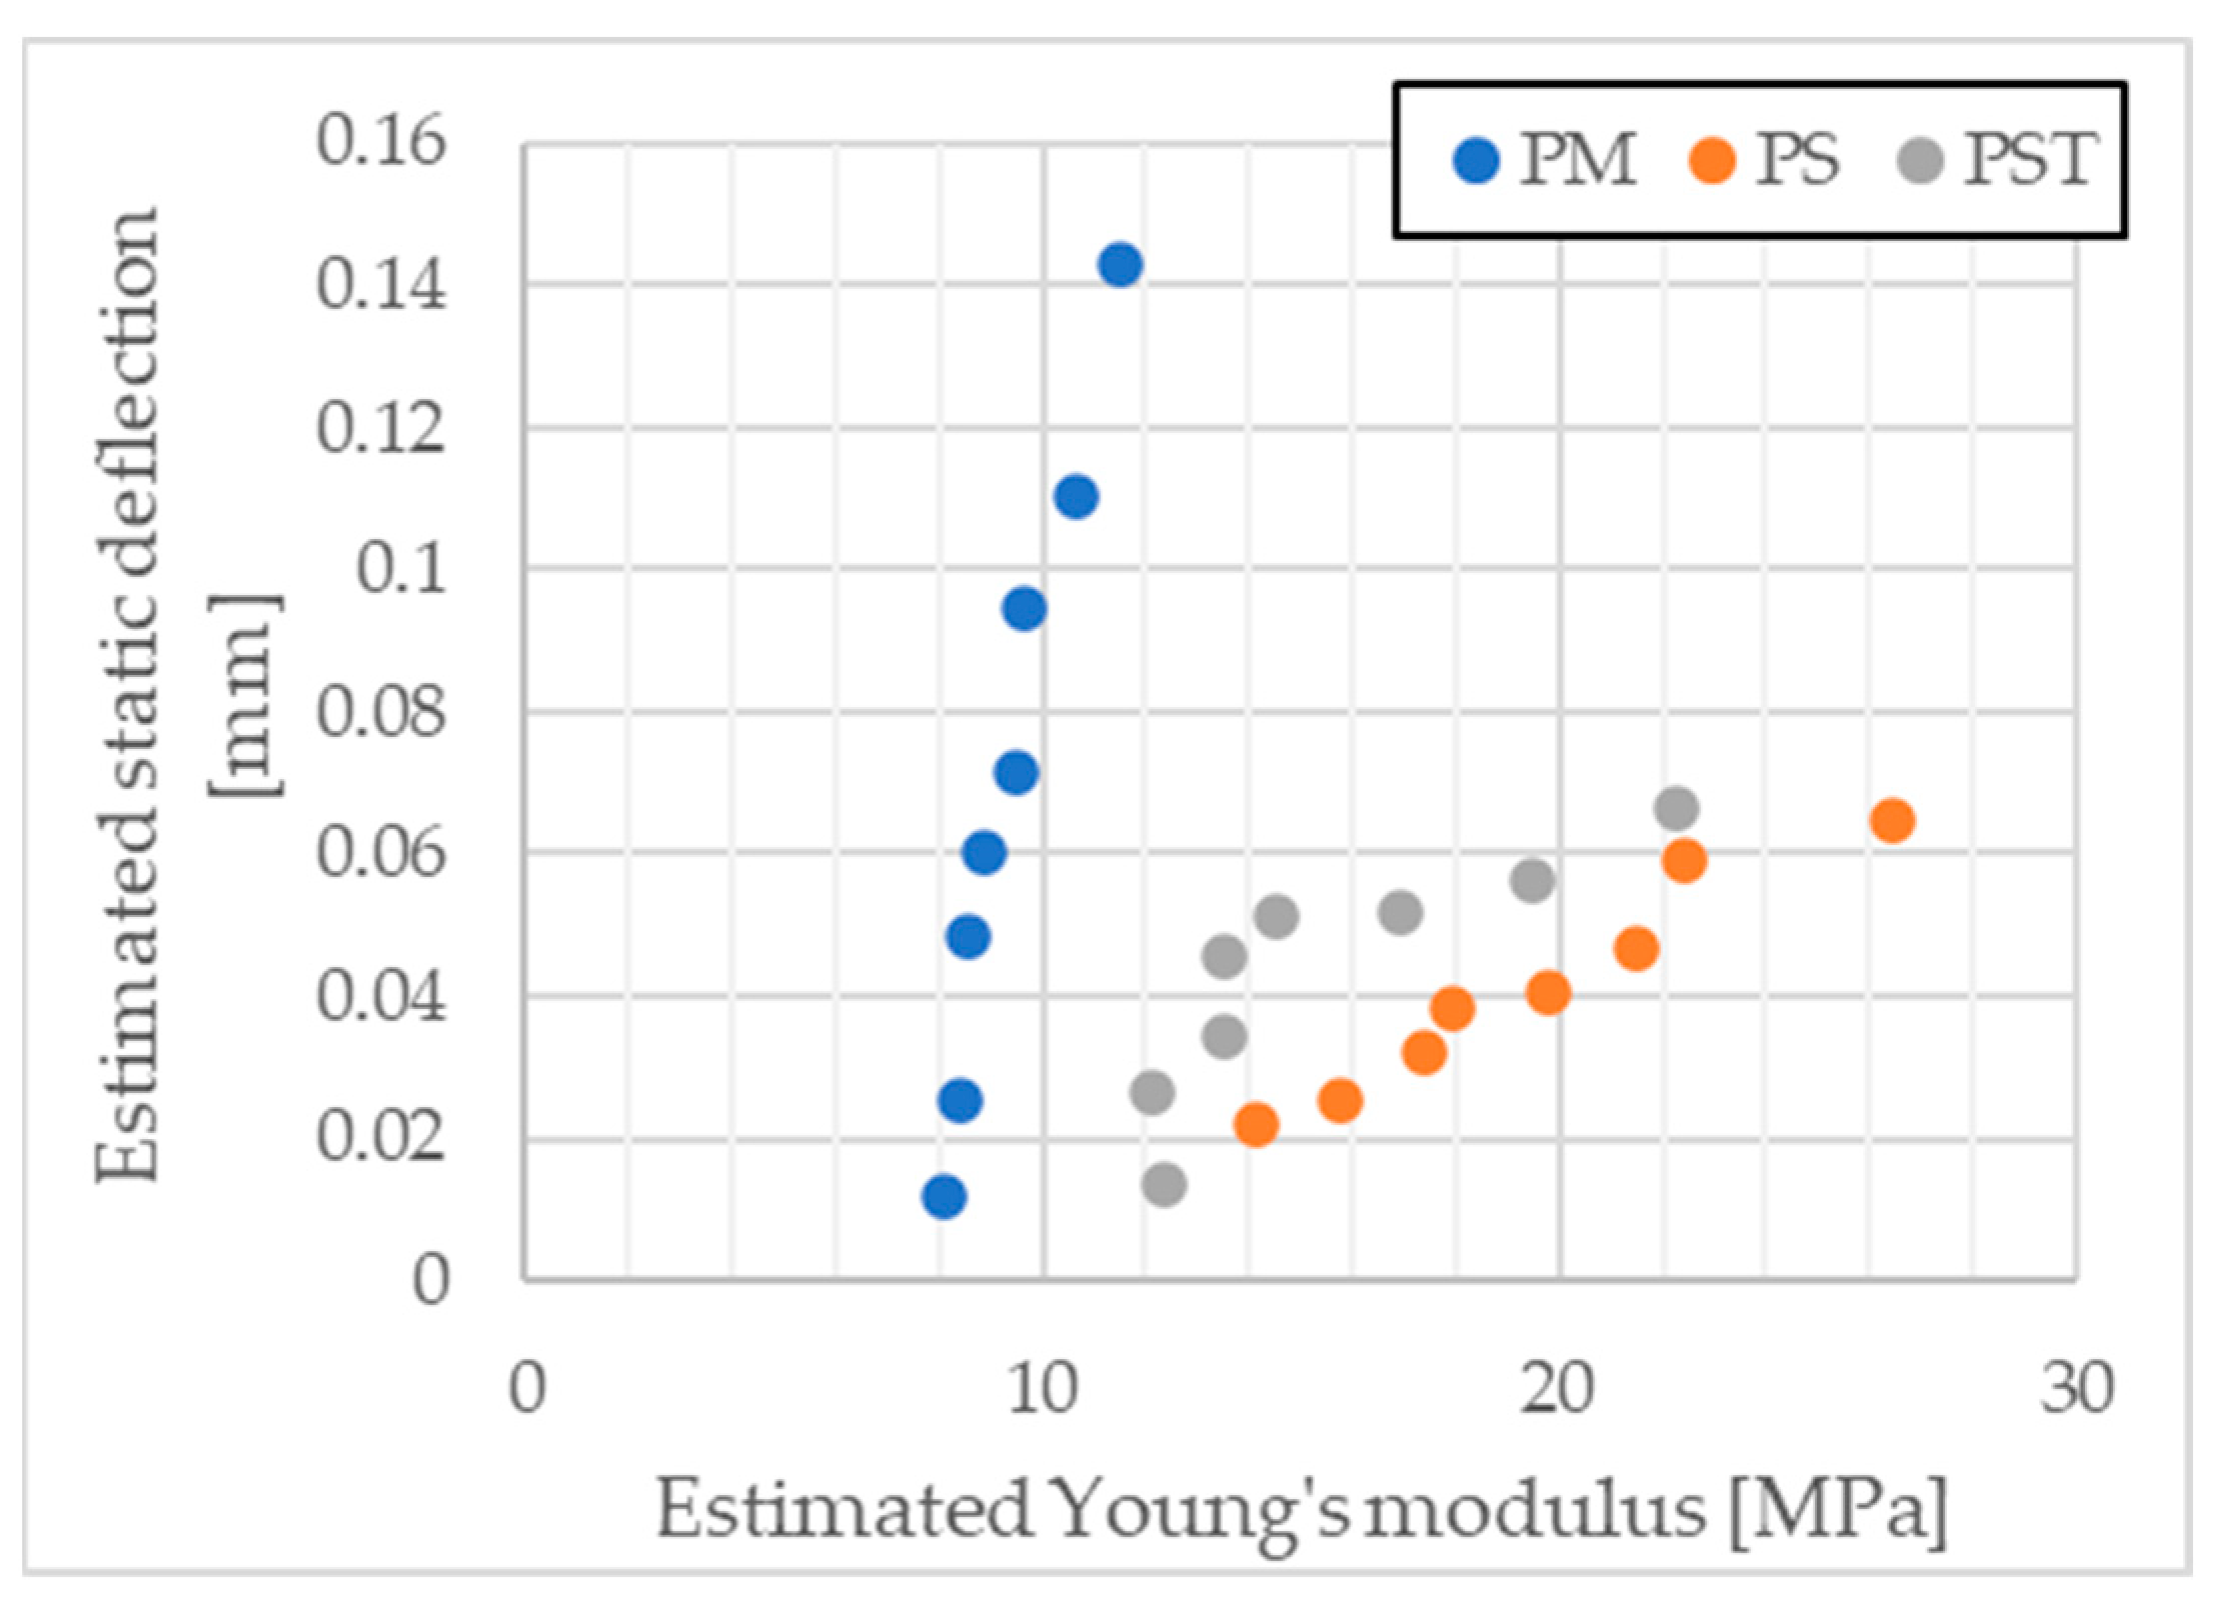
4.2. Young’s Modulus Evaluation and Sample Irregularities Issue in the Context of Dynamic Stiffness
4.3. Dynamic Stiffness Influence on Sound Reduction Index for Building Partitions
4.4. Prediction of Error on Dynamic Stiffness Estimation Using Laboratory Test
4.5. Rayleigh Damping of Cylindrical Samples Sets
5. Conclusions
6. Further Studies
Author Contributions
Funding
Institutional Review Board Statement
Informed Consent Statement
Data Availability Statement
Acknowledgments
Conflicts of Interest
References
- Kuddus, M.A.; Tynan, E.; McBryde, E. Urbanization: A Problem for the Rich and the Poor? Public Health Rev. 2020, 41, 1. [Google Scholar] [CrossRef] [PubMed]
- Sikder, M.; Wang, C.; Yao, X.; Huai, X.; Wu, L.; KwameYeboah, F.; Wood, J.; Zhao, Y.; Dou, X. The Integrated Impact of GDP Growth, Industrialization, Energy Use, and Urbanization on CO2 Emissions in Developing Countries: Evidence from the Panel ARDL Approach. Sci. Total Environ. 2022, 837, 155795. [Google Scholar] [CrossRef] [PubMed]
- Hazell, P.; Haggblade, S.; Reardon, T. Transformation of the Rural Nonfarm Economy During Rapid Urbanization and Structural Transformation in Developing Regions. Annu. Rev. Resour. Econ. 2024, 16, 277–299. [Google Scholar] [CrossRef]
- Murayama, Y.; Simwanda, M.; Ranagalage, M. Spatiotemporal Analysis of Urbanization Using GIS and Remote Sensing in Developing Countries. Sustainability 2021, 13, 3681. [Google Scholar] [CrossRef]
- Magazzino, C.; Mele, M. On the Relationship between Transportation Infrastructure and Economic Development in China. Res. Transp. Econ. 2021, 88, 100947. [Google Scholar] [CrossRef]
- Pradhan, R.P.; Arvin, M.B.; Nair, M. Urbanization, Transportation Infrastructure, ICT, and Economic Growth: A Temporal Causal Analysis. Cities 2021, 115, 103213. [Google Scholar] [CrossRef]
- Gallent, N.; Morphet, J.; Chiu, R.L.H.; Filion, P.; Fischer, K.F.; Gurran, N.; Li, P.; Schwartz, A.; Stead, D. International Experience of Public Infrastructure Delivery in Support of Housing Growth. Cities 2020, 107, 102920. [Google Scholar] [CrossRef]
- Kulka, A.; Sood, A.; Chiumenti, N. How to Increase Housing Affordability: Understanding Local Deterrents to Building Multifamily Housing; Federal Reserve Bank of Boston: Boston, MA, USA, 2022. [Google Scholar]
- Aljoufie, M. The Impact Assessment of Increasing Population Density on Jeddah Road Transportation Using Spatial-Temporal Analysis. Sustainability 2021, 13, 1455. [Google Scholar] [CrossRef]
- Sharma, K.K.; Bhandary, N.P.; Subedi, M.; Pradhananga, R. Unraveling the Nexus between Road Transport Infrastructures and Economic Growth: Empirical Insights from Nepal’s Case. Economies 2024, 12, 221. [Google Scholar] [CrossRef]
- Marquis-Favre, C.; Gille, L.-A.; Breton, L. Combined Road Traffic, Railway and Aircraft Noise Sources: Total Noise Annoyance Model Appraisal from Field Data. Appl. Acoust. 2021, 180, 108127. [Google Scholar] [CrossRef]
- Preisendörfer, P.; Liebe, U.; Bruderer Enzler, H.; Diekmann, A. Annoyance Due to Residential Road Traffic and Aircraft Noise: Empirical Evidence from Two European Cities. Environ. Res. 2022, 206, 112269. [Google Scholar] [CrossRef] [PubMed]
- Zambon, G.; Muchetti, S.S.; Salvi, D.; Angelini, F.; Brambilla, G.; Benocci, R. Analysis of Noise Annoyance Complaints in the City of Milan, Italy. J. Phys. Conf. Ser. 2020, 1603, 012029. [Google Scholar] [CrossRef]
- Kowalska-Koczwara, A.; Rizzo, F.; Sabbà, M.F.; Bedon, C. Assessing the Influence of RMS and VDV on Analysis of Human Perception of Vibrations in Buildings Caused by Selected Sources of Traffic. Appl. Sci. 2024, 14, 3688. [Google Scholar] [CrossRef]
- Benz, S.L.; Kuhlmann, J.; Schreckenberg, D.; Wothge, J. Contributors to Neighbour Noise Annoyance. Int. J. Environ. Res. Public Health 2021, 18, 8098. [Google Scholar] [CrossRef]
- Gutiérrez, G.; Marín-Restrepo, L. Acoustic Comfort and Noise Control in the Design of Multi-Residential Buildings in the Tropics. In Removing Barriers to Environmental Comfort in the Global South; Springer: Cham, Switzerland, 2023; pp. 279–293. [Google Scholar]
- Nering, K.; Nering, K. Alternative Method for Determination of Vibroacoustic Material Parameters for Building Applications. Materials 2024, 17, 3042. [Google Scholar] [CrossRef]
- Schoenwald, S.; Vallely, S. Cross Laminated Timber Elements with Functional Grading and Localised Ballast to Improve Airborne and Impact Sound Insulation. In Proceedings of the 10th Convention of the European Acoustics Association Forum Acusticum 2023, Torino, Italy, 11–15 September 2023; European Acoustics Association: Turin, Italy, 2024; pp. 1529–1534. [Google Scholar]
- European Parliament; Council of the European Union. Directive 2002/49/EC of the European Parliament and of the Council of 25 June 2002 Relating to the Assessment and Management of Environmental Noise—Declaration by the Commission in the Conciliation Committee on the Directive Relating to the Assessment and Management of Environmental Noise; Official Journal L 189, 18/07/2002; European Parliament: Strasbourg, France; Council of the European Union: Brussels, Belgium, 2002; pp. 0012–0026. [Google Scholar]
- Khan, D.; Burdzik, R. Measurement and Analysis of Transport Noise and Vibration: A Review of Techniques, Case Studies, and Future Directions. Measurement 2023, 220, 113354. [Google Scholar] [CrossRef]
- Kowalska-Koczwara, A.; Pachla, F.; Tatara, T.; Nering, K. Green Areas in the City as an Element of Noise Protection. IOP Conf. Ser. Mater. Sci. Eng. 2021, 1203, 032025. [Google Scholar] [CrossRef]
- Nering, K. Damping Problem of Numerical Simulation of Structural Reverberation Time. IOP Conf. Ser. Mater. Sci. Eng. 2020, 960, 042083. [Google Scholar] [CrossRef]
- Nering, K.; Kowalska-Koczwara, A.; Shymanska, A.; Pawluś, M. The Possibility of Providing Acoustic Comfort in Hotel Rooms as an Element of Sustainable Development. Sustainability 2022, 14, 13692. [Google Scholar] [CrossRef]
- Fedorczak-Cisak, M.; Kowalska-Koczwara, A.; Nering, K.; Pachla, F.; Radziszewska-Zielina, E.; Stecz, P.; Tatara, T.; Jeleński, T. Measurement and Diagnosis of Comfort in a Historic Building. Energies 2022, 15, 8963. [Google Scholar] [CrossRef]
- Shamatov, I.Y.; Shopulotova, Z.A.; Abdukadirova, N.B. Comprehensive audiological studies sensory neural hearing loss of noise genesis. Am. J. Soc. Sci. Humanit. Res. 2023, 3, 128–132. [Google Scholar] [CrossRef]
- Natarajan, N.; Batts, S.; Stankovic, K.M. Noise-Induced Hearing Loss. J. Clin. Med. 2023, 12, 2347. [Google Scholar] [CrossRef]
- Fink, D. Review of Hearing Loss in Children. JAMA 2021, 325, 1223. [Google Scholar] [CrossRef]
- Lieu, J.E.C.; Kenna, M.; Anne, S.; Davidson, L. Hearing Loss in Children. JAMA 2020, 324, 2195. [Google Scholar] [CrossRef]
- Tao, Y.; Chai, Y.; Kou, L.; Kwan, M.-P. Understanding Noise Exposure, Noise Annoyance, and Psychological Stress: Incorporating Individual Mobility and the Temporality of the Exposure-Effect Relationship. Appl. Geogr. 2020, 125, 102283. [Google Scholar] [CrossRef]
- Eze, I.C.; Foraster, M.; Schaffner, E.; Vienneau, D.; Pieren, R.; Imboden, M.; Wunderli, J.-M.; Cajochen, C.; Brink, M.; Röösli, M.; et al. Incidence of Depression in Relation to Transportation Noise Exposure and Noise Annoyance in the SAPALDIA Study. Environ. Int. 2020, 144, 106014. [Google Scholar] [CrossRef]
- Stansfeld, S.; Clark, C.; Smuk, M.; Gallacher, J.; Babisch, W. Road Traffic Noise, Noise Sensitivity, Noise Annoyance, Psychological and Physical Health and Mortality. Environ. Health 2021, 20, 32. [Google Scholar] [CrossRef]
- Gong, X.; Fenech, B.; Blackmore, C.; Chen, Y.; Rodgers, G.; Gulliver, J.; Hansell, A.L. Association between Noise Annoyance and Mental Health Outcomes: A Systematic Review and Meta-Analysis. Int. J. Environ. Res. Public Health 2022, 19, 2696. [Google Scholar] [CrossRef]
- Ruhala, R.; Ruhala, L. Case Study of Office Noise and Vibration Annoyance Due to Building Water Pumps for HVAC Equipment. Inter-Noise Noise-Con Congr. Conf. Proc. 2022, 264, 865–873. [Google Scholar] [CrossRef]
- Lazi, M.K.A.M.; Adnan, M.A.; Sulaiman, N.; Kamarudin, S.N.N.; Hassan, S.A.; Warid, M.N.M.; Samsudin, M.S.; Jasmi, A.R.; Zolkepli, M.F. Allowable Limit of Human Annoyance Towards Ground-Borne Vibration Velocity Induced by Rail Traffic: A Review. IOP Conf. Ser. Earth Environ. Sci. 2023, 1238, 012007. [Google Scholar] [CrossRef]
- Avci, O.; Bhargava, A.; Nikitas, N.; Inman, D.J. Vibration Annoyance Assessment of Train Induced Excitations from Tunnels Embedded in Rock. Sci. Total Environ. 2020, 711, 134528. [Google Scholar] [CrossRef]
- Vincens, N.; van Kempen, E.; Ögren, M.; Persson Waye, K. Living Close to Railways: Cross-Sectional Analysis of Ground-Borne Vibrations and Vibration Annoyance. Transp. Res. D Transp. Environ. 2024, 136, 104458. [Google Scholar] [CrossRef]
- Liu, H.; Lin, X.; Gong, Z.; Shi, J. Combined Annoyance Assessment of Ship Structural Vibration and Ambient Noise. Buildings 2023, 13, 363. [Google Scholar] [CrossRef]
- Maravich, M.M.; Rosenkranz, R.; Altinsoy, M.E. Annoyance Caused by Simultaneous Noise and Vibration in Commercial Vehicles: Multimodal Interaction and the Effects of Sinusoidal Components in Recorded Seat Vibrations. Vibration 2023, 6, 536–555. [Google Scholar] [CrossRef]
- Maigrot, P.; Parizet, É.; Marquis-Favre, C. Annoyance Due to Combined Railway Noise and Vibration: Comparison and Testing of Results from the Literature. Appl. Acoust. 2020, 165, 107324. [Google Scholar] [CrossRef]
- Hoekstra, J.; Van Kempen, E.; Kok, A.; Simon, S.; Mabjaia, N.; Van Wijnen, H.; Van Kamp, I. Effects of Combined Exposure to Railway Vibration and Noise on Severe Annoyance. In Proceedings of the 36th Annual Conference of the International Society of Environmental Epidemiology, Santiago, Chile, 25–28 August 2024; ISEE Conference Abstracts. Volume 2024. [Google Scholar] [CrossRef]
- Nering, K.; Kowalska-Koczwara, A.; Stypuła, K. Annoyance Based Vibro-Acoustic Comfort Evaluation of as Summation of Stimuli Annoyance in the Context of Human Exposure to Noise and Vibration in Buildings. Sustainability 2020, 12, 9876. [Google Scholar] [CrossRef]
- Kowalska-Koczwara, A.; Pachla, F.; Nering, K. Environmental Protection Against Noise and Vibration. IOP Conf. Ser. Mater. Sci. Eng. 2021, 1203, 032026. [Google Scholar] [CrossRef]
- Laze, K. An Overview of Patents of Noise Reduction in Buildings. Build. Acoust. 2024. [Google Scholar] [CrossRef]
- Amran, M.; Fediuk, R.; Murali, G.; Vatin, N.; Al-Fakih, A. Sound-Absorbing Acoustic Concretes: A Review. Sustainability 2021, 13, 10712. [Google Scholar] [CrossRef]
- Wang, J.; Du, B. Sound Insulation Performance of Foam Rubber Damping Pad and Polyurethane Foam Board in Floating Floors. Exp. Tech. 2023, 47, 839–850. [Google Scholar] [CrossRef]
- Huang, X.; Zeng, Z.; Li, Z.; Luo, X.; Yin, H.; Wang, W. Experimental Study on Vibration Characteristics of the Floating Slab with Under-Slab Polyurethane Mats Considering Fatigue Loading Effect. Eng. Struct. 2023, 276, 115322. [Google Scholar] [CrossRef]
- Sołkowski, J.; Górszczyk, J.; Malicki, K.; Kudła, D. The Effect of Fatigue Test on the Mechanical Properties of the Cellular Polyurethane Mats Used in Tram and Railway Tracks. Materials 2021, 14, 4118. [Google Scholar] [CrossRef]
- Smirnov, V. Basement Vibration Isolation Efficiency Investigation. IOP Conf. Ser. Mater. Sci. Eng. 2020, 896, 012020. [Google Scholar] [CrossRef]
- Plugin, A.A.; Plugin, D.A.; Pluhin, O.A.; Borziak, O.S. The Influence of the Molecular Structure of Polyurethane on Vibro- and Electroinsulation Properties of the Tramway Structures. In Proceedings of the CEE 2019, Lviv, Ukraine, 11–13 September 2020; pp. 346–353. [Google Scholar]
- Zhang, Y.; Wang, Z.; Sun, C.; Chang, X.; Jia, X. Characteristics and Control of Impact Vibration and Noise in Rail Belt Conveyor. J. Vib. Control. 2024. [Google Scholar] [CrossRef]
- Pushenko, S.; Bozhko, E.; Zolotuhina, I. Methods for Reducing Vibrations Generated by Shock Equipment. In Proceedings of the Topical Problems of Green Architecture, Civil and Environmental Engineering 2019, Moscow, Russia, 19–22 November 2019; E3S Web of Conferences. Volume 164, p. 01026. [Google Scholar] [CrossRef]
- Parcheta-Szwindowska, P.; Kopczyńska, K.; Kordyzon, M.J.; Datta, J. Fabrication and Characterization of Green Polyurethane Foams with Enhanced Vibration Damping Capability. ACS Sustain. Chem. Eng. 2023, 11, 14348–14357. [Google Scholar] [CrossRef]
- Gosar, A.; Emri, I.; Klemenc, J.; Nagode, M.; Oman, S. On the Vibration-Damping Properties of the Prestressed Polyurethane Granular Material. Polymers 2023, 15, 1299. [Google Scholar] [CrossRef]
- Karpiesiuk, J. Mechanical Strength Indicators of Polyurethane Adhesive in Lightweight Floor Systems. Tech. Trans. 2020, 117, 1–14. [Google Scholar] [CrossRef]
- Zhao, P. Impact Sound Insulation Performance of Floating Floor Assemblies on Mass Timber Slabs. Mater’s Thesis, University of Northern British Columbia, Prince George, BC, Canada, 2022. [Google Scholar]
- Salino, R.E.; Catai, R.E. A Study of Polyurethane Waste Composite (PUR) and Recycled Plasterboard Sheet Cores with Polyurethane Foam for Acoustic Absorption. Constr. Build. Mater. 2023, 387, 131201. [Google Scholar] [CrossRef]
- Zhong, K.; Shao, C.; Sun, M.; Tian, X. Evaluation of the Attenuation Mechanism of the Noise Reduction Performance of Polyurethane Porous Elastic Road Surface. Constr. Build. Mater. 2024, 448, 138247. [Google Scholar] [CrossRef]
- Lasowicz, N.; Kwiecień, A.; Jankowski, R. Experimental Study on the Effectiveness of Polyurethane Flexible Adhesive in Reduction of Structural Vibrations. Polymers 2020, 12, 2364. [Google Scholar] [CrossRef]
- Cortazar-Noguerol, J.; Cortés, F.; Sarría, I.; Elejabarrieta, M.J. Preload Influence on the Dynamic Properties of a Polyurethane Elastomeric Foam. Polymers 2024, 16, 1844. [Google Scholar] [CrossRef] [PubMed]
- Konar, D.; Stewart, K.A.; Moerschel, J.; Rynk, J.F.; Sumerlin, B.S. Polysquaramides. ACS Macro Lett. 2024, 13, 972–978. [Google Scholar] [CrossRef] [PubMed]
- Aguirresarobe, R.H.; Nevejans, S.; Reck, B.; Irusta, L.; Sardon, H.; Asua, J.M.; Ballard, N. Healable and Self-Healing Polyurethanes Using Dynamic Chemistry. Prog. Polym. Sci. 2021, 114, 101362. [Google Scholar] [CrossRef]
- Nowak-Michta, A.; Kwiecień, A.; Michta, J. A Roadmap for the Certification of Polyurethane Flexible Connectors Used as Envelope Products in the Next Generation of Healthy, Nearly Zero-Energy Buildings. Materials 2024, 17, 5503. [Google Scholar] [CrossRef]
- Cho, J.; Lee, H.-S.; Park, M.; Song, K.; Kim, J.; Kwon, N. Estimating the Performance of Heavy Impact Sound Insulation Using Empirical Approaches. J. Asian Archit. Build. Eng. 2021, 20, 298–313. [Google Scholar] [CrossRef]
- Marques, B.; António, J.; Almeida, J.; Tadeu, A.; de Brito, J.; Dias, S.; Pedro, F.; Sena, J.D. Vibro-Acoustic Behaviour of Polymer-Based Composite Materials Produced with Rice Husk and Recycled Rubber Granules. Constr. Build. Mater. 2020, 264, 120221. [Google Scholar] [CrossRef]
- Bettarello, F.; Gasparella, A.; Caniato, M. The Influence of Floor Layering on Airborne Sound Insulation and Impact Noise Reduction: A Study on Cross Laminated Timber (CLT) Structures. Appl. Sci. 2021, 11, 5938. [Google Scholar] [CrossRef]
- Arenas, J.P.; Sepulveda, L.F. Impact Sound Insulation of a Lightweight Laminate Floor Resting on a Thin Underlayment Material above a Concrete Slab. J. Build. Eng. 2022, 45, 103537. [Google Scholar] [CrossRef]
- ISO 12354-1:2017; Building Acoustics—Estimation of Acoustic Performance of Buildings from the Performance of Elements—Part 1: Airborne Sound Insulation between Rooms. International Organization for Standardization: Geneva, Switzerland, 2017.
- ISO 12354-2:2017; Building Acoustics—Estimation of Acoustic Performance of Buildings from the Performance of Elements—Part 2: Impact Sound Insulation between Rooms. International Organization for Standardization: Geneva, Switzerland, 2017.
- EN 29052-1:2011/ISO 9052-1. Acoustics—Determination of Dynamic Stiffness—Part 1: Materials Used under Floating Floors in Dwellings. Available online: https://Standards.Iteh.Ai/Catalog/Standards/Cen/04a2dad0-Ff01-4409-B2d4-6d6d62feb5c7/En-29-052-1-1992 (accessed on 1 December 2022).
- Caniato, M. Sound Insulation of Complex Façades: A Complete Study Combining Different Numerical Approaches. Appl. Acoust. 2020, 169, 107484. [Google Scholar] [CrossRef]
- Jayalath, A.; Navaratnam, S.; Gunawardena, T.; Mendis, P.; Aye, L. Airborne and Impact Sound Performance of Modern Lightweight Timber Buildings in the Australian Construction Industry. Case Stud. Constr. Mater. 2021, 15, e00632. [Google Scholar] [CrossRef]
- Yue, K.; Cheng, X.; Zhang, Y.; Xie, C.; Wu, P.; Zhao, H. Improvement in Airborne Sound Insulation of Cross-Laminated Timber (Clt) Walls; Research Square Platform LLC.: Durham, NC, USA, 2023. [Google Scholar]
- Lietzén, J.; Kovalainen, V.; Talus, L.; Kylliäinen, M.; Lopetegi, A.; Aldalur, A. Sound Insulation of Suspended Ceilings: A FEM-Based Comparison of Suspension Systems. In Proceedings of the 10th Convention of the European Acoustics Association Forum Acusticum 2023, Torino, Italy, 11–15 September 2023; European Acoustics Association: Turin, Italy, 2022; pp. 5989–5996. [Google Scholar]
- Gao, G.; Bi, J.; Chen, Q.; Chen, R. Analysis of Ground Vibrations Induced by High-Speed Train Moving on Pile-Supported Subgrade Using Three-Dimensional FEM. J. Cent. South Univ. 2020, 27, 2455–2464. [Google Scholar] [CrossRef]
- Kovacic, I.; Teofanov, L.; Kanovic, Z.; Zhao, J.; Zhu, R.; Rajs, V. On the Influence of Internal Oscillators on the Performance of Metastructures: Modelling and Tuning Conditions. Mech. Syst. Signal Process. 2023, 205, 110861. [Google Scholar] [CrossRef]
- Cai, C.; Deng, S.; Xiong, Q.; Wu, D.; Li, C. Tuning Fork Seismic Metamaterial for Low-Frequency Surface Wave Attenuation with Locally Resonant Band Gaps. J. Vib. Eng. Technol. 2024, 12, 4039–4051. [Google Scholar] [CrossRef]
- Liu, J.; Li, X.; Cao, J.; Duan, Z.; Ye, Q.; Feng, G. Geometric Parameter Effects on Bandgap Characteristics of Periodic Pile Barriers in Passive Vibration Isolation. Symmetry 2024, 16, 1130. [Google Scholar] [CrossRef]
- Chirikov, V.A.; Dimitrov, D.M.; Boyadjiev, Y.S. Determination of the Dynamic Young’s Modulus and Poisson’s Ratio Based on Higher Frequencies of Beam Transverse Vibration. Procedia Manuf. 2020, 46, 87–94. [Google Scholar] [CrossRef]
- Qin, H.; Li, L. Error Caused by Damping Formulating in Multiple Support Excitation Problems. Appl. Sci. 2020, 10, 8180. [Google Scholar] [CrossRef]
- Lyratzakis, A.; Tsompanakis, Y.; Psarropoulos, P.N. Efficient Mitigation of High-Speed Train Vibrations on Adjacent Reinforced Concrete Buildings. Constr. Build. Mater. 2022, 314, 125653. [Google Scholar] [CrossRef]
- Jafari, M.; Alipour, A. Methodologies to Mitigate Wind-Induced Vibration of Tall Buildings: A State-of-the-Art Review. J. Build. Eng. 2021, 33, 101582. [Google Scholar] [CrossRef]
- Zhang, S.Y.; Zhao, H.Y.; Ding, H.H.; Lin, Q.; Wang, W.J.; Guo, J.; Wang, P.; Zhou, Z.R. Effect of Vibration Amplitude and Axle Load on the Rail Rolling Contact Fatigue under Water Condition. Int. J. Fatigue 2023, 167, 107329. [Google Scholar] [CrossRef]
- Jing, L.; Wang, K.; Zhai, W. Impact Vibration Behavior of Railway Vehicles: A State-of-the-Art Overview. Acta Mech. Sin. 2021, 37, 1193–1221. [Google Scholar] [CrossRef]
- Nering, K.; Nering, K. A Low-Stress Method for Determining Static and Dynamic Material Parameters for Vibration Isolation with the Use of VMQ Silicone. Materials 2023, 16, 2960. [Google Scholar] [CrossRef] [PubMed]
- Nering, K.; Kowalska-Koczwara, A. Determination of Vibroacoustic Parameters of Polyurethane Mats for Residential Building Purposes. Polymers 2022, 14, 314. [Google Scholar] [CrossRef]
- Zhang, L.; Dupuis, R. Measurement and Identification of Dynamic Properties of Flexible Polyurethane Foam. J. Vib. Control. 2011, 17, 517–526. [Google Scholar] [CrossRef]
- Rutkowski, P.; Kwiecień, K.; Berezicka, A.; Sułowska, J.; Kwiecień, A.; Śliwa-Wieczorek, K.; Azinovic, B.; Schwarzkopf, M.; Pondelak, A.; Pečnik, J.G.; et al. Thermal Stability and Heat Transfer of Polyurethanes for Joints Applications of Wooden Structures. Molecules 2024, 29, 3337. [Google Scholar] [CrossRef] [PubMed]
- Yu, D.-H.; Li, G.; Li, H.-N. Implementation of Rayleigh Damping for Local Nonlinear Dynamic Analysis Based on a Matrix Perturbation Approach. J. Struct. Eng. 2021, 147, 04021130. [Google Scholar] [CrossRef]
- Yılmaz, İ.; Arslan, E.; Kızıltaş, E.Ç.; Çavdar, K. Development of a Prediction Method of Rayleigh Damping Coefficients for Free Layer Damping Coatings through Machine Learning Algorithms. Int. J. Mech. Sci. 2020, 166, 105237. [Google Scholar] [CrossRef]
- Sánchez Iglesias, F.; Fernández López, A. Rayleigh Damping Parameters Estimation Using Hammer Impact Tests. Mech. Syst. Signal Process. 2020, 135, 106391. [Google Scholar] [CrossRef]


| Device Name/Manufacturer | Key Feature | Key Value of Parameters |
|---|---|---|
| Dynamic exciter—Brüel & Kjær (Virum, Denmark) Mini-shaker Type 4810 | Provides sinusoidal force | Sine peak max 10 N Frequency range DC-18 kHz |
| Force sensor—Forsentek (Shenzhen, China) FSSM 50 N | Measures force applied to system | Max force 50 N Rated output 2.0 mV/V Hysteresis ± 0.1% R.O. (rated output) |
| IEPE accelerometer—MMF (Radebeul, Germany) KS78B.100 | Measures acceleration of system response | Peak acceleration 60 g (~600 m/s2) Linear frequency range (5% deviation) 0.6 Hz–14 kHz |
| Dynamic stiffness test bench | Measures resonant frequency of sample set under load of 8 kg | Linear frequency range upper limit (5% deviation) 20–350 Hz—measured |
| Material Type (Manufacturer) | Nominal Density [kg/m3] | Poisson Ratio |
|---|---|---|
| Polyurethane PM (FlexAndRobust Systems, Cracow, Poland) | 970 | 0.48 |
| Polyurethane PS (FlexAndRobust Systems, Cracow, Poland) | 1450 | 0.48 |
| Polyurethane PST (FlexAndRobust Systems, Cracow, Poland) | 1100 | 0.48 |
| Parameter | Material Type | ||
|---|---|---|---|
| PM | PS | PST | |
| Cylindrical samples | |||
| Mass [g] | 59.0511 (59.0230; 59.0792) | 88.2842 (88.1675; 88.4009) | 68.0833 (67.9656; 68.2011) |
| Diameter [mm] | 29.0467 (29.0334; 29.0600) | 29.0517 (29.0433; 29.0600) | 29.0653 (29.0521; 29.0784) |
| Height [mm] | 91.8710 (91.8251; 91.9170) | 91.9803 (91.9617; 91.9990) | 92.0426 (92.0151; 92.0700) |
| Cuboid samples | |||
| Mass [g] | 794.00 (779.08; 808.92) | 1186.67 (1148.63; 1224.71) | 904.33 (877.85; 930.82) |
| Height [mm] | 19.8883 (19.5975; 20.1791) | 20.4917 (20.1622; 20.8211) | 19.7700 (19.1585; 20.3815) |
| Parameter | Material Type | ||
|---|---|---|---|
| PM | PS | PST | |
| Irregularities with 95% credibility interval in brackets [mm] | 0.89 (0.22; 1.13) | 0.41 (0.21; 0.73) | 0.60 (0.19; 0.75) |
| Element | Density [kg/m3] | Poisson Ratio [-] | Young’s Modulus [GPa] |
|---|---|---|---|
| Steel plate | 7850 | 0.30 | 210 |
| Test sample (PS, PM, PST) | As in Table 2 PS, 1450 PM, 970 PST, 1100 | As in Table 2 (0.48) | From analysis (see Section 4.2) |
| Material Type | fr [Hz] (95% CI) | CDF [-] |
|---|---|---|
| PM | 270.28 (230.92; 309.63) | beyond method capabilities (>0.3) |
| PS | 159.26 (67.76; 250.76) | beyond method capabilities (>0.3) |
| PST | 116.49 (45.60; 187.38) | beyond method capabilities (>0.3) |
| Material Type | Cylinders Quantity [pcs.] | fr [Hz] | CDF [-] | ||||
|---|---|---|---|---|---|---|---|
| Test Batch 1 | Test Batch 2 | Test Batch 3 | Test Batch 1 | Test Batch 2 | Test Batch 3 | ||
| PM | 4 | 32.3 | 32.1 | 33.2 | 0.0510 | 0.0551 | 0.0495 |
| 5 | 35.0 | 34.9 | 35.1 | 0.0465 | 0.0506 | 0.0452 | |
| 6 | 36.7 | 36.1 | 36.6 | 0.0431 | 0.0422 | 0.0414 | |
| 7 | 39.4 | 38.5 | 39.2 | 0.0465 | 0.0469 | 0.0474 | |
| 8 | 41.0 | 39.2 | 41.1 | 0.0447 | 0.0416 | 0.0487 | |
| 9 | 42.7 | 40.7 | 42.9 | 0.0437 | 0.0422 | 0.0437 | |
| 11 | 47.0 | 44.1 | 47.3 | 0.0604 | 0.0516 | 0.0588 | |
| 13 | 48.9 | 46.7 | 51.6 | 0.0443 | 0.0621 | 0.0500 | |
| PS | 4 | 49.3 | 49.1 | 49.5 | 0.0565 | 0.0543 | 0.0571 |
| 5 | 48.8 | 52.3 | 51.3 | 0.0673 | 0.0659 | 0.0646 | |
| 6 | 55.4 | 54.0 | 53.9 | 0.0626 | 0.0652 | 0.0578 | |
| 7 | 57.5 | 55.0 | 56.9 | 0.0627 | 0.0646 | 0.0566 | |
| 8 | 55.6 | 58.6 | 58.1 | 0.0648 | 0.0706 | 0.0669 | |
| 9 | 58.0 | 62.0 | 59.9 | 0.0627 | 0.0640 | 0.0653 | |
| 11 | 63.1 | 65.9 | 60.5 | 0.0692 | 0.0754 | 0.0822 | |
| 13 | 64.3 | 69.5 | 61.1 | 0.0878 | 0.0870 | 0.1061 | |
| PST | 4 | 45.7 | 45.8 | 44.3 | 0.0568 | 0.0529 | 0.0562 |
| 5 | 48.1 | 48.1 | 45.7 | 0.0552 | 0.0546 | 0.0541 | |
| 6 | 48.1 | 49.8 | 46.9 | 0.0559 | 0.0519 | 0.0583 | |
| 7 | 48.3 | 49.2 | 47.5 | 0.0568 | 0.0528 | 0.0591 | |
| 8 | 51.7 | 50.0 | 47.6 | 0.0633 | 0.0678 | 0.0525 | |
| 9 | 52.6 | 56.0 | 50.1 | 0.0604 | 0.0692 | 0.0580 | |
| 11 | 54.7 | 58.9 | 52.5 | 0.0614 | 0.0677 | 0.0542 | |
| 13 | 60.2 | 65.8 | 56.0 | 0.1330 | 0.1110 | 0.0901 | |
| Material Type | Cylinders Quantity [pcs.] | Average Young’s Modulus [MPa] | FEM Estimated fr [Hz] | DS from FEM Simulations [MN/m3] | DS from Cuboid Sample Measurements (95% CI) [MN/m3] |
|---|---|---|---|---|---|
| PM | 4 | 11.51 | 594.73 | 2793 | 421–757 |
| 5 | 10.67 | 572.65 | 2589 | ||
| 6 | 9.66 | 544.67 | 2342 | ||
| 7 | 9.46 | 539.03 | 2294 | ||
| 8 | 8.88 | 522.47 | 2155 | ||
| 9 | 8.57 | 513.23 | 2080 | ||
| 11 | 8.42 | 508.59 | 2042 | ||
| 13 | 8.07 | 498.04 | 1958 | ||
| PS | 4 | 26.42 | 883.45 | 6162 | 36–497 |
| 5 | 22.45 | 814.44 | 5237 | ||
| 6 | 21.47 | 796.60 | 5010 | ||
| 7 | 19.82 | 765.45 | 4626 | ||
| 8 | 17.93 | 728.06 | 4185 | ||
| 9 | 17.39 | 717.10 | 4060 | ||
| 11 | 15.79 | 683.31 | 3687 | ||
| 13 | 14.16 | 647.14 | 3307 | ||
| PST | 4 | 22.28 | 822.60 | 5343 | 16–277 |
| 5 | 19.44 | 768.57 | 4664 | ||
| 6 | 16.91 | 716.85 | 4057 | ||
| 7 | 14.52 | 664.43 | 3486 | ||
| 8 | 13.48 | 640.22 | 3236 | ||
| 9 | 13.55 | 641.77 | 3252 | ||
| 11 | 12.14 | 607.68 | 2916 | ||
| 13 | 12.36 | 613.17 | 2969 |
| Resonance Frequency of the Additional Layer [Hz] | ΔRw [dB] |
|---|---|
| <80 | 35—Rw/2 |
| 100 | 32—Rw/2 |
| 125 | 30—Rw/2 |
| 160 | 28—Rw/2 |
| 200 | −1 |
| 250 | −3 |
| 315 | −5 |
| 400 | −7 |
| 500 | −9 |
| 630 to 1600 | −10 |
| >1600 | −5 |
| Data Source | Material Type | DS [MN/m3] | fr [Hz] | ΔRw [dB] |
|---|---|---|---|---|
| Cuboidal sample test | PM (95% CI) | 421 | 810 | −10 |
| 757 | 1086 | −10 | ||
| PS (95% CI) | 36 | 237 | −3 | |
| 497 | 880 | −10 | ||
| PST (95% CI) | 16 | 158 | 0 | |
| 277 | 657 | −10 | ||
| FEM analysis with data from cylindrical sample test (4 pcs. batches) | FEM results for PM, PS, PST (min, max) | 1958 | 1747 | −5 |
| 6162 | 3100 | −5 |
| Relative Error | 1% | 5% | 10% | 50% |
|---|---|---|---|---|
| Measured Value | 26.73 | 127.32 | 244.83 | 779.05 |
| FEM simulated value based on cylindrical samples | 27 | 134 | 272 | 1558 |
| Material Type | Model Coefficients | Rayleigh Damping Coefficients | R2 | ||
|---|---|---|---|---|---|
| a | b | α | β | ||
| All materials | 0.002231 | 0.251 | 0.01402 | 0.03995 | 0.9754 |
| PM | 0.001429 | 1.522 | 0.00898 | 0.24223 | 0.0581 |
| PS | 0.002309 | 0.06631 | 0.01451 | 0.01055 | 0.6720 |
| PST | 0.002109 | 0.5587 | 0.01325 | 0.08892 | 0.9075 |
Disclaimer/Publisher’s Note: The statements, opinions and data contained in all publications are solely those of the individual author(s) and contributor(s) and not of MDPI and/or the editor(s). MDPI and/or the editor(s) disclaim responsibility for any injury to people or property resulting from any ideas, methods, instructions or products referred to in the content. |
© 2024 by the authors. Licensee MDPI, Basel, Switzerland. This article is an open access article distributed under the terms and conditions of the Creative Commons Attribution (CC BY) license (https://creativecommons.org/licenses/by/4.0/).
Share and Cite
Nering, K.; Kwiecień, A.; Nering, K. Evaluating the Impact of Sample Irregularities on the Dynamic Stiffness of Polyurethane: Insights from Experimental and FEM Analysis. Materials 2024, 17, 5910. https://doi.org/10.3390/ma17235910
Nering K, Kwiecień A, Nering K. Evaluating the Impact of Sample Irregularities on the Dynamic Stiffness of Polyurethane: Insights from Experimental and FEM Analysis. Materials. 2024; 17(23):5910. https://doi.org/10.3390/ma17235910
Chicago/Turabian StyleNering, Krzysztof, Arkadiusz Kwiecień, and Konrad Nering. 2024. "Evaluating the Impact of Sample Irregularities on the Dynamic Stiffness of Polyurethane: Insights from Experimental and FEM Analysis" Materials 17, no. 23: 5910. https://doi.org/10.3390/ma17235910
APA StyleNering, K., Kwiecień, A., & Nering, K. (2024). Evaluating the Impact of Sample Irregularities on the Dynamic Stiffness of Polyurethane: Insights from Experimental and FEM Analysis. Materials, 17(23), 5910. https://doi.org/10.3390/ma17235910