
Effect of Calcination Temperature and Time on the Synthesis of Iron Oxide Nanoparticles: Green vs. Chemical Method

 , ,
, ,  and
and 
Abstract

1. Introduction
2. Materials and Methodology
2.1. Materials
2.2. Nanoparticle Synthesis
2.3. Nanoparticle Characterization
2.3.1. X-ray Diffraction (XRD)
2.3.2. Fourier Transform Infrared Spectroscopy (FTIR)
2.3.3. Scanning Electron Microscopy (SEM)
2.3.4. Transmission Electron Microscopy (TEM)
2.4. Functional Properties
2.4.1. Antioxidant Activity
2.4.2. Antimicrobial Activity
2.5. Statistical Analysis
3. Results and Discussion
3.1. Nanoparticle Characterization
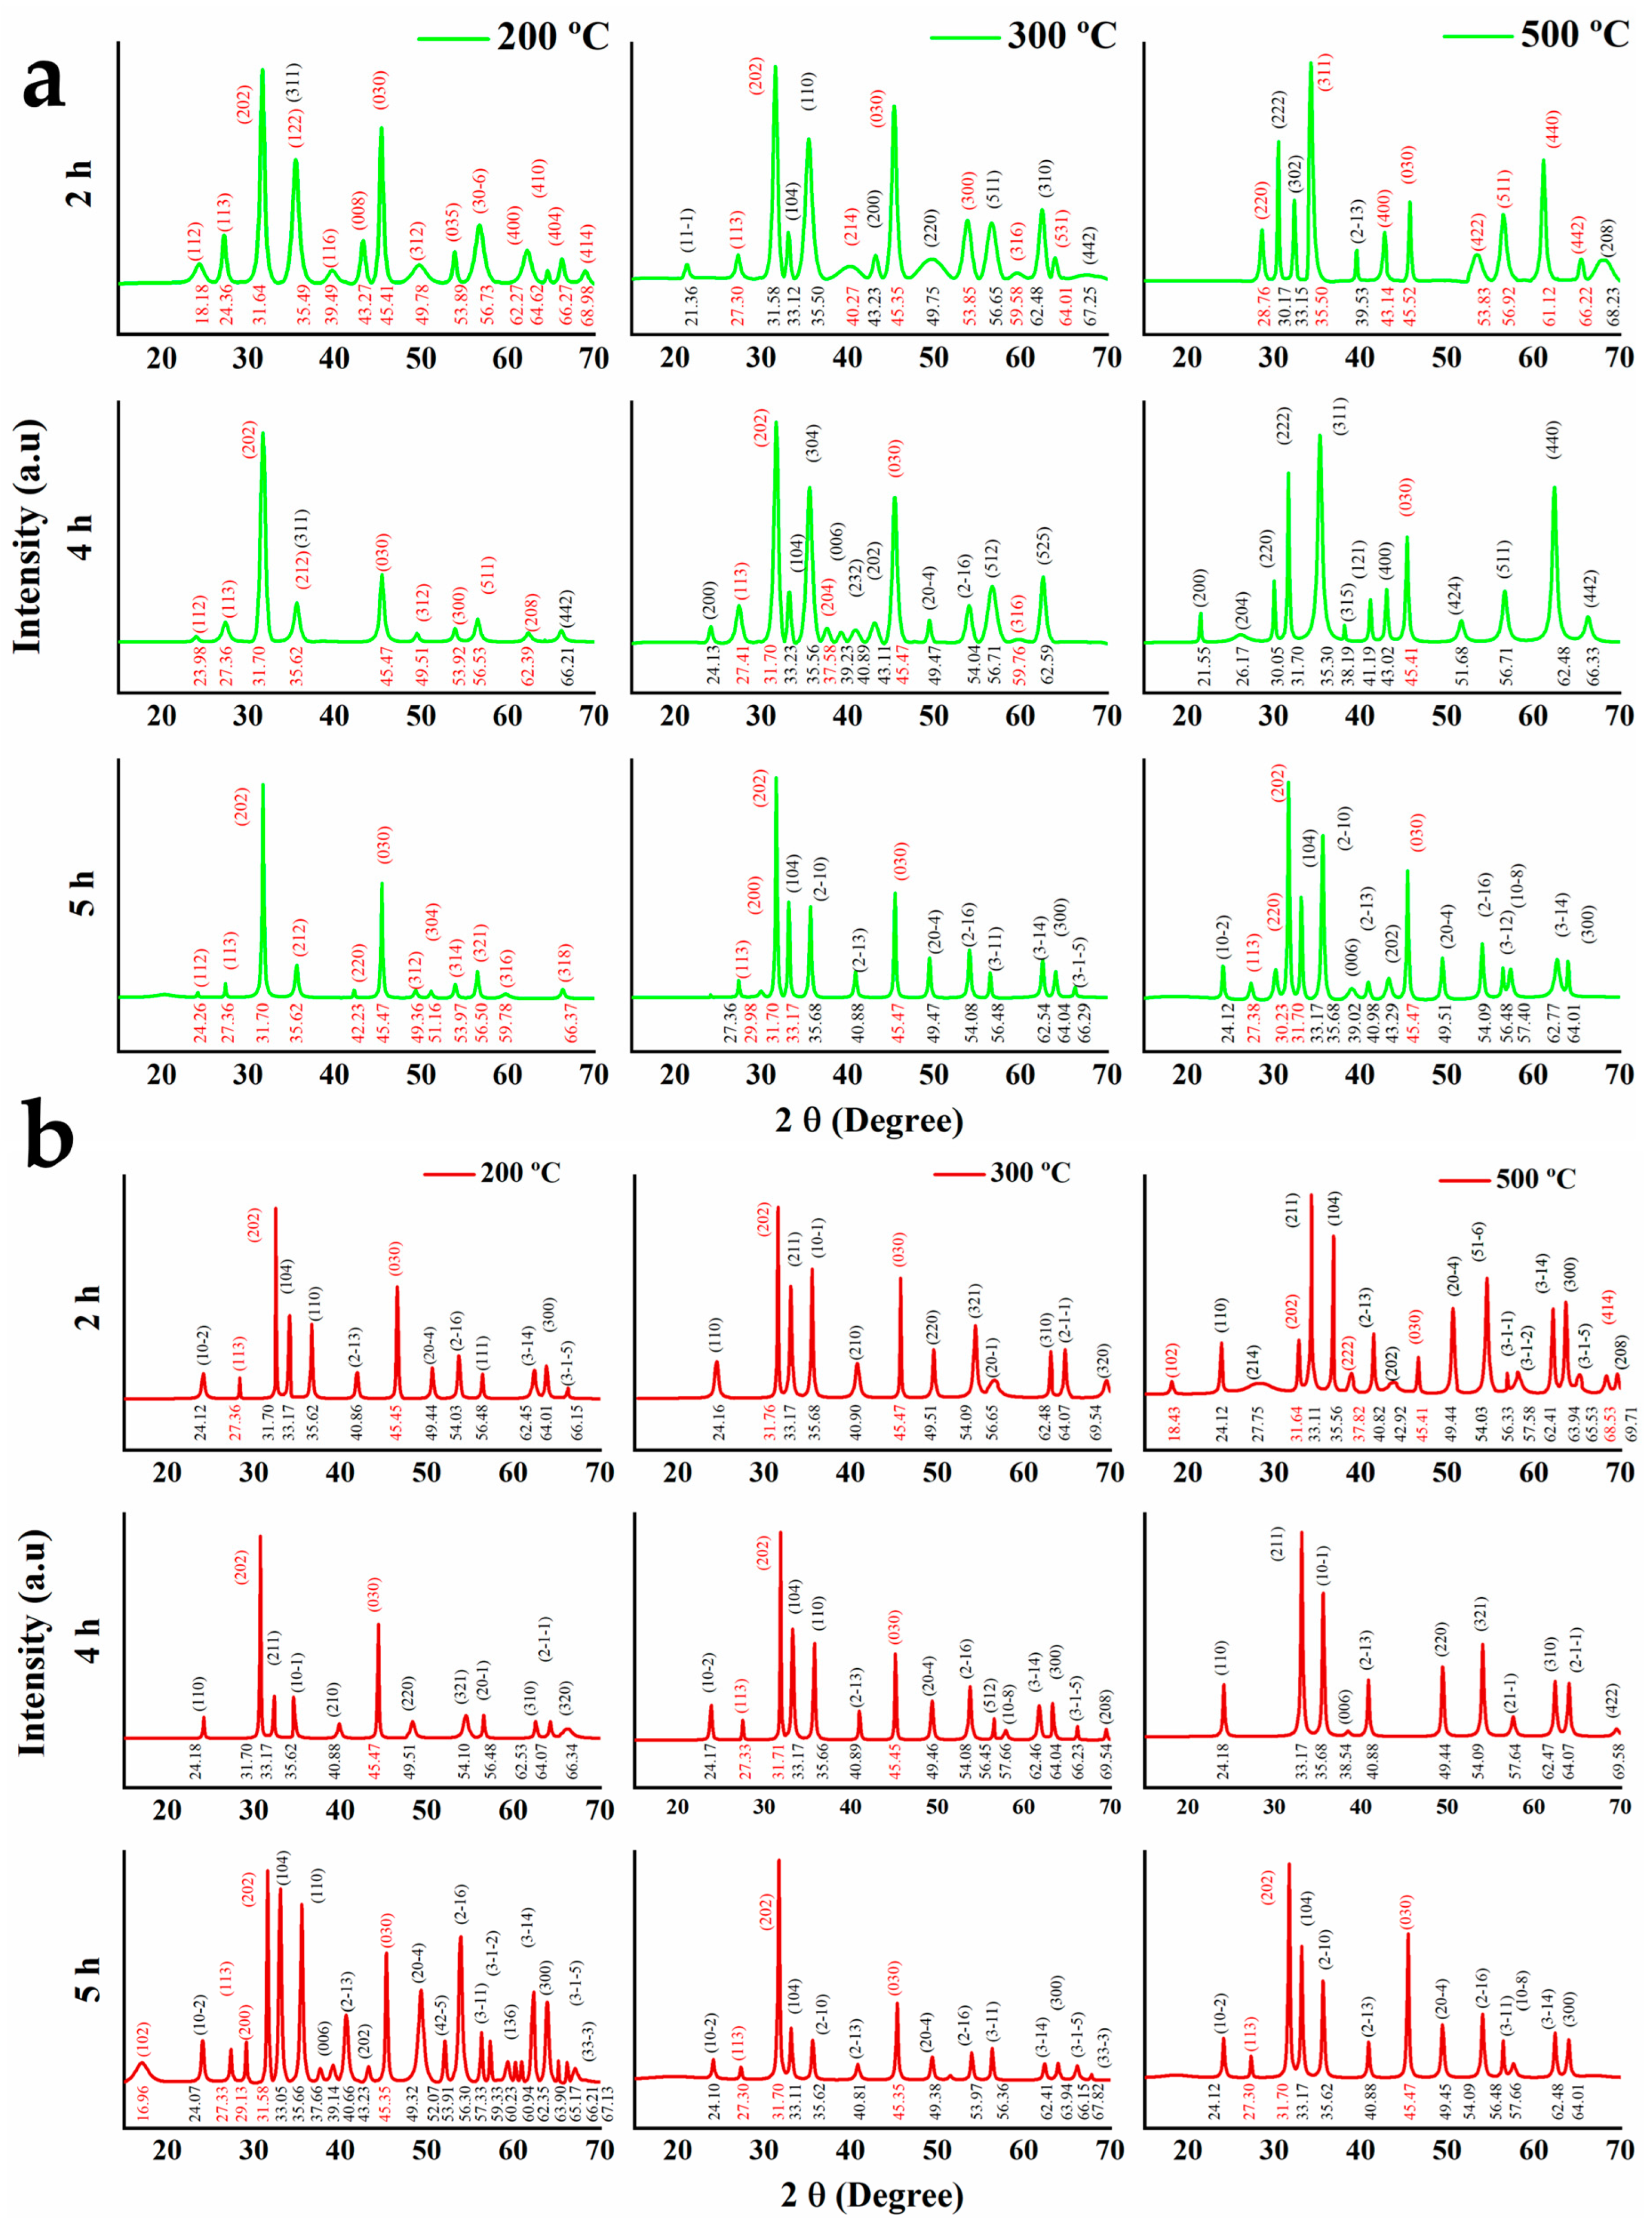
3.1.1. XRD
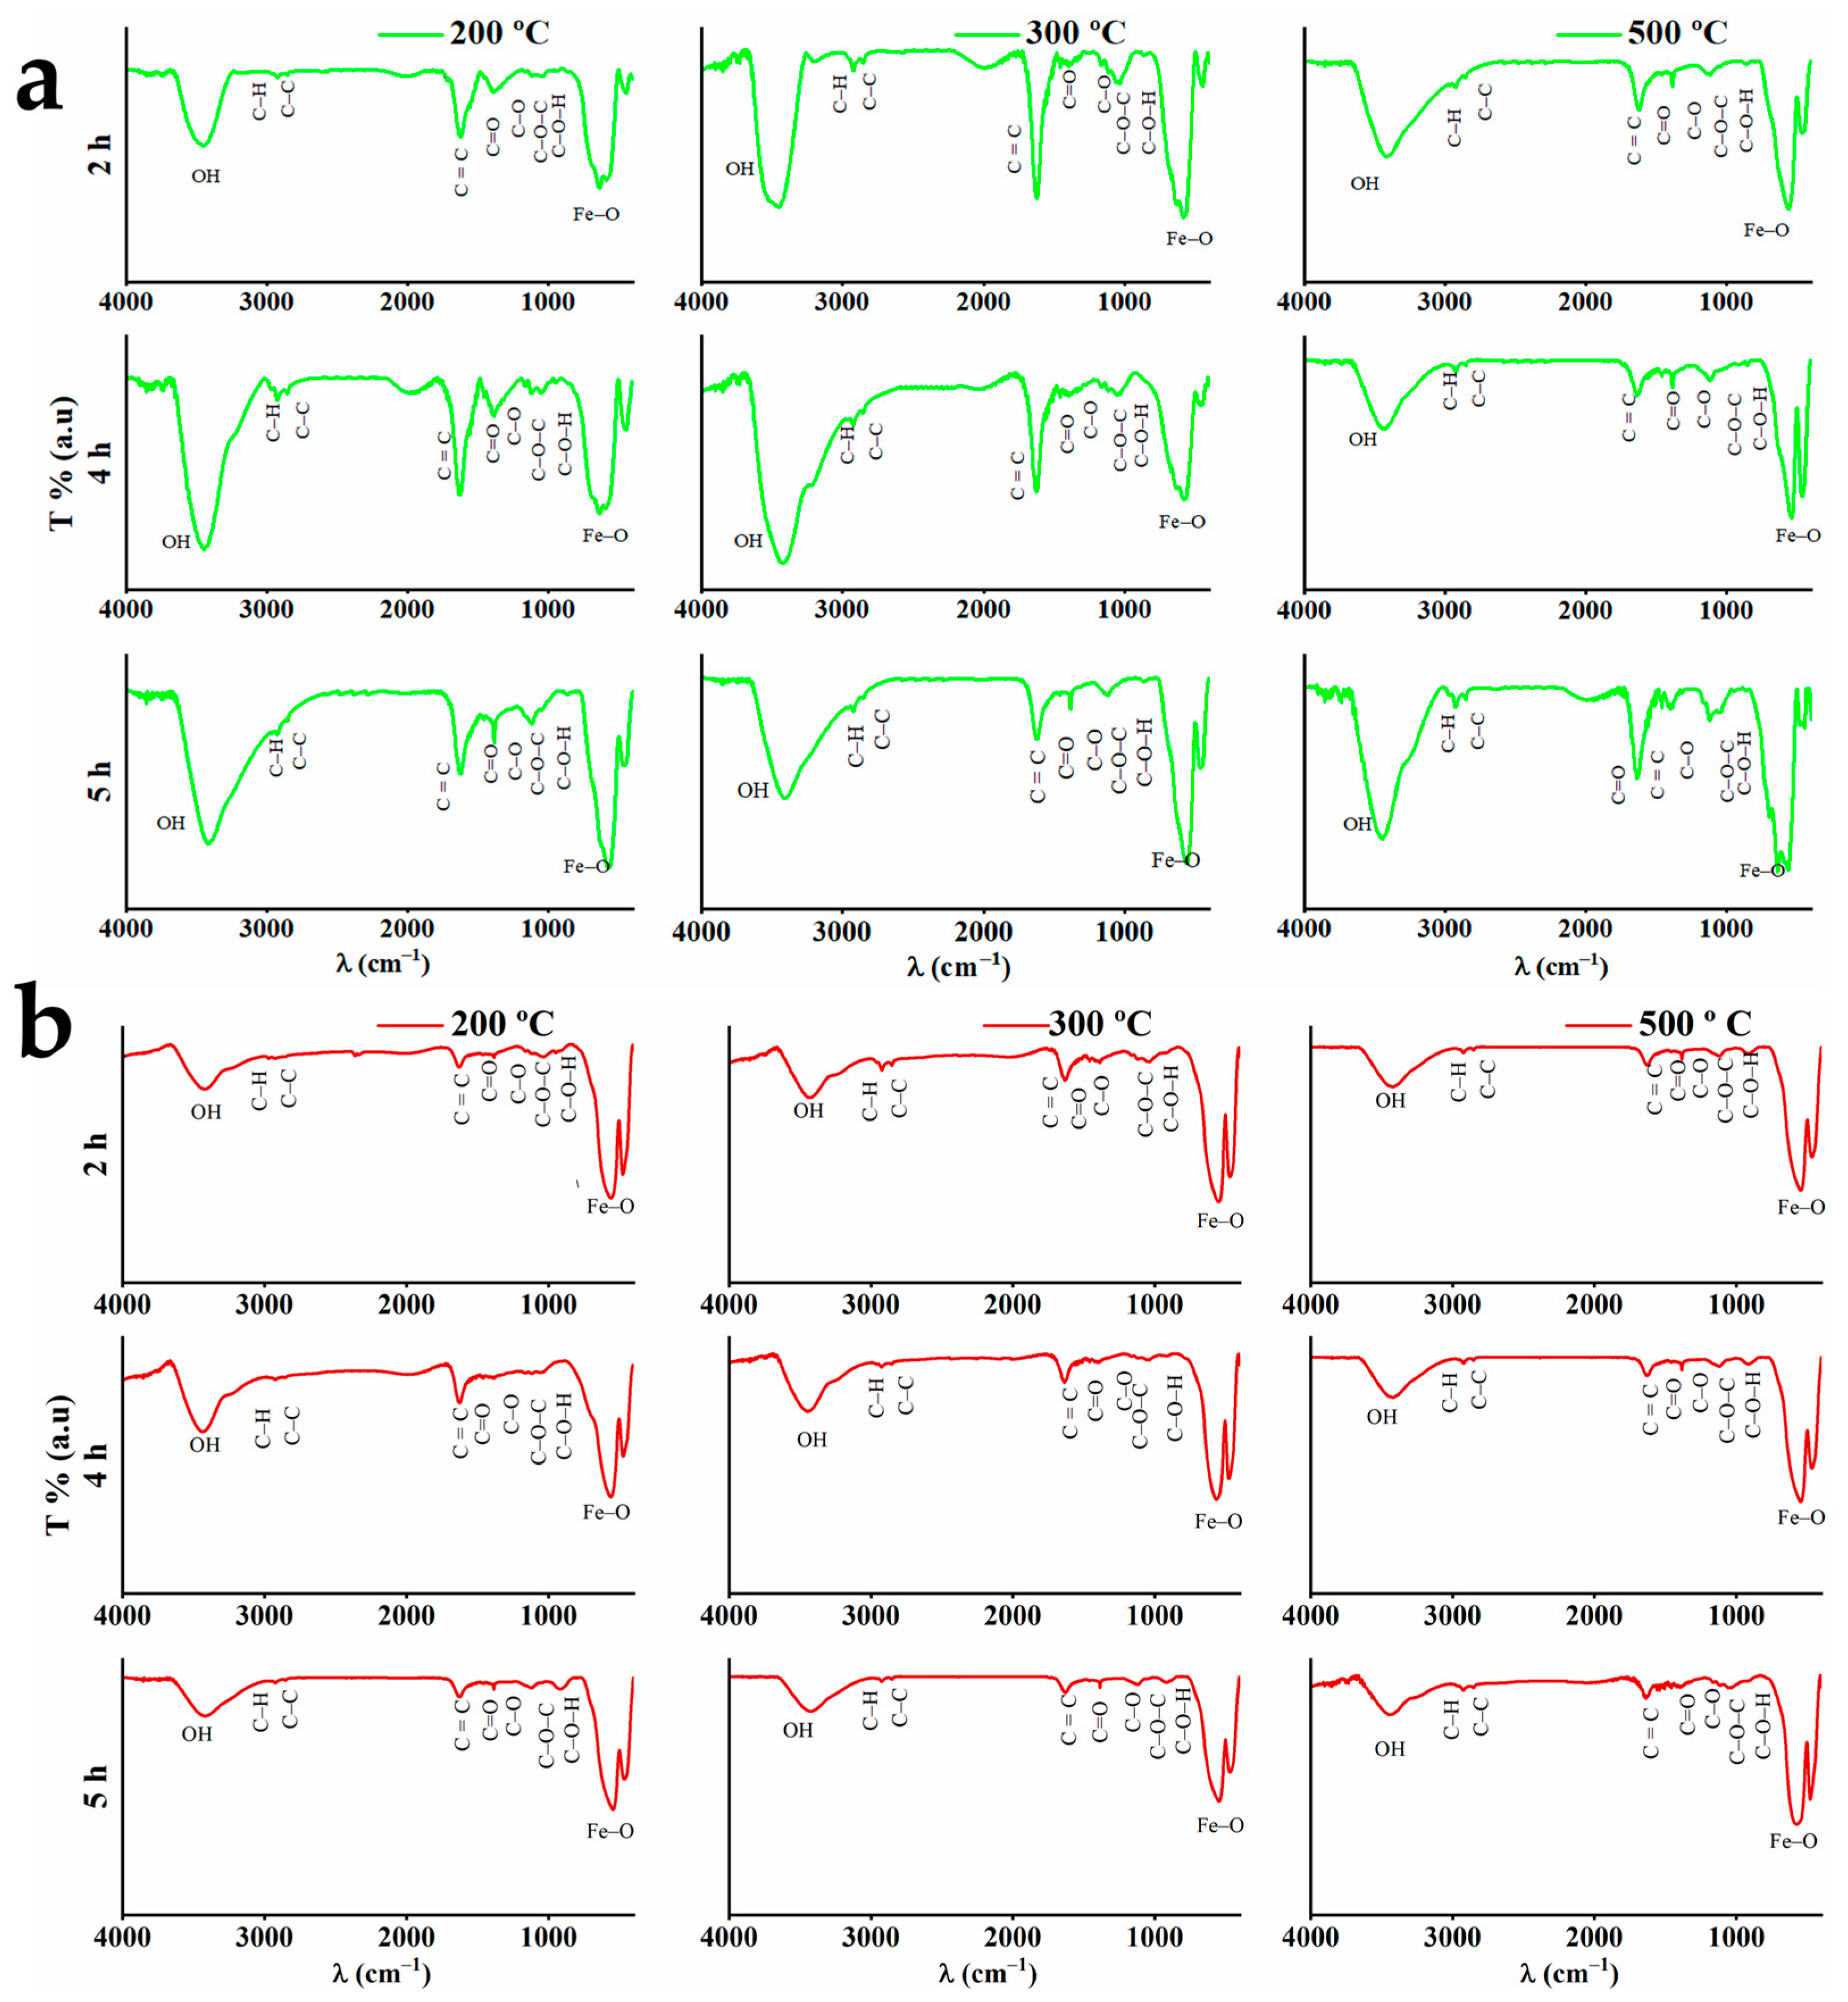
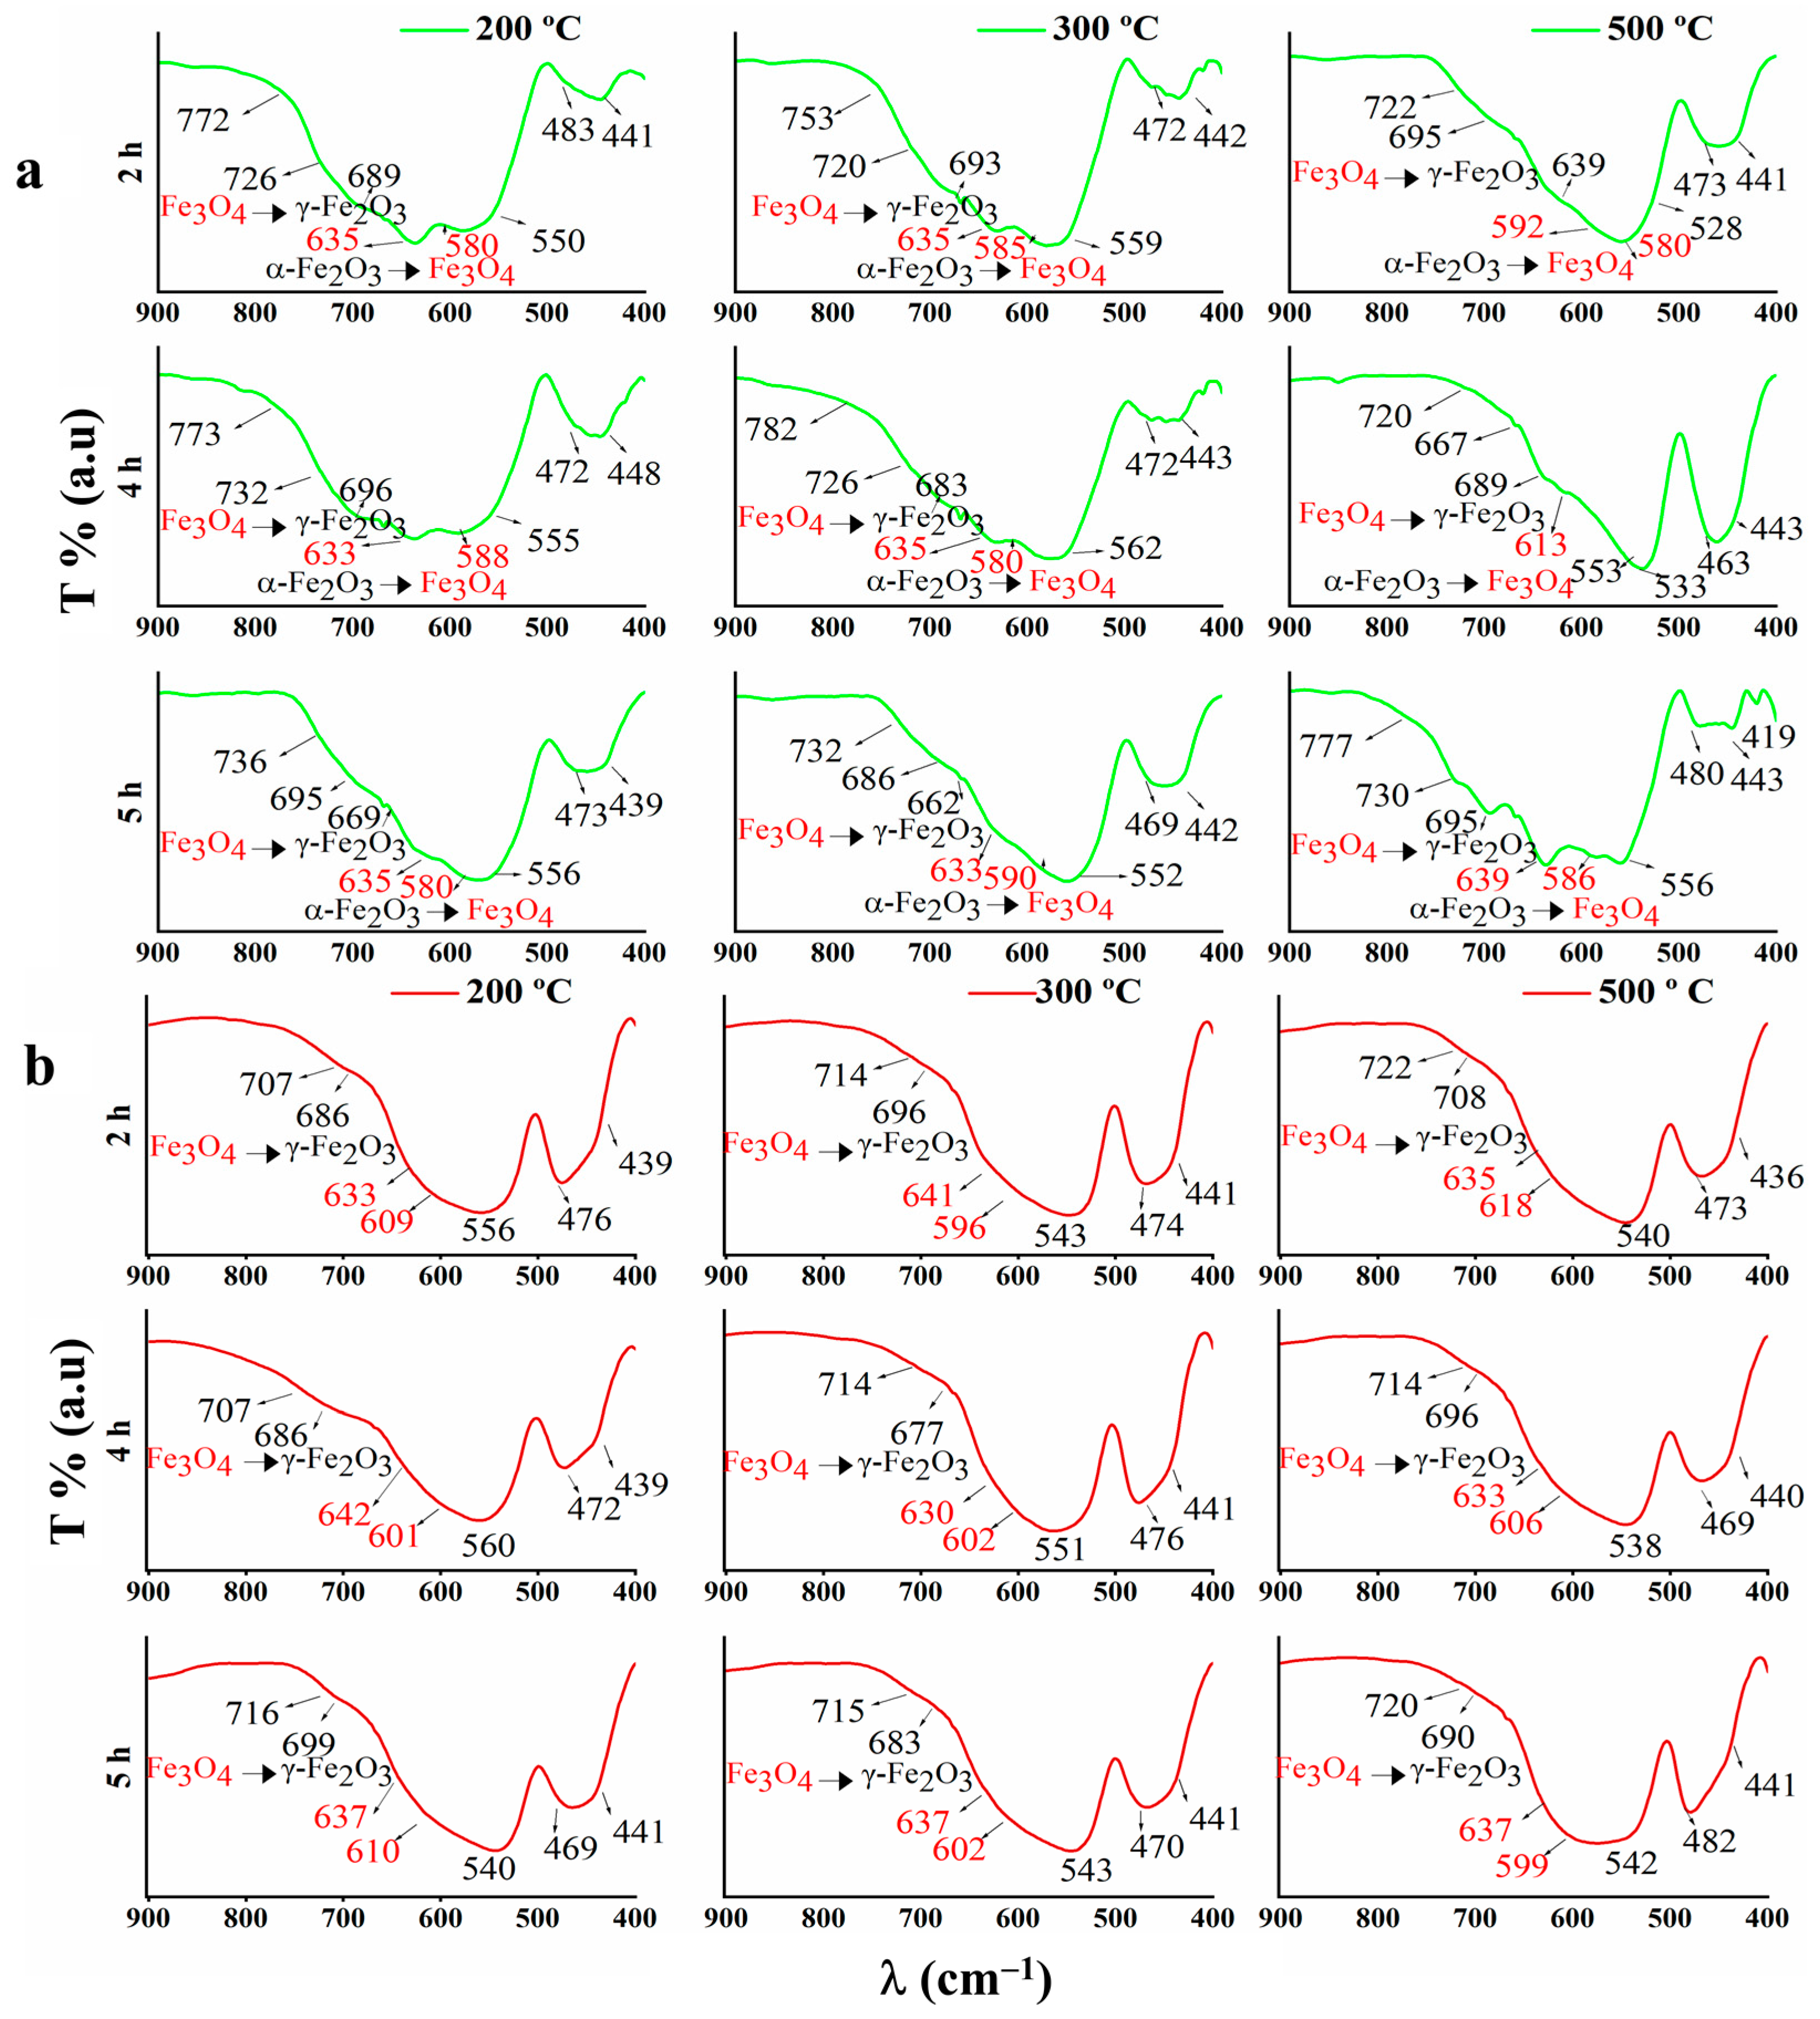
3.1.2. FTIR
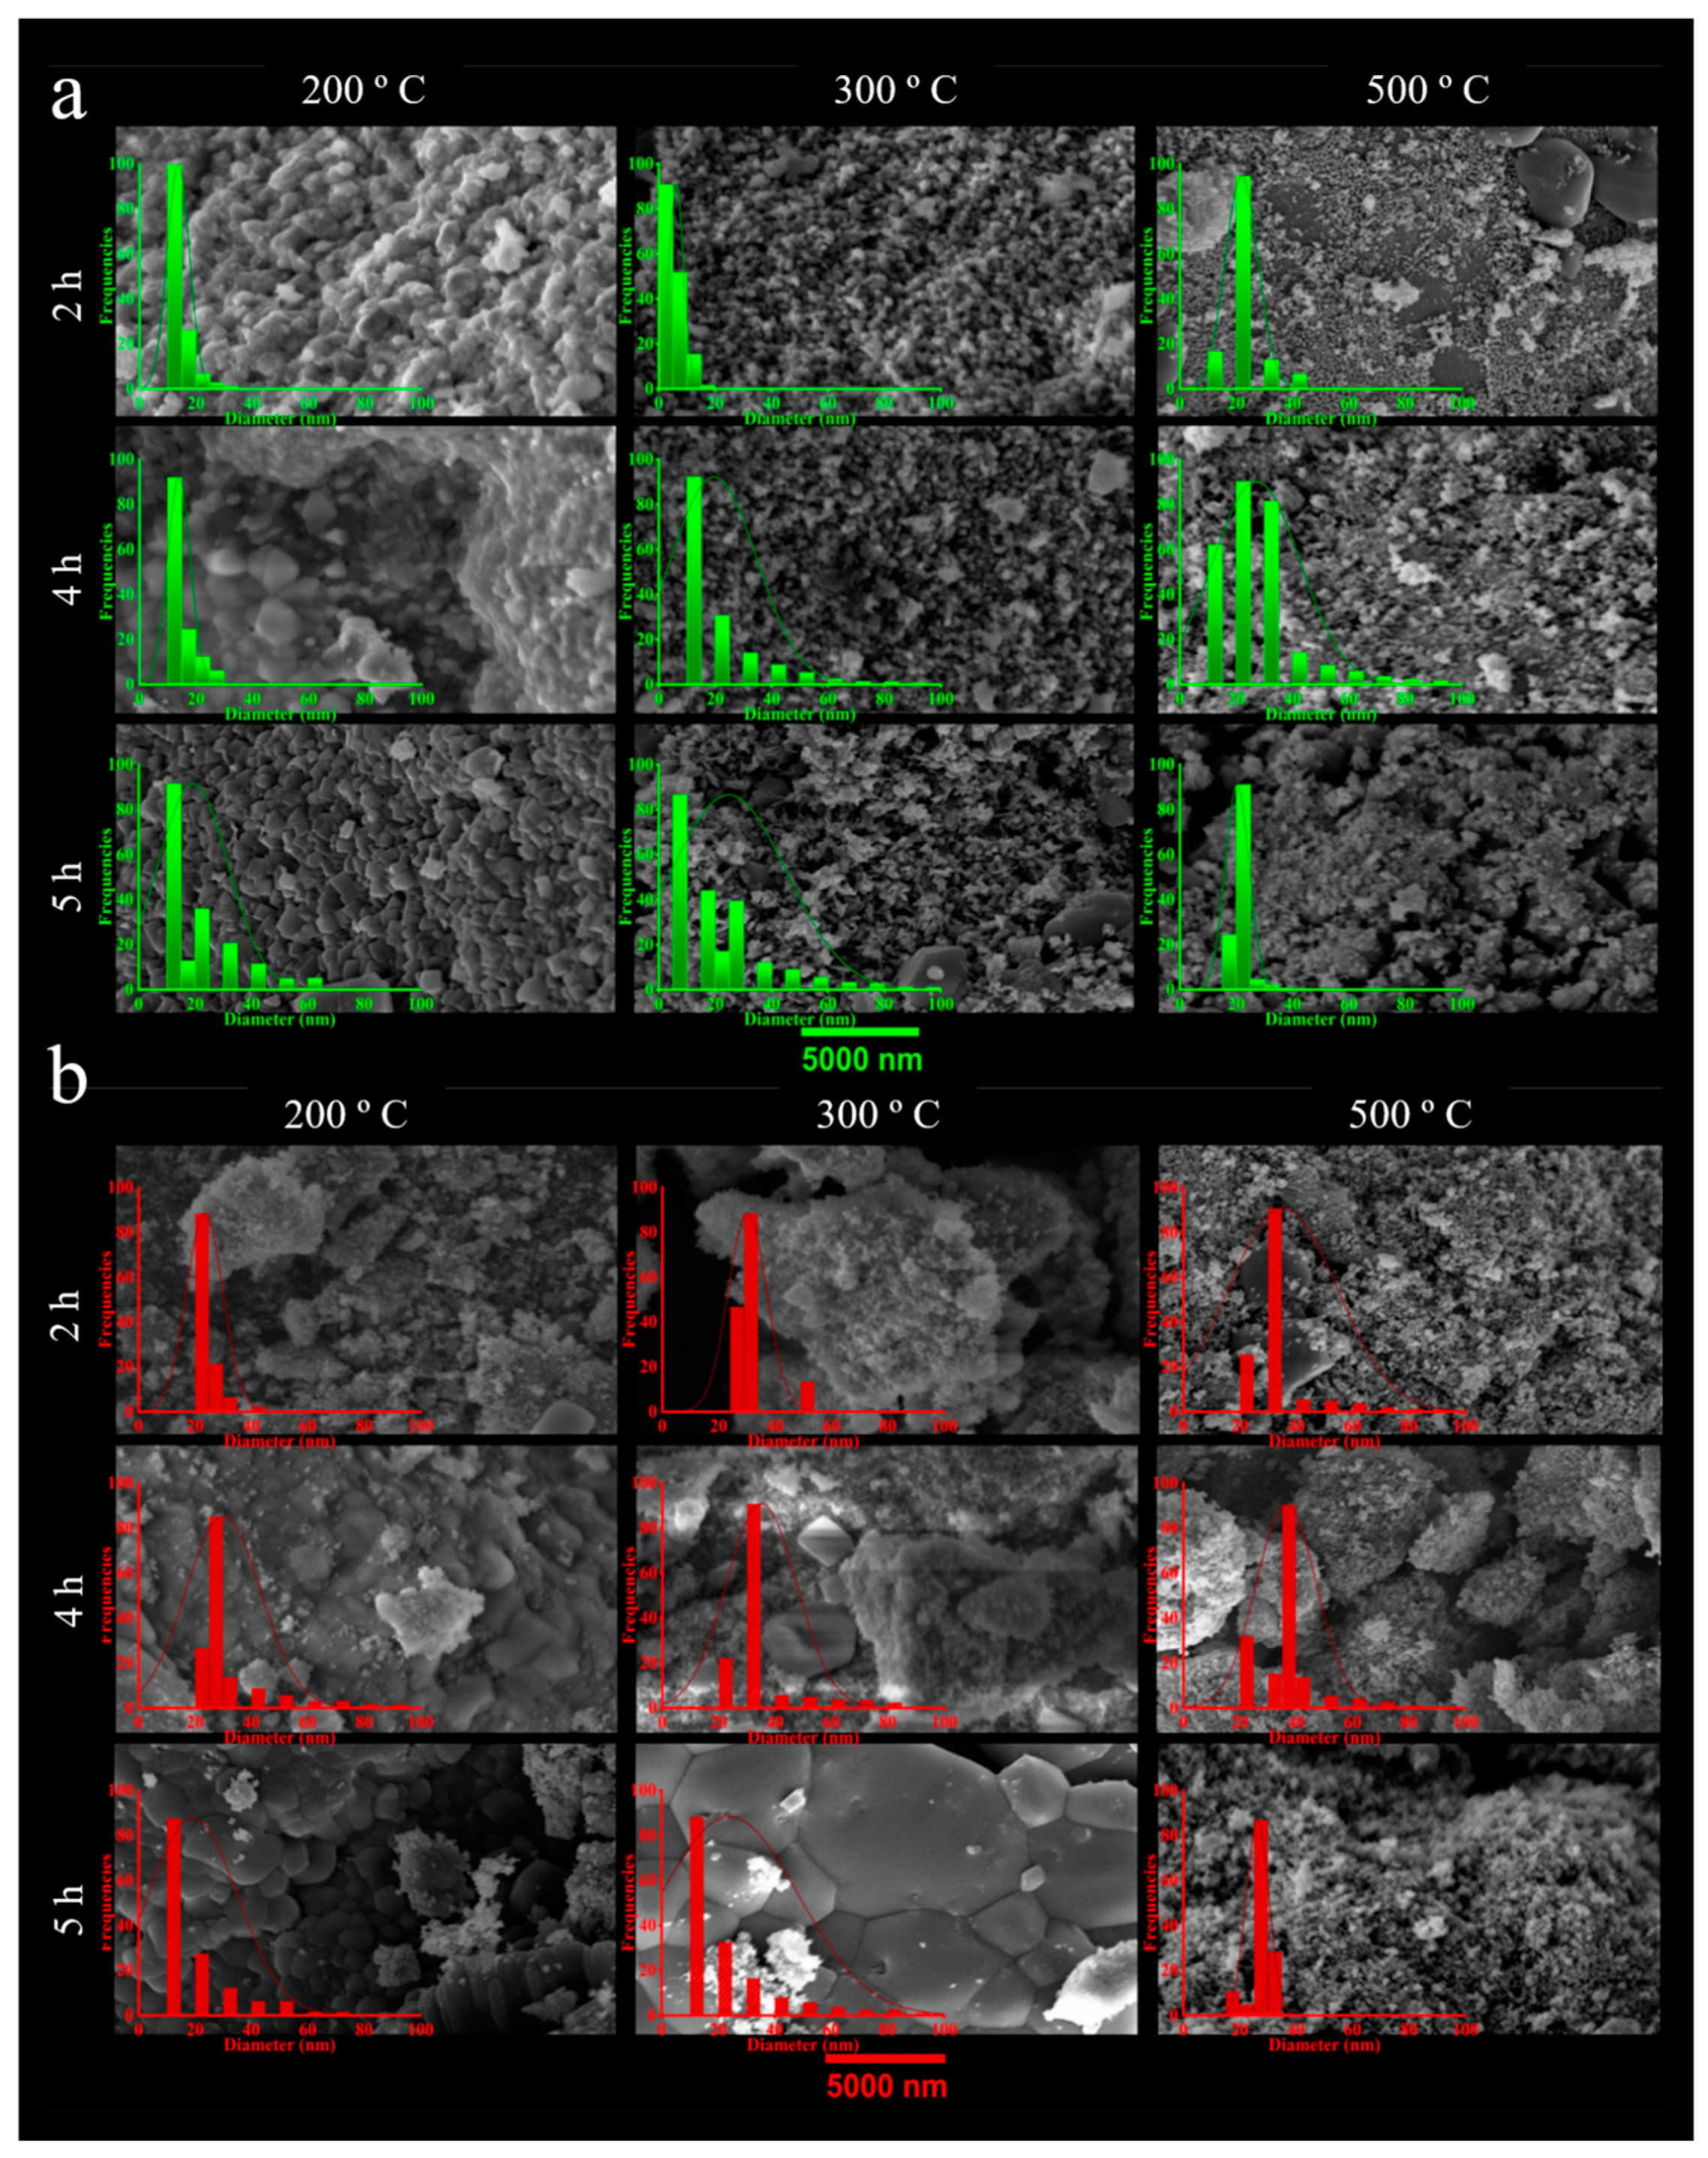
3.1.3. SEM
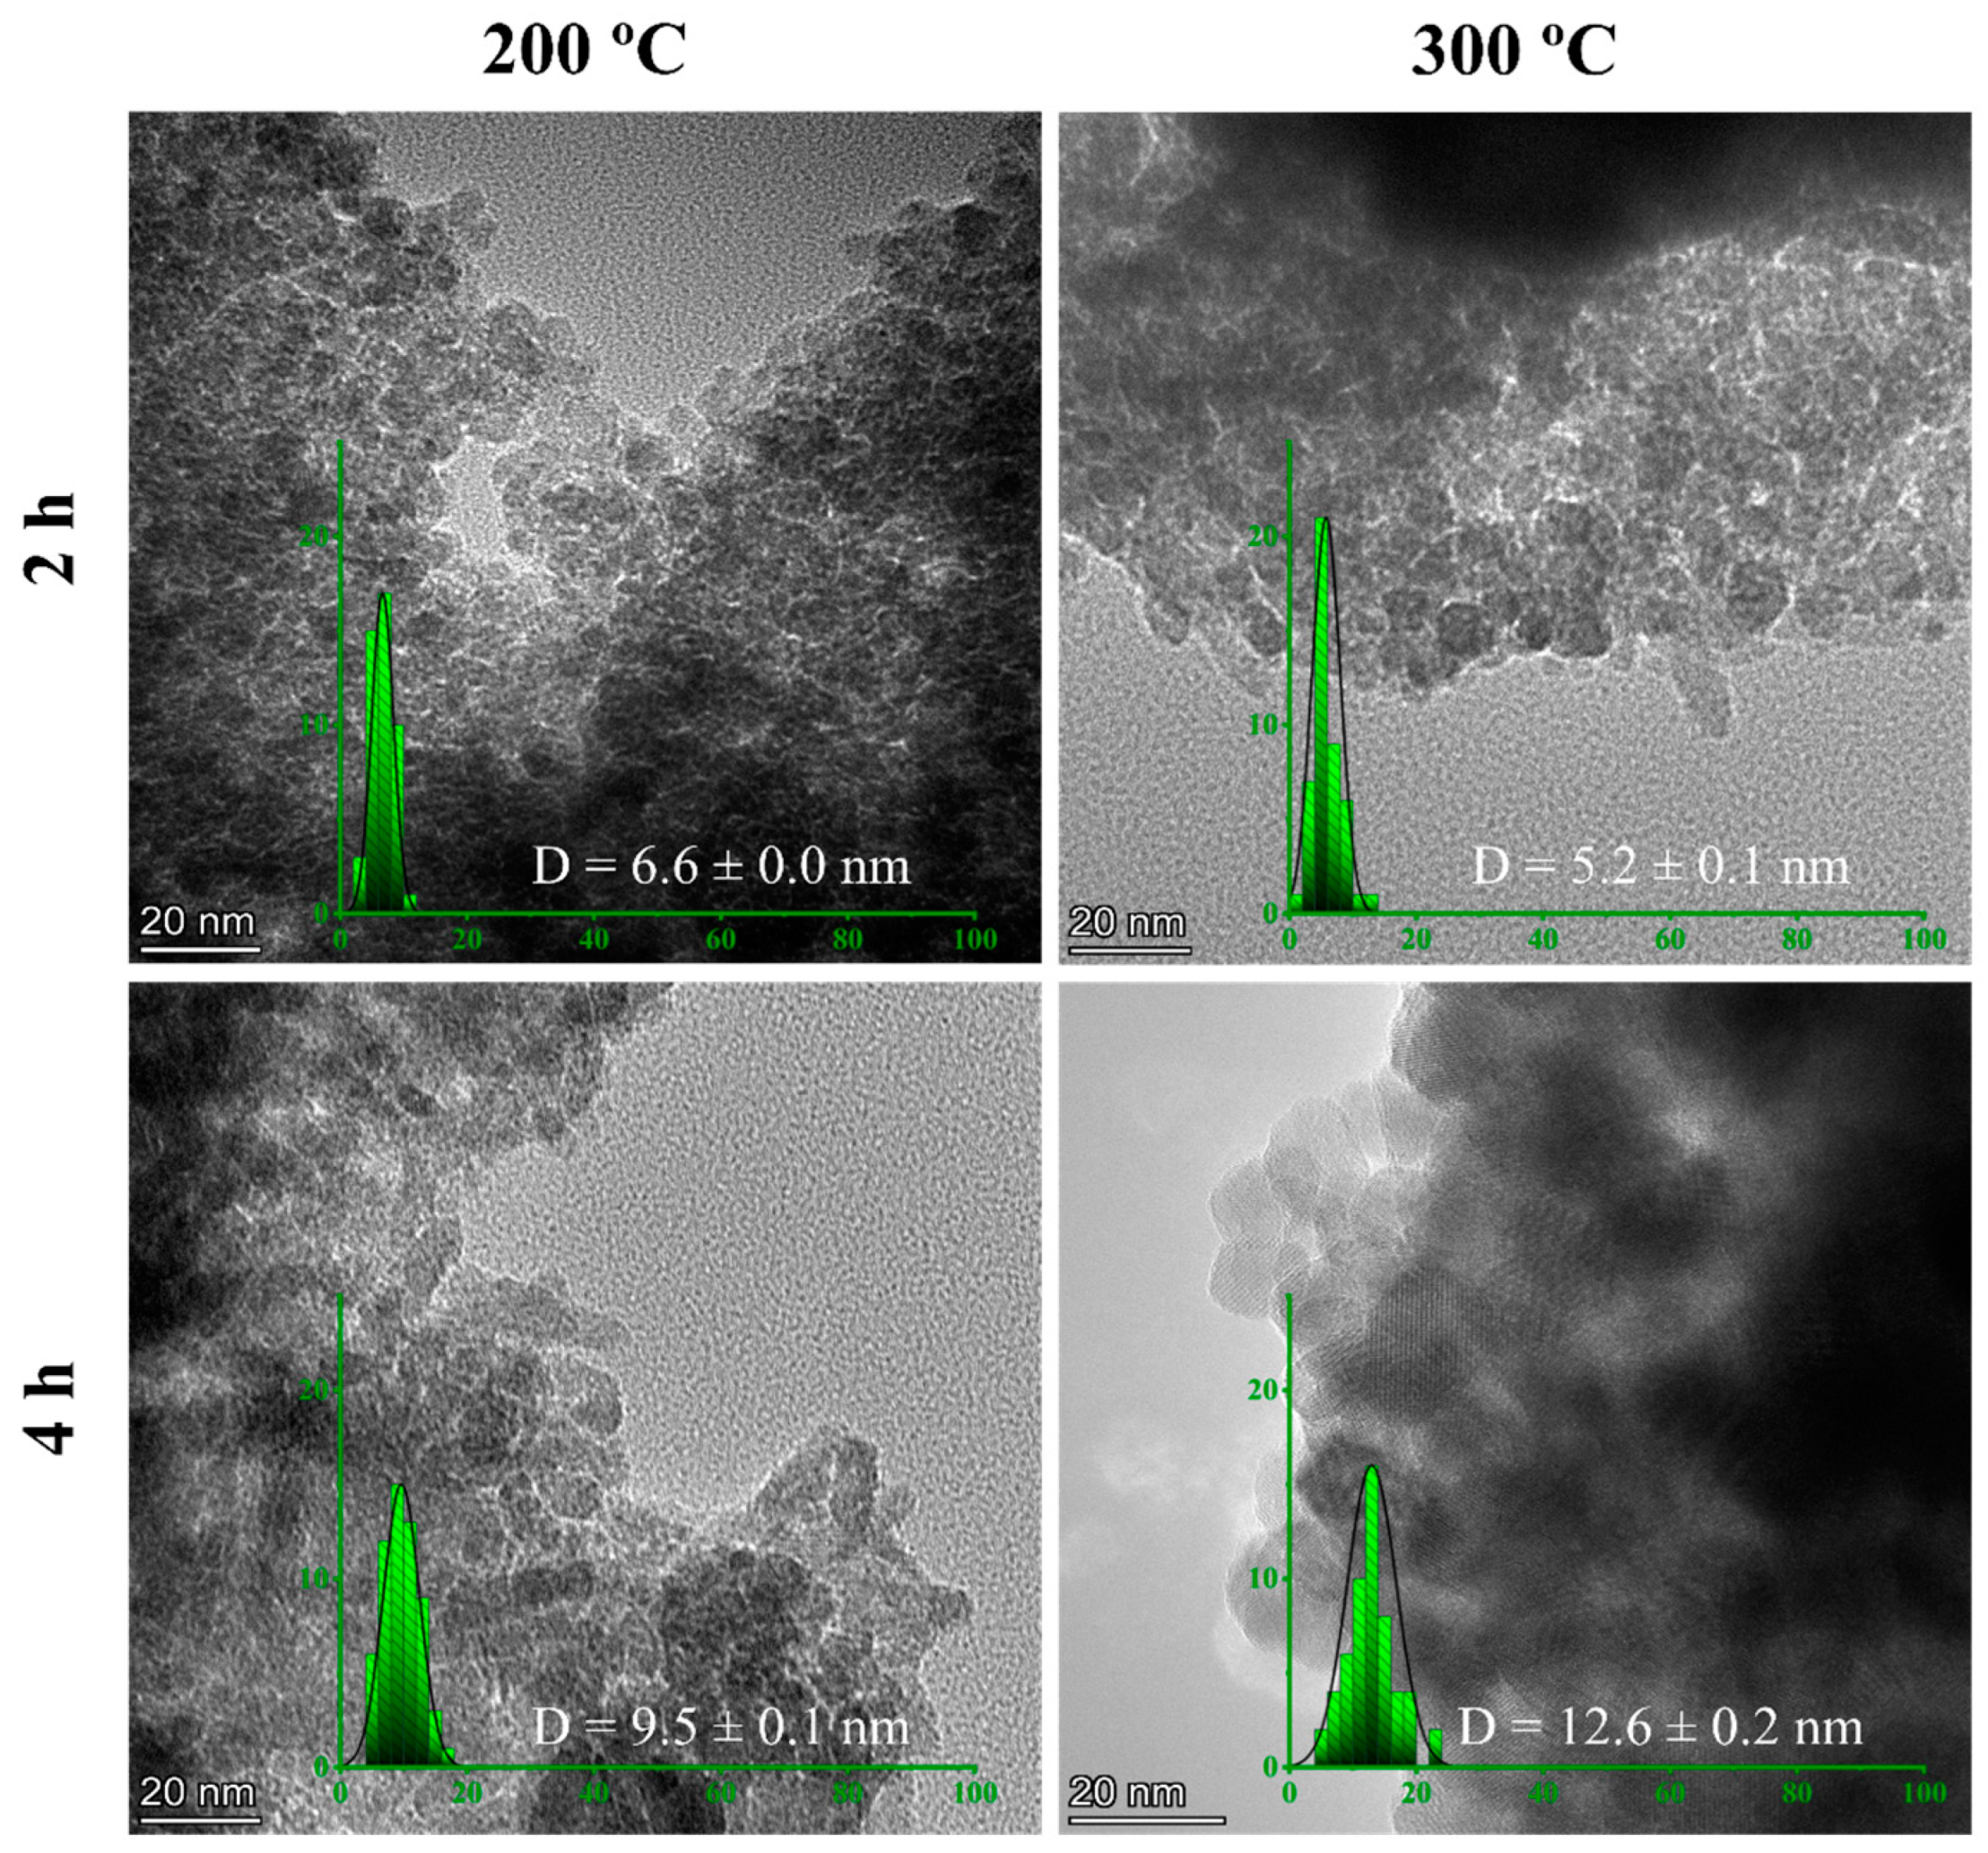
3.1.4. TEM
3.2. Functional Properties
3.2.1. Antioxidant Activity
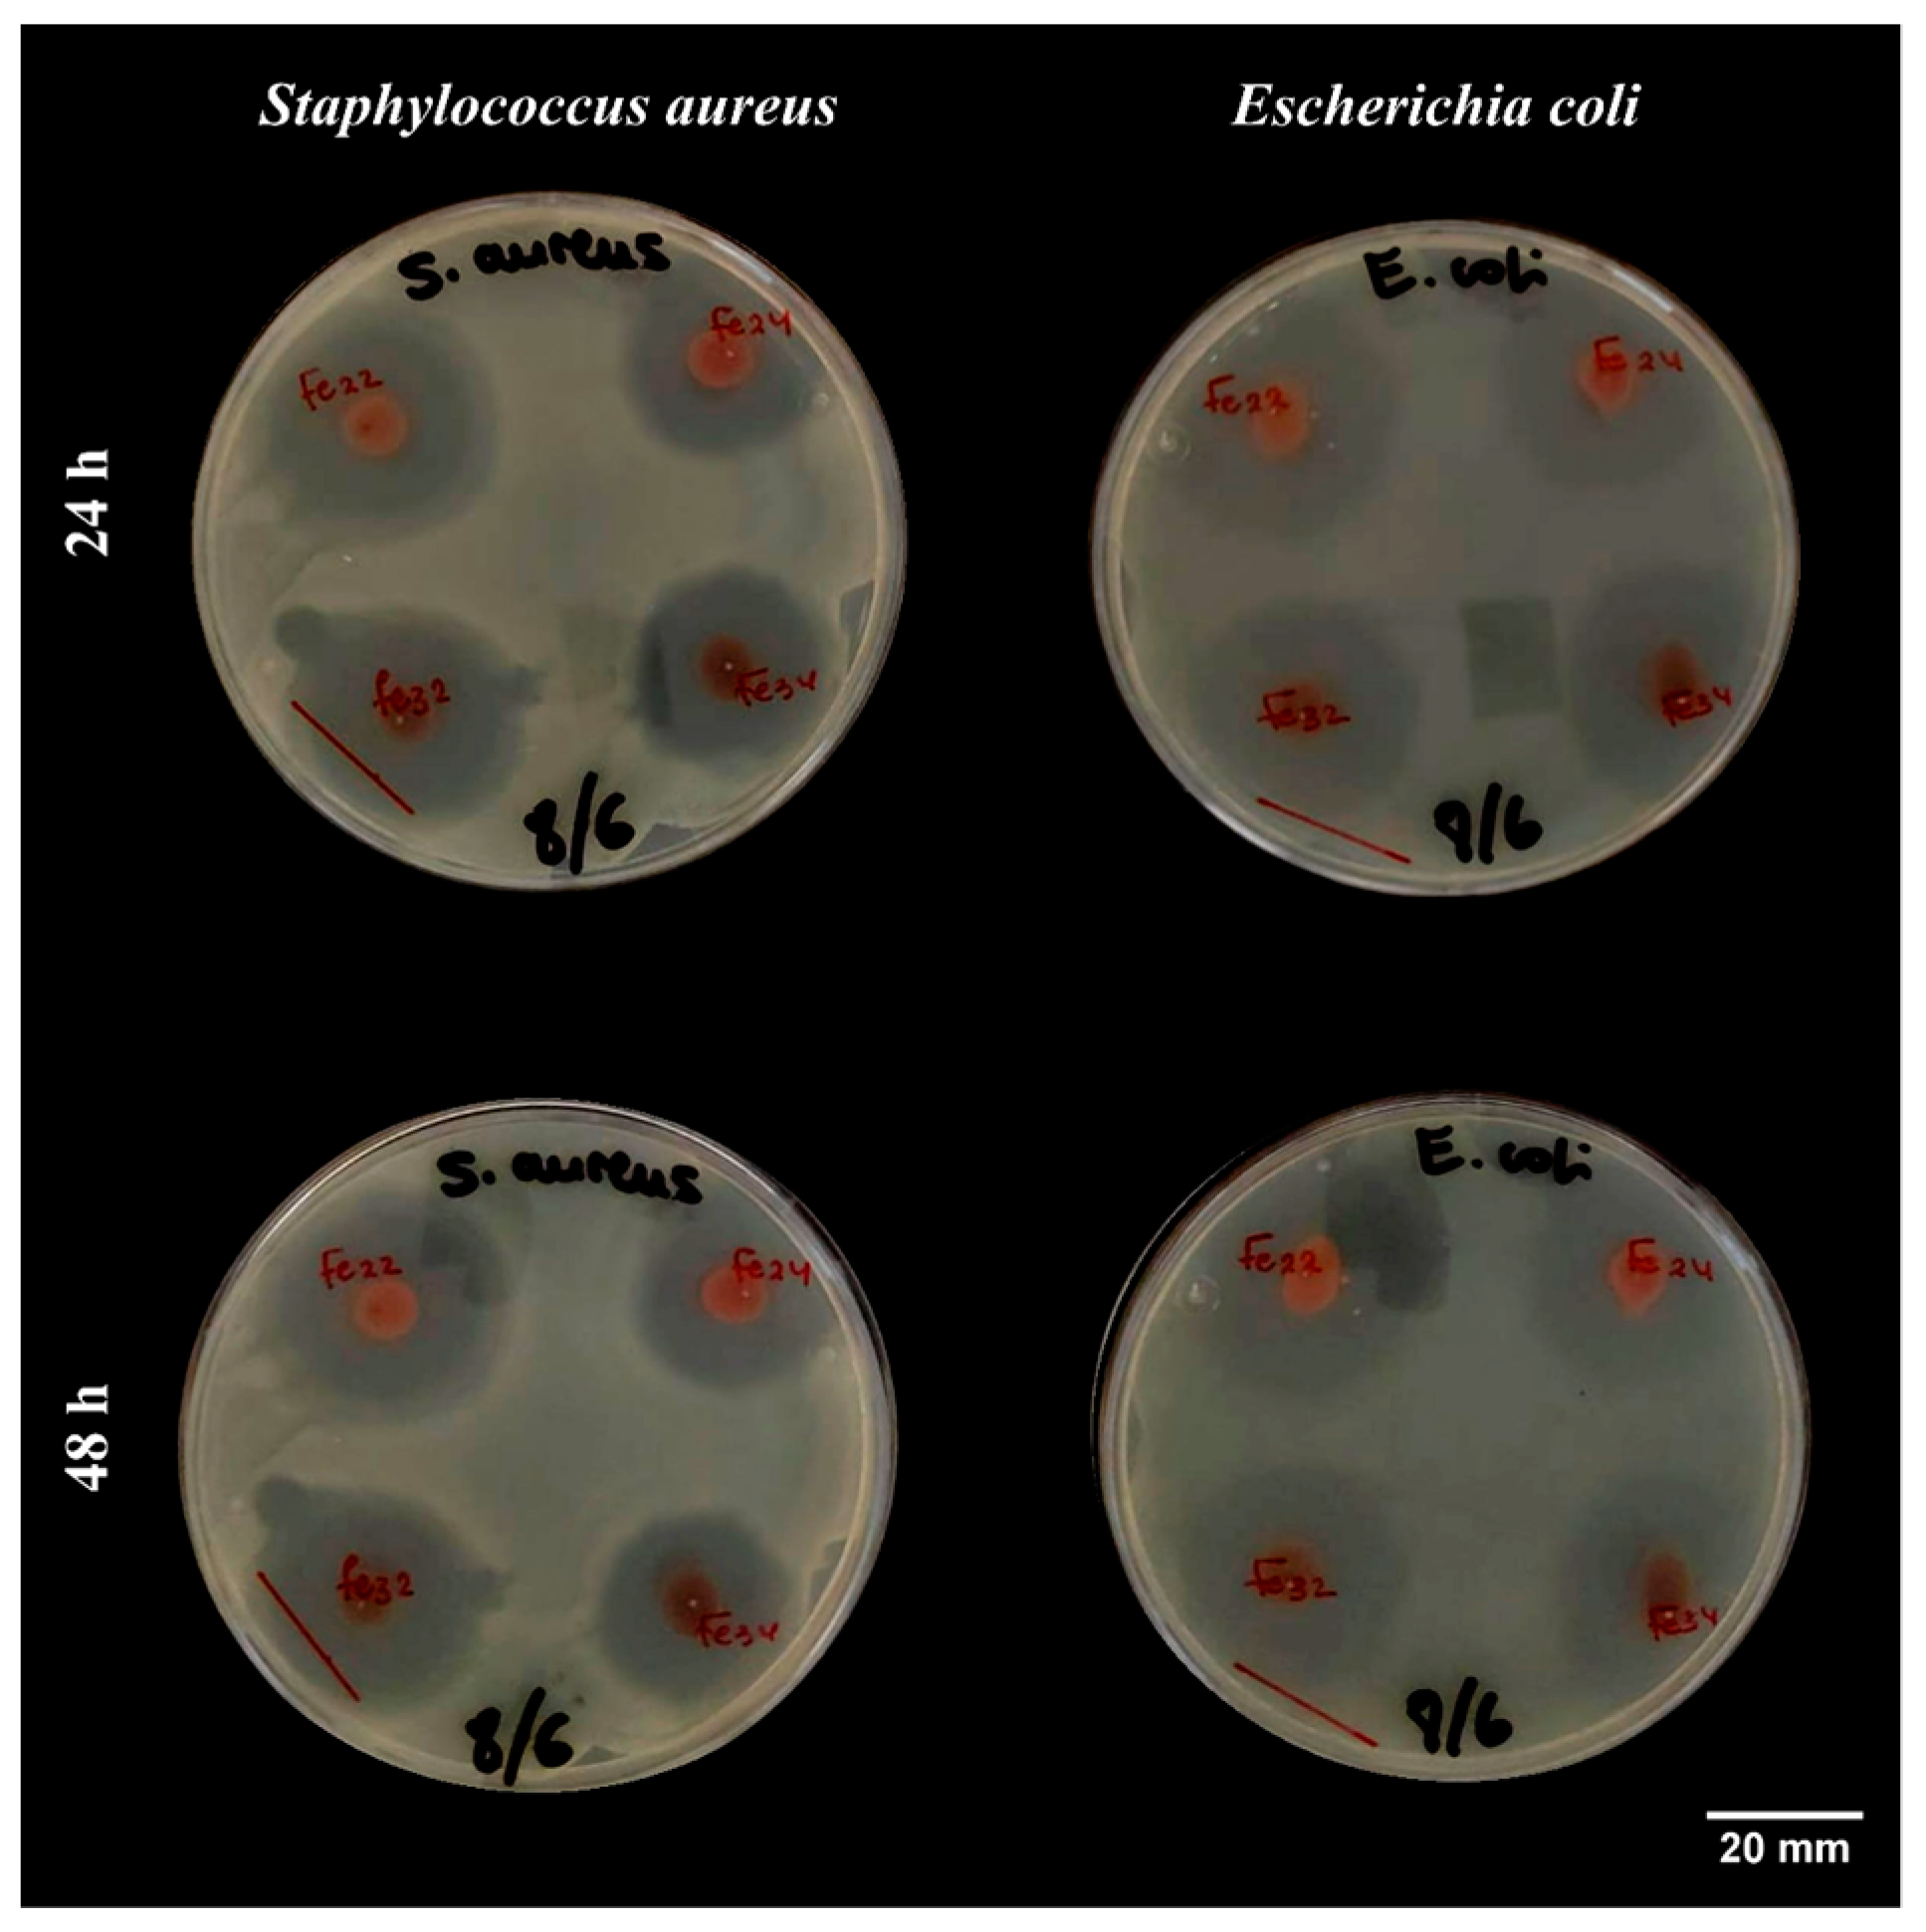
3.2.2. Antimicrobial Activity
4. Conclusions
Author Contributions
Funding
Institutional Review Board Statement
Informed Consent Statement
Data Availability Statement
Acknowledgments
Conflicts of Interest
References
- Wang, T.; Jin, X.; Chen, Z.; Megharaj, M.; Naidu, R. Science of the Total Environment Green synthesis of Fe nanoparticles using eucalyptus leaf extracts for treatment of eutrophic wastewater. Sci. Total Environ. 2014, 466–467, 210–213. [Google Scholar] [CrossRef]
- Zikalala, N.; Matshetshe, K.; Parani, S.; Oluwafemi, O.S. Biosynthesis protocols for colloidal metal oxide nanoparticles. Nano-Struct. Nano-Objects 2018, 16, 288–299. [Google Scholar] [CrossRef]
- Akhtar, M.S.; Panwar, J.; Yun, Y.S. Biogenic synthesis of metallic nanoparticles by plant extracts. ACS Sustain. Chem. Eng. 2013, 1, 591–602. [Google Scholar] [CrossRef]
- Makarov, V.V.; Love, A.J.; Sinitsyna, O.V.; Makarova, S.S.; Yaminsky, I.V.; Taliansky, M.E.; Kalinina, N.O. “Green” Nanotechnologies: Synthesis of Metal Nanoparticles Using Plants. Acta Nat. 2014, 6, 35–44. [Google Scholar] [CrossRef]
- Singh, J.; Dutta, T.; Kim, K.-H.; Rawat, M.; Samddar, P.; Kumar, P. ‘Green’ synthesis of metals and their oxide nanoparticles: Applications for environmental remediation. J. Nanobiotechnology 2018, 16, 84. [Google Scholar] [CrossRef]
- Basavegowda, N.; Somai Magar, K.B.; Mishra, K.; Lee, Y.R. Green fabrication of ferromagnetic Fe3O4 nanoparticles and their novel catalytic applications for the synthesis of biologically interesting benzoxazinone and benzthioxazinone derivatives. New J. Chem. 2014, 38, 5415–5420. [Google Scholar] [CrossRef]
- Wu, W.; Wu, Z.; Yu, T.; Jiang, C.; Kim, W.S.; Wu, W.; Wu, Z.; Yu, T.; Jiang, C. Recent progress on magnetic iron oxide nanoparticles: Synthesis, surface functional strategies and biomedical applications. Sci. Technol. Adv. Mater. 2015, 16, 23501. [Google Scholar] [CrossRef]
- Ali, A.; Zafar, H.; Zia, M.; ul Haq, I.; Phull, A.R.; Ali, J.S.; Hussain, A. Synthesis, characterization, applications, and challenges of iron oxide nanoparticles. Nanotechnol. Sci. Appl. 2016, 9, 49–67. [Google Scholar] [CrossRef]
- Ghodake, G.S.; Deshpande, N.G.; Lee, Y.P.; Jin, E.S. Pear fruit extract-assisted room-temperature biosynthesis of gold nanoplates. Colloids Surfaces B Biointerfaces 2010, 75, 584–589. [Google Scholar] [CrossRef]
- Sanghi, R.; Verma, P. Biomimetic synthesis and characterisation of protein capped silver nanoparticles. Bioresour. Technol. 2009, 100, 501–504. [Google Scholar] [CrossRef]
- Zayed, M.F.; Eisa, W.H. Phoenix dactylifera L. leaf extract phytosynthesized gold nanoparticles; controlled synthesis and catalytic activity. Spectrochim. Acta Part A Mol. Biomol. Spectrosc. 2014, 121, 238–244. [Google Scholar] [CrossRef]
- Toropov, N.; Vartanyan, T. Noble Metal Nanoparticles: Synthesis and Optical Properties. In Comprehensive Nanoscience and Nanotechnology; Elsevier: Amsterdam, The Netherlands, 2019; pp. 61–88. [Google Scholar] [CrossRef]
- Markova, Z.; Novak, P.; Kaslik, J.; Plachtova, P.; Brazdova, M.; Jancula, D.; Siskova, K.M.; Machala, L.; Marsalek, B.; Zboril, R.; et al. Iron(II,III)-polyphenol complex nanoparticles derived from green tea with remarkable ecotoxicological impact. ACS Sustain. Chem. Eng. 2014, 2, 1674–1680. [Google Scholar] [CrossRef]
- Nakbanpote, W.; Ruttanakorn, M.; Sukadeetad, K.; Sakkayawong, N.; Damrianant, S. Effects of drying and extraction methods on phenolic compounds and in vitro assays of Eclipta prostrata Linn leaf extracts. ScienceAsia 2019, 45, 127–137. [Google Scholar] [CrossRef]
- Karam, M.C.; Petit, J.; Zimmer, D.; Baudelaire Djantou, E.; Scher, J. Effects of drying and grinding in production of fruit and vegetable powders: A review. J. Food Eng. 2016, 188, 32–49. [Google Scholar] [CrossRef]
- Noruzi, M.; Zare, D.; Khoshnevisan, K.; Davoodi, D. Rapid green synthesis of gold nanoparticles using Rosa hybrida petal extract at room temperature. Spectrochim. Acta Part A Mol. Biomol. Spectrosc. 2011, 79, 1461–1465. [Google Scholar] [CrossRef]
- Shreyash, N.; Bajpai, S.; Khan, M.A.; Vijay, Y.; Tiwary, S.K.; Sonker, M. Green Synthesis of Nanoparticles and Their Biomedical Applications: A Review. ACS Appl. Nano Mater. 2021, 4, 11428–11457. [Google Scholar] [CrossRef]
- Mornani, E.G.; Mosayebian, P.; Dorranian, D.; Behzad, K. Effect of calcination temperature on the size and optical properties of synthesized ZnO nanoparticles. J. Ovonic Res. 2016, 12, 75–80. [Google Scholar]
- Parra, M.R.; Haque, F.Z. Aqueous chemical route synthesis and the effect of calcination temperature on the structural and optical properties of ZnO nanoparticles. J. Mater. Res. Technol. 2014, 3, 363–369. [Google Scholar] [CrossRef]
- Bhebhe, M.; Füller, T.N.; Chipurura, B.; Muchuweti, M. Effect of Solvent Type on Total Phenolic Content and Free Radical Scavenging Activity of Black Tea and Herbal Infusions. Food Anal. Methods 2016, 9, 1060–1067. [Google Scholar] [CrossRef]
- Junaid, M.; Dowlath, H.; Anjum, S.; Khalith, S.B.M.; Varjani, S.; Kumar, S.; Munuswamy, G.; Woong, S.; Jin, W.; Ravindran, B. Comparison of characteristics and biocompatibility of green synthesized iron oxide nanoparticles with chemical synthesized nanoparticles. Environ. Res. 2021, 201, 111585. [Google Scholar] [CrossRef]
- Cornell, R.M.; Schwertmann, U. The Iron Oxides; Wiley: Hoboken, NJ, USA, 2003; ISBN 9783527302741. [Google Scholar]
- Fernández-Remolar, D.C. Iron Oxides, Hydroxides and Oxy-hydroxides. In Encyclopedia of Astrobiology; Springer: Berlin/Heidelberg, Germany, 2015; pp. 1268–1270. [Google Scholar]
- Darroudi, M.; Hakimi, M.; Goodarzi, E.; Kazemi Oskuee, R. Superparamagnetic iron oxide nanoparticles (SPIONs): Green preparation, characterization and their cytotoxicity effects. Ceram. Int. 2014, 40, 14641–14645. [Google Scholar] [CrossRef]
- Chaudhuri, S.K.; Malodia, L. Biosynthesis of zinc oxide nanoparticles using leaf extract of Calotropis gigantea: Characterization and its evaluation on tree seedling growth in nursery stage. Appl. Nanosci. 2017, 7, 501–512. [Google Scholar] [CrossRef]
- Cordova, G.; Attwood, S.; Gaikwad, R.; Gu, F.; Leonenko, Z. Magnetic Force Microscopy Characterization of Superparamagnetic Iron Oxide Nanoparticles (SPIONs). Nano Biomed. Eng. 2014, 6, 31–39. [Google Scholar] [CrossRef]
- Hasany, S.; Abdurahman, N.; Sunarti, A.; Jose, R. Magnetic Iron Oxide Nanoparticles: Chemical Synthesis and Applications Review. Curr. Nanosci. 2013, 9, 561–575. [Google Scholar] [CrossRef]
- Xie, J.; Jon, S. Magnetic Nanoparticle-Based Theranostics. Theranostics 2012, 2, 122–124. [Google Scholar] [CrossRef]
- Laurent, S.; Forge, D.; Port, M.; Roch, A.; Robic, C.; Vander Elst, L.; Muller, R.N. Magnetic Iron Oxide Nanoparticles: Synthesis, Stabilization, Vectorization, Physicochemical Characterizations, and Biological Applications. Chem. Rev. 2008, 108, 2064–2110. [Google Scholar] [CrossRef]
- Singh, B.; Gräfe, M.; Kaur, N.; Liese, A. Applications of synchrotron-based X-ray diffraction and X-ray absorption spectroscopy to the understanding of poorly crystalline and metal-substituted Iron oxides. Dev. Soil Sci. 2010, 34, 199–254. [Google Scholar] [CrossRef]
- Tran, N.; Mir, A.; Mallik, D.; Sinha, A.; Nayar, S.; Webster, T.J. Bactericidal effect of iron oxide nanoparticles on Staphylococcus aureus. Int. J. Nanomed. 2010, 5, 277–283. [Google Scholar] [CrossRef]
- Pankhurst, Q.A.; Connolly, J.; Jones, S.K.; Dobson, J. Applications of magnetic nanoparticles in biomedicine. J. Phys. D. Appl. Phys. 2003, 36, R167–R181. [Google Scholar] [CrossRef]
- Ajinkya, N.; Yu, X.; Kaithal, P.; Luo, H.; Somani, P.; Ramakrishna, S. Magnetic iron oxide nanoparticle (Ionp) synthesis to applications: Present and future. Materials 2020, 13, 4644. [Google Scholar] [CrossRef]
- Azam, A.; Ahmed, A.S.; Oves, M.; Khan, M.S.; Habib, S.S.; Memic, A. Antimicrobial activity of metal oxide nanoparticles against Gram-positive and Gram-negative bacteria: A comparative study. Int. J. Nanomed. 2012, 7, 6003–6009. [Google Scholar] [CrossRef]
- Mehmood, Z.; Sadiq, M.B.; Khan, M.R. Gelatin nanocomposite films incorporated with magnetic iron oxide nanoparticles for shelf life extension of grapes. J. Food Saf. 2020, 40, e12814. [Google Scholar] [CrossRef]
- Singh, N.; Jenkins, G.J.S.; Asadi, R.; Doak, S.H. Potential toxicity of superparamagnetic iron oxide nanoparticles (SPION). Nano Rev. 2010, 1, 5358. [Google Scholar] [CrossRef]
- Paul, S.; Saikia, J.P.; Samdarshi, S.K.; Konwar, B.K. Investigation of antioxidant property of iron oxide particlesby 1′-1′diphenylpicryl-hydrazyle (DPPH) method. J. Magn. Magn. Mater. 2009, 321, 3621–3623. [Google Scholar] [CrossRef]
- Jegadeesan, G.B.; Srimathi, K.; Santosh Srinivas, N.; Manishkanna, S.; Vignesh, D. Green synthesis of iron oxide nanoparticles using Terminalia bellirica and Moringa oleifera fruit and leaf extracts: Antioxidant, antibacterial and thermoacoustic properties. Biocatal. Agric. Biotechnol. 2019, 21, 101354. [Google Scholar] [CrossRef]
- Gajanan, G.; Chang, M.; Kim, J.; Jin, E. Biogenic materialization using pear extract intended for the synthesis and design of ordered gold nanostructures. J. Mater. Sci. 2011, 46, 4741–4747. [Google Scholar] [CrossRef]
- Rodríguez-Carvajal, J. Recent advances in magnetic structure determination by neutron powder diffraction. Phys. B Condens. Matter. 1993, 192, 55–69. [Google Scholar] [CrossRef]
- Abdullah, J.A.A.; Salah Eddine, L.; Abderrhmane, B.; Alonso-González, M.; Guerrero, A.; Romero, A.; Ahmed, J.A.; Salah, L.; Abderrhmane, B. Green synthesis and characterization of iron oxide nanoparticles by pheonix dactylifera leaf extract and evaluation of their antioxidant activity. Sustain. Chem. Pharm. 2020, 17, 100280. [Google Scholar] [CrossRef]
- Abdullah, J.A.A.; Jiménez-Rosado, M.; Perez-Puyana, V.; Guerrero, A.; Romero, A. Green Synthesis of FexOy Nanoparticles with Potential Antioxidant Properties. Nanomaterials 2022, 12, 2449. [Google Scholar] [CrossRef]
- Abdullah, J.A.A.; Jiménez-Rosado, M.; Guerrero, A.; Romero, A. Gelatin-Based Biofilms with FexOy-NPs Incorporated for Antioxidant and Antimicrobial Applications. Materials 2022, 15, 1966. [Google Scholar] [CrossRef]
- Jiménez-Rosado, M.; Gomez-Zavaglia, A.; Guerrero, A.; Romero, A. Green synthesis of ZnO nanoparticles using polyphenol extracts from pepper waste (Capsicum annuum). J. Clean. Prod. 2022, 350, 131541. [Google Scholar] [CrossRef]
- Behera, S.S.; Patra, J.K.; Pramanik, K.; Panda, N.; Thatoi, H. Characterization and Evaluation of Antibacterial Activities of Chemically Synthesized Iron Oxide Nanoparticles. World J. Nano Sci. Eng. 2012, 2, 196–200. [Google Scholar] [CrossRef]
- Wright, J.P.; Attfield, J.P.; Radaelli, P.G. Charge ordered structure of magnetite. Phys. Rev. B 2002, 66, 214422. [Google Scholar] [CrossRef]
- Fjellvag, H.; Hauback, B.C.B.C.; Vogt, T.; Stolen, S.; Stølen, S. Monoclinic nearly stoichiometric wüstite at low temperatures. Am. Mineral. 2002, 87, 347–349. [Google Scholar] [CrossRef]
- Fleet, M.E. The structure of magnetite: Two annealed natural magnetites, Fe3.005O4 and Fe2.96Mg0.04O4. Acta Crystallogr. Sect. C Cryst. Struct. Commun. 1984, 40, 1491–1493. [Google Scholar] [CrossRef]
- Okudera, H.; Kihara, K.; Matsumoto, T. Temperature dependence of structure parameters in natural magnetite: Single crystal X-ray studies from 126 to 773 K. Acta Crystallogr. Sect. B Struct. Sci. 1996, 52, 450–457. [Google Scholar] [CrossRef]
- Jørgensen, J.-E.; Mosegaard, L.; Thomsen, L.E.; Jensen, T.R.; Hanson, J.C. Formation of γ-Fe2O3 nanoparticles and vacancy ordering: An in situ X-ray powder diffraction study. J. Solid State Chem. 2007, 180, 180–185. [Google Scholar] [CrossRef]
- Wright, J.P.; Bell, A.M.T.; Attfield, J.P. Variable temperature powder neutron diffraction study of the Verwey transition in magnetite Fe3O4. Solid State Sci. 2000, 2, 747–753. [Google Scholar] [CrossRef]
- Fjellvåg, H.; Grønvold, F.; Stølen, S.; Hauback, B.C.; Fjellvag, H.; Gronvold, F.; Stolen, S.; Hauback, B.C. On the crystallographic and magnetic structures of nearly stoichiometric iron monoxide. J. Solid State Chem. 1996, 124, 52–57. [Google Scholar] [CrossRef]
- Nakagiri, N.; Manghnani, M.H.; Ming, L.C.; Kimura, S. Crystal structure of magnetite under pressure. Phys. Chem. Miner. 1986, 13, 238–244. [Google Scholar] [CrossRef]
- Montoro, V. Miscibilita fra gli ossidi salini di ferro e di manganese. Gazz. Chim. Ital. 1938, 68, 728–733. [Google Scholar]
- Finger, L.W.; Hazen, R.M.; Hofmeister, A.M. High-pressure crystal chemistry of spinel (Mg Al2O4) and magnetite (Fe3O4): Comparison with silicate spinels. Phys. Chem. Miner. 1986, 13, 215–220. [Google Scholar] [CrossRef]
- Fabrykiewicz, P.; Stękiel, M.; Sosnowska, I.; Przeniosło, R. Deformations of the α-Fe2O3 rhombohedral lattice across the Néel temperature. Acta Crystallogr. Sect. B Struct. Sci. Cryst. Eng. Mater. 2017, 73, 27–32. [Google Scholar] [CrossRef]
- El Mendili, Y.; Bardeau, J.-F.; Randrianantoandro, N.; Grasset, F.; Greneche, J.-M. Insights into the Mechanism Related to the Phase Transition from γ-Fe2O3 to α-Fe2O3 Nanoparticles Induced by Thermal Treatment and Laser Irradiation. J. Phys. Chem. C 2012, 116, 23785–23792. [Google Scholar] [CrossRef]
- Haavik, C.; Stølen, S.; Fjellvåg, H.; Hanfland, M.; Häusermann, D. Equation of state of magnetite and its high-pressure modification: Thermodynamics of the Fe-O system at high pressure. Am. Mineral. 2000, 85, 514–523. [Google Scholar] [CrossRef]
- Pecharromán, C.; González-Carreño, T.; Iglesias, J.E. The infrared dielectric properties of maghemite, γ-Fe2O3, from reflectance measurement on pressed powders. Phys. Chem. Miner. 1995, 22, 21–29. [Google Scholar] [CrossRef]
- Solano, E.; Frontera, C.; Puente Orench, I.; Puig, T.; Obradors, X.; Ricart, S.; Ros, J. Neutron and X-ray diffraction study of ferrite nanocrystals obtained by microwave-assisted growth. A structural comparison with the thermal synthetic route. Corrigendum. J. Appl. Crystallogr. 2014, 47, 1478. [Google Scholar] [CrossRef]
- Finger, L.W.; Hazen, R.M. Crystal structure and isothermal compression of Fe2O3, Cr2O3, and V2O3 to 50 kbars. J. Appl. Phys. 1980, 51, 5362. [Google Scholar] [CrossRef]
- Hendricks, S.B.; Pauling, L. The crystal structures of sodium and potassium trinitrides and potassium cyanate and the nature of the trinitride group. J. Am. Chem. Soc. 1925, 47, 2904–2920. [Google Scholar] [CrossRef]
- Baskar, M.; Patania, A. X-ray Powder Diffraction Data—Identification and Structure Elucidation of Unknown Stone—Rietveld Refinement Approach. J. Biophys. Chem. 2020, 11, 51–61. [Google Scholar] [CrossRef]
- Maslen, E.N.; Streltsov, V.A.; Streltsova, N.R.; Ishizawa, N. Synchrotron X-ray study of the electron density in α-Fe2O3. Acta Crystallogr. Sect. B Struct. Sci. 1994, 50, 435–441. [Google Scholar] [CrossRef]
- Jafari, A.; Farjami Shayesteh, S.; Salouti, M.; Boustani, K. Effect of annealing temperature on magnetic phase transition in Fe3O4 nanoparticles. J. Magn. Magn. Mater. 2015, 379, 305–312. [Google Scholar] [CrossRef]
- Du, W.; Yang, S.; Pan, F.; Shangguan, J.; Lu, J.; Liu, S.; Fan, H. Hydrogen Reduction of Hematite Ore Fines to Magnetite Ore Fines at Low Temperatures. J. Chem. 2017, 2017, 1919720. [Google Scholar] [CrossRef]
- Al-wardy, R.A.; Al-ogaili, H.A.T.; Abbas, S.I. Study of Annealing Temperature on Prepared Iron oxide Nanoparticles by Sol-Gel Method. Int. J. Innov. Res. Sci. Eng. Technol. 2016, 5, 5560–5567. [Google Scholar] [CrossRef]
- Matthews, A. Magnetite forrnation by the reduction of hematite with iron under hydrothermal conditions. Am. Mineral. 1976, 6, 927–932. [Google Scholar]
- Salgado, P.; Márquez, K.; Rubilar, O.; Contreras, D.; Vidal, G. The effect of phenolic compounds on the green synthesis of iron nanoparticles (FexOy-NPs) with photocatalytic activity. Appl. Nanosci. 2019, 9, 371–385. [Google Scholar] [CrossRef]
- Noukelag, S.K.; Arendse, C.J.; Maaza, M. Biosynthesis of hematite phase a-Fe2O3 nanoparticles using an aqueous extract of Rosmarinus officinalis leaves. Mater. Today Proc. 2020, 43, 3679–3683. [Google Scholar] [CrossRef]
- Venkateswarlu, S.; Natesh Kumar, B.; Prasad, C.H.; Venkateswarlu, P.; Jyothi, N.V.V. Bio-inspired green synthesis of Fe3O4 spherical magnetic nanoparticles using Syzygium cumini seed extract. Phys. B Condens. Matter 2014, 449, 67–71. [Google Scholar] [CrossRef]
- Niyom, Y.; Phakkeeree, T.; Flood, A.; Crespy, D. Synergy between polymer crystallinity and nanoparticles size for payloads release. J. Colloid Interface Sci. 2019, 550, 139–146. [Google Scholar] [CrossRef]
- Drummer, S.; Madzimbamuto, T.; Chowdhury, M. Green Synthesis of Transition-Metal Nanoparticles and Their Oxides: A Review. Materials 2021, 14, 2700. [Google Scholar] [CrossRef]
- Fatima, M.; Riaz, S.; Kayani, Z.N.; Naseem, S. Effect of Calcination on Phase Transition in Iron Oxide Nanoparticles; Elsevier Ltd.: Amsterdam, The Netherlands, 2015; Volume 2. [Google Scholar]
- Madhuri, K.; Kannan, P.K.; Chaudhari, S.; Dhage, S.R.; Dey, S.R. ScienceDirect Effect of Annealing Time and Heat Flux on Solvothermal Synthesis of CIGS Nanoparticles. Mater. Today Proc. 2020, 21, 1882–1887. [Google Scholar] [CrossRef]
- Matsumoto, T.; Tamine, K.I.; Kagawa, R.; Hamada, Y.; Okazaki, M.; Takahashi, J. Different behavior of implanted hydroxyapatite depending on morphology, size and crystallinity. J. Ceram. Soc. Jpn. 2006, 114, 760–762. [Google Scholar] [CrossRef]
- Koupaei, M.H.; Shareghi, B.; Saboury, A.A.; Davar, F.; Semnani, A.; Evini, M. Green synthesis of zinc oxide nanoparticles and their effect on the stability and activity of proteinase K. RSC Adv. 2016, 6, 42313–42323. [Google Scholar] [CrossRef]
- Br, S.; Xr, J. Effect of Calcination Time on Structural, Optical and Antimicrobial Properties of Nickel Oxide Nanoparticles Theoretical & Computational Science. J. Theor. Comput. Sci. 2016, 3, 1000149. [Google Scholar] [CrossRef]
- Ashraf, R.; Riaz, S.; Nazir, Z.; Naseem, S. Effect of Calcination on Properties of ZnO Nanoparticles; Elsevier Ltd.: Amsterdam, The Netherlands, 2015; Volume 2. [Google Scholar]
- Bhongsuwan, T. Effect of Calcination Temperature on the Magnetic Characteristics of Synthetic Iron Oxide Magnetic Nanoparticles for Arsenic Adsorption. Chiang Mai J. Sci. 2018, 45, 528–539. [Google Scholar]
- Rajeswari, V.D.; Khalifa, A.S.; Elfasakhany, A.; Badruddin, I.A.; Kamangar, S.; Brindhadevi, K. Green and ecofriendly synthesis of cobalt oxide nanoparticles using Phoenix dactylifera L: Antimicrobial and photocatalytic activity. Appl. Nanosci. 2023, 13, 1367–1375. [Google Scholar] [CrossRef]
- Mohan Kumar, K.; Mandal, B.K.; Siva Kumar, K.; Sreedhara Reddy, P.; Sreedhar, B. Biobased green method to synthesise palladium and iron nanoparticles using Terminalia chebula aqueous extract. Spectrochim. Acta Part A Mol. Biomol. Spectrosc. 2013, 102, 128–133. [Google Scholar] [CrossRef]
- Ayala-Zavala, J.F.; Silva-Espinoza, B.A.; Cruz-Valenzuela, M.R.; Villegas-Ochoa, M.A.; Esqueda, M.; González-Aguilar, G.A.; Calderón-López, Y. Antioxidant and antifungal potential of methanol extracts of Phellinus spp. from Sonora, Mexico. Rev. Iberoam. Micol. 2012, 29, 132–138. [Google Scholar] [CrossRef]
- Casillas, P.E.G.; Gonzalez, C.A.R.; Pérez, C.A.M. Infrared Spectroscopy of Functionalized Magnetic Nanoparticles. Infrared Spectrosc. Mater. Sci. Eng. Technol. 2012, 21, 406–418. [Google Scholar] [CrossRef]
- Răcuciu, M.; Oancea, S. ATR-FTIR Versus Raman spectroscopy used for structural analyses of the iron oxide nanoparticles. Rom. Rep. Phys. 2019, 71, 1–10. [Google Scholar]
- Zhang, S.; Wu, W.; Xiao, X.; Zhou, J.; Ren, F.; Jiang, C. Preparation and characterization of spindle-like Fe3O4 mesoporous nanoparticles. Nanoscale Res. Lett. 2011, 6, 89. [Google Scholar] [CrossRef]
- Nalbandian, L.; Patrikiadou, E.; Zaspalis, V.; Patrikidou, A.; Hatzidaki, E.; NPapandreou, C. Magnetic Nanoparticles in Medical Diagnostic Applications: Synthesis, Characterization and Proteins Conjugation. Curr. Nanosci. 2015, 12, 455–468. [Google Scholar] [CrossRef]
- Bertolucci, E.; Galletti, A.M.R.; Antonetti, C.; Marracci, M.; Tellini, B.; Piccinelli, F.; Visone, C. Chemical and magnetic properties characterization of magnetic nanoparticles. In Proceedings of the 2015 IEEE International Instrumentation and Measurement Technology Conference (I2MTC), Pisa, Italy, 11–14 May 2015; pp. 1492–1496. [Google Scholar] [CrossRef]
- Li, Y.S.; Church, J.S.; Woodhead, A.L. Infrared and Raman spectroscopic studies on iron oxide magnetic nano-particles and their surface modifications. J. Magn. Magn. Mater. 2012, 324, 1543–1550. [Google Scholar] [CrossRef]
- Manzo, M.; Ahmed, H.; Nasrazadani, S. Study on emission spectral lines of hematite and magnetite for purity’s differentiation. AIP Adv. 2020, 10, 105327. [Google Scholar] [CrossRef]
- Vinayagam, R.; Pai, S.; Varadavenkatesan, T.; Narasimhan, M.K.; Narayanasamy, S.; Selvaraj, R. Structural characterization of green synthesized α-Fe2O3 nanoparticles using the leaf extract of Spondias dulcis. Surf. Interfaces 2020, 20, 100618. [Google Scholar] [CrossRef]
- Hsu, C.-M.; Huang, Y.-H.; Chen, H.-J.; Lee, W.-C.; Chiu, H.-W.; Maity, J.P.; Chen, C.-C.; Kuo, Y.-H.; Chen, C.-Y. Green synthesis of nano-Co3O4 by Microbial Induced Precipitation (MIP) process using Bacillus pasteurii and its application as supercapacitor. Mater. Today Commun. 2018, 14, 302–311. [Google Scholar] [CrossRef]
- Bibi, I.; Kamal, S.; Ahmed, A.; Iqbal, M.; Nouren, S.; Jilani, K.; Nazar, N.; Amir, M.; Abbas, A.; Ata, S.; et al. Nickel nanoparticle synthesis using Camellia Sinensis as reducing and capping agent: Growth mechanism and photo-catalytic activity evaluation. Int. J. Biol. Macromol. 2017, 103, 783–790. [Google Scholar] [CrossRef]
- Patiño-Ruiz, D.A.; Meramo-Hurtado, S.I.; González-Delgado, Á.D.; Herrera, A. Environmental Sustainability Evaluation of Iron Oxide Nanoparticles Synthesized via Green Synthesis and the Coprecipitation Method: A Comparative Life Cycle Assessment Study. ACS Omega 2021, 6, 12410–12423. [Google Scholar] [CrossRef]
- Shokry Hassan, H.; Kashyout, A.B.; Soliman, H.M.A.; Uosif, M.A.; Afify, N. Influence of Reaction Time, Reducing Agent and Zinc Precursors on the Morphological Structures of Zinc Oxide. Angl. J. 2013, 3, 100933989. [Google Scholar]
- Mohammadi, F.M.; Ghasemi, N. Influence of temperature and concentration on biosynthesis and characterization of zinc oxide nanoparticles using cherry extract. J. Nanostruct. Chem. 2018, 8, 93–102. [Google Scholar] [CrossRef]
- Zhao, X.; Zhou, L.; Shahid, M.; Rajoka, R.; Yan, L.; Shao, D.; Zhu, J.; Shi, J.; Huang, Q.; Yang, H. Critical Reviews in Biotechnology Fungal silver nanoparticles: Synthesis, application and challenges. Crit. Rev. Biotechnol. 2018, 38, 817–835. [Google Scholar] [CrossRef]
- Demirbas, A.; Welt, B.A.; Ocsoy, I. Biosynthesis of red cabbage extract directed Ag NPs and their effect on the loss of antioxidant activity. Mater. Lett. 2016, 179, 20–23. [Google Scholar] [CrossRef]
- Öztürk, F.; Ço, S.; Duman, F. Materials Science & Engineering C Biosynthesis of silver nanoparticles using leaf extract of Aesculus hippocastanum (horse chestnut): Evaluation of their antibacterial, antioxidant and drug release system activities. Mater. Sci. Eng. C 2020, 107, 110207. [Google Scholar] [CrossRef]
- Gudikandula, K.; Vadapally, P.; Charya, M.A.S. OpenNano Biogenic synthesis of silver nanoparticles from white rot fungi: Their characterization and antibacterial studies. OpenNano 2017, 2, 64–78. [Google Scholar] [CrossRef]
- Shah, S.T.; Yehye, W.A.; Chowdhury, Z.Z.; Simarani, K. Magnetically directed antioxidant and antimicrobial agent: Synthesis and surface functionalization of magnetite with quercetin. PeerJ 2019, 7, e7651. [Google Scholar] [CrossRef]
- Kumar Patra, J.; Baek, K.-H. Green Nanobiotechnology: Factors Affecting Synthesis and Characterization Techniques. J. Nanomater. 2014, 2014, 417305. [Google Scholar] [CrossRef]
- Armijo, L.M.; Wawrzyniec, S.J.; Kopciuch, M.; Brandt, Y.I.; Rivera, A.C.; Withers, N.J.; Cook, N.C.; Huber, D.L.; Monson, T.C.; Smyth, H.D.C.; et al. Antibacterial activity of iron oxide, iron nitride, and tobramycin conjugated nanoparticles against Pseudomonas aeruginosa biofilms. J. Nanobiotechnology 2020, 18, 35. [Google Scholar] [CrossRef]
- Lee, C.; Jee, Y.K.; Won, I.L.; Nelson, K.L.; Yoon, J.; Sedlak, D.L. Bactericidal effect of zero-valent iron nanoparticles on Escherichia coli. Environ. Sci. Technol. 2008, 42, 4927–4933. [Google Scholar] [CrossRef]
- Mahdy, S.A.; Raheed, Q.J.; Kalaichelvan, P.T. Antimicrobial activity of zero-valent iron nanoparticles. Int. J. Mod. Eng. Res. 2012, 2, 578–581. [Google Scholar]
- Mohan, P.; Mala, R. Comparative antibacterial activity of magnetic iron oxide nanoparticles synthesized by biological and chemical methods against poultry feed pathogens. Mater. Res. Express 2019, 6, 115077. [Google Scholar] [CrossRef]
- Shuai, C.; Wang, C.; Qi, F.; Peng, S.; Yang, W.; He, C.; Wang, G.; Qian, G. Enhanced Crystallinity and Antibacterial of PHBV Scaffolds Incorporated with Zinc Oxide. J. Nanomater. 2020, 2020, 6014816. [Google Scholar] [CrossRef]
- Touati, D. Iron and Oxidative Stress in Bacteria. Arch. Biochem. Biophys. 2000, 373, 1–6. [Google Scholar] [CrossRef]
- Datta, A.; Patra, C.; Bharadwaj, H.; Kaur, S.; Dimri, N.; Khajuria, R. Green Synthesis of Zinc Oxide Nanoparticles Using Parthenium hysterophorus Leaf Extract and Evaluation of their Antibacterial Properties. J. Biotechnol. Biomater. 2017, 7, 3–7. [Google Scholar] [CrossRef]
- Awwad, A.M.; Amer, M.W. Biosynthesis of copper oxide nanoparticles using Ailanthus altissima leaf extract and antibacterial activity. Chem. Int. 2020, 6, 210–2017. [Google Scholar]
- Azizi, S.; Mohamad, R.; Bahadoran, A.; Bayat, S.; Abdul, R.; Ariff, A.; Zuhainis, W. Effect of annealing temperature on antimicrobial and structural properties of bio-synthesized zinc oxide nanoparticles using flower extract of Anchusa italica. J. Photochem. Photobiol. B 2016, 161, 441–449. [Google Scholar] [CrossRef]


| GS-NPs | ||||||||||||||||||
|---|---|---|---|---|---|---|---|---|---|---|---|---|---|---|---|---|---|---|
| T °C | 200 °C | 300 °C | 500 °C | |||||||||||||||
| Time | XRD (nm) | SEM (nm) | Crl (%) | Fe2O3 (%) | Fe3O4 (%) | IC50 (µg/mL) | XRD (nm) | SEM (nm) | Crl (%) | Fe2O3 (%) | Fe3O4 (%) | IC50 (µg/mL) | XRD (nm) | SEM (nm) | Crl (%) | Fe2O3 (%) | Fe3O4 (%) | IC50 (µg/mL) |
| 2 h | 10.2 ± 0.4 f | 11.7 ± 0.2 f | 98.5 a | 1.7 | 98.3 | 86 ± 6 e | 7.6 ± 0.5 f | 5.8 ± 0.1 e | 98.4 a | 55.0 | 45.0 | 8 ± 2 f | 22.0 ± 0.3 e | 21.8 ± 0.6 c | 96.6 b | 25.4 | 74.6 | 1488 ± 449 f |
| 4 h | 11.8 ± 0.6 e | 14.2 ± 0.3 e | 96.7 b | 4.7 | 95.3 | 55 ± 2 f | 16.3 ± 0.2 e | 19.3 ± 0.2 d | 98.6 a | 57.1 | 42.9 | 39 ± 3 e | 24.6 ± 0.8 d | 26.0 ± 1.7 b | 97.0 a | 91.3 | 8.7 | 4586 ± 343 c |
| 5 h | 18.5 ± 1.2 d | 16.8 ± 3.6 d | 87.6 f | - | 100 | 403 ± 41 d | 27.7 ± 0.3 d | 23.5 ± 1.8 c | 94.6 c | 86.6 | 13.4 | 109 ± 3 d | 23.5 ± 0.6 d | 20.8 ± 0.1 d | 91.1 d | 62.4 | 37.6 | 2100 ± 10 e |
| CS-NPs | ||||||||||||||||||
| 2 h | 29.8 ± 0.8 b | 24.2 ± 0.4 b | 93.4 c | 91.1 | 8.9 | 4213 ± 990 c | 32.1 ± 1.1 b | 25.3 ± 0.9 b | 93.6 d | 88.6 | 11.4 | 4810 ± 165 c | 32.3 ± 0.6 a | 36.0 ± 1.0 a | 91.7 d | 96.9 | 3.1 | 97,778 ± 2320 a |
| 4 h | 31.9 ± 0.3 a | 26.3 ± 0.4 a | 90.5 e | 92.9 | 7.7 | 12,602 ± 779 b | 39.0 ± 1.7 a | 31.8 ± 0.9 a | 95.0 b | 93.5 | 6.5 | 19280 ± 1249 a | 31.3 ± 0.1 b | 37.0 ± 1.0 a | 94.9 c | 100.0 | - | 3735 ± 1650 d |
| 5 h | 22.2 ± 0.7 c | 19.2 ± 0.1 c | 92.4 d | 95.5 | 4.5 | 23,442 ± 1362 a | 29.5 ± 0.9 c | 23.0 ± 1.0 c | 91.0 e | 98.1 | 1.9 | 16,550 ± 1208 b | 29.6 ± 0.9 c | 27.5 ± 0.5 b | 85.6 e | 98.7 | 1.3 | 7100 ± 400 b |
| GS-NPs | |||||||||||||||||||
|---|---|---|---|---|---|---|---|---|---|---|---|---|---|---|---|---|---|---|---|
| T °C | 300 °C | 300 °C | 500 °C | ||||||||||||||||
| Time | Phase | MO | Tri (Hex) | Tri (rohm) | Cu | Te | Total | MO | Tri (Hex) | Tri (rohm) | Cu | Te | Total | MO | Tri (Hex) | Tri (rohm) | Cu | Te | Total |
| 2 h | Fe2O3 | 1.7 | 1.7 | 0.7 | 0.6 | 47.9 | 5.8 | 55.0 | 25.4 | 25.4 | |||||||||
| Fe3O4 | 36.2 | 32.6 | 29.4 | 98.3 | 35.3 | 6.6 | 3.1 | 45.0 | 74.6 | 74.6 | |||||||||
| 4 h | Fe2O3 | 4.7 | 4.7 | 7.2 | 49.9 | 57.1 | 91.3 | 91.3 | |||||||||||
| Fe3O4 | 9.2 | 50.0 | 36.1 | 95.3 | 42.9 | 42.9 | 1.8 | 1.4 | 5.5 | 8.7 | |||||||||
| 5 h | Fe2O3 | 0.5 | 86.1 | 86.6 | 62.4 | 62.4 | |||||||||||||
| Fe3O4 | 44.9 | 55.1 | 100 | 7.9 | 2.5 | 3.0 | 13.4 | 19.0 | 1.0 | 17 | 0.6 | 37.6 | |||||||
| CS-NPs | |||||||||||||||||||
| 2 h | Fe2O3 | 1.5 | 89.6 | 91.1 | 88.6 | 88.6 | 3.4 | 46.7 | 46.8 | 96.9 | |||||||||
| Fe3O4 | 6.3 | 2.6 | 8.9 | 11.4 | 11.4 | 2.1 | 1.0 | 3.1 | |||||||||||
| 4 h | Fe2O3 | 2.9 | 2.5 | 87.5 | 92.9 | 0.7 | 92.8 | 93.5 | 2.2 | 2.8 | 95.0 | 100 | |||||||
| Fe3O4 | 2.9 | 4.2 | 7.1 | 5.7 | 0.8 | 6.5 | |||||||||||||
| 5 h | Fe2O3 | 6.1 | 89.4 | 95.5 | 1.5 | 96.6 | 98.1 | 60.3 | 36.1 | 2.3 | 98.7 | ||||||||
| Fe3O4 | 4.5 | 4.5 | 1.1 | 0.8 | 1.9 | 1.3 | 1.3 | ||||||||||||
| Test Time (h) | Sample | S. aureus | E. coli |
|---|---|---|---|
| 24 | Gentamicin | 28.3 ± 0.3 a | 30.4 ± 0.7 A |
| GS-NPs 200°C 2h | 23.3 ± 0.7 b | 24.9 ± 0.4 B | |
| GS-NPs 200°C 4h | 19.2 ± 0.2 d | 20.8 ± 0.1 D | |
| GS-NPs 300°C 2h | 21.8 ± 0.7 c | 24.2 ± 0.3 BC | |
| GS-NPs 300°C 4h | 18.4 ± 0.9 d | 23.5 ± 1.0 C | |
| 48 | Gentamicin | 26.6 ± 0.1 a | 28.1 ± 0.4 A |
| GS-NPs 200°C 2h | 23.6 ± 0.6 b | 25.1 ± 0.3 B | |
| GS-NPs 200°C 4h | 17.1 ± 0.2 d | 20.2 ± 0.2 D | |
| GS-NPs 300°C 2h | 20.8 ± 0.3 c | 21.4 ± 0.0 C | |
| GS-NPs 300°C 4h | 15.7 ± 0.7 e | 21.2 ± 0.5 C |
Disclaimer/Publisher’s Note: The statements, opinions and data contained in all publications are solely those of the individual author(s) and contributor(s) and not of MDPI and/or the editor(s). MDPI and/or the editor(s) disclaim responsibility for any injury to people or property resulting from any ideas, methods, instructions or products referred to in the content. |
© 2023 by the authors. Licensee MDPI, Basel, Switzerland. This article is an open access article distributed under the terms and conditions of the Creative Commons Attribution (CC BY) license (https://creativecommons.org/licenses/by/4.0/).
Share and Cite
Abdullah, J.A.A.; Jiménez-Rosado, M.; Guerrero, A.; Romero, A. Effect of Calcination Temperature and Time on the Synthesis of Iron Oxide Nanoparticles: Green vs. Chemical Method. Materials 2023, 16, 1798. https://doi.org/10.3390/ma16051798
Abdullah JAA, Jiménez-Rosado M, Guerrero A, Romero A. Effect of Calcination Temperature and Time on the Synthesis of Iron Oxide Nanoparticles: Green vs. Chemical Method. Materials. 2023; 16(5):1798. https://doi.org/10.3390/ma16051798
Chicago/Turabian StyleAbdullah, Johar Amin Ahmed, Mercedes Jiménez-Rosado, Antonio Guerrero, and Alberto Romero. 2023. "Effect of Calcination Temperature and Time on the Synthesis of Iron Oxide Nanoparticles: Green vs. Chemical Method" Materials 16, no. 5: 1798. https://doi.org/10.3390/ma16051798
APA StyleAbdullah, J. A. A., Jiménez-Rosado, M., Guerrero, A., & Romero, A. (2023). Effect of Calcination Temperature and Time on the Synthesis of Iron Oxide Nanoparticles: Green vs. Chemical Method. Materials, 16(5), 1798. https://doi.org/10.3390/ma16051798