

Fragmentation Mechanism in a Nitrogen Dielectric Barrier Discharge Plasma on Fluoropolymer Polymer Films

 ,
,  ,
,  ,
,
Abstract
1. Introduction
2. Experimental Section
2.1. Materials
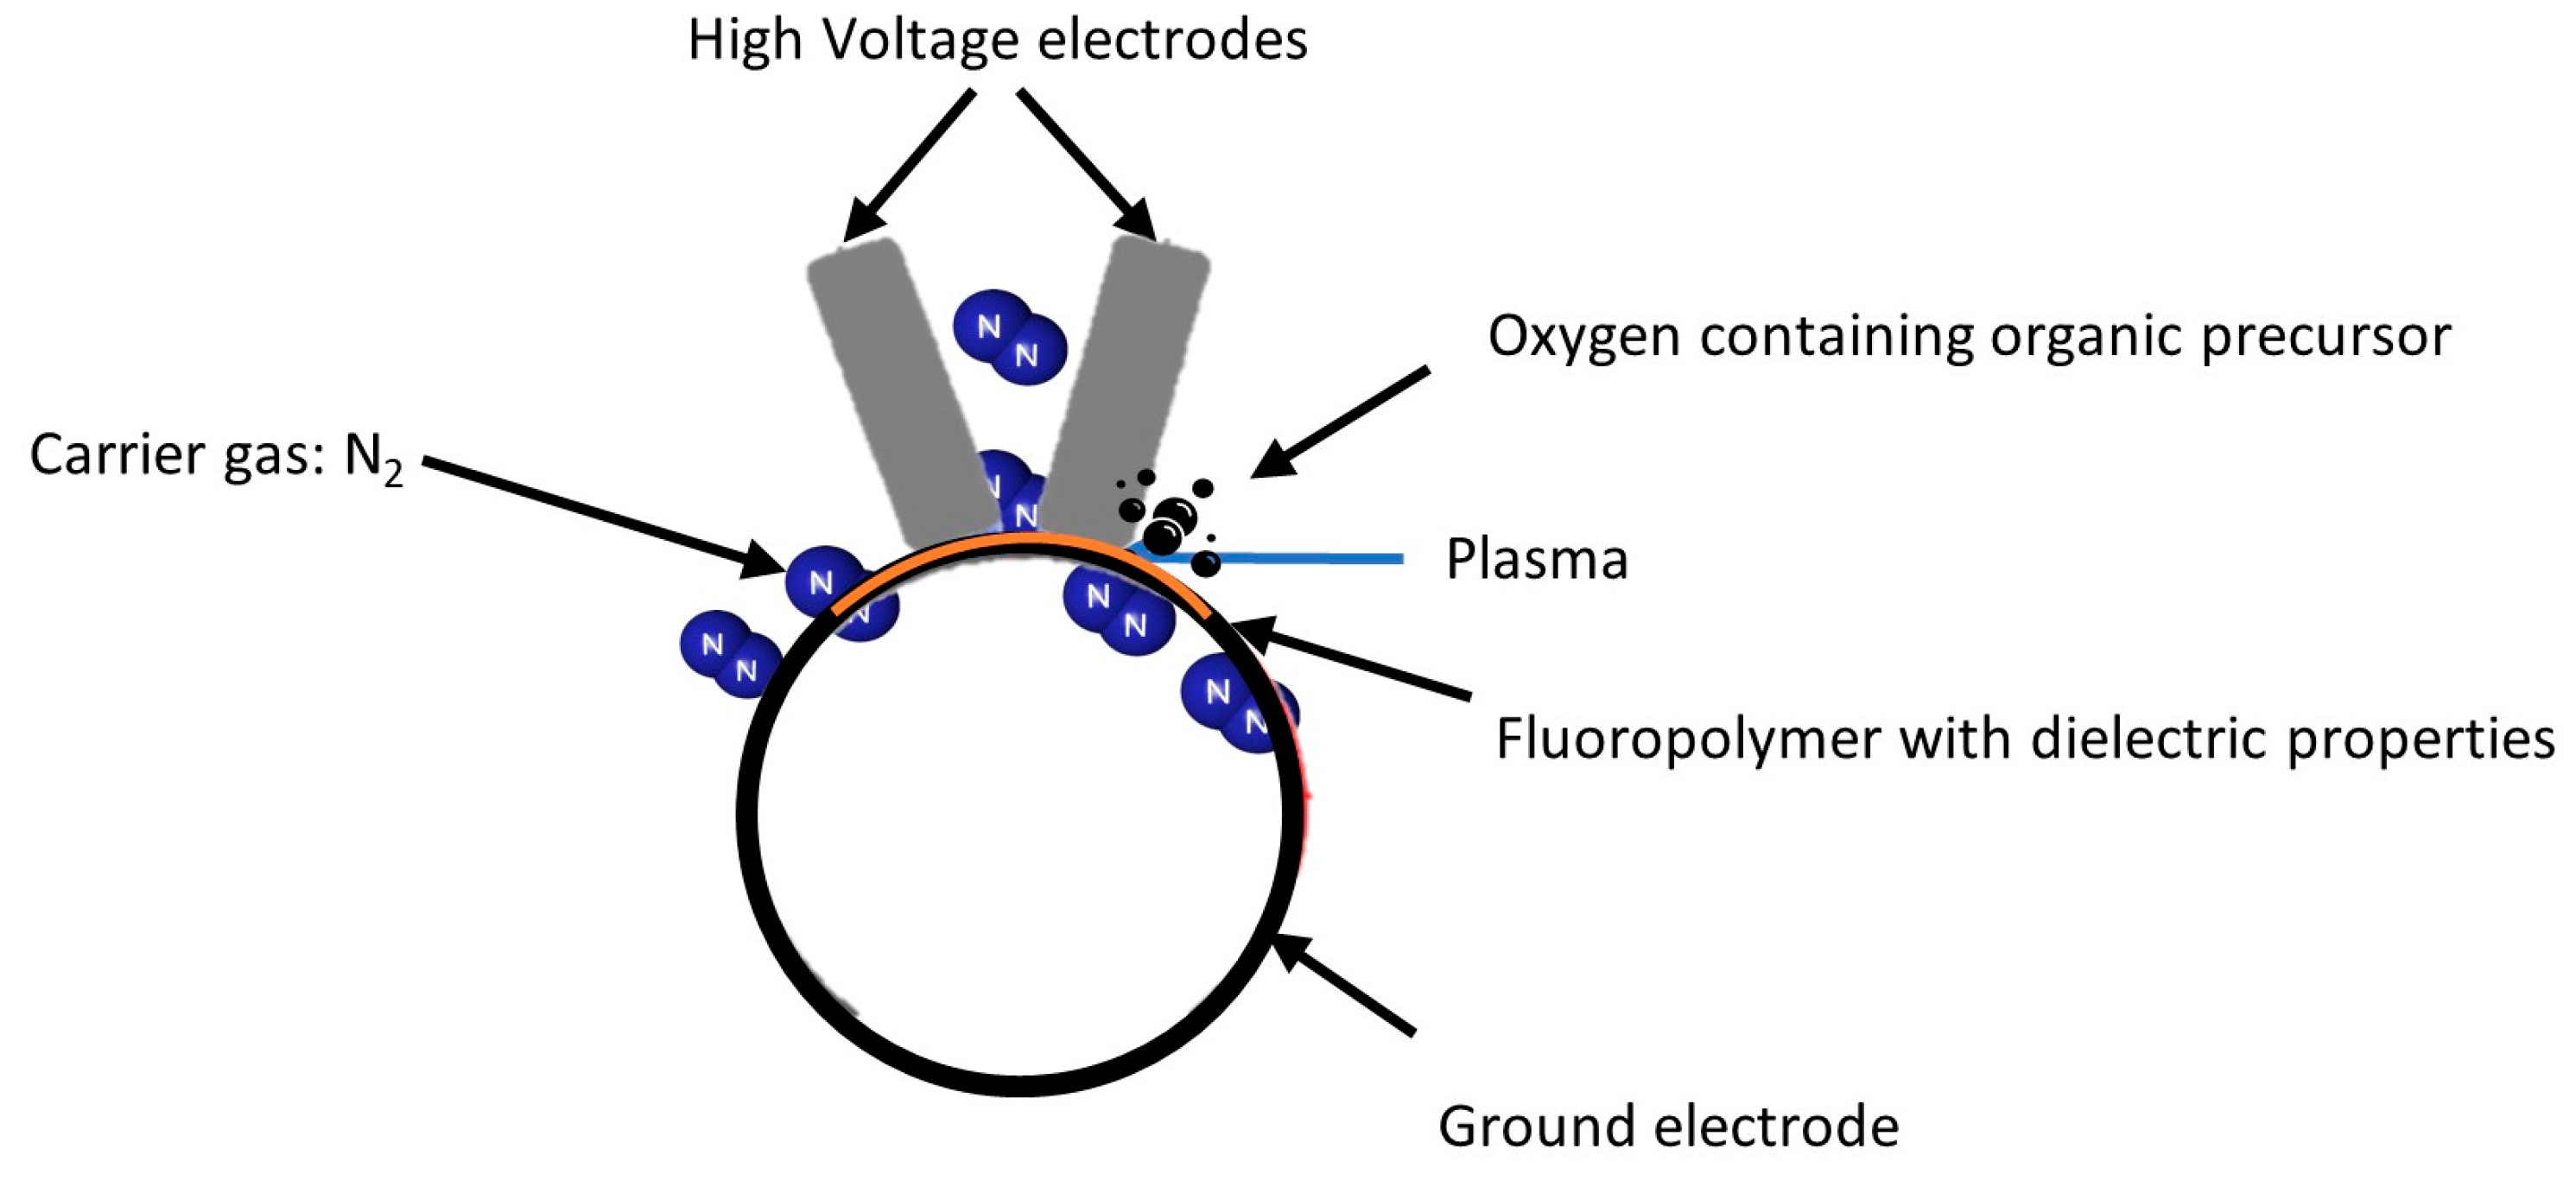
2.2. Plasma Reactor
2.3. Characterization Techniques
2.3.1. X-ray Photoelectron Spectroscopy
2.3.2. Surface Energy
2.3.3. Attenuated Total Reflectance Fourier Transformed Infrared Spectroscopy (ATR-FTIR)
3. Results and Discussion
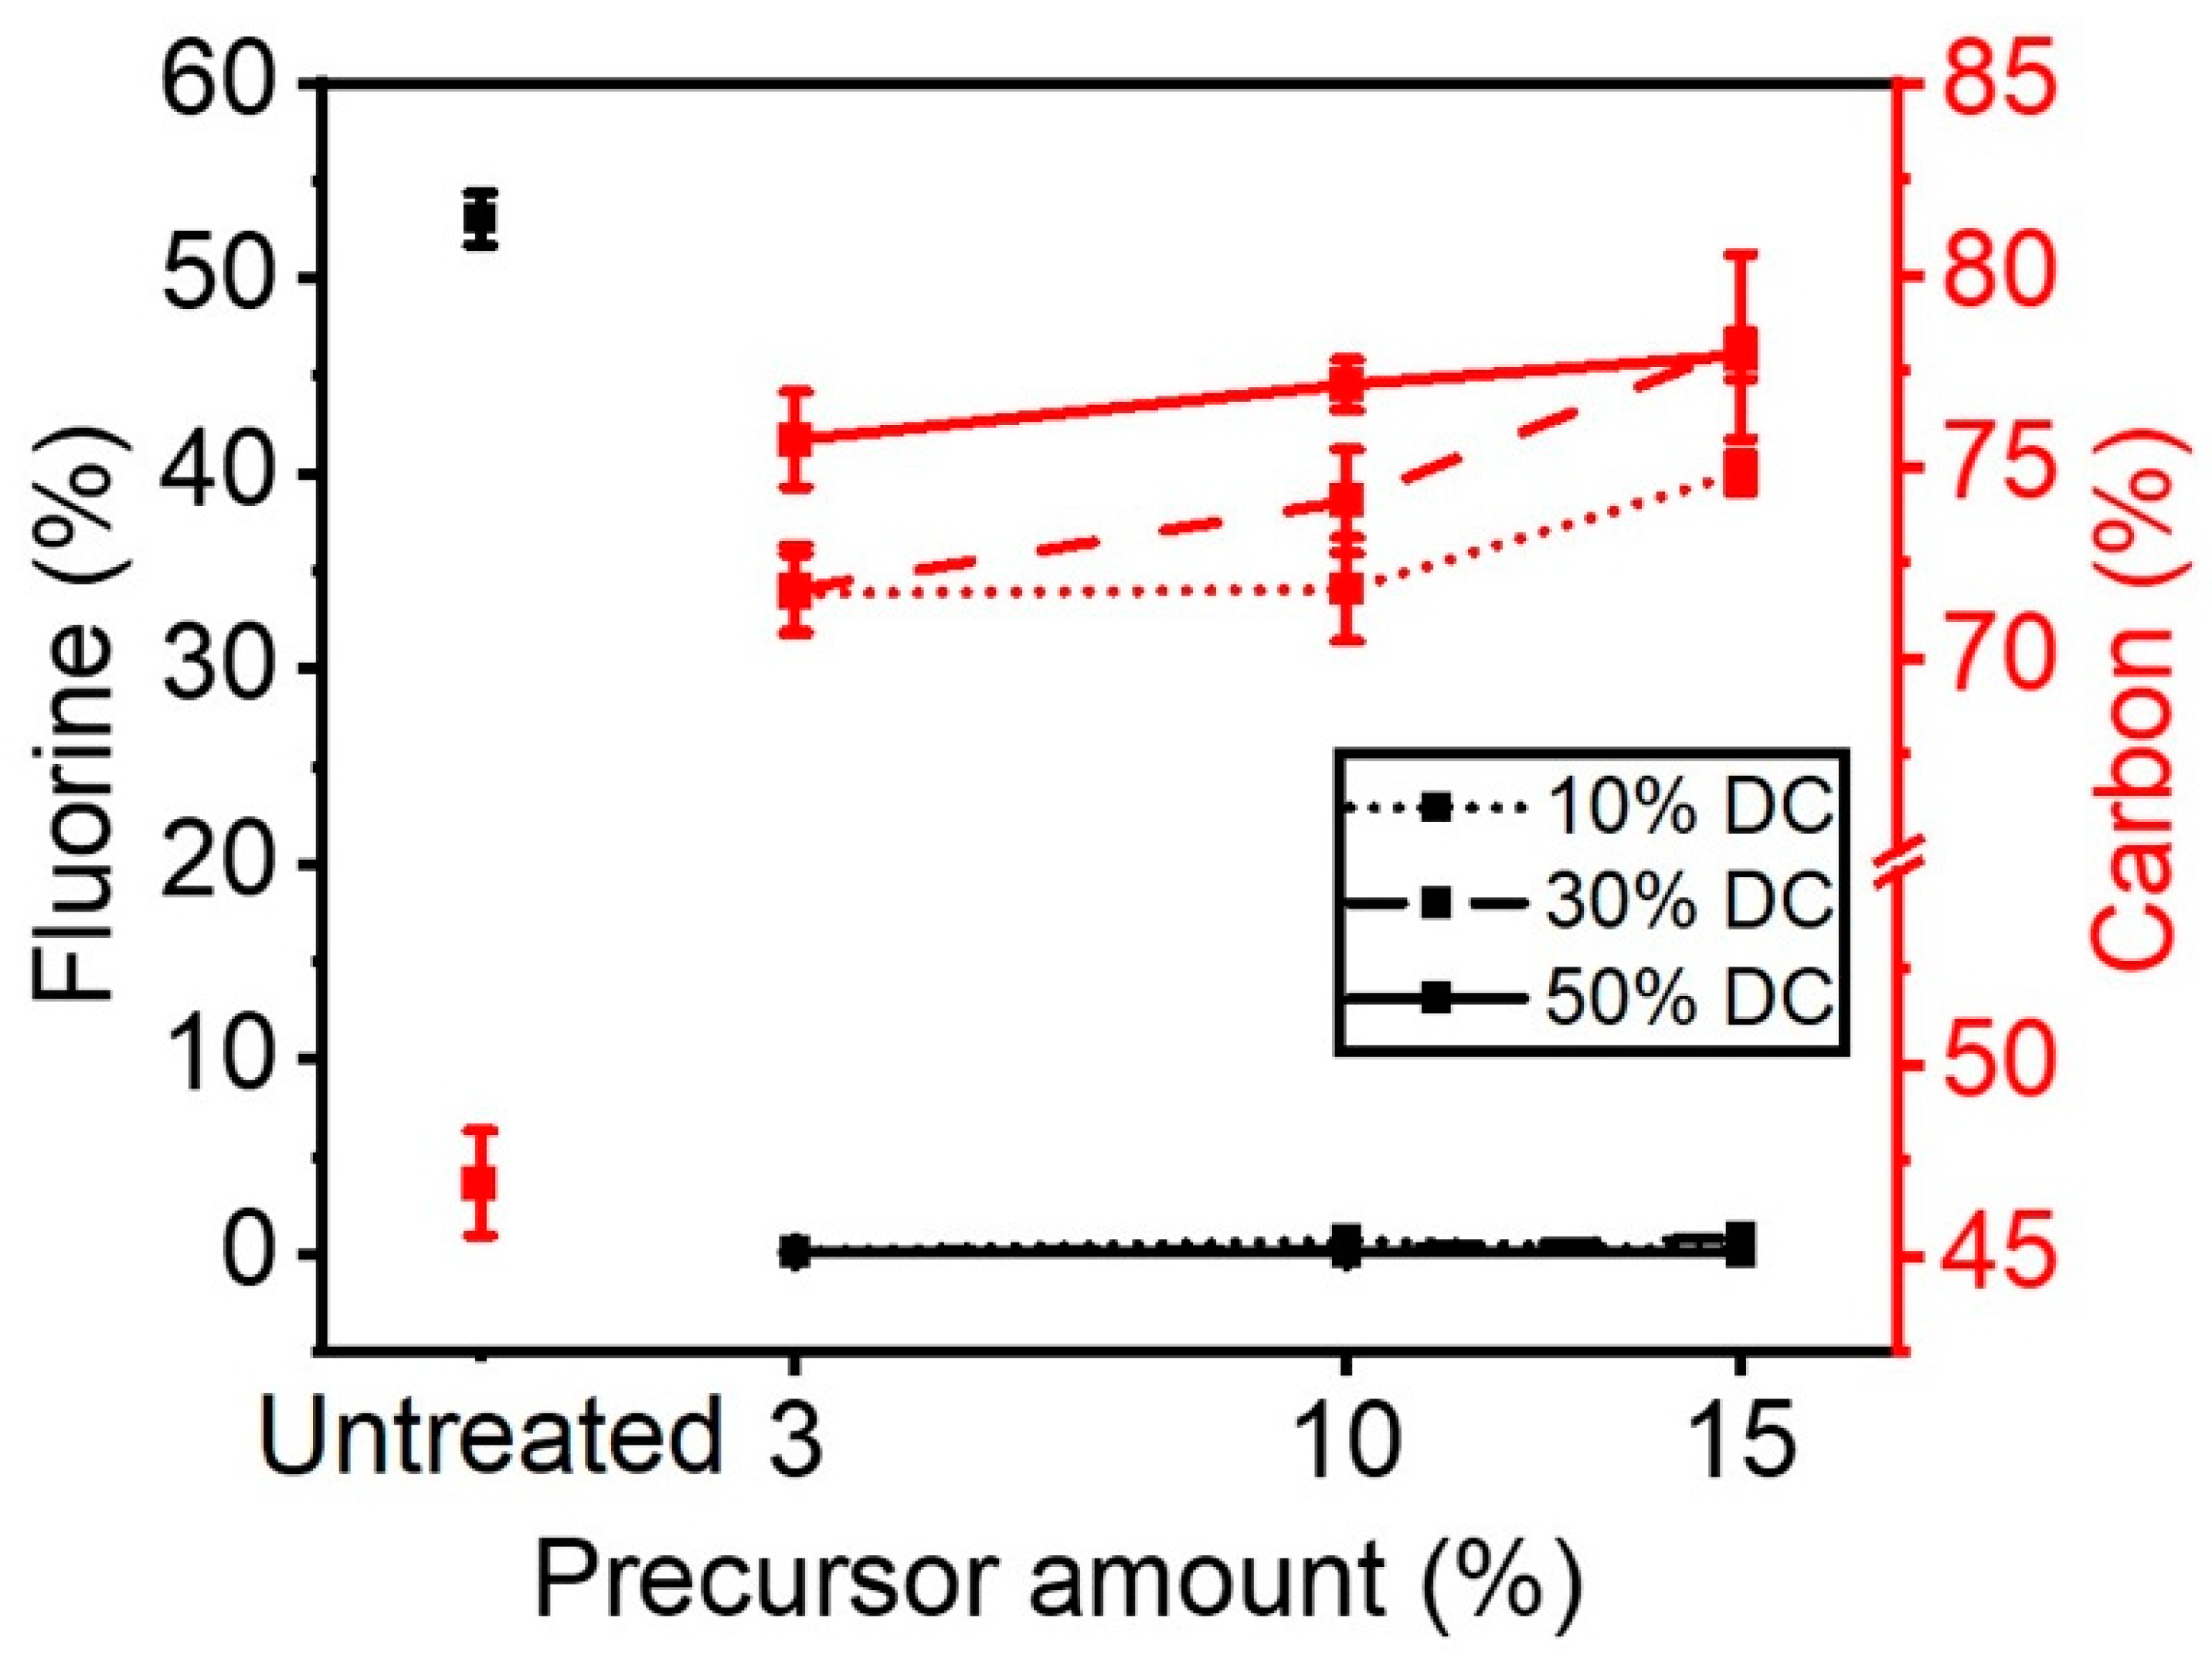
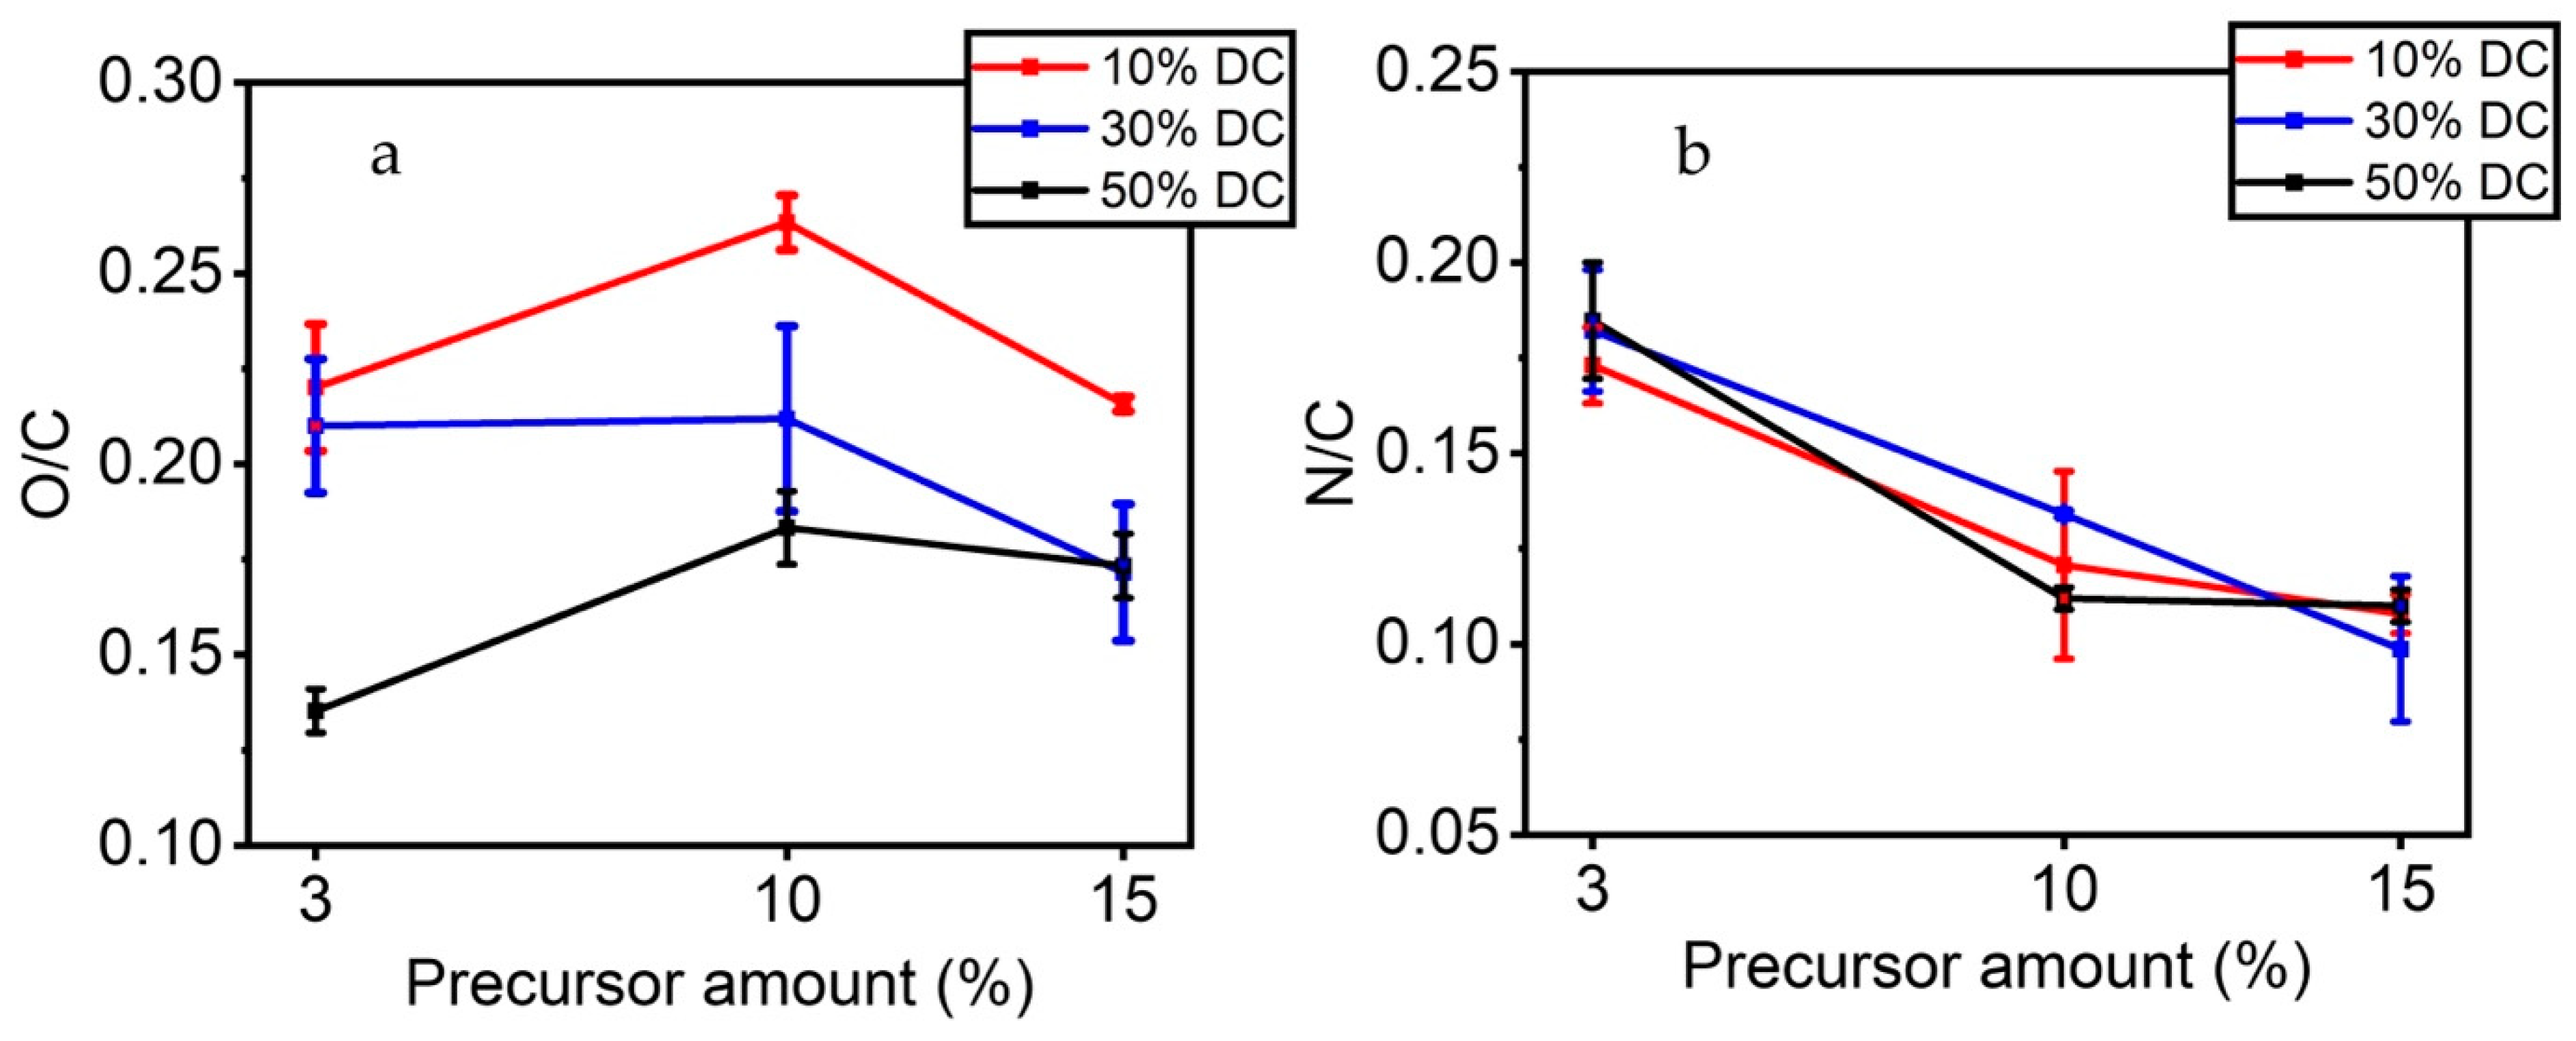
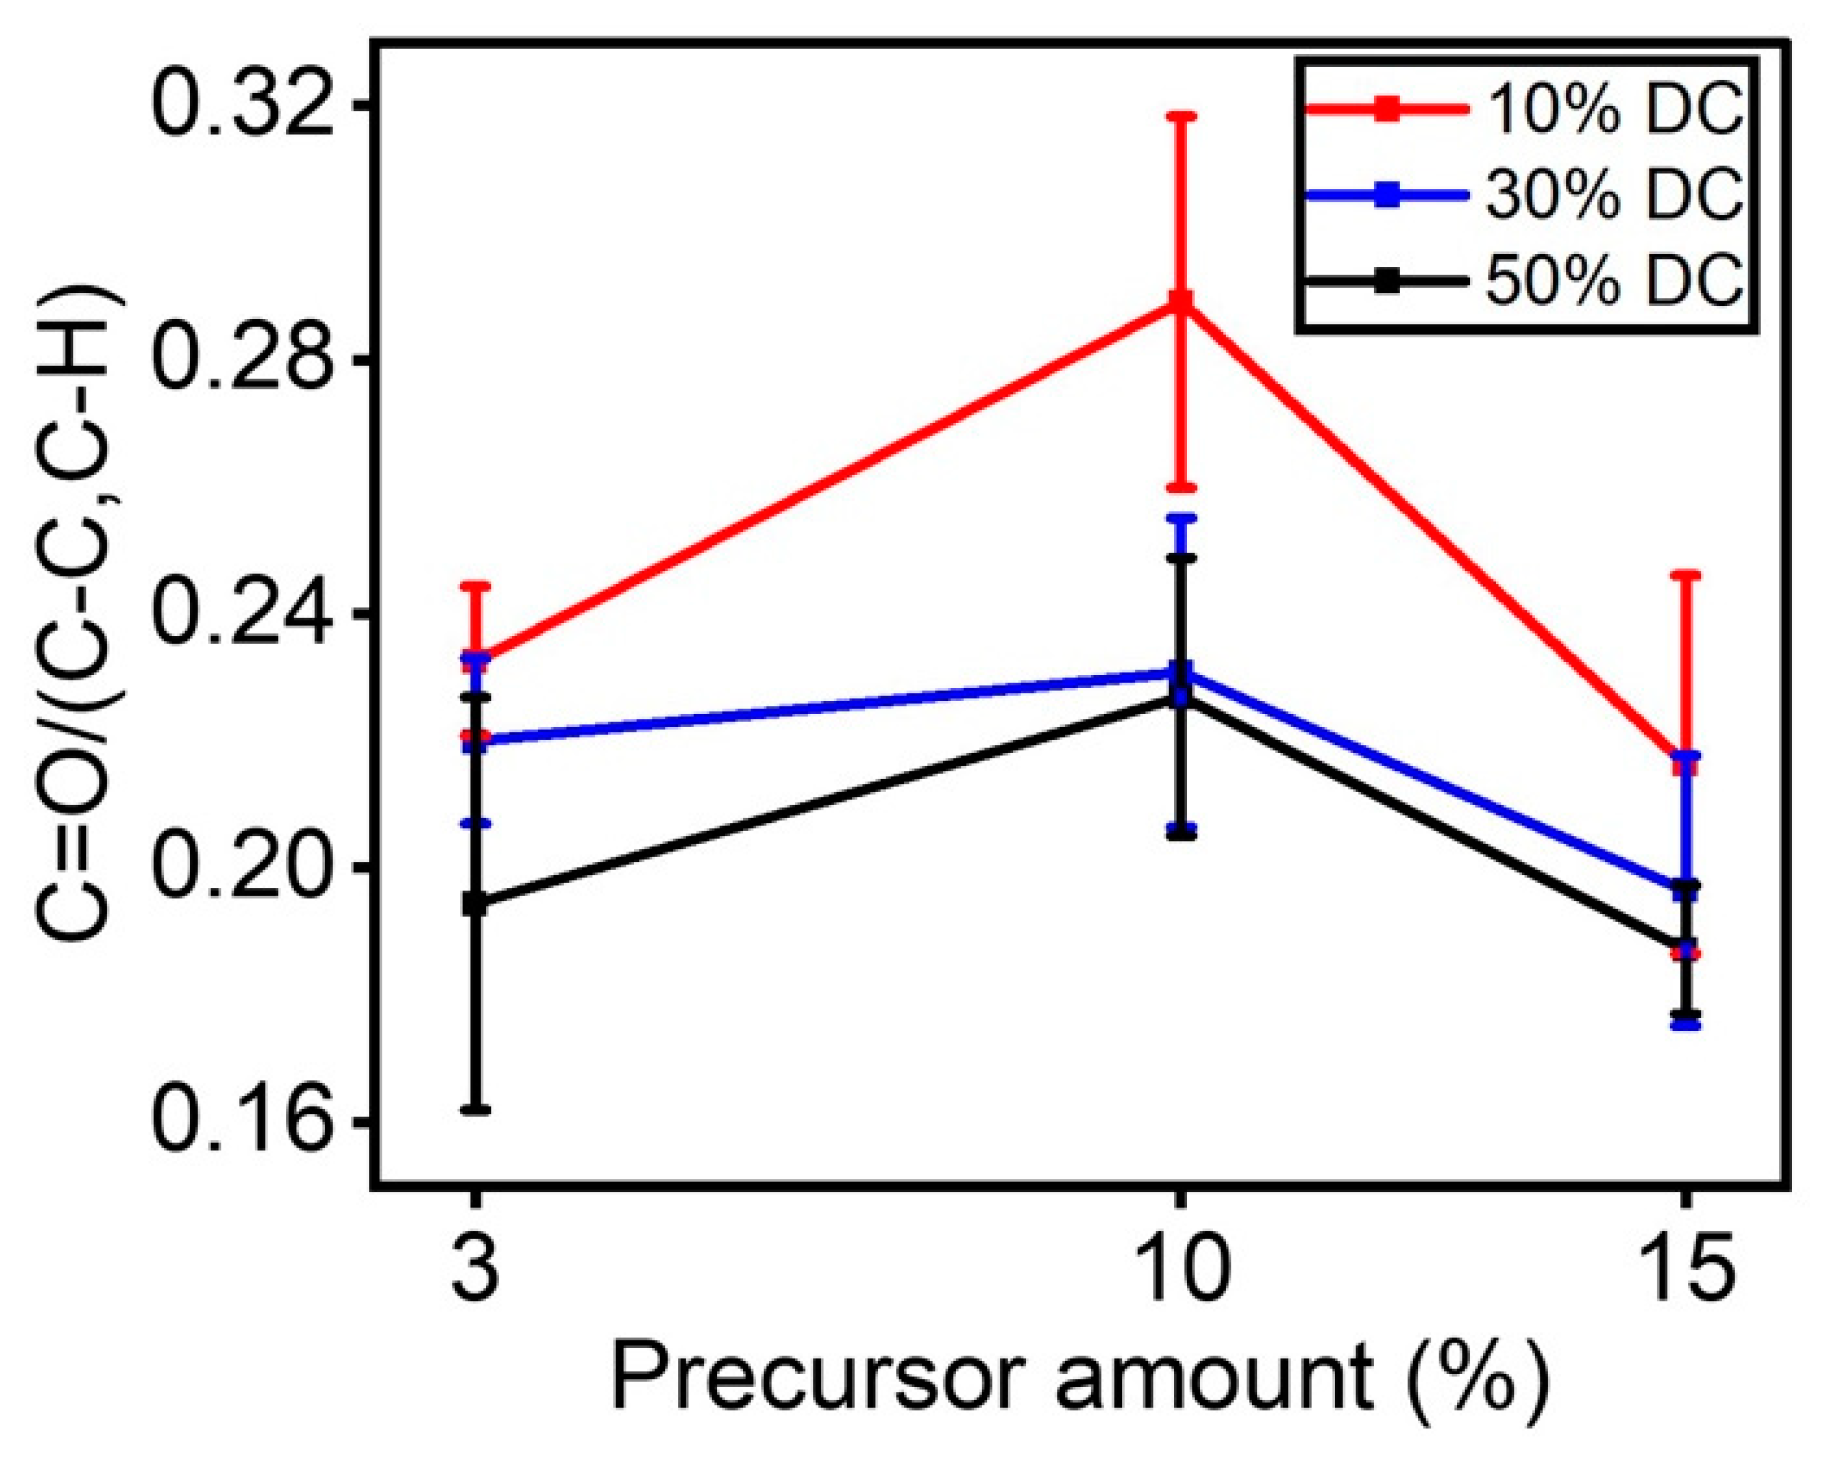
3.1. Surface Composition of Plasma-Treated Samples
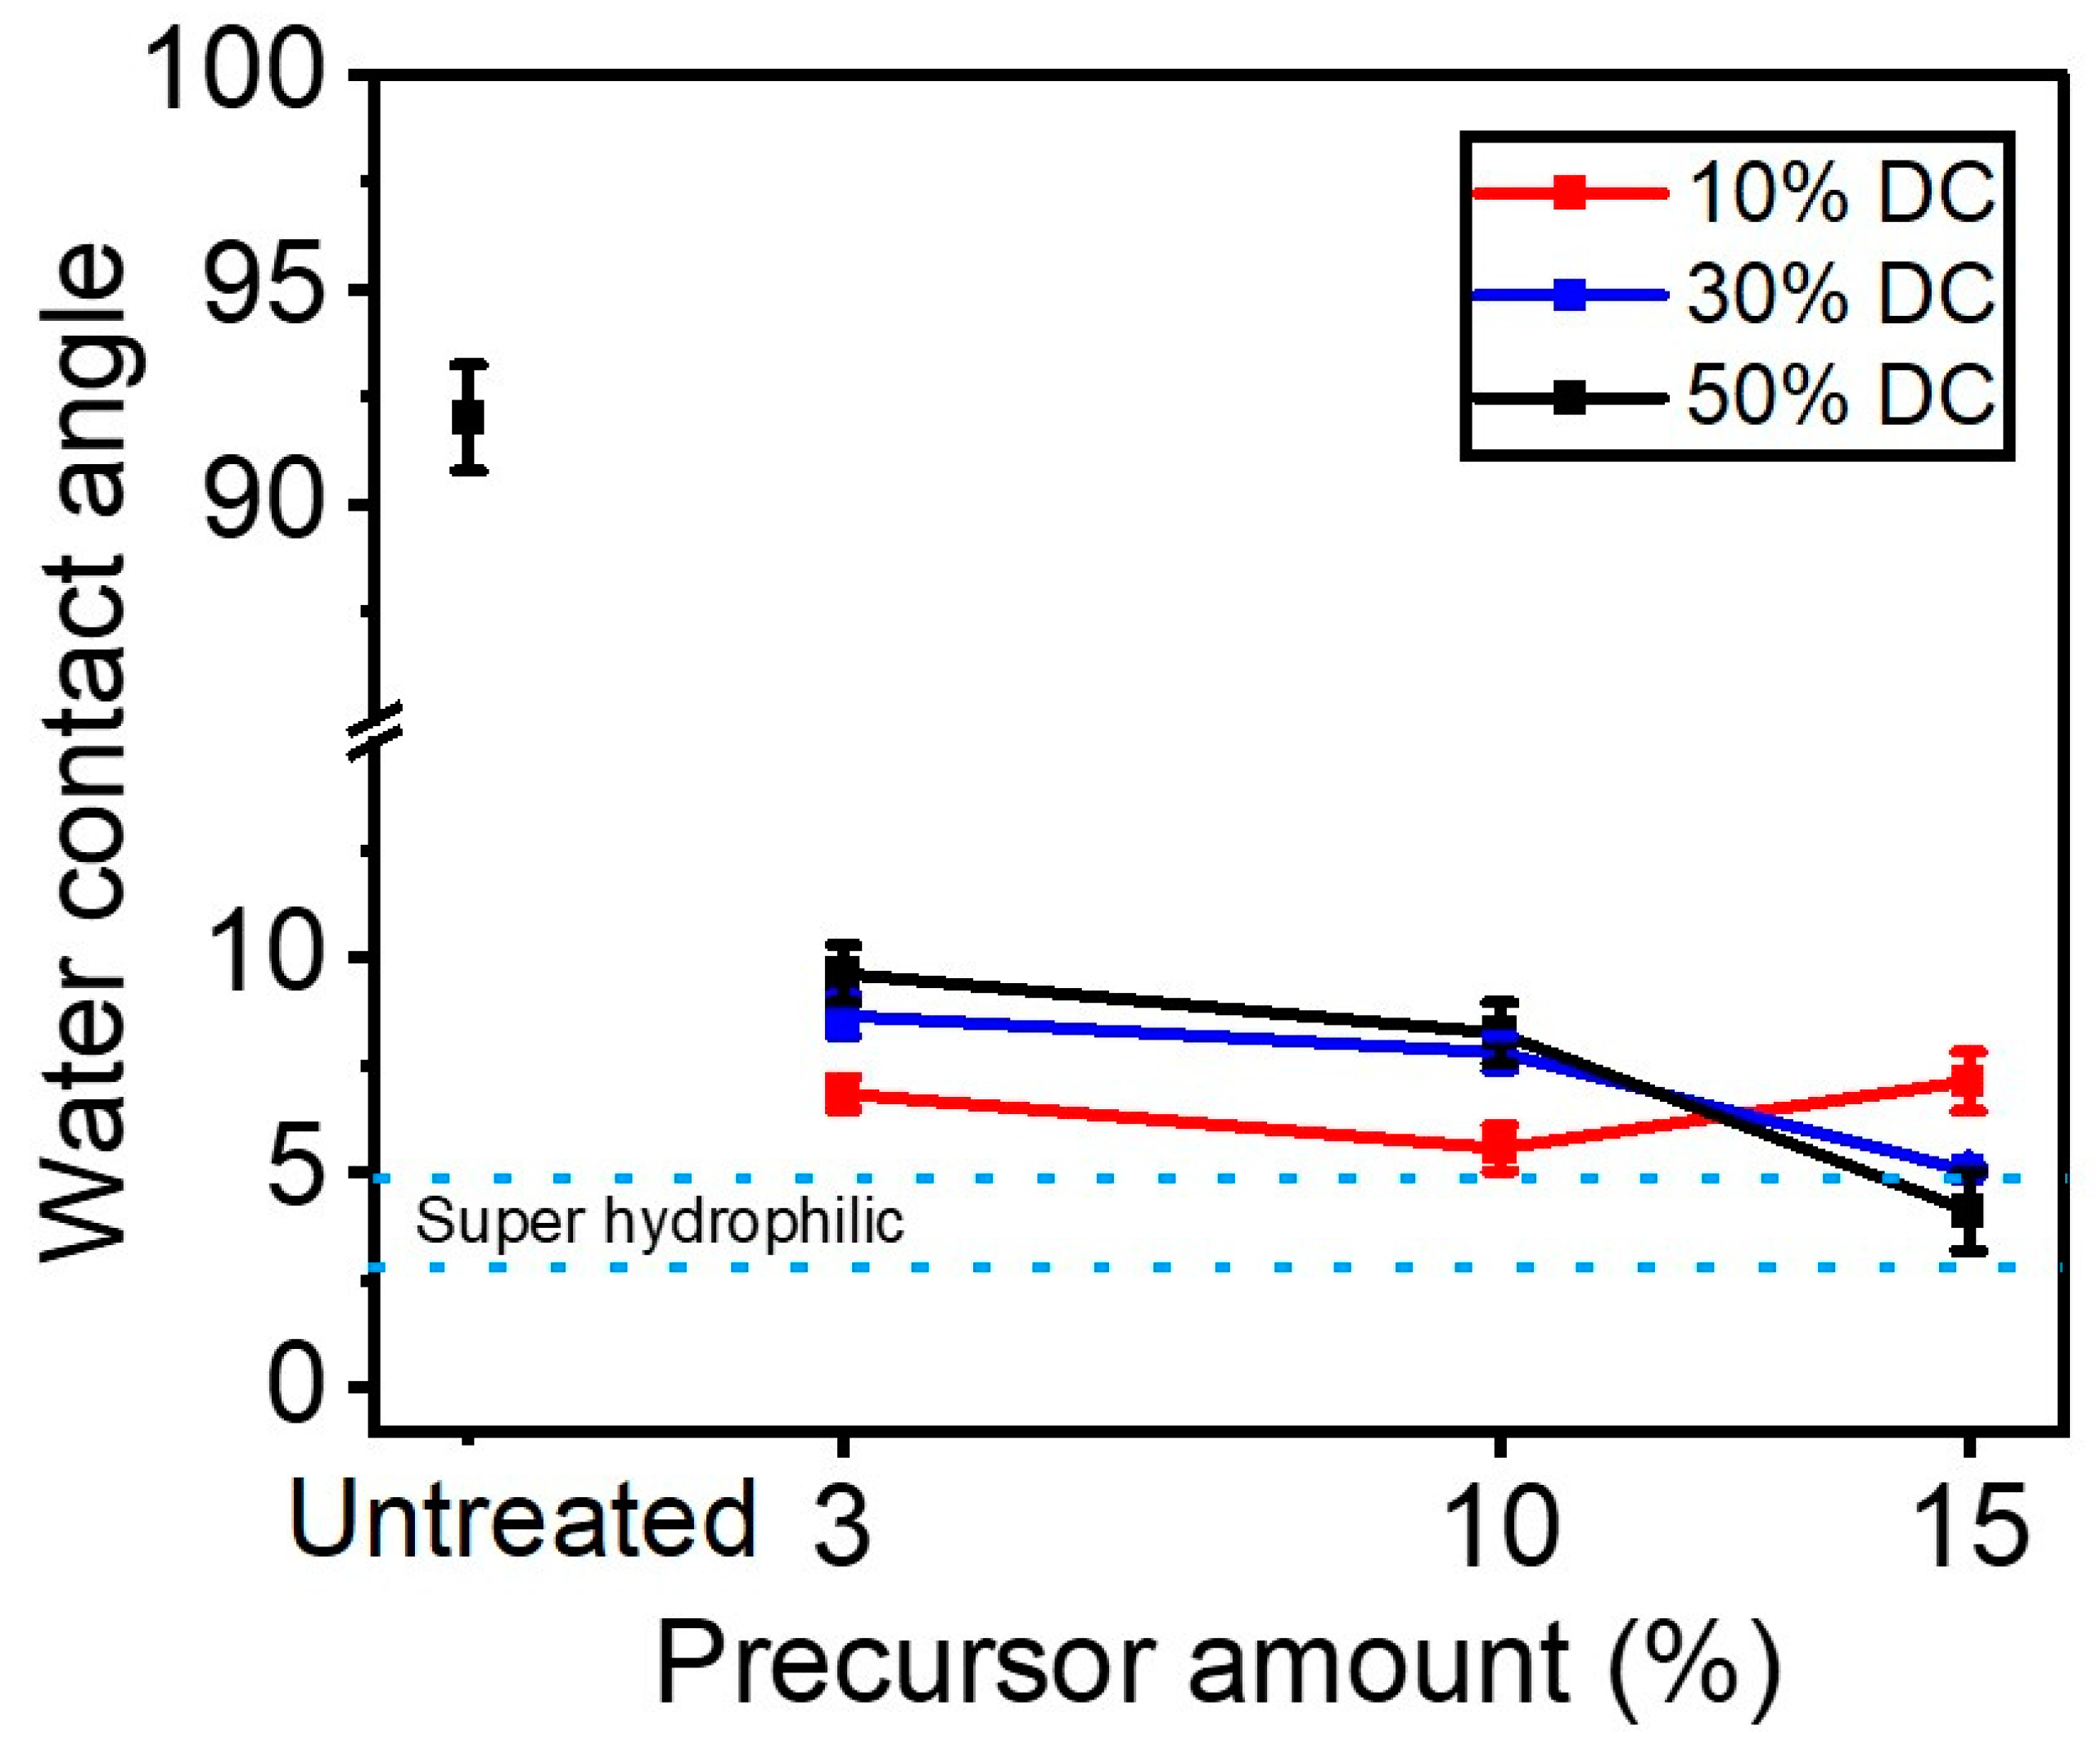
3.2. Wetting Behavior of Plasma Treated ETFE Samples
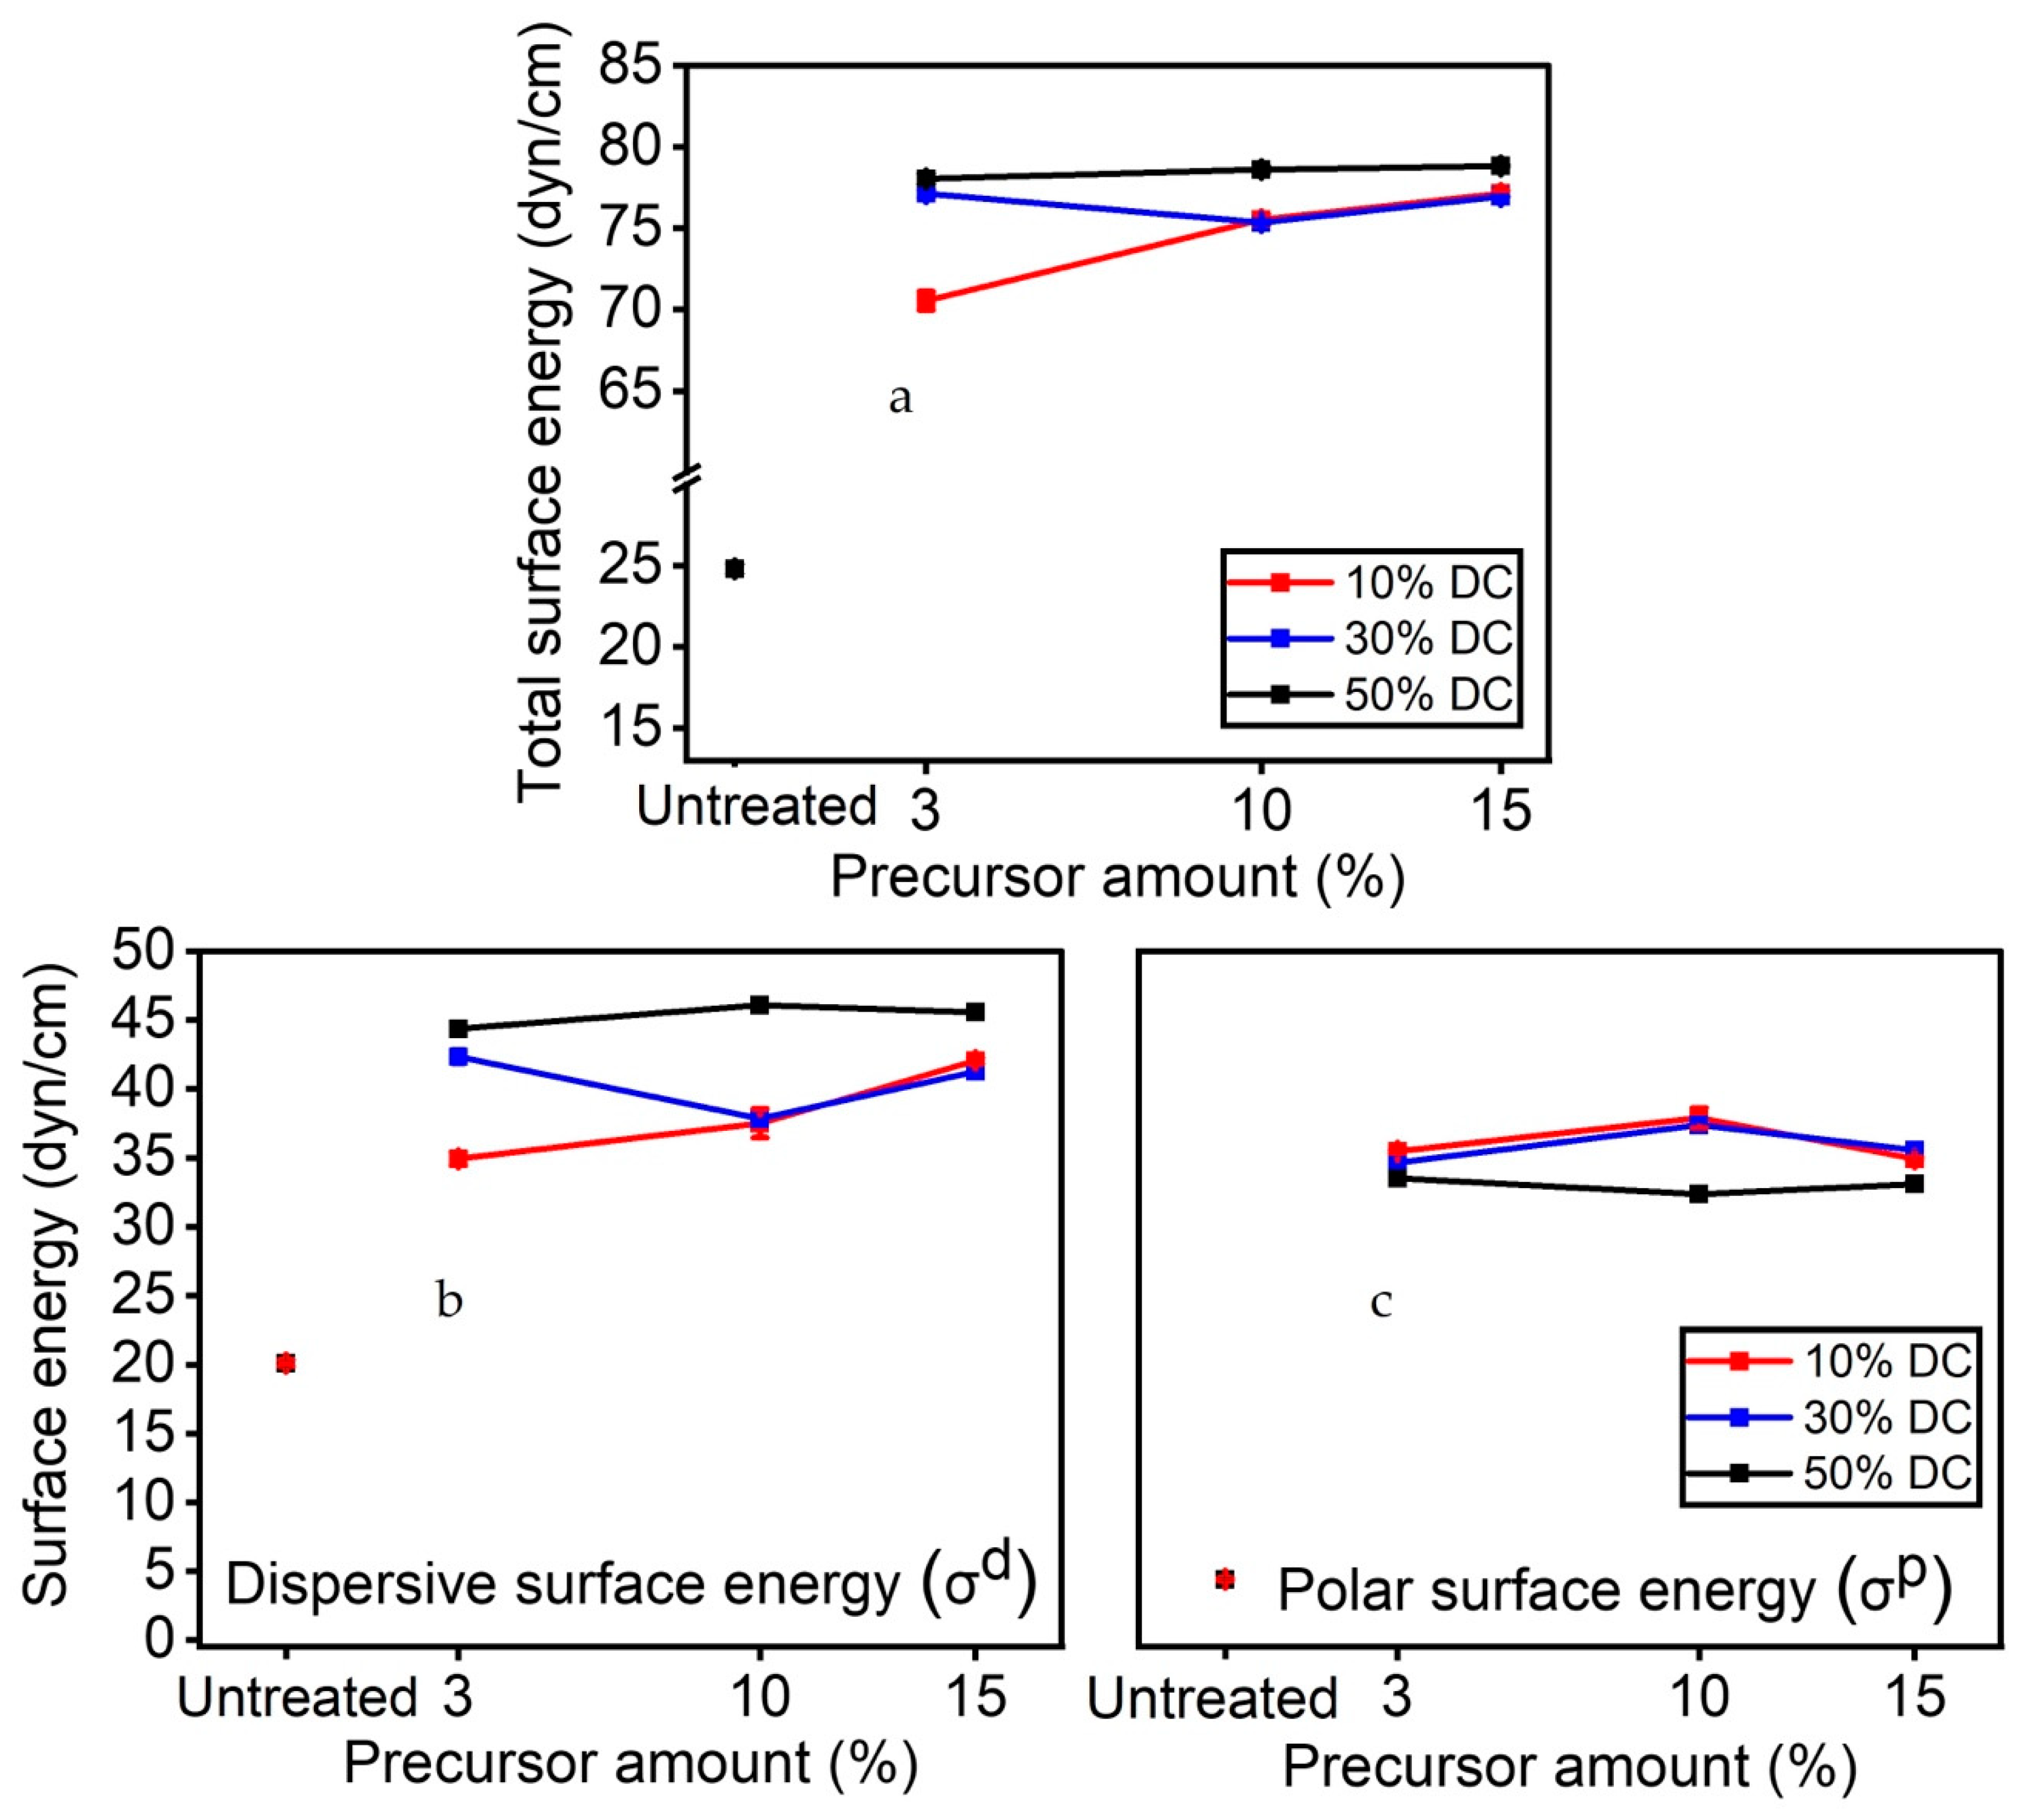
3.3. Surface Energy of Plasma Treated ETFE Samples
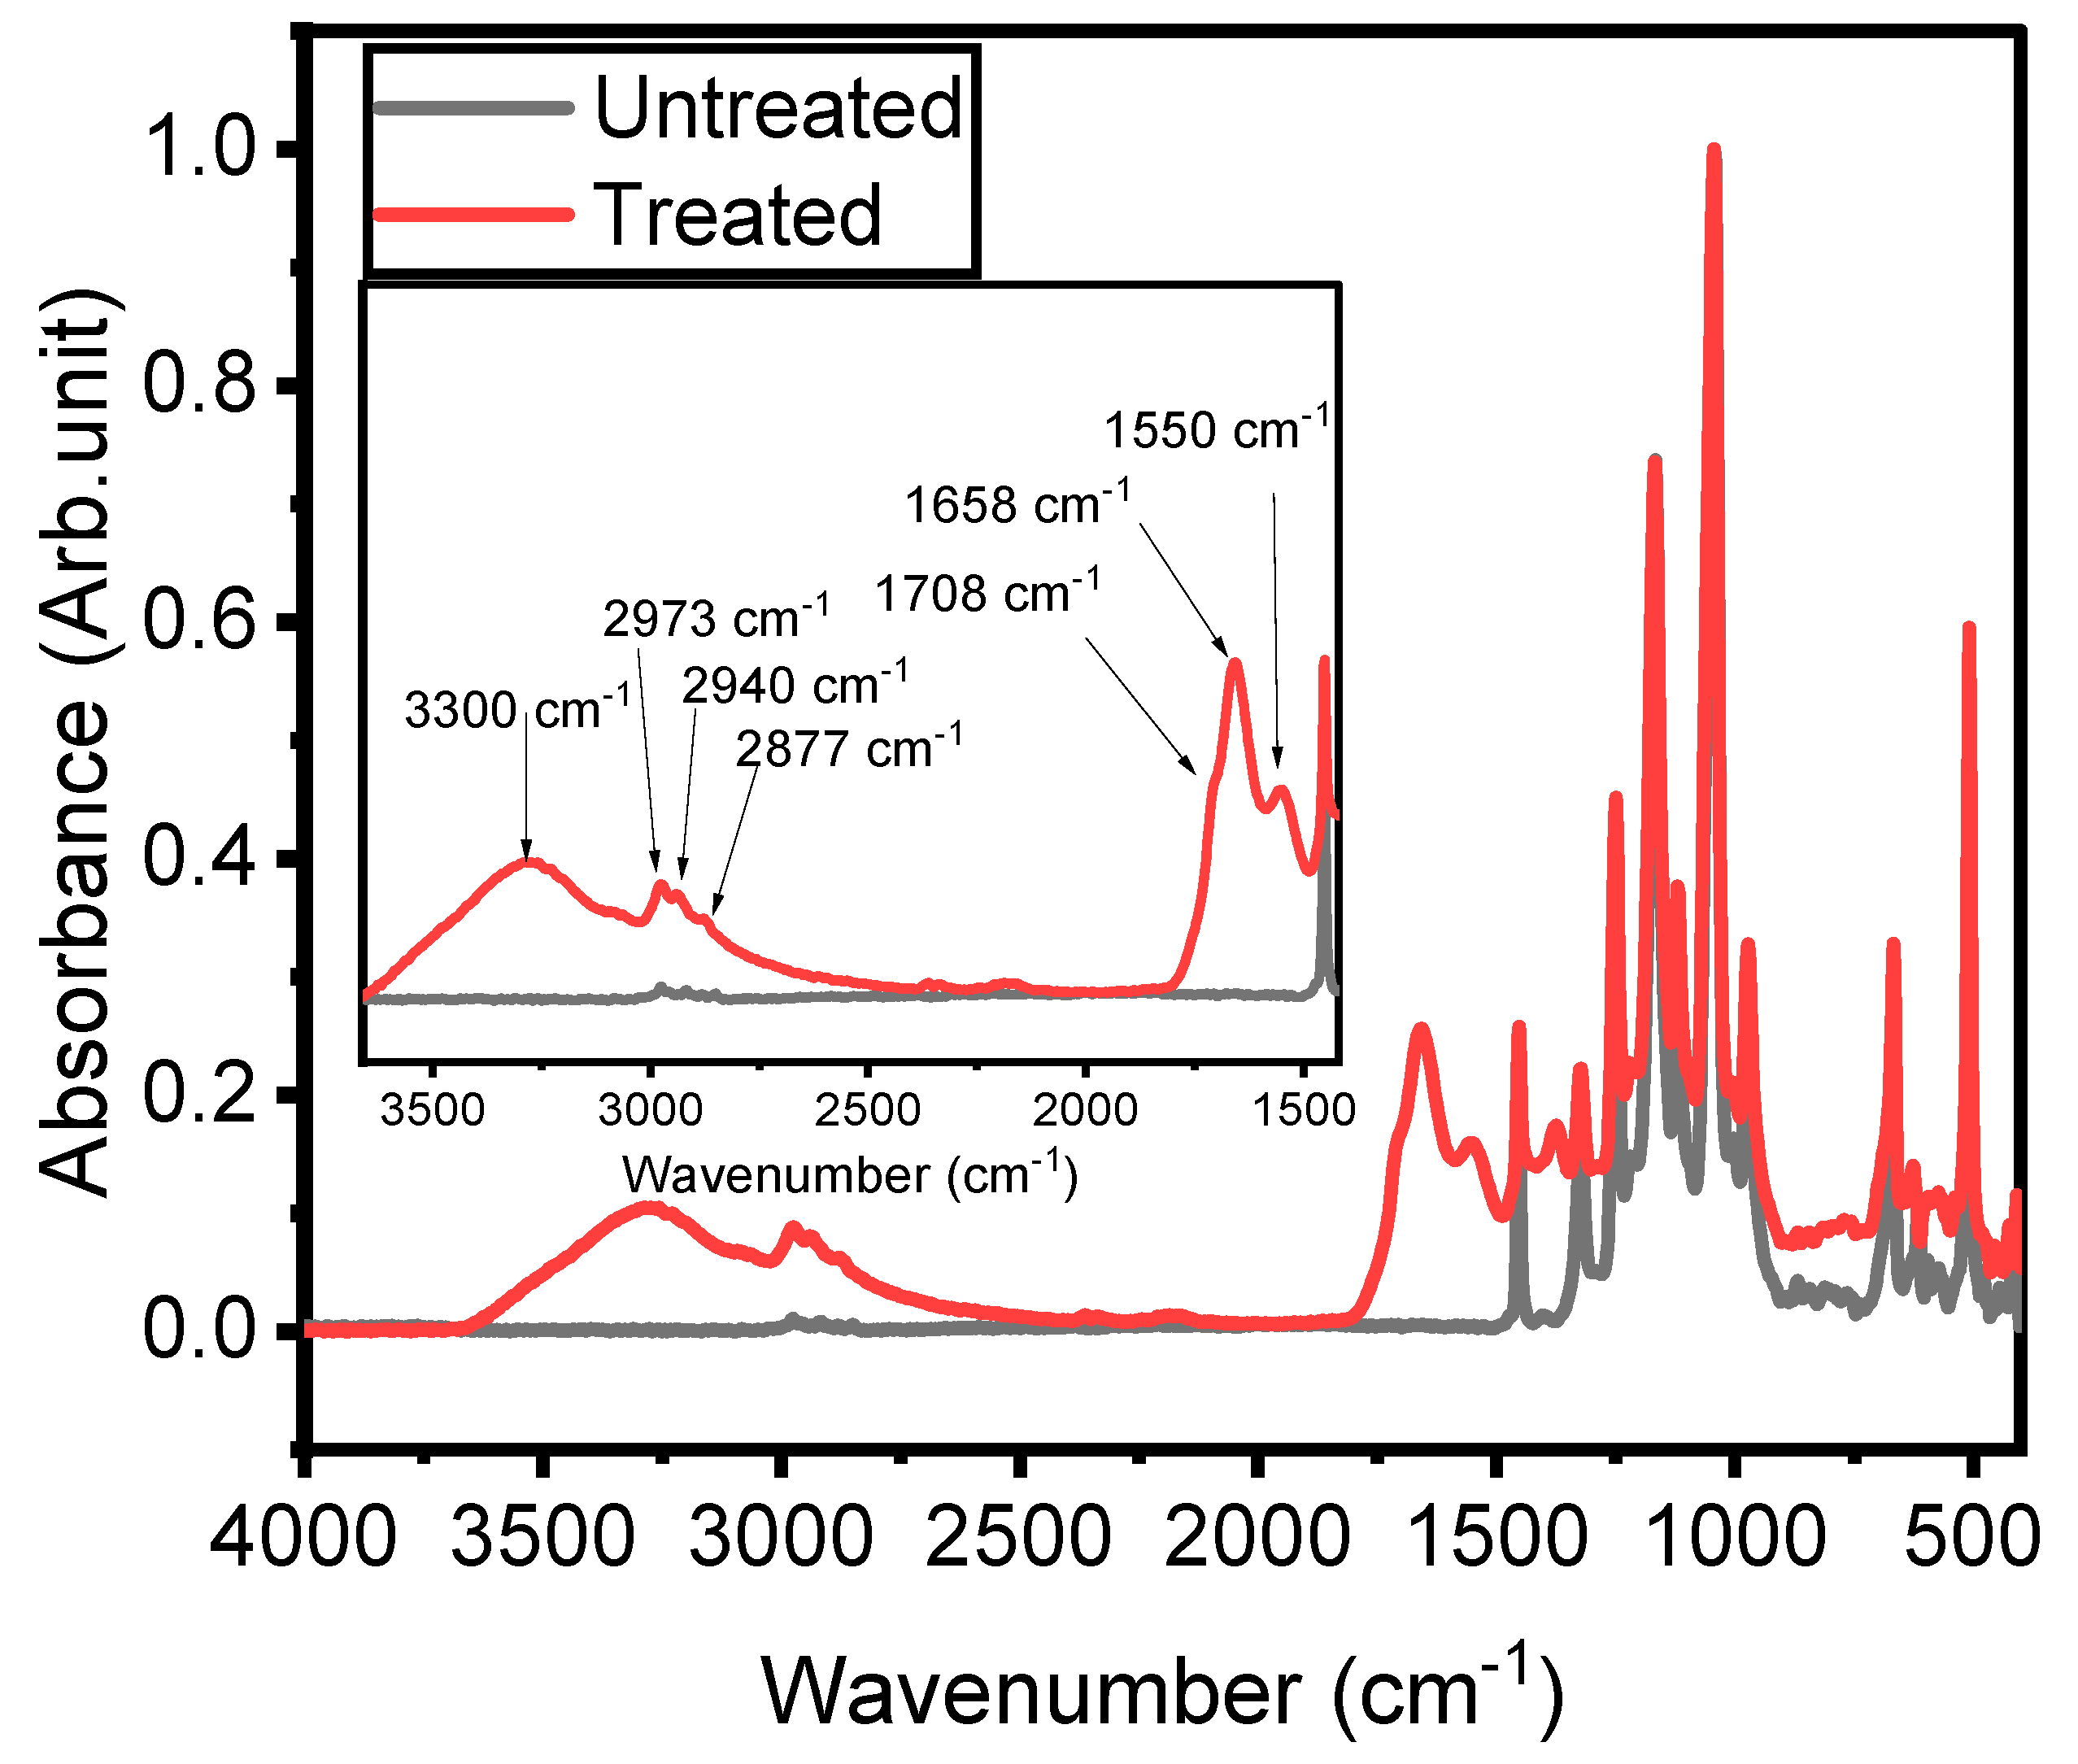
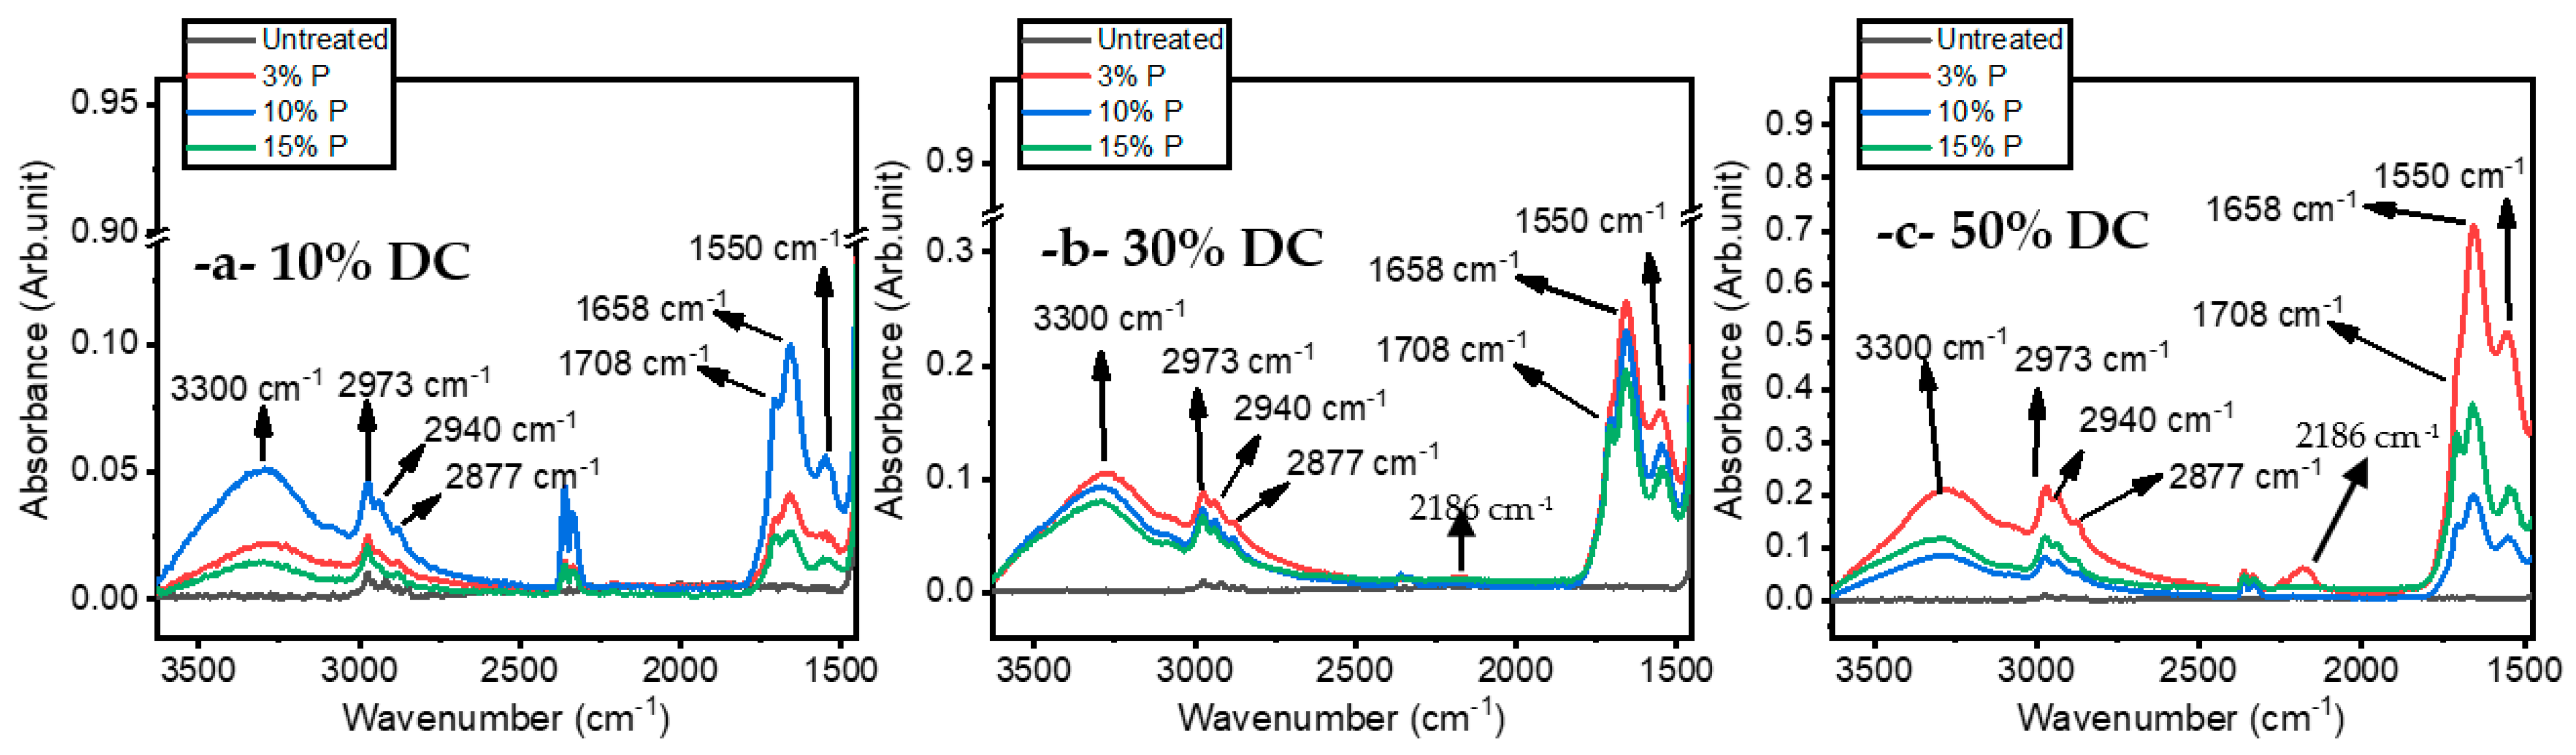
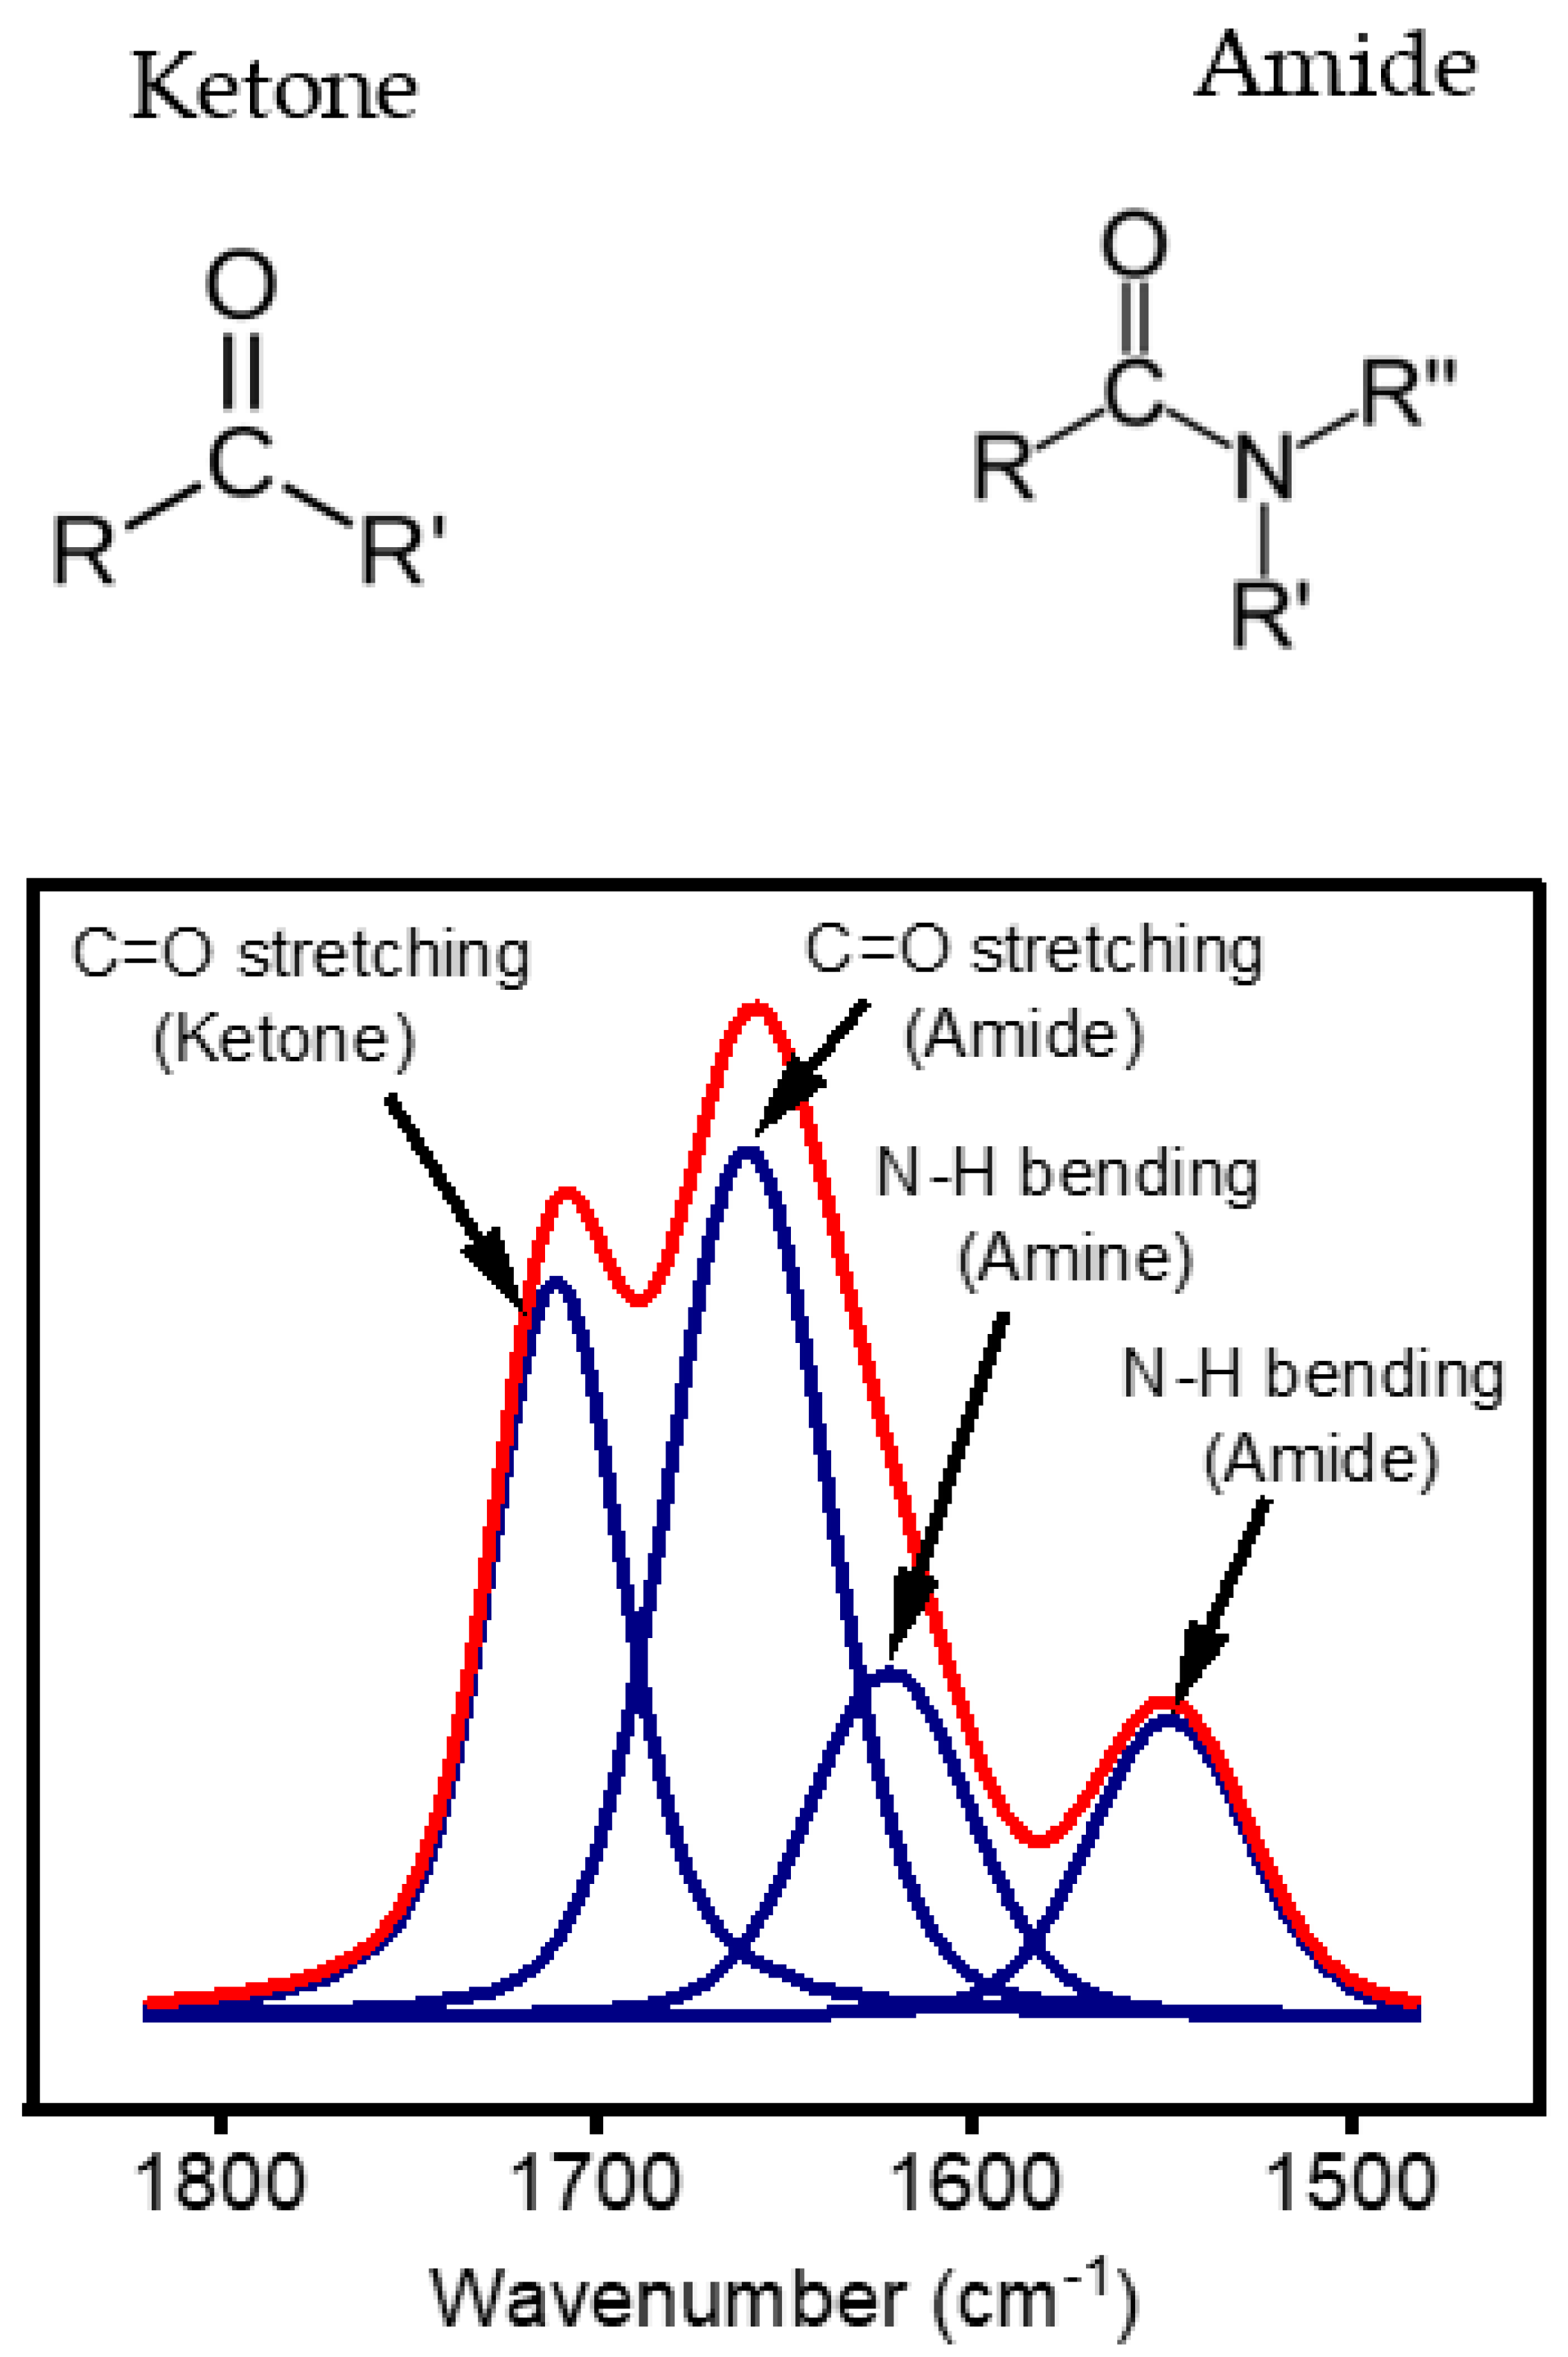
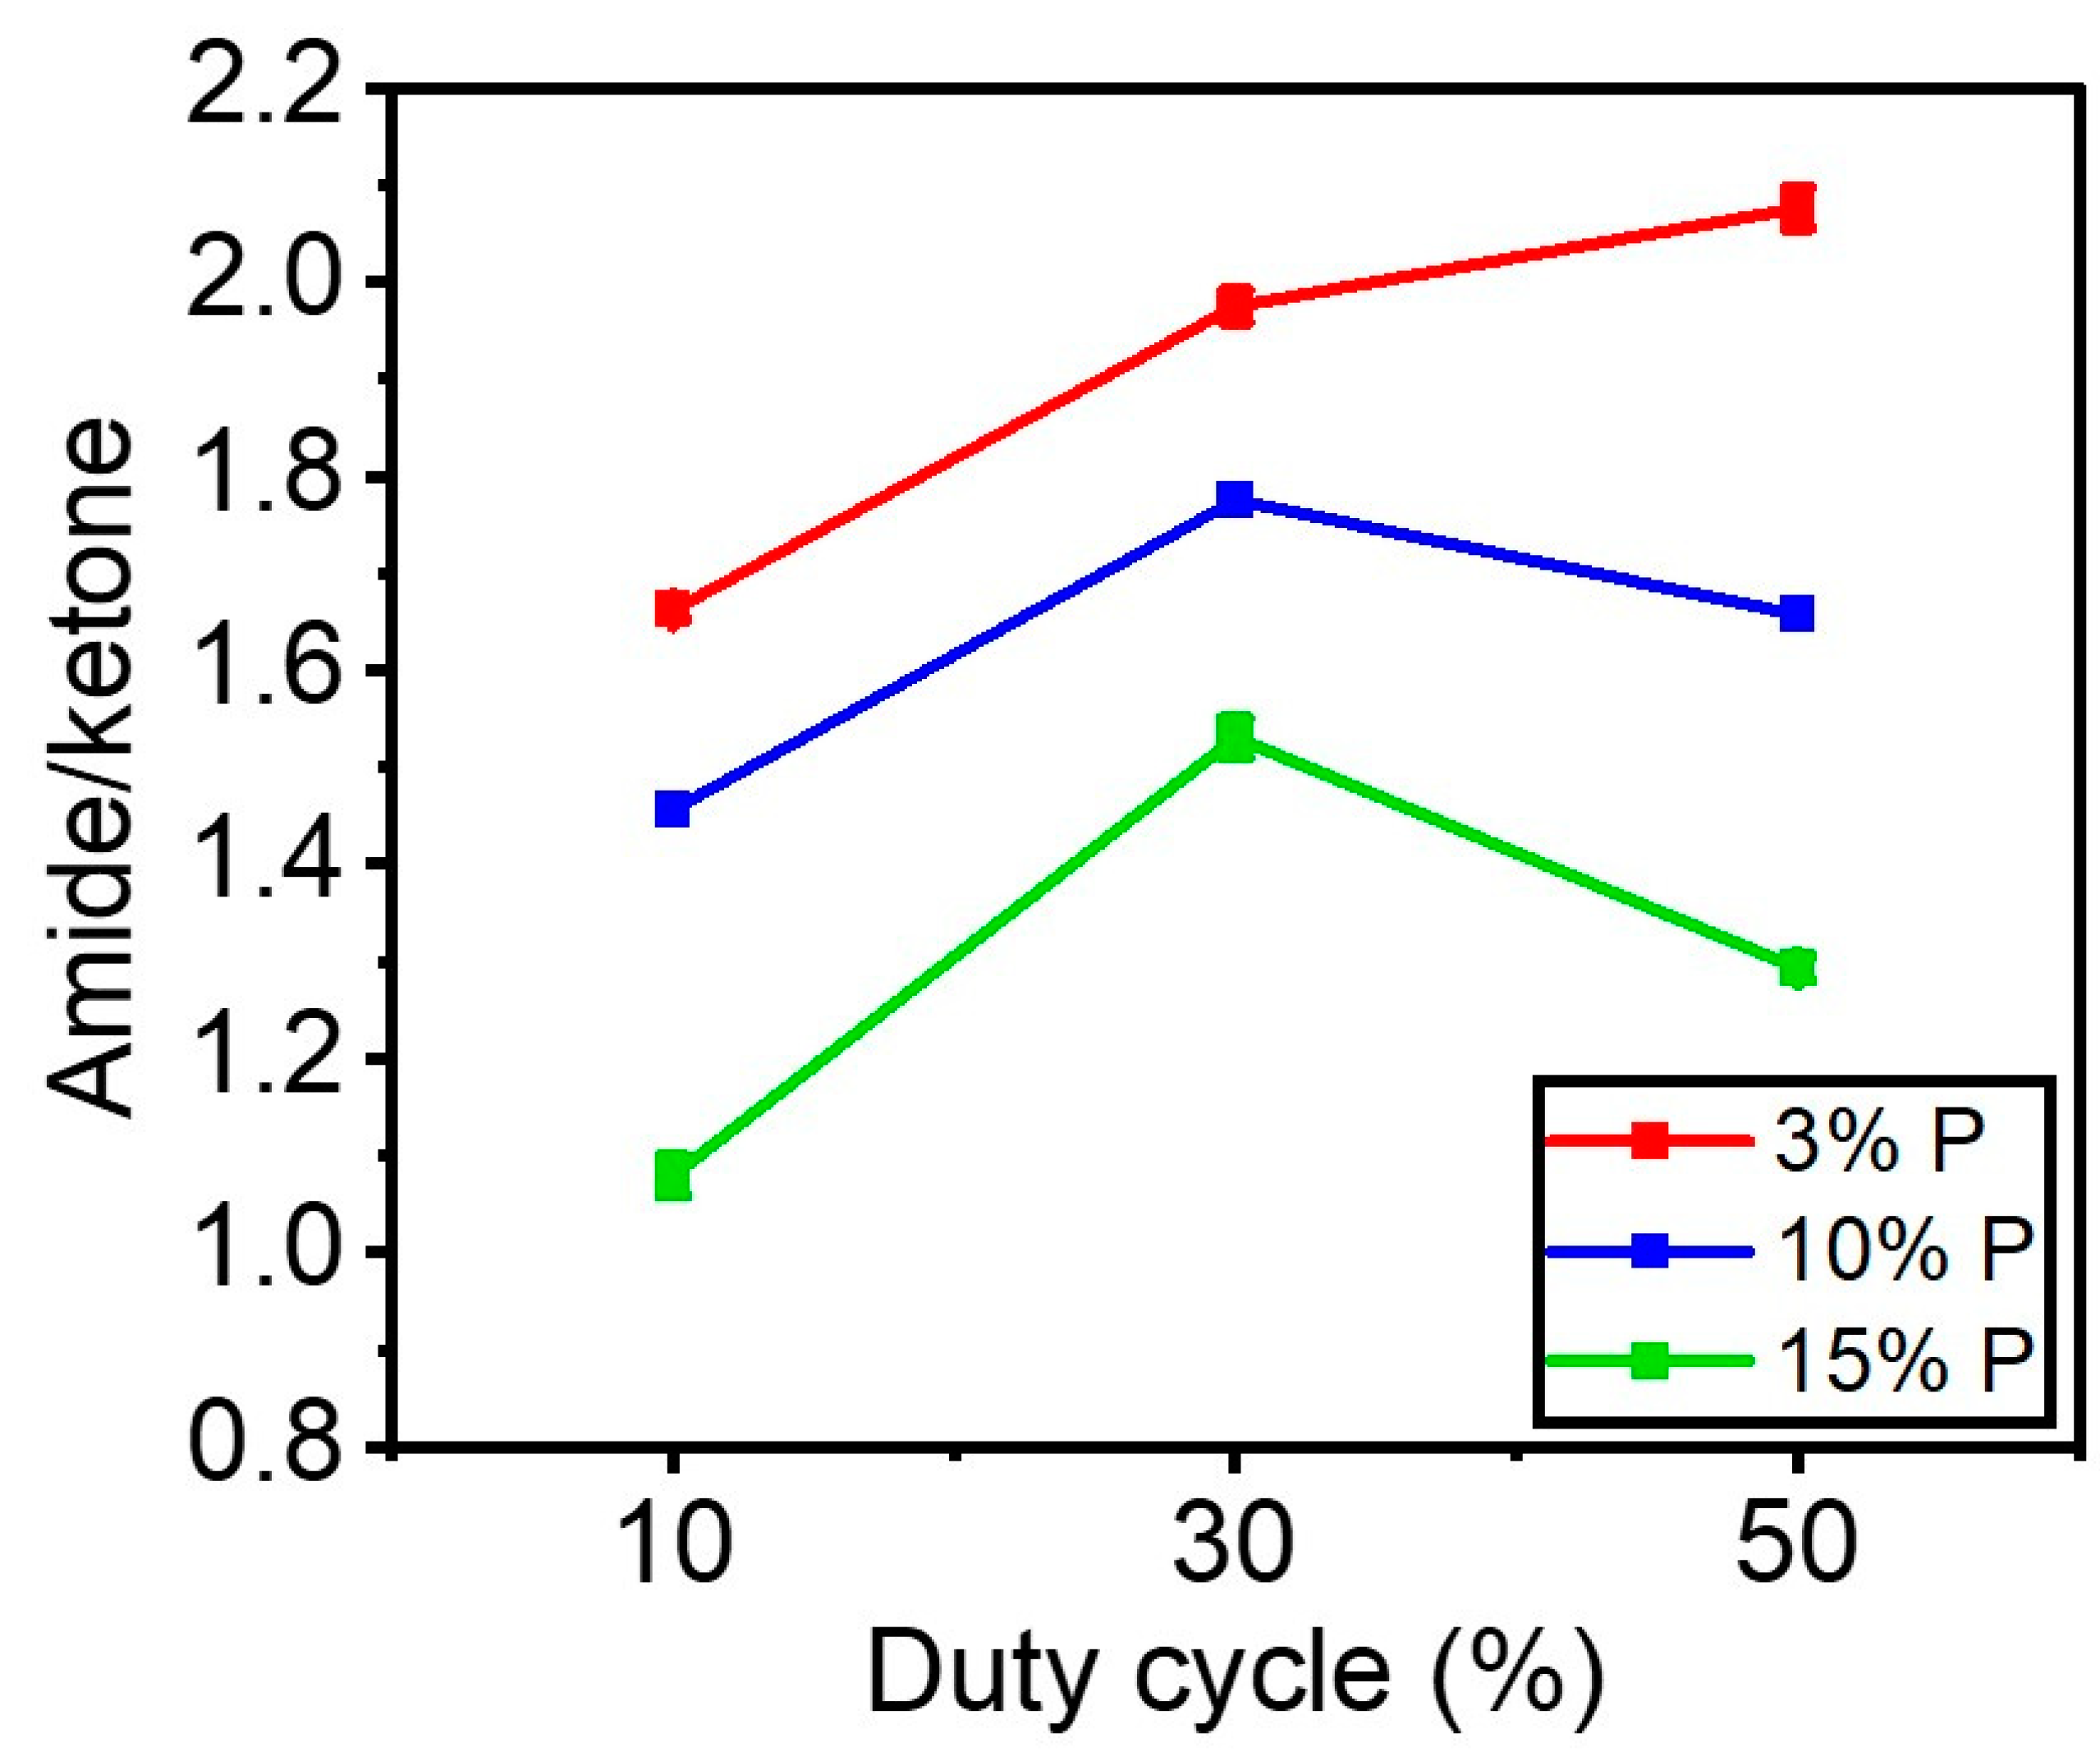
3.4. FTIR
4. Conclusions
Author Contributions
Funding
Institutional Review Board Statement
Informed Consent Statement
Data Availability Statement
Acknowledgments
Conflicts of Interest
References
- Cardoso, V.F.; Correia, D.M.; Ribeiro, C.; Fernandes, M.M.; Lanceros-Méndez, S. Fluorinated Polymers as Smart Materials for Advanced Biomedical Applications. Polymers 2018, 10, 161. [Google Scholar] [CrossRef] [PubMed]
- Boday, D.J. The State of Fluoropolymers. ACS Symp. Ser. 2012, 1106, 1–7. [Google Scholar]
- Siperko, L.M.; Thomas, R.R. Chemical and physical modification of fluoropolymer surfaces for adhesion enhancement: A review. J. Adhes. Sci. Technol. 1989, 3, 157–173. [Google Scholar] [CrossRef]
- Kusano, Y. Atmospheric pressure plasma processing for polymer adhesion: A review. J. Adhes. 2014, 90, 755–777. [Google Scholar] [CrossRef]
- Ma, C.; Nikiforov, A.; Hegemann, D.; De Geyter, N.; Morent, R.; Ostrikov, K. Plasma-controlled surface wettability: Recent advances and future applications. Int. Mater. Rev. 2022, 1–38. [Google Scholar] [CrossRef]
- Nemani, S.K.; Annavarapu, R.K.; Mohammadian, B.; Raiyan, A.; Heil, J.; Haque, M.A.; Abdelaal, A.; Sojoudi, H. Surface Modification of Polymers: Methods and Applications. Adv. Mater. Interfaces 2018, 5, 1801247. [Google Scholar] [CrossRef]
- Sarra-Bournet, C.; Turgeon, S.; Mantovani, D.; Laroche, G. Comparison of Atmospheric-Pressure Plasma versus Low-Pressure RF Plasma for Surface Functionalization of PTFE for Biomedical Applications. Plasma Process. Polym. 2006, 3, 506–515. [Google Scholar] [CrossRef]
- Galinski, H.; Leutenegger, D.; Amberg, M.; Krogh, F.; Schnabel, V.; Heuberger, M.; Spolenak, R.; Hegemann, D. Functional Coatings on High-Performance Polymer Fibers for Smart Sensing. Adv. Funct. Mater. 2020, 30, 1910555. [Google Scholar] [CrossRef]
- Morent, R.; De Geyter, N.; Verschuren, J.; De Clerck, K.; Kiekens, P.; Leys, C. Non-thermal plasma treatment of textiles. Surf. Coat. Technol. 2008, 202, 3427–3449. [Google Scholar] [CrossRef]
- Levasseur, O.; Gangwar, R.K.; Profili, J.; Naudé, N.; Gherardi, N.; Stafford, L. Influence of substrate outgassing on the plasma properties during wood treatment in He dielectric barrier discharges at atmospheric pressure. Plasma Process. Polym. 2016, 14, 1600172. [Google Scholar] [CrossRef]
- De Mejanes, N.; Profili, J.; Babaei, S.; Naudé, N.; Stafford, L. Refined analysis of current–voltage characteristics in Townsend dielectric barrier discharges in nitrogen at atmospheric pressure. J. Phys. D Appl. Phys. 2020, 54, 095204. [Google Scholar] [CrossRef]
- Fridman, A.; Gutsol, A.; Cho, Y.I. Non-thermal atmospheric pressure plasma. Adv. Heat Transf. 2007, 40, 1–142. [Google Scholar]
- Schuman, T.; Wolf, R.A. Effects of a DBD plasma discharge on bond strength. Surf. Interfaces 2020, 18, 100461. [Google Scholar] [CrossRef]
- Hegemann, D.; Hossain, M.-M. Influence of Non-Polymerizable Gases Added During Plasma Polymerization. Plasma Process. Polym. 2005, 2, 554–562. [Google Scholar] [CrossRef]
- Osada, Y. Plasma polymerization and plasma treatment of polymers. Review. Polym. Sci. USSR 1988, 30, 1922–1941. [Google Scholar] [CrossRef]
- Herbert, P.A.F.; O’Neill, L.; Jaroszyńska-Wolińska, J. Soft Plasma Polymerization of Gas State Precursors from an Atmospheric Pressure Corona Plasma Discharge. Chem. Mater. 2009, 21, 4401–4407. [Google Scholar] [CrossRef]
- Levasseur, O.; Profili, j.; Gangwar, R.K.; Naudé, N.; Clergereaux, R.; Gherardi, N.; Stafford, L. Experimental and modelling study of organization phenomena in dielectric barrier discharges with struc-turally inhomogeneous wood substrates. Plasma Sources Sci. Technol. 2014, 23, 054006. [Google Scholar] [CrossRef]
- Babaei, S.; Profili, J.; Asadollahi, S.; Sarkassian, A.; Dorris, A.; Beck, S.; Stafford, L. Analysis of transport phenomena during plasma deposition of hydrophobic coatings on porous cellulosic substrates in plane-to-plane dielectric barrier discharges at atmospheric pressure. Plasma Process. Polym. 2020, 17, 2000091. [Google Scholar] [CrossRef]
- Durán, I.R.; Profili, J.; Stafford, L.; Laroche, G. Response surface methodology as a predictive tool for the fabrication of coatings with optimal anti-fogging performance. Thin Solid Films 2020, 718, 138482. [Google Scholar] [CrossRef]
- Macgregor, M.; Vasilev, K. Perspective on Plasma Polymers for Applied Biomaterials Nanoengineering and the Recent Rise of Oxazolines. Materials 2019, 12, 191. [Google Scholar] [CrossRef]
- Tatoulian, M.; Arefi-Khonsari, F.; Borra, J.-P. Deposition of Organic Coatings at Atmospheric Pressure from Liquid Precursors. Plasma Process. Polym. 2007, 4, 360–369. [Google Scholar] [CrossRef]
- Profili, J.; Durocher-Jean, A.; Rodríguez, I.; Laroche, G.; Stafford, L. The role of the atmospheric-pressure dielectric barrier discharge regime on the fragmentation of a cyclic siloxane precursor. Int. Symp. High Press. Low Temp. Plasma Chem. 2017, 3–7. [Google Scholar]
- Hegemann, D.; Körner, E.; Guimond, S. Plasma Polymerization of Acrylic Acid Revisited. Plasma Process. Polym. 2009, 6, 246–254. [Google Scholar] [CrossRef]
- Savage, C.R.; Timmons, R.B.; Lin, J.W. Molecular control of surface film compositions via pulsed radio-frequency plasma deposition of perfluoropropylene oxide. Chem. Mater. 1991, 3, 575–577. [Google Scholar] [CrossRef]
- Denis, L.; Marsal, P.; Olivier, Y.; Godfroid, T.; Lazzaroni, R.; Hecq, M.; Cornil, J.; Snyders, R. Deposition of Functional Organic Thin Films by Pulsed Plasma Polymerization: A Joint Theoretical and Experimental Study. Plasma Process. Polym. 2009, 7, 172–181. [Google Scholar] [CrossRef]
- Sarra-Bournet, C.; Gherardi, N.; Glénat, H.; Laroche, G.; Massines, F. Effect of C 2H 4/N 2 ratio in an atmospheric pressure dielectric barrier discharge on the plasma deposition of hydrogenated amorphous carbon-nitride films (a-C:N:H). Plasma Chem. Plasma Process. 2010, 30, 213–239. [Google Scholar] [CrossRef]
- Gélinas, A.; Laurent, M.; Laroche, G. Electrode cleanliness impact on the surface treatment of fluoropolymer films for a long-lasting plasma process. Manuf. Lett. 2020, 26, 28. [Google Scholar] [CrossRef]
- Fowkes, F.M. ATTRACTIVE FORCES AT INTERFACES. Ind. Eng. Chem. 1964, 56, 40–52. [Google Scholar] [CrossRef]
- Hansen, F.K. The measurement of surface energy of polymers by means of contact angles of liquids on solid surfaces. Univ. Oslo 2004.
- Atanasov, V.; Kerres, J. ETFE-g-pentafluorostyrene: Functionalization and proton conductivity. Eur. Polym. J. 2015, 63, 168–176. [Google Scholar] [CrossRef]
- Laurent, M.; Koehler, J.; Sabbatier, G.; Hoesli, C.A.; Gherardi, N.; Laroche, G. Atmospheric Pressure Plasma Polymer of Ethyl Lactate: In Vitro Degradation and Cell Viability Studies. Plasma Process. Polym. 2016, 13, 711–721. [Google Scholar] [CrossRef]
- Mertens, J.; Baneton, J.; Ozkan, A.; Pospisilova, E.; Nysten, B.; Delcorte, A.; Reniers, F. Atmospheric pressure plasma polymerization of organics: Effect of the presence and position of double bonds on polymerization mechanisms, plasma stability and coating chemistry. Thin Solid Films 2019, 671, 64–76. [Google Scholar] [CrossRef]
- Kim, J.S.; Friend, R.H.; Cacialli, F. Surface energy and polarity of treated indium–tin–oxide anodes for polymer light-emitting diodes studied by contact-angle measurements. J. Appl. Phys. 1999, 86, 2774–2778. [Google Scholar] [CrossRef]
- Airoudj, A.; Schrodj, G.; Vallat, M.-F.; Fioux, P.; Roucoules, V. Influence of plasma duty cycle during plasma polymerization in adhesive bonding. Int. J. Adhes. Adhes. 2011, 31, 498–506. [Google Scholar] [CrossRef]
- Vallade, J.; Turgeon, S.; Laroche, G. Partial Least-Squares Regression as a Tool to Predict Fluoropolymer Surface Modification by Dielectric Barrier Discharge in a Corona Process Configuration in a Nitrogen-Organic Gaseous Precursor Environment. Ind. Eng. Chem. Res. 2018, 57, 7476–7485. [Google Scholar] [CrossRef]
- Beck, A.J.; Short, R.D.; Matthews, A. Surface & Coatings Technology Deposition of functional coatings from acrylic acid and octamethylcyclotetrasiloxane onto steel using an atmospheric pressure dielectric barrier discharge. Surf. Coat. Technol. 2008, 203, 822–825. [Google Scholar]
- Drabik, M.; Celma, C.; Kousal, J.; Biederman, H.; Hegemann, D. Properties of a-C:H:O plasma polymer films deposited from acetone vapors. Thin Solid Films 2014, 573, 27–32. [Google Scholar] [CrossRef]
- Gravis, D.; Moisan, S.; Poncin-Epaillard, F. Characterization of surface physico-chemistry and morphology of plasma-sized carbon fiber. Thin Solid Films 2021, 721, 138555. [Google Scholar] [CrossRef]
- Shaw, D.; West, A.; Bredin, J.; Wagenaars, E. Mechanisms behind surface modification of polypropylene film using an at-mospheric-pressure plasma jet. Plasma Sources Sci. Technol. 2016, 25, 065018. [Google Scholar] [CrossRef]
- Dubreuil, M.; Bongaers, E.; Lens, P. Incorporation of amino moieties through atmospheric pressure plasma: Relationship between precursor structure and coating properties. Surf. Coat. Technol. 2011, 206, 1439–1448. [Google Scholar] [CrossRef]
- Fricke, K.; Girard-Lauriault, P.-L.; Weltmann, K.-D.; Wertheimer, M.R. Plasma polymers deposited in atmospheric pressure dielectric barrier discharges: Influence of process parameters on film properties. Thin Solid Films 2016, 603, 119–125. [Google Scholar] [CrossRef]
- Myung, S.W.; Suk, H. Chemical structure and surface morphology of plasma polymerized-allylamine film. Korean J. Chem. Eng. 2006, 23, 505–511. [Google Scholar] [CrossRef]
- Ruscic, B. Active Thermochemical Tables: Sequential Bond Dissociation Enthalpies of Methane, Ethane, and Methanol and the Related Thermochemistry. J. Phys. Chem. A 2015, 119, 7810–7837. [Google Scholar] [CrossRef]
- Sadat, A.; Joye, I.J. Peak Fitting Applied to Fourier Transform Infrared and Raman Spectroscopic Analysis of Proteins. Appl. Sci. 2020, 10, 5918. [Google Scholar] [CrossRef]
- Gordeev, I.; Choukourov, A.; Šimek, M.; Prukner, V.; Biederman, H.; Shukurov, A. PEO-like Plasma Polymers Prepared by Atmospheric Pressure Surface Dielectric Barrier Discharge. Plasma Process. Polym. 2012, 9, 782–791. [Google Scholar] [CrossRef]
- Choukourov, A.; Biederman, H.; Kholodkov, I.; Slavinska, D.; Trchova, M.; Hollander, A. Properties of amine-containing coatings prepared by plasma polymerization. J. Appl. Polym. Sci. 2004, 92, 979–990. [Google Scholar] [CrossRef]
- Rodrigues, A.; Tatibouët, J.-M.; Fourré, E. Operando DRIFT Spectroscopy Characterization of Intermediate Species on Catalysts Surface in VOC Removal from Air by Non-thermal Plasma Assisted Catalysis. Plasma Chem. Plasma Process. 2016, 36, 901–915. [Google Scholar] [CrossRef]
- Gengenbach, T.R.; Griesser, H. Aging of 1,3-diaminopropane plasma-deposited polymer films: Mechanisms and reaction pathways. J. Polym. Sci. Part A: Polym. Chem. 1999, 37, 2191–2206. [Google Scholar] [CrossRef]
- Guerra, V.; Sá, P.A.; Loureiro, J. Role played by the N2(A 3Σu+) metastable in stationary N2 and N2-O2 discharges. J. Phys. D Appl. Phys. 2001, 34, 1745–1755. [Google Scholar] [CrossRef]
- Winter, L.R.; Chen, J.G. N2 Fixation by Plasma-Activated Processes. Joule 2020, 5, 300–315. [Google Scholar] [CrossRef]


| Voltage (kV) | Frequency (kHz) | Total Gas Flow (SLM) | Gap (mm) | Treatment Duration (s) | Duty Cycle (%) | Power (W.cm−2) | Precursor (%) | Precursor Amount (gr.h−1) |
|---|---|---|---|---|---|---|---|---|
| 11 | 5 | 5 | 1 | 180 | 10% 30% 50% | 0.17 0.51 0.91 | 3% 10% 15% | 18 60 91 |
| DC (%) | Precursor (%) | 285 eV C—C/C—H | 286.5 eV C—N/C—O | 288.4 eV C=O |
|---|---|---|---|---|
| 10 | 3 | 61± 1 | 23 ± 1 | 13 ± 1 |
| 10 | 67 ± 1 | 13 ± 1 | 19 ± 1 | |
| 15 | 63 ± 1 | 20 ± 2 | 17 ± 1 | |
| 30 | 3 | 68 ± 0.5 | 14 ± 1 | 16 ± 0.5 |
| 10 | 64 ± 2 | 21 ± 1 | 15 ± 1 | |
| 15 | 67 ± 1 | 19 ± 3 | 13 ± 2 | |
| 50 | 3 | 62 ± 1 | 26.5 ± 0.5 | 12 ± 2 |
| 10 | 69 ± 1 | 15.5 ± 0.5 | 16 ± 1 | |
| 15 | 72 ± 2 | 15± 2 | 13.5 ± 0.5 |
| Band Position (cm−1) | Vibrational Mode | Comment |
|---|---|---|
| 1550 | Stretching, ν N-H | in amine/amide |
| 1660 | C=O | in amide |
| 1710 | C=O | in ketone |
| 2870–2970 | CHx | in CHx (x = 2, 3) |
| 3200–3550 | O-H | intermolecular bonded |
| 3310–3350 | Stretching N-H | in amine/amide |
Disclaimer/Publisher’s Note: The statements, opinions and data contained in all publications are solely those of the individual author(s) and contributor(s) and not of MDPI and/or the editor(s). MDPI and/or the editor(s) disclaim responsibility for any injury to people or property resulting from any ideas, methods, instructions or products referred to in the content. |
© 2023 by the authors. Licensee MDPI, Basel, Switzerland. This article is an open access article distributed under the terms and conditions of the Creative Commons Attribution (CC BY) license (https://creativecommons.org/licenses/by/4.0/).
Share and Cite
Fotouhiardakani, F.; Laurent, M.; Profili, J.; Ravichandran, S.; Dorairaju, G.; Laroche, G. Fragmentation Mechanism in a Nitrogen Dielectric Barrier Discharge Plasma on Fluoropolymer Polymer Films. Materials 2023, 16, 942. https://doi.org/10.3390/ma16030942
Fotouhiardakani F, Laurent M, Profili J, Ravichandran S, Dorairaju G, Laroche G. Fragmentation Mechanism in a Nitrogen Dielectric Barrier Discharge Plasma on Fluoropolymer Polymer Films. Materials. 2023; 16(3):942. https://doi.org/10.3390/ma16030942
Chicago/Turabian StyleFotouhiardakani, Faegheh, Morgane Laurent, Jacopo Profili, Sethumadhavan Ravichandran, Gowri Dorairaju, and Gaetan Laroche. 2023. "Fragmentation Mechanism in a Nitrogen Dielectric Barrier Discharge Plasma on Fluoropolymer Polymer Films" Materials 16, no. 3: 942. https://doi.org/10.3390/ma16030942
APA StyleFotouhiardakani, F., Laurent, M., Profili, J., Ravichandran, S., Dorairaju, G., & Laroche, G. (2023). Fragmentation Mechanism in a Nitrogen Dielectric Barrier Discharge Plasma on Fluoropolymer Polymer Films. Materials, 16(3), 942. https://doi.org/10.3390/ma16030942