

Application of Digital Image Correlation to Evaluate Strain, Stiffness and Ductility of Full-Scale LVL Beams Strengthened by CFRP


Abstract
:1. Introduction
2. Materials and Methods
2.1. Materials
2.1.1. Laminated Veneer Lumber
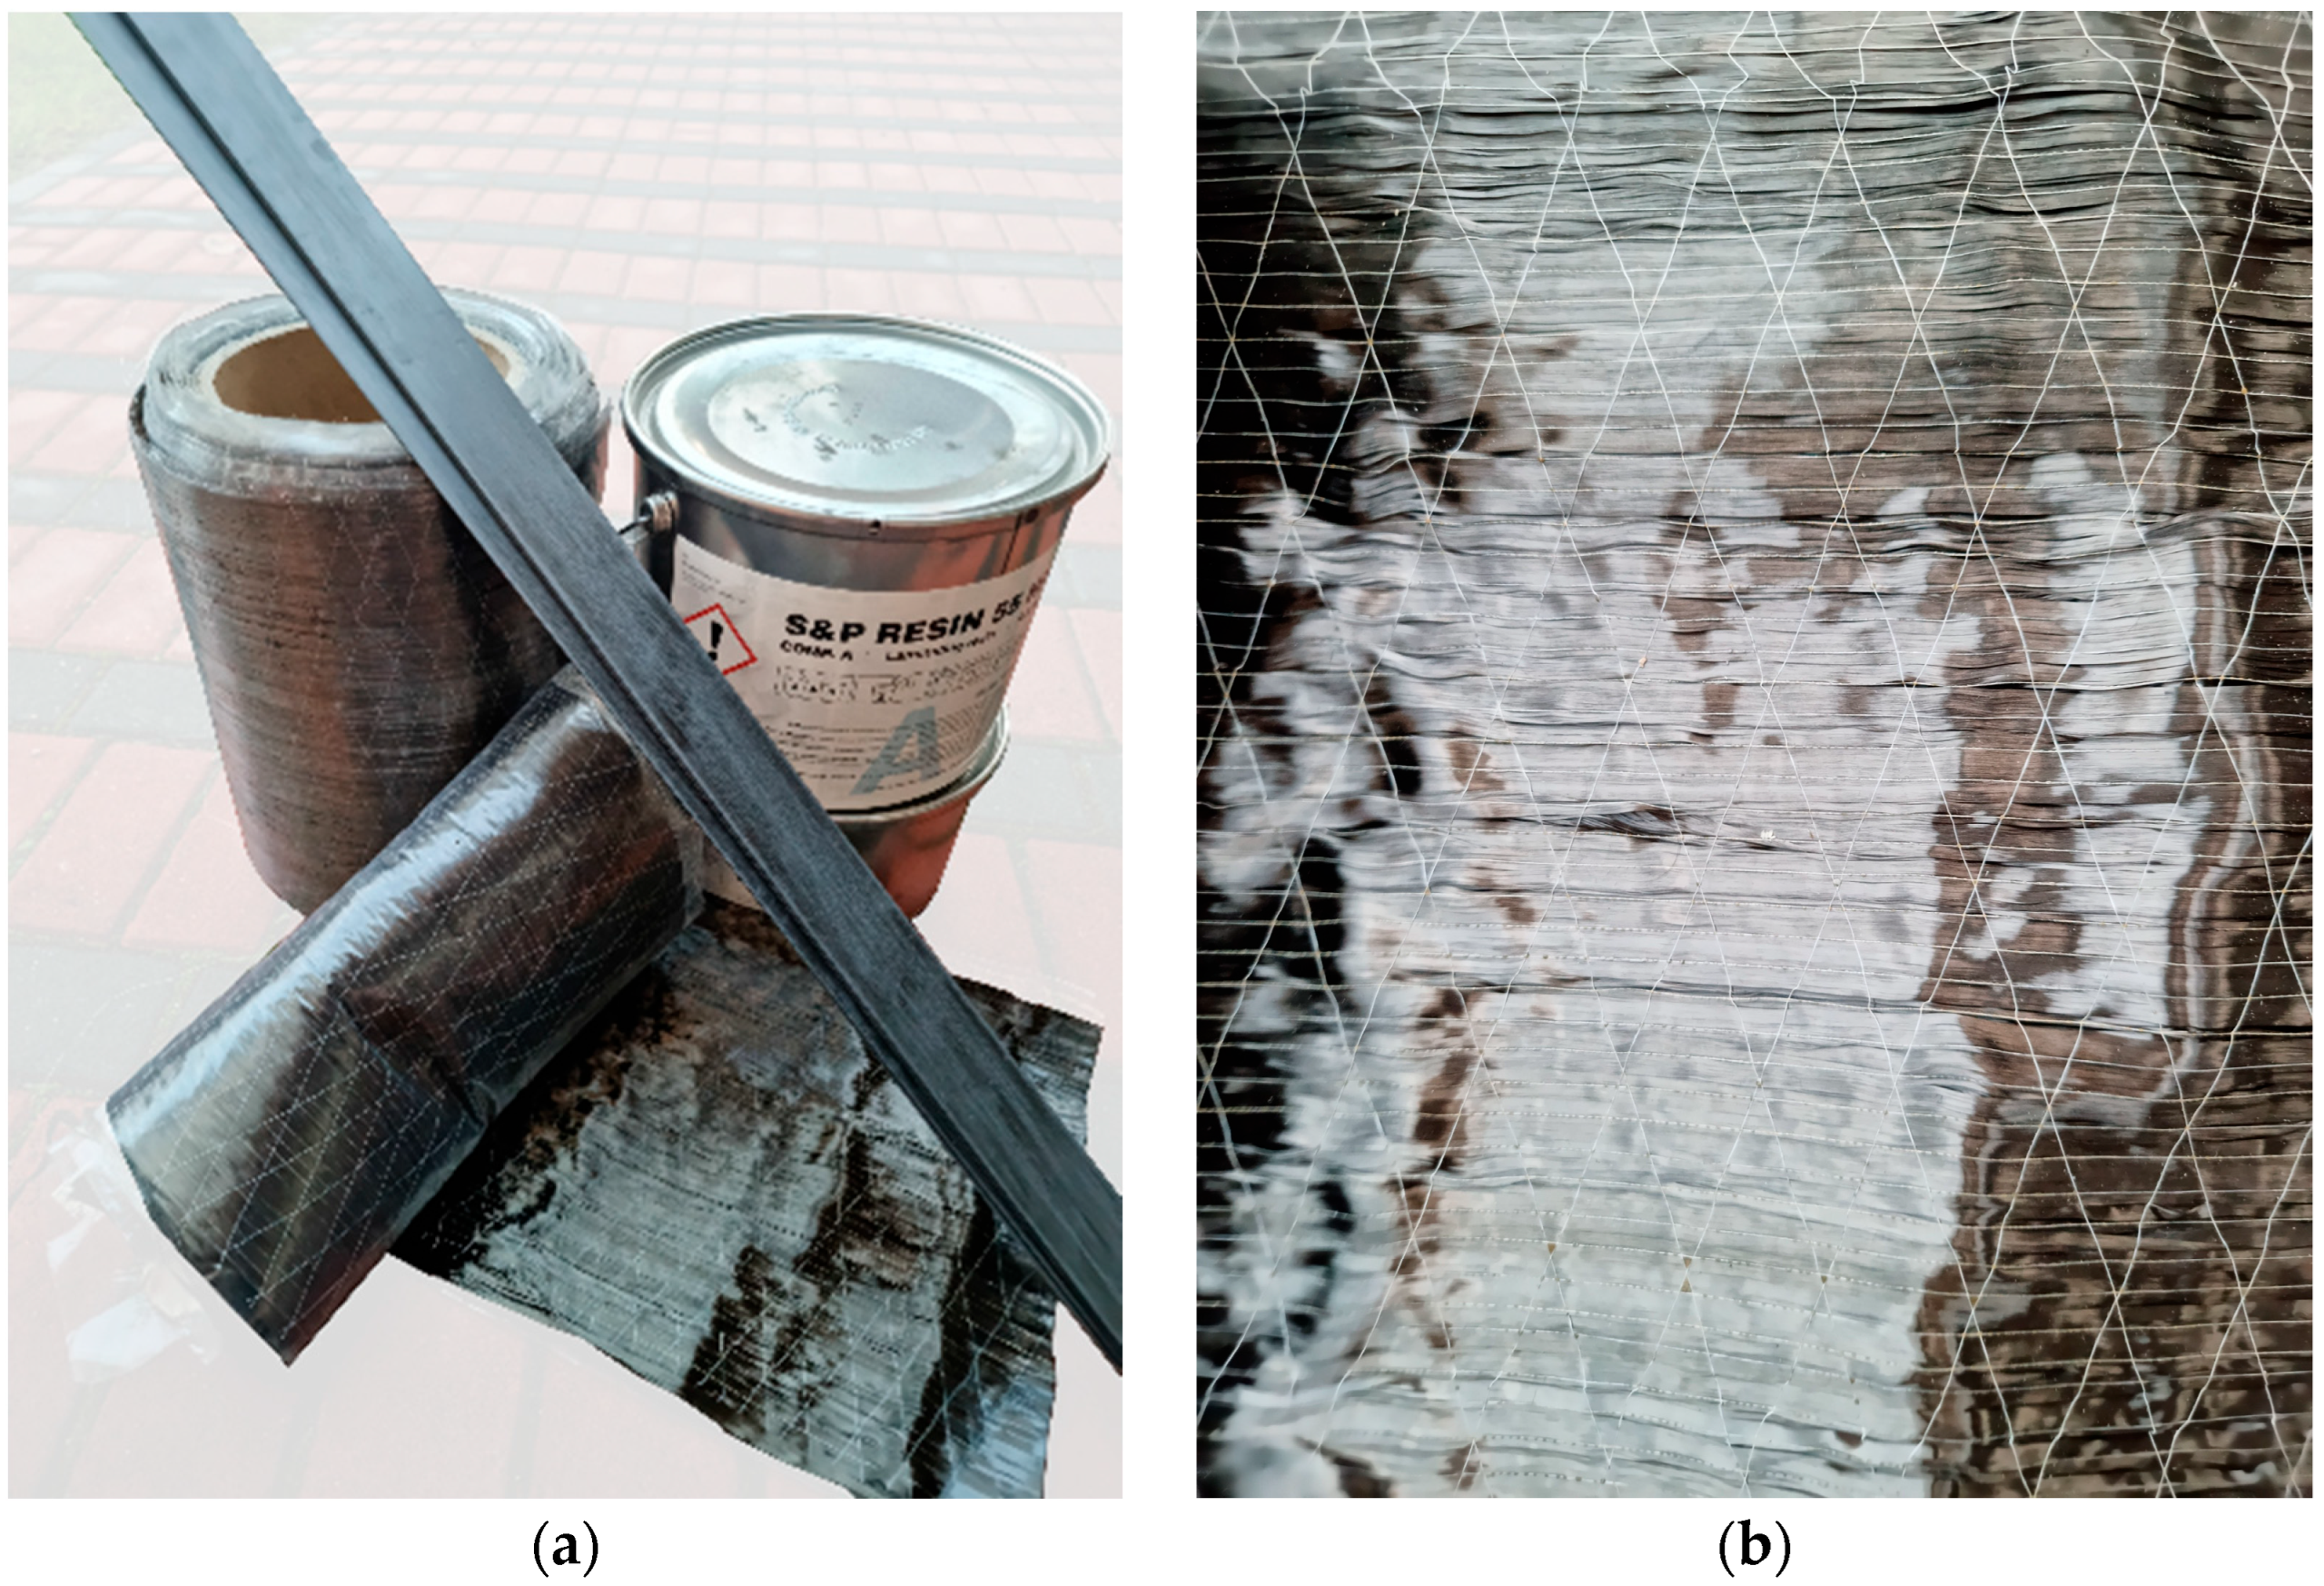
2.1.2. Carbon Fiber Reinforced Polymer
2.1.3. Epoxy Resin
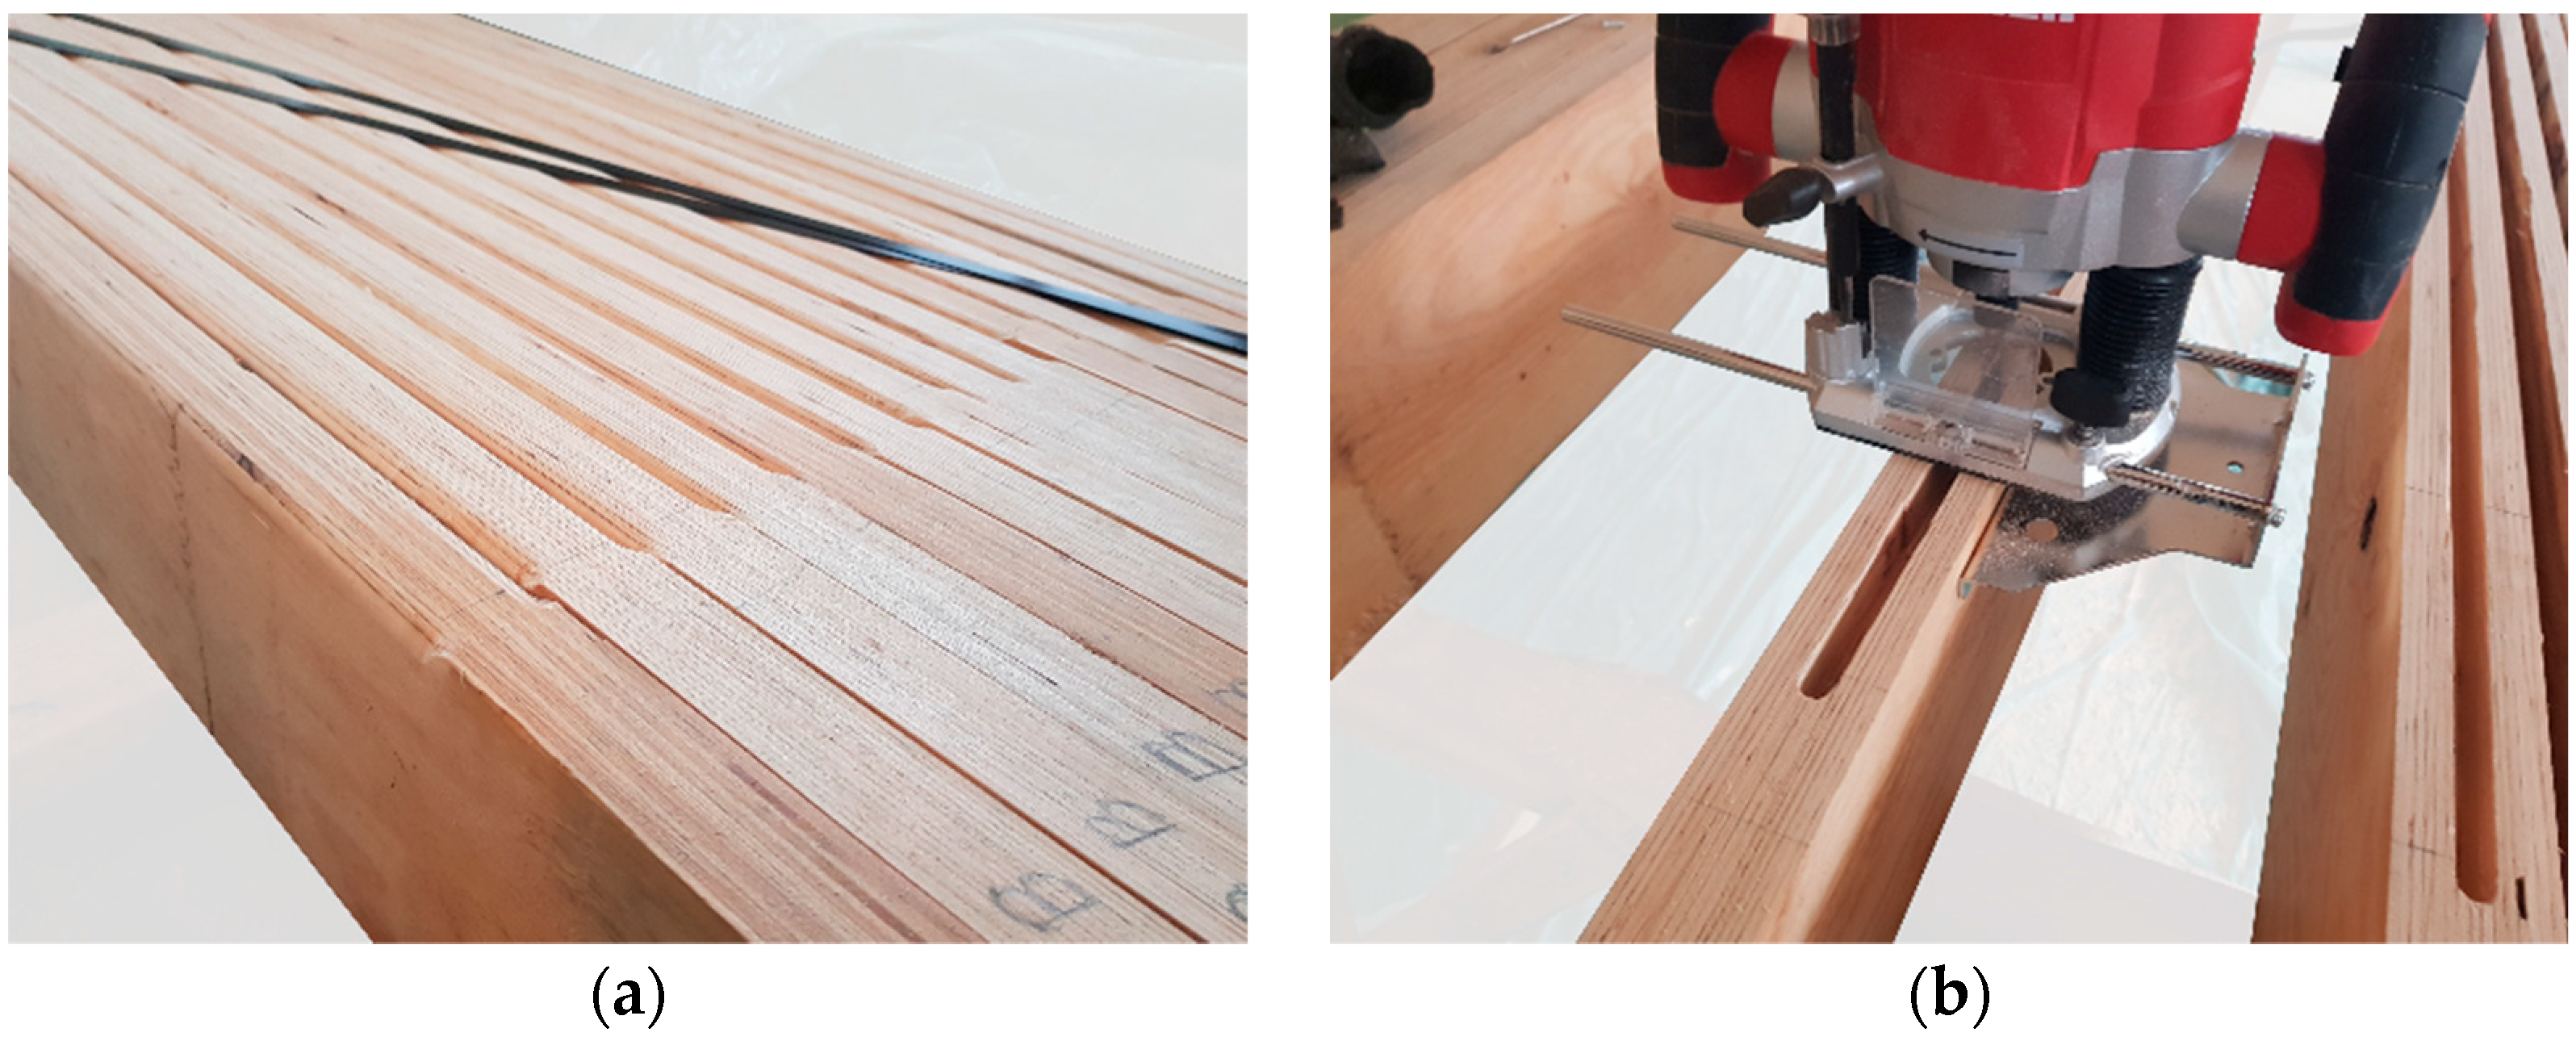
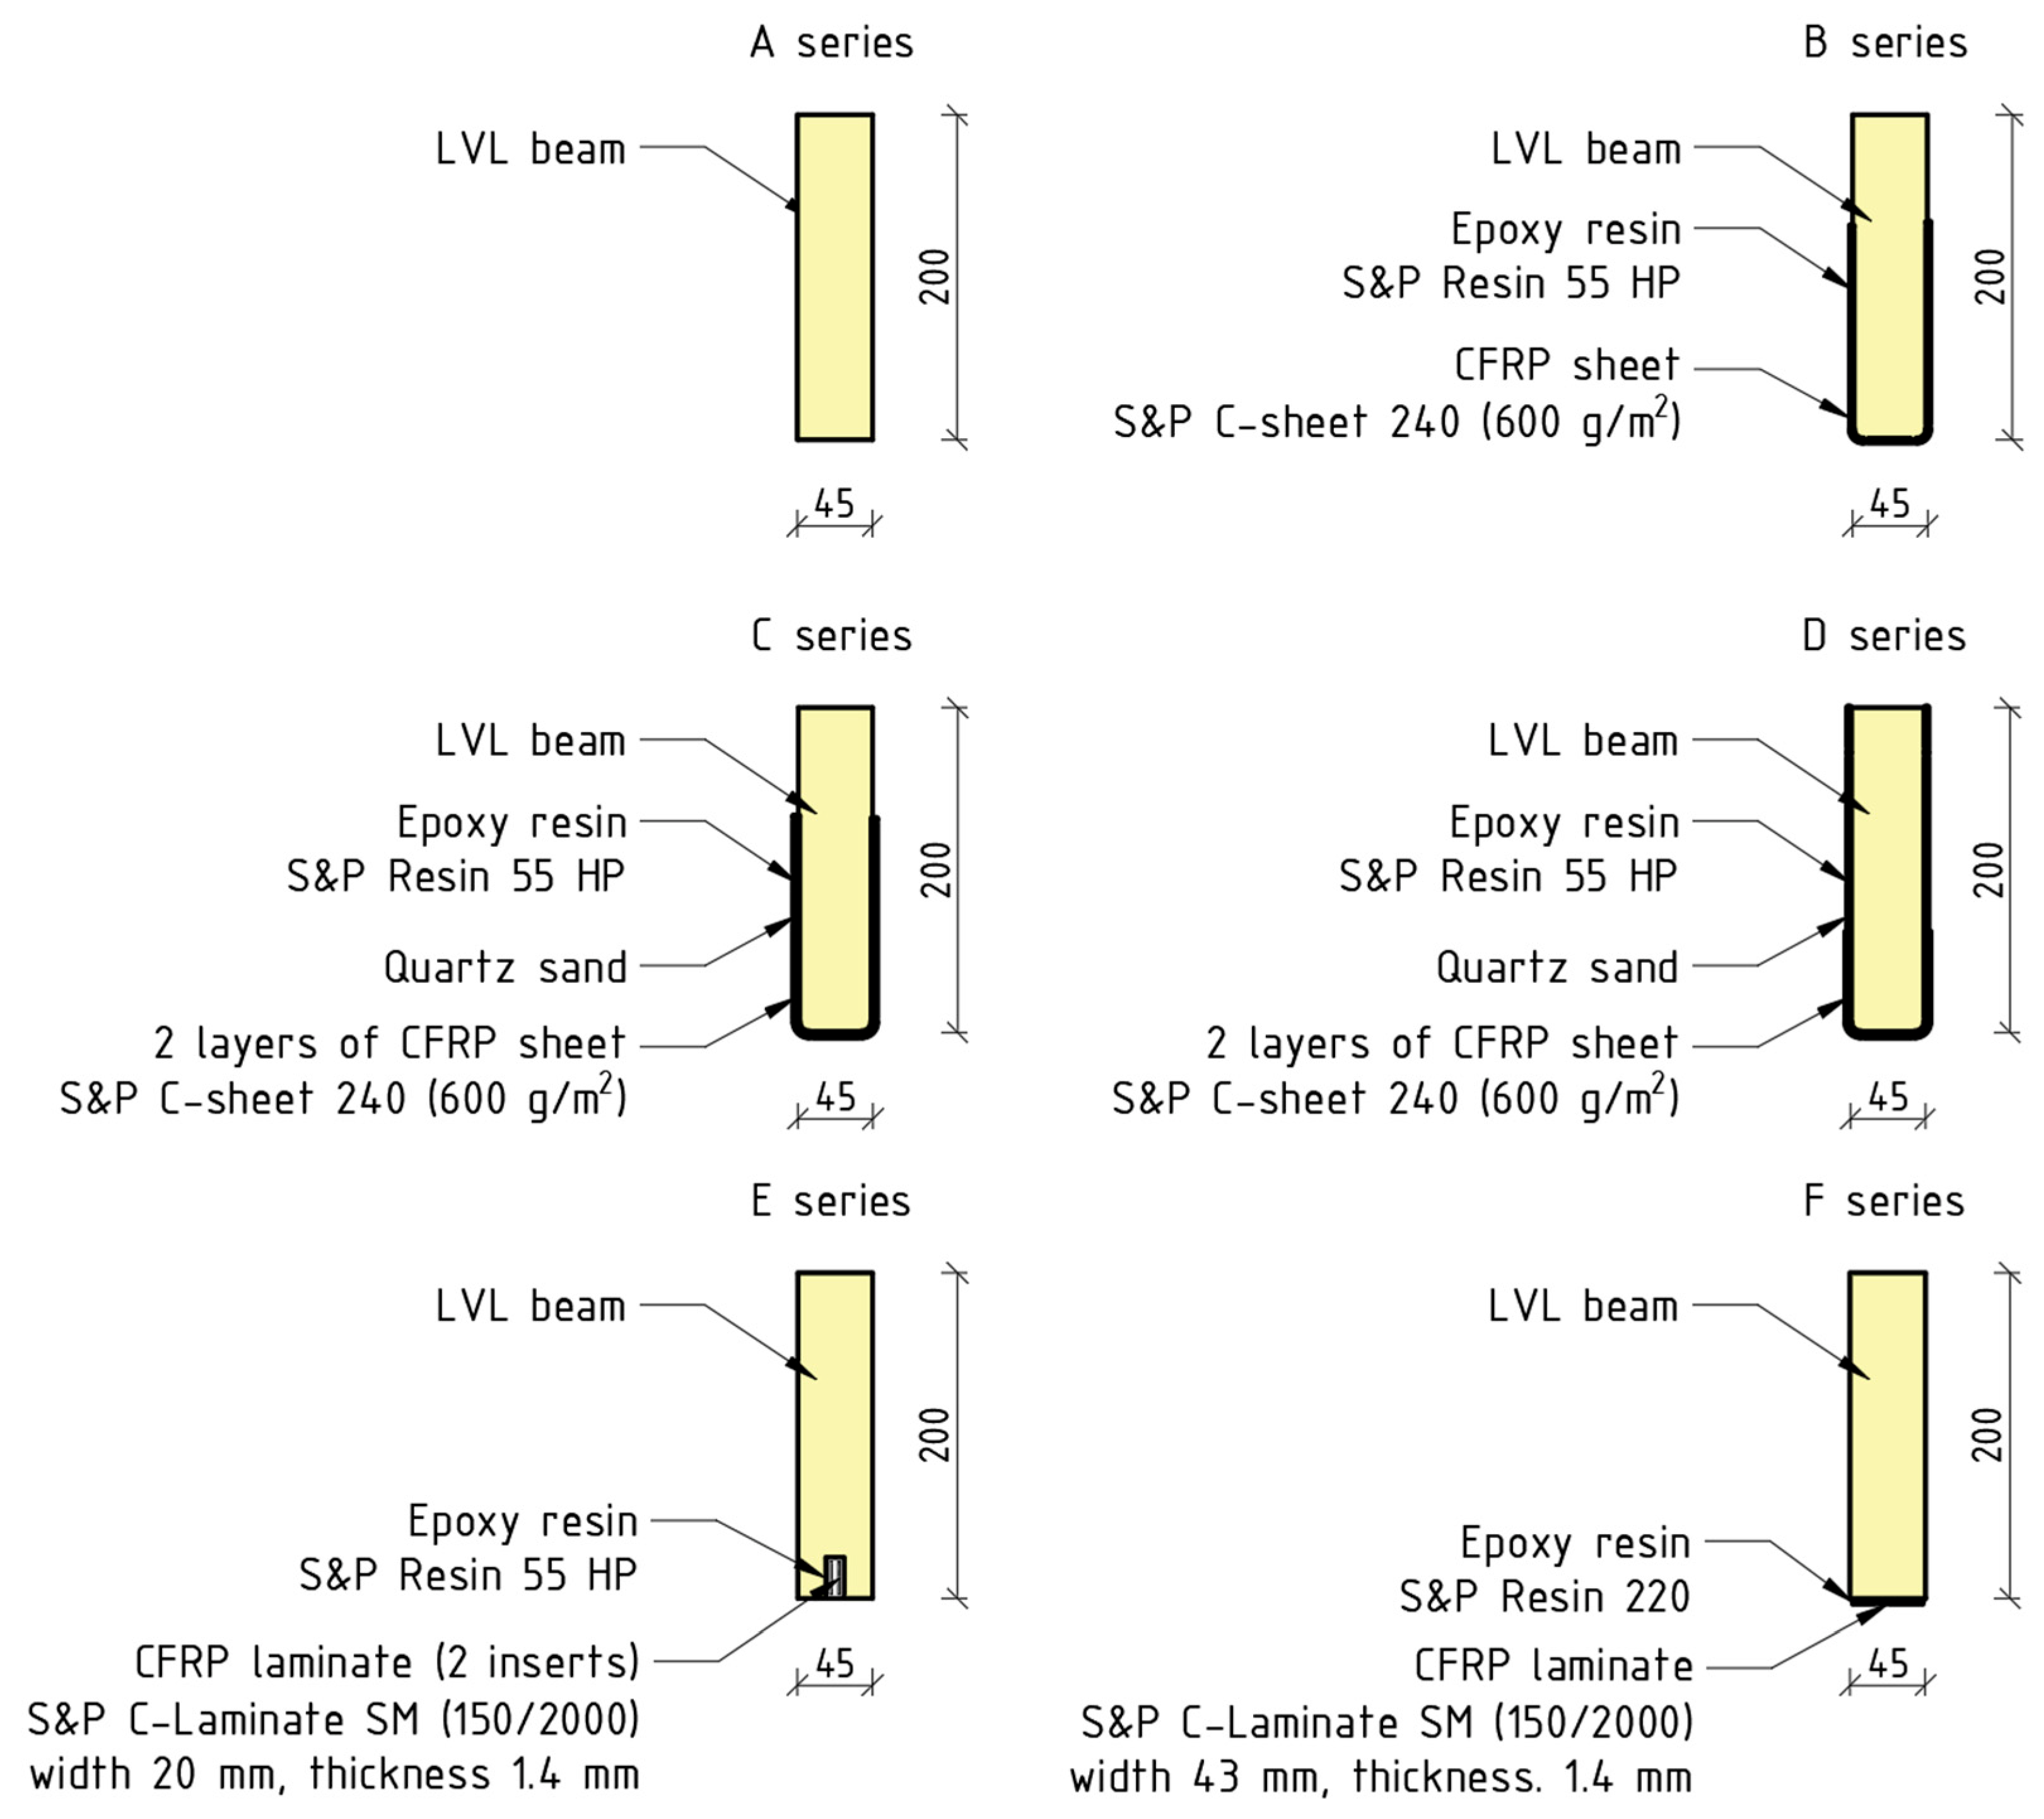
2.1.4. Preparation for Application of Reinforcement
2.2. Method
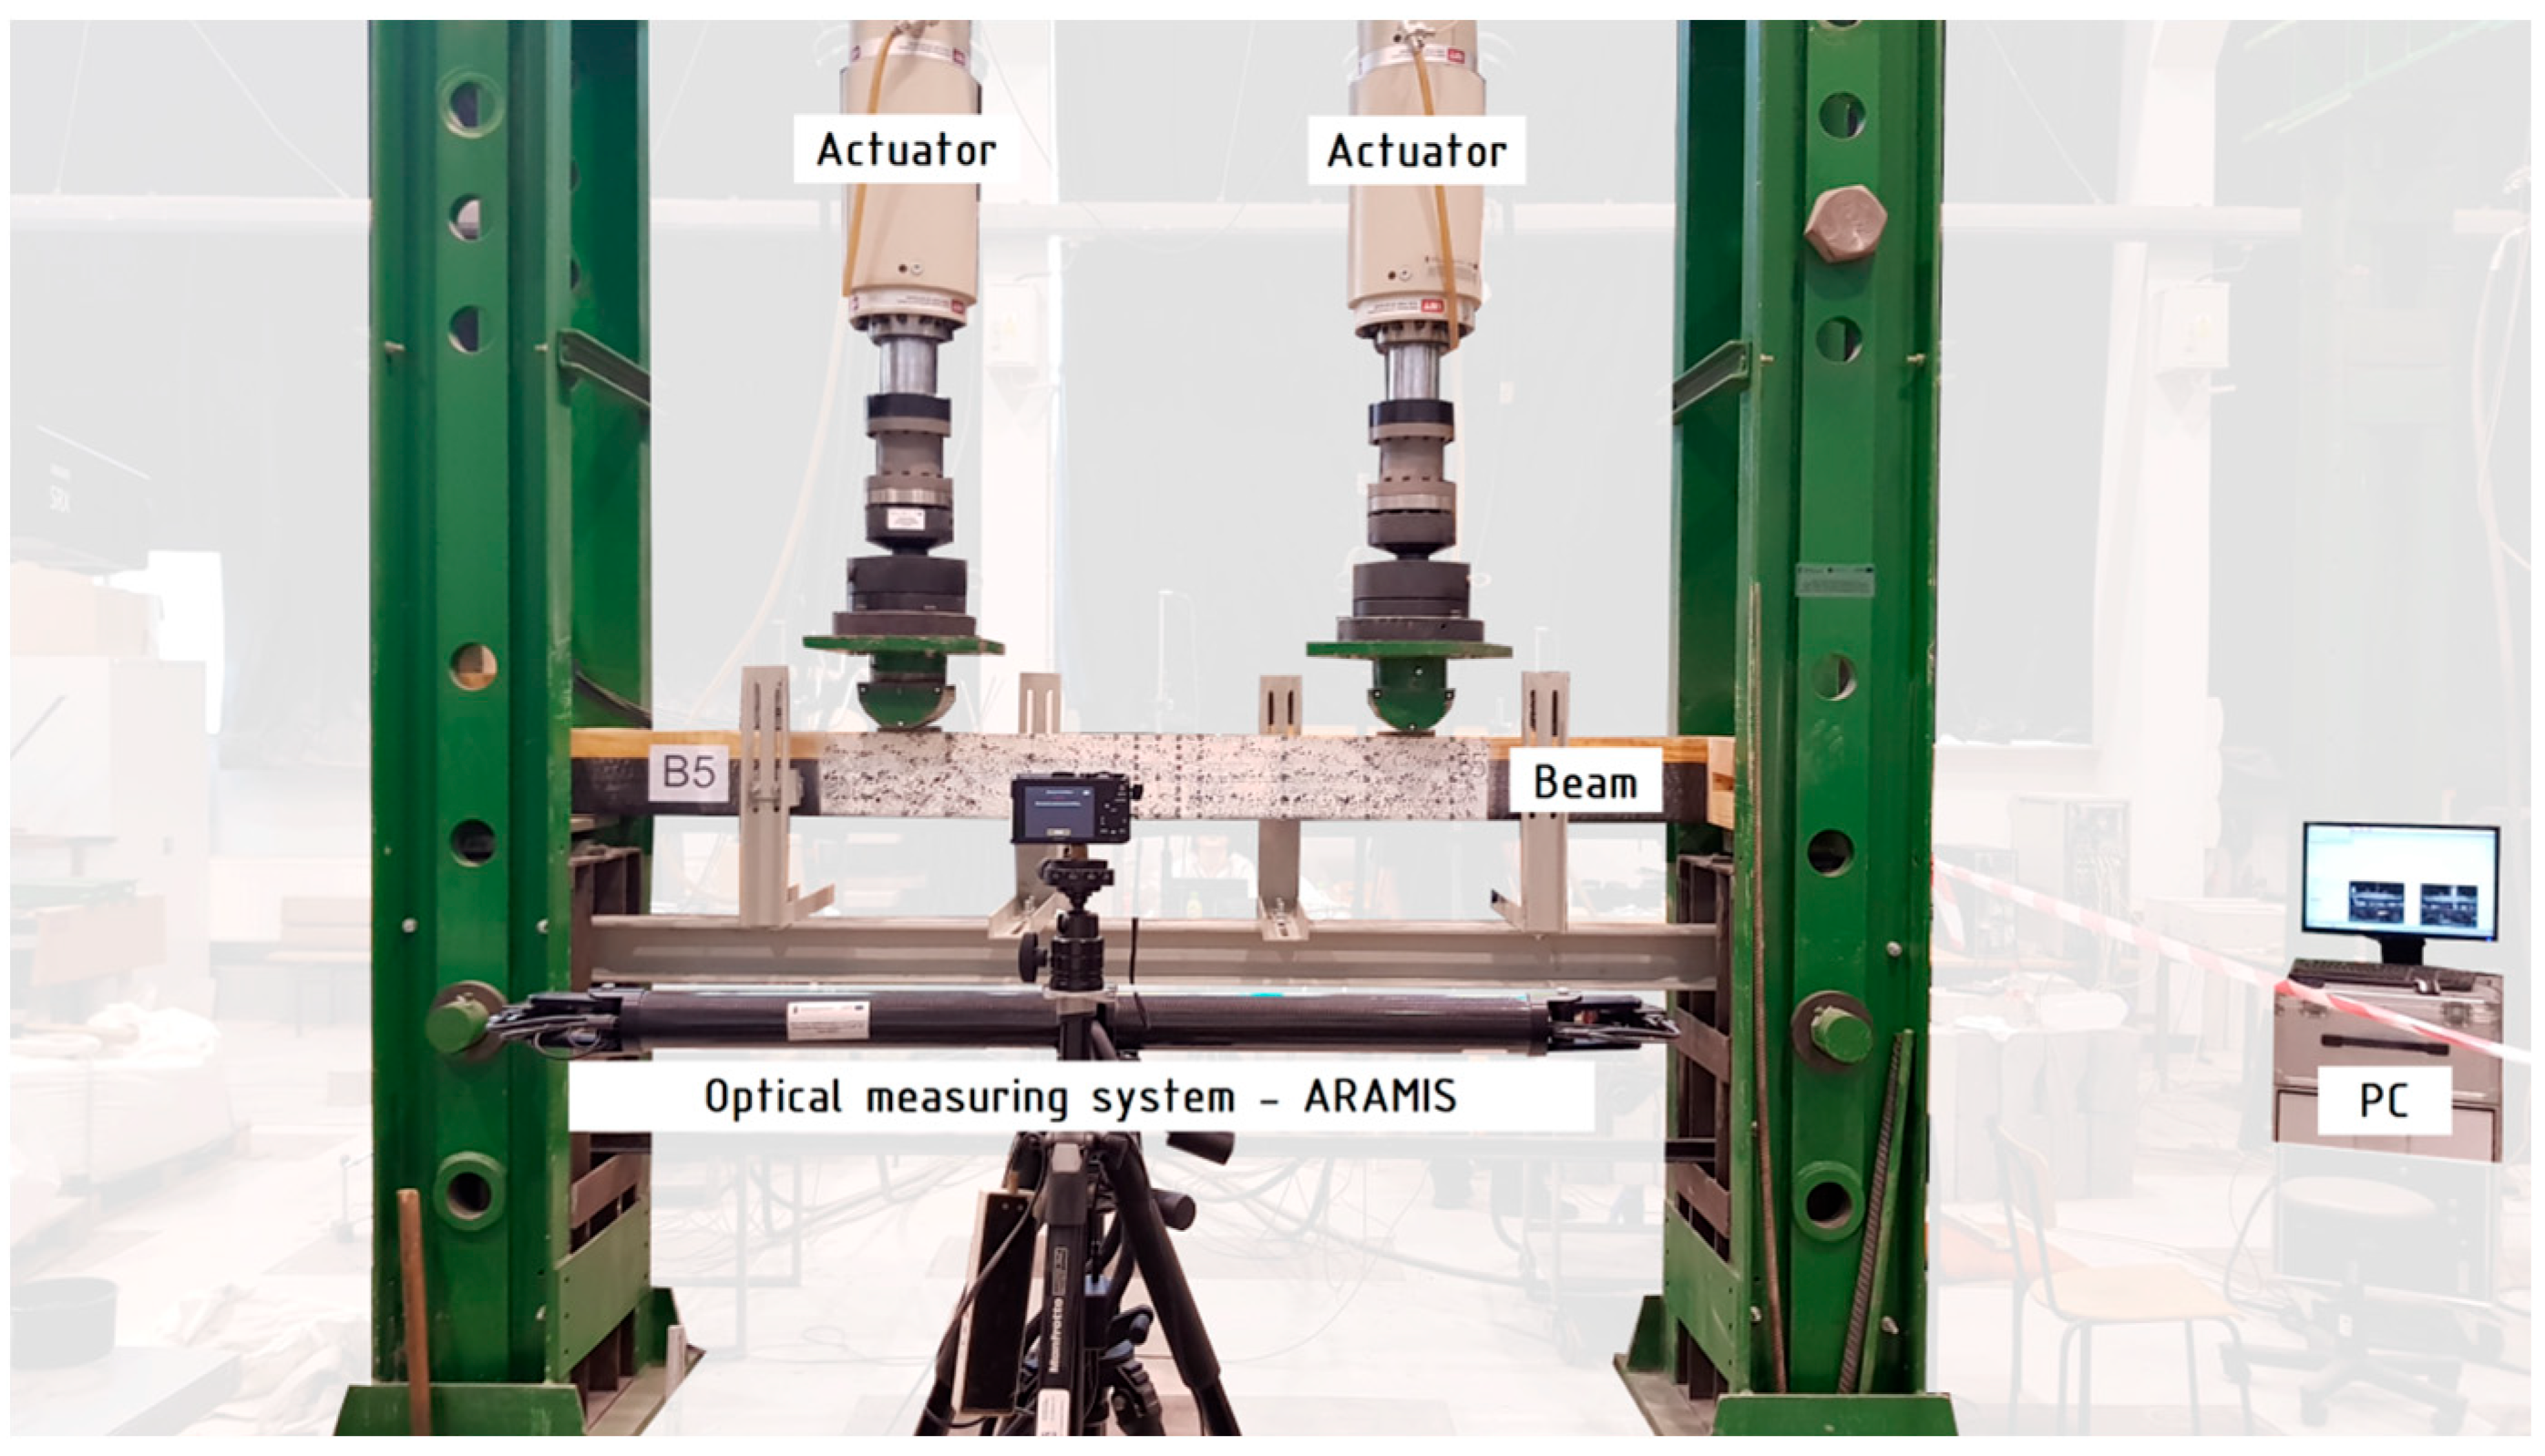
2.2.1. Bending Test
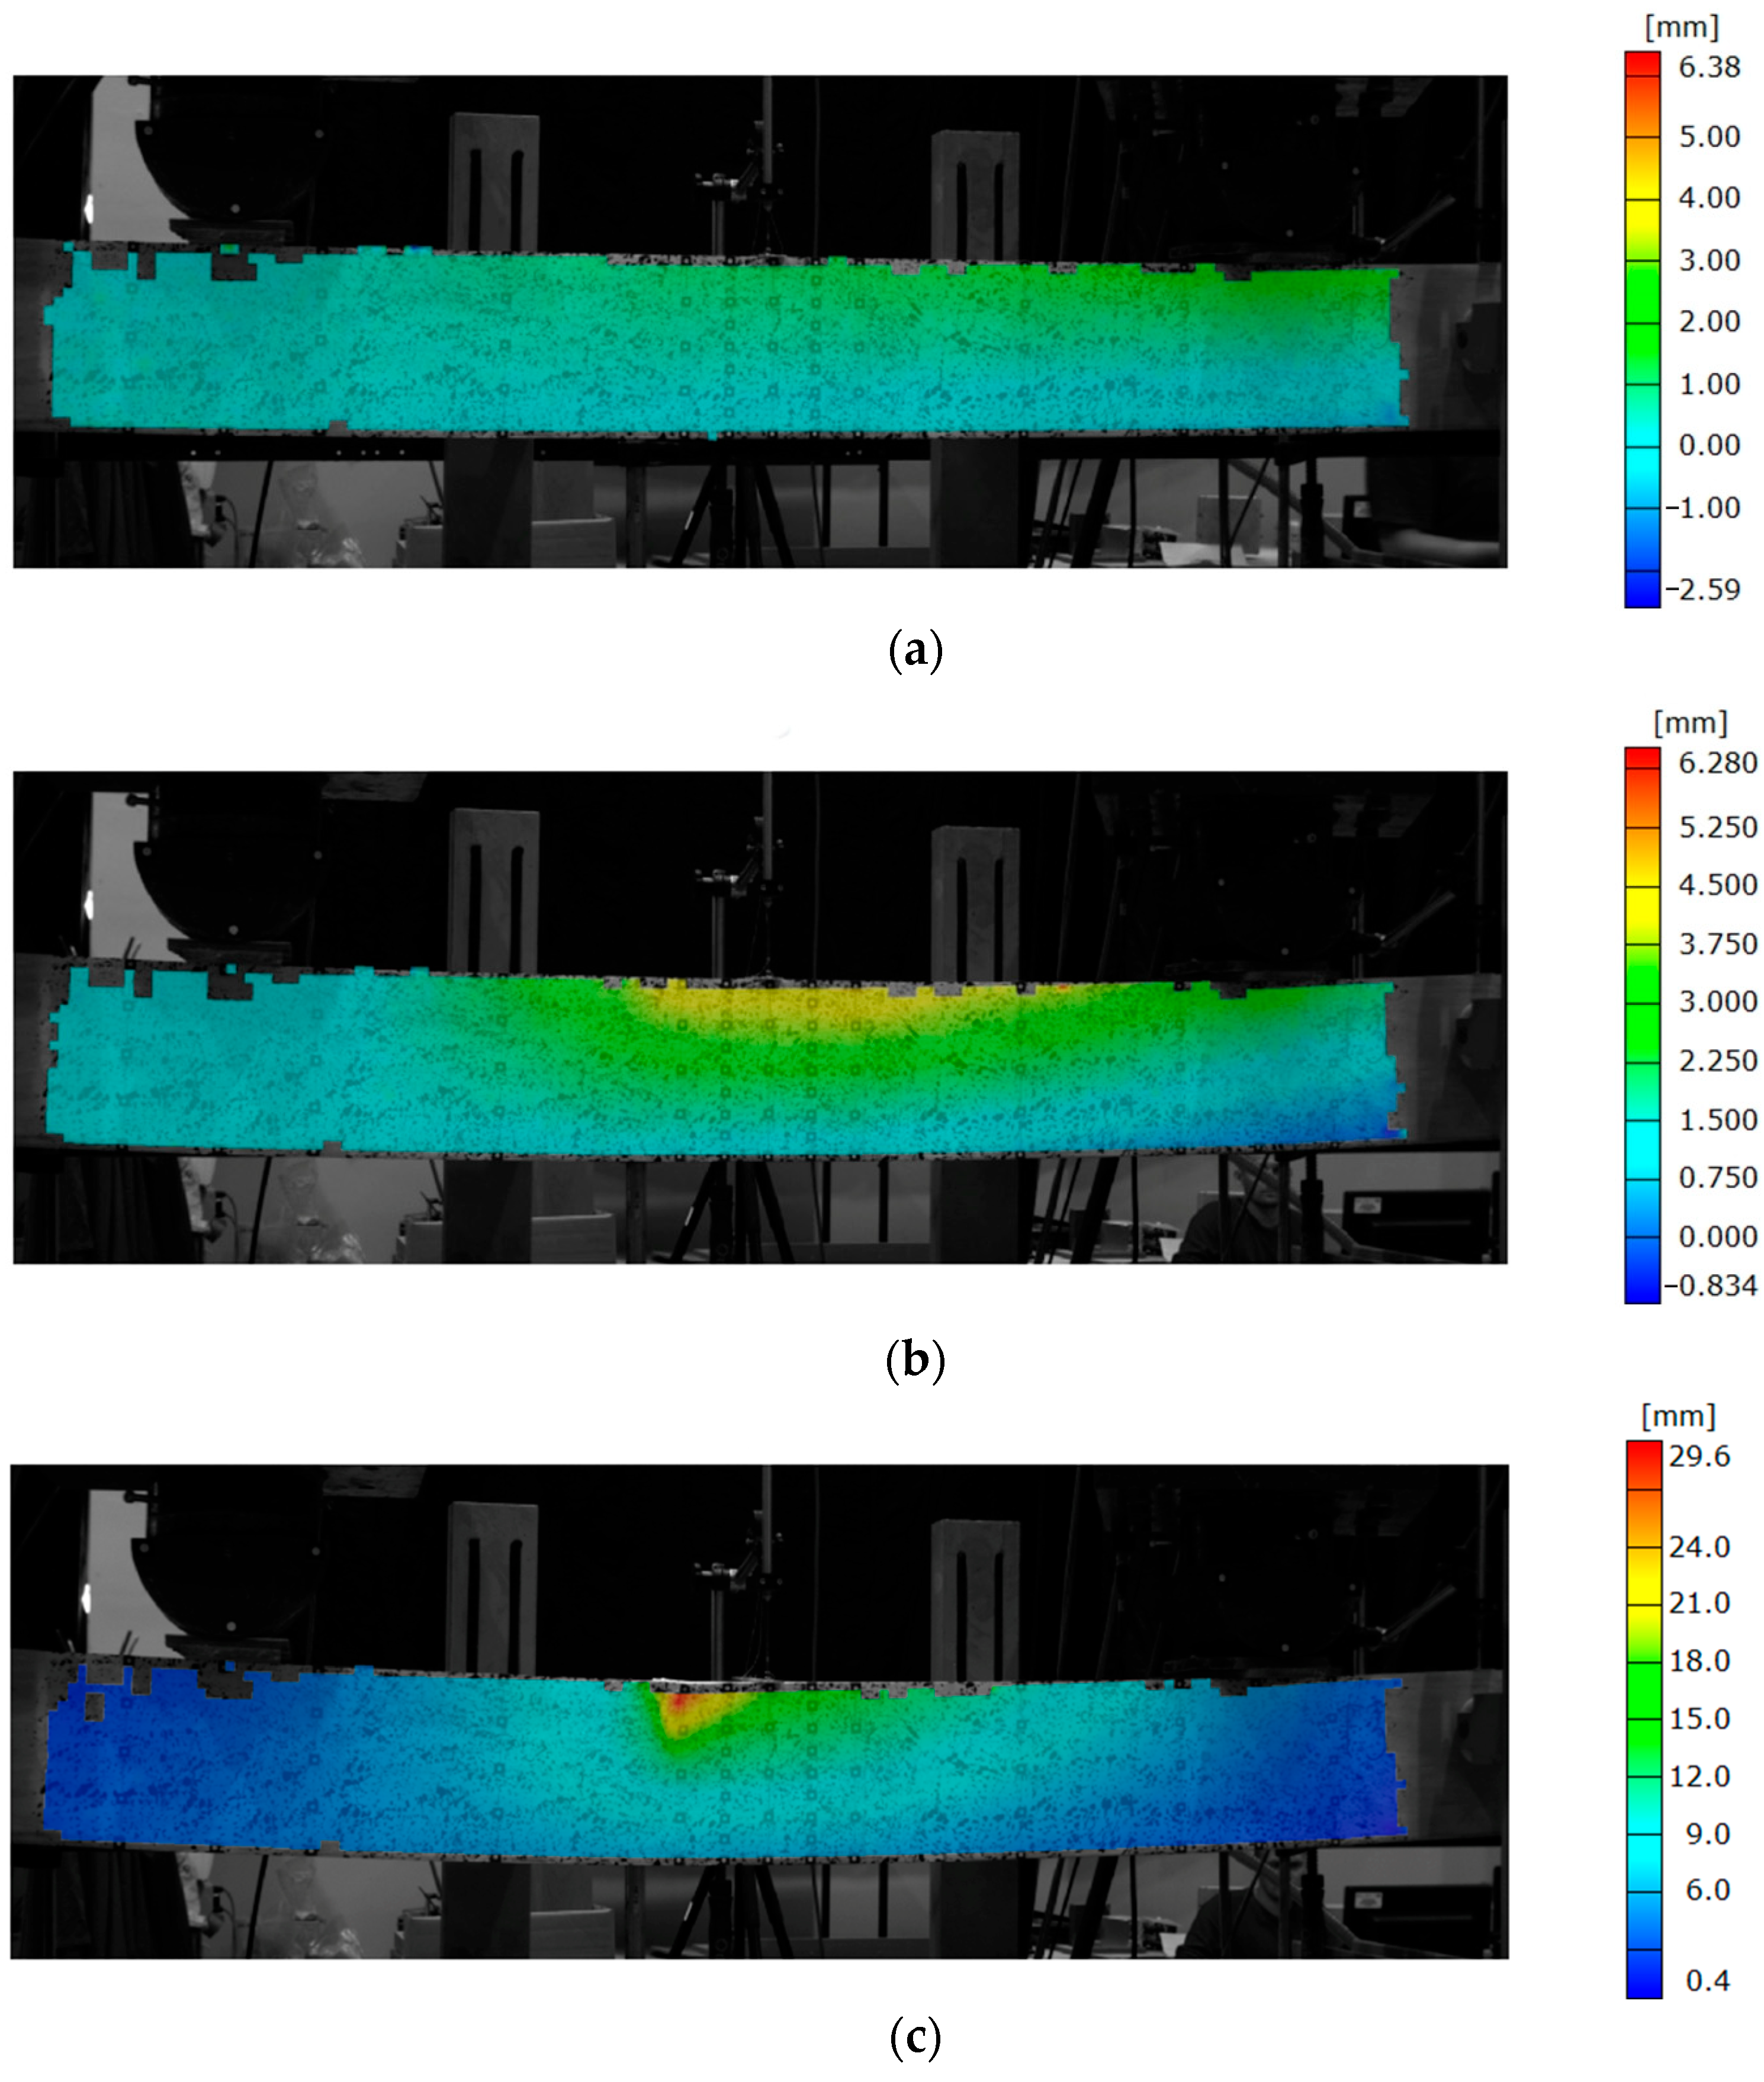
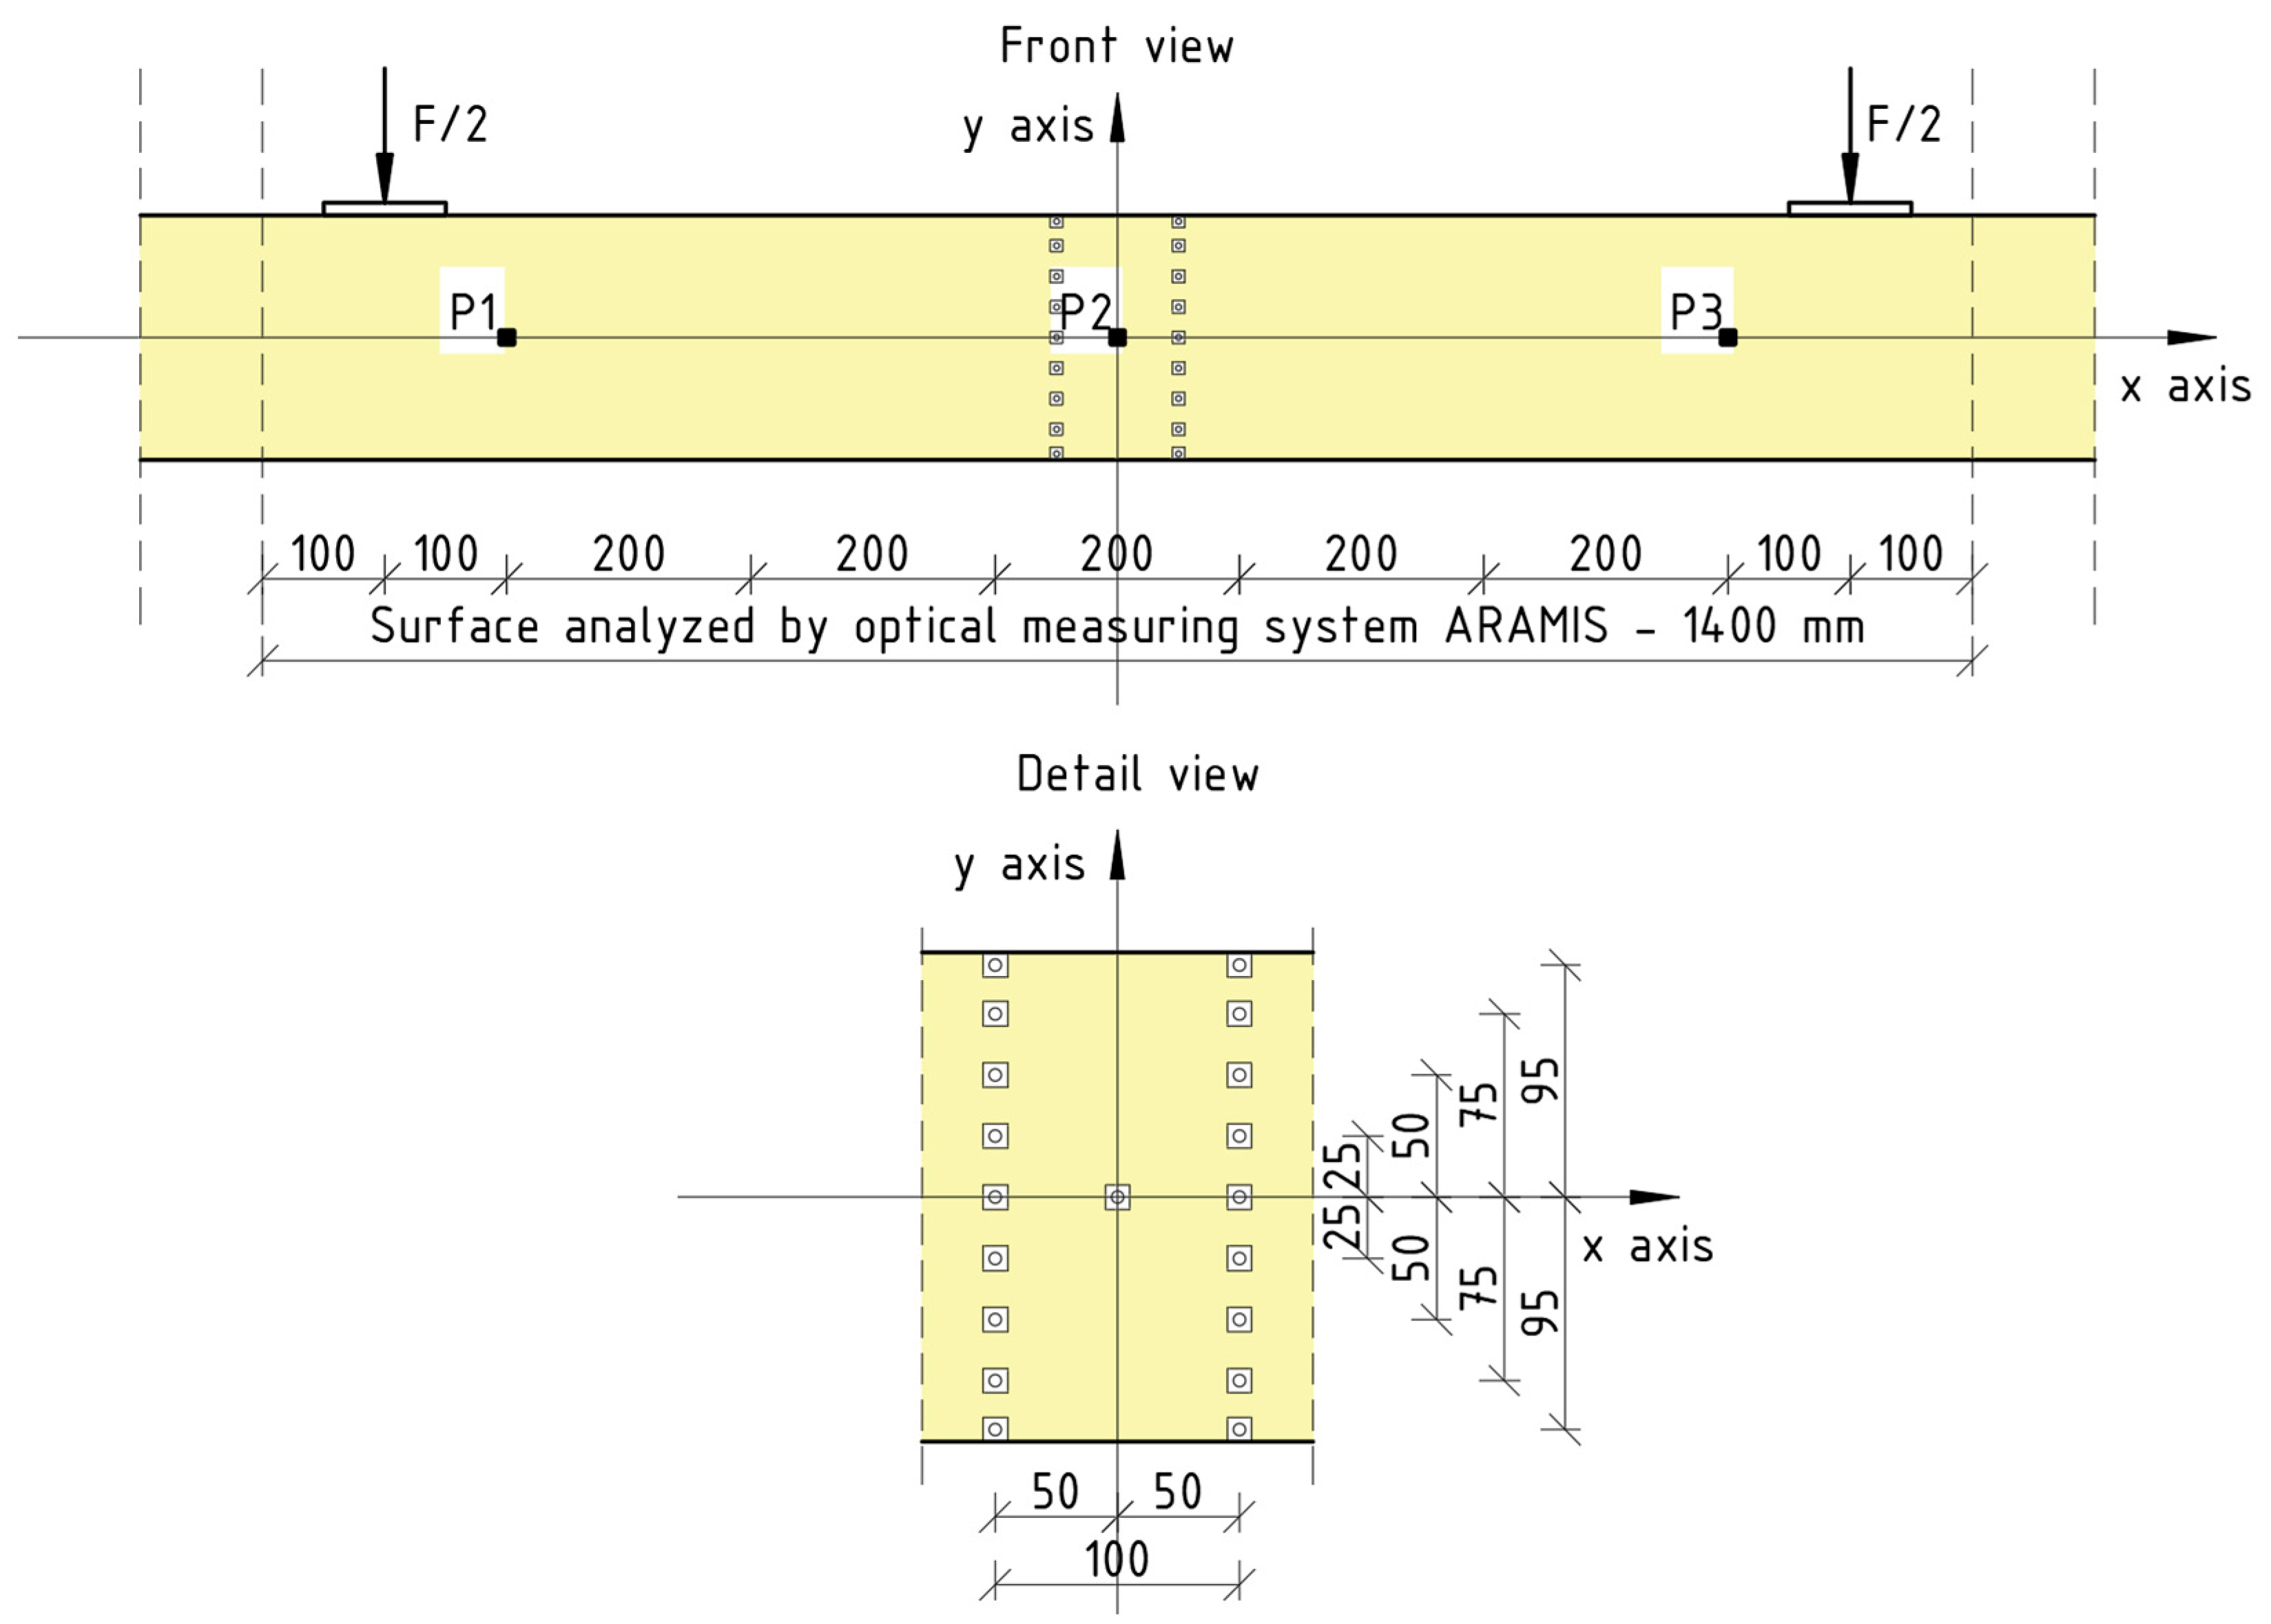
2.2.2. Digital Image Correlation System
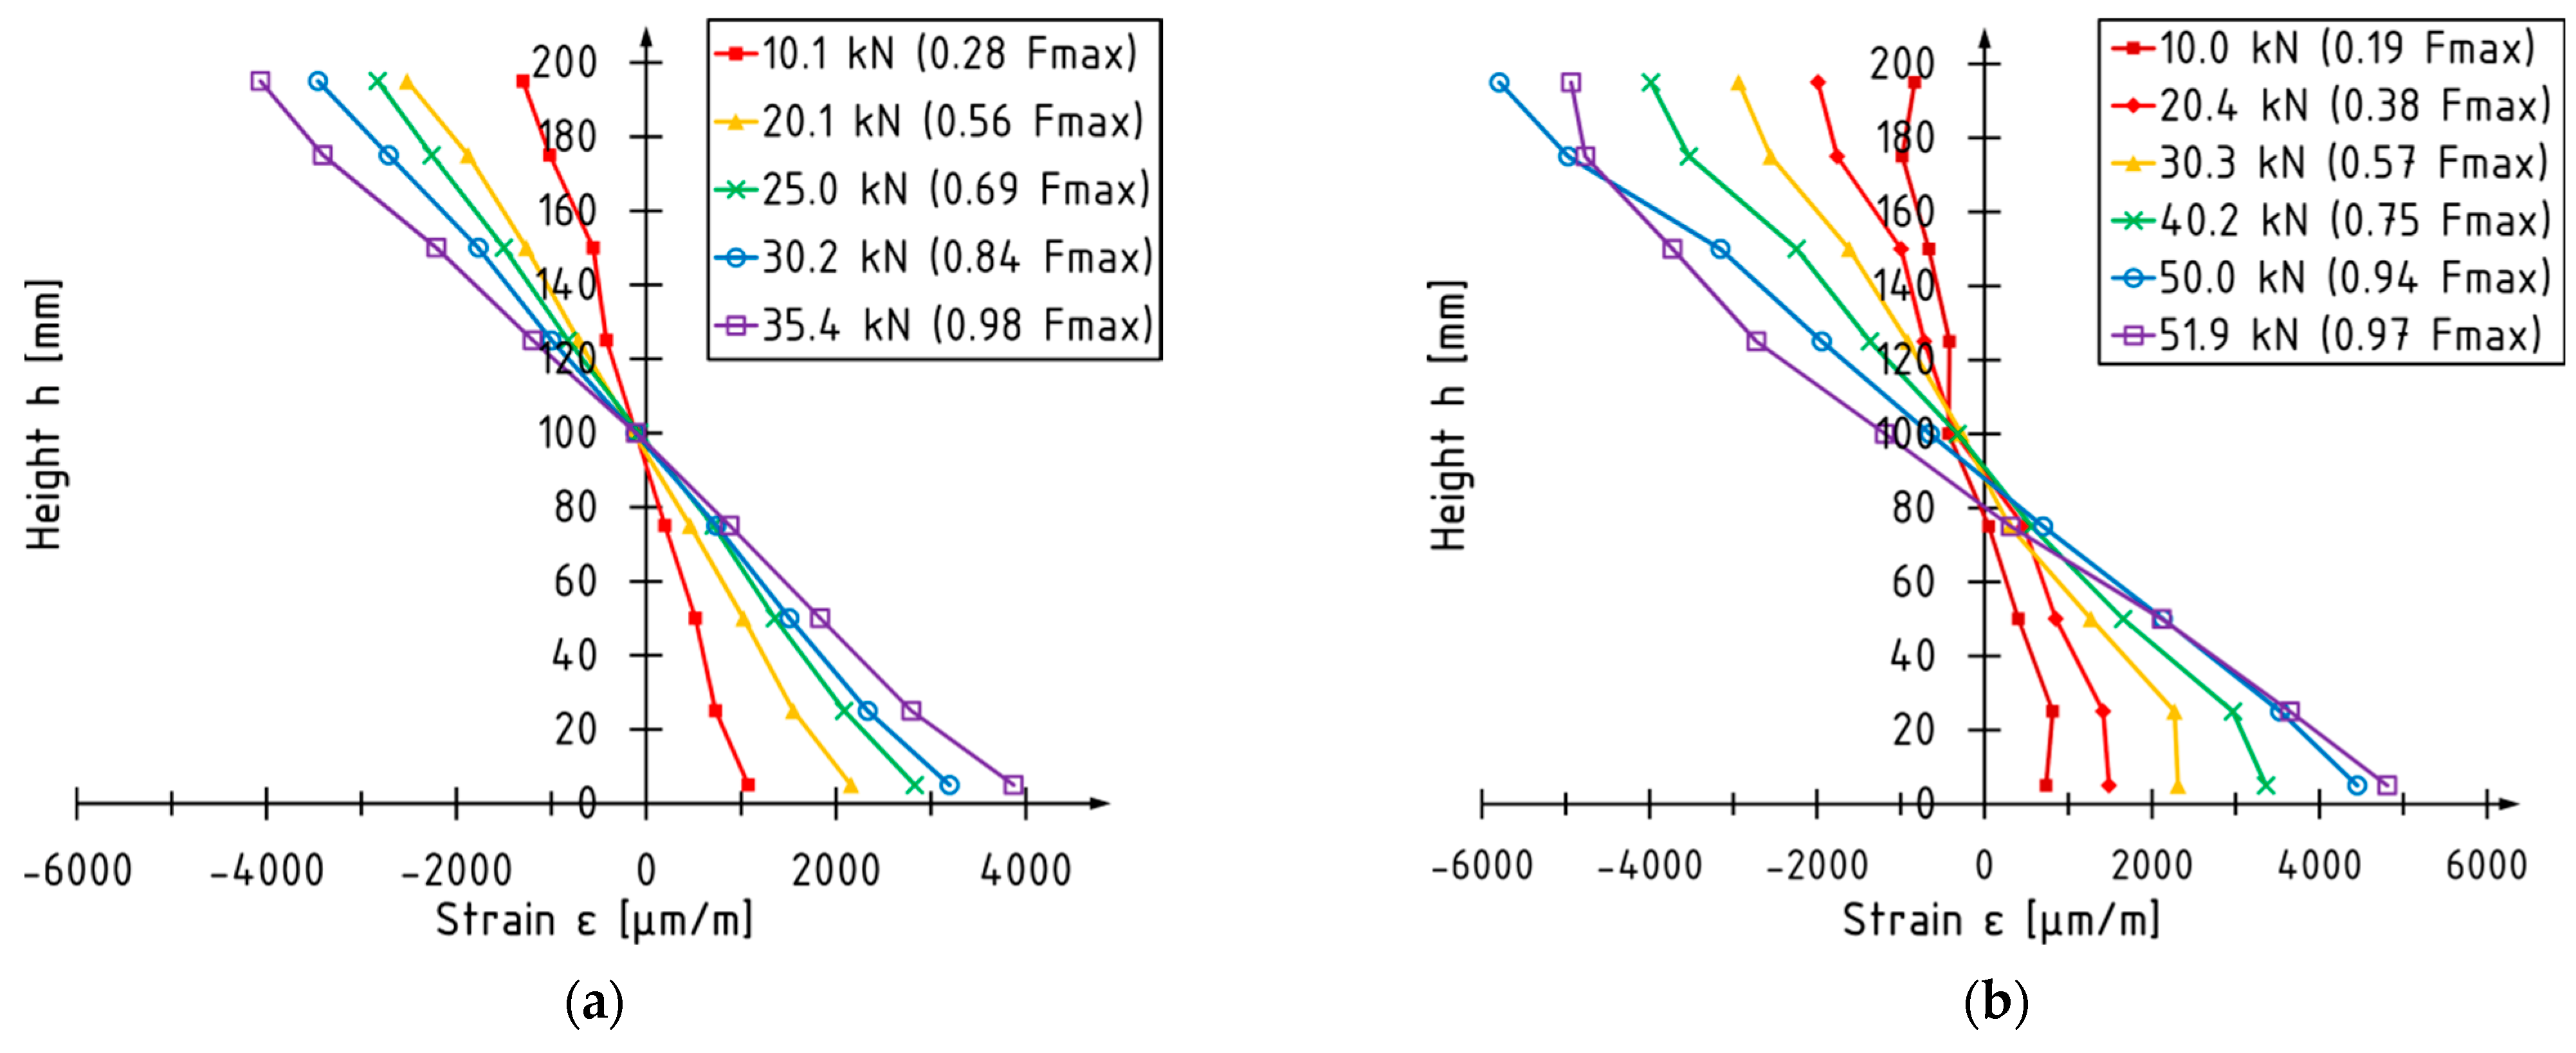
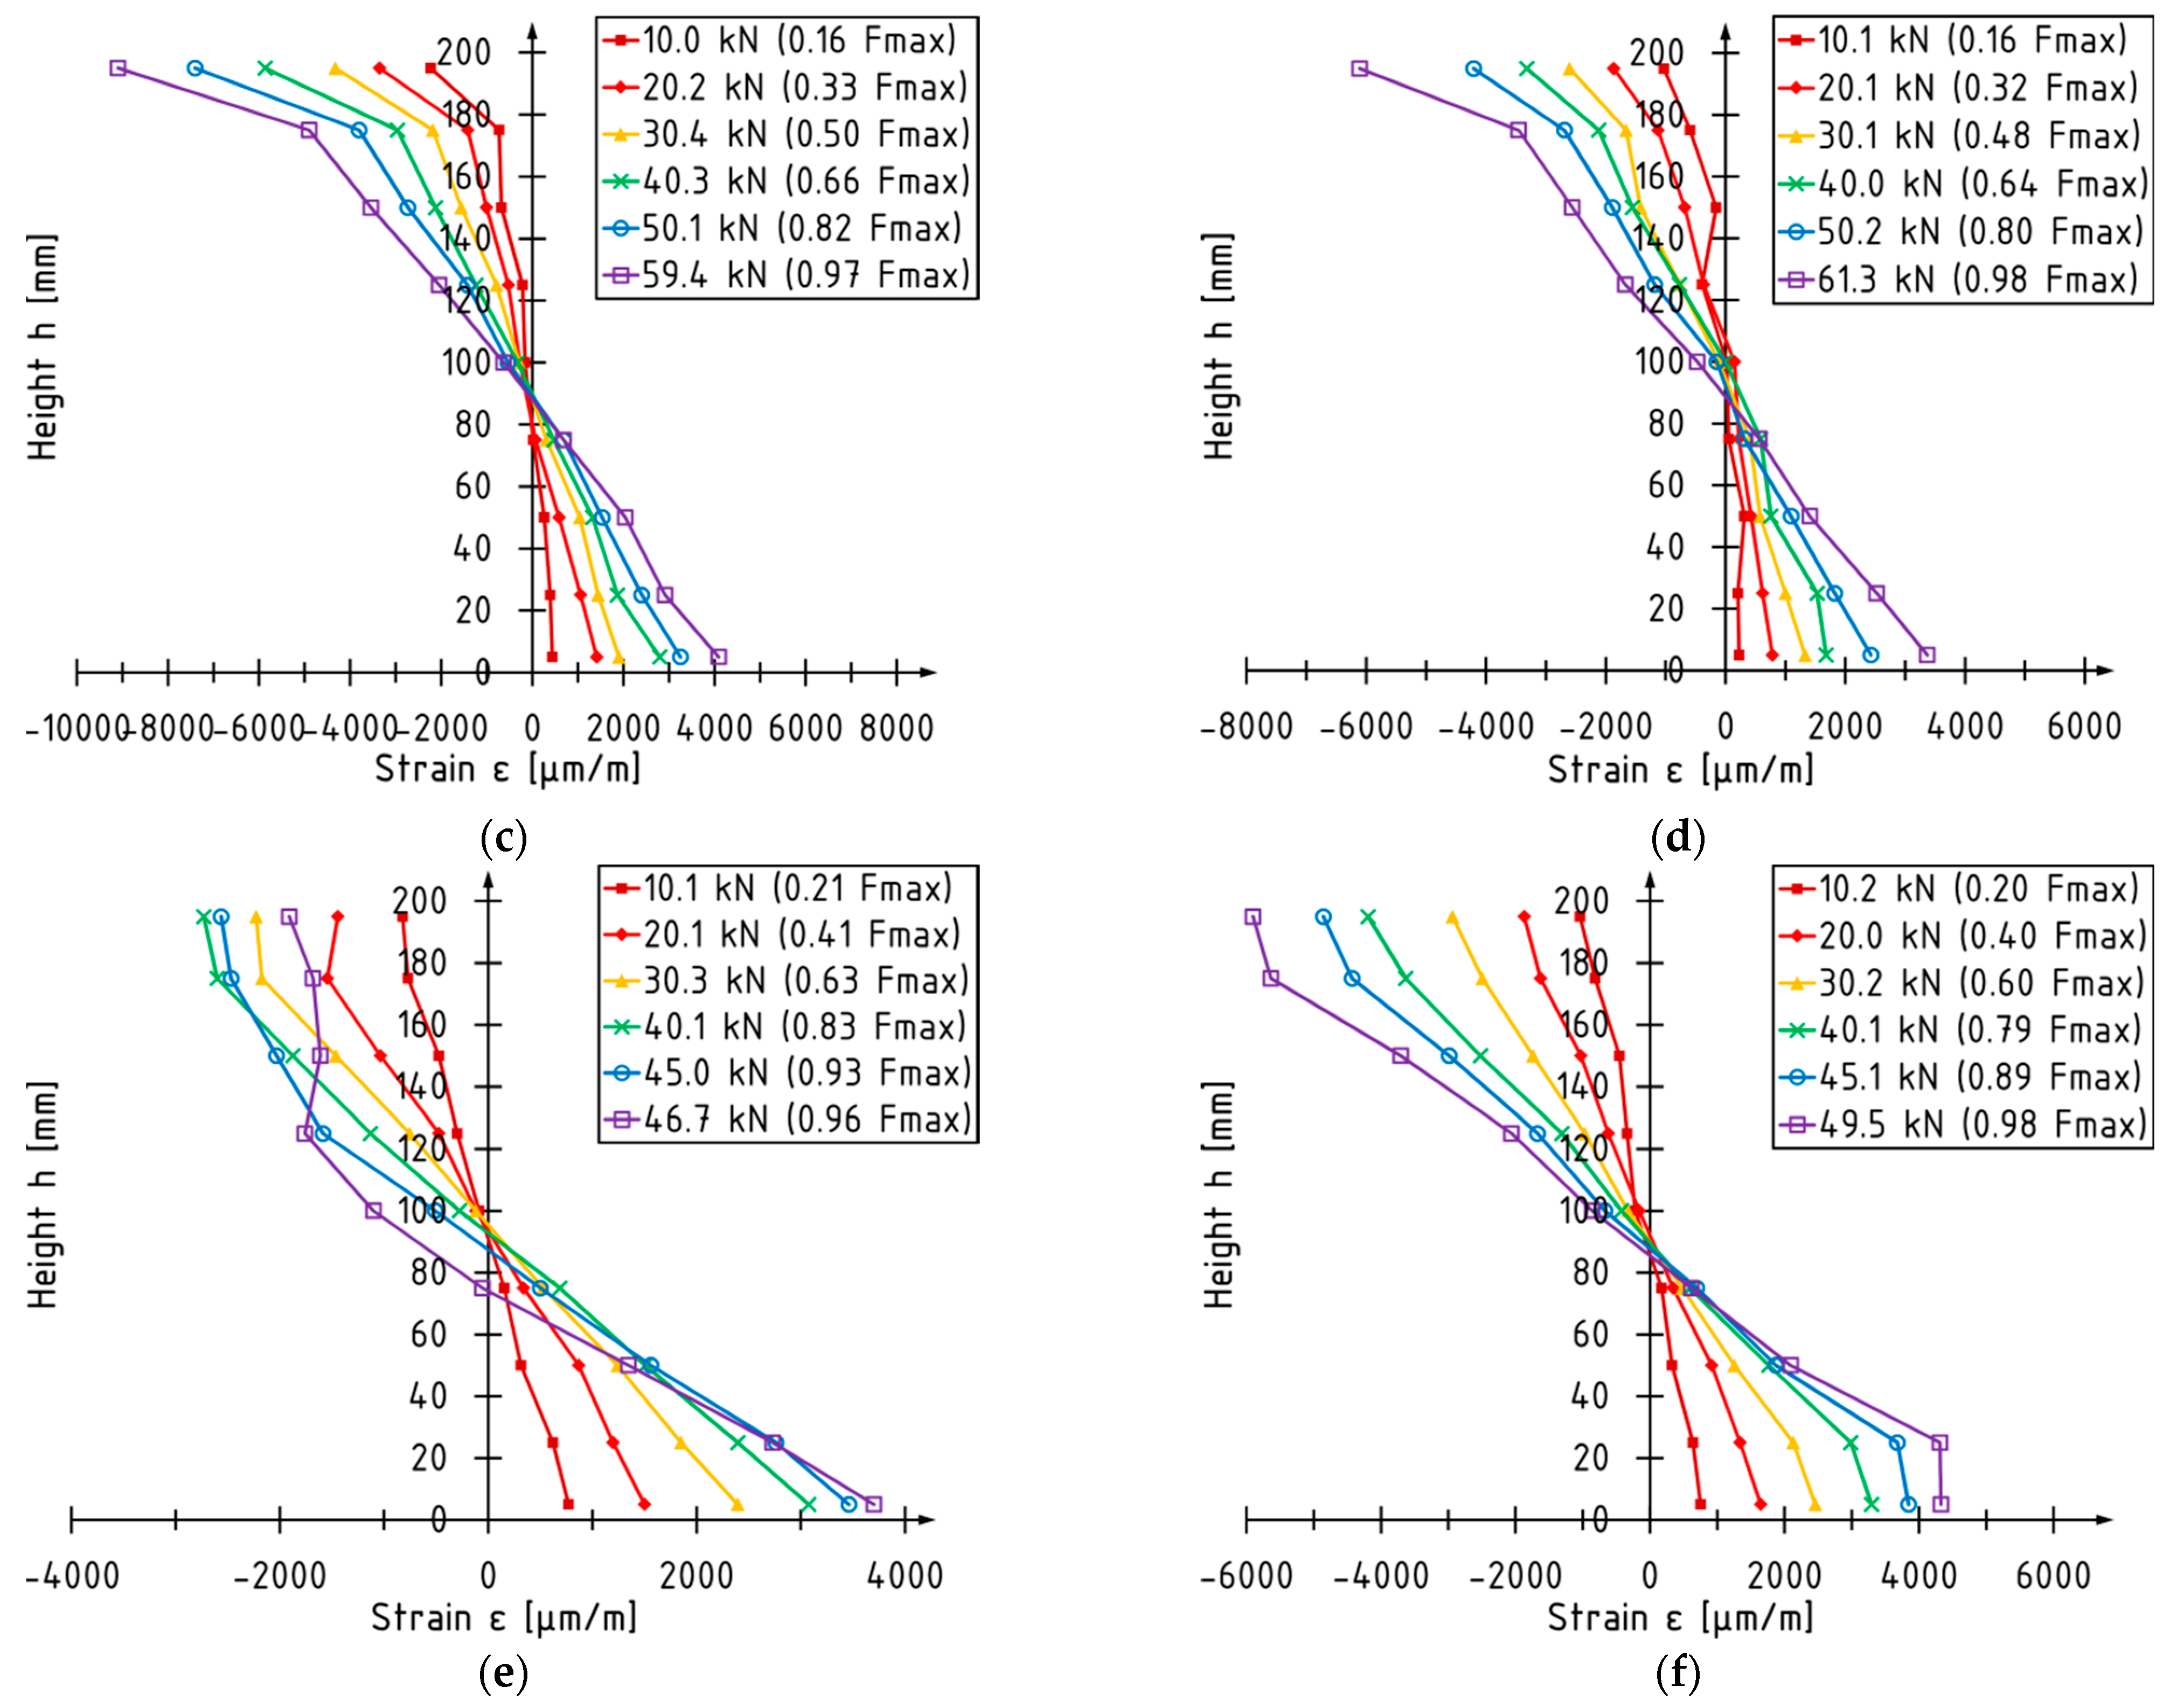
2.2.3. Strains
2.2.4. Ductility
- us—the deflection at the maximum load of the strengthened beam,
- uun—the deflection at the maximum load of the unstrengthened beam.
- uu—the deflection at the ultimate load,
- uy—the deflection at the yield point.
- ue—the deflection at the elastic limit.
- We—the elastic energy (fraction of total), the area under the load-deflection curve up to elastic limit;
- Wtot—the total energy, the area under the load-deflection curve up to failure.
2.2.5. Stiffness
Stiffness Coefficients
- F—the loading force,
- f—the local deflection.
- u—the deflection.
Modulus of Elasticity
- a—the distance between the concentrated load and the nearest support axis,
- l1—the gauge length for the determination of the modulus of elasticity,
- I—the second moment of inertia,
- ΔF—the increment of load,
- Δu—the increment of the deflection corresponding to the increment of the load.
- l—the span in bending,
- b, h—the cross-section dimensions,
- —the shear modulus.
3. Results and Discussion
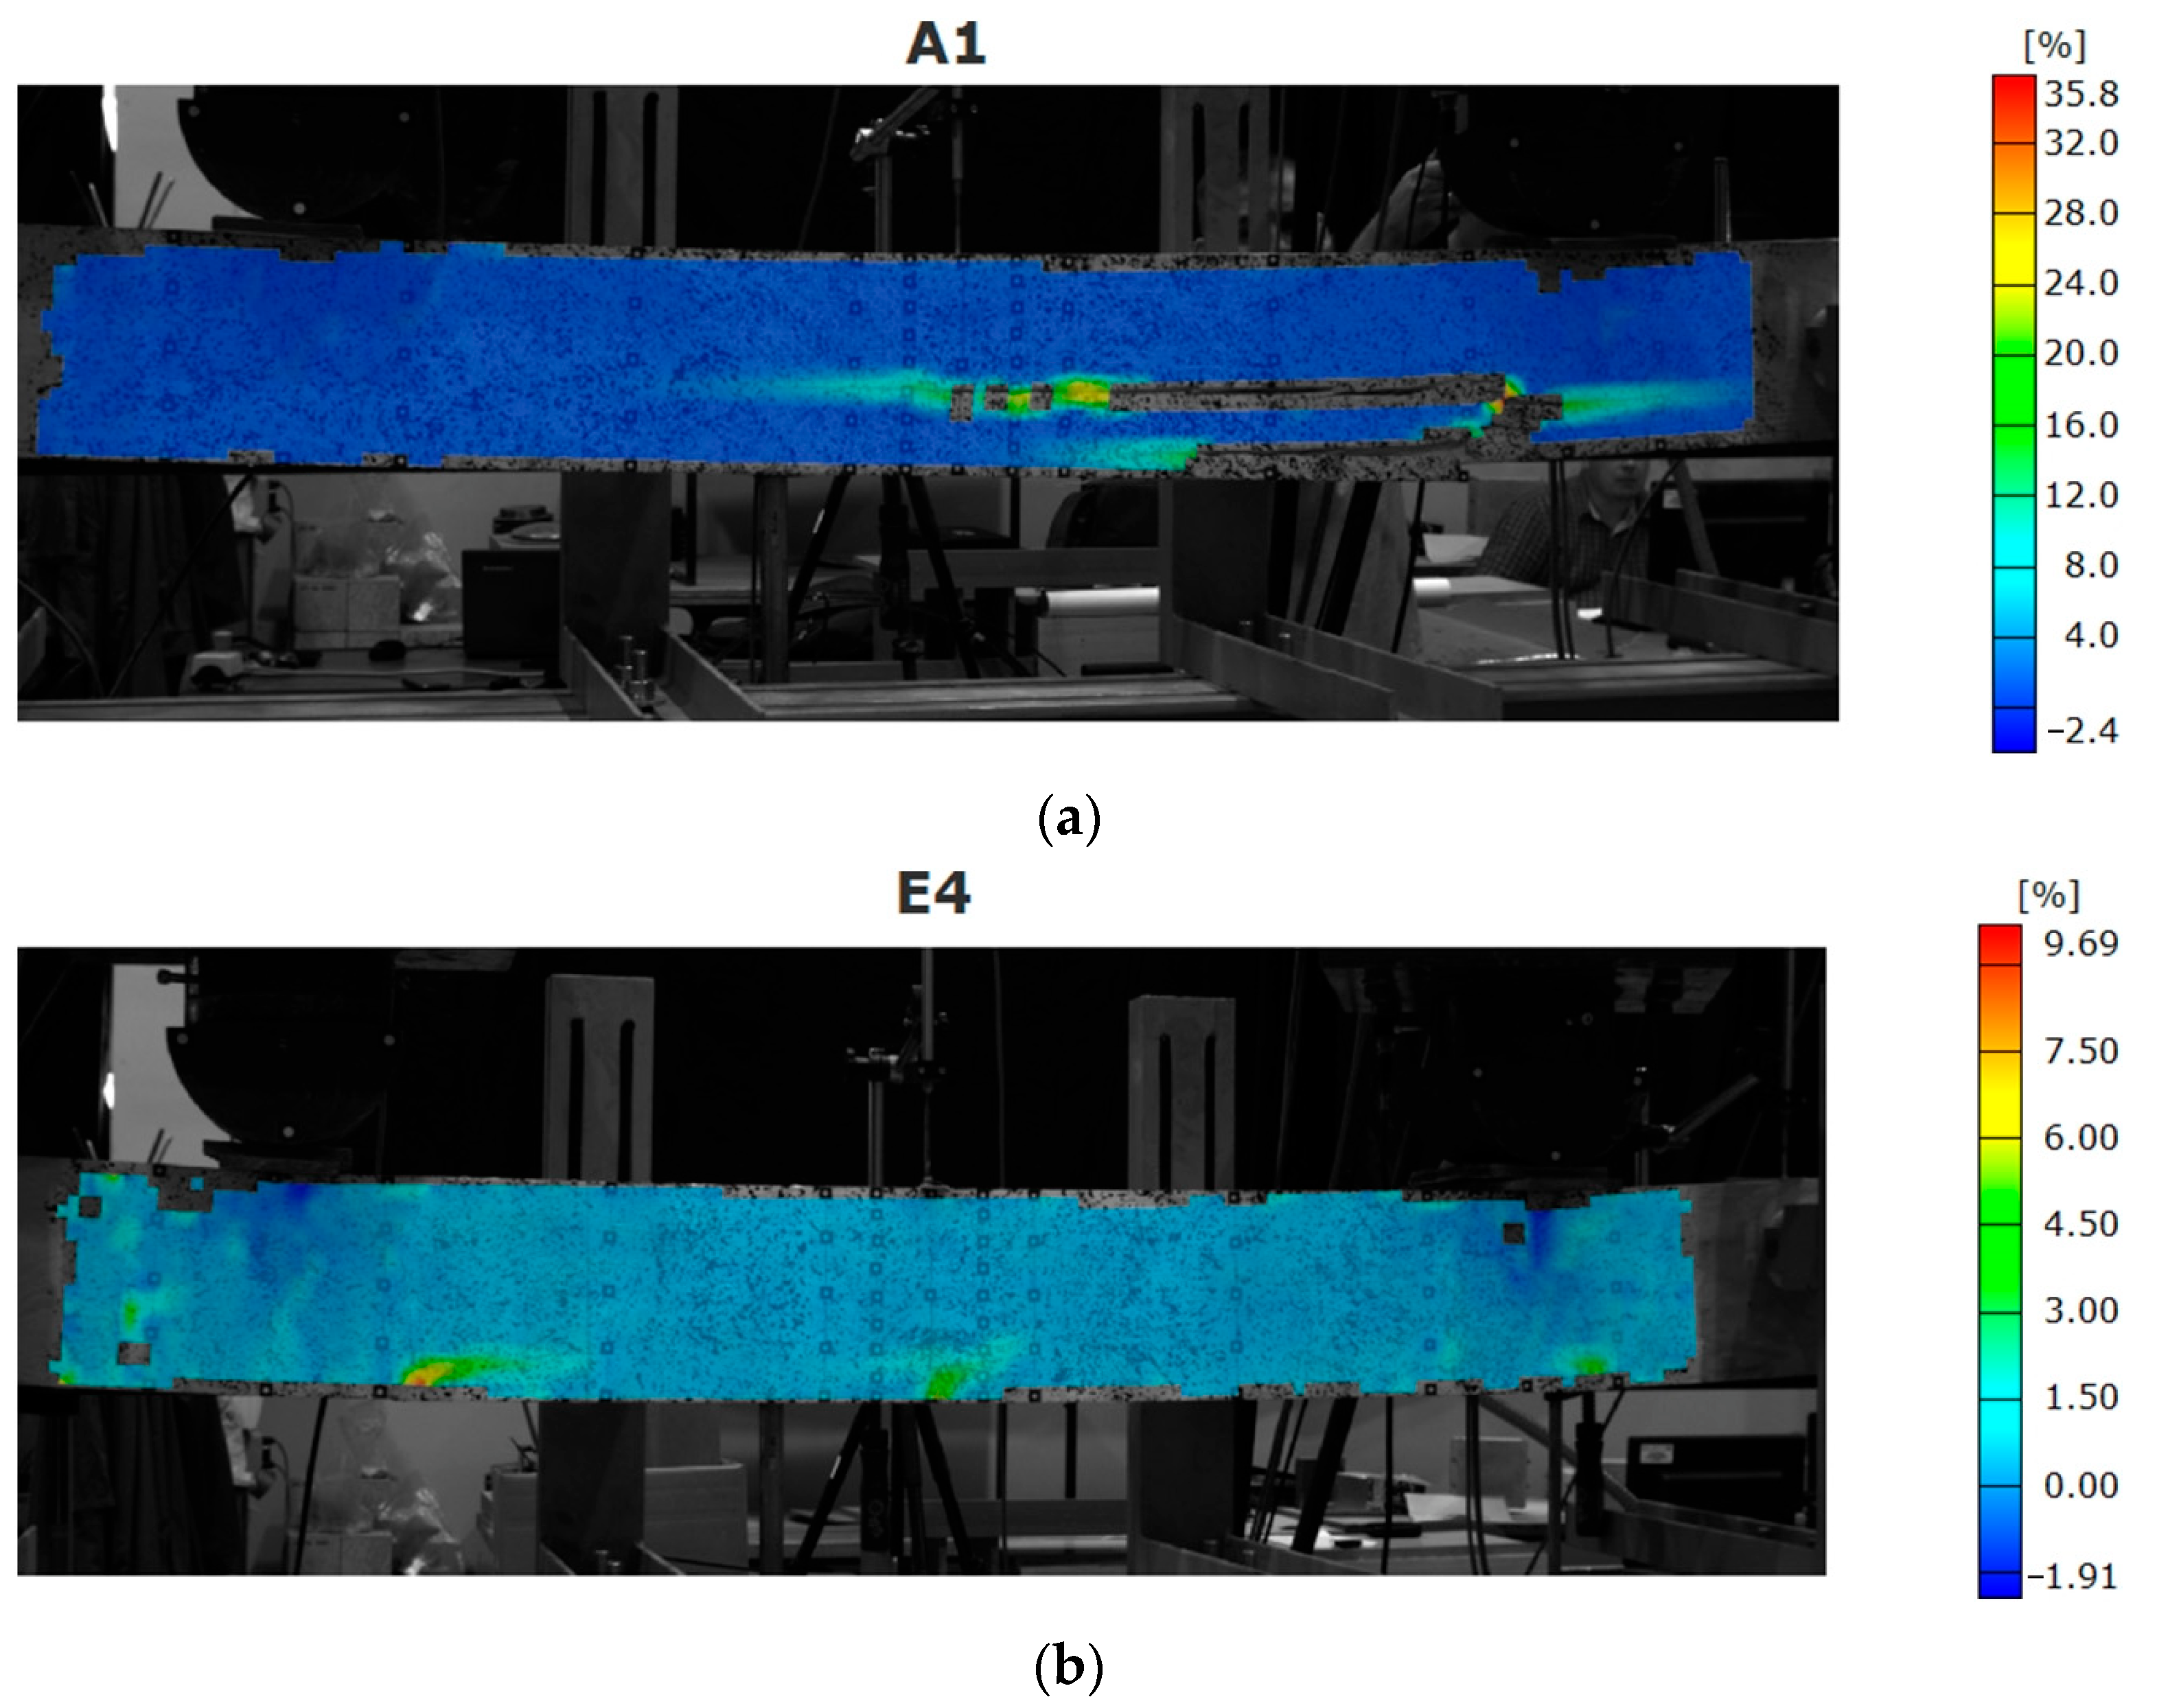
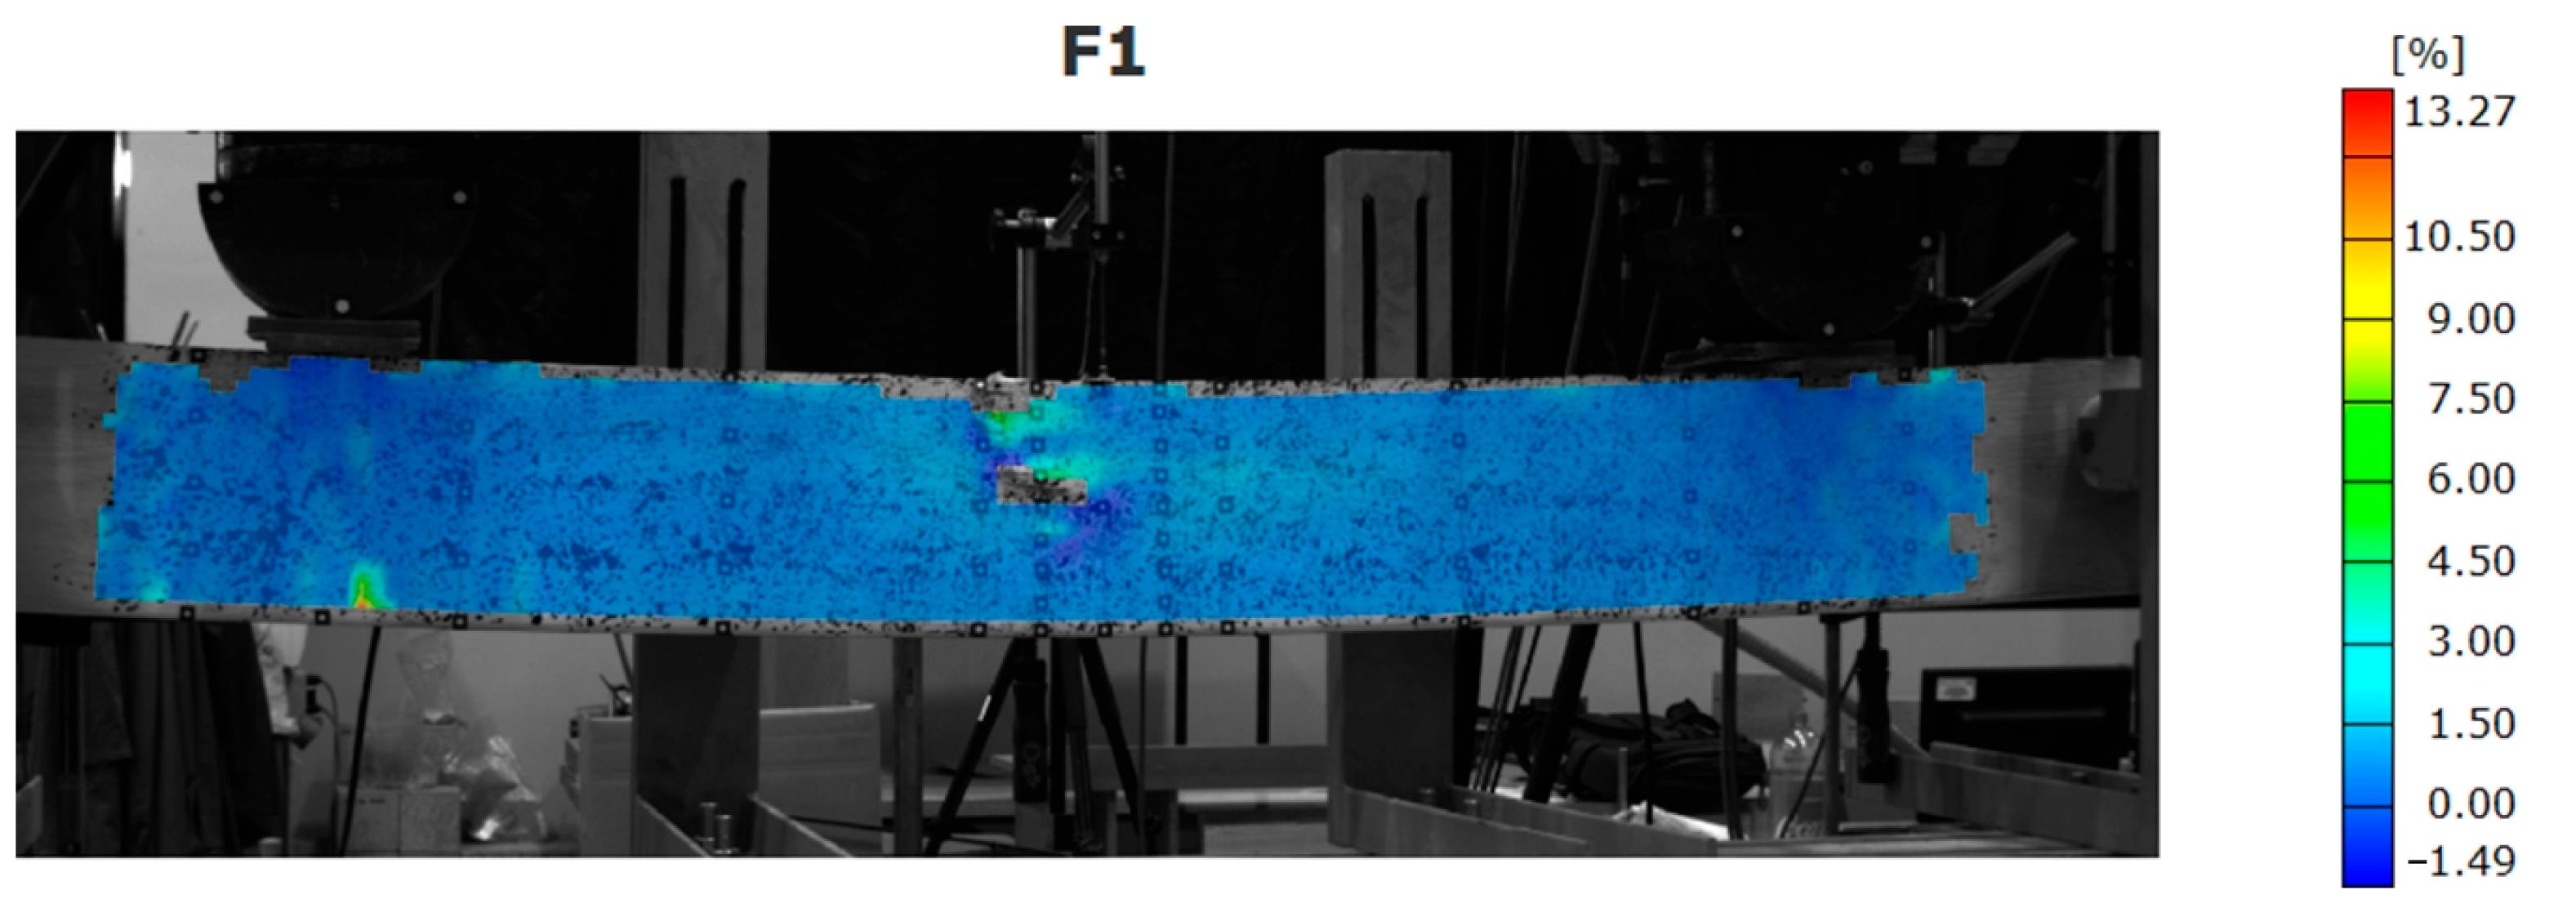
3.1. Strain Analysis
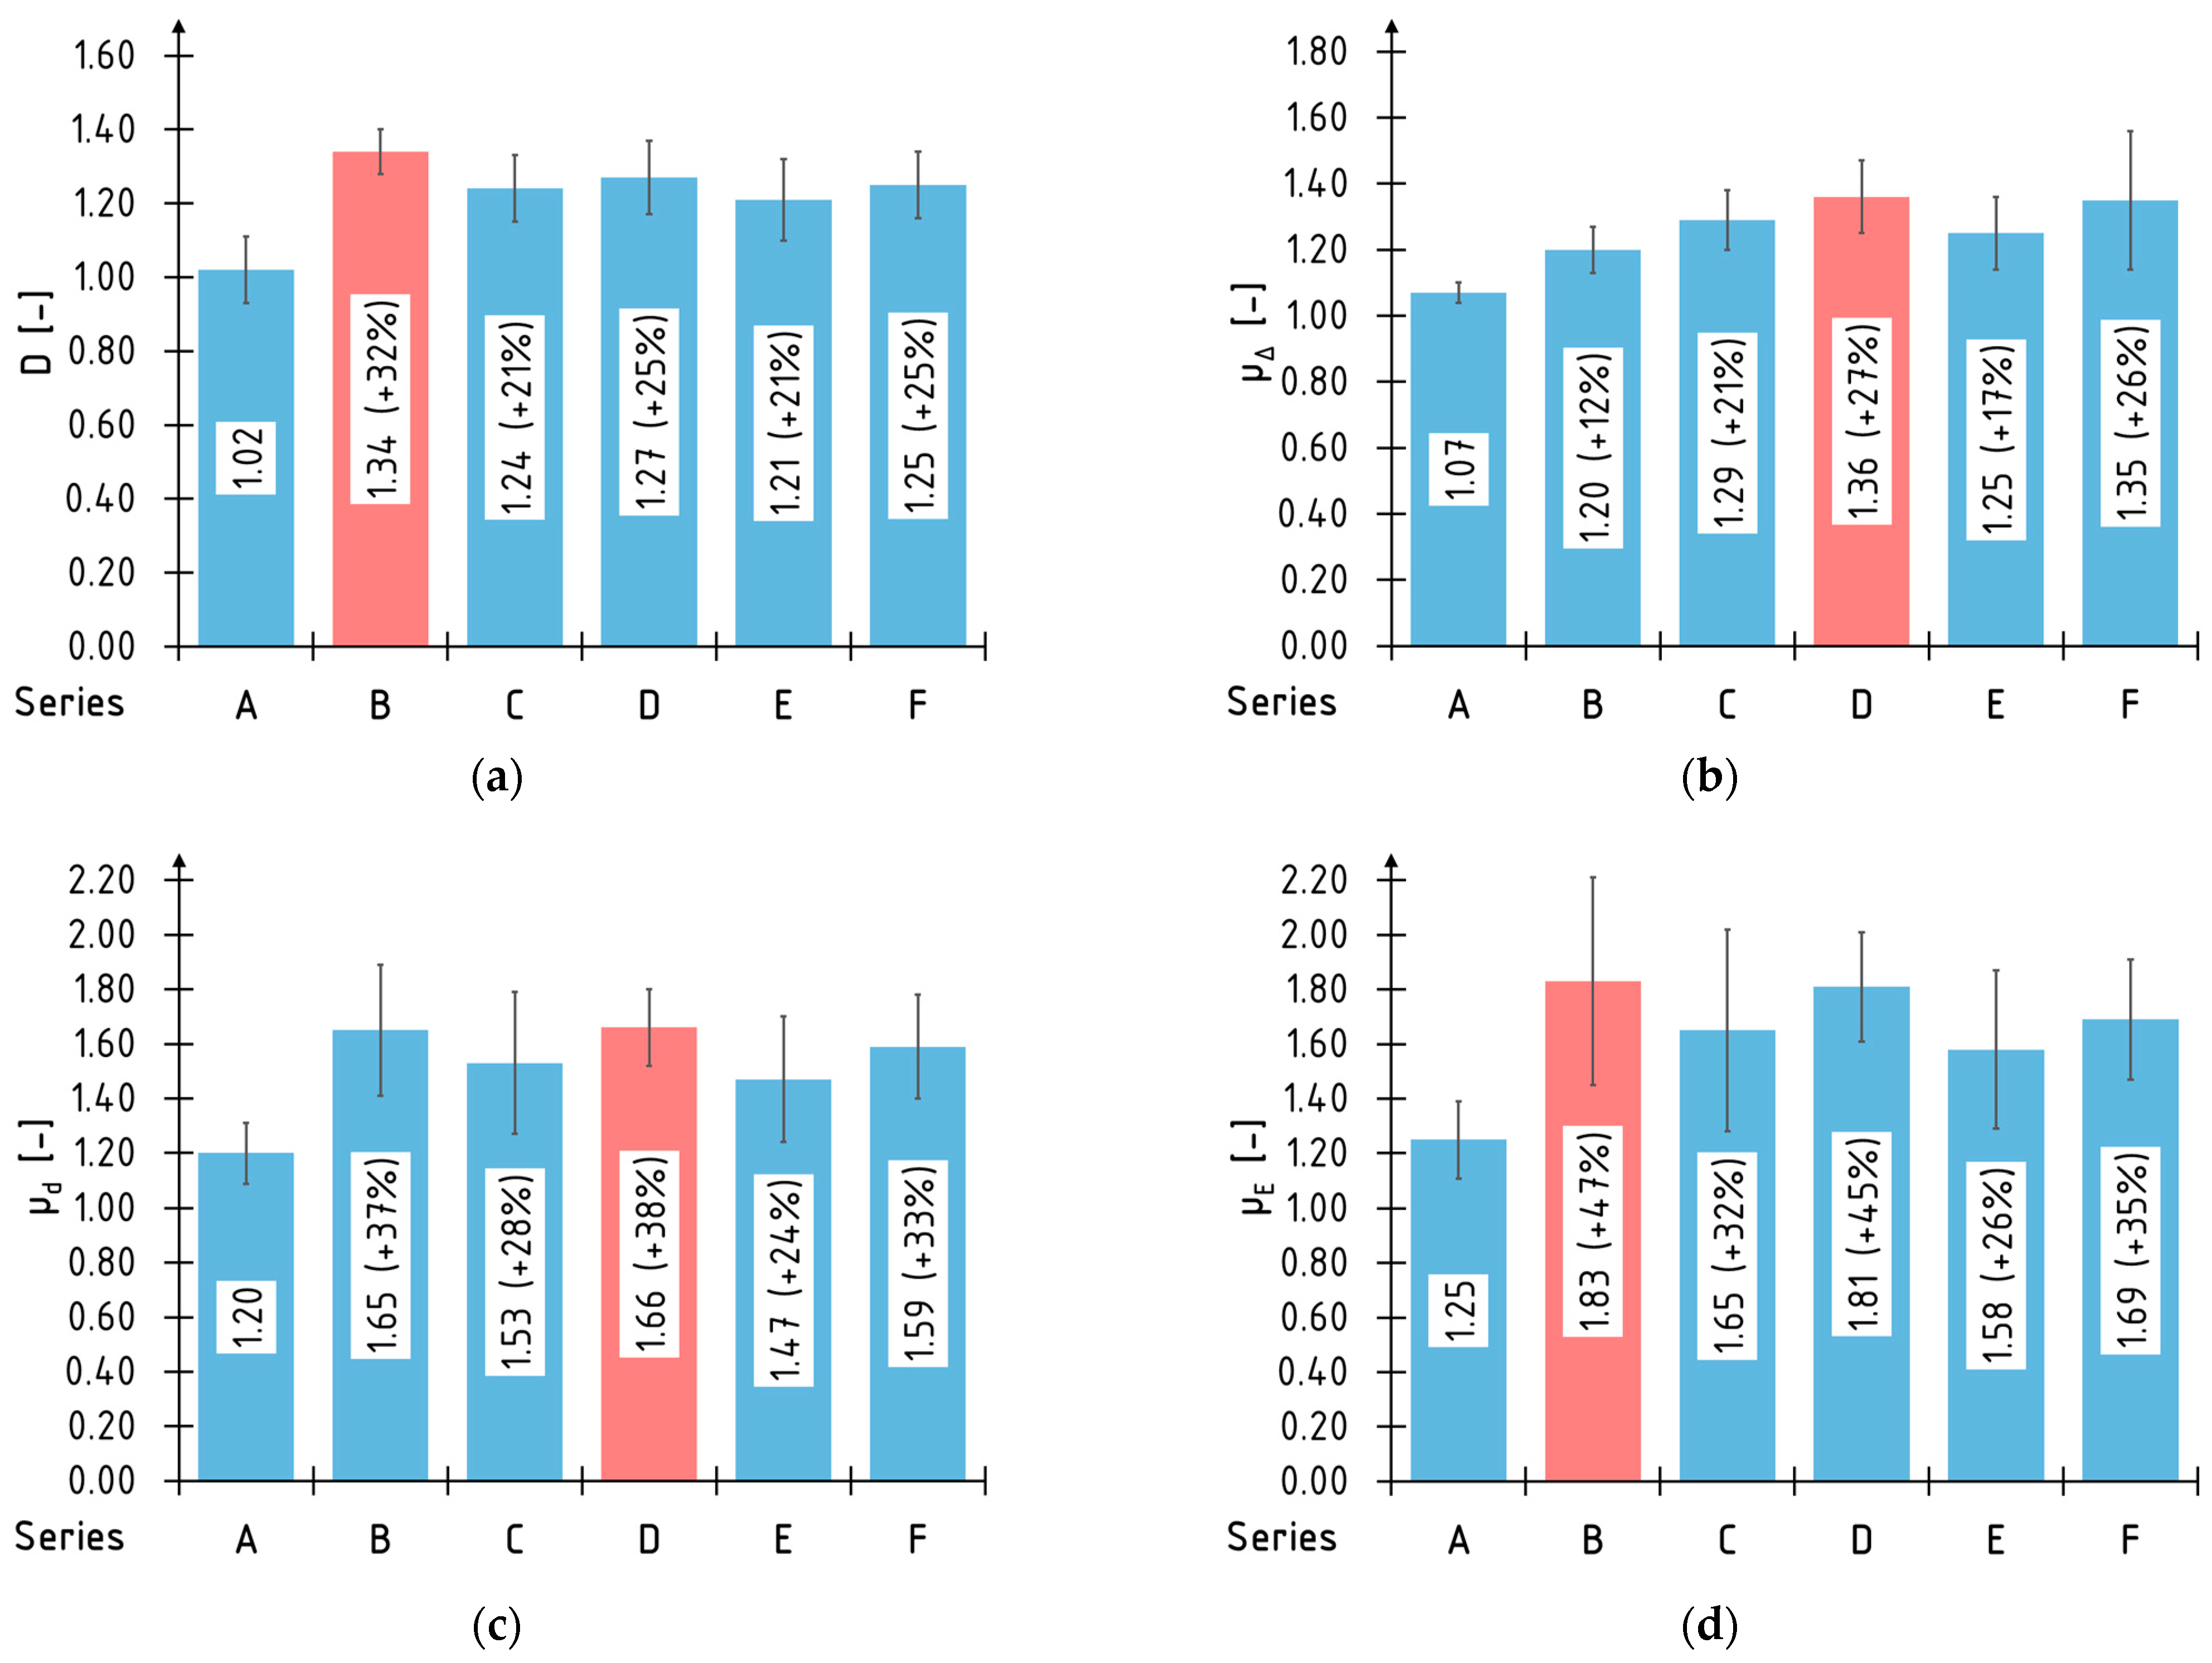
3.2. Ductility
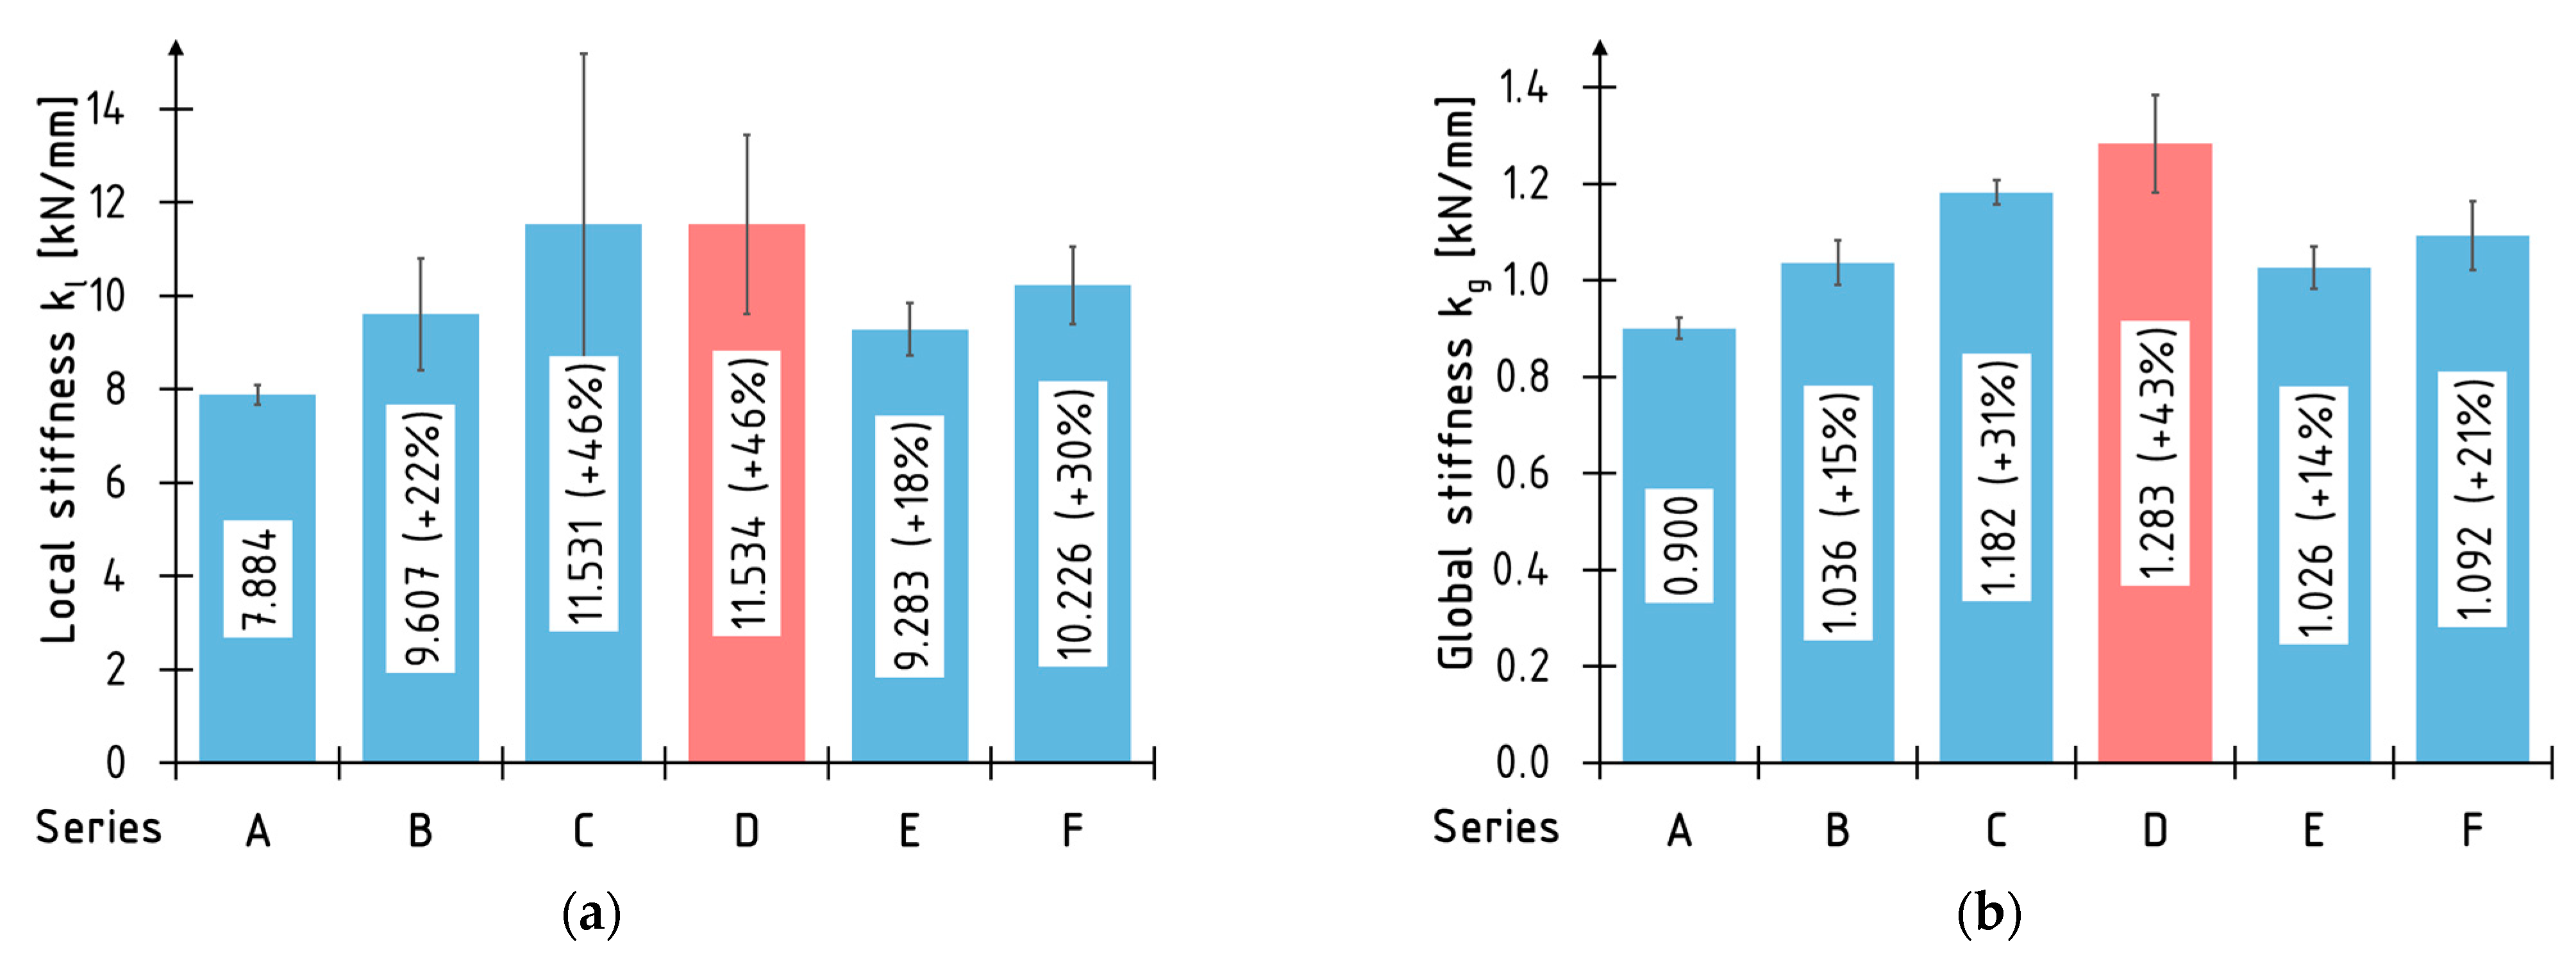
3.3. Stiffness
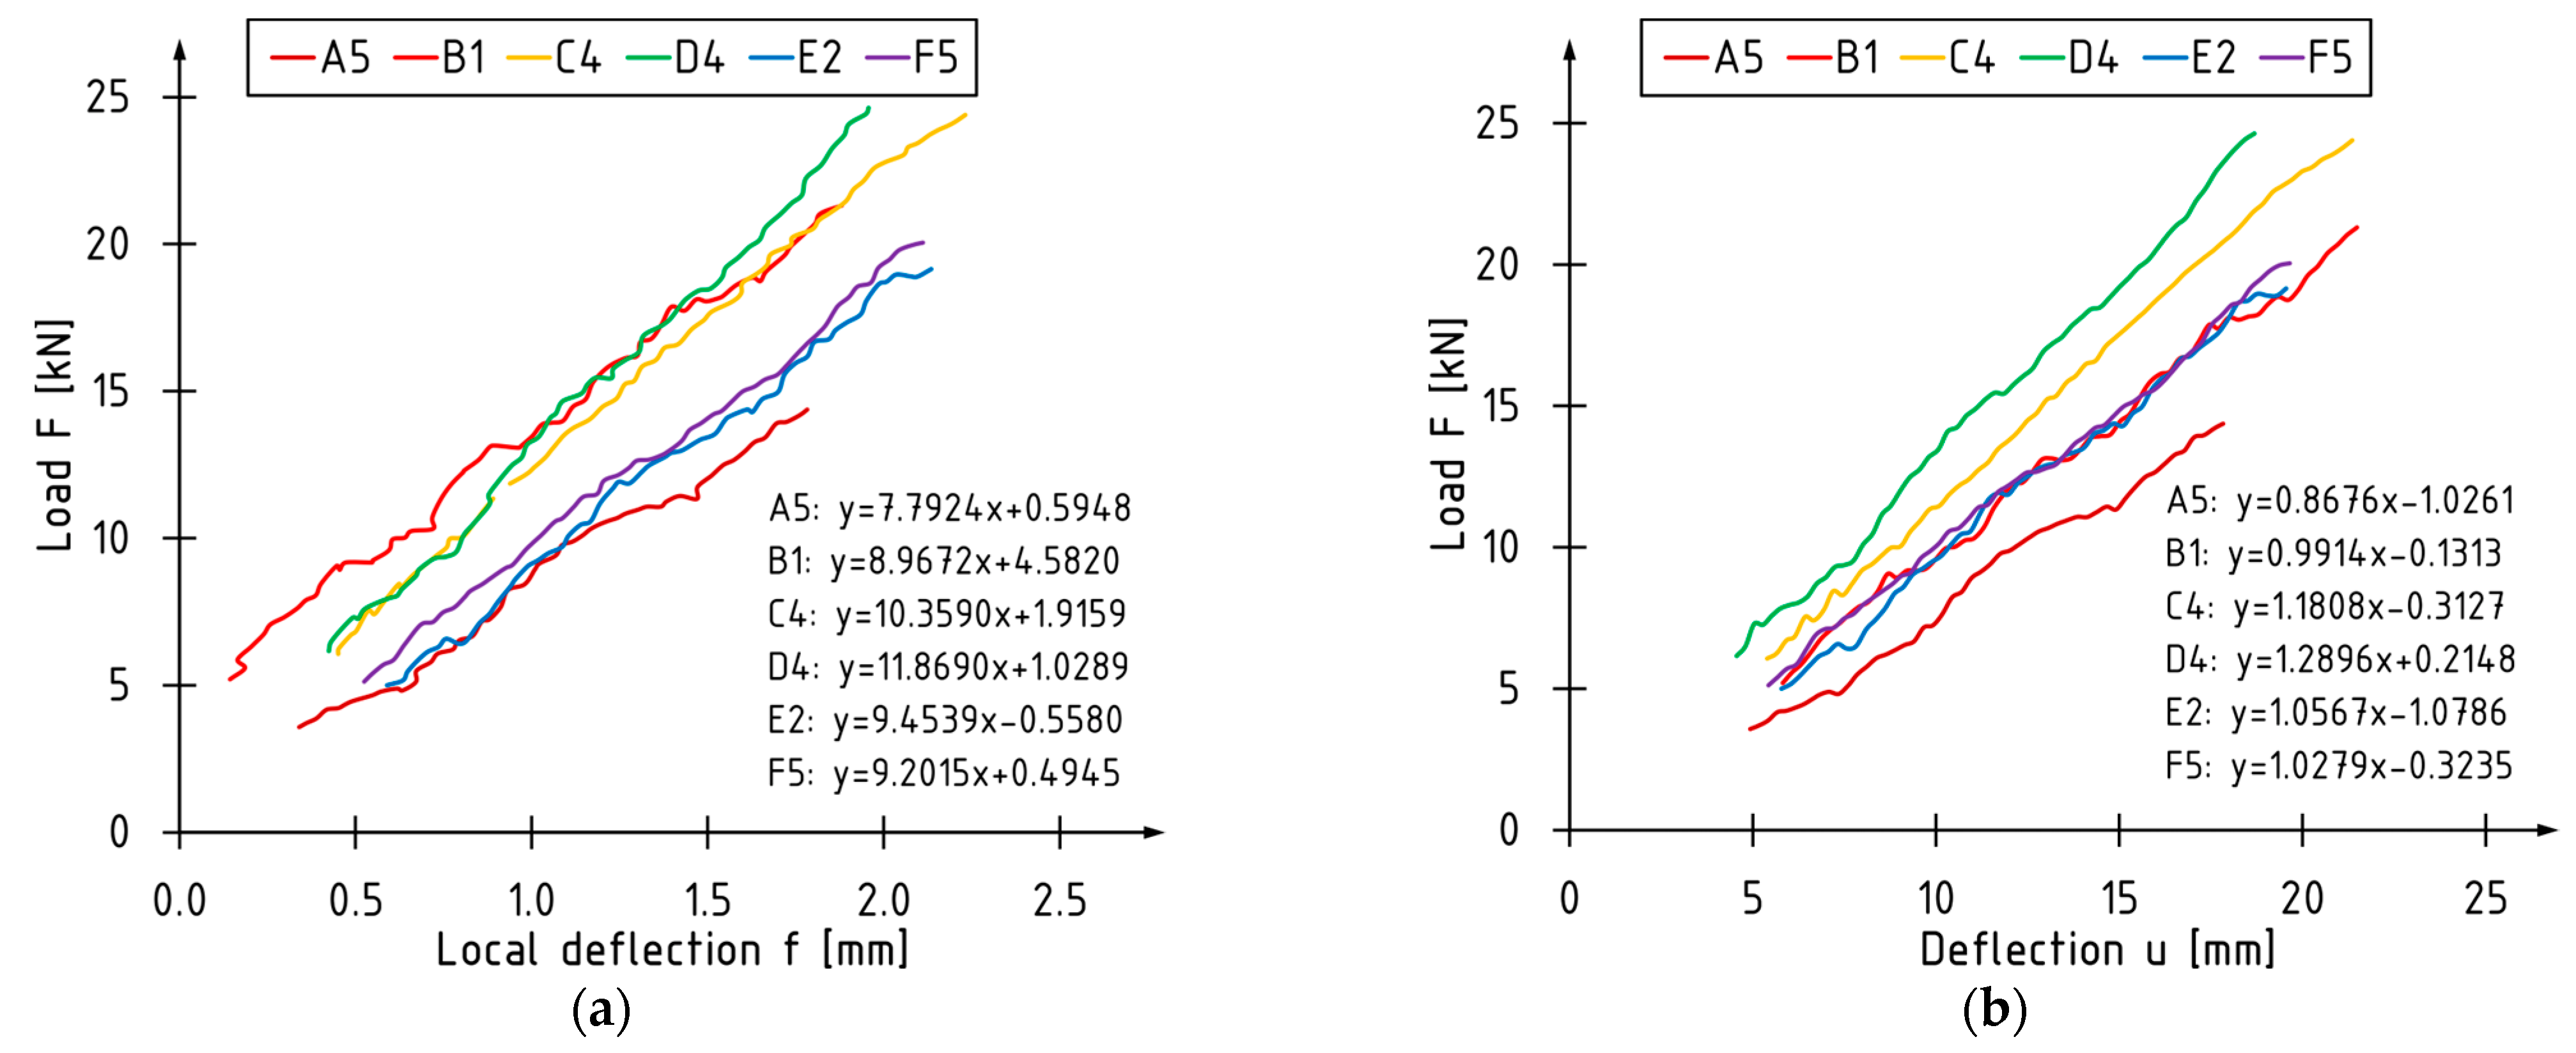
3.3.1. Local and Global Stiffness Coefficients
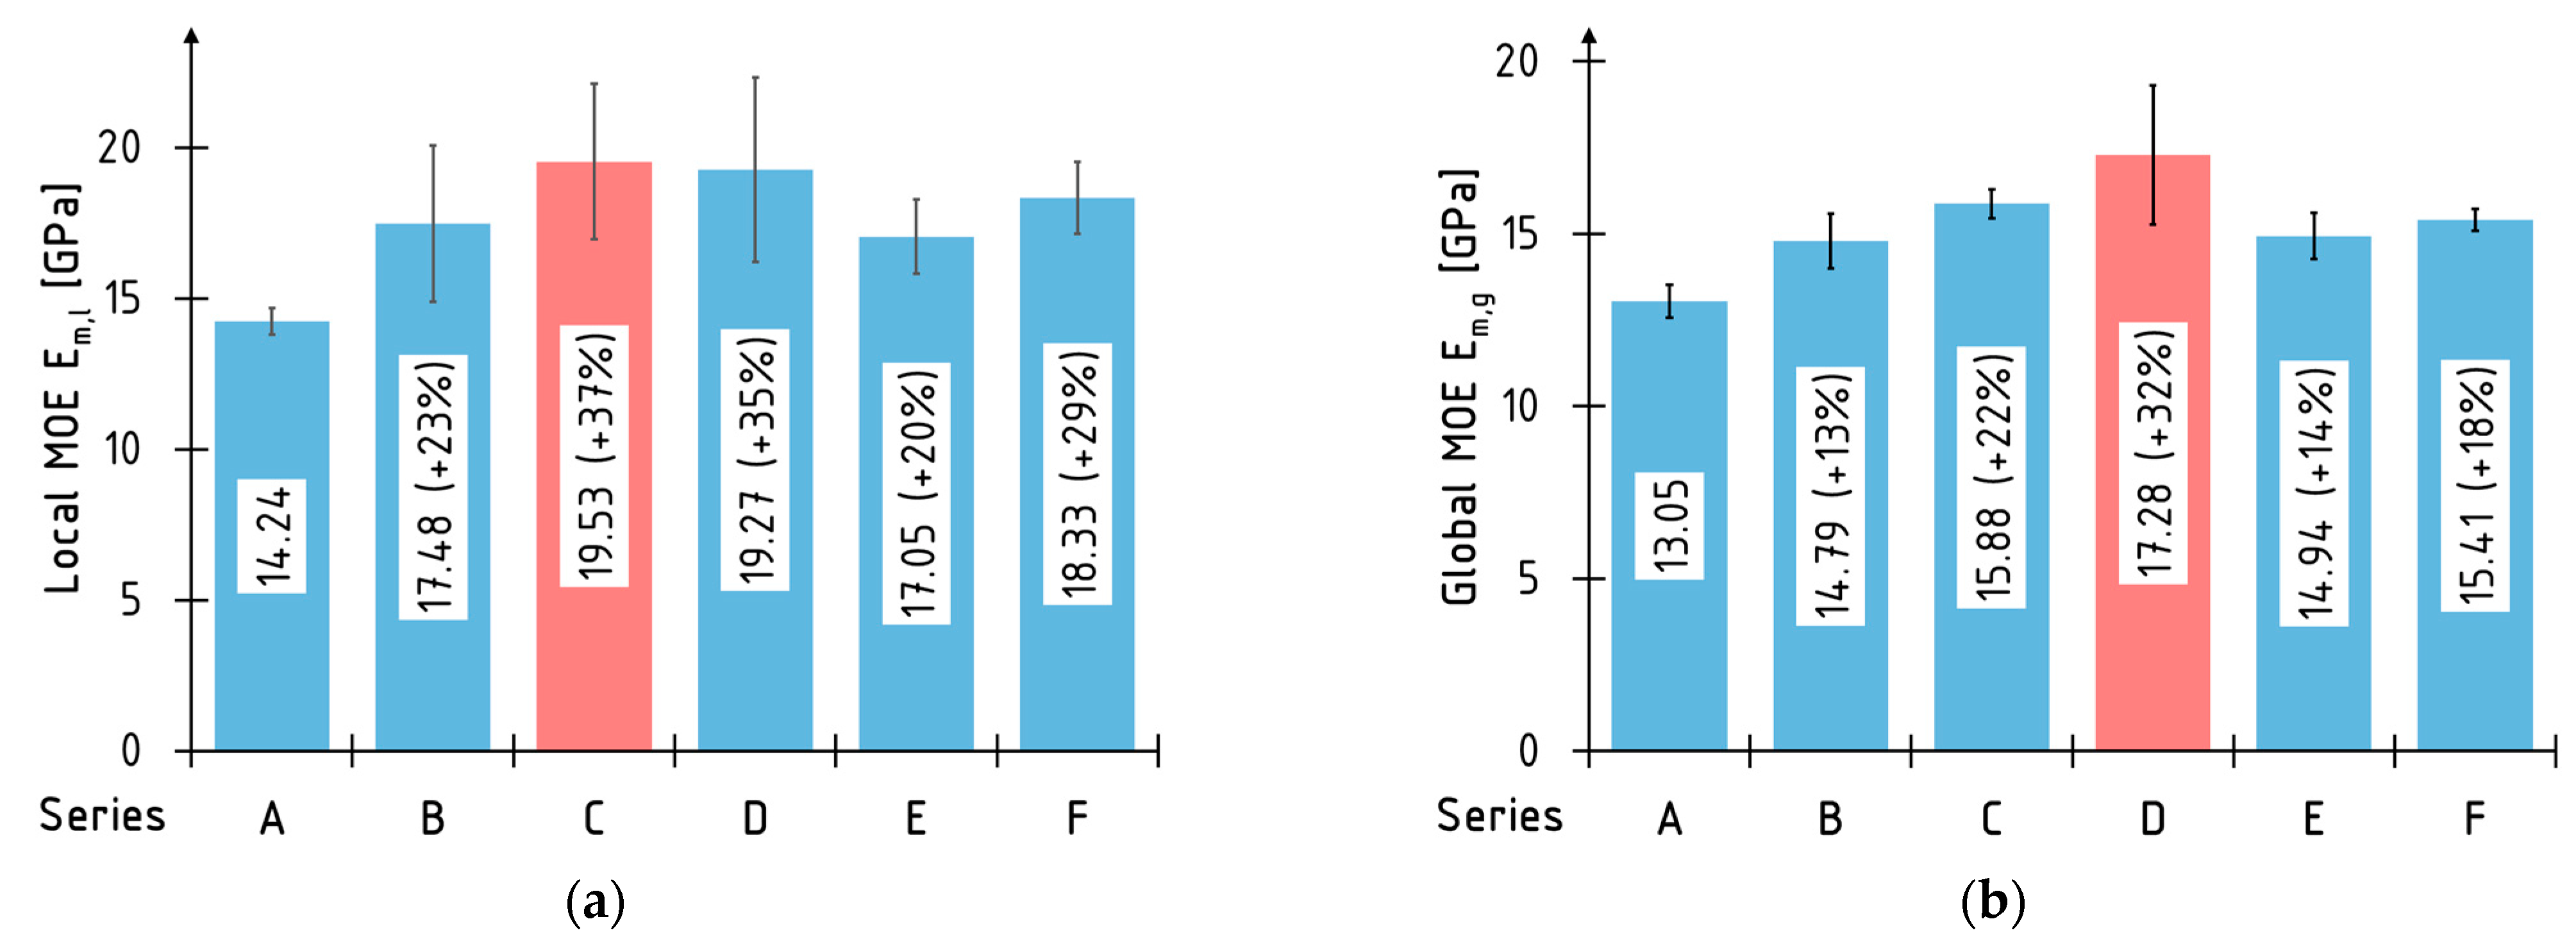
3.3.2. Global and Local Modulus of Elasticity
4. Conclusions
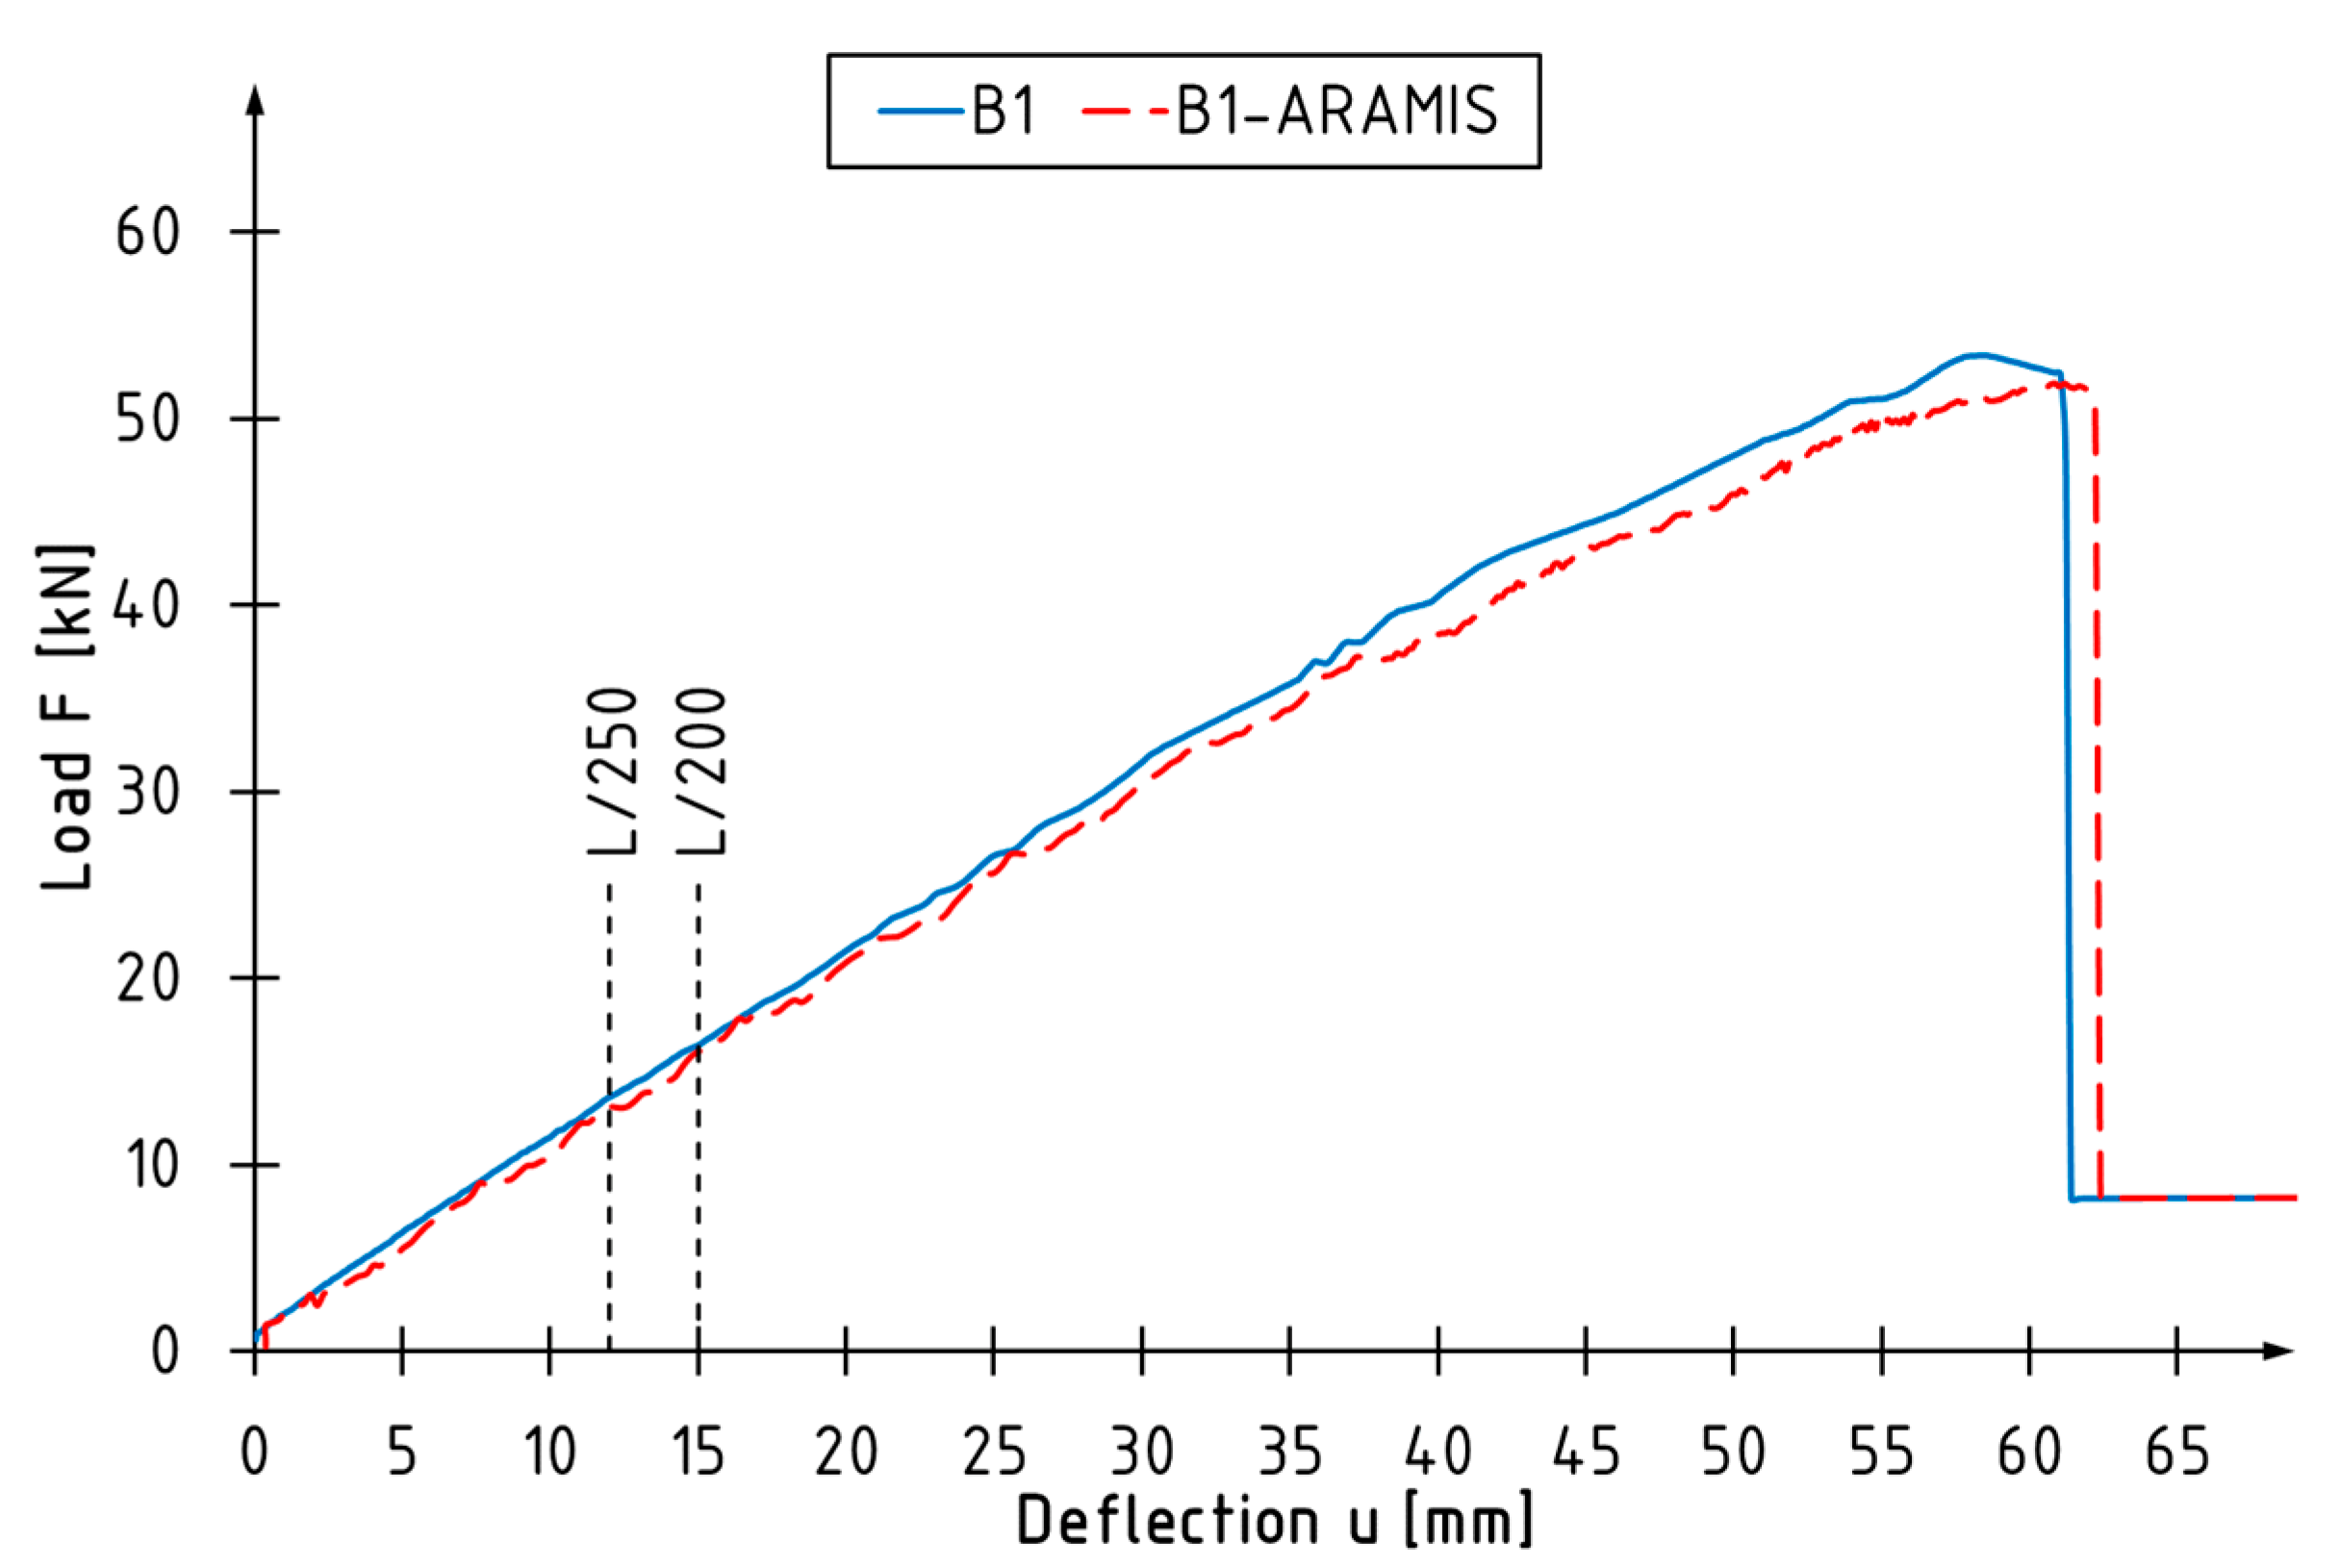
- The ARAMIS optical system can be used for non-destructive examination non-interfering with the side surface of unstrengthened and strengthened wooden elements. The applied measurement system allows for making a wide range of deformations, strains, stiffness and ductility analyses.
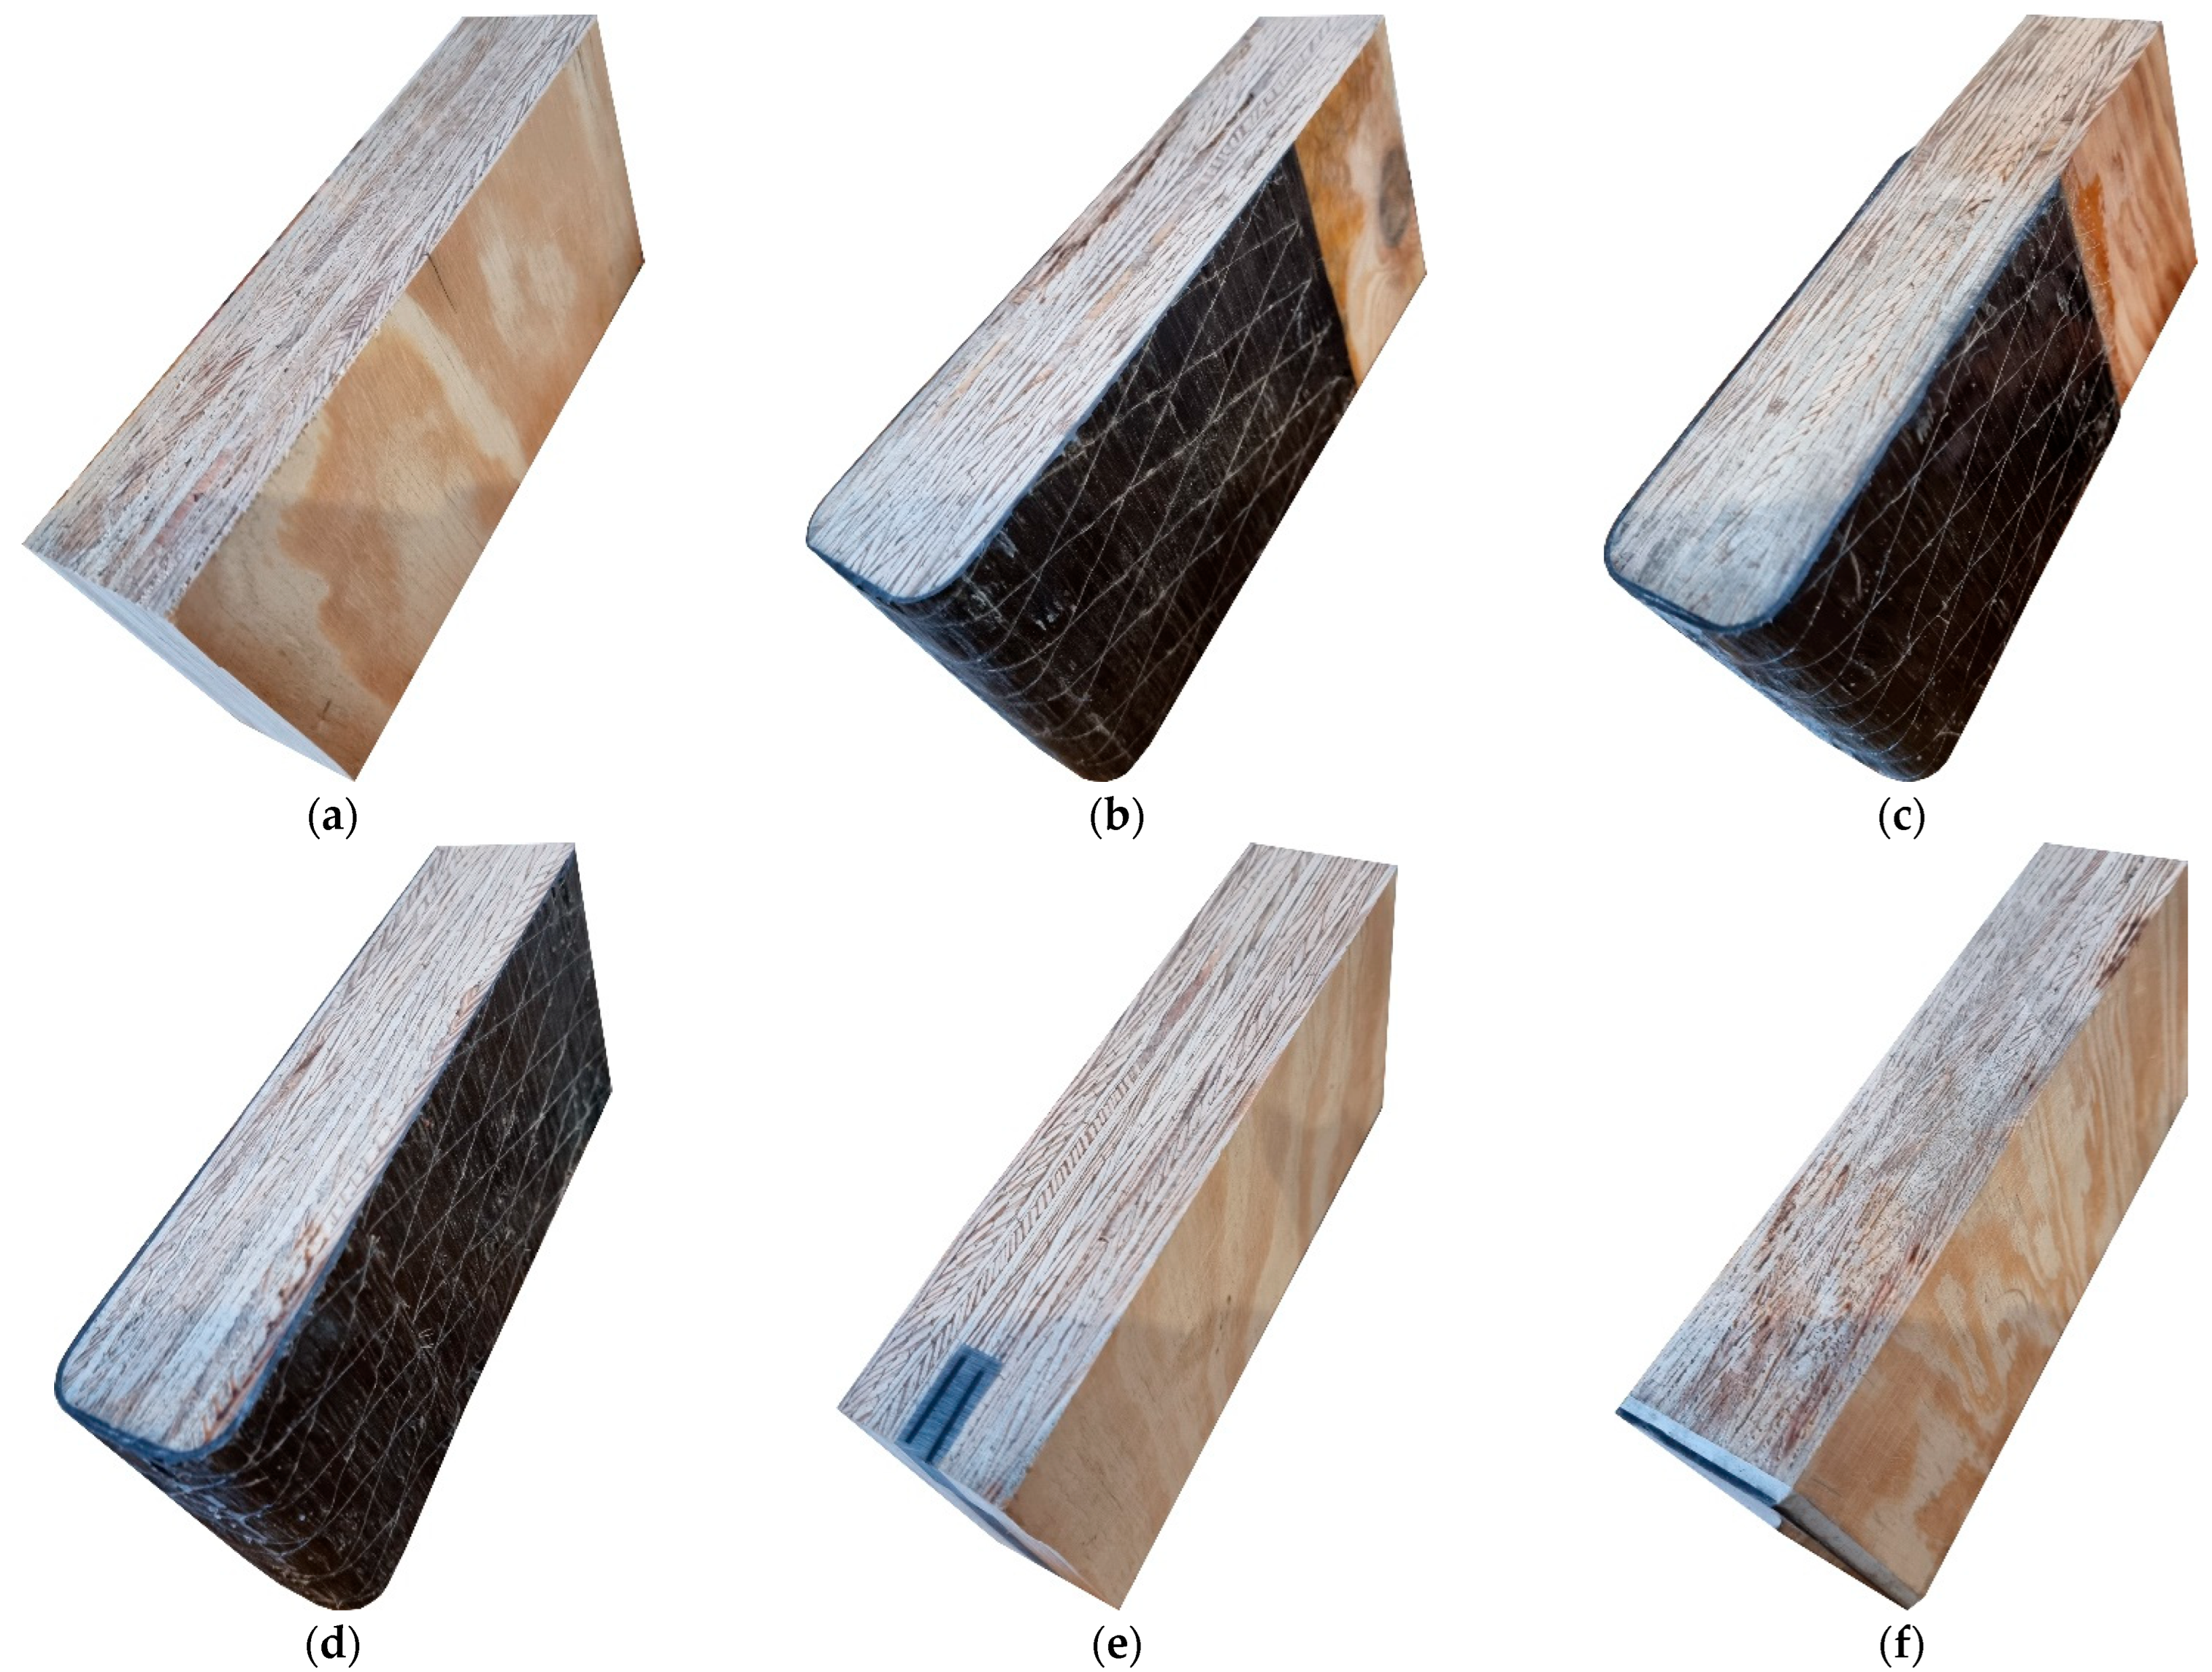
- The reinforcement of beams using two layers of the CFRP sheets is the most effective method of beam reinforcement among the discussed strengthening configurations, given the increase in stiffness and bending ductility. Better results can also be achieved when the CFRP sheet covers the entire side surfaces.
- Better mechanical parameters are observed for the beams strengthened with the CFRP laminates glued to the bottom surface rather than glued into the predrilled grooves.
- Strain profiles analysis indicated changes in the distribution of the strain in the compressive zone from the linear for the unstrengthened to the bilinear (consisted of linear and parabolic part) for the strengthened LVL beams.
- Distribution of strains along the depth of the cross-section depends on the presence of defects in the LVL, the type of reinforcement and its location. Reading of the strains depends on the distance between the section where the strains are measured and the section where the failure occurs.
- Higher values of the stiffness coefficient and the modulus of elasticity were obtained for the local in comparison to the global values. It is caused by the way of evaluating the curvature of the beams during bending in each method.
Author Contributions
Funding
Institutional Review Board Statement
Informed Consent Statement
Data Availability Statement
Acknowledgments
Conflicts of Interest
References
- Neuhaus, H. Budownictwo Drewniane; Polskie Wydawnictwo Techniczne: Rzeszów, Poland, 2006. [Google Scholar]
- Jasieńko, J. Połączenia Klejowe I Inżynierskie w Naprawie, Konserwacji I Wzmacnianiu Zabytkowych Konstrukcji Drewnianych; Dolnośląskie Wydawnictwo Edukacyjne: Wrocław, Poland, 2003. [Google Scholar]
- Masłowski, E.; Spiżewska, D. Wzmacnianie Konstrukcji Budowlanych; Wydawnictwo Arkady: Warszawa, Poland, 2000. [Google Scholar]
- Rudziński, L. Konstrukcje Drewniane. Naprawy, Wzmocnienia, Przykłady Obliczeń; Wydawnictwo Politechniki Świętokrzyskiej: Kielce, Poland, 2010. [Google Scholar]
- Saad, K.; Lengyel, A. Strengthening Timber Structural Members with CFRP and GFRP: A State-of-the-Art Review. Polymers 2022, 14, 2381. [Google Scholar] [CrossRef] [PubMed]
- Bakalarz, M.; Kossakowski, P. Mechanical Properties of Laminated Veneer Lumber Beams Strengthened with CFRP Sheets. Arch. Civ. Eng. 2019, 65, 57–66. [Google Scholar] [CrossRef]
- Śliwa-Wieczorek, K.; Ostrowski, K.A.; Jaskowska-Lemańska, J.; Karolak, A. The Influence of CFRP Sheets on the Load-Bearing Capacity of the Glued Laminated Timber Beams under Bending Test. Materials 2021, 14, 4019. [Google Scholar] [CrossRef] [PubMed]
- Halicka, A.; Ślósarz, S. Strengthening of timber beams with pretensioned CFRP strips. Structures 2021, 34, 2912–2921. [Google Scholar] [CrossRef]
- Vahedian, A.; Shrestha, R.; Crews, K. Experimental and analytical investigation on CFRP strengthened glulam laminated timber beams: Full-scale experiments. Compos. B Eng. 2019, 164, 377–389. [Google Scholar] [CrossRef]
- Raftery, G.M.; Whelan, C. Low-grade glued laminated timber beams reinforced using improved arrangements of bonded-in GFRP rods. Constr. Build. Mater. 2014, 52, 209–220. [Google Scholar] [CrossRef]
- Corradi, M.; Borri, A. Fir and chestnut timber beams reinforced with GFRP pultruded elements. Compos. B Eng. 2007, 38, 172–181. [Google Scholar] [CrossRef]
- Yeboah, D.; Gkantou, M. Investigation of flexural behaviour of structural timber beams strengthened with NSM basalt and glass FRP bars. Structures 2021, 33, 390–405. [Google Scholar] [CrossRef]
- Kossakowski, P.G.; Bakalarz, M. The flexural capacity of laminated veneer lumber beams strengthened with AFRP and GFRP sheets. Tech. Trans. 2019, 2, 85–95. [Google Scholar] [CrossRef]
- Nowak, T.; Jasieńko, J.; Kotwica, E.; Krzosek, S. Strength enhancement of timber beams using steel plates–review and experimental tests. Drew. Pr. Nauk. Doniesienia Komun. 2016, 59, 75–80. [Google Scholar] [CrossRef]
- Balmori, J.-A.; Basterra, L.-A.; Acuña, L. Internal GFRP Reinforcement of Low-Grade Maritime Pine Duo Timber Beams. Materials 2020, 13, 571. [Google Scholar] [CrossRef]
- Wang, B.; Bachtiar, E.V.; Yan, L.; Kasal, B.; Fiore, V. Flax, Basalt, E-Glass FRP and Their Hybrid FRP Strengthened Wood Beams: An Experimental Study. Polymers 2019, 11, 1255. [Google Scholar] [CrossRef]
- Ye, L.; Wang, B.; Shao, P. Experimental and Numerical Analysis of a Reinforced Wood Lap Joint. Materials 2020, 13, 4117. [Google Scholar] [CrossRef]
- Rescalvo, F.J.; Valverde-Palacios, I.; Suarez, E.; Gallego, A. Experimental Comparison of Different Carbon Fiber Composites in Reinforcement Layouts for Wooden Beams of Historical Buildings. Materials 2017, 10, 1113. [Google Scholar] [CrossRef]
- Sokołowski, P.; Kossakowski, P.G. Estimation of the modulus fir wood reinforced with PBO fiber mesh. Arch. Civ. Eng. 2018, 64, 105–121. [Google Scholar] [CrossRef]
- Kawecki, B.; Podgórski, J. The Effect of Glue Cohesive Stiffness on the Elastic Performance of Bent Wood–CFRP Beams. Materials 2020, 13, 5075. [Google Scholar] [CrossRef]
- Socha, T.; Kula, K.; Denisiewicz, A.; Lesiuk, G.; Błażejewski, W. Rheological Relaxation of OSB Beams Reinforced with CFRP Composites. Materials 2021, 14, 7527. [Google Scholar] [CrossRef]
- Lukin, M.; Prusov, E.; Roshchina, S.; Karelina, M.; Vatin, N. Multi-Span Composite Timber Beams with Rational Steel Reinforcements. Buildings 2021, 11, 46. [Google Scholar] [CrossRef]
- Bakalarz, M. Load bearing capacity of laminated veneer lumber beams strengthened with CFRP strips. Arch. Civ. Eng. 2021, 67, 139–155. [Google Scholar] [CrossRef]
- Bakalarz, M.M.; Kossakowski, P.G.; Tworzewski, P. Strengthening of Bent LVL Beams with Near-Surface Mounted (NSM) FRP Reinforcement. Materials 2020, 13, 2350. [Google Scholar] [CrossRef]
- Bakalarz, M.M.; Kossakowski, P.G. Strengthening of Full-Scale Laminated Veneer Lumber Beams with CFRP Sheets. Materials 2022, 15, 6526. [Google Scholar] [CrossRef] [PubMed]
- Bakalarz, M.M.; Kossakowski, P. Ductility and Stiffness of Laminated Veneer Lumber Beams Strengthened with Fibrous Composites. Fibers 2022, 10, 21. [Google Scholar] [CrossRef]
- Bakalaraz, M.; Kossakowski, P. Sztywność na zginanie belek z forniru klejonego warstwowo wzmocnionych matami węglowymi o ultrawysokim module sprężystości. Inżynieria I Bud. 2019, 1, 47–50. [Google Scholar]
- Tworzewski, P.; Goszczyńska, B. An Application of an Optical Measuring System to Reinforced Concrete Beams Analysis. In Proceedings of the 2016 Prognostics and System Health Management Conference (PHM-Chengdu), Chengdu, China, 19–21 October 2016. [Google Scholar] [CrossRef]
- Tworzewski, P. Zastosowanie cyfrowej korelacji obrazu w badaniach elementów żelbetowych. Przegląd Bud. 2022, 93, 103–106. [Google Scholar]
- Szewczyk, P.; Kudyba, P. Effectiveness of Selected Strain and Displacement Measurement, Techniques in Civil Engineering. Buildings 2022, 12, 172. [Google Scholar] [CrossRef]
- Sutton, M.A.; Wolters, W.J.; Peters, W.H.; Ranson, W.F.; McNeill, S.R. Determination of displacements using an improved digital correlation method. Image Vis. Comput. 1983, 1, 133–139. [Google Scholar] [CrossRef]
- Blikharskyy, Y.; Kopiika, N.; Khmil, R.; Selejdak, J.; Blikharskyy, Z. Review of Development and Application of Digital Image Correlation Method for Study of Stress–Strain State of RC Structures. Appl. Sci. 2022, 12, 10157. [Google Scholar] [CrossRef]
- Jeong, G.Y.; Kong, J.H.; Lee, S.J.; Pang, S.J. Comparisons of bearing properties for various oriented glulam using digital image correlation. J. Wood Sci. 2018, 64, 237–245. [Google Scholar] [CrossRef]
- Navaratnam, S.; Ngo, T.; Christopher, P.; Linforth, S. The use of digital image correlation for identifying failure characteristics of cross-laminated timber under transverse loading. Measurement 2020, 154, 107502. [Google Scholar] [CrossRef]
- Liu, W.; Yu, Y.; Zhang, Z.; Liu, C.; Tong, Y. Impact resistance of CFRP-reinforced wood beams under axial force using a digital image correlation method. Compos. Struct. 2021, 261, 113276. [Google Scholar] [CrossRef]
- Lima, C.H.; Gomes, F.C.; Pereira, R.A.; Rivera, F.P. Particle image velocimetry and digital image correlation for determining the elasticity modulus in wood. Sci. Agric. 2022, 79, 20200297. [Google Scholar] [CrossRef]
- Kawecki, B. Guidelines for FEM modelling of wood-CFRP beams using ABAQUS. Arch. Civ. Eng. 2021, 67, 175–191. [Google Scholar] [CrossRef]
- Tang, Y.; Huang, Z.; Chen, Z.; Chen, M.; Zhou, H.; Zhang, H.; Sun, J. Novel visual crack width measurement based on backbone double-scale features for improved detection automation. Eng. Struct. 2023, 274, 115158. [Google Scholar] [CrossRef]
- Verma, A.; Baurai, K.; Sanjay, M.R.; Siengchin, S. Mechanical, microstructural, and thermal characterization insights of pyrolyzed carbon black from waste tires reinforced epoxy nanocomposites for coating application. Polym. Compos. 2020, 41, 338–349. [Google Scholar] [CrossRef]
- Verma, A.; Negi, P.; Singh, V.K. Experimental analysis on carbon residuum transformed epoxy resin: Chicken feather fiber hybrid composite. Polym. Compos. 2019, 40, 2690–2699. [Google Scholar] [CrossRef]
- STEICO. STEICO LVL R—Fornir Klejony Warstwowo. Available online: https://www.steico.com/pl/produkty/produkty-konstrukcyjne/fornir-klejony-warstwowo-lvl/steico-lvl-r-fornir-klejony-warstwowo (accessed on 19 September 2022).
- S&P C-Laminate–Technical Information. Available online: https://www.sp-reinforcement.pl/sites/default/files/field_product_col_doc_file/c-laminates_polska_ver012019-low.pdf (accessed on 19 September 2022).
- S&P C-Sheet 240–Technical Information. Available online: https://www.sp-reinforcement.pl/sites/default/files/field_product_col_doc_file/c-sheet_240_polska_ver20190627.pdf (accessed on 19 September 2022).
- S&P Resin 55 HP–Technical Information. Available online: https://www.sp-reinforcement.pl/sites/default/files/field_product_col_doc_file/resin55_hp_polska_ver20190523.pdf (accessed on 19 September 2022).
- S&P Resin 220–Technical Information. Available online: https://www.sp-reinforcement.pl/sites/default/files/field_product_col_doc_file/resin220_polska_ver20190523.pdf (accessed on 19 September 2022).
- PN-EN 408+A1:2012; Timber Structures—Structural Timber and Glued Laminated Timber. Determination of Some Physical and Mechanical Properties. PKN: Warszawa, Poland, 2012.
- PN-EN 14374:2005; Timber Structures—Structural Laminated Veneer Lumber (LVL). Requirements. PKN: Warszawa, Poland, 2005.
- Borri, A.; Corradi, M.; Speranzini, E. Bending Tests on Natural Fiber Reinforced Fir Wooden Elements. Adv. Mater. Res. 2013, 778, 537–544. [Google Scholar] [CrossRef]
- Park, R. Evaluation of ductility of structures and structural assemblages for laboratory testing. Bull. N. Z. Soc. Earthq. Eng. 1989, 22, 155–166. [Google Scholar] [CrossRef]
- Subhani, M.; Globa, A.; Al-Ameri, R.; Moloney, J. Flexural strengthening of LVL beam using CFRP. Constr. Build. Mater. 2017, 150, 480–489. [Google Scholar] [CrossRef]
- Naaman, A.E.; Jeong, S.M. Structural Ductility of Concrete Beams Prestressed with FRP Tendons. In Non-Metallic (FRP) Reinforcement for Concrete Structures, Proceedings of the 2nd International RILEM Symposium (FRPRXS-2), Ghent, Belgium, 23–25 August 1995; RILEM: Bagneus, France, 1995; pp. 379–386. [Google Scholar]
- Nowak, T. Analiza Pracy Statycznej Zginanych Belek Drewnianych Wzmacnianych Przy Użyciu CFRP. Ph.D. Thesis, Politechnika Wrocławska, Wrocław, Poland, 2007. [Google Scholar]


| Parameter | Value |
|---|---|
| Bending strength, edge wise [MPa] | 44 |
| Bending strength, flat wise [MPa] | 50 |
| Tension strength (parallel to grain) (for 3000 mm sample) [MPa] | 36 |
| Tension strength (perpendicular to grain) [MPa] | 0.9 |
| Compression strength (parallel to grain) [MPa] | 40 |
| Compression strength (perpendicular to grain) [MPa] | 7.5 |
| Shear strength (parallel to grain) [MPa] | 4.6 |
| Modulus of elasticity [GPa] | 14 |
| Shear modulus [MPa] | 600 |
| Density [kg/m3] | 550 |
| Parameter | S&P C-Sheet 240 | S&P C-Laminate |
|---|---|---|
| Modulus of elasticity [GPa] | 265 | 170 |
| Tensile strength [Mpa] | 5100 | 2800 |
| Density [kg/m3] | 1800 | 1600 |
| Elongation at rupture [%] | 1.7–1.9 | 1.6 |
| Thickness [mm] | 0.333 | 1.4 |
| Parameter | S&P Resin 55 HP | S&P Resin 220 |
|---|---|---|
| Modulus of Elasticity [Gpa] | 3.2 | 7.1 |
| Compression strength [Mpa] | 100 | 70 |
| Density [kg/m3] | 1200–1300 | 1700–1800 |
| Number of Measurements | Average Value [mm] | Standard Deviation [mm] | Measurement Uncertainty [mm] |
|---|---|---|---|
| n | |||
| 1370 | 0.0039 | 0.0034 | 0.010 |
Disclaimer/Publisher’s Note: The statements, opinions and data contained in all publications are solely those of the individual author(s) and contributor(s) and not of MDPI and/or the editor(s). MDPI and/or the editor(s) disclaim responsibility for any injury to people or property resulting from any ideas, methods, instructions or products referred to in the content. |
© 2023 by the authors. Licensee MDPI, Basel, Switzerland. This article is an open access article distributed under the terms and conditions of the Creative Commons Attribution (CC BY) license (https://creativecommons.org/licenses/by/4.0/).
Share and Cite
Bakalarz, M.M.; Tworzewski, P.P. Application of Digital Image Correlation to Evaluate Strain, Stiffness and Ductility of Full-Scale LVL Beams Strengthened by CFRP. Materials 2023, 16, 1309. https://doi.org/10.3390/ma16031309
Bakalarz MM, Tworzewski PP. Application of Digital Image Correlation to Evaluate Strain, Stiffness and Ductility of Full-Scale LVL Beams Strengthened by CFRP. Materials. 2023; 16(3):1309. https://doi.org/10.3390/ma16031309
Chicago/Turabian StyleBakalarz, Michał Marcin, and Paweł Piotr Tworzewski. 2023. "Application of Digital Image Correlation to Evaluate Strain, Stiffness and Ductility of Full-Scale LVL Beams Strengthened by CFRP" Materials 16, no. 3: 1309. https://doi.org/10.3390/ma16031309
APA StyleBakalarz, M. M., & Tworzewski, P. P. (2023). Application of Digital Image Correlation to Evaluate Strain, Stiffness and Ductility of Full-Scale LVL Beams Strengthened by CFRP. Materials, 16(3), 1309. https://doi.org/10.3390/ma16031309