Thermal Diffusivity of Concrete Samples Assessment Using a Solar Simulator

 , , , , , , and
Abstract
1. Introduction
2. The Purpose and Scope of the Paper
- preparation of construction of a test bench for simulating solar radiation in laboratory conditions,
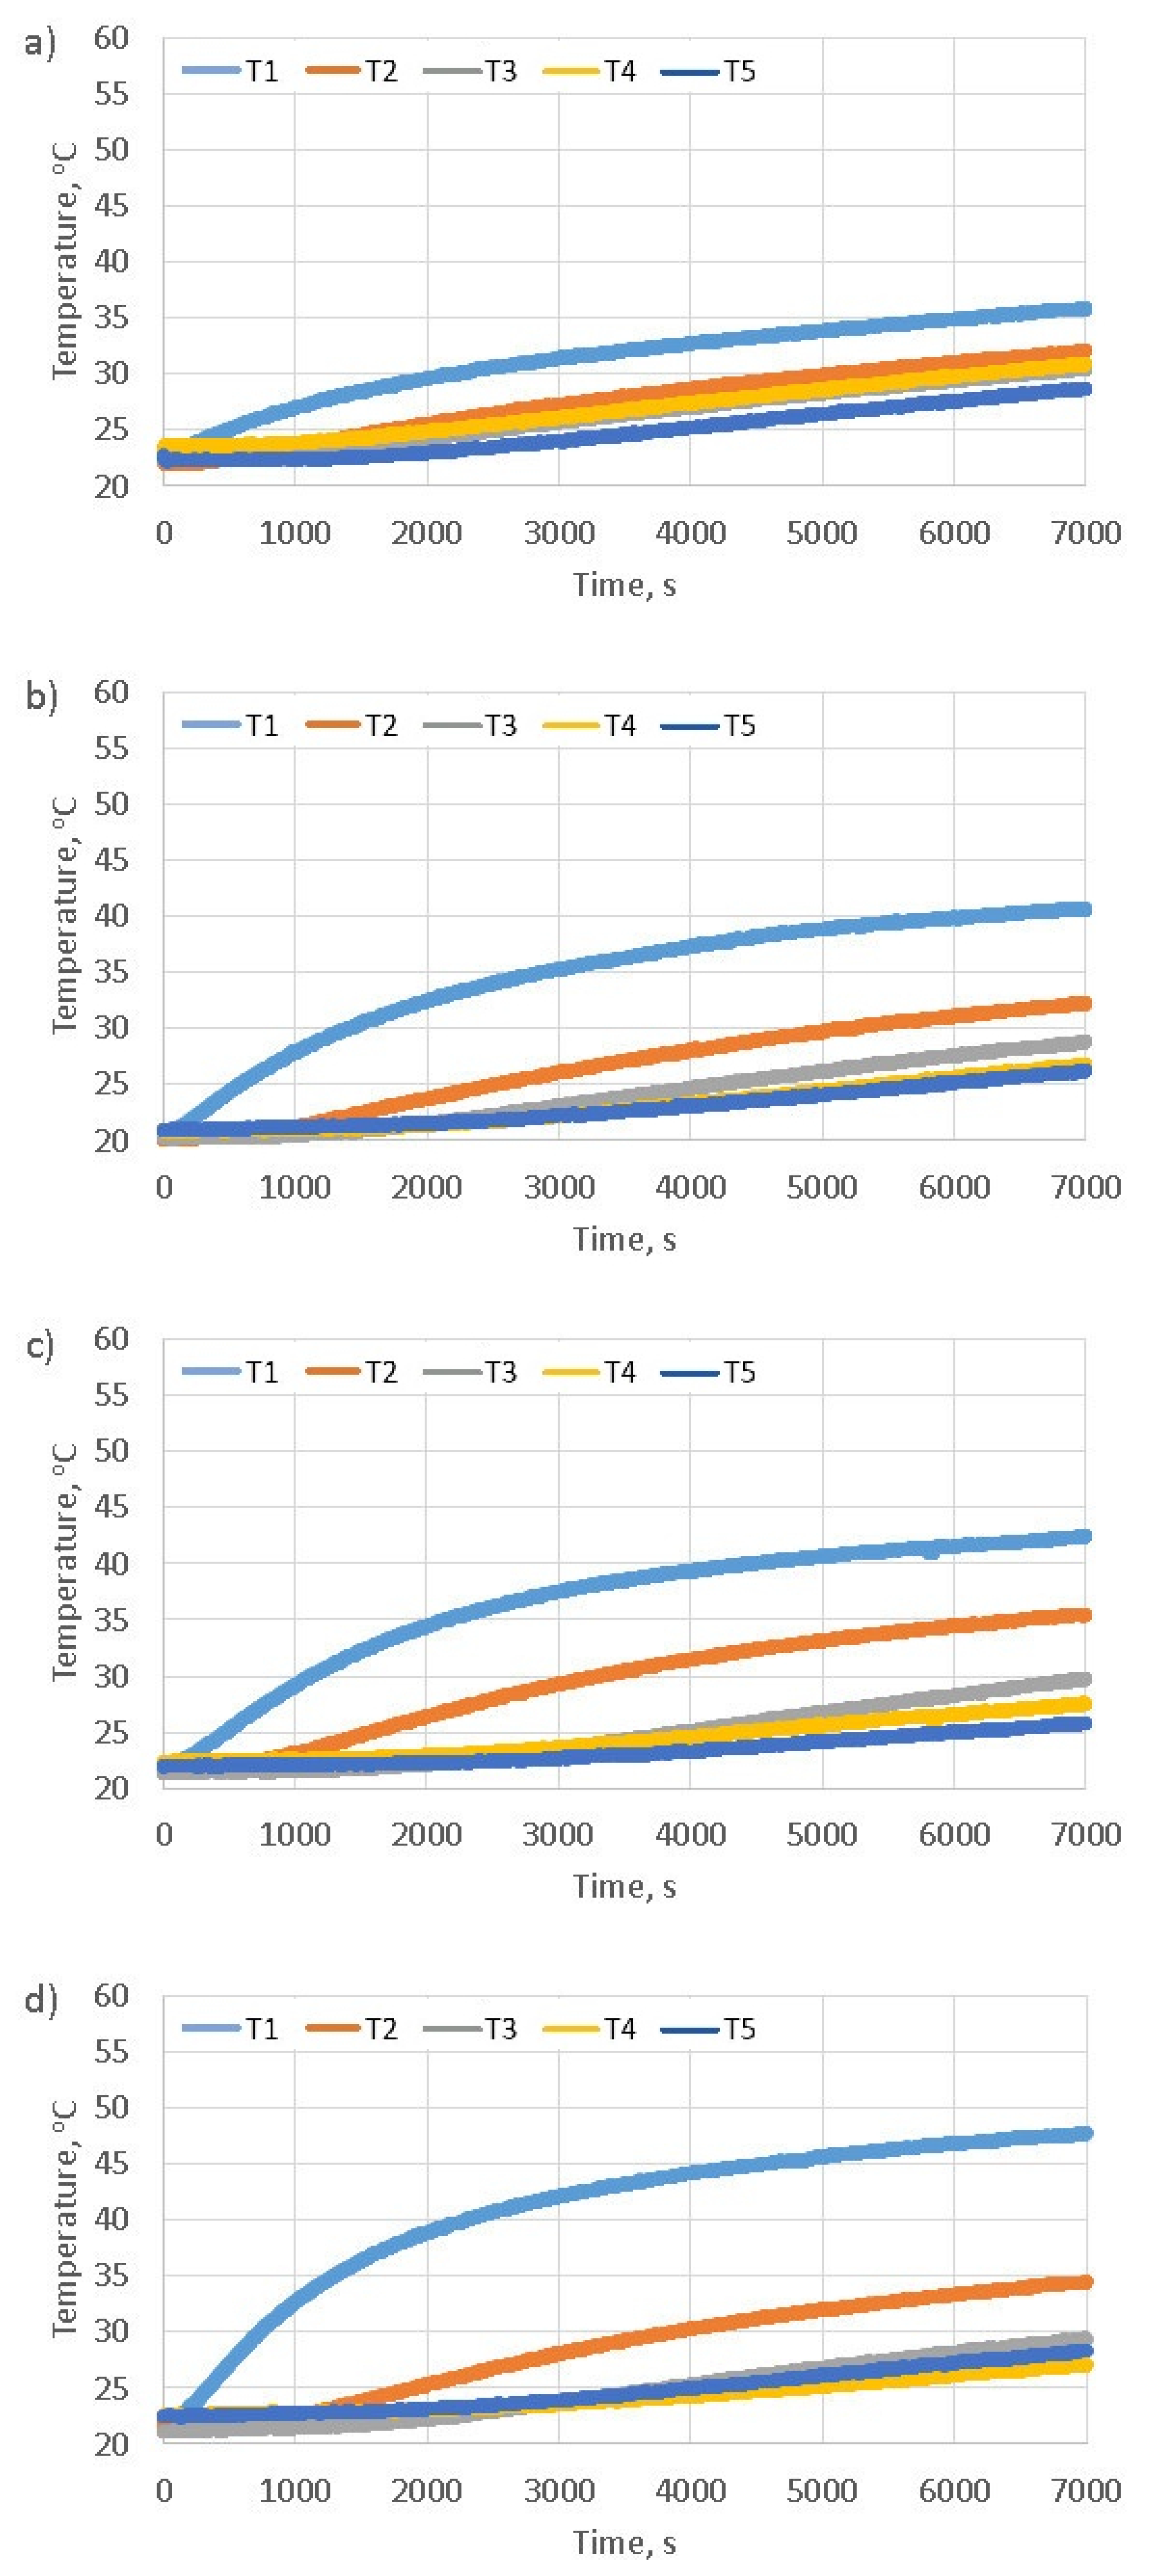
- laboratory testing in solar simulator of cubic samples made of cement concrete varying in density, which show substantial differences with respect to thermal properties,
- development of a computer implementation method of back-calculation procedure for the determination of thermal diffusivity coefficient values,
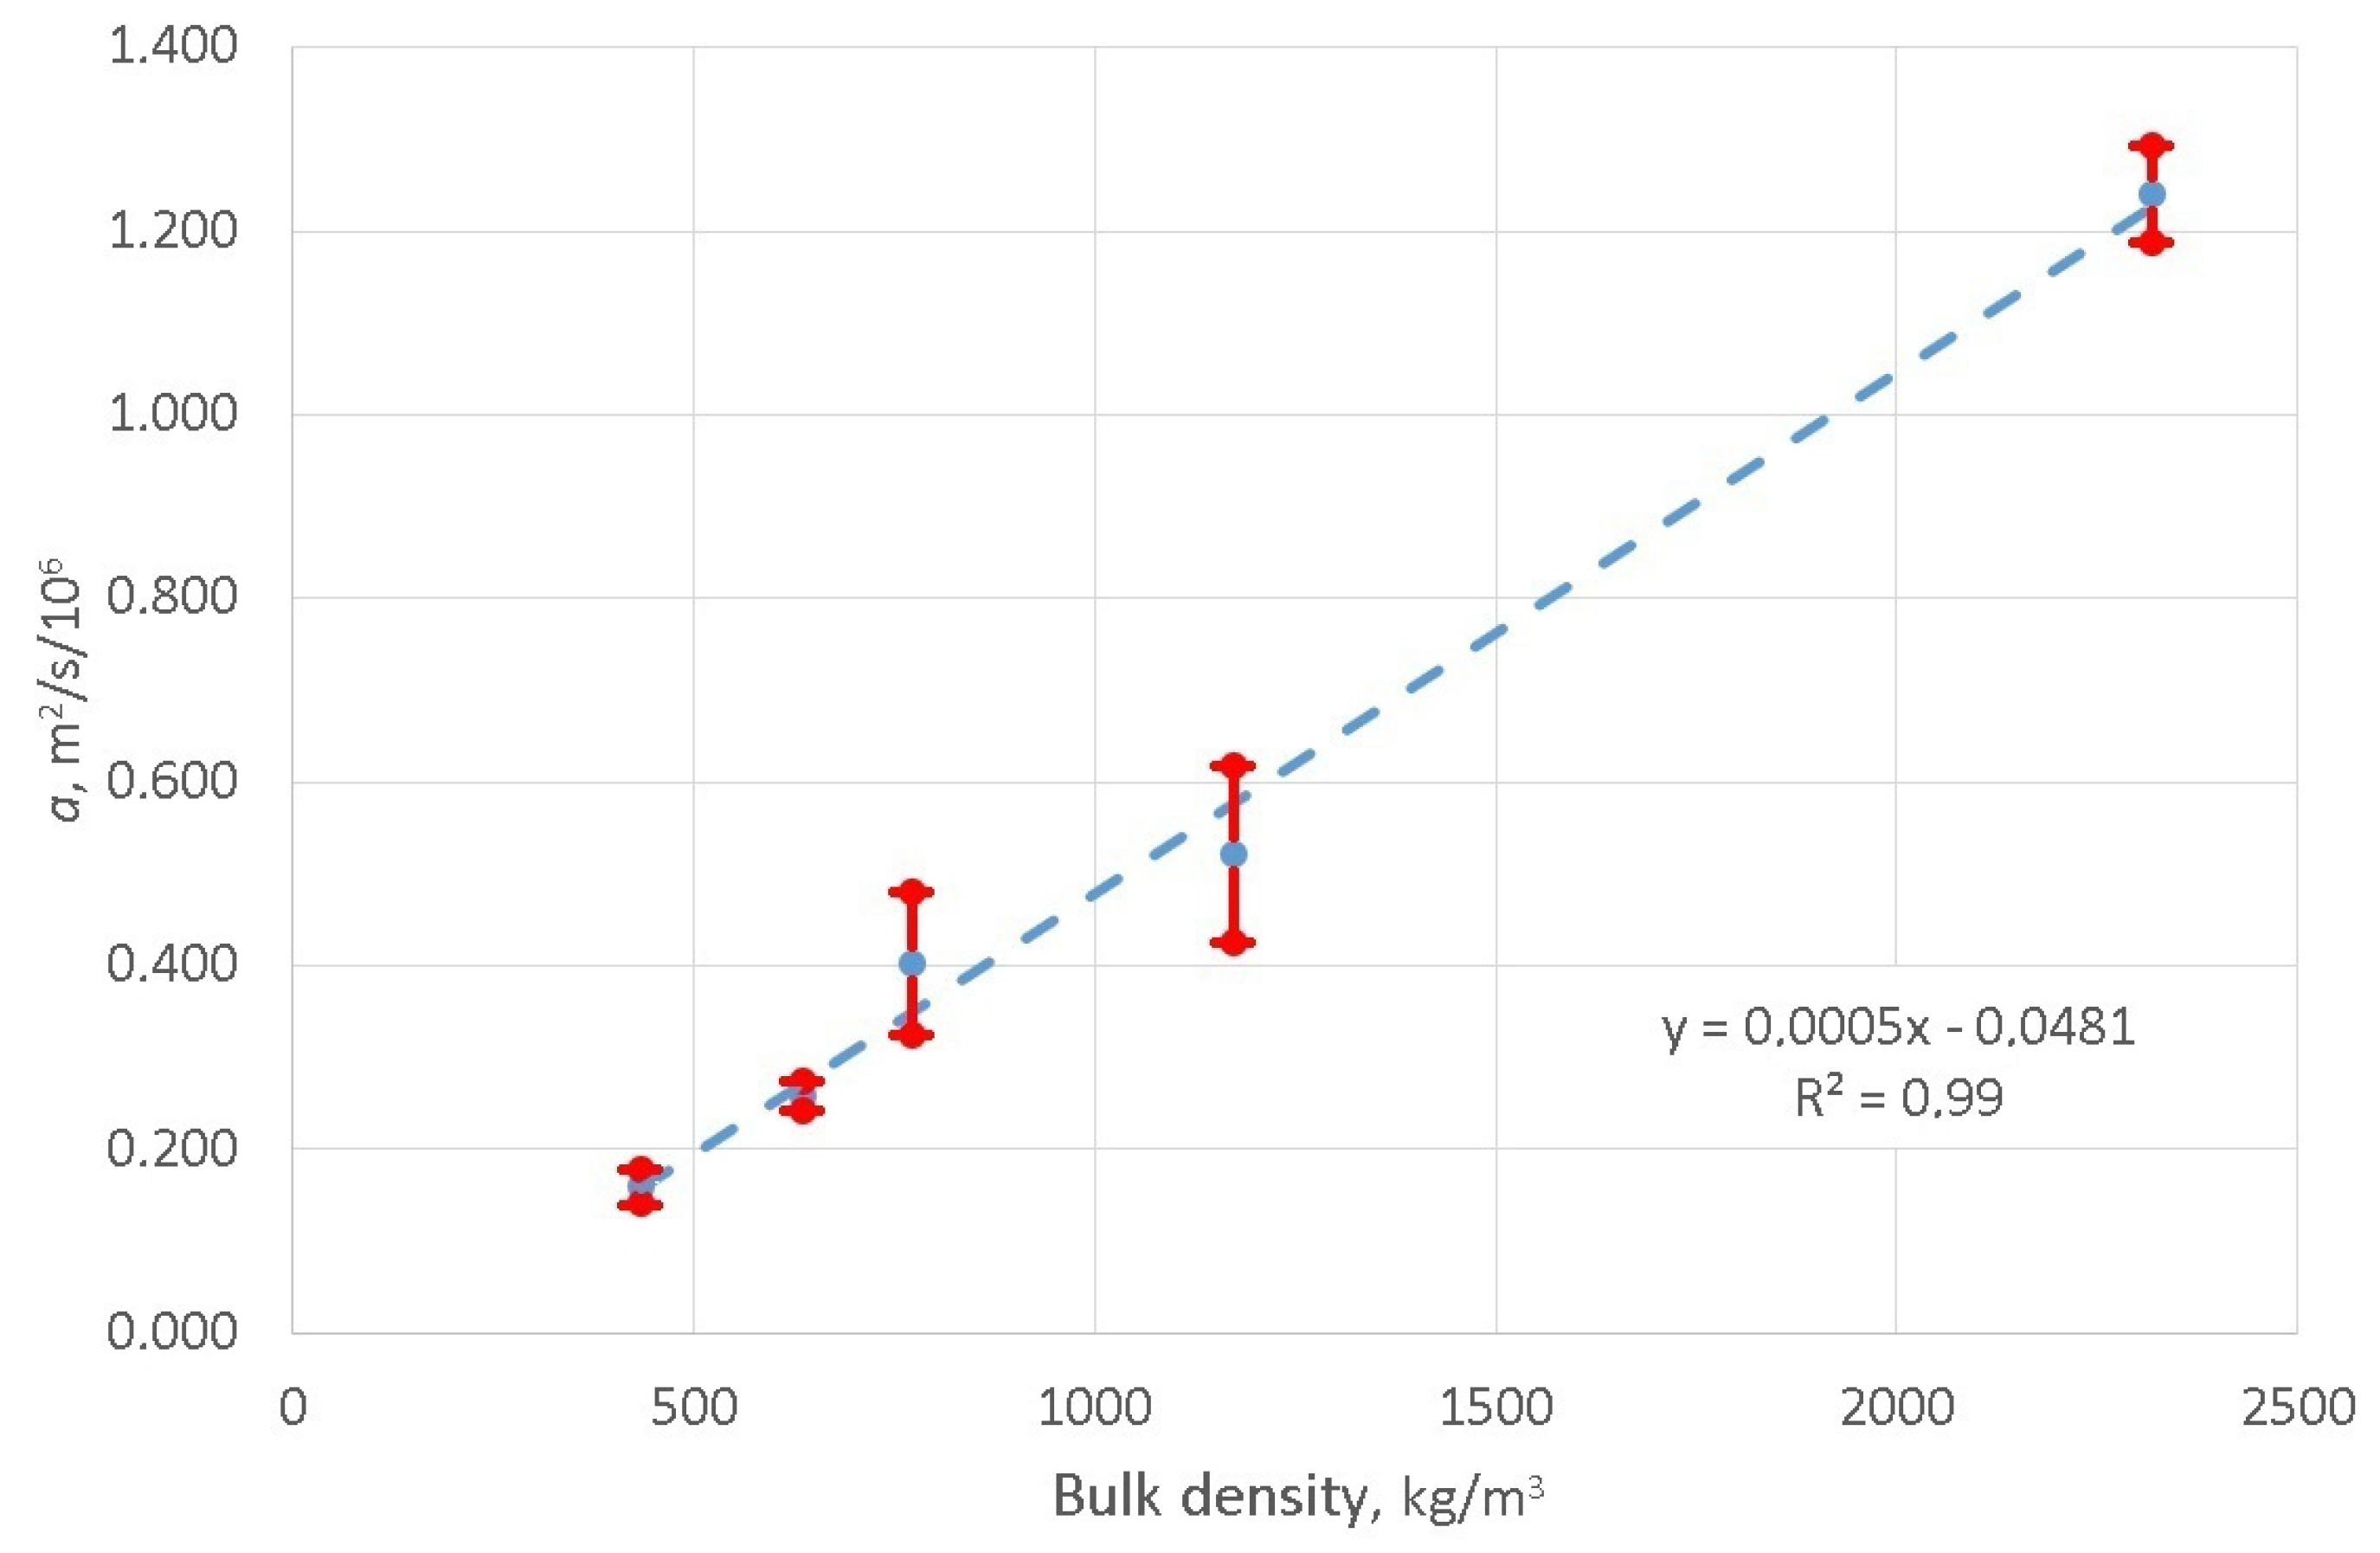
- performing regression analysis on sets containing results of calculated values of parameters defining thermal properties of concrete samples varying bulk density,
- discussion and conclusions.
3. Materials and Methods
3.1. Testing Materials
- –
- = —cement concrete C45/55 ( = MPa),
- –
- = —foam concrete LDCC ( = MPa),
- –
- = —foam concrete LDCC ( = MPa),
- –
- = —foam concrete LDCC ( = MPa),
- –
- = —foam concrete LDCC ( = MPa).
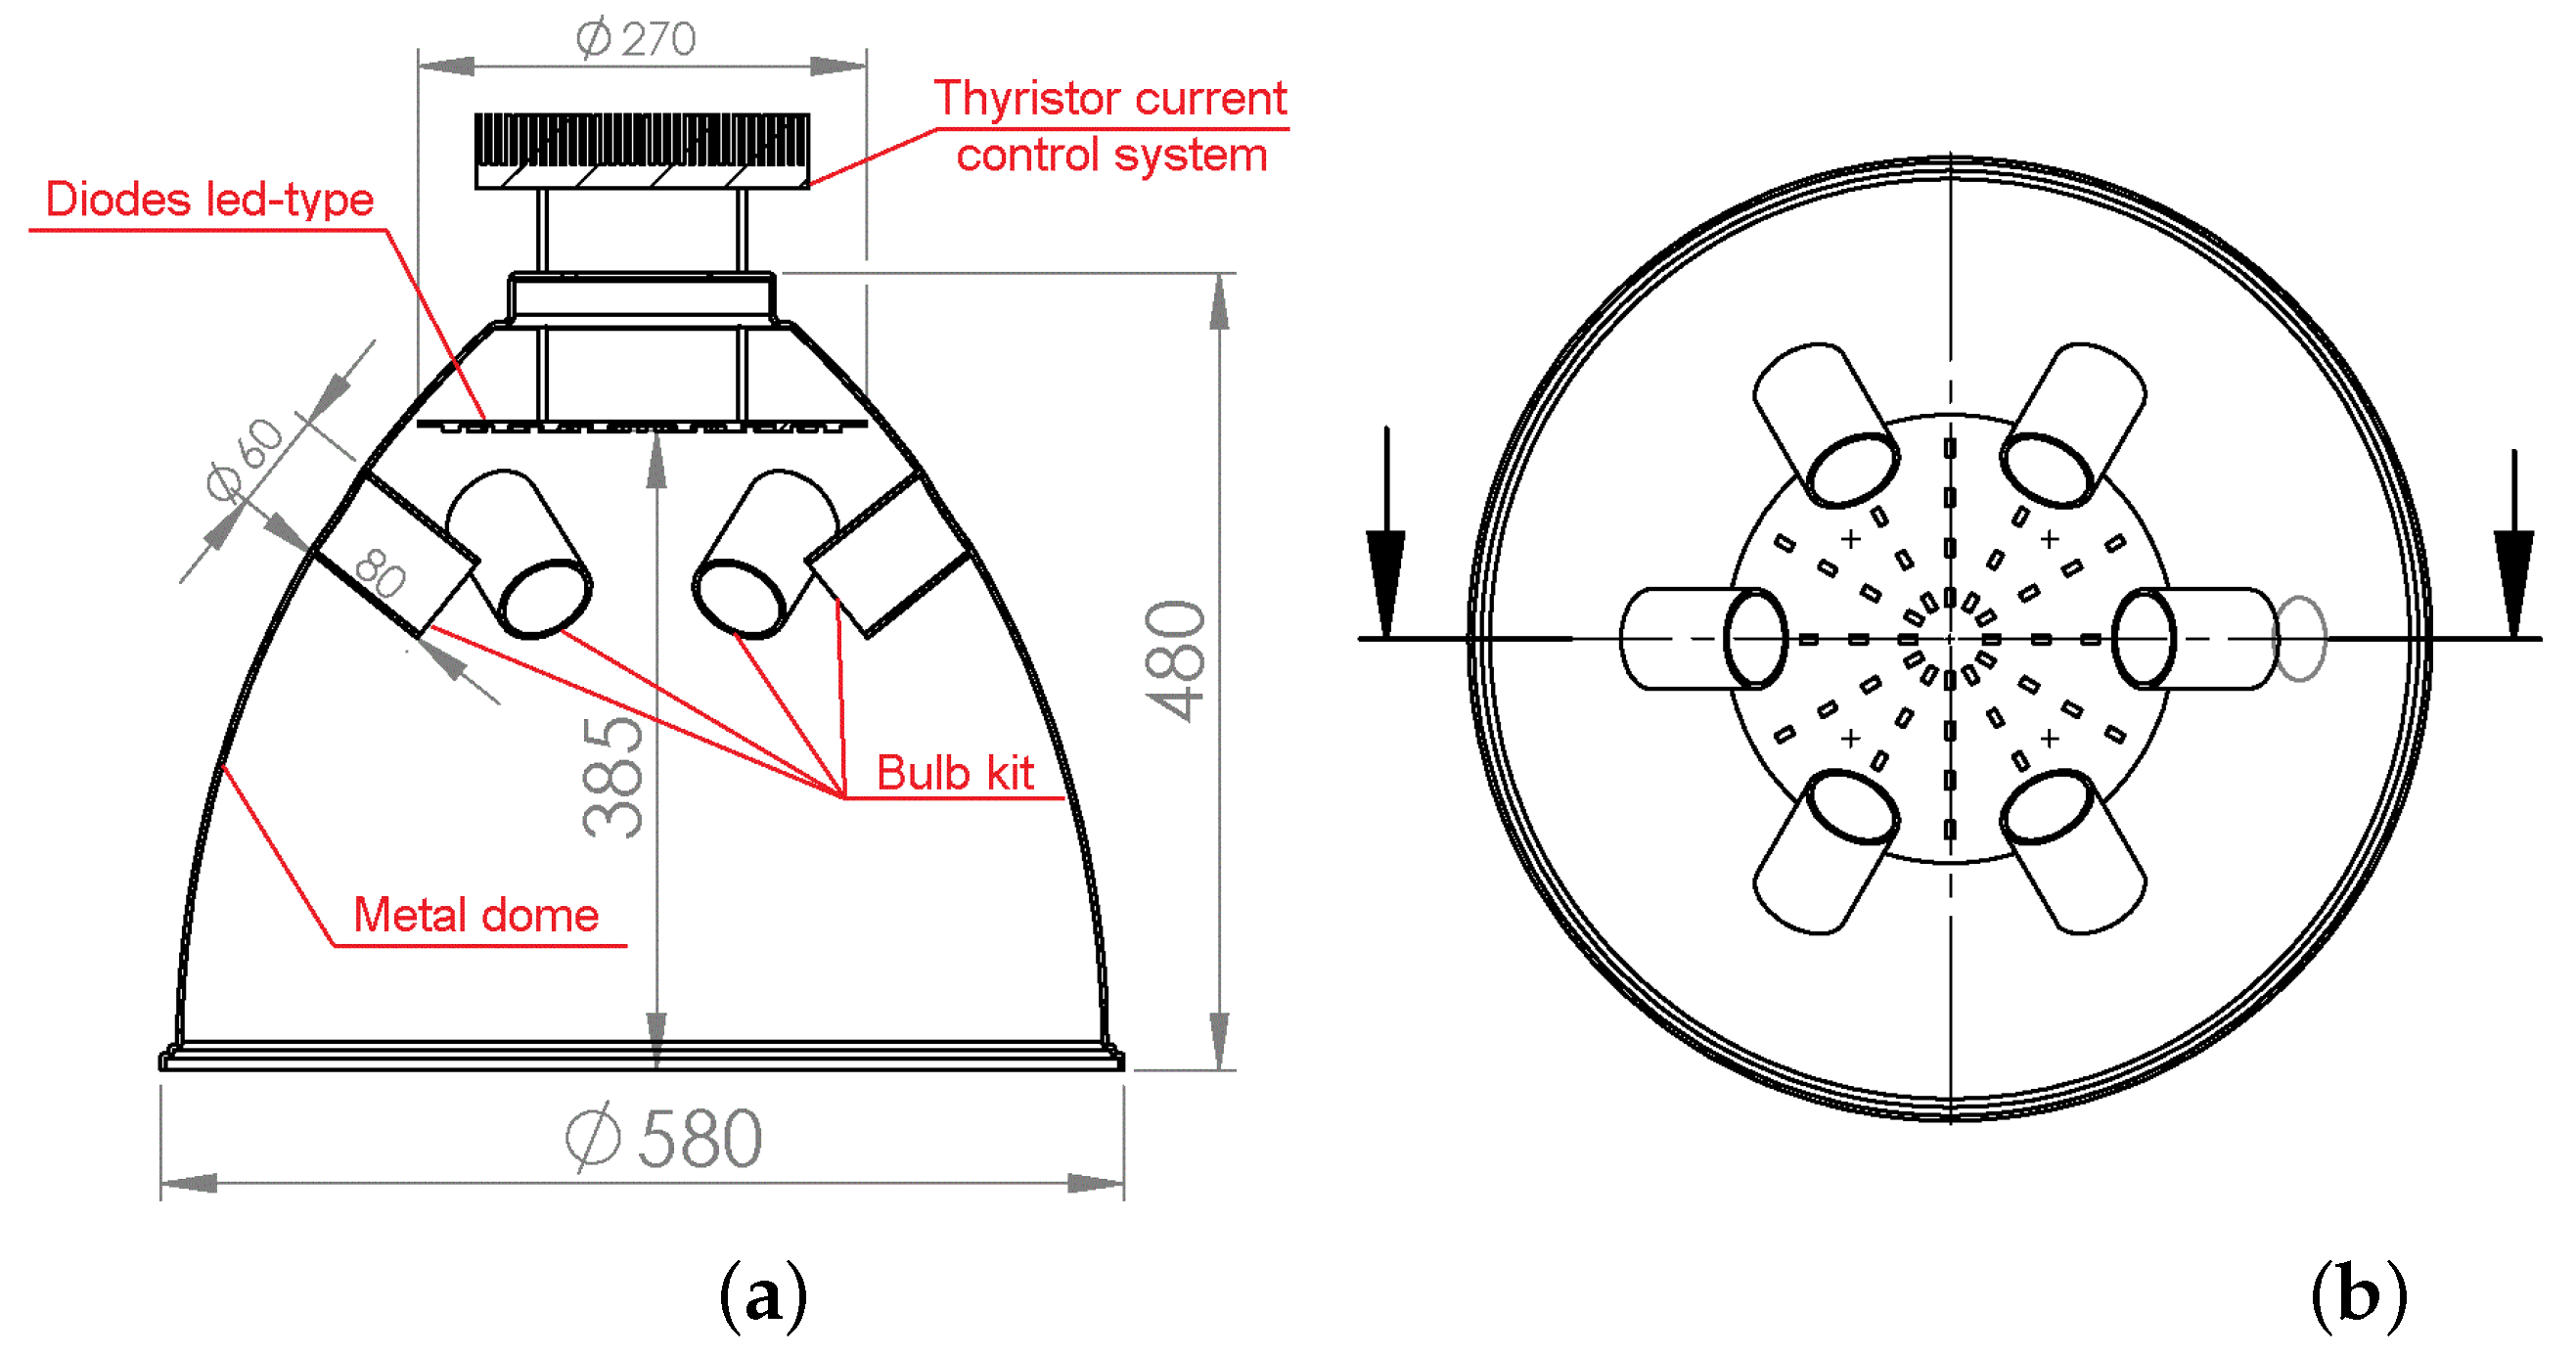
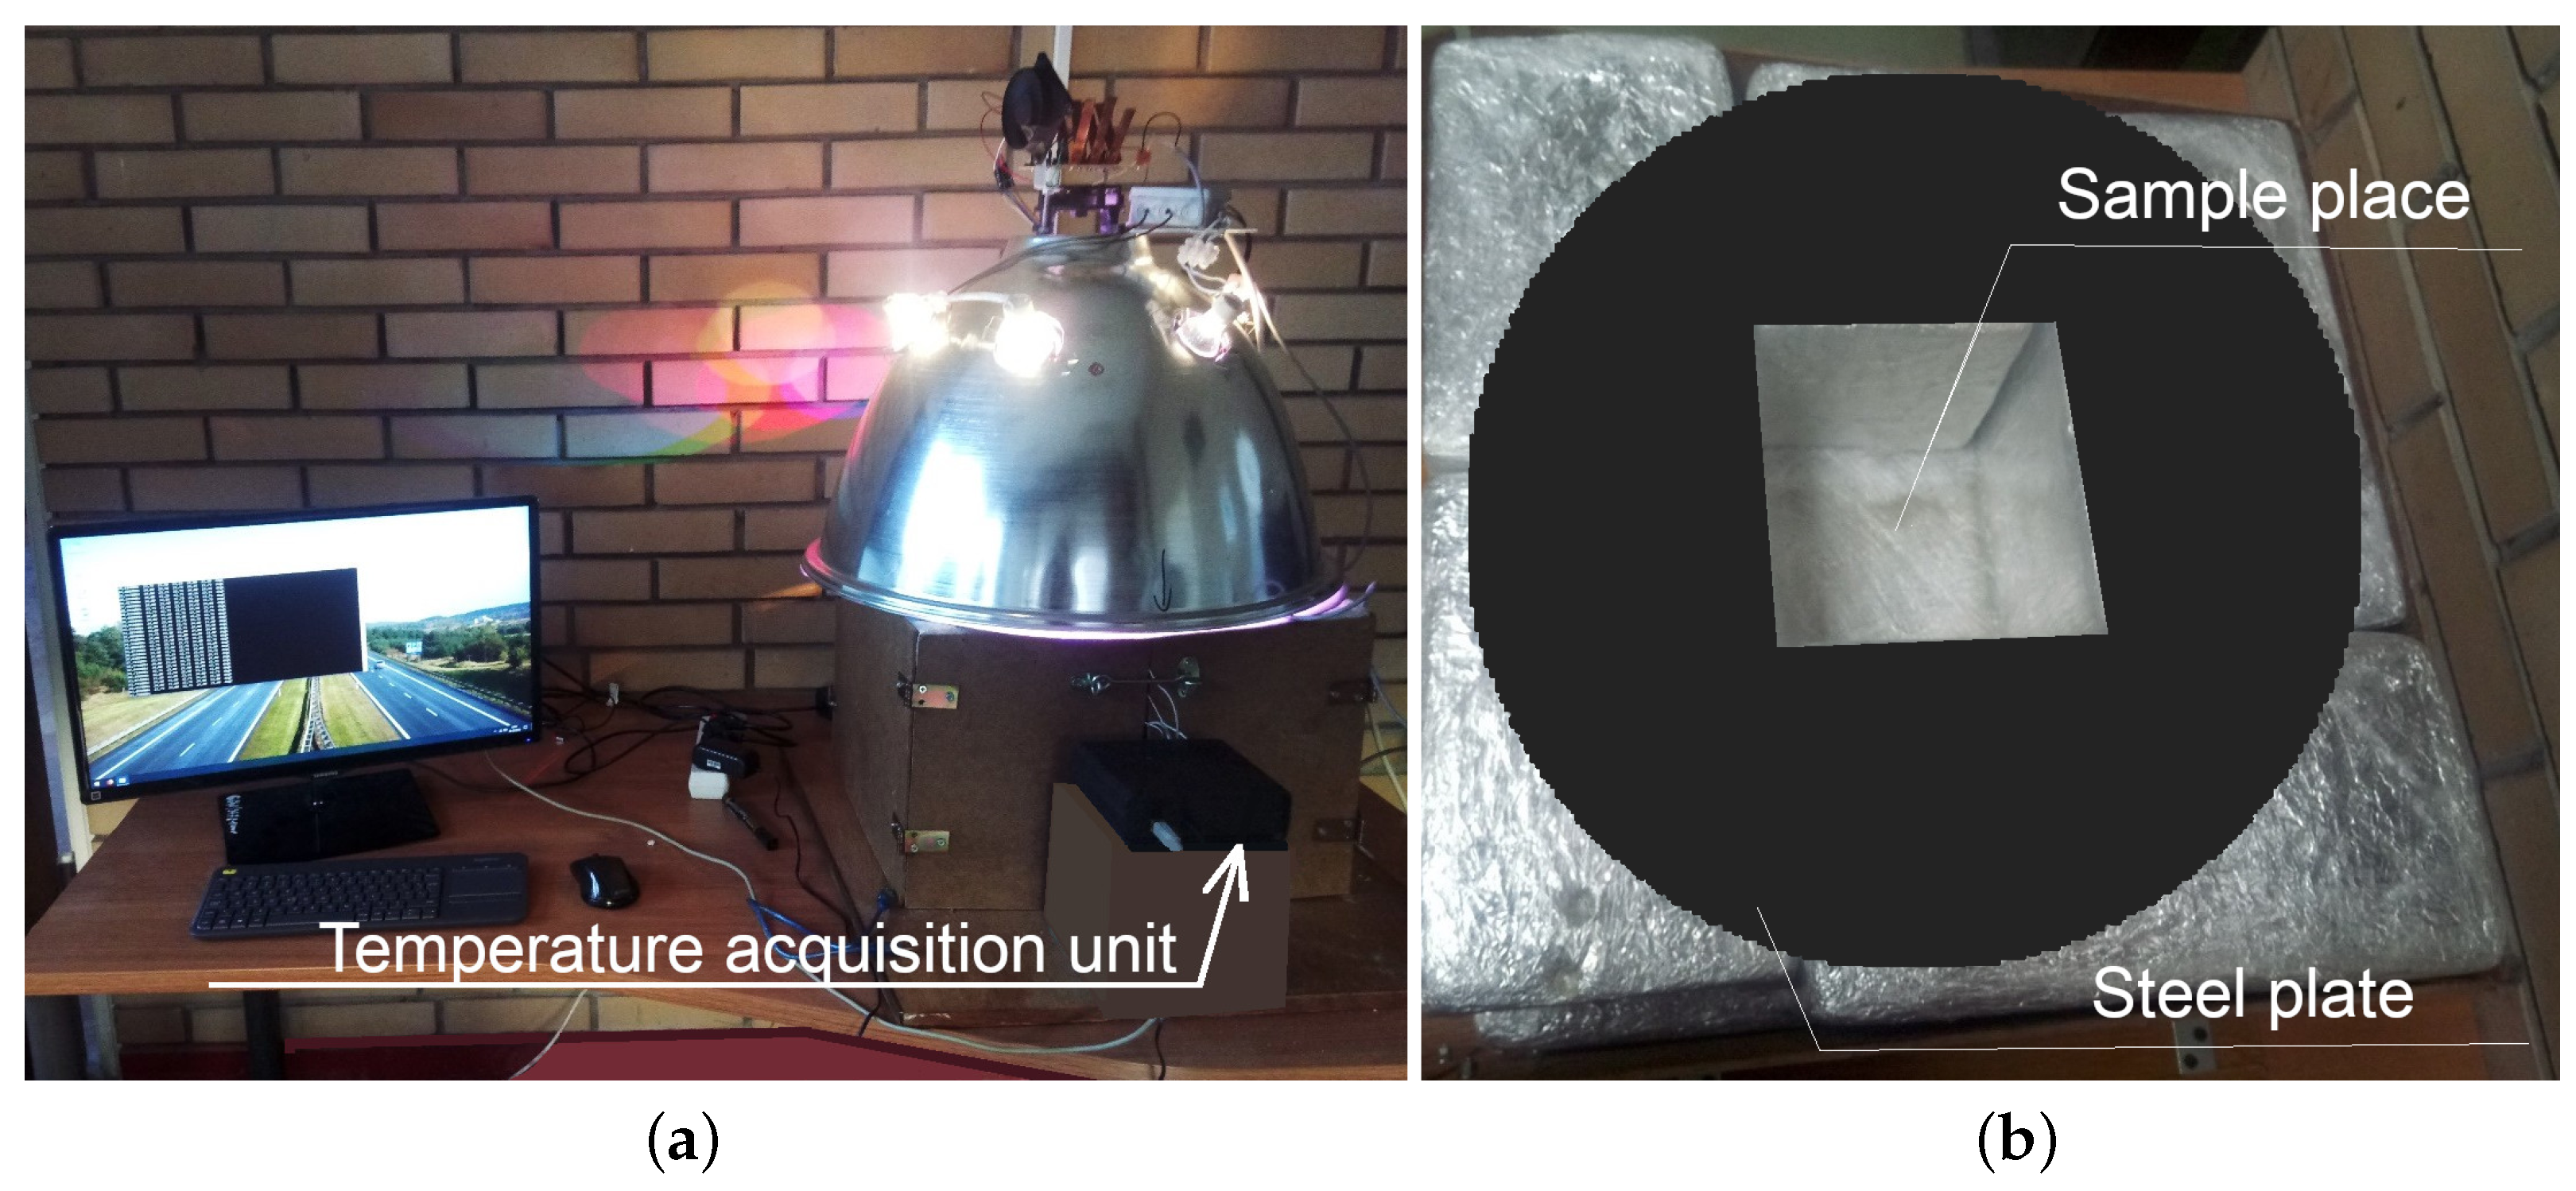
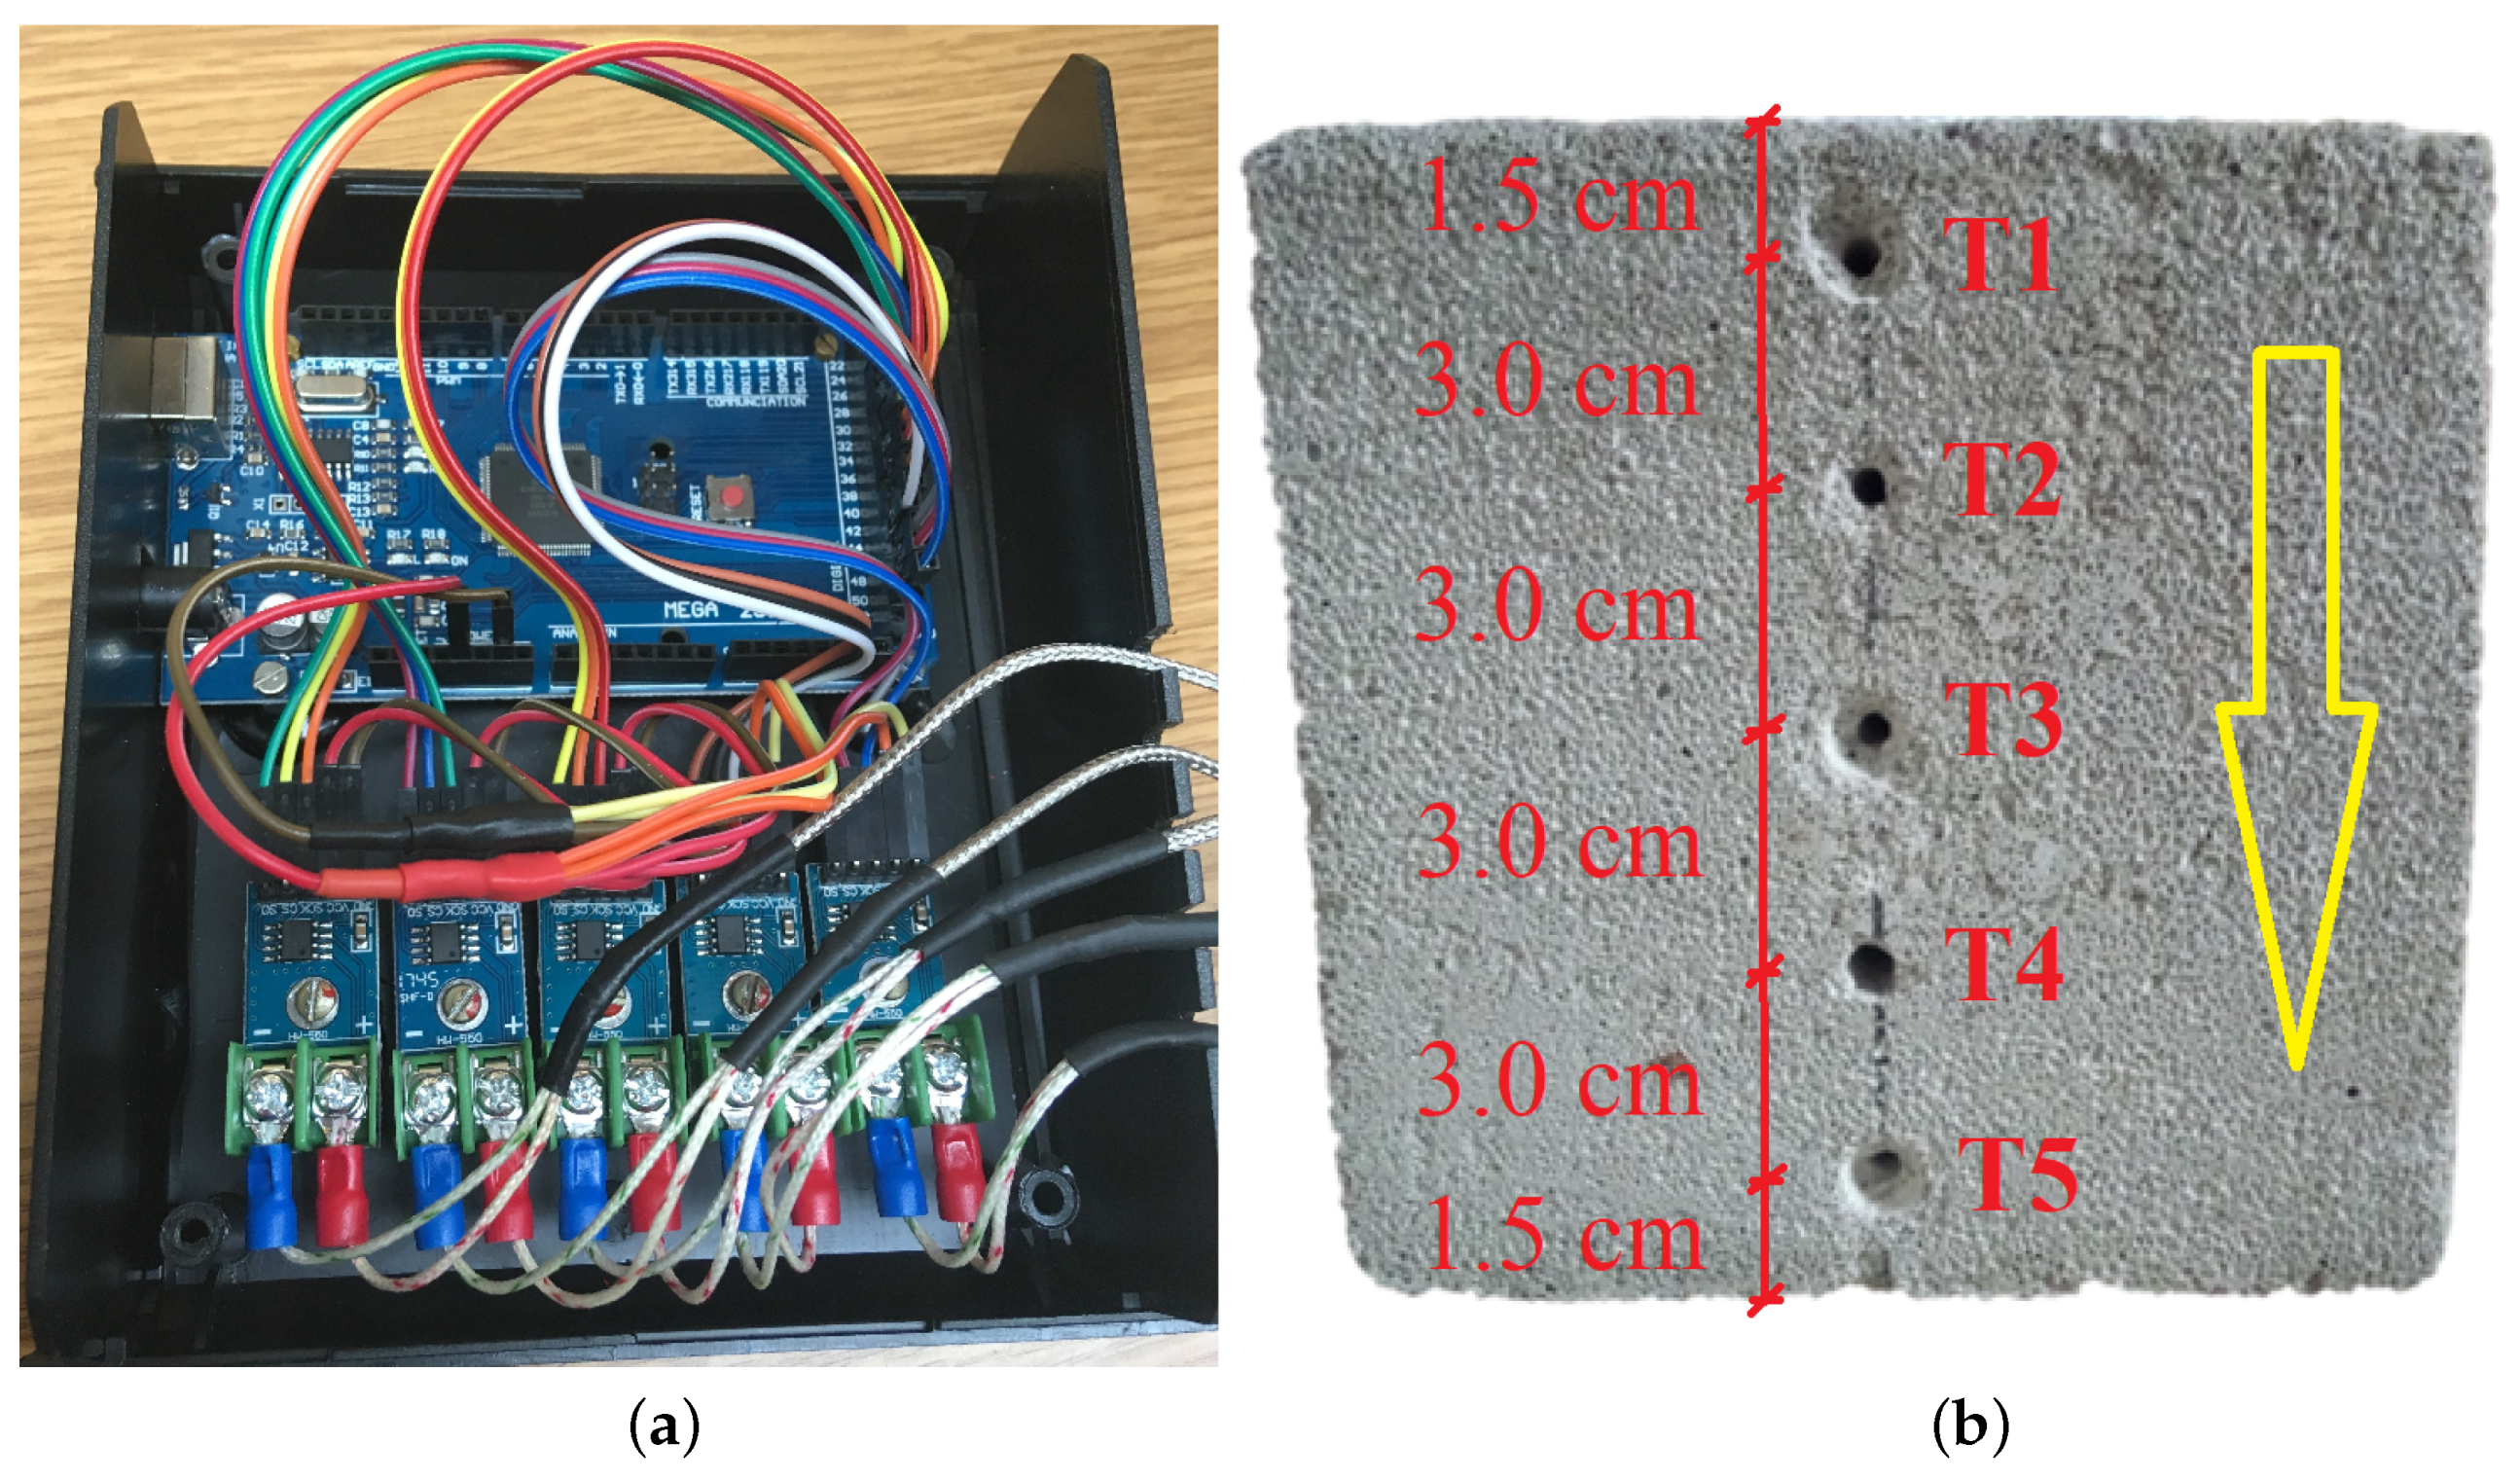
3.2. Test Bench
- –
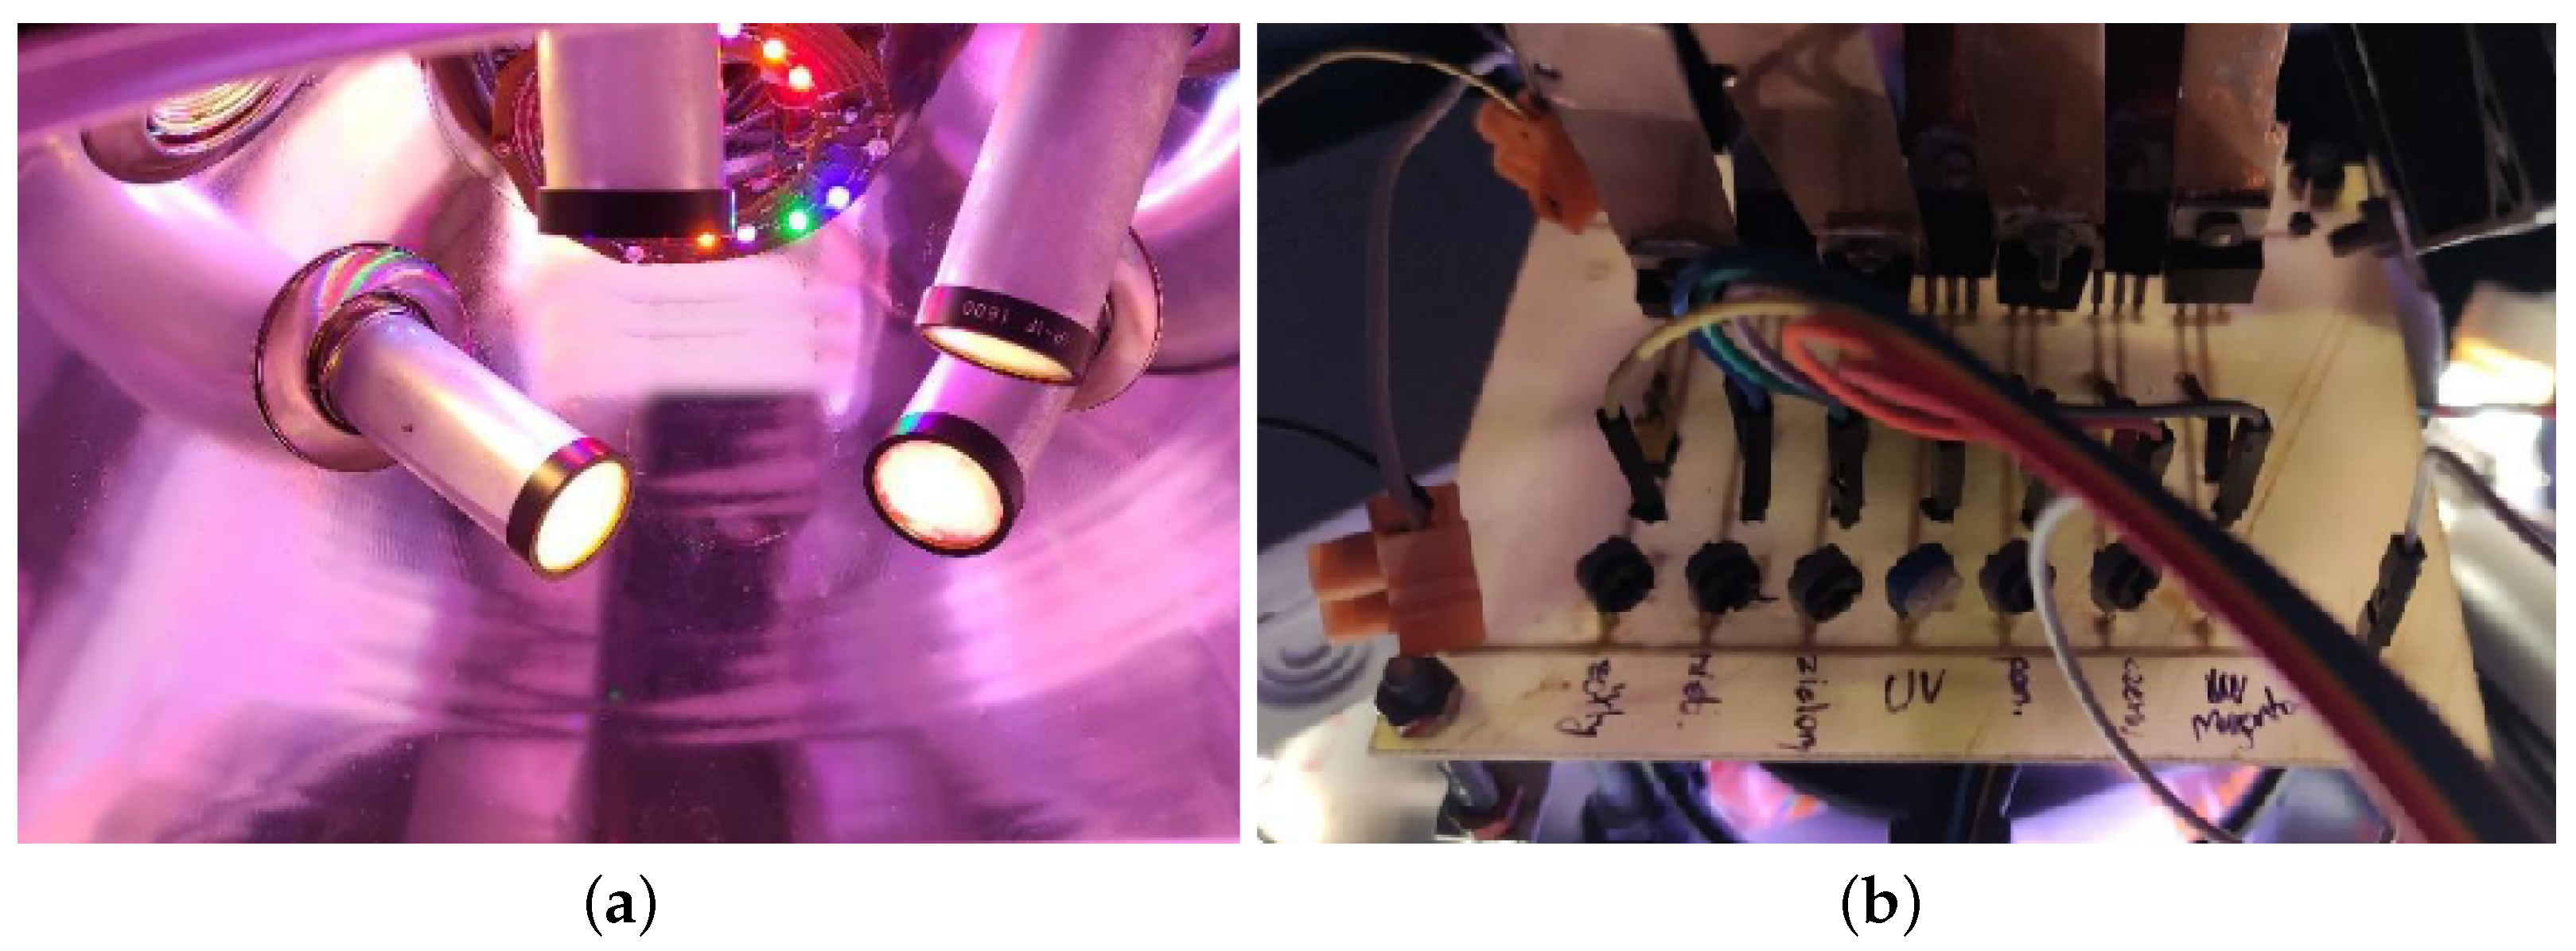
- a heat emission source simulating solar radiation—the upper part of the test bench,
- –
- a thermal isolation part—the bottom part of the test bench,
- –
- a set of five temperature measurement transducers,
- –
- a data acquisition module,
- –
- a computer module for controlling, processing and archiving test results.
| Listing 1. The main loop in the acquisition algorithm. |
 |
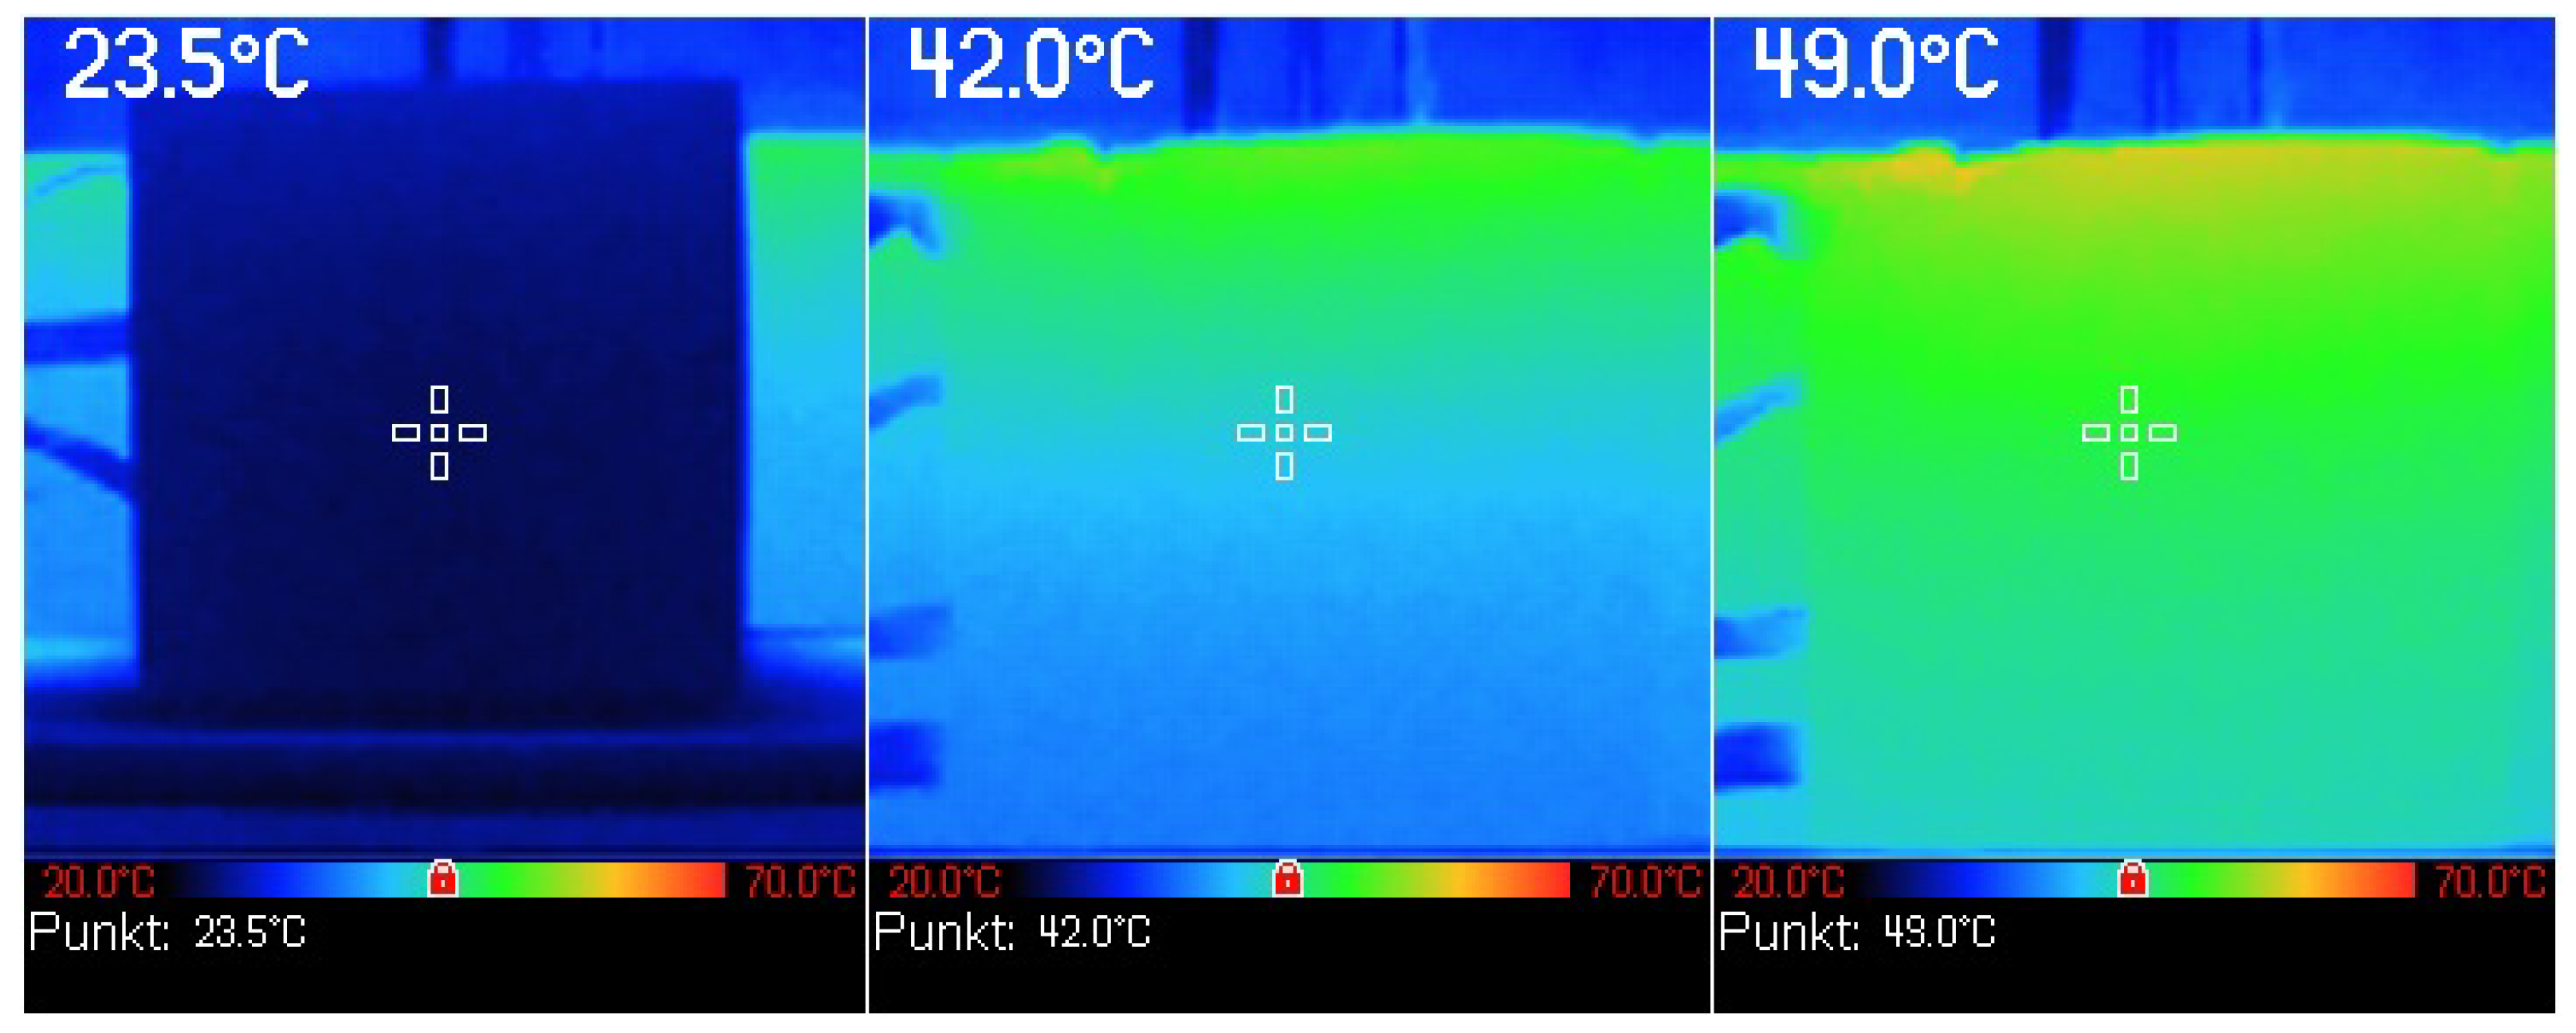
3.3. Verification of Unidirectional Heat Flow through the Sample
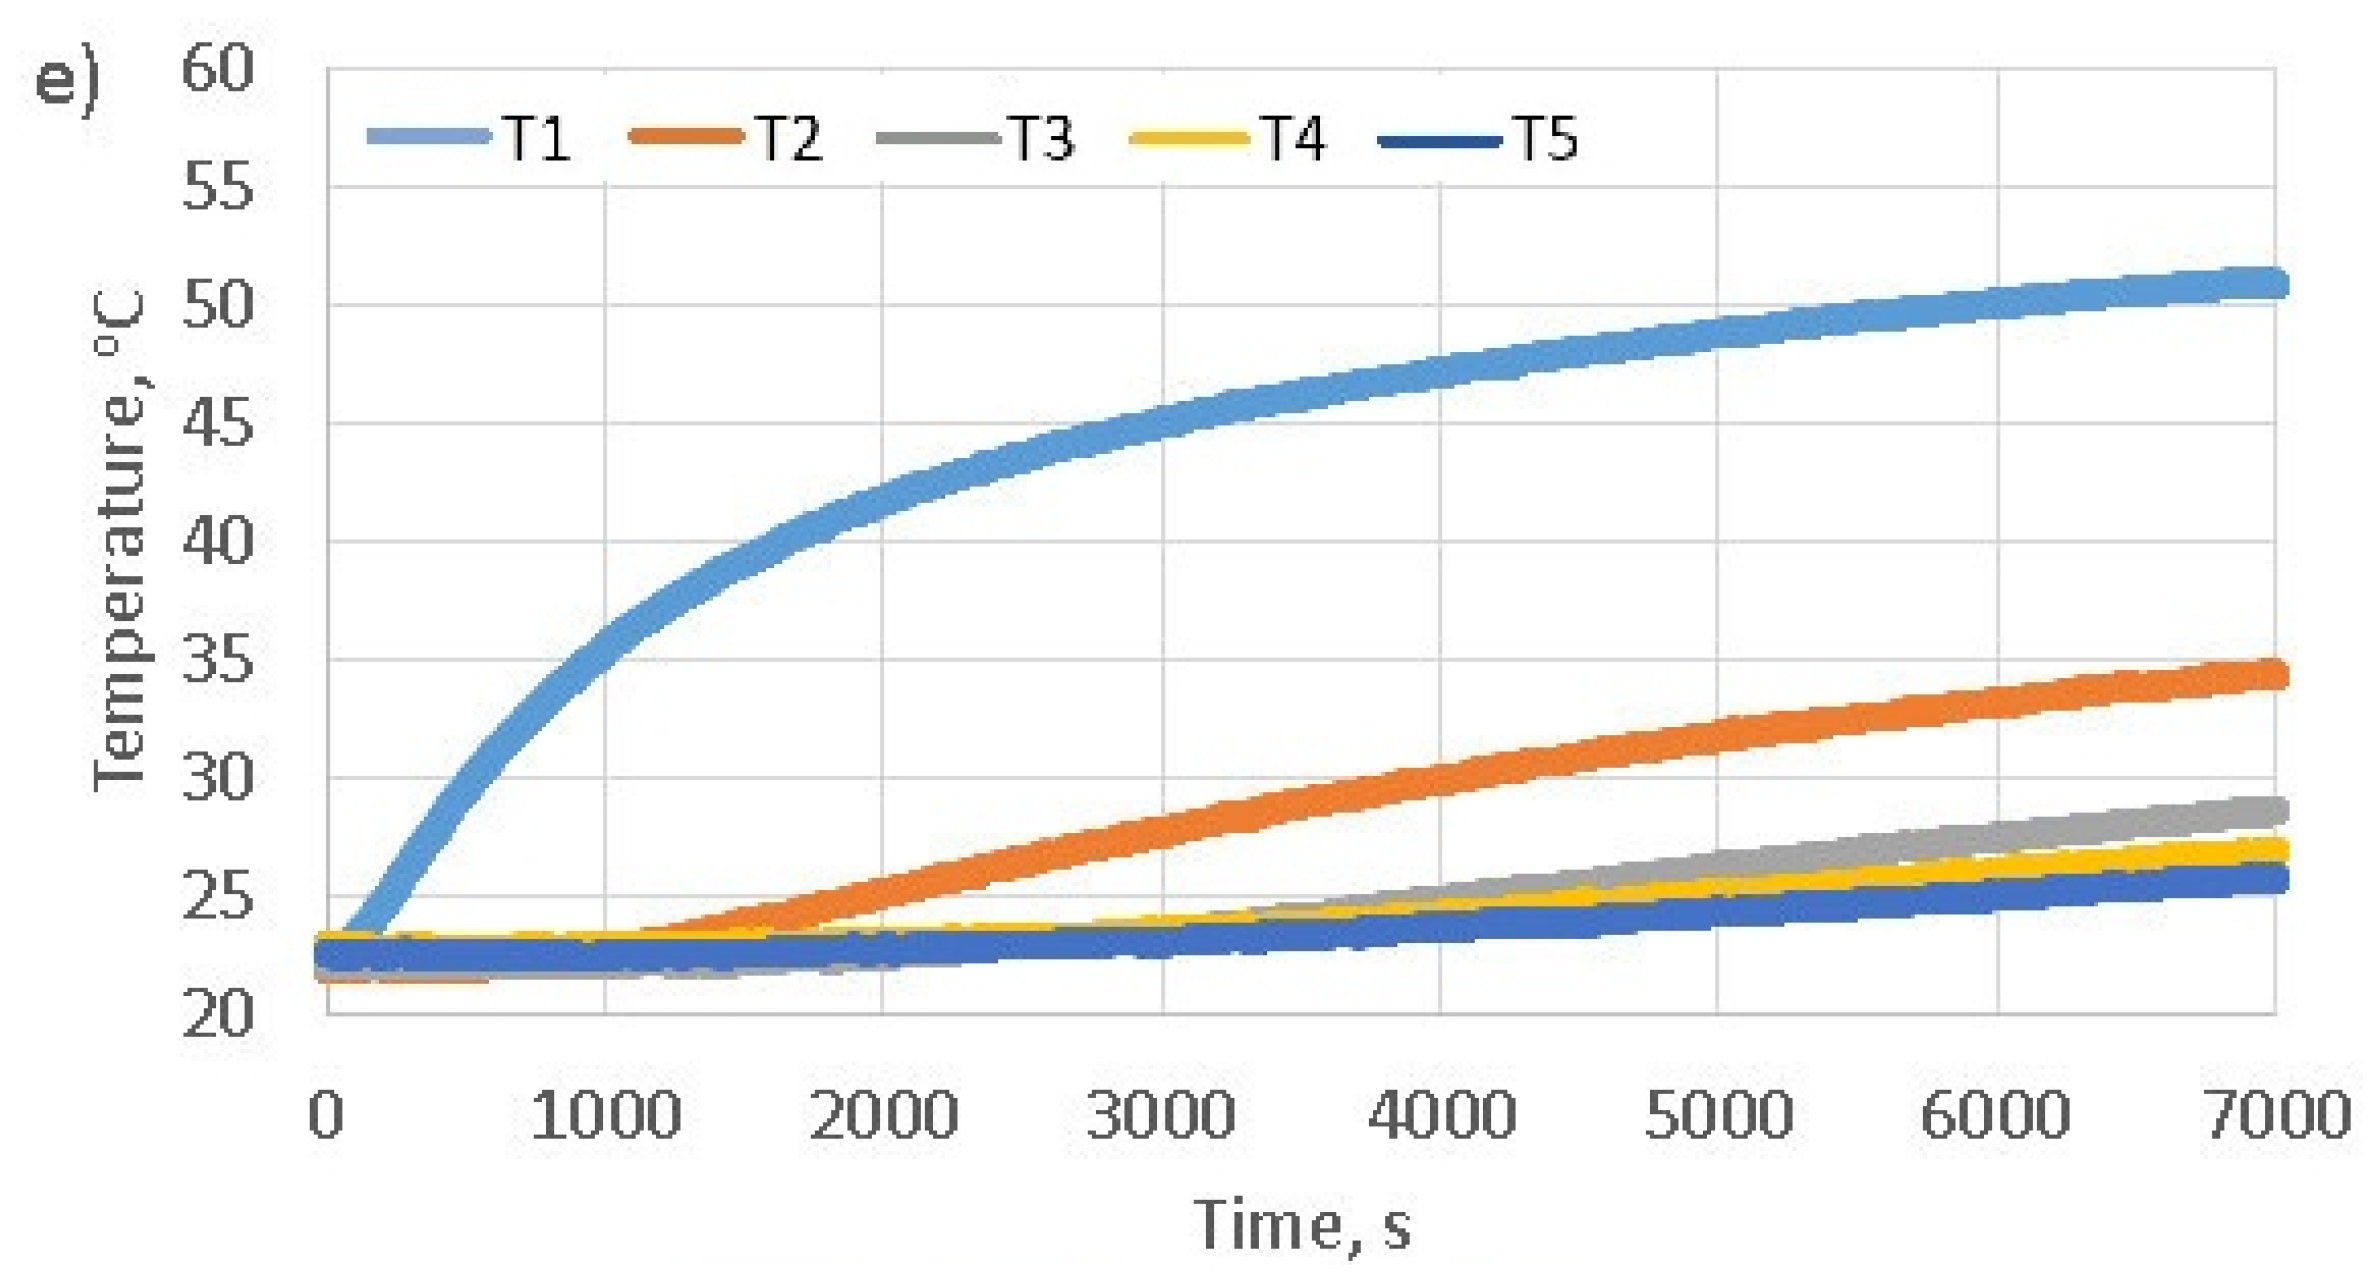
3.4. Laboratory Experiment Using a Solar Simulator
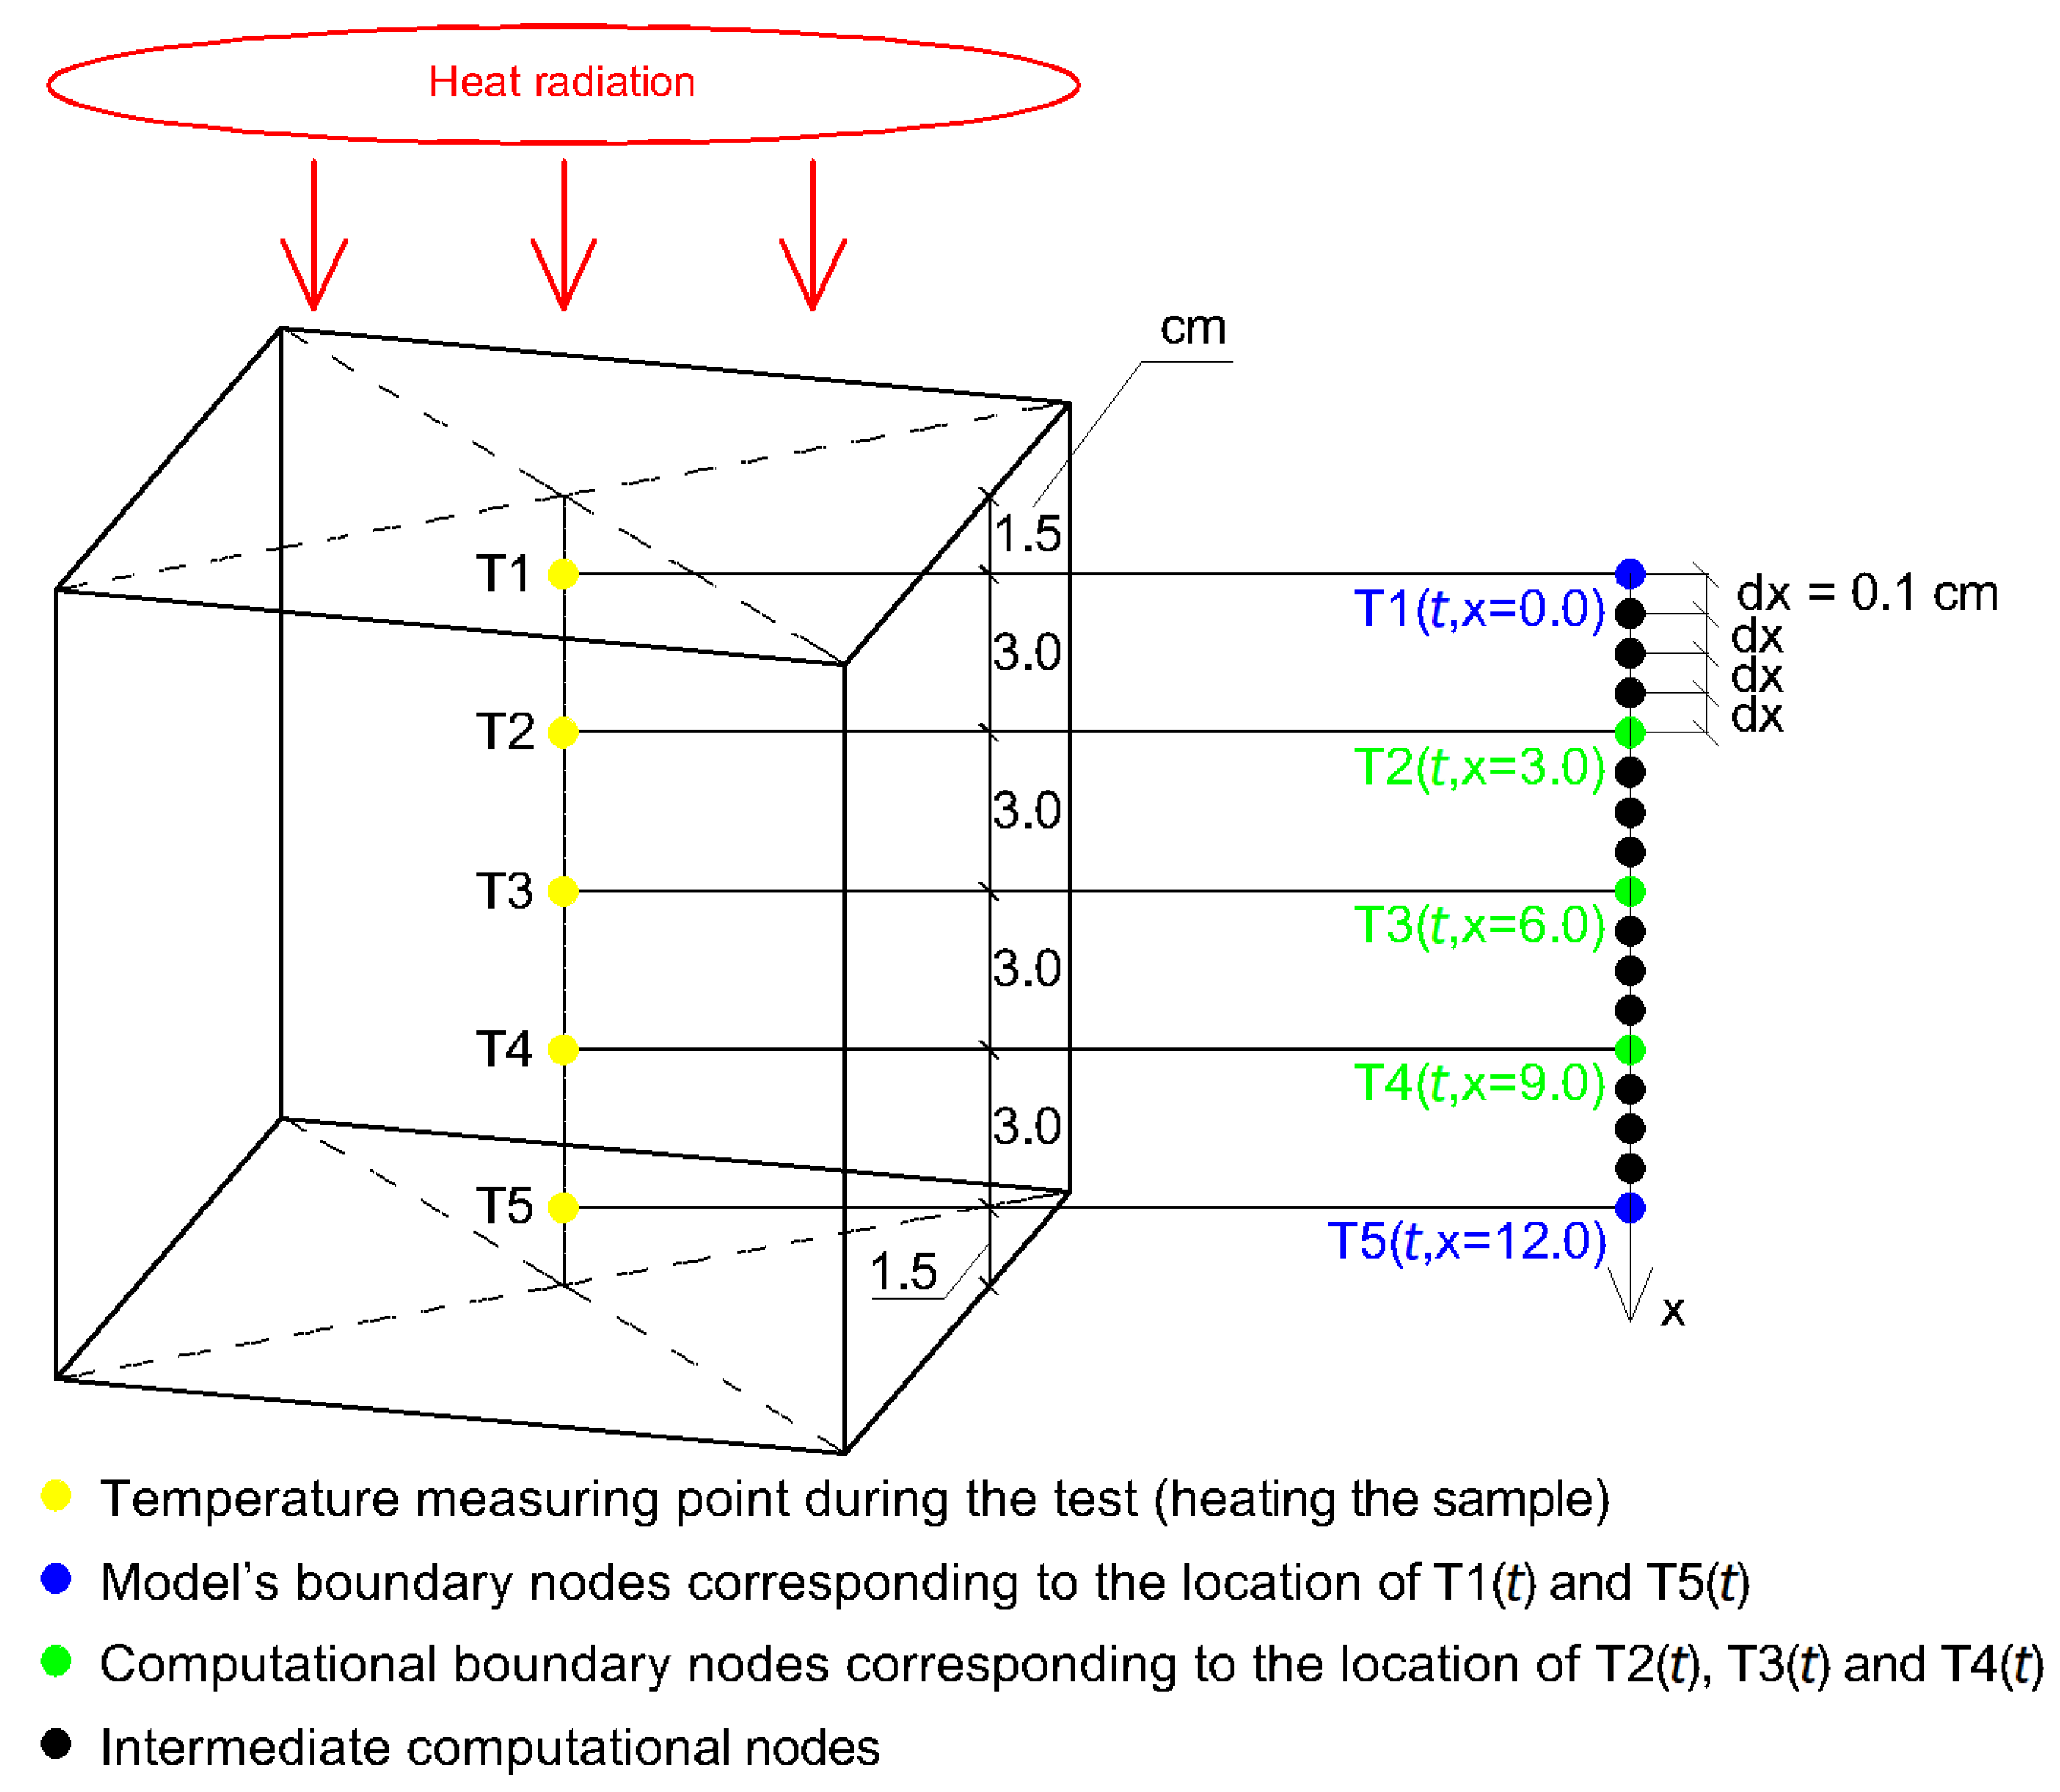
3.5. Back-Calculation Computational Method
- a unidirectional flow of thermal energy is ensured in the direction from the heated surface of the sample to its lower surface,
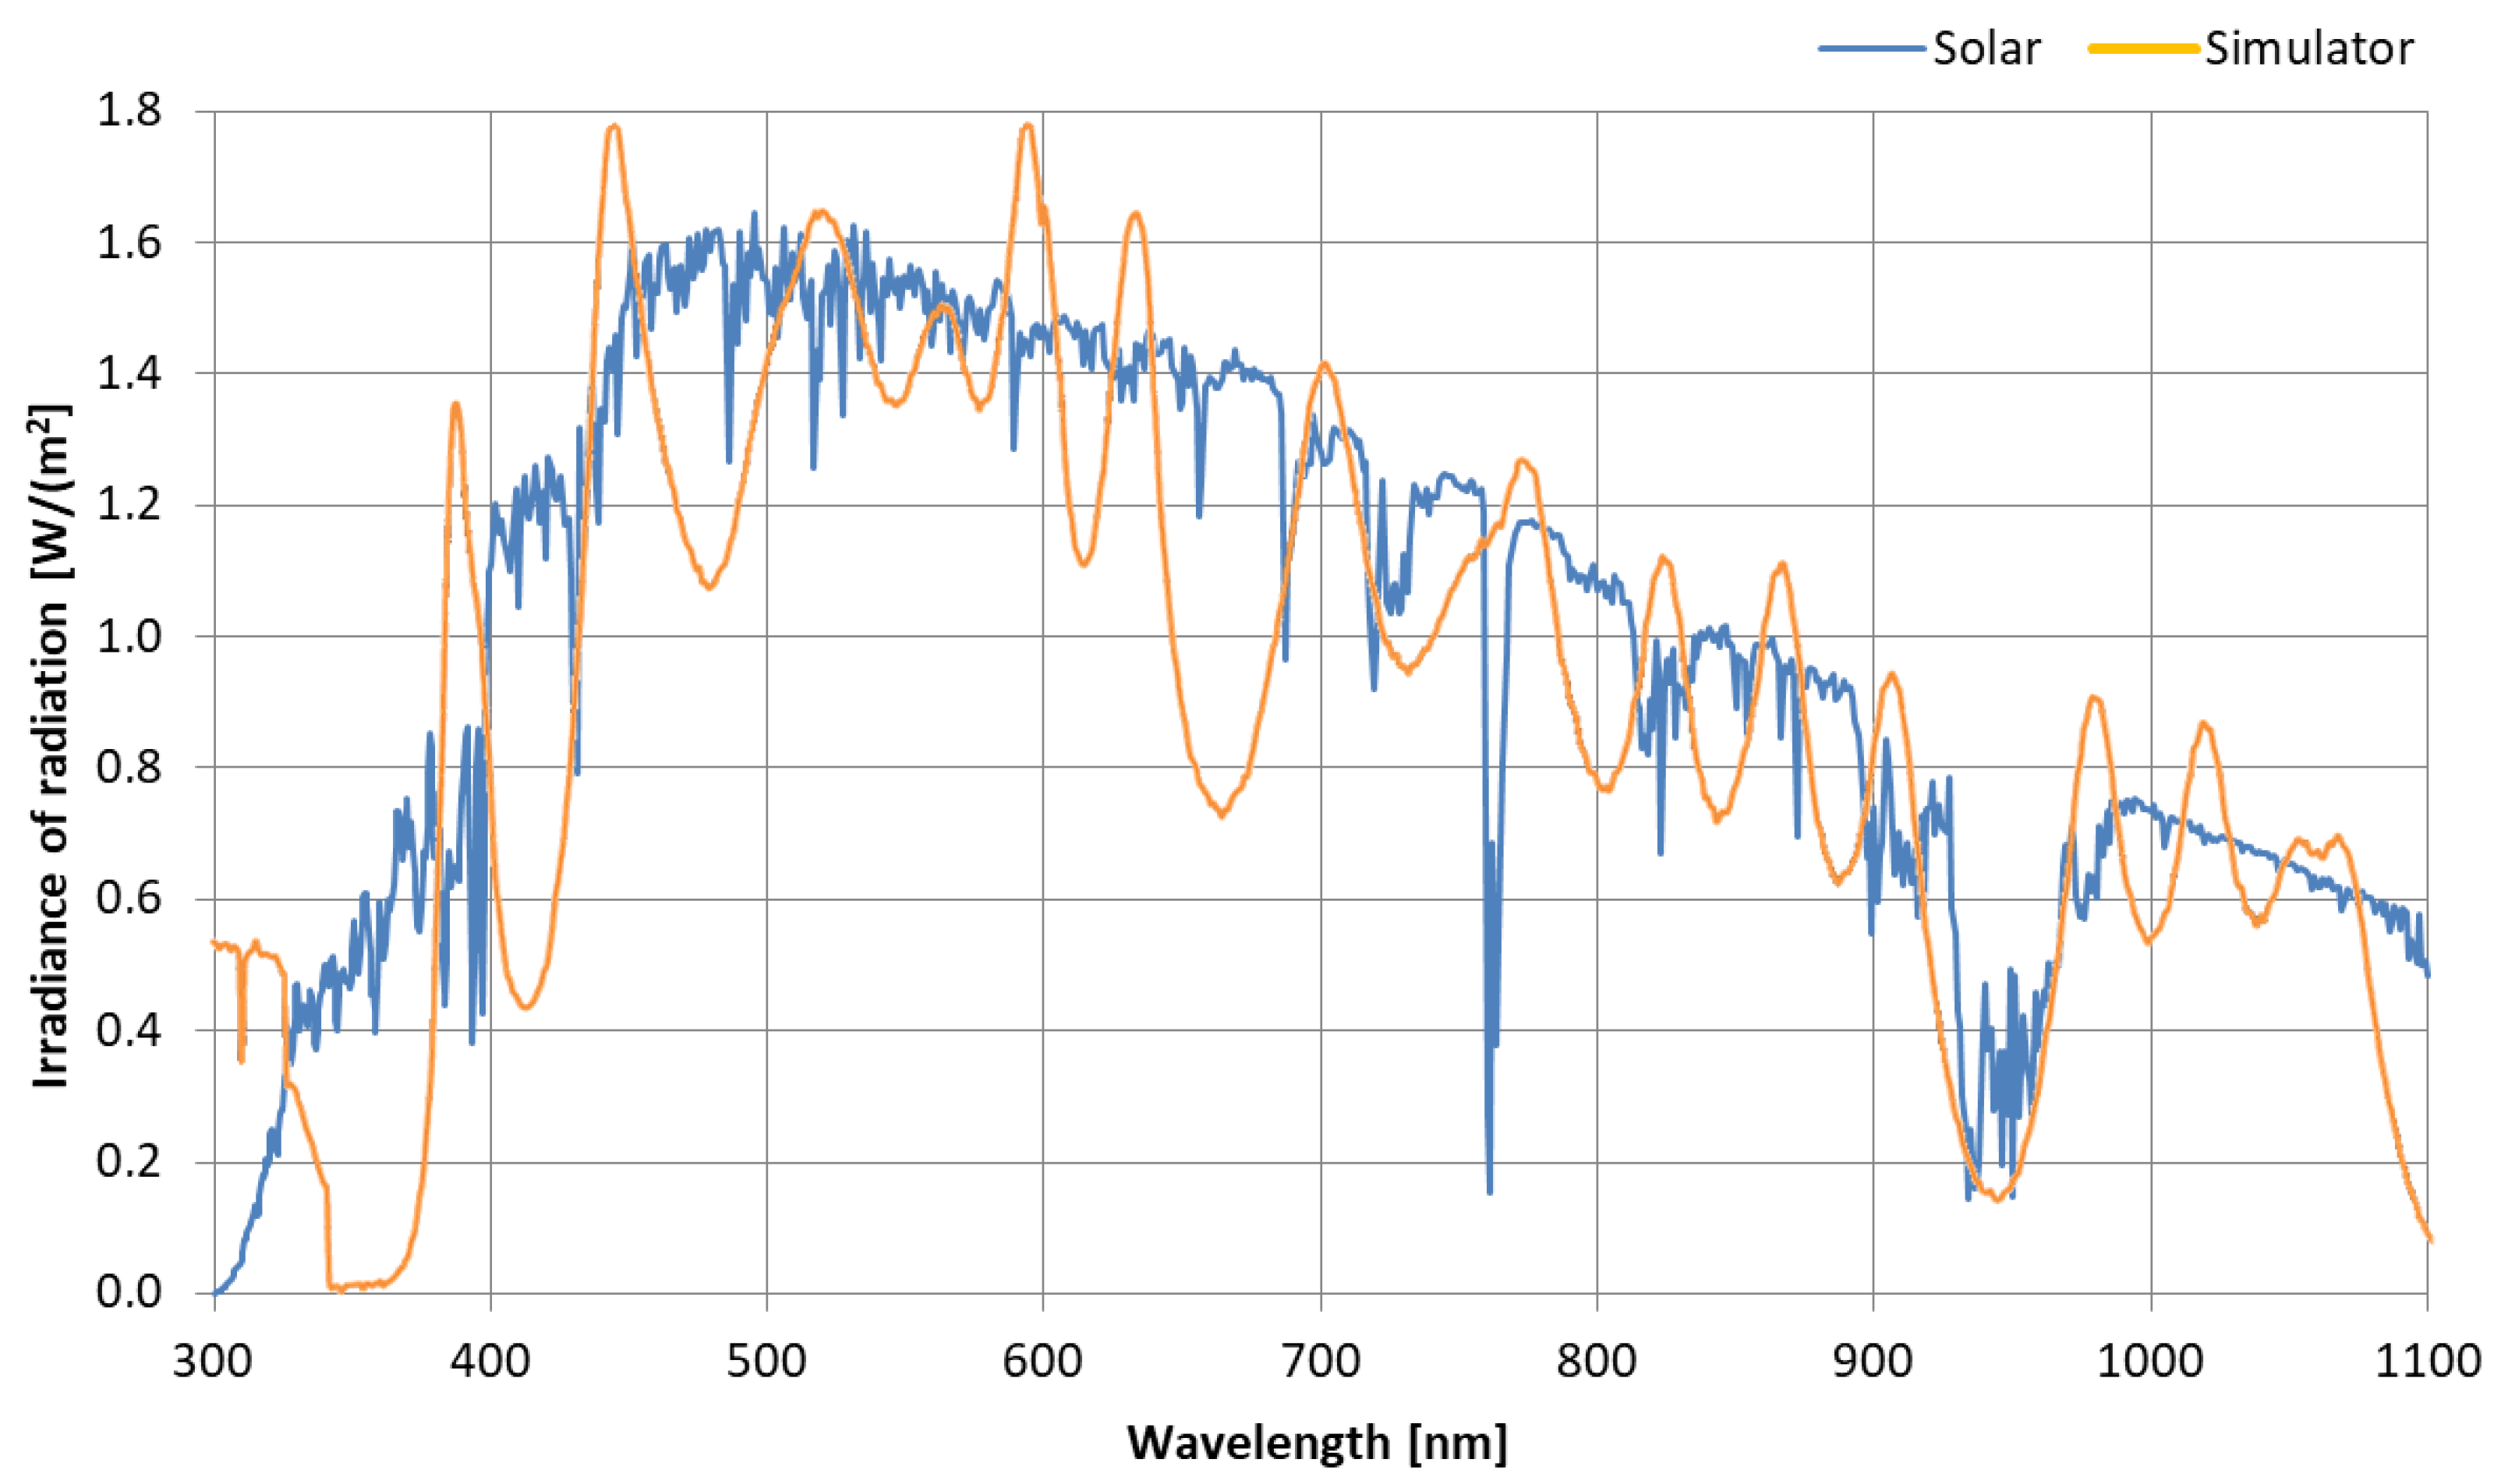
- the filling of the components of the solar radiation spectrum is realized in a simulator with a multi-diode and incandescent combination of the highest class of spectral projection,
- the exchange of heat energy between the sample and the environment takes place in a space with the volume of the dome of the test bench, which imitates the actual vicinity of the horizontal building partition with sunlight.
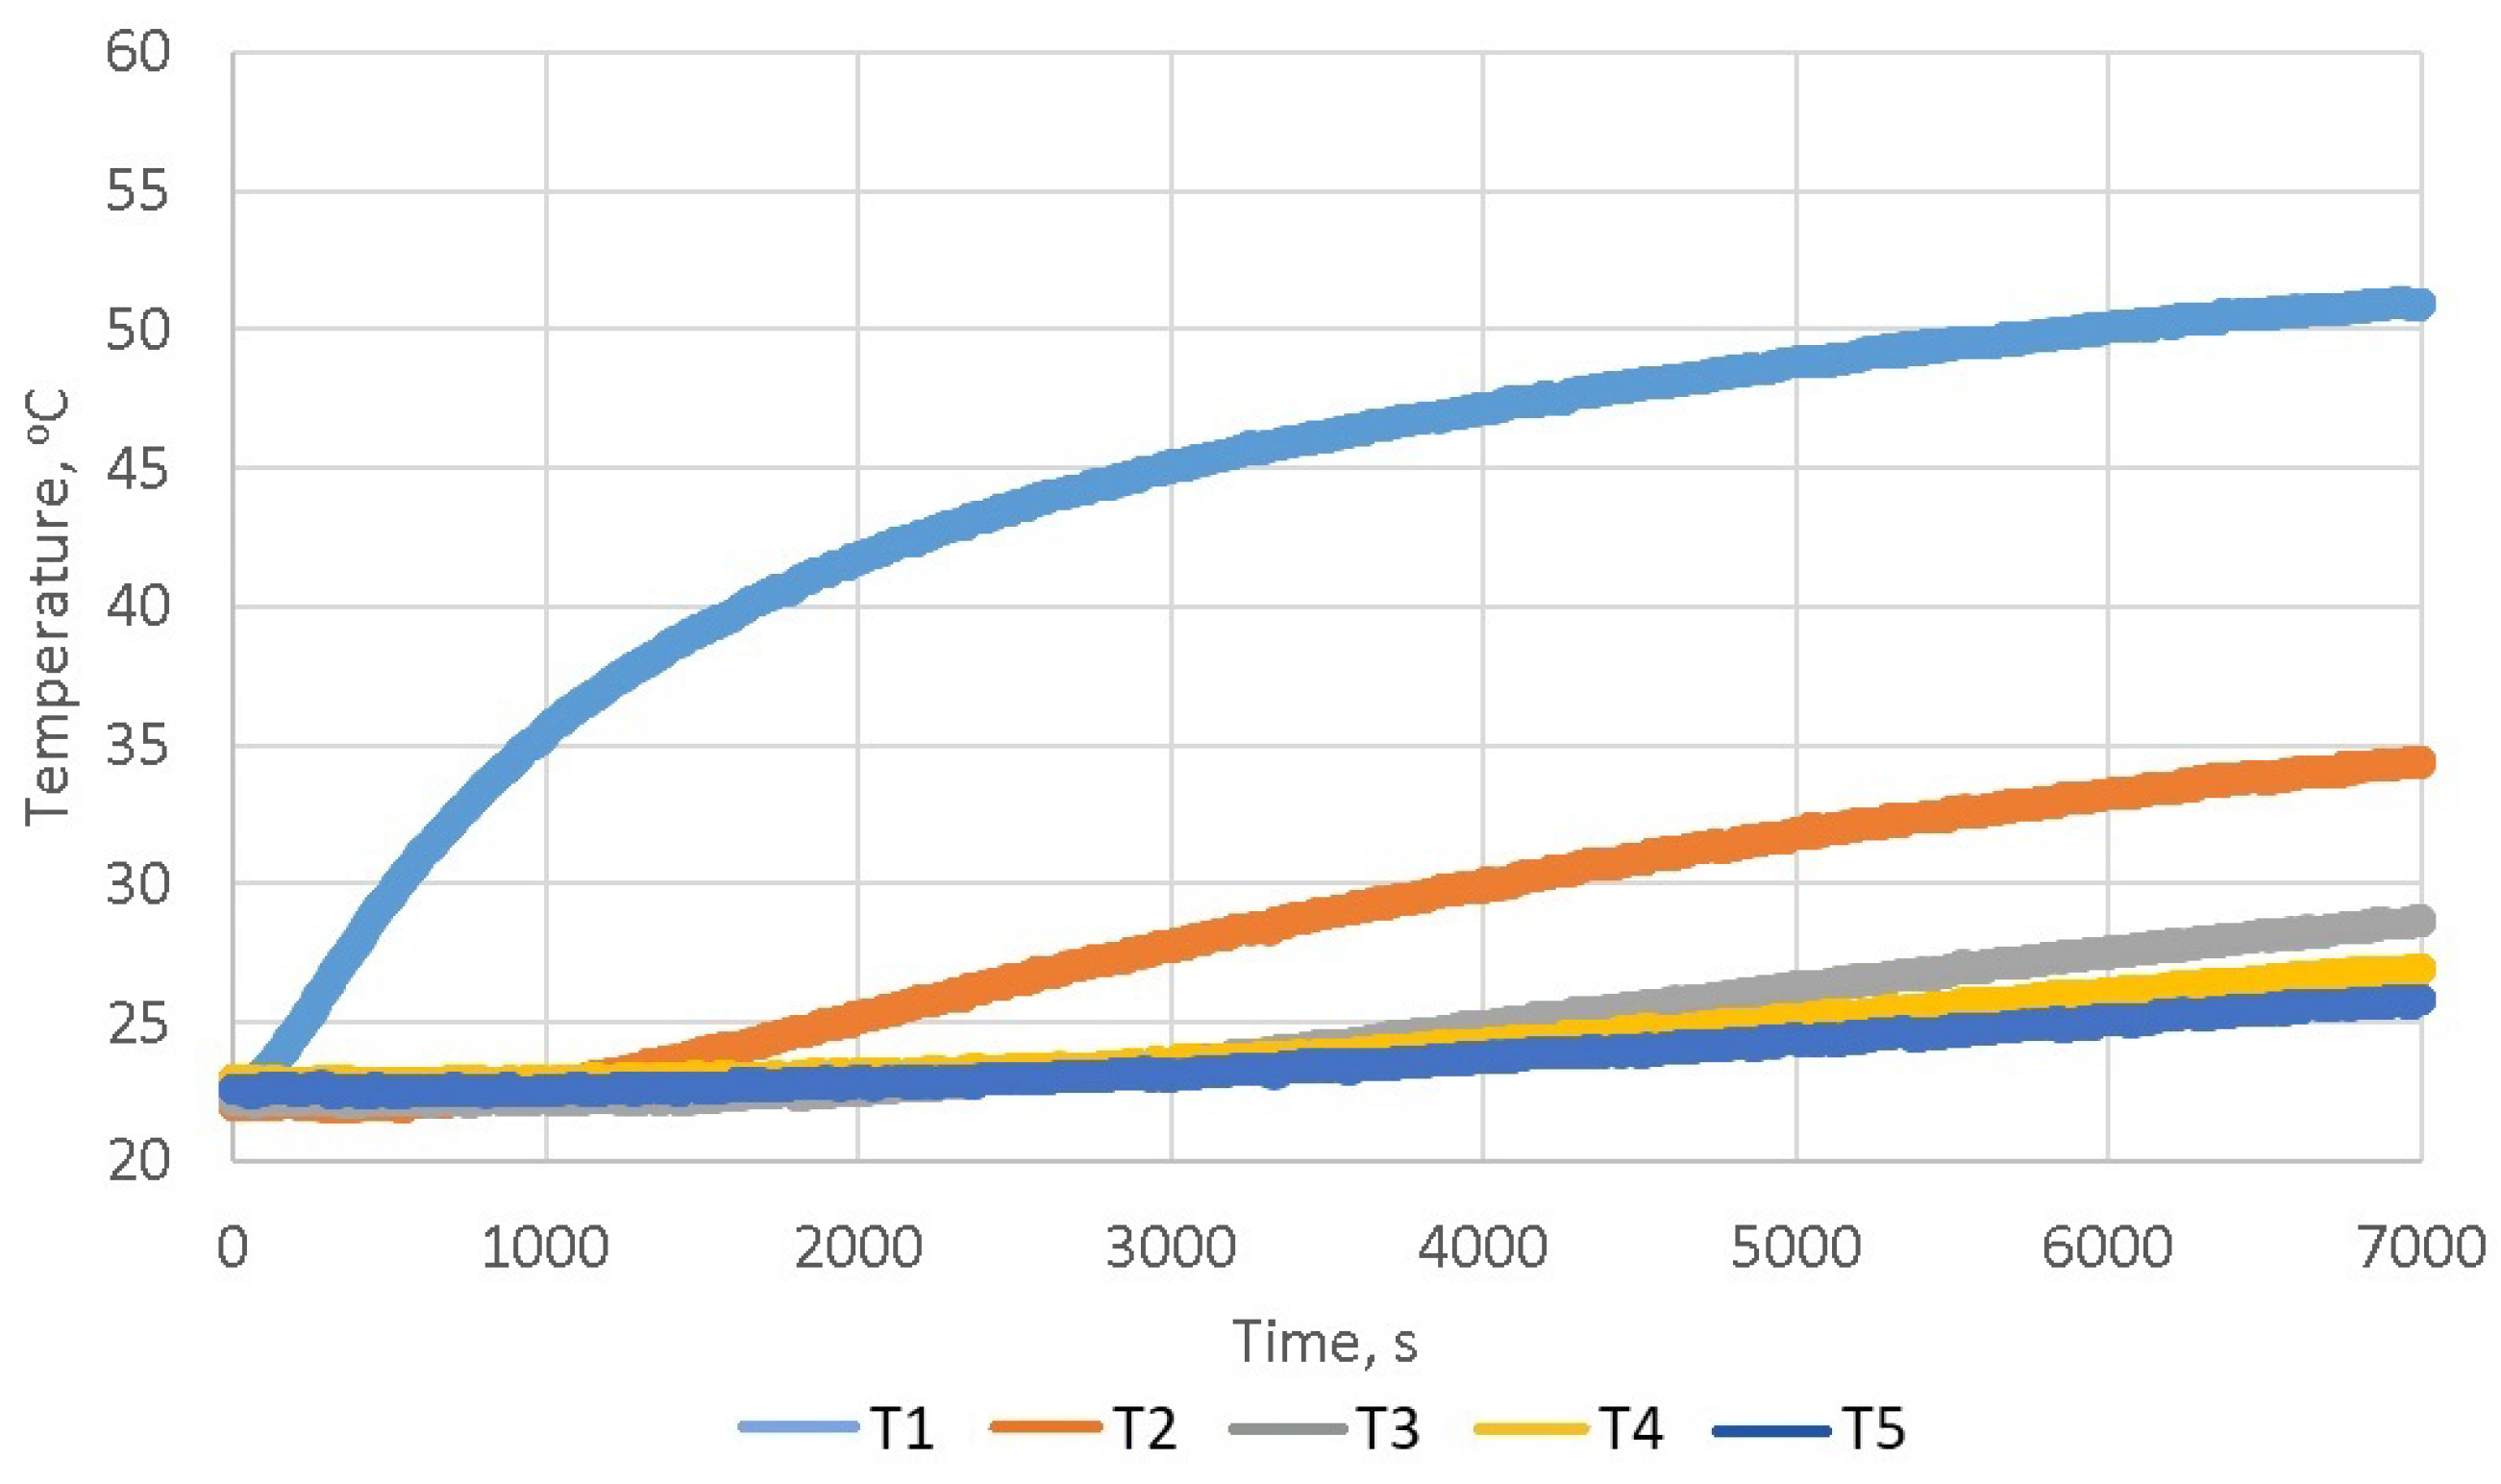
4. Results of Heating Test in Solar Simulator
5. Discussion
6. Conclusions
Author Contributions
Funding
Institutional Review Board Statement
Informed Consent Statement
Data Availability Statement
Conflicts of Interest
References
- Delatte, N.-J. Concrete Pavement Design, Construction, and Performance, 2nd ed.; CRC Press: Boca Raton, FL, USA, 2014. [Google Scholar]
- Das, A. Analysis of Pavement Structures, 1st ed.; CRC Press: Boca Raton, FL, USA, 2017. [Google Scholar]
- Moretti, L. Technical and economic sustainability of concrete pavements. Mod. Appl. Sci. 2014, 8, 1–9. [Google Scholar] [CrossRef]
- Szydło, A.; Mackiewicz, P. Analysis of the costs of construction and maintenance of rigid and flexible pavements. Transp. Overv. 2018, 11, 14–19. [Google Scholar] [CrossRef]
- Ray, G.-K. History and development of concrete pavement design. J. Highw. Div. 1964, 90, 79–101. [Google Scholar] [CrossRef]
- Szydło, A.; Mackiewicz, P. Concrete pavement in Poland—Experience in design and operation. Road Eng. 2017, 11, 359–368. [Google Scholar]
- Kim, S.; Kyo, Y.; Ho, J. Advanced reinforced concrete pavement: Concept and design. Constr. Build. Mater. 2020, 231, 117130. [Google Scholar] [CrossRef]
- Pancar, E.-B.; Akpnar, M.-V. Temperature reduction of concrete pavement using glass bead materials. Int. J. Concr. Struct. Mater. 2016, 10, 39–46. [Google Scholar] [CrossRef]
- Anupam, B.-R.; Balan, L.-A.; Sharma, S. Thermal and mechanical performance of cement concrete pavements containing PVC-glass mix. Road Mater. Pavement Des. 2021, 23, 1207–1219. [Google Scholar] [CrossRef]
- Balan, L.-A.; Anupam, B.-R.; Sharma, S. Thermal and mechanical performance of cool concrete pavements containing waste glass. Constr. Build. Mater. 2021, 290, 123238. [Google Scholar] [CrossRef]
- Kadela, M. Application of foamed concrete in layers of pavement structure. J. Civil Eng. Environ. Archit. 2017, 64, 67–80. [Google Scholar] [CrossRef]
- Panchmatia, P.; Glinicki, M.-A.; Olek, J. Influence of mixture composition on thermal properties of concrete and the performance of rigid pavement. Roads Bridges Drogi i Mosty 2014, 13, 235–260. [Google Scholar] [CrossRef]
- Zhou, W.; Feng, C.; Liu, X.; Liu, S.; Zhang, C.; Yuan, W. Contrastive Numerical Investigations on Thermo-Structural Behaviors in Mass Concrete with Various Cements. Materials 2016, 9, 378. [Google Scholar] [CrossRef] [PubMed]
- Klemczak, B.; Batog, M.; Giergiczny, Z.; Żmij, A. Complex Effect of Concrete Composition on the Thermo-Mechanical Behaviour of Mass Concrete. Materials 2018, 11, 2207. [Google Scholar] [CrossRef] [PubMed]
- Długosz, A.; Pokorska, I.; Jaskulski, R.; Glinicki, M.-A. Evolutionary identification method for determining thermophysical parameters of hardening concrete. Arch. Civ. Mech. Eng. 2016, 21, 35. [Google Scholar] [CrossRef]
- Pogorzelski, J.-A. Caution with unstationary thermal conductivity tests. Build. Res. Inst. 2000, 29, 38–52. [Google Scholar]
- Ratajczak, J. Spectral and Thermal Aspects of Simulation of Solar Radiation. Ph.D. Thesis, Poznan University of Technology, Poznan, Poland, 2013. [Google Scholar]
- Tarantola, A. Inverse Problem Theory and Methods for Model Parameter Estimation; SIAM: Philadelphia, PA, USA, 2005; p. 358.
- Beilina, L. Inverse Problems and Applications, on-line ed.; Springer International Publishing: Cham, Switzerland, 2015; p. 176. [Google Scholar]
- Standard EN 206:2013+A2:2021; Concrete—Specification, Performance, Production and Conformity. European Standard: Pilsen, Czech Republic, 2021.
- Kadela, M.; Winkler-Skalna, A.; Łoboda, B.; Kukiełka, A. Foam concrete—Characteristics and applicability. Build. Mater. 2015, 7, 108–110. [Google Scholar] [CrossRef]
- Kadela, M.; Babiak, B. Foamed concrete in road construction. Build. Mater. 2018, 3, 80–81. [Google Scholar]
- International Standard IEC 60904-9:2020; Photovoltaic Devices—Part 9: Classification of Solar Simulator Characteristics. IEC: Geneva, Switzerland, 2020.
- International Standard IEC 60904-3:2019; Photovoltaic Devices—Part 3: Measurement Principles for Terrestrial Photovoltaic (PV) Solar Devices with Reference Spectral Irradiance Data. IEC: Geneva, Switzerland, 2019.
- International Standard IEC 60904-9:2007; Photovoltaic Devices—Part 9: Solar Simulator Performance Requirements. IEC: Geneva, Switzerland, 2007.
- Fatunla, S.-O. Numerical Methods for Initial Value Problems in Ordinary Differential Equations, 1st ed.; Academic Press: Cambridge, UK, 1998. [Google Scholar]
- Gilat, A.; Subramaniam, V. Numerical Methods for Engineers and Scientists, 3rd ed.; Wiley: Hoboken, NJ, USA, 2014; p. 576. [Google Scholar]
- Nelder, J.-A.; Mead, R. A simplex method for function minimization. Comput. J. 1965, 7, 308–313. [Google Scholar] [CrossRef]
- Ganesan, S.; Othuman, M.-M.-A.; Mohd, Y.-M.-Y. Thermal properties of foamed concrete with various densities and additives at ambient temperature. Appl. Mech. Mater. 2015, 747, 230–233. [Google Scholar] [CrossRef]
- Mydin, M.-A.-O.; Awang, H.; Roslan, A.-F. Determination of lightweight foamed concrete thermal properties integrating various additives. Cem. Concr. Comp. 2012, 48, 9286–9291. [Google Scholar]
- Presciutti, A.; Asdrubali, F.; Marrocchi, A.; Broggi, A.; Pizzoli, G.; Damiani, A. Sun Simulators: Development of an Innovative Low Cost Film Filter. Sustainability 2014, 6, 6830–6846. [Google Scholar] [CrossRef]
- Liu, G.; Ning, J.; Gu, Z.; Wang, Z. Stability Test on Power Supply to the Xenon Lamp of Solar Simulator. J. Phys. Conf. Ser. 2021, 1820, 012142. [Google Scholar] [CrossRef]
- Frolova, T.; Frolov, A. Analysis of a Solar Simulator Based on the Electrodeless Sulfur Lamp for Photovoltaic Devices. Telecommun. Radio Eng. 2018, 77, 6. [Google Scholar] [CrossRef]


| Sample No. | Bulk Density | RMSE | a |
|---|---|---|---|
| [] | [%] | [] | |
| 1.1 | 2318 | 2.98 | 1.273 |
| 1.2 | 2322 | 3.80 | |
| 1.3 | 2317 | 4.44 | |
| 1.4 | 2321 | 1.84 | |
| mean value/uncertainty | 2319 ± 3 | (1.240 ± 0.053) | |
| 2.1 | 1175 | 1.47 | |
| 2.2 | 1172 | 1.09 | |
| 2.3 | 1174 | 1.30 | |
| 2.4 | 1172 | 1.16 | |
| mean value/uncertainty | 1173 ± 2 | (0.520 ± 0.096) | |
| 3.1 | 772 | 2.00 | |
| 3.2 | 776 | 1.22 | |
| 3.3 | 777 | 1.88 | |
| 3.4 | 767 | 2.61 | |
| mean value/uncertainty | 773 ± 5 | (0.402 ± 0.078) | |
| 4.1 | 636 | 2.42 | |
| 4.2 | 647 | 2.37 | |
| 4.3 | 640 | 2.71 | |
| 4.4 | 621 | 2.48 | |
| mean value/uncertainty | 636 ± 11 | (0.259 ± 0.017) | |
| 5.1 | 425 | 3.13 | |
| 5.2 | 442 | 3.50 | |
| 5.3 | 443 | 1.82 | |
| 5.4 | 428 | 4.00 | |
| mean value/uncertainty | 434 ± 9 | (0.160 ± 0.019) |
Disclaimer/Publisher’s Note: The statements, opinions and data contained in all publications are solely those of the individual author(s) and contributor(s) and not of MDPI and/or the editor(s). MDPI and/or the editor(s) disclaim responsibility for any injury to people or property resulting from any ideas, methods, instructions or products referred to in the content. |
© 2023 by the authors. Licensee MDPI, Basel, Switzerland. This article is an open access article distributed under the terms and conditions of the Creative Commons Attribution (CC BY) license (https://creativecommons.org/licenses/by/4.0/).
Share and Cite
Bilski, M.; Górnaś, P.; Pożarycki, A.; Skrzypczak, P.; Słowik, M.; Mielczarek, M.; Wróblewska, A.; Semkło, Ł. Thermal Diffusivity of Concrete Samples Assessment Using a Solar Simulator. Materials 2023, 16, 1268. https://doi.org/10.3390/ma16031268
Bilski M, Górnaś P, Pożarycki A, Skrzypczak P, Słowik M, Mielczarek M, Wróblewska A, Semkło Ł. Thermal Diffusivity of Concrete Samples Assessment Using a Solar Simulator. Materials. 2023; 16(3):1268. https://doi.org/10.3390/ma16031268
Chicago/Turabian StyleBilski, Marcin, Przemysław Górnaś, Andrzej Pożarycki, Przemysław Skrzypczak, Mieczysław Słowik, Marta Mielczarek, Agnieszka Wróblewska, and Łukasz Semkło. 2023. "Thermal Diffusivity of Concrete Samples Assessment Using a Solar Simulator" Materials 16, no. 3: 1268. https://doi.org/10.3390/ma16031268
APA StyleBilski, M., Górnaś, P., Pożarycki, A., Skrzypczak, P., Słowik, M., Mielczarek, M., Wróblewska, A., & Semkło, Ł. (2023). Thermal Diffusivity of Concrete Samples Assessment Using a Solar Simulator. Materials, 16(3), 1268. https://doi.org/10.3390/ma16031268