1. Introduction
Light-emitting diodes (LEDs) have achieved big success in lighting and display applications [
1,
2]. To support the sustainable and healthy development of the huge LED industry, which ranges from substrate epitaxy, LED chip fabrication, and LED package to end-use applications, it is urgent to open up new fields of application [
1,
2]. For this aspect, the red and near-infrared LEDs show a bright future for applications in infrared photography, imaging, photomedicine, biomedicine, sensors, detectors, photosynthetic agriculture, and as a backlight for testing instruments [
3,
4,
5,
6,
7].
Compared with multiple-chip LEDs, the phosphor-converted LEDs have many distinct advantages in terms of an easily tunable emission wavelength, low cost of manufacturing, and a short period research and development cycle. Moreover, the technique of fabricating blue LED chips is relatively more mature than that of other kinds of ultraviolet, near ultraviolet, and deep ultraviolet chips. In addition, the instruments used to grow blue LED chips, mainly metal–organic chemical vapor deposition (MOCVD), are abundant, and the key raw materials for fabricating blue LED chips are available. Nevertheless, due to the large Stokes shift, it is a challenge to convert the blue emission of LED chips into red and near-infrared photons by using phosphors. Both Eu
2+ and Ce
3+ have been widely used as activators to obtain yellow, green, and red emissions, but it is very hard to obtain near-infrared emissions from Eu
2+ and Ce
3+ under the excitation of blue light [
8,
9,
10]. Comparatively, the Cr
3+, whose d orbital has a relatively small crystal field splitting energy, is promising for obtaining red and near-infrared emissions under blue excitation [
5,
6,
7]. However, the d-d transition of Cr
3+ is spin-forbidden, and accordingly, the absorbance of Cr
3+ is low, which results in the luminescence of the Cr
3+-activated phosphor with poor efficiency. Recent progress achieved in the NIR phosphors activated by Cr
3+ is described in the latest review papers on references [
11,
12,
13]. Generally, the absorbance and luminescence efficiency of the Cr
3+-activated phosphors are far below those of the Eu
2+- and Ce
3+- activated phosphors. To enhance the luminous efficiency of the Cr
3+-activated phosphors, the absorbance of the phosphor should be improved above all.
The rare-earth (RE) scandium borates RESc
3(BO
3)
4 have a calcite-derived huntite structure, crystallized in the trigonal R32 space group [
14,
15,
16]. In the crystal lattice of RESc
3(BO
3)
4, the Sc atom provides an ideal site for the activator Cr
3+ because of their similar ion radii (Sc
3+, 0.81; Cr
3+, 0.69) and charge balance. Surprisingly, we found out that the luminescence efficiency of CeSc
3(BO
3)
4:Cr
3+ is several orders of magnitude higher than that of GdSc
3(BO
3)
4:Cr
3+, TbSc
3(BO
3)
4:Cr
3+, and LuSc
3(BO
3)
4:Cr
3+. This exceptional phenomenon mechanism was revealed in this work with energy conversion and transfer in the luminescence of CeSc
3(BO
3)
4:Cr
3+ phosphor.
2. Experimental Procedure
The phosphors RE(Sc0.975Cr0.025)3(BO3)4 (RE = Ce, Gd, Tb, and Lu), abbreviated as RESc3(BO3)4:Cr3+ below, were synthesized with a two-step solid-state reaction. The high-purity CeO2 (99.99%, Kepu, Ganzhou), Gd2O3 (99.99%, Kepu, Ganzhou), Tb4O7 (99.99%, Kepu, Ganzhou), Lu2O3 (99.99%, Kepu, Ganzhou), Sc2O3 (99.99%, Kepu, Ganzhou), H3BO3 (99.8%, Sinopharm), and Cr(NO3)3·9H2O (99.95%, Luoen, Shanghai) were used as raw materials. Firstly, the stoichiometric raw materials were thoroughly ground with a high-speed vibration ball mill. Next, the ball-milled mixtures were pre-fired at 500 ℃ for 2 h, and then the pre-fired products were ground again using the agate mortar and pestle. Finally, the phosphors were synthesized at 1250 oC for 8 h in ambient air. Crystal structures of the phosphors were examined with the X-ray diffractometer (PANalytical, X-Pert PRO MPD) using a Cu target. The morphology was tested by scanning electron microscopy (JEOL, JSM-6490LV). The excitation and emission spectra of the samples were tested by a fluorescence spectrometer (Hitachi, F4600). The test sample was loaded into a self-made sample tank, pressed, and scraped flat to guarantee that the excitation and emission spectra were measured under the same conditions. The absorption spectra were collected with a UV–visible near infrared spectrophotometer (Shimadzu Corporation, Kyoto City, Japan, Shimadzu, UV-3600). All samples’ excitation and emission spectra were tested after the samples were synthesized and preserved for 8 months. The fluorescence quantum yield was measured with an absolute photoluminescence quantum yield measurement system (Hamamatsu Photonics K. K., Hamamatsu City, Janpan, Hamamatsu, Quantaurus-QY plus C13534-31), and the accumulation wavelength range is 300–1600 nm. The band gap, reflective spectra, absorption spectra, and the optical parameter of refractive index were calculated using the CASTEP module of Materials Studio 2019 software by employing the crystal structure of Ce3Sc(BO3)4 with PDF # 38-0720 as the initial structure model. In calculating the properties of RE’Sc3(BO3)4 (RE’ = Gd, Tb, Lu), the Ce atom was replaced with Gd, Tb, and Lu, respectively. Before performing computations, the crystal structure was optimized with the generalized gradient approximation (GGA).
3. Results and Discussion
The compounds RESc
3(BO
3)
4 (RE = Ce, Gd, Tb, Lu) are members of a large group of huntite-family rare-earth borates REM
3(BO
3)
4 (M = Al, Sc, Cr, Fe, Ga) that crystallize in the structure of huntite minerals, CaMg
3(CO
3)
4 [
14,
15,
16]. From the X-ray diffraction (XRD) patterns of the RESc
3(BO
3)
4:Cr
3+ (RE = Ce, Gd, Tb, Lu) phosphors shown in
Figure 1a, we can see that the main diffraction peaks of CeSc
3(BO
3)
4:Cr
3+ phosphor are consistent with standard PDF# 38-0720 of CeSc
3(BO
3)
4. When Ce is replaced with Gd, Tb, and Lu, the phosphors of GdSc
3(BO
3)
4:Cr
3+, TbSc
3(BO
3)
4:Cr
3+, and LuSc
3(BO
3)
4:Cr
3+ exhibit a similar diffraction pattern to that of CeSc
3(BO
3)
4:Cr
3+, as Ce, Gd, Tb, and Lu belong to the same rare-earth family elements. Furthermore, the minor peaks indicate the presence of minor intermediate compounds of TbBO
3 and ScBO
3, as well as the remaining unreacted CeO
2 raw material. Indeed, the melting point of B
2O
3, about 450
oC, is very low, while the melting point of rare-earth oxides is far higher. During the synthesis process of RESc
3(BO
3)
4, the rare-earth orthogonal borates REBO
3 usually appear first, followed by the formation of RESc
3(BO
3)
4. For this reason, we always find that borates such as TbBO
3 and ScBO
3 always accompany the RESc
3(BO
3)
4 phases. The three-dimensional structure of CeSc
3(BO
3)
4, shown in
Figure 1b, exhibits non-centrosymmetry with the space group R32 in the trigonal system. In the crystal lattice of CeSc
3(BO
3)
4, both Sc and Ce are sixfold coordinated, as shown in
Figure 1b. Considering ionic radium and charge balance, Cr
3+ should take the place of Sc in the crystal lattice of RESc
3(BO
3)
4. Except for pure hosts, the concentration of Cr
3+ doped in each RESc
3(BO
3)
4 sample was nominally fixed at 2.5 atm% of Sc in the crystal lattice. Thus, the luminescence properties of Cr
3+ in the RESc
3(BO
3)
4 host could be explained with the Tanabe–Sugano diagram as shown in
Figure 1c.
The scanning electron microscope (SEM) image presented in
Figure 2 shows that the particles of CeSc
3(BO
3)
4:Cr
3+ phosphor have a typical size of 2–10 μm, consisting of several small grains that have agglomerated together. Nonetheless, the characteristic trigonal profile of the grains could still be identified from the irregular particles, as indicated by the arrow in
Figure 2.
The emission and excitation spectra of RESc
3(BO
3)
4:Cr
3+ (RE = Ce, Gd, Tb, Lu) displayed in
Figure 3 show that the luminescence intensity of CeSc
3(BO
3)
4:Cr
3+ is nearly four times higher than that of LuSc
3(BO
3)
4:Cr
3+ and more than 10 times higher than that of GdSc
3(BO
3)
4:Cr
3+ and TbSc
3(BO
3)
4:Cr
3+. This phenomenon is very interesting. The measured quantum yield and absorbance of CeSc
3(BO
3)
4:Cr
3+ are 65.8% and 24.4%, respectively.
Figure 3a presents the emission spectra of RESc
3(BO
3)
4:Cr
3+ (RE = Ce, Gd, Tb, Lu) under the excitation of 471 nm, in which the broadband emission is attributed to the
4A
2-
4T
2(
4F) transition of Cr
3+. By monitoring the emission of Cr
3+ at 822, 830, and 866 nm, the excitation spectra of RESc
3(BO
3)
4:Cr
3+ (RE = Ce, Gd, Tb, Lu) are given in
Figure 3b–d, respectively, in which two strong excitation bands in regions of 400–575 nm and 575–800 nm are attributed to the electron transitions of
4A
2-
4T
1(
4F) and
4A
2-
4T
2(
4F), respectively [
11,
12,
13]. Moreover, minor excitation bands in the region of 200–400 nm are observed, which should be caused by host excitation (as discussed below) in addition to the high-level excitation of Cr
3+ with the
4A
2-
4T
1(
4G) transition. Many electronic vibration peaks were observed in
Figure 3b–d, particularly in
Figure 3d as indicated by arrows, which for one side suggests the presence of strong thermal vibration of the crystal lattice on Cr
3+ luminescence and for the other side suggests that the crystal lattice of RESc
3(BO
3)
4:Cr
3+ (RE = Ce, Gd, Tb, Lu) has an un-rigid structure. Through the electronic vibration peaks displayed in
Figure 3d, the phonon energy of CeSc
3(BO
3)
4:Cr
3+ phosphor could be evaluated, in which the reciprocal of peak wavelengths corresponds to energy. According to quantum mechanics, the difference between two neighboring peaks corresponds to the energy of coupled phonons, nћω, i.e., n times the smallest one ћω, where n is the natural number. Hereby, the smallest phonon energy ћω, which is about 347.7 cm
−1, was evaluated from the neighboring peaks at 718.3 nm and 736.7 nm as marked with pink arrows in
Figure 3d. Using the relation of phonon energy of E =
ħω, where
ħ = h /2 π (h is the Planck constant, h = 6.626 × 10
−34 J·s = 4.1369 × 10
−15 eV·s;
ħ is the reduced Planck constant,
ħ = 1.055 × 10
−34 J·s = 6.582 × 10
−16 eV·s) and ω = 2 πν (radians per unit time), the angular frequency ω was evaluated at 4.26 × 10
21 (rad/ S).
To reveal the mechanisms of the far higher photoluminescence of CeSc
3(BO
3)
4:Cr
3+ phosphor than others, the emission and excitation spectra of RESc
3(BO
3)
4:Cr
3+ (RE = Ce, Gd, Tb, Lu) were first normalized. After normalizing the emission intensity, the spectra in
Figure 4a show that the emission peaks red shift upon the change of rare-earth elements in the order of Ce-Lu-Gd-Tb. However, the variation in emission peak is not evident. With the strongest excitation at 471 nm normalized to 1.0, the excitation spectra upon the emission at 822 nm are shown in
Figure 3b. As indicated by the line in
Figure 4b, the relative excitation intensity in the 550–700 nm region in the order of Tb-Gd-Lu-Ce is opposite to that presented in
Figure 3a for luminescence red shift. To some extent, this phenomenon suggests that the relaxation of electrons from the
4T
1(
4F) to
4T
2(
4F) level that produces NIR emission results in the low-efficiency luminescence of the phosphors.
The element Lu, due to the inert electronic structure of [Xe]4f
14, is widely used as a component for phosphor hosts, such as the green phosphor of Lu
3Al
5O
12:Ce
3+ for white LEDs [
17]. The element Gd
3+, which has a 4f semi-complete orbital electronic structure, i.e., [Xe]4f
7, is not only used as a component of phosphor hosts but is also frequently used as a sensitizer, such as a phosphor (Y,Gd)BO
3:Eu
3+ for plasma display panels. Gd
3+ is a good innate sensitizer due to the large energy difference between the ground state,
8S, and the lowest excited level,
6P. Thus, Gd
3+ could play the role of an intermediate to transfer energy through the sublattice [
18]. Ce
3+ and Tb
3+ are commonly used as phosphor activators to obtain various color emissions, but they can also be used as components of hosts, such as the traditional green phosphor LaPO
4:Ce
3+,Tb
3+ for fluorescent lamps and the yellow phosphor Tb
3Al
5O
12:Ce
3+ for white LEDs [
19,
20]. Herein, the rare-earth elements Ce, Gd, Tb, and Lu were all used as the components of hosts for the activator Cr
3+. Surprisingly, the photoluminescence of Cr
3+ in the CeSc
3(BO
3)
4 host is far higher than that in GdSc
3(BO
3)
4, TbSc
3(BO
3)
4, and LuSc
3(BO
3)
4 hosts. To further reveal the mechanisms, the emission, excitation, and absorption spectra of the CeSc
3(BO
3)
4 host without doping Cr
3+ were studied.
By exciting the CeSc
3(BO
3)
4 host with two different wavelengths of 323 and 358 nm, nearly the same configuration emission spectra were obtained, as shown in
Figure 5a, which confirms that the emissions originate from the same mechanism. By monitoring the emission at 450 and 472 nm, the excitation spectra are shown in
Figure 5b, in which two excitation peaks were observed. In
Figure 5b, the two excitation peaks should originate from the 4f–5d transition of Ce
3+. The spin–orbital coupling effect on the outer one electron in the 4f orbital splits the ground state of the Ce
3+ electron into two states,
4F
5/2 and
4F
7/2. Thus, the two excitation peaks at 323 and 358 nm in
Figure 5b were attributed to the
4F
5/2–5d and
4F7
/2–5d transitions of Ce
3+. Accordingly, the emission spectra of the CeSc
3(BO
3)
4 host presented in
Figure 5a were attributed to the 5d–4f transition of Ce
3+. By plotting the emission and excitation spectra of the CeSc
3(BO
3)
4 host together,
Figure 5c shows that there is almost no overlap between them, suggesting the CeSc
3(BO
3)
4 host has a weak crystal field. The excitation peaks of the
4F
5/2–5d and
4F
7/2–5d transitions at 323 and 358 nm, respectively, in
Figure 5b, show that the energy difference between the
4F
5/2 and
4F7
/2 states is about 3000 cm
−1, which is equivalent to 9–10 phonons (as above-obtained, 347.7 cm
−1) in CeSc
3(BO
3)
4:Cr
3+ phosphor. The energy difference between the
4F
5/2 and
4F7
/2 states in CeSc
3(BO
3)
4:Cr
3+ phosphor is far higher than that in the rigid-structure phosphors such as Y
3Al
5O
12:Ce
3+ [
17], also indicating the soft structure of CeSc
3(BO
3)
4.
The absorption spectrum of the CeSc
3(BO
3)
4 host is shown in
Figure 5d, in which a broadband consisting of several peaks was observed. By plotting the absorption and the excitation spectra of CeSc
3(BO
3)
4 together, the absorption peaks of the characteristic
4F
5/2–5d and
4F7
/2–5d transitions of Ce
3+ were easily identified. The extra absorption within 200–300 nm may be caused by the electron transitions within the Sc-O or Sc-BO
3 bonds. Therefore,
Figure 5d suggests that the minor excitation band within 200–400 nm should be caused by the CeSc
3(BO
3)
4 host, but the
4A
2-
4T
1(
4P) transition of Cr
3+ cannot be excluded.
Figure 5d shows that the low energy cutoff of the absorption spectrum is approximately 400 nm, suggesting the band gap of the CeSc
3(BO
3)
4 host is about 3.1 eV. The calculated band gap of CeSc
3(BO
3)
4 shown in
Figure 6a is about 0.494 eV. The result is comparable with the calculated value of 0.317 eV of CeSc
3(BO
3)
4 band gap shared in the Materials Project with ID mp-16097 [
21]. Due to the inherent nature of the first principle calculation, the calculated band is usually smaller than the experimental one [
22]. Nevertheless, the calculated band still could provide some important information for understanding the mechanism.
Figure 6d shows that the Fermi level consists of a line, which should originate from the 4f orbital of CeSc
3(BO
3)
4 and is consistent with the experimental results in
Figure 5d. The refractive index is an intrinsic parameter that determines the optical behavior of reflection and absorption. As the result shown in
Figure 6b, the refractive index changes with photon energy. However, the blue excitation and NIR emission have photon energies less than 5 eV. As shown in
Figure 6c,d, there is a significant difference in the reflection and absorption spectra among the REc
3(BO
3)
4 hosts within the energy range of 5–50 eV. Yet, there is almost no difference in the energy below 5 eV, which further indicates that Ce plays a special role in improving the luminescence efficiency of CeSc
3(BO
3)
4:Cr
3+.
By plotting the emission of the CeSc
3(BO
3)
4 host and the excitation of the CeSc
3(BO
3)
4:Cr
3+ phosphor together, the spectra are shown in
Figure 7. In
Figure 7, a good match between the emission of the CeSc
3(BO
3)
4 host and the
4A
2-
4T
1(
4F) excitation of Cr
3+ in the CeSc
3(BO
3)
4:Cr
3+ phosphor suggests that there is an energy transfer from the CeSc
3(BO
3)
4 host Ce
3+ to the activator Cr
3+. With the intensity normalized, the overlap of Cr
3+ absorption and Ce
3+ emission is 99% of Ce
3+ emission, suggesting an efficient pathway from Ce
3+ emission to Cr
3+ re-absorption.
However, the excitation spectra in
Figure 3b–d show that the energy transfer from the host to Cr
3+ is not efficient since the relative intensity of excitation in the 200–400 nm range is very low. Moreover, no overlap between the emission and excitation spectra of Ce
3+ suggests that the Stokes shift is very high. As a result, the energy transfer between variant Ce
3+ ions is almost impossible. This phenomenon could be explained by the low phonon energy in CeSc
3(BO
3)
4. Thus, the energy transfer pathway from Ce
3+ to Cr
3+ through electron resonance effect was excluded. By combining with the absorption spectrum in
Figure 5d, we get to know that the energy transfer from Ce
3+ to Cr
3+ in the CeSc
3(BO
3)
4:Cr
3+ phosphor under the excitation of blue light is thus through coaction of Ce
3+ emission and Cr
3+ reabsorption. Accordingly, the mechanism of the energy transfer from the CeSc
3(BO
3)
4 host to the Cr
3+ activator and energy conversion processes in the CeSc
3(BO
3)
4:Cr
3+ phosphor could be depicted with
Scheme 1.


 and
and 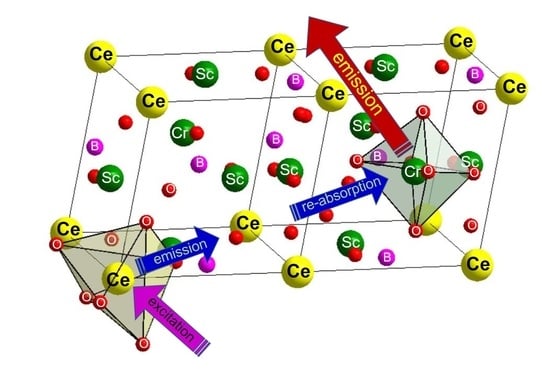


