
Characterization of Zr-Containing Dispersoids in Al–Zn–Mg–Cu Alloys by Small-Angle Scattering
 ,
,  , , , ,
Abstract
1. Introduction
2. Materials and Methods
3. Results
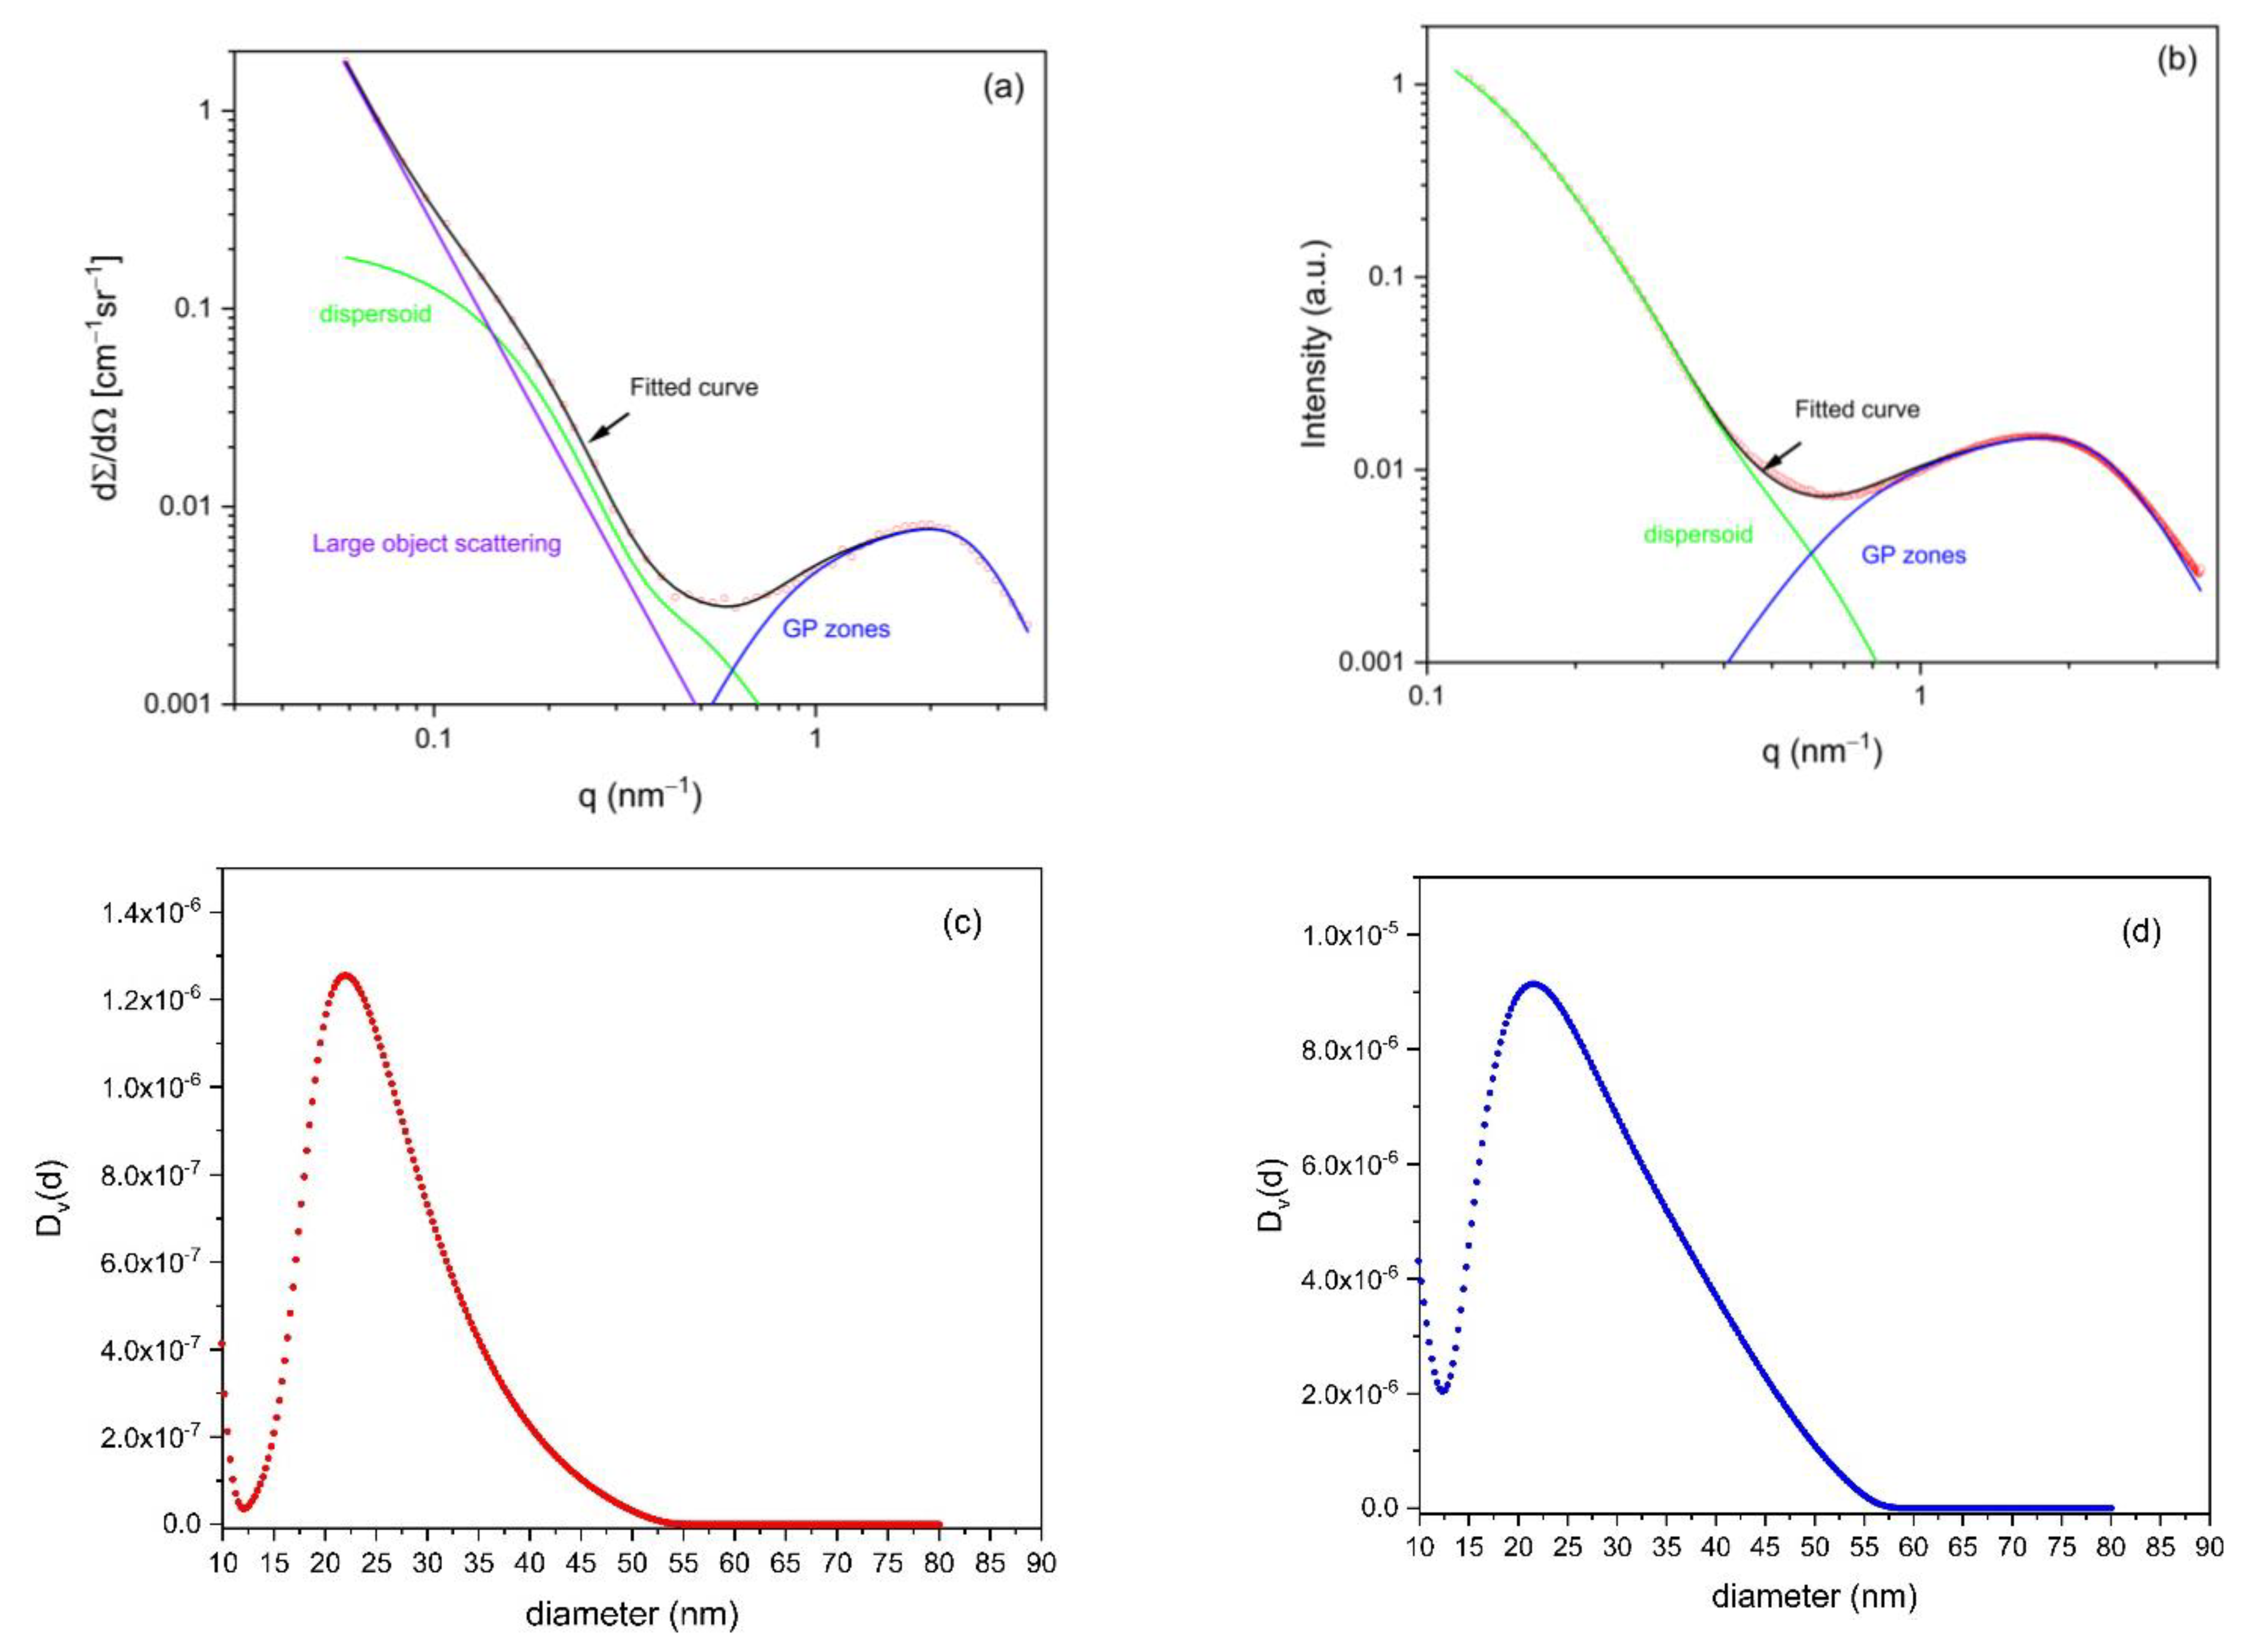
3.1. SANS/SAXS
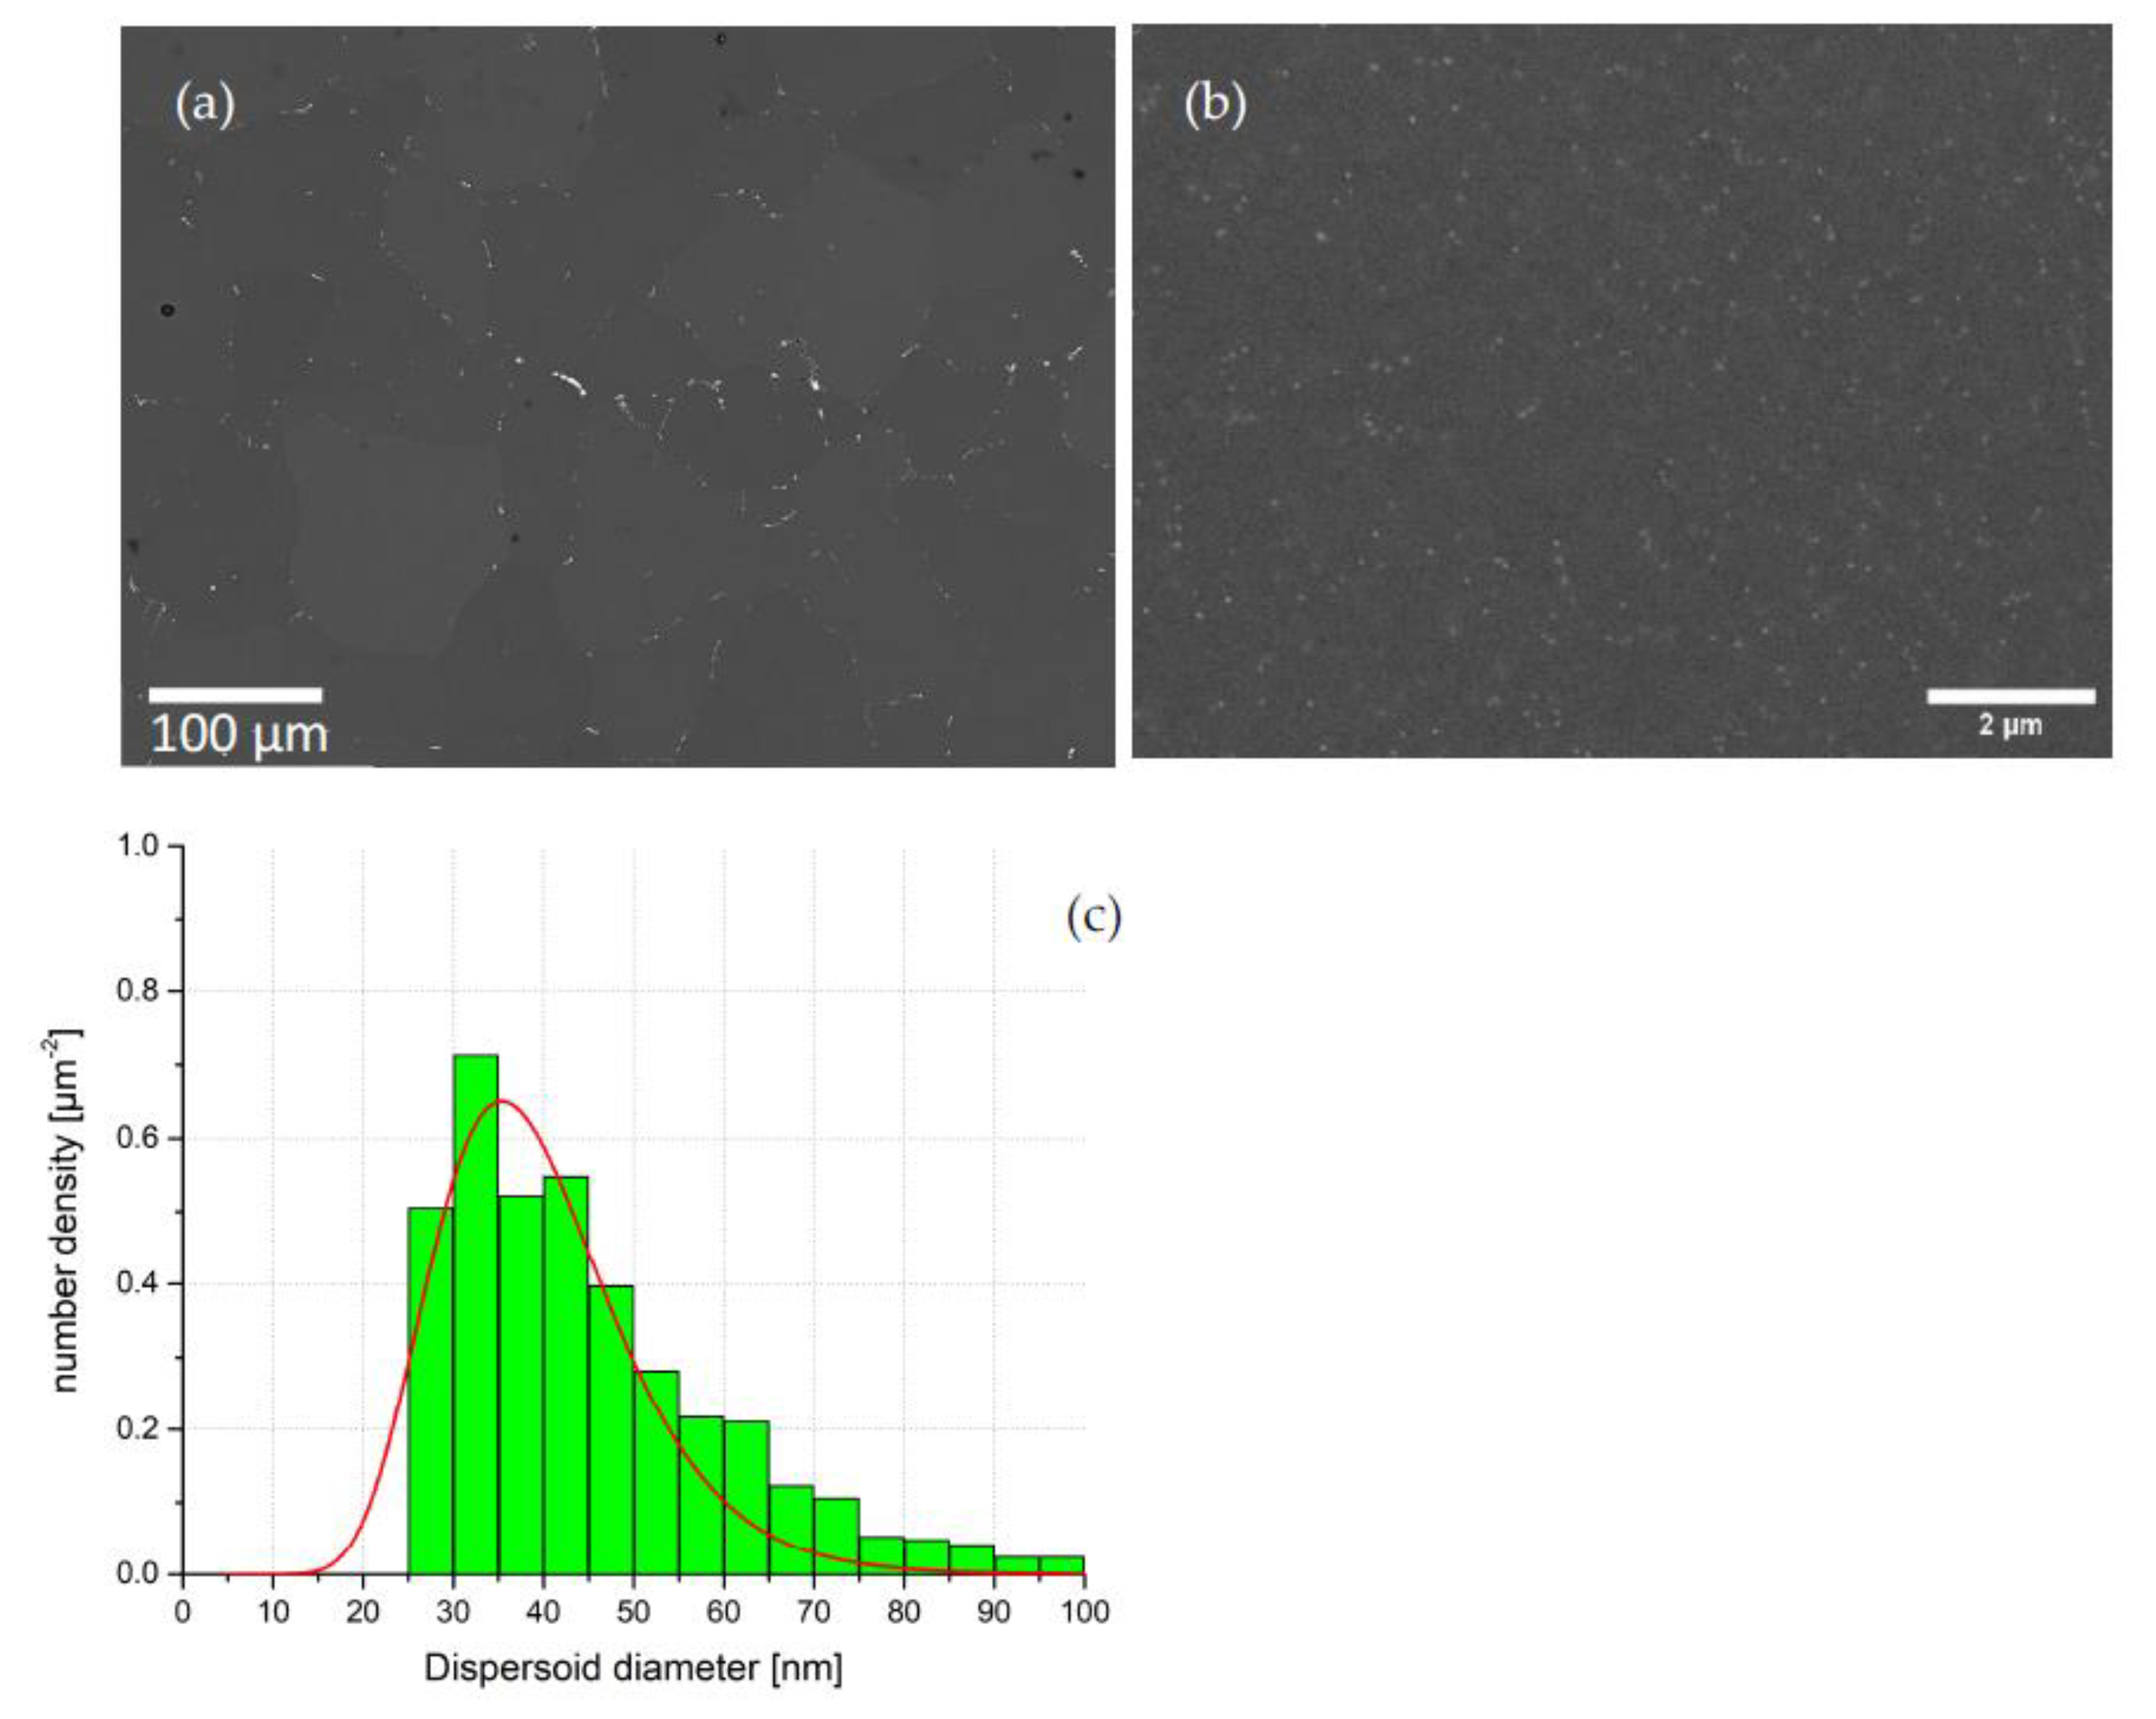
3.2. Scanning Electron Microscopy (SEM)
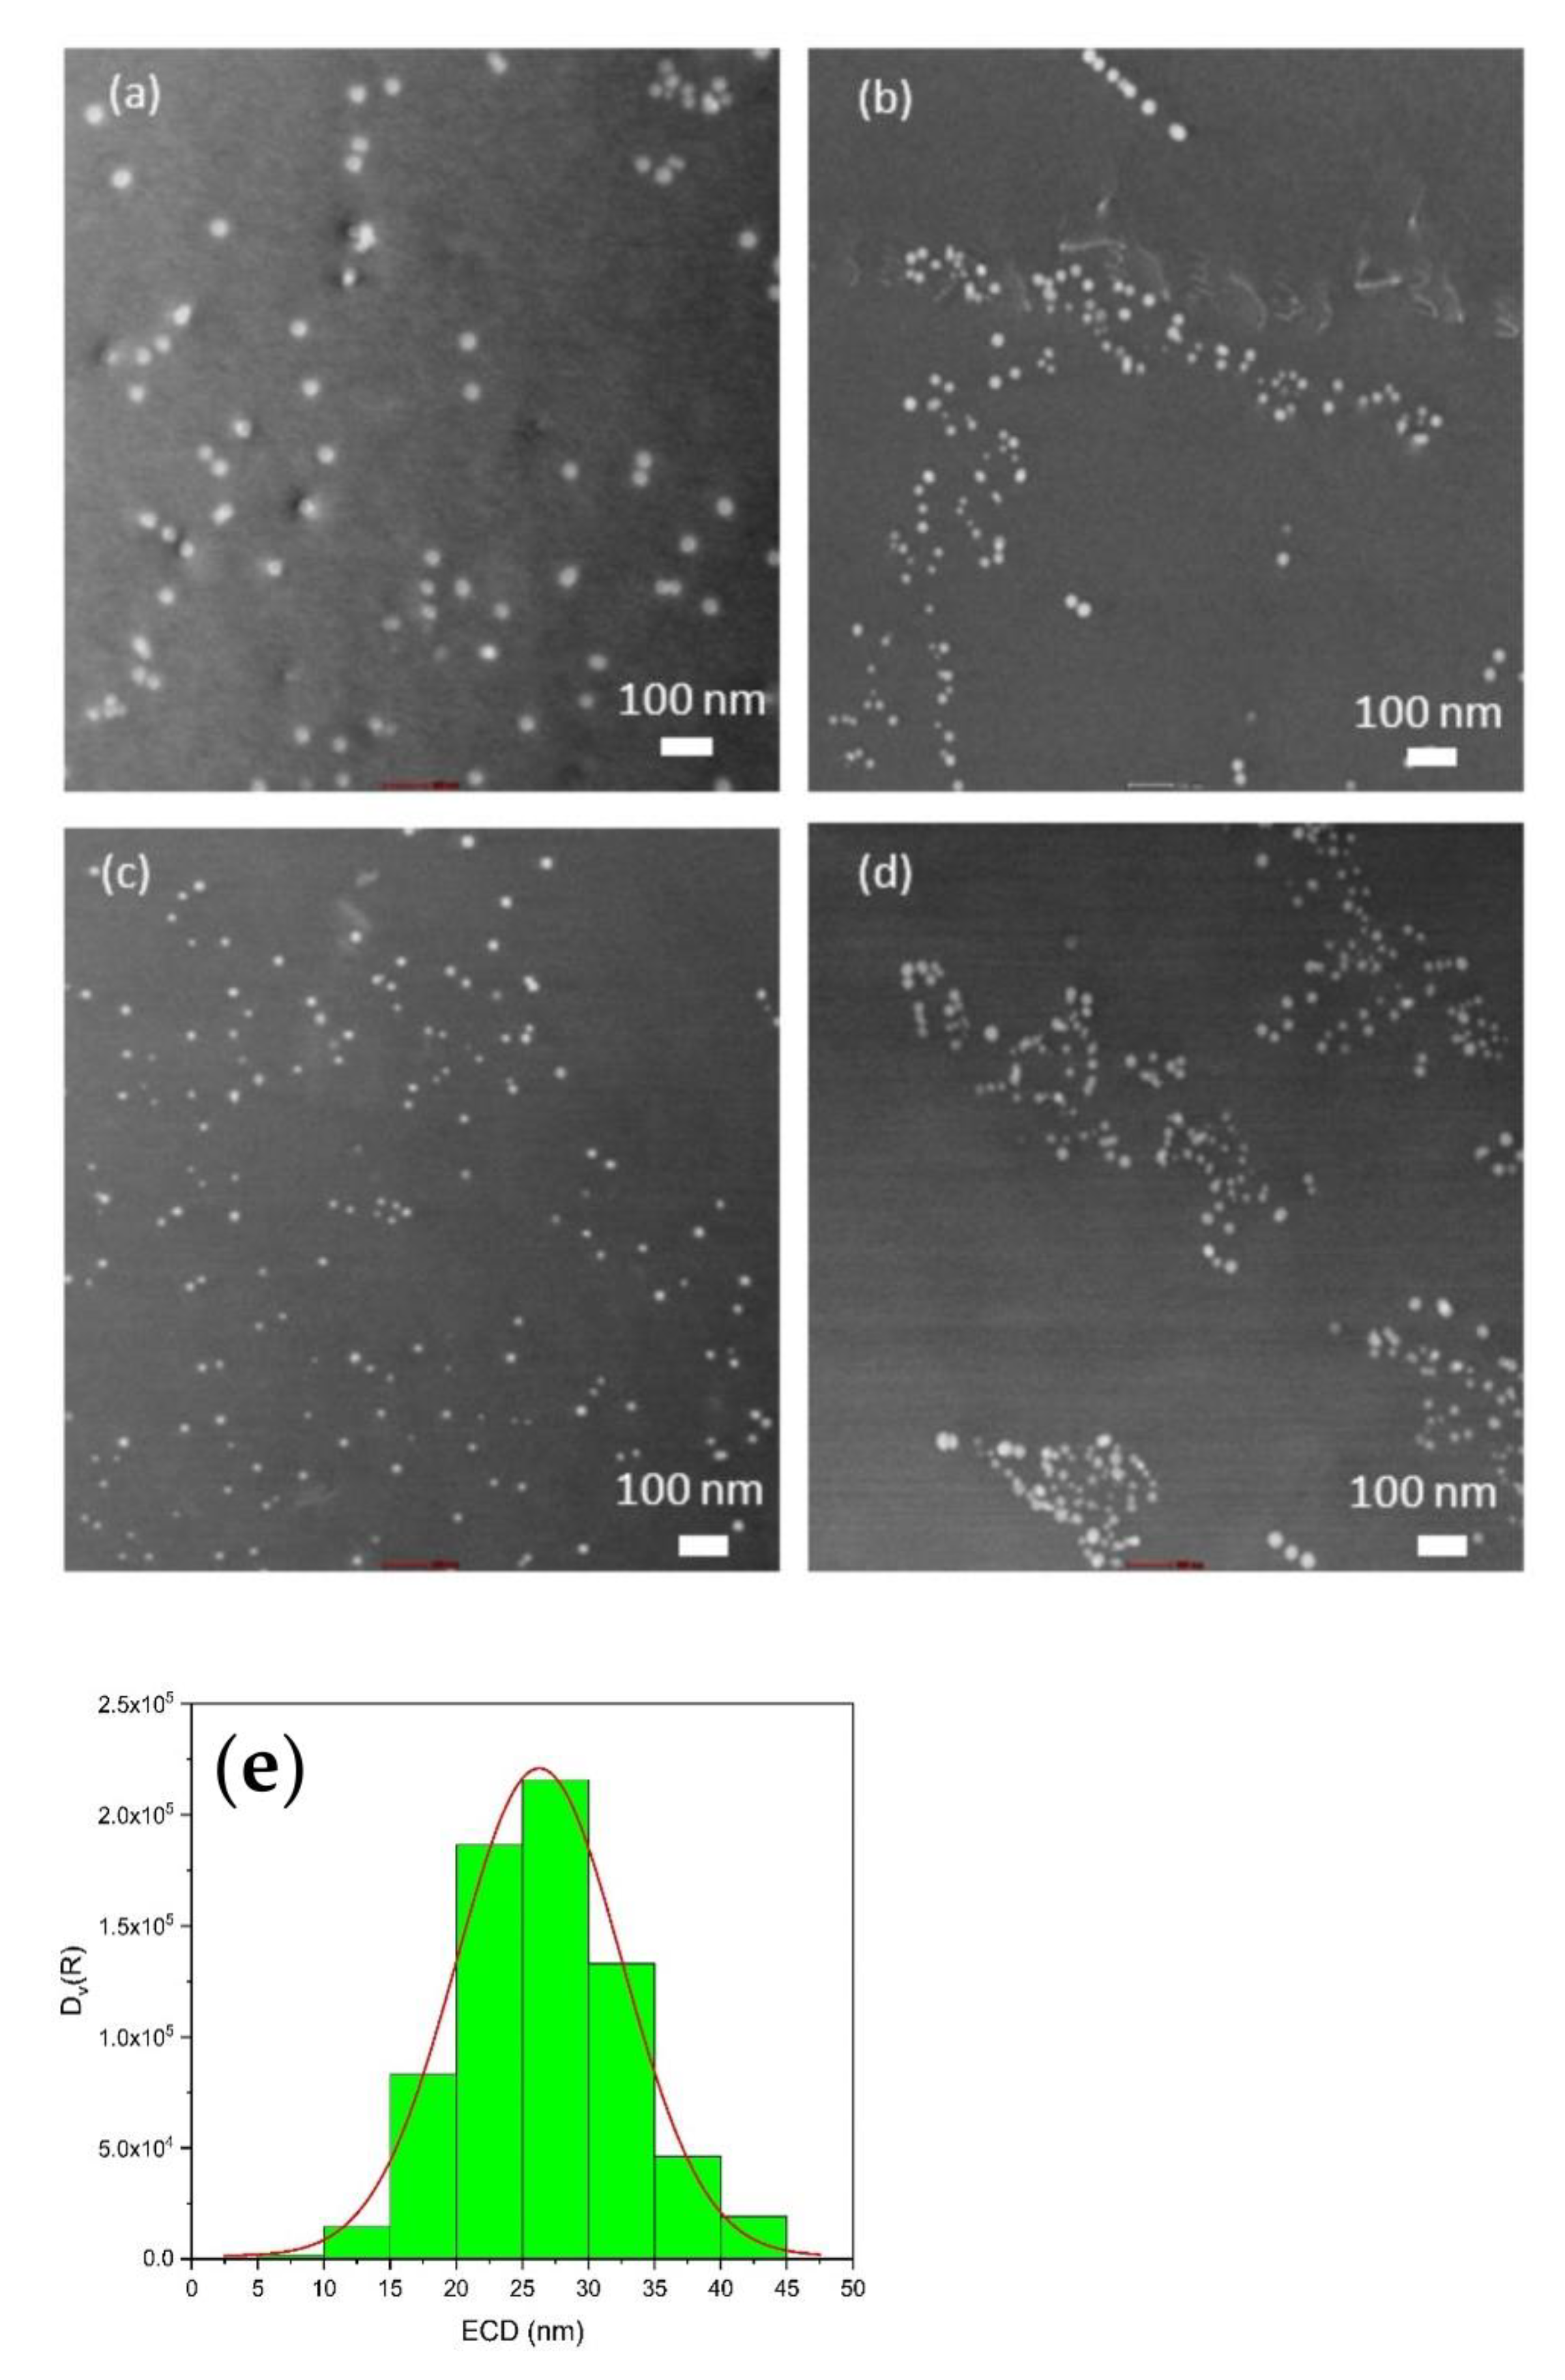
3.3. Transmission Electron Microscopy (TEM)
4. Discussion
5. Conclusions
Supplementary Materials
Author Contributions
Funding
Data Availability Statement
Conflicts of Interest
References
- Polmear, I.; St. John, D.; Nie, J.F.; Qian, M. Light Alloys: Metallurgy of the Light Metals, 5th ed.; Butterworth-Heinemann: Oxford, UK, 2017; ISBN 9780080994307. [Google Scholar]
- Zhang, Y.; Bettles, C.; Rometsch, P.A. Effect of Recrystallisation on Al3Zr Dispersoid Behaviour in Thick Plates of Aluminium Alloy AA7150. J. Mater. Sci. 2014, 49, 1709–1715. [Google Scholar] [CrossRef]
- Totten, G.E.; Tiryakioglu, M.; Kessler, O. Encyclopedia of Aluminum and Its Alloys, Two-Volume Set; CRC Press: Boca Raton, FL, USA, 2018; pp. 770–777. [Google Scholar]
- McQueen, H.J.; Spigarelli, S.; Kassner, M.E.; Evangelista, E. Hot Deformation and Processing of Aluminum Alloys; CRC Press: Boca Raton, FL, USA, 2016; ISBN 9781420017687. [Google Scholar]
- Pan, T.A.; Tzeng, Y.C.; Bor, H.Y.; Liu, K.H.; Lee, S.L. Effects of the Coherency of Al3Zr on the Microstructures and Quench Sensitivity of Al–Zn–Mg–Cu Alloys. Mater. Today Commun. 2021, 28, 102611. [Google Scholar] [CrossRef]
- Starke, E.A.; Staley, J.T. Application of Modern Aluminum Alloys to Aircraft. Prog. Aerosp. Sci. 1996, 32, 131–172. [Google Scholar] [CrossRef]
- Wang, Z.; Xiao, H.; Chen, W.; Li, Y.; Geng, J.; Li, X.; Xia, P.; Wang, M.; Chen, D.; Wang, H. Materials Characterization New Insight into Precipitation of Al 3 Zr and Correlative Effect on Recrystallization Behavior in a Rapidly-Solidified Al-Zn-Mg-Cu-Zr Alloy. Mater. Charact. 2022, 191, 112142. [Google Scholar] [CrossRef]
- Knipling, K.E.; Dunand, D.C.; Seidman, D.N. Nucleation and Precipitation Strengthening in Dilute Al-Ti and Al-Zr Alloys. Metall. Mater. Trans. A 2007, 38, 2552–2563. [Google Scholar] [CrossRef]
- Knipling, K.E.; Dunand, D.C.; Seidman, D.N. Precipitation Evolution in Al-Zr and Al-Zr-Ti Alloys during Isothermal Aging at 375–425 °C. Acta Mater. 2008, 56, 114–127. [Google Scholar] [CrossRef]
- Robson, J.D. Optimizing the Homogenization of Zirconium Containing Commercial Aluminium Alloys Using a Novel Process Model. Mater. Sci. Eng. A 2002, 338, 219–229. [Google Scholar] [CrossRef]
- Robson, J.D.; Prangnell, P.B. Modelling Al3Zr Dispersoid Precipitation in Multicomponent Aluminium Alloys. Mater. Sci. Eng. A 2003, 352, 240–250. [Google Scholar] [CrossRef]
- Robson, J.D.; Prangnell, P.B. Predicting Recrystallised Volume Fraction in Aluminium Alloy 7050 Hot Rolled Plate. Mater. Sci. Technol. 2002, 18, 607–614. [Google Scholar] [CrossRef]
- Knipling, K.E.; Dunand, D.C.; Seidman, D.N. Precipitation Evolution in Al-Zr and Al-Zr-Ti Alloys during Aging at 450–600 °C. Acta Mater. 2008, 56, 1182–1195. [Google Scholar] [CrossRef]
- Mochugovskiy, A.G.; Mikhaylovskaya, A.V.; Zadorognyy, M.Y.; Golovin, I.S. Effect of Heat Treatment on the Grain Size Control, Superplasticity, Internal Friction, and Mechanical Properties of Zirconium-Bearing Aluminum-Based Alloy. J. Alloys Compd. 2021, 856, 157455. [Google Scholar] [CrossRef]
- Knipling, K.E.; Karnesky, R.A.; Lee, C.P.; Dunand, D.C.; Seidman, D.N. Precipitation Evolution in Al-0.1Sc, Al-0.1Zr and Al-0.1Sc-0.1Zr (at.%) Alloys during Isochronal Aging. Acta Mater. 2010, 58, 5184–5195. [Google Scholar] [CrossRef]
- Forbord, B.; Hallem, H.; Ryum, N.; Marthinsen, K. Precipitation and Recrystallisation in Al-Mn-Zr with and without Sc. Mater. Sci. Eng. A 2004, 387, 936–939. [Google Scholar] [CrossRef]
- Rouxel, B.; Ramajayam, M.; Langan, T.J.; Lamb, J.; Sanders, P.G.; Dorin, T. Effect of Dislocations, Al3 (Sc,Zr) Distribution and Ageing Temperature on θ’ Precipitation in Al-Cu-(Sc)-(Zr) Alloys. Materialia 2020, 9, 100610. [Google Scholar] [CrossRef]
- De Geuser, F.; Deschamps, A. Precipitate Characterisation in Metallic Systems by Small-Angle X-ray or Neutron Scattering. C. R. Phys. 2012, 13, 246–256. [Google Scholar] [CrossRef]
- Robson, J.D.; Engler, O.; Sigli, C.; Deschamps, A.; Poole, W.J. Advances in Microstructural Understanding of Wrought Aluminum Alloys. Metall. Mater. Trans. A 2020, 51, 4377–4389. [Google Scholar] [CrossRef]
- Fratzl, P. Small-Angle Scattering in Materials Science—A Short Review of Applications in Alloys, Ceramics and Composite Materials. J. Appl. Crystallogr. 2003, 36, 397–404. [Google Scholar] [CrossRef]
- Zhang, Y.; Pelliccia, D.; Milkereit, B.; Kirby, N.; Starink, M.J.; Rometsch, P.A. Analysis of Age Hardening Precipitates of Al-Zn-Mg-Cu Alloys in a Wide Range of Quenching Rates Using Small Angle X-ray Scattering. Mater. Des. 2018, 142, 259–267. [Google Scholar] [CrossRef]
- Schloth, P.; Menzel, A.; Fife, J.L.; Wagner, J.N.; Van Swygenhoven, H.; Drezet, J.M. Early Cluster Formation during Rapid Cooling of an Al-Cu-Mg Alloy: In situ Small-Angle X-ray Scattering. Scr. Mater. 2015, 108, 56–59. [Google Scholar] [CrossRef]
- Wan, L.; Deng, Y.L.; Ye, L.Y.; Zhang, Y. The Natural Ageing Effect on Pre-Ageing Kinetics of Al-Zn-Mg Alloy. J. Alloys Compd. 2019, 776, 469–474. [Google Scholar] [CrossRef]
- Ivanov, R.; Deschamps, A.; De Geuser, F. A Combined Characterization of Clusters in Naturally Aged Al–Cu–(Li, Mg) Alloys Using Small-Angle Neutron and X-ray Scattering and Atom Probe Tomography Research Papers. J. Appl. Crystallogr. 2017, 5, 1725–1734. [Google Scholar] [CrossRef]
- Ivanov, R.; Deschamps, A.; De Geuser, F. Clustering Kinetics during Natural Ageing of Al-Cu Based Alloys with (Mg, Li) Additions. Acta Mater. 2018, 157, 186–195. [Google Scholar] [CrossRef]
- Deschamps, A.; Lae, L.; Guyot, P. In situ Small-Angle Scattering Study of the Precipitation Kinetics in an Al-Zr-Sc Alloy. Acta Mater. 2007, 55, 2775–2783. [Google Scholar] [CrossRef]
- Panagos, P.; Wang, Y.; McCartney, D.G.; Li, M.; Ghaffari, B.; Zindel, J.W.; Miao, J.; Makineni, S.; Allison, J.E.; Shebanova, O.; et al. Characterising Precipitate Evolution in Multi-Component Cast Aluminium Alloys Using Small-Angle X-ray Scattering. J. Alloys Compd. 2017, 703, 344–353. [Google Scholar] [CrossRef]
- Available online: https://imagej.nih.gov/ij/docs/menus/analyze.html (accessed on 11 December 2022).
- Li, M.; Wilkinson, D.; Patchigolla, K. Comparison of Particle Size Distributions Measured Using Different Techniques. Part. Sci. Technol. 2005, 23, 265–284. [Google Scholar] [CrossRef]
- Glatter, V.O.; Kratky, O. Small Angle X-ray Scattering; Academic Press Inc. Ltd.: London, UK, 1982; ISBN 0-12-286280-5. [Google Scholar]
- De Geuser, F.; Bley, F.; Deschamps, A. A New Method for Evaluating the Size of Plate-Like Precipitates by Small-Angle Scattering. J. Appl. Crystallogr. 2012, 45, 1208–1218. [Google Scholar] [CrossRef]
- Deschamps, A.; De Geuser, F. On the Validity of Simple Precipitate Size Measurements by Small-Angle Scattering in Metallic Systems. J. Appl. Crystallogr. 2011, 44, 343–352. [Google Scholar] [CrossRef]
- Ivanov, R.; Deschamps, A.; De Geuser, F. High Throughput Evaluation of the Effect of Mg Concentration on Natural Ageing of Al-Cu-Li-(Mg) Alloys. Scr. Mater. 2018, 150, 156–159. [Google Scholar] [CrossRef]
- Freiberg, D.; Zhu, W.; Park, J.-S.; Almer, J.D.; Sanders, P. Precipitate Characterization in Model Al-Zn-Mg-(Cu) Alloys Using Small-Angle X-ray Scattering. Metals 2020, 10, 959. [Google Scholar] [CrossRef]
- Luo, J.; Luo, H.; Liu, C.; Zhao, T.; Wang, R.; Ma, Y. Effect of Magnetic Field on Precipitation Kinetics of an Ultrafine Grained Al–Zn–Mg–Cu Alloy. Mater. Sci. Eng. A 2020, 798, 139990. [Google Scholar] [CrossRef]
- Priya, P.; Johnson, D.R.; Krane, M.J.M. Precipitation during Cooling of 7XXX Aluminum Alloys. Comput. Mater. Sci. 2017, 139, 273–284. [Google Scholar] [CrossRef]
- Robson, J.D. Microstructural Evolution in Aluminium Alloy 7050 during Processing. Mater. Sci. Eng. A 2004, 382, 112–121. [Google Scholar] [CrossRef]
- Fratzl, P. Volume-Fraction Dependence of the Scaling Function for Phase-Separating Systems. J. Appl. Crystallogr. 1991, 24, 593–597. [Google Scholar] [CrossRef]
- Fratzl, P.; Lebowitz, J.L.; Penrose, O.; Amar, J. Scaling Functions, Self-Similarity, and the Morphology of Phase-Separating Systems. Phys. Rev. B 1991, 44, 4794–4811. [Google Scholar] [CrossRef] [PubMed]
- Woźnicki, A.; Leszczyńska-Madej, B.; Włoch, G.; Grzyb, J.; Madura, J.; Leśniak, D. Homogenization of 7075 and 7049 Aluminium Alloys Intended for Extrusion Welding. Metals 2021, 11, 338. [Google Scholar] [CrossRef]
- Wu, H.; Wen, S.P.; Huang, H.; Li, B.L.; Wu, X.L.; Gao, K.Y.; Wang, W.; Nie, Z.R. Effects of Homogenization on Precipitation of Al3 (Er,Zr) Particles and Recrystallization Behavior in a New Type Al-Zn-Mg-Er-Zr Alloy. Mater. Sci. Eng. A 2017, 689, 313–322. [Google Scholar] [CrossRef]
- Guo, Z.; Zhao, G.; Chen, X.G. Effects of Two-Step Homogenization on Precipitation Behavior of Al3Zr Dispersoids and Recrystallization Resistance in 7150 Aluminum Alloy. Mater. Charact. 2015, 102, 122–130. [Google Scholar] [CrossRef]
- Forbord, B.; Auran, L.; Lefebvre, W.; Hallem, H.; Marthinsen, K. Rapid Precipitation of Dispersoids during Extrusion of an Al-0.91 Wt.% Mn-0.13 Wt.% Zr-0.17 Wt.% Sc-Alloy. Mater. Sci. Eng. A 2006, 424, 174–180. [Google Scholar] [CrossRef]
- Jia, Z.; Hu, G.; Forbord, B.; Solberg, J.K. Enhancement of Recrystallization Resistance of Al-Zr-Mn by Two-Step Precipitation Annealing. Mater. Sci. Eng. A 2008, 483, 195–198. [Google Scholar] [CrossRef]
- Zhang, Y.Z.; Gao, H.Y.; Wang, Y.F.; Wang, J.; Sun, B.D.; Gu, S.W.; You, W.R. Effects of Y Addition on Microstructure and Properties of Al-Zr Alloys. Trans. Nonferrous Met. Soc. China 2014, 24, 2239–2243. [Google Scholar] [CrossRef]
- Tsivoulas, D.; Robson, J.D. Heterogeneous Zr Solute Segregation and Al3Zr Dispersoid Distributions in Al-Cu-Li Alloys. Acta Mater. 2015, 93, 73–86. [Google Scholar] [CrossRef]


| Al | Zn | Mg | Cu | Zr | Ti | Fe | Si | |
|---|---|---|---|---|---|---|---|---|
| ICP OES | Balance | 6.35 ± 0.25 | 2.07 ± 0.1 | 2.09 ± 0.13 | 0.098 ± 0.005 | 0.037 ± 0.006 | 0.029 ± 0.001 | 0.025 ± 0.005 |
| XRF | Balance | 6.05 ± 0.19 | 2.50 ± 0.07 | 2.25 ± 0.14 | 0.096 ± 0.003 | 0.037 ± 0.006 | 0.038 ± 0.008 | 0.032 ± 0.010 |
Disclaimer/Publisher’s Note: The statements, opinions and data contained in all publications are solely those of the individual author(s) and contributor(s) and not of MDPI and/or the editor(s). MDPI and/or the editor(s) disclaim responsibility for any injury to people or property resulting from any ideas, methods, instructions or products referred to in the content. |
© 2023 by the authors. Licensee MDPI, Basel, Switzerland. This article is an open access article distributed under the terms and conditions of the Creative Commons Attribution (CC BY) license (https://creativecommons.org/licenses/by/4.0/).
Share and Cite
Honaramooz, M.T.; Morak, R.; Pogatscher, S.; Fritz-Popovski, G.; Kremmer, T.M.; Meisel, T.C.; Österreicher, J.A.; Arnoldt, A.; Paris, O. Characterization of Zr-Containing Dispersoids in Al–Zn–Mg–Cu Alloys by Small-Angle Scattering. Materials 2023, 16, 1213. https://doi.org/10.3390/ma16031213
Honaramooz MT, Morak R, Pogatscher S, Fritz-Popovski G, Kremmer TM, Meisel TC, Österreicher JA, Arnoldt A, Paris O. Characterization of Zr-Containing Dispersoids in Al–Zn–Mg–Cu Alloys by Small-Angle Scattering. Materials. 2023; 16(3):1213. https://doi.org/10.3390/ma16031213
Chicago/Turabian StyleHonaramooz, Mohammad Taha, Roland Morak, Stefan Pogatscher, Gerhard Fritz-Popovski, Thomas M. Kremmer, Thomas C. Meisel, Johannes A. Österreicher, Aurel Arnoldt, and Oskar Paris. 2023. "Characterization of Zr-Containing Dispersoids in Al–Zn–Mg–Cu Alloys by Small-Angle Scattering" Materials 16, no. 3: 1213. https://doi.org/10.3390/ma16031213
APA StyleHonaramooz, M. T., Morak, R., Pogatscher, S., Fritz-Popovski, G., Kremmer, T. M., Meisel, T. C., Österreicher, J. A., Arnoldt, A., & Paris, O. (2023). Characterization of Zr-Containing Dispersoids in Al–Zn–Mg–Cu Alloys by Small-Angle Scattering. Materials, 16(3), 1213. https://doi.org/10.3390/ma16031213