To ensure the accuracy of both the test and simulation results and to minimize the influence of other factors, a total of 16 specimens were designed using data from the FC45-2 and FC80-2 models. In consideration of practical engineering applications, the seismic performance of these specimens was analyzed in relation to the diameter-thickness ratio, circumferential elastic modulus of the confined tubes, and tensile strength of the concrete. Notably, the discussion on the circumferential elastic modulus of the confined tubes takes into account the commonly used types of FRP materials in structural applications. It is worth mentioning that the majority of circumferential elastic moduli of confined tubes, with various FRP materials and processing methods, fall within the range of 20 to 200 GPa [
26]. The design parameters of the specimens are presented in
Table 7.
4.1. Skeleton Curve Analysis
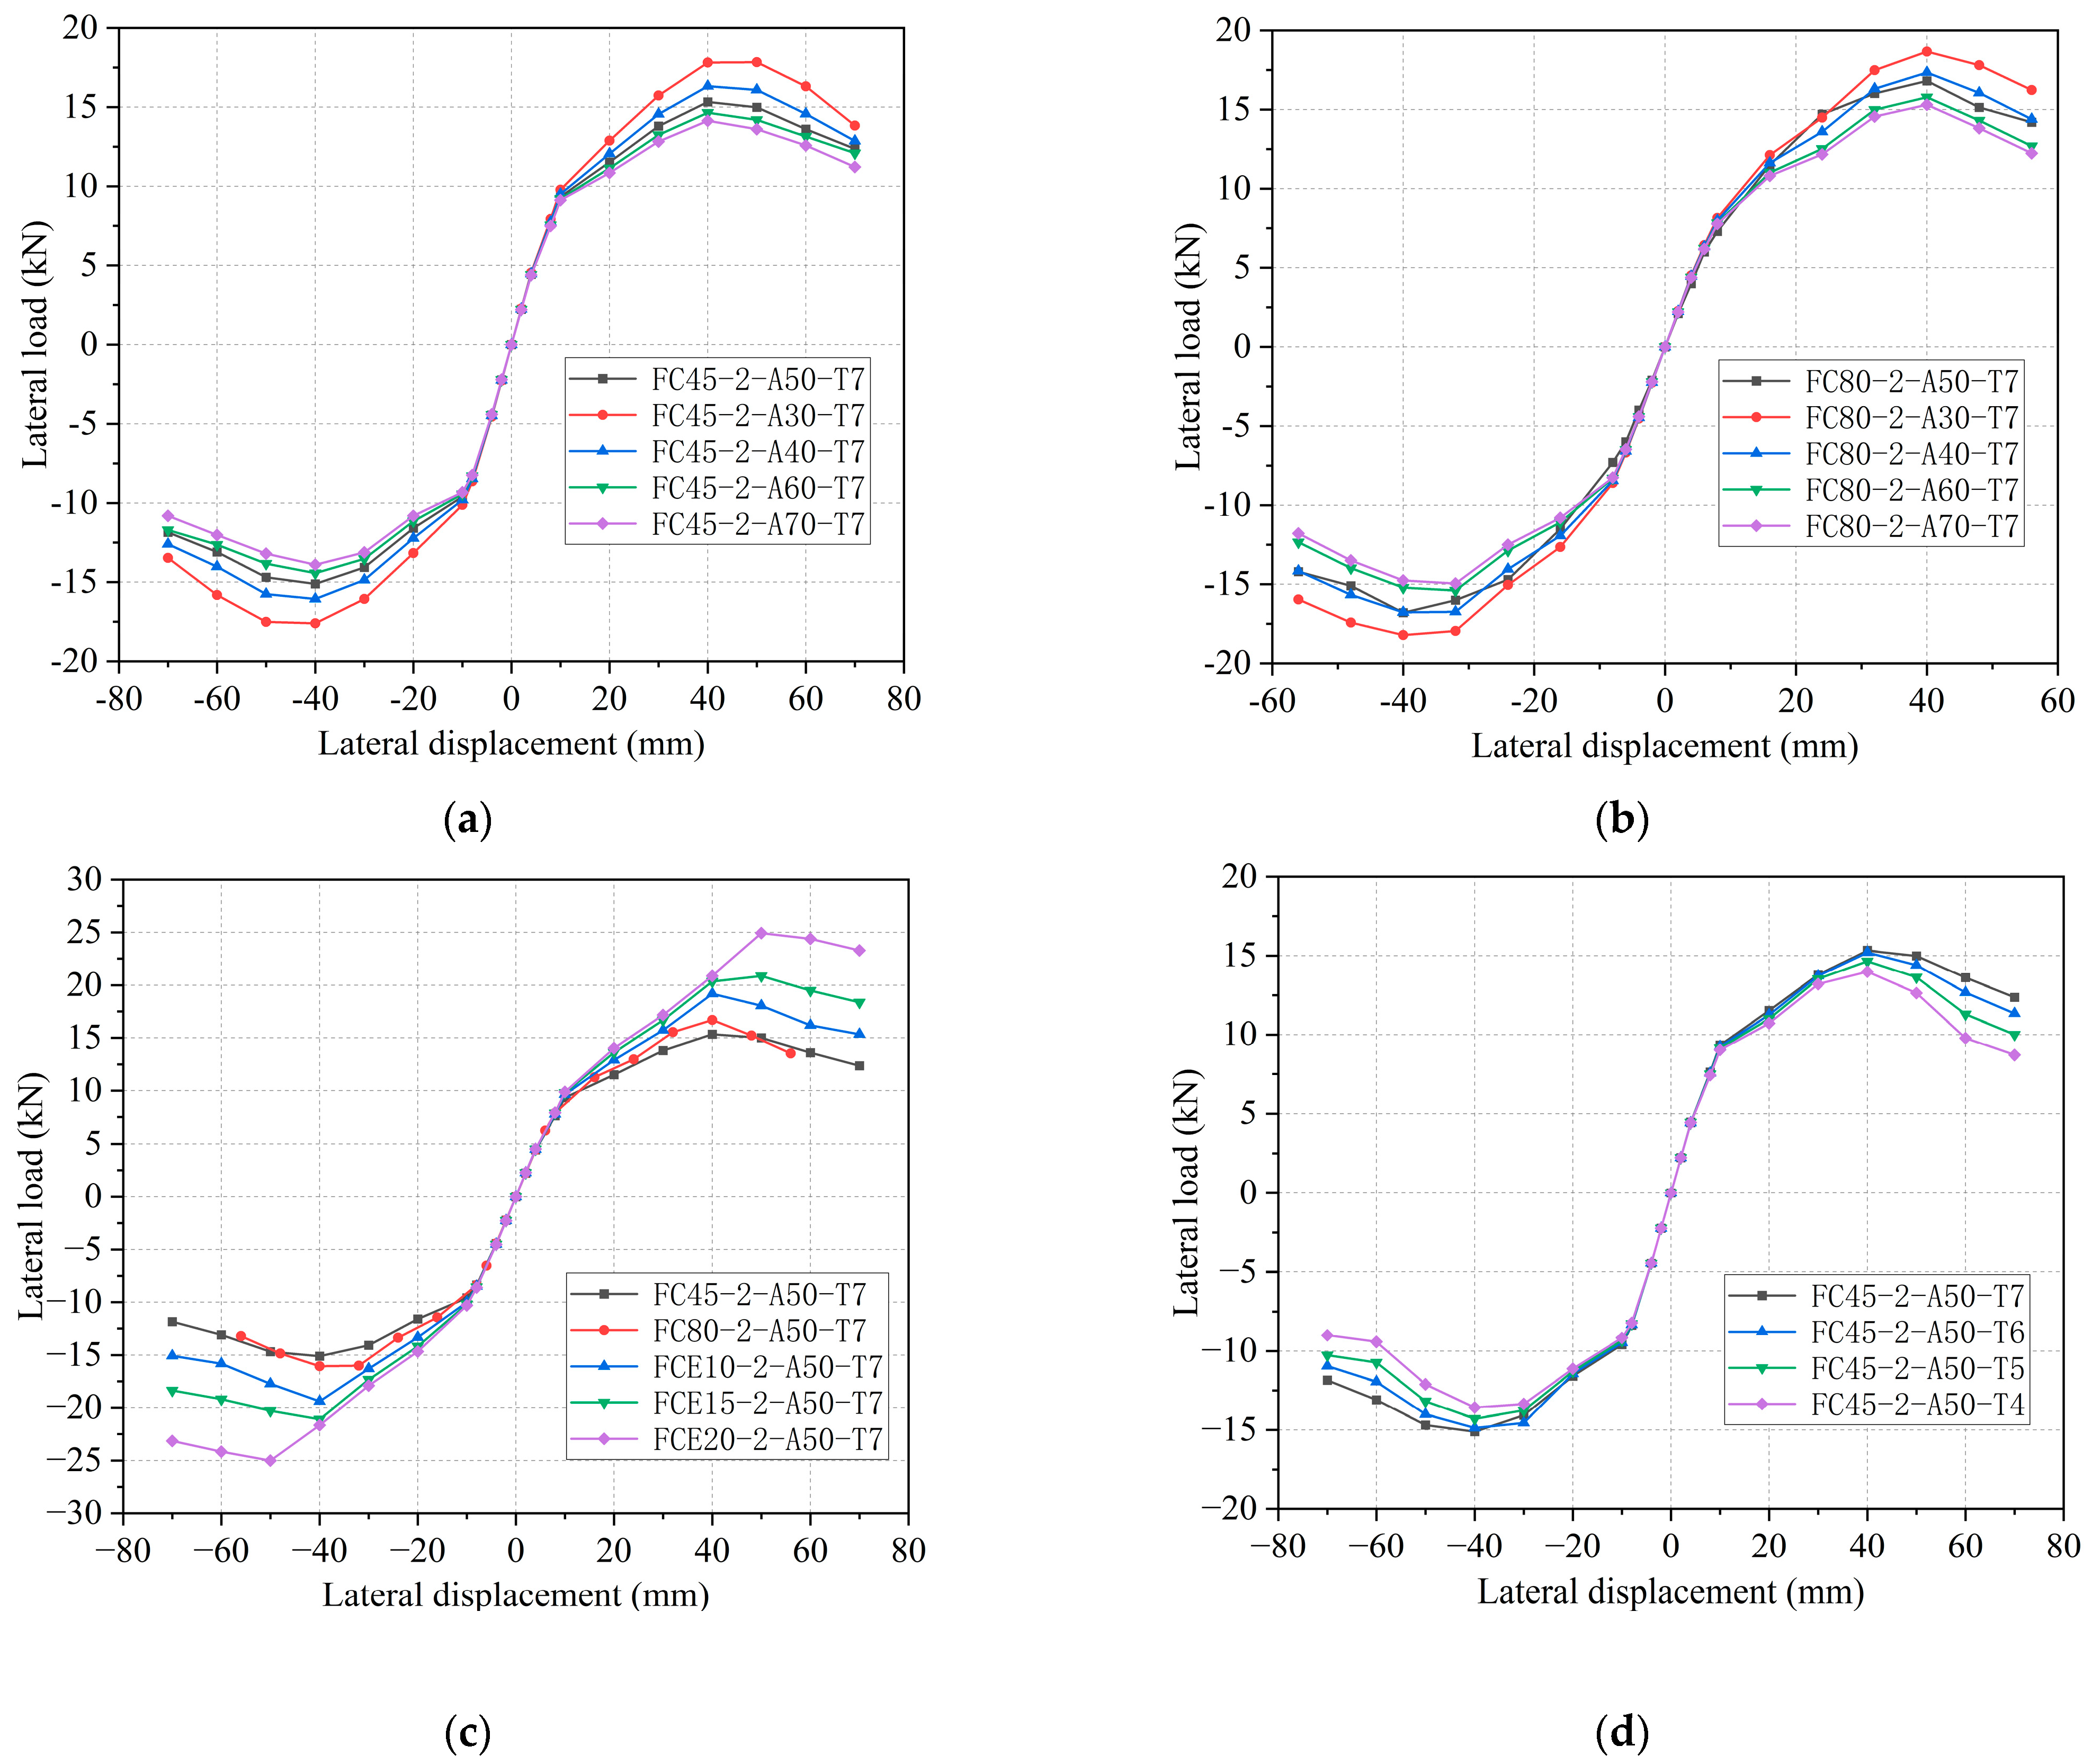
The skeleton curve provides a macroscopic representation of the seismic performance of each characteristic point (data acquisition points) of the specimen, including displacement, load, ductility, strength degradation, and stiffness degradation. By correlating the specimen data with parameters such as the diameter-thickness ratio, circumferential elastic modulus of the restrained tube, and concrete tensile strength, the skeleton curve depicted in
Figure 13 was generated. From
Figure 13, it can be observed that for specimens with a GFRP fiber 45° winding angle, when the diameter-thickness ratio is set at 30, 40, 60, and 70, the peak bearing capacity of the specimen is measured at 17.81 kN, 16.32 kN, 14.65 kN, and 14.14 kN, respectively. Compared to the FC45-2-A50-T7-S20 specimen with a diameter-thickness ratio of 50, the variation range of the diameter-thickness ratio is −40%, −20%, 20%, and 40%, resulting in changes of 16.2%, 6.5%, −4.4%, and −7.7%, respectively. Similarly, for specimens with a GFRP fiber 80° winding angle, when the diameter-thickness ratio is set at 30, 40, 60, and 70, the peak bearing capacity of the specimen is measured at 18.67 kN, 17.34 kN, 15.78 kN, and 15.31 kN, respectively. Compared to the FC80-2-A50-T7-S20 specimen with a diameter-thickness ratio of 50, the variation range of the diameter-thickness ratio is −40%, −20%, 20%, and 40%, resulting in changes of 11.9%, 3.9%, −5.4%, and −8.3%, respectively. When the diameter-thickness ratio decreases, the peak load of the specimen increases while the peak displacement remains unaffected.
When the circumferential elastic modulus of the constrained tube is set to 54 GPa, 100 GPa, 150 GPa, and 200 GPa, the corresponding peak bearing capacities of the specimen are measured at 16.73 kN, 19.18 kN, 20.88 kN, and 24.92 kN, respectively. In comparison to the FC45-2-A50-T7 specimen with a circumferential elastic modulus of 29 GPa, the peak bearing capacity exhibits a variation range of 9.4%, 25.1%, 36.2%, and 62.6%, respectively. It is evident that an increase in the circumferential elastic modulus of the restrained tube leads to an increase in the peak load displacement and peak load of the specimen.
The peak displacement of the specimen is primarily influenced by specimen damage. For specimens with different diameter-thickness ratios and varying concrete tensile strengths, the peak displacement consistently remains at 40 mm. This indicates that an increase in GFRP thickness has a minimal impact on delaying the damage to the core concrete. However, when the circumferential elastic modulus of the restrained tube reaches a certain level, the peak displacement of the FCE20-2-A50-T7-S20 specimen increases from 40 mm to 50 mm. A restrained tube with a higher elastic modulus can effectively restrain the crushed concrete under larger displacements, thereby delaying specimen damage. Additionally, a smaller diameter-thickness ratio results in a steeper decreasing trend after reaching the peak load, while an increase in the circumferential elastic modulus slows down the downward trend of the specimen after reaching the peak load. Therefore, it can be concluded that decreasing the diameter-thickness ratio and increasing the circumferential elastic modulus can delay the damage to the core concrete during the intermediate loading stage, thereby improving the seismic performance of the specimen. However, in the later loading stage, the restraining effect caused by increased thickness rapidly diminishes due to the damage to the GFRP tube, whereas the increase in circumferential elastic modulus continues to provide persistent benefits. In practical engineering applications, the method of increasing the circumferential elastic modulus of restrained tubes should be prioritized to enhance the seismic performance of composite columns.
When the concrete tensile strength of the 45° angle specimen is set at 6 MPa, 5 MPa, and 4 MPa, the corresponding peak bearing capacities of the specimen are measured at 15.2 kN, 14.65 kN, and 13.98 kN, respectively. Compared to the FC45-2-A50-T7-S20 specimen with a concrete tensile strength of 7 MPa, the peak bearing capacity exhibits a change range of −0.8%, −4.4%, and −8.8%, respectively. As the tensile strength of the concrete decreases, the peak bearing capacity of the specimen also decreases. Following the peak load, the decreasing trend becomes steeper, although it does not significantly affect the peak displacement of the specimen.
4.2. Degradation of Stiffness
In this paper, the equivalent stiffness [
27] is used to describe the stiffness change. The equivalent stiffness is calculated as shown in
Figure 14. The equivalent stiffness is that the positive and negative peak points of the hysteretic curve of the first cycle of each stage are connected by AB, and the slope of the AB connection line is the equivalent stiffness.
where
Ki1 is the equivalent stiffness of stage
i loading cycle;
Pi1A is the positive peak load of stage
i loading the first cycle;
Pi1B is the negative peak load of stage
i loading the first cycle; Δ
i1A is the positive peak displacement of stage
i loading the first cycle; Δ
i1B is the negative peak displacement of stage
i loading the first cycle;
i is the loading series.
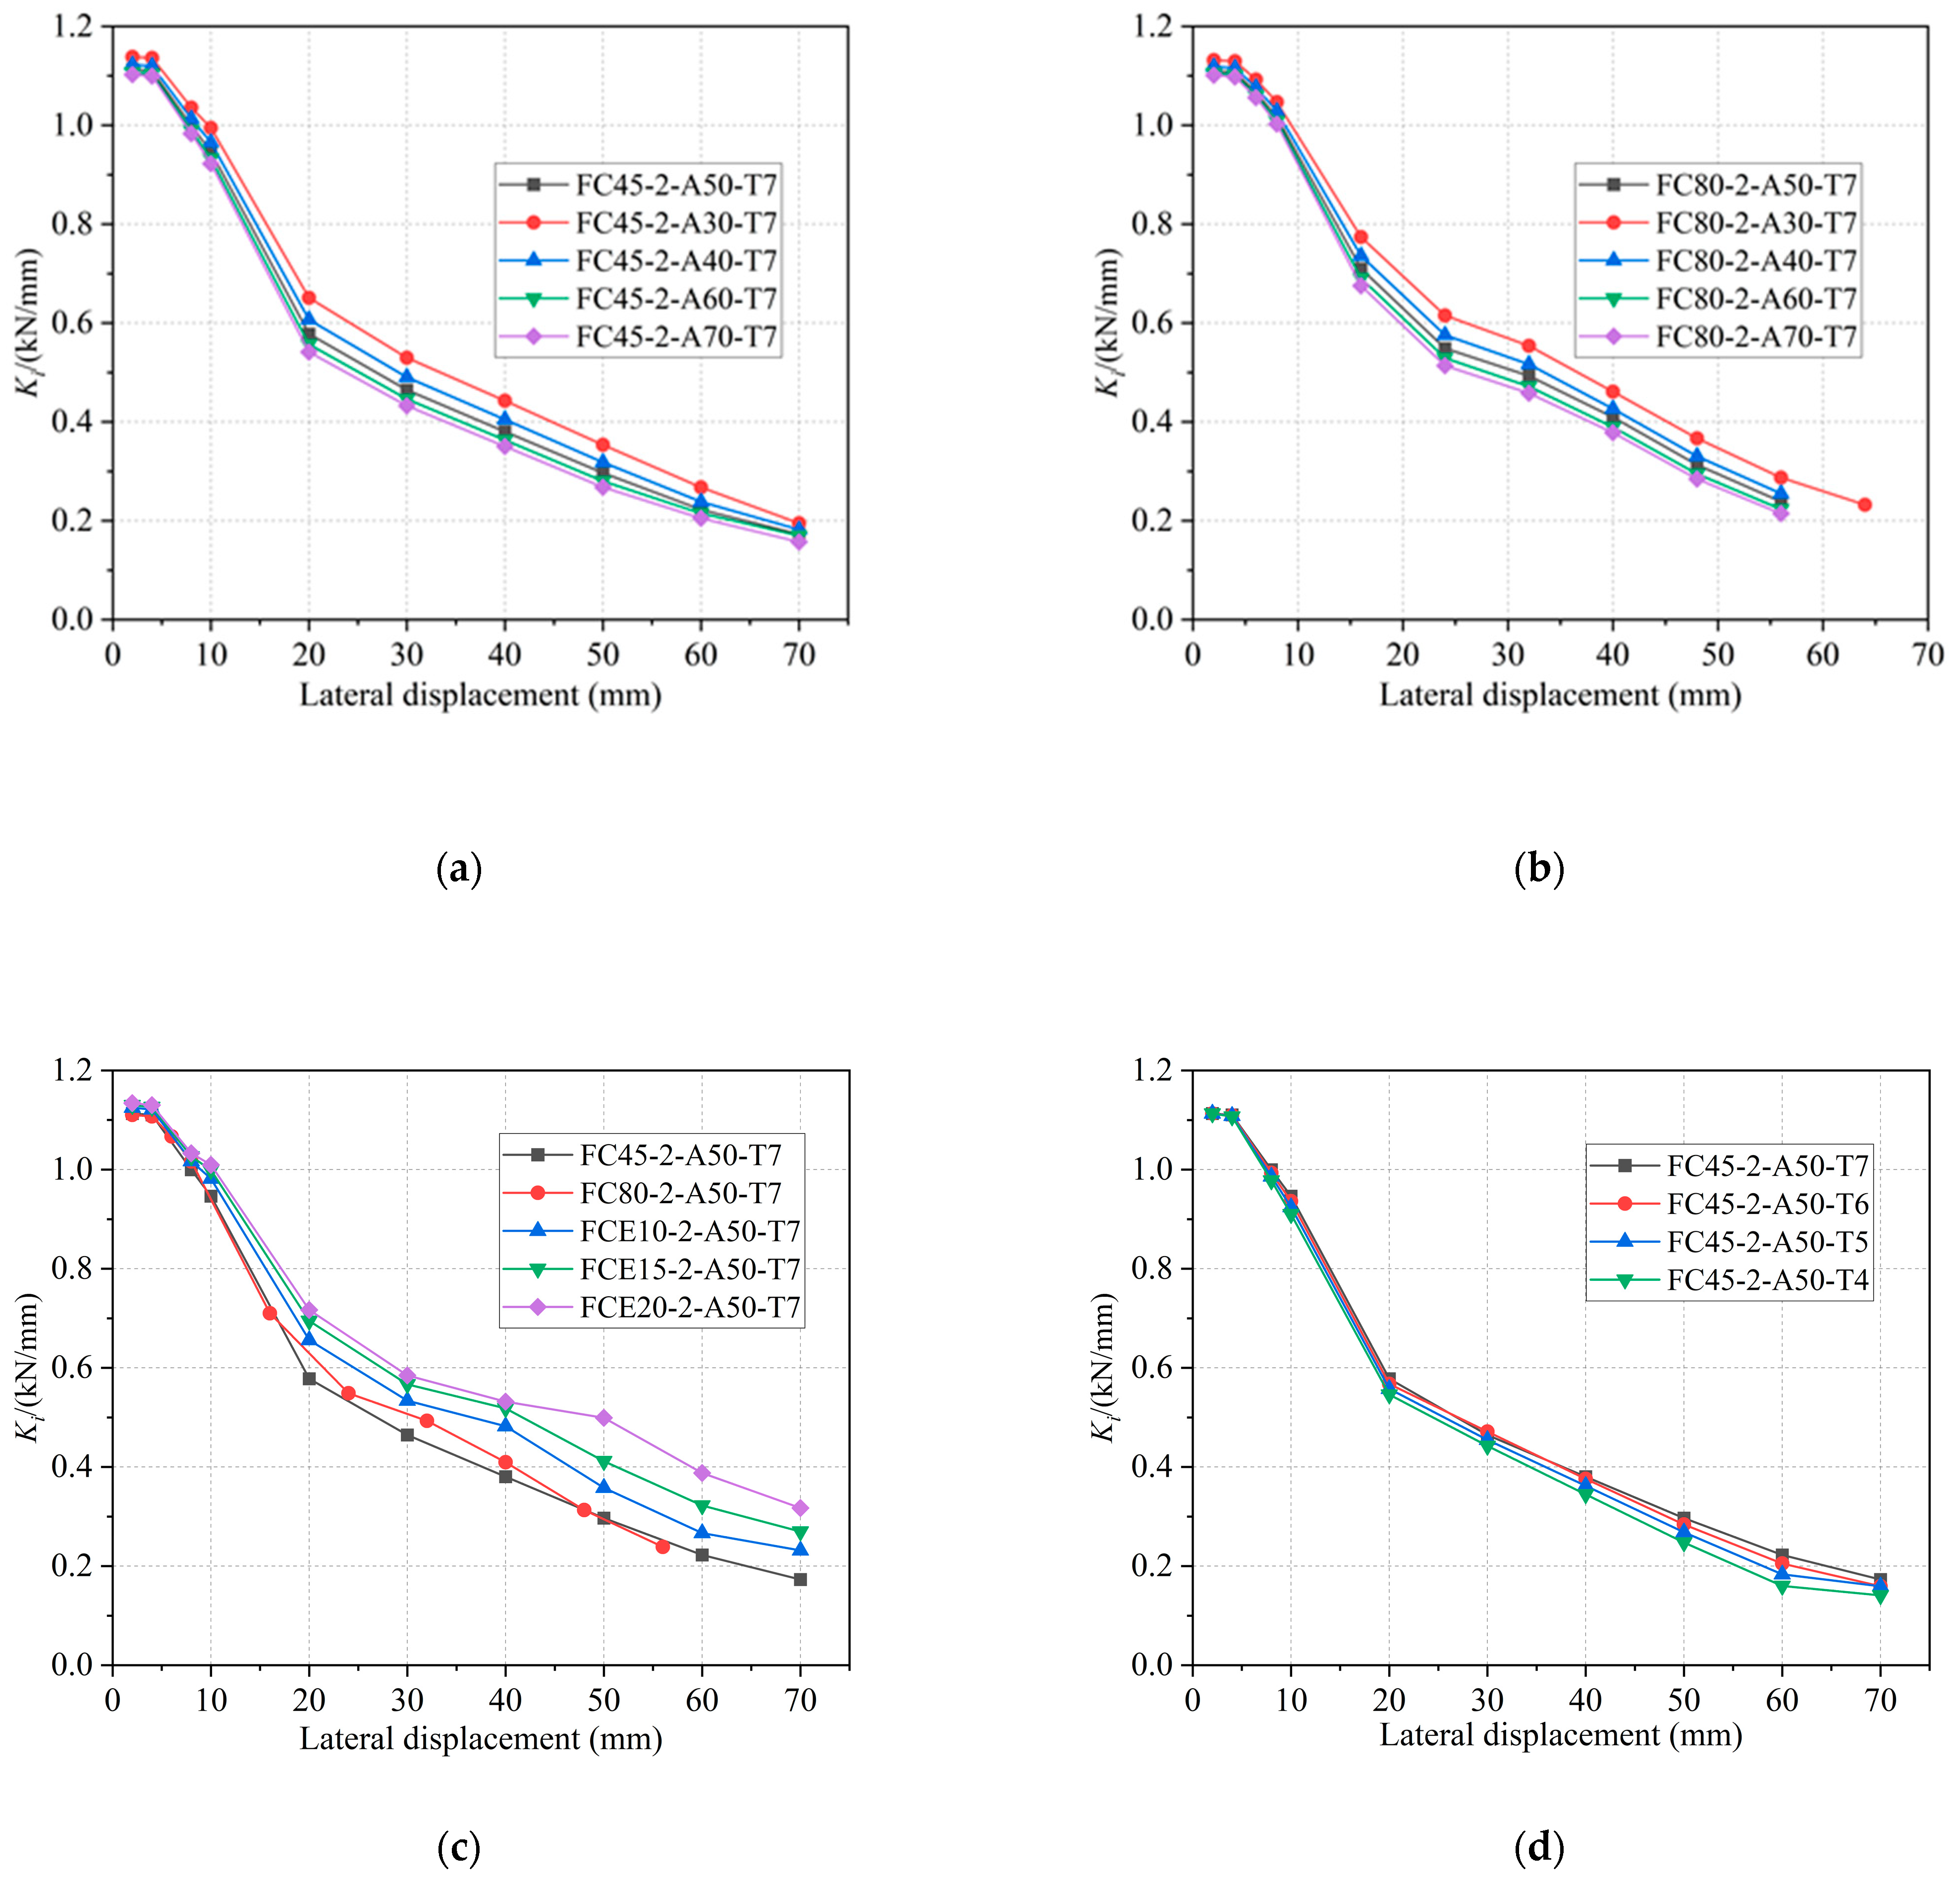
The above calculation results are shown in
Figure 15 to discuss the effects of the diameter-thickness ratio, the circumferential elastic modulus of the restrained tube, and the tensile strength of concrete on the stiffness degradation of the specimen.
Figure 15a,b demonstrates that the specimens with two different winding angles exhibit an increase in equivalent stiffness as the diameter-thickness ratio decreases. Initially, the difference in stiffness between the specimens increases, but it subsequently decreases with the progression of loading displacement. However, overall, when varying the diameter-thickness ratio, the Secant stiffness curve of the specimens does not exhibit significant differentiation. Referring to
Figure 15c,d, it is evident that a higher circumferential elastic modulus of the restrained tube results in greater specimen stiffness. Furthermore, the stiffness degradation curve becomes more pronounced in the later stages of loading. The irregular fluctuation of the stiffness of the specimens in the later stage may be due to the varying degrees of damage to the internal concrete, and the effect of stronger constraints on the stiffness is nonlinear, but the overall trend is not affected. Specimens with a larger circumferential elastic modulus of the restrained tube experience a slower attenuation of stiffness. Conversely, the tensile strength of concrete does not exert a noticeable effect on the stiffness of the specimens.
4.3. Energy Dissipation Capacity
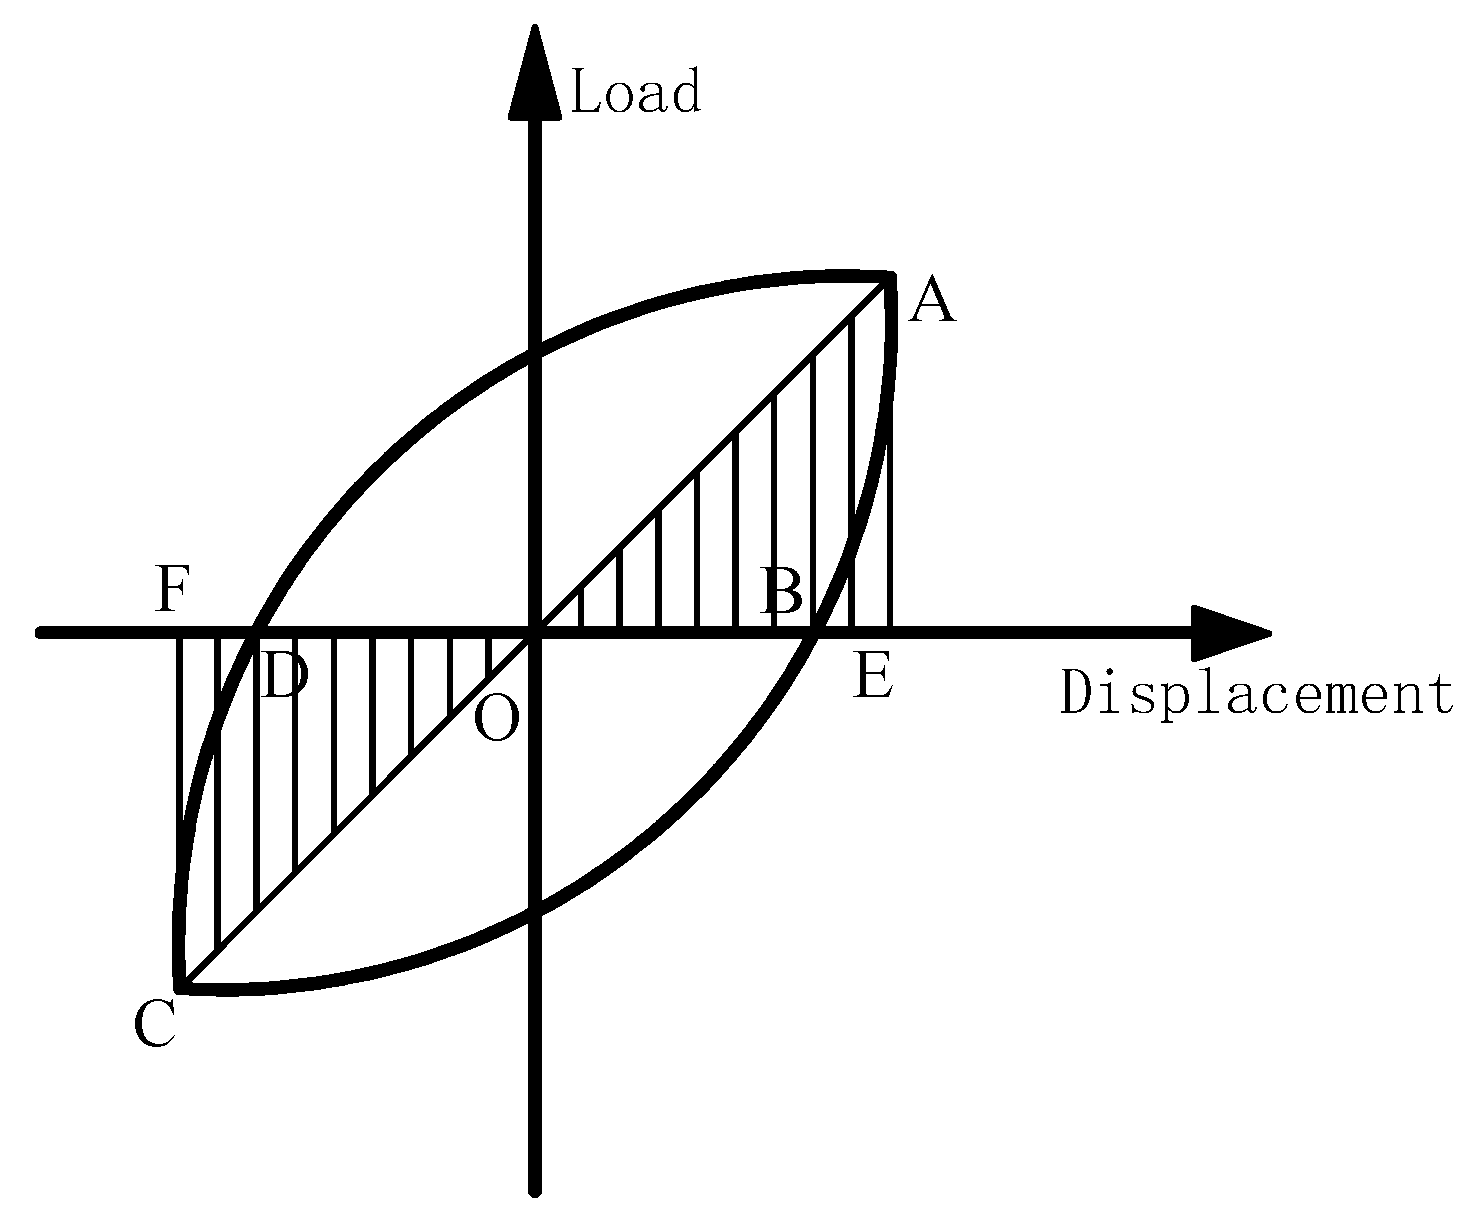
The energy dissipation capacity of the composite column specimens studied in this paper can be analyzed with reference to the wrapping area of the hysteretic curve. With reference to the building seismic test code [
28], the energy dissipation coefficient
E can be used to evaluate the energy dissipation capacity of the specimen. The calculation diagram is shown in
Figure 16, and the calculation method is as follows:
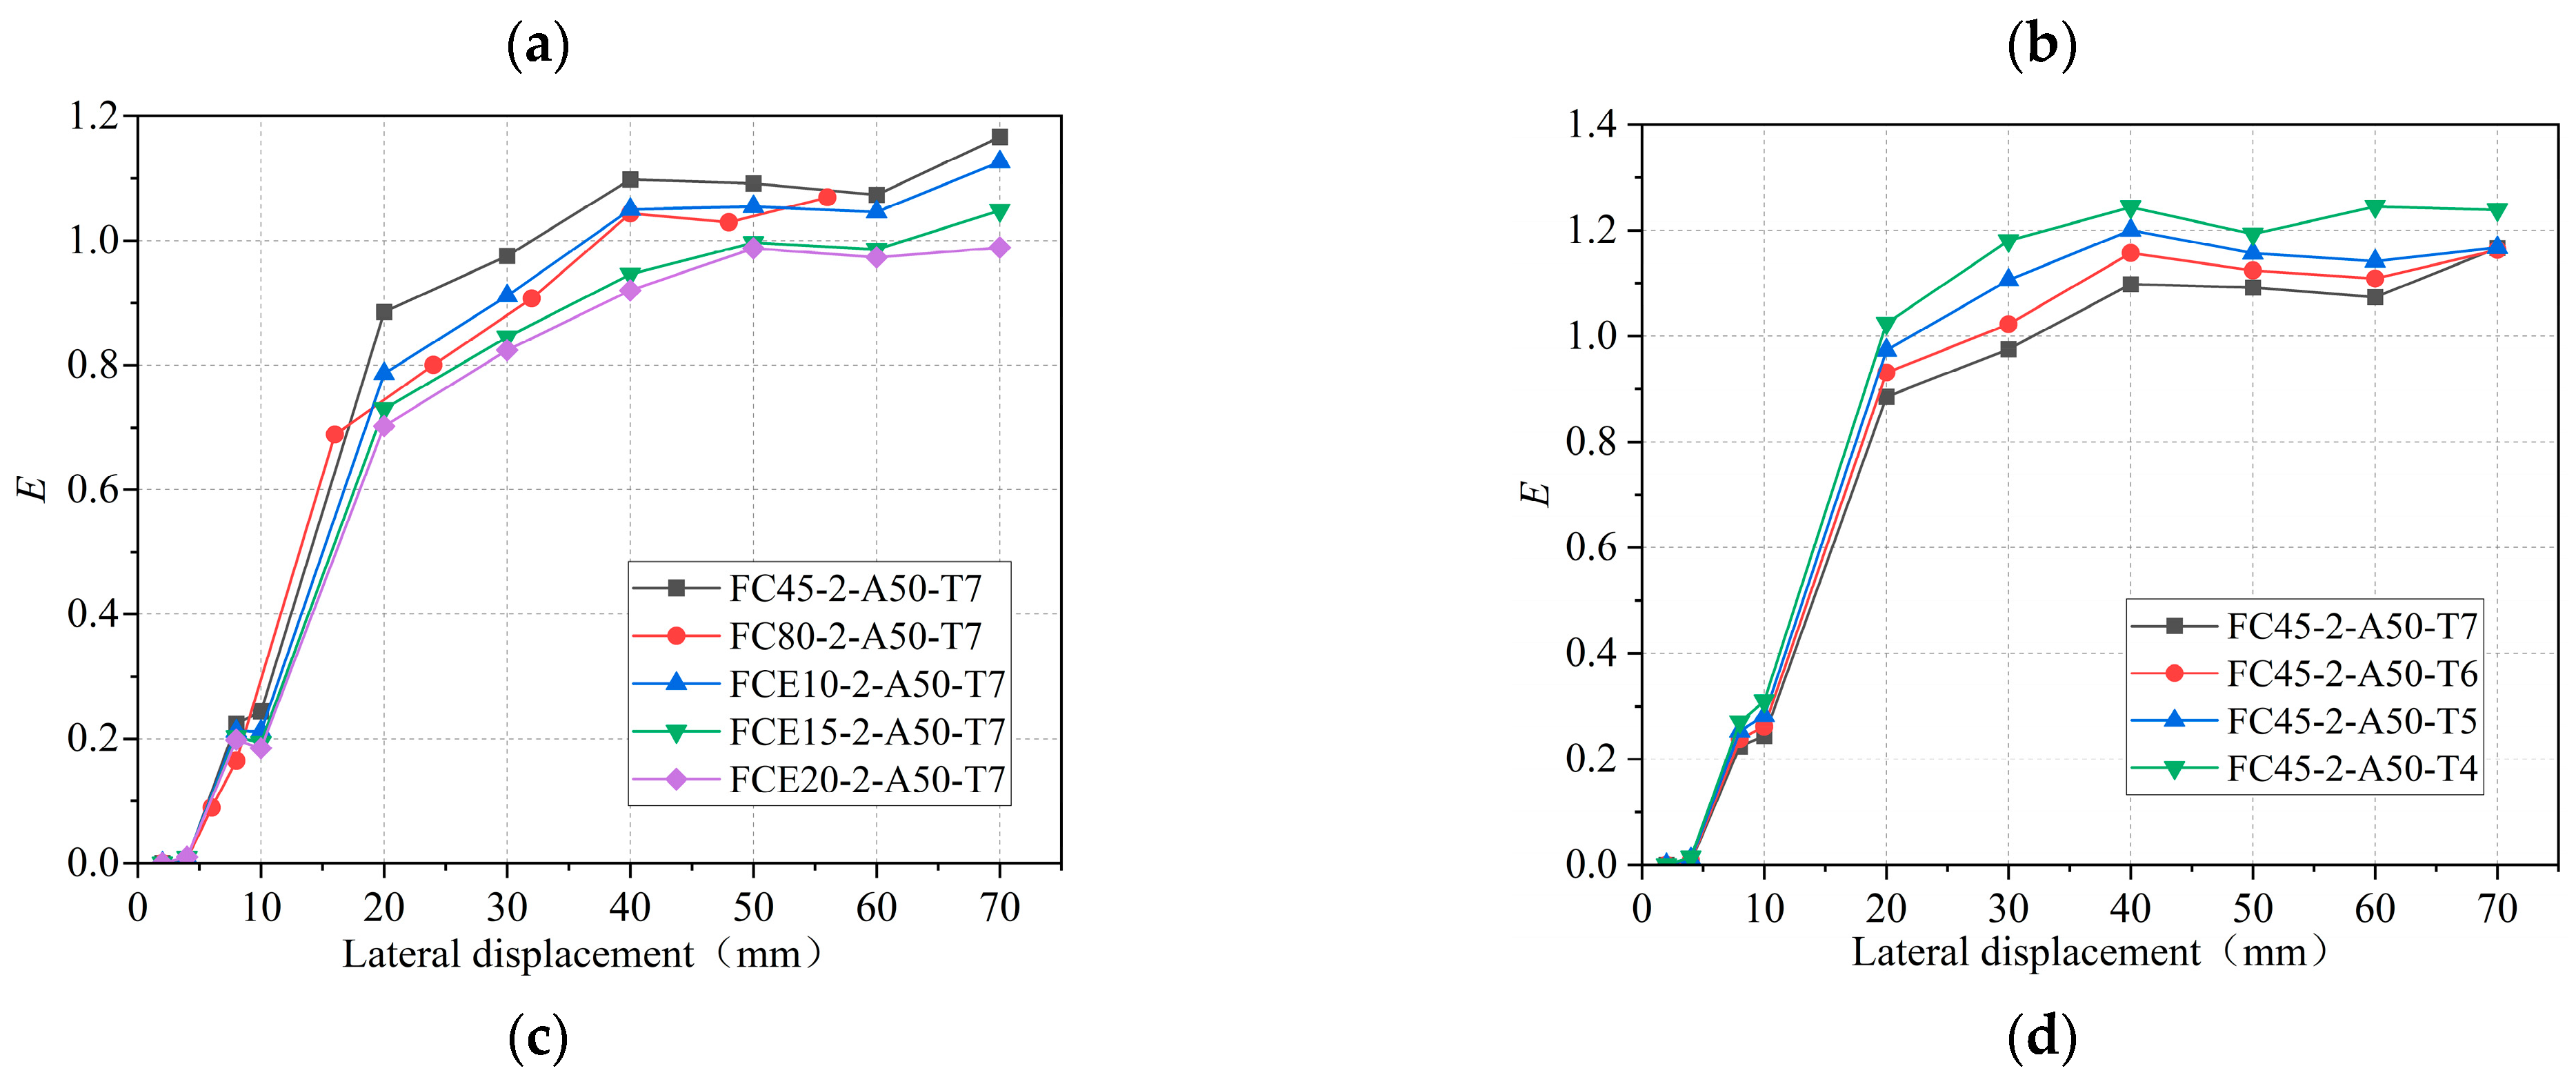
The energy consumption coefficient of each specimen is obtained, as shown in
Figure 17.
Figure 17 reveals several observations regarding the energy dissipation capacity of the specimen. Firstly, as the diameter-thickness ratio decreases, the energy dissipation capacity also decreases. Additionally, the energy dissipation capacity decreases with an increase in both the circumferential elastic modulus of the restrained tube and the tensile strength of the concrete. This phenomenon can be attributed to the increased constraint on the internal concrete when the thickness of the external GFRP tube and the circumferential elastic modulus of the restrained tube increase. Consequently, the damage to the concrete decreases proportionally. Similarly, when the tensile strength of the concrete increases, the extent of tensile damage to the internal concrete diminishes, leading to an increase in specimen strength and a decrease in energy dissipation capacity. Furthermore, the energy dissipation coefficient of the specimen increases with each loading cycle, indicating a gradual increase in energy dissipation capacity. However, as the loading displacement increases, the rate of increase in energy dissipation capacity initially decreases and then begins to rise again. During the initial stage of loading, the restraint effect of the GFRP tube on the micro-cracking and expansion of concrete gradually intensifies. As a result, the proportion of elastic deformation to total deformation increases, leading to a gradual decrease in the rate of increase in energy dissipation capacity. In the final loading stage, the external GFRP tube loses its restraint ability and undergoes destruction. This intensifies the damage to the core concrete, causing it to contribute the largest proportion to the total deformation and exhibit the least elastic deformation. Consequently, the increase in energy dissipation capacity becomes more significant during this stage.


