

Characterization of Filigree Additively Manufactured NiTi Structures Using Micro Tomography and Micromechanical Testing for Metamaterial Material Models

 , , ,
, , , 
Abstract
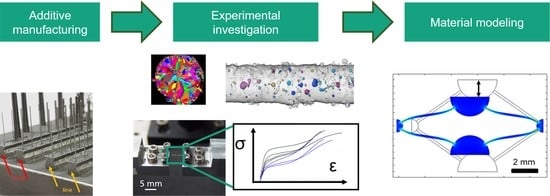
1. Introduction
2. Materials and Methods
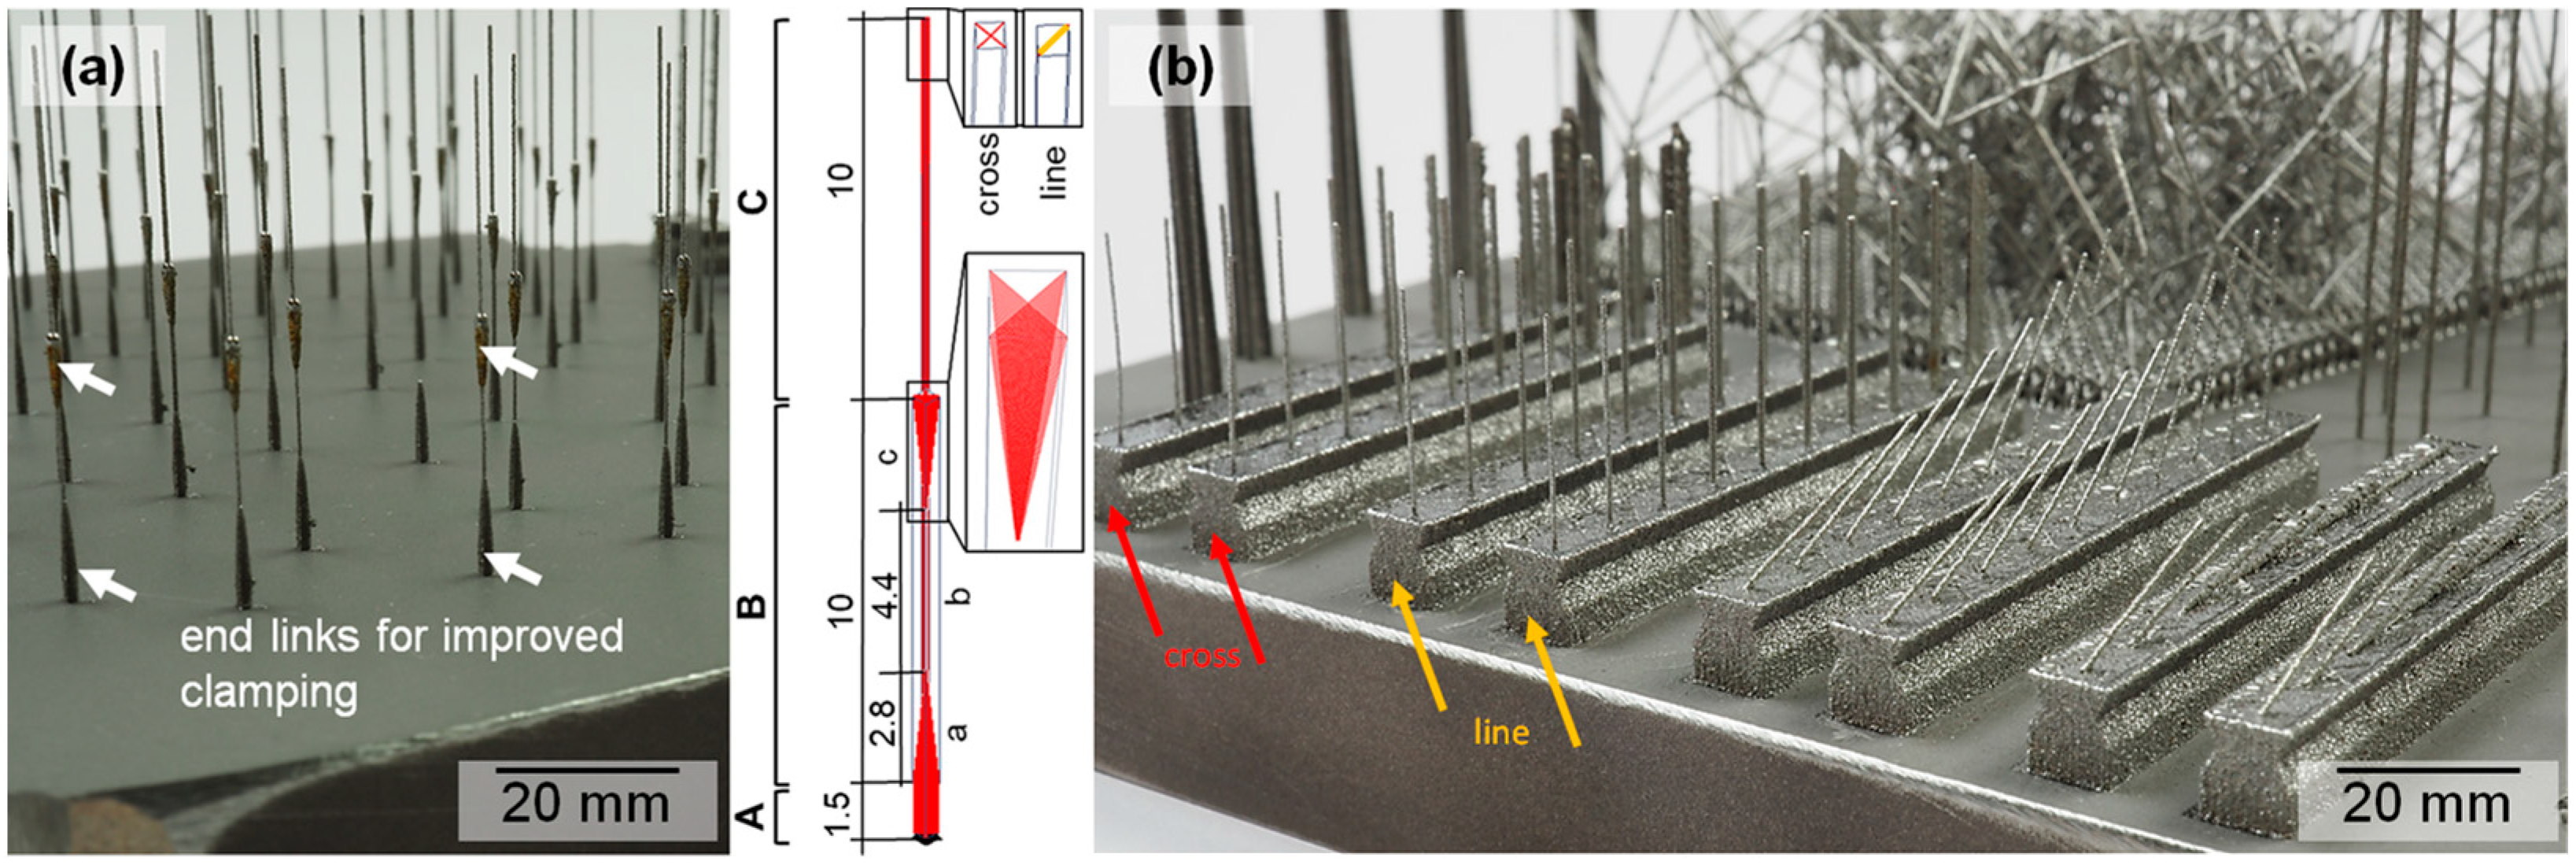
2.1. Additive Manufacturing of NiTi Specimens

2.2. Microscopical Analysis
2.3. X-ray Micro-Computed Tomography (µCT)
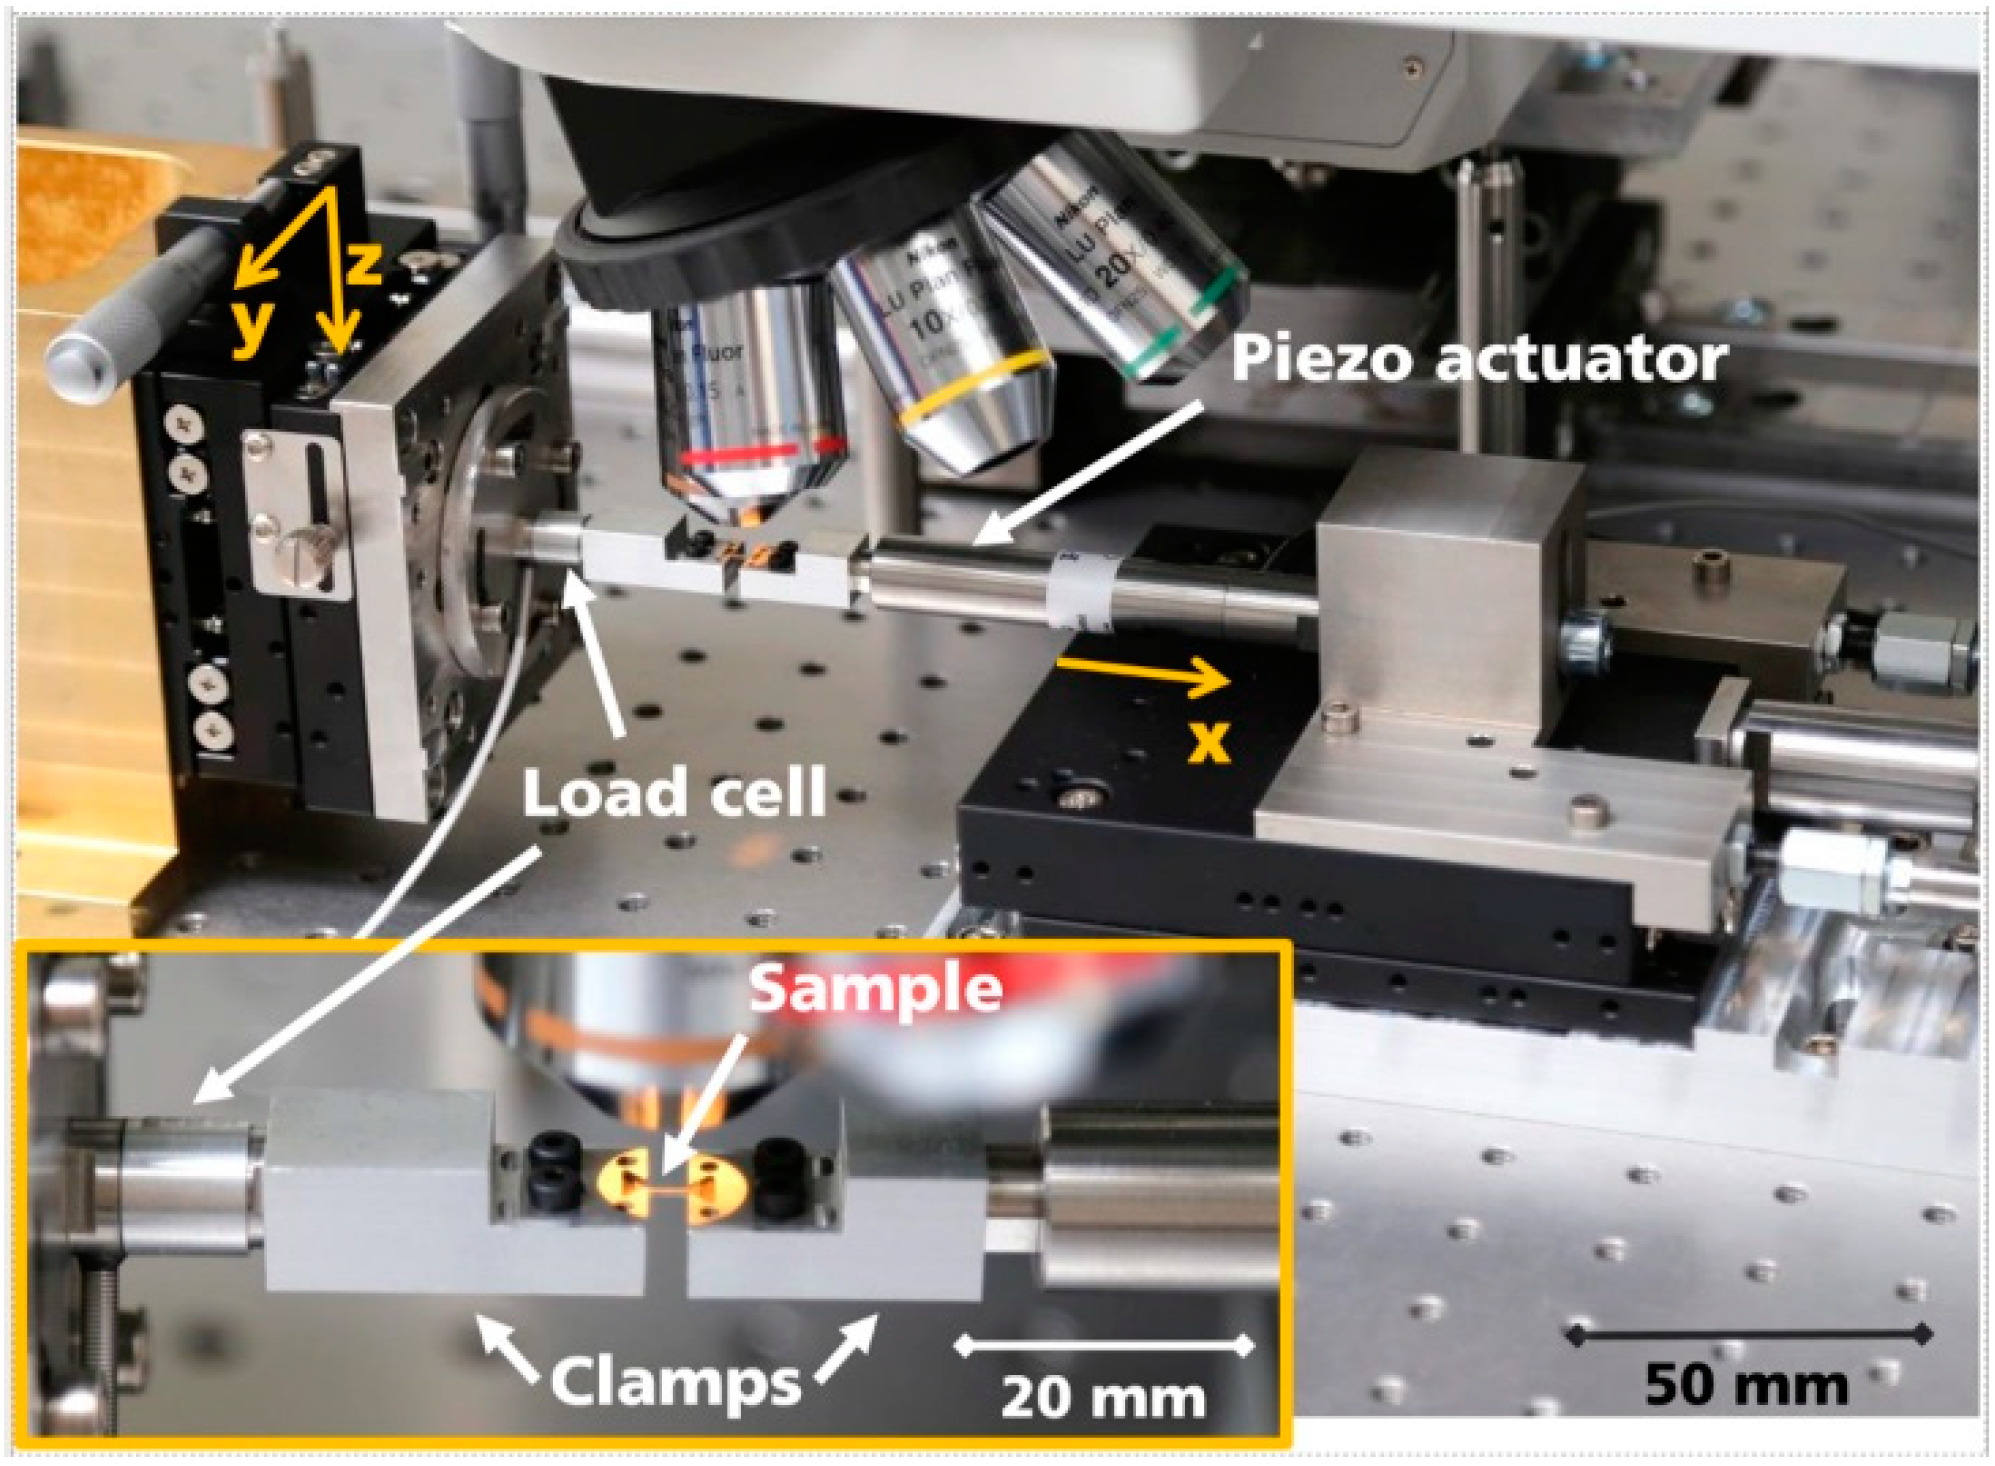
2.4. Micromechanical Testing
2.5. Numerical Simulations
3. Results and Discussion
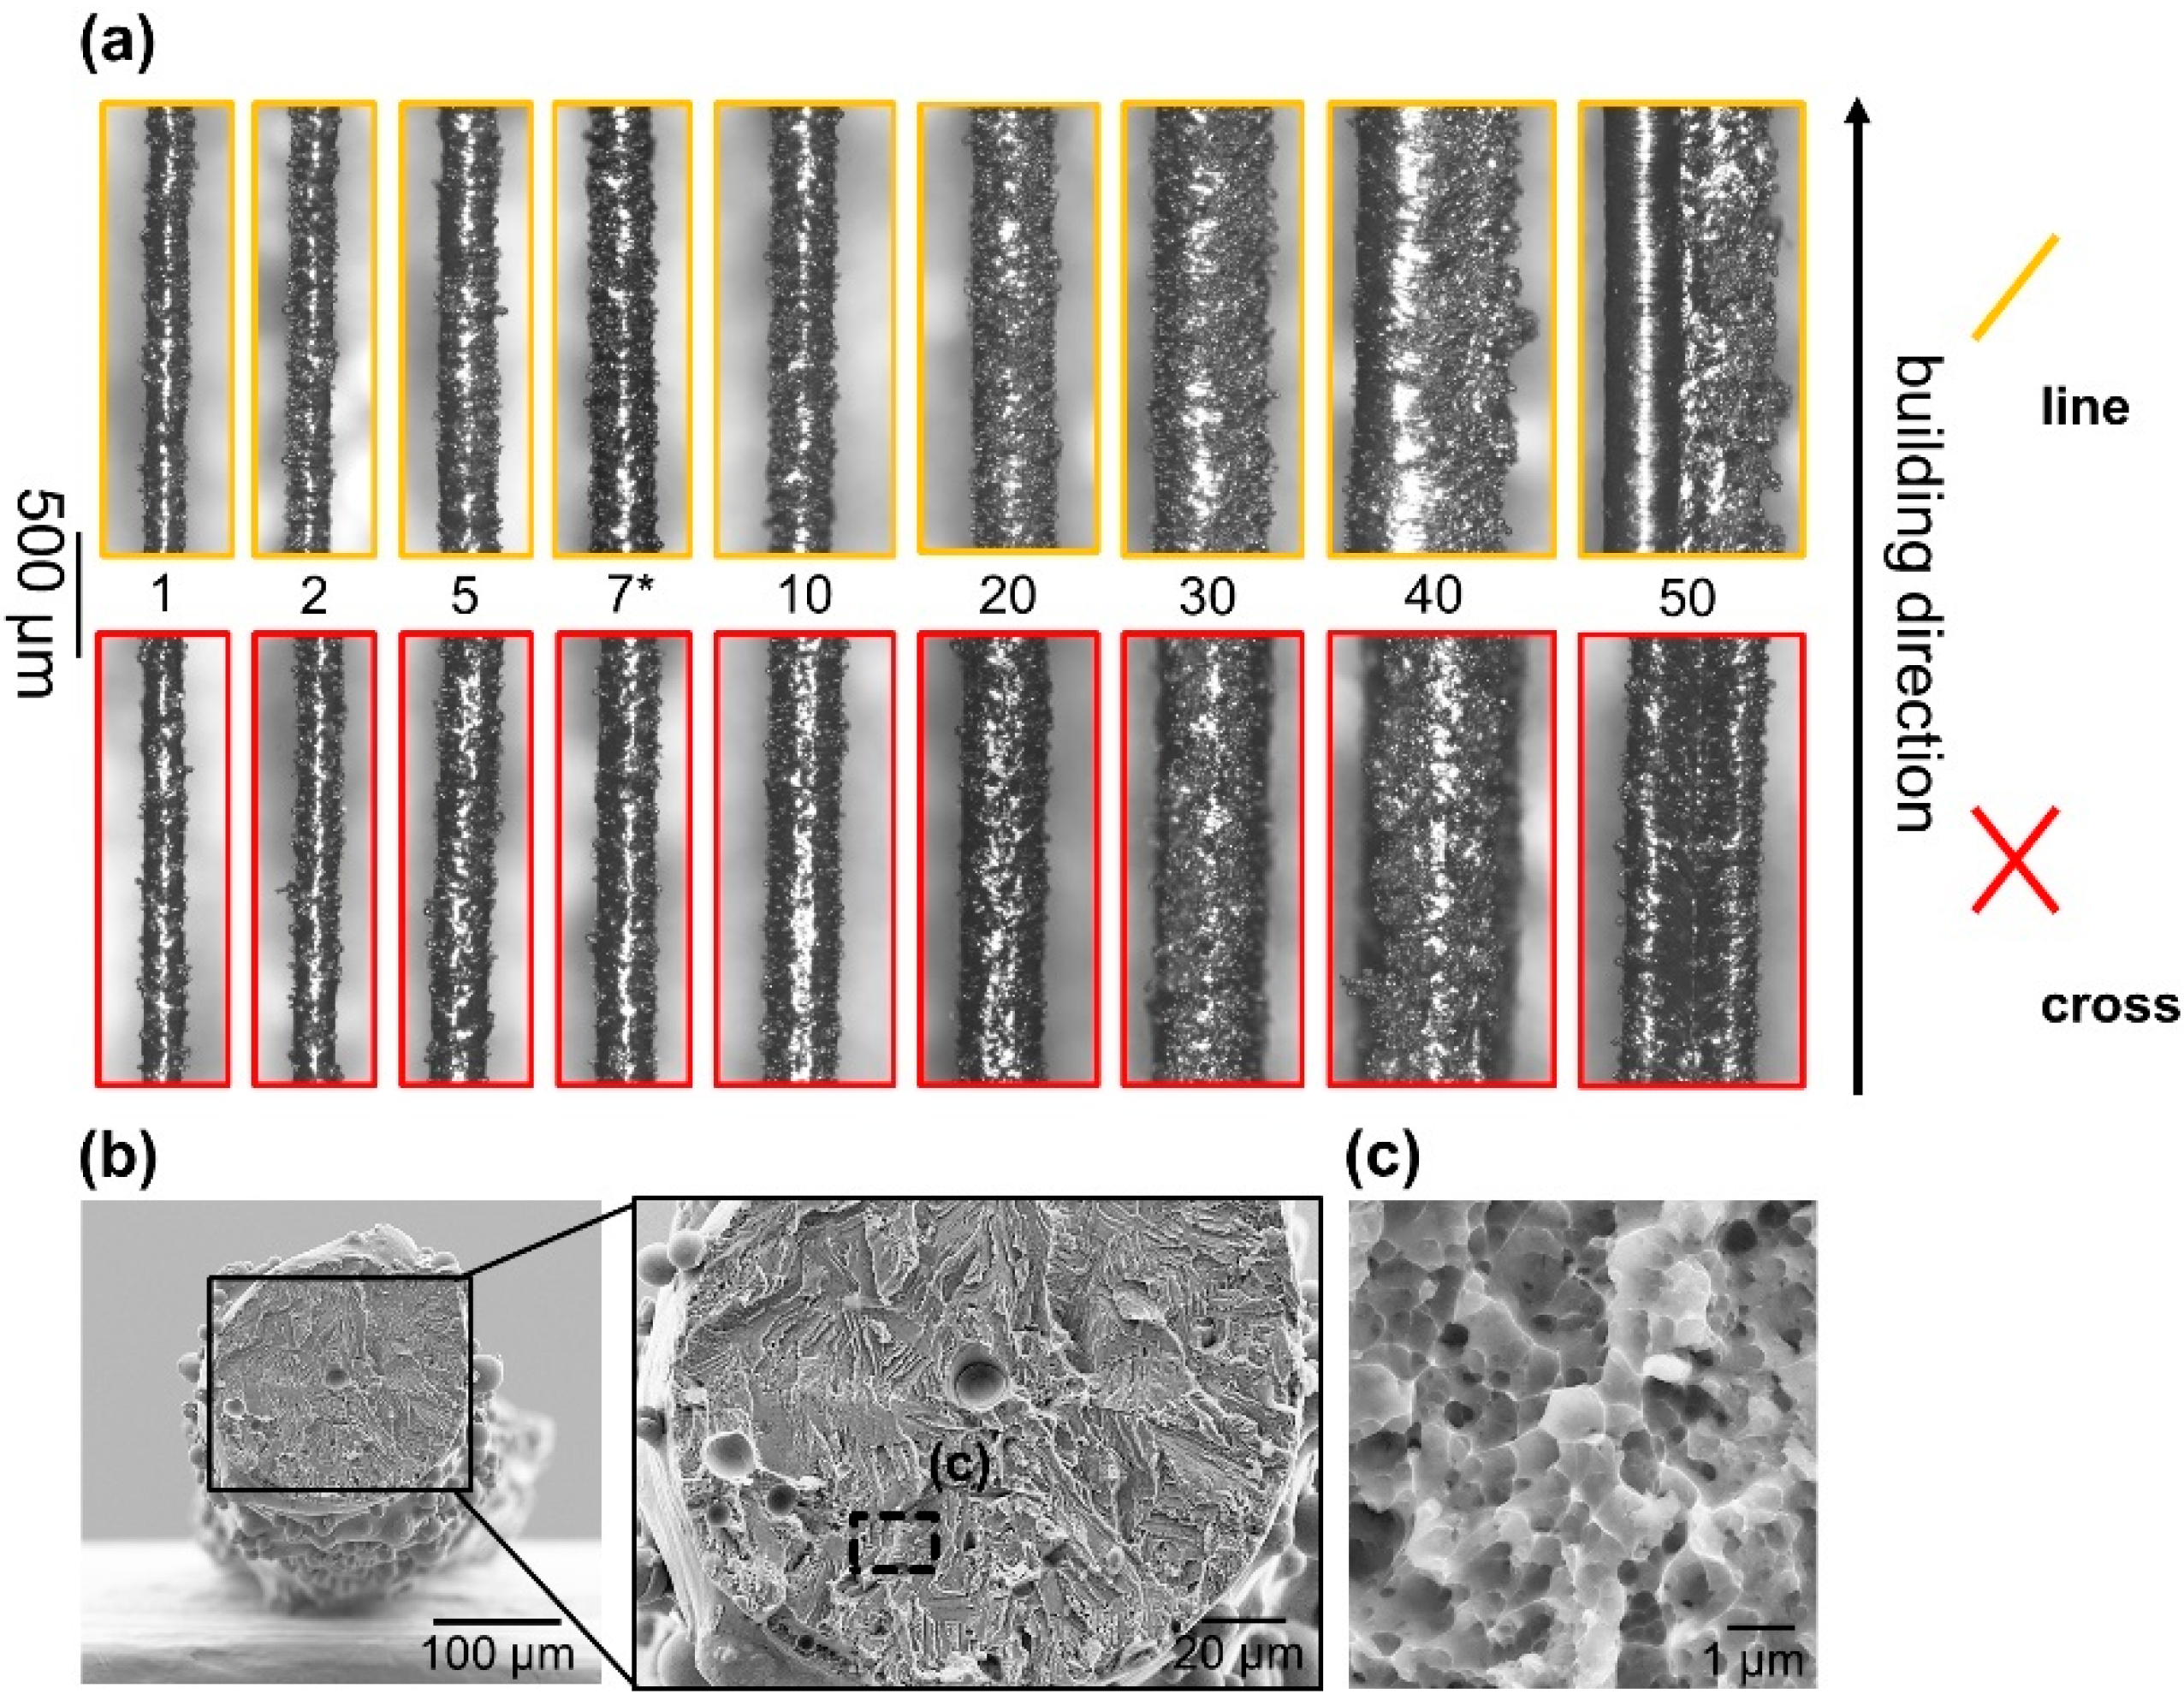
3.1. Influence of Scanning Strategy on Strut Diameter and Morphology
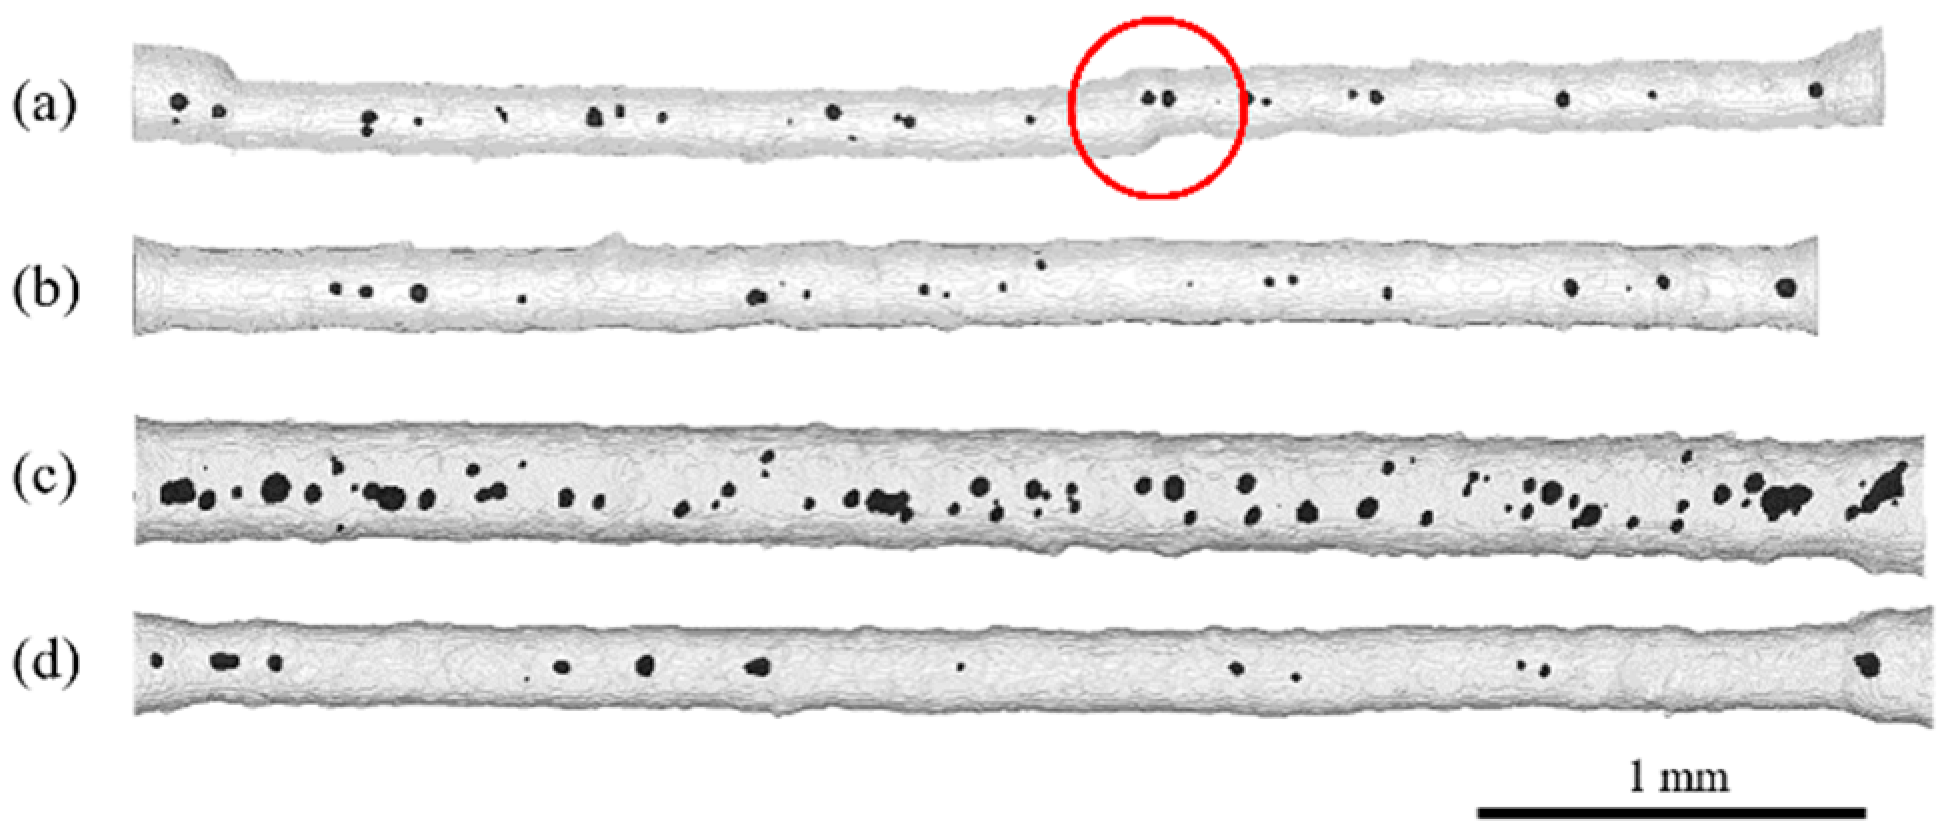
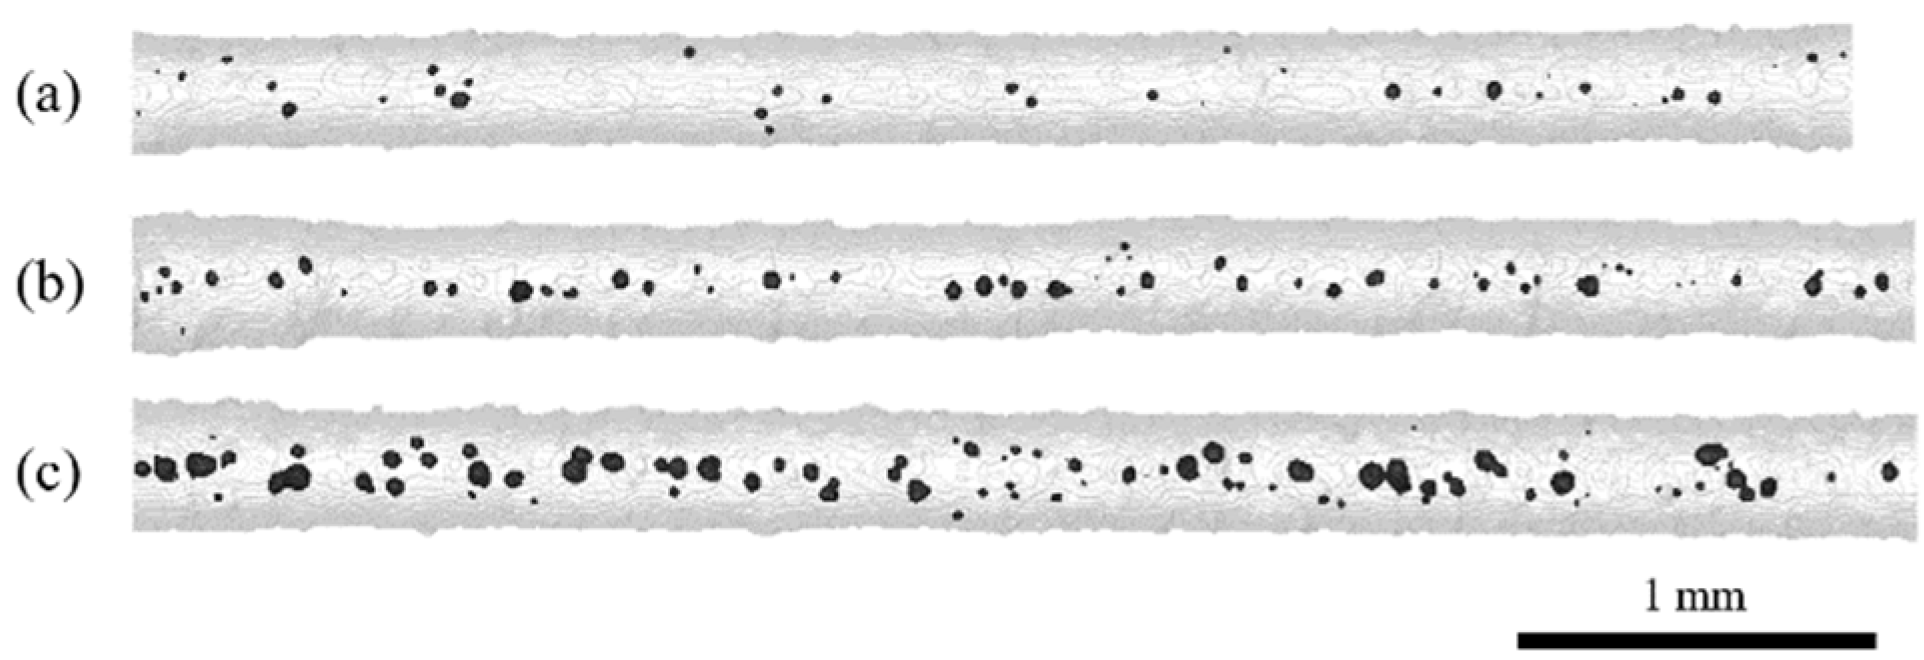
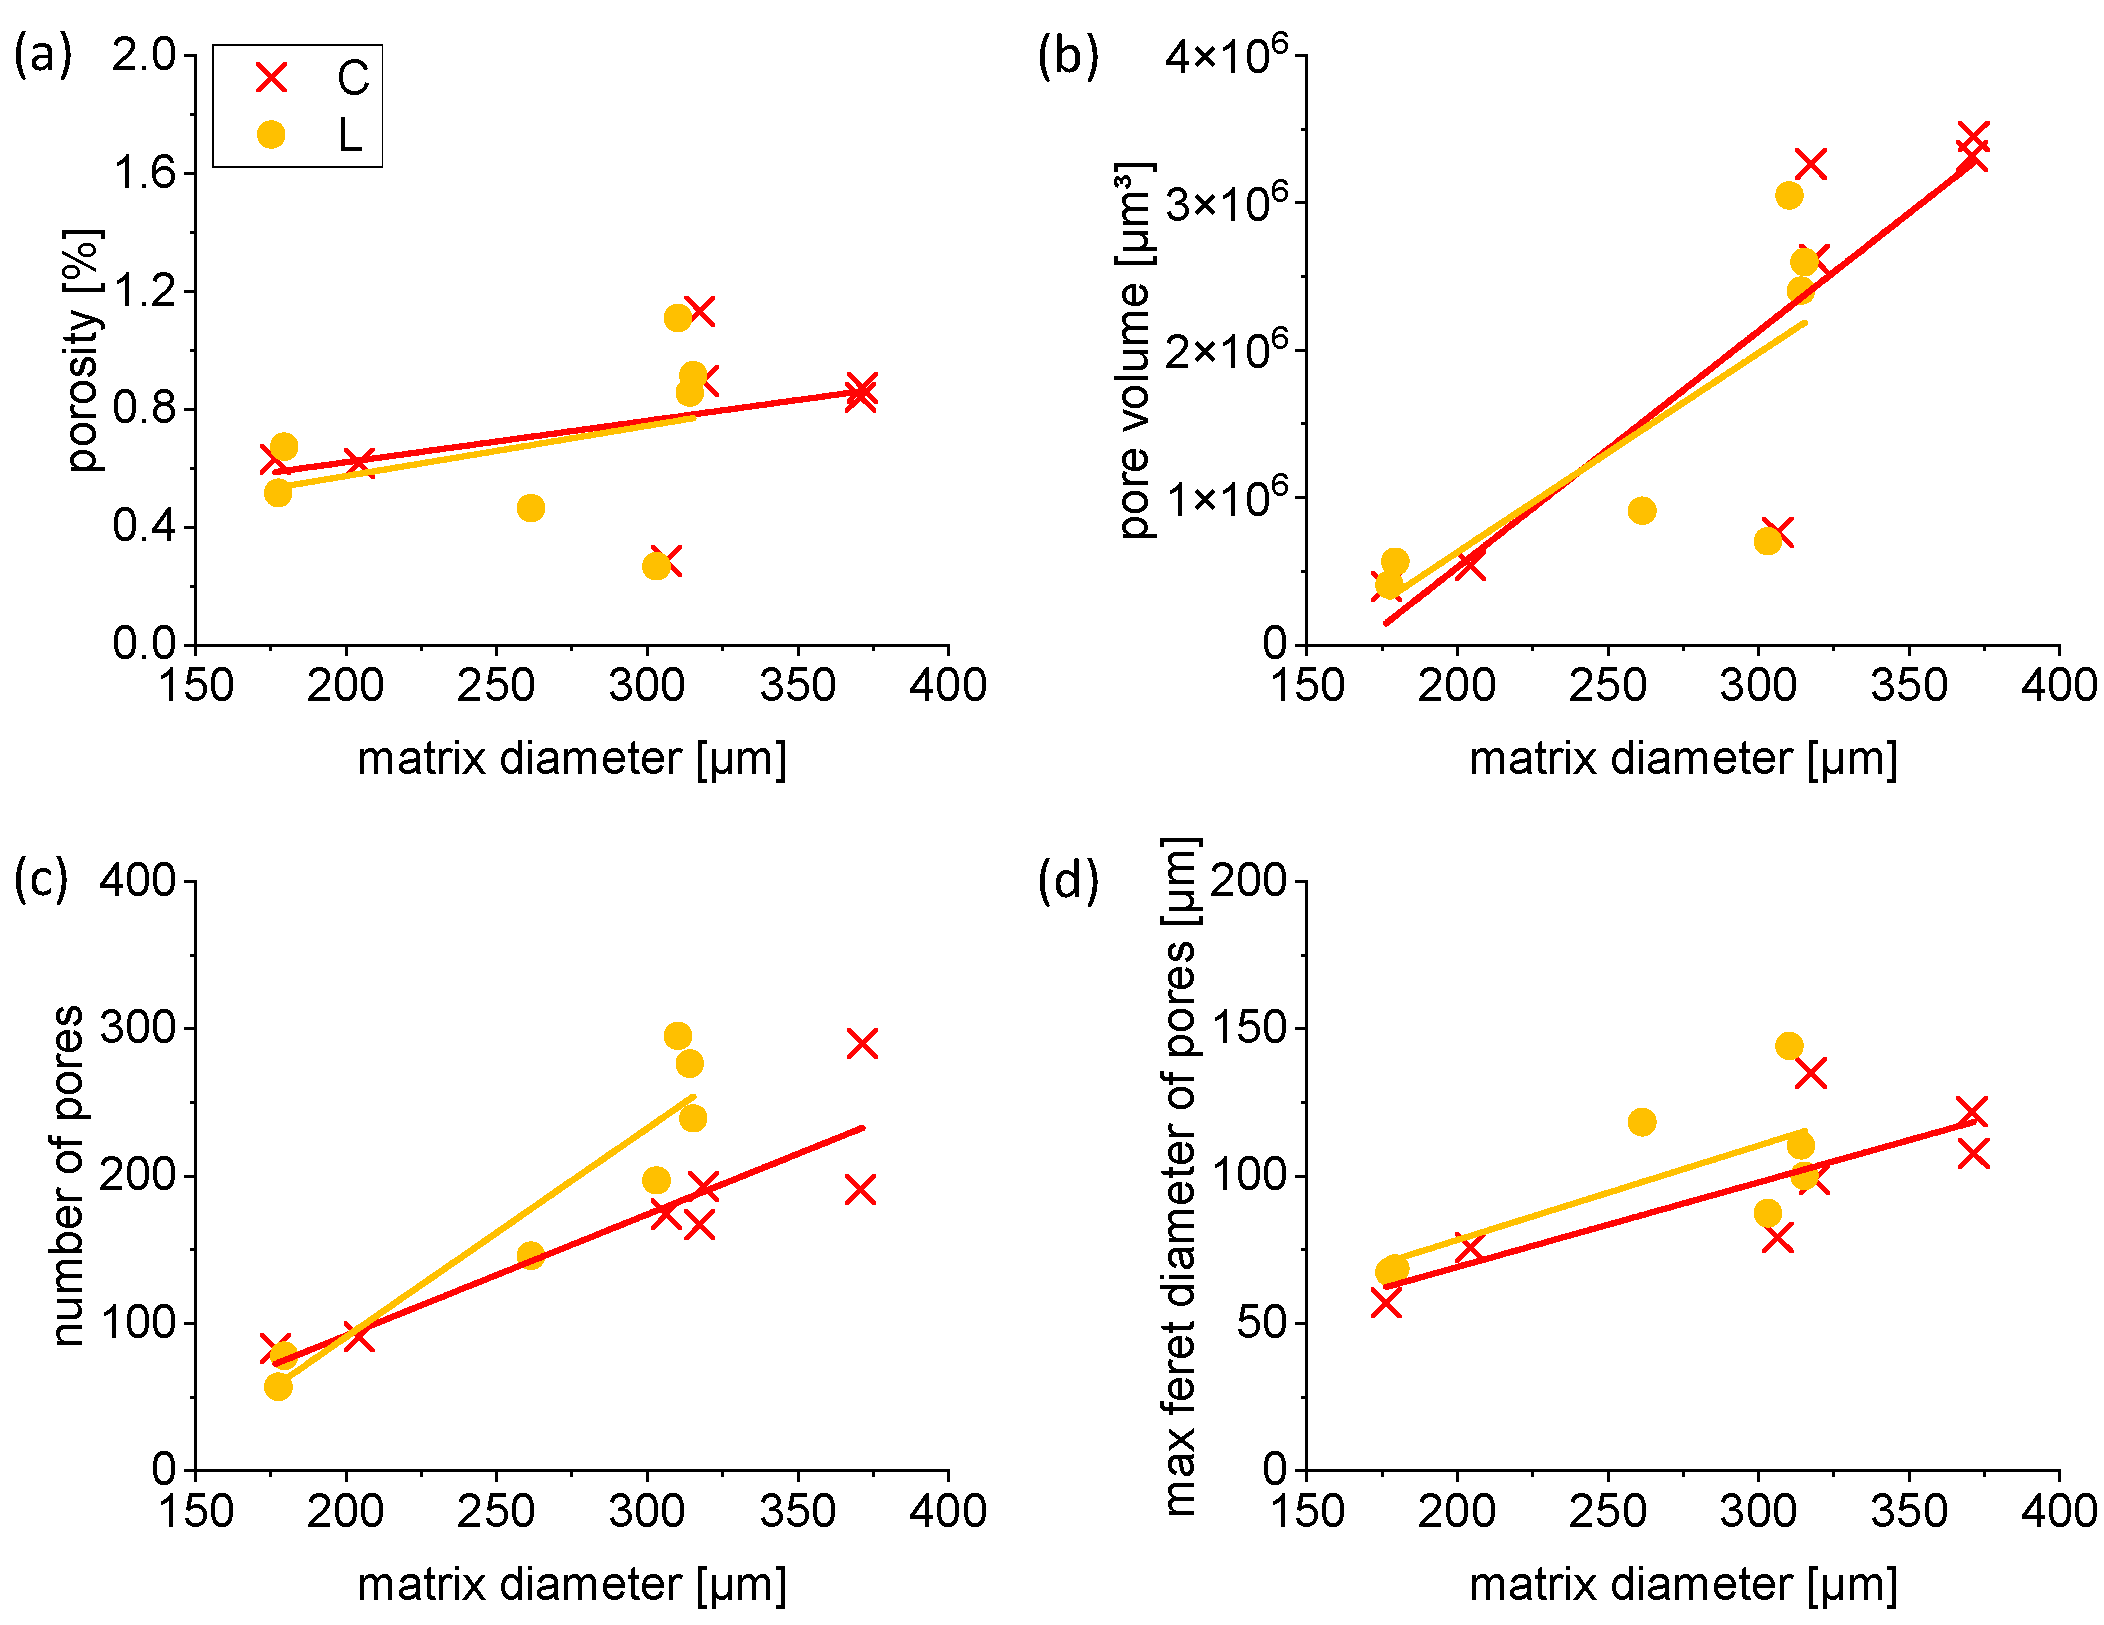
3.2. 3D Strut Characteristics
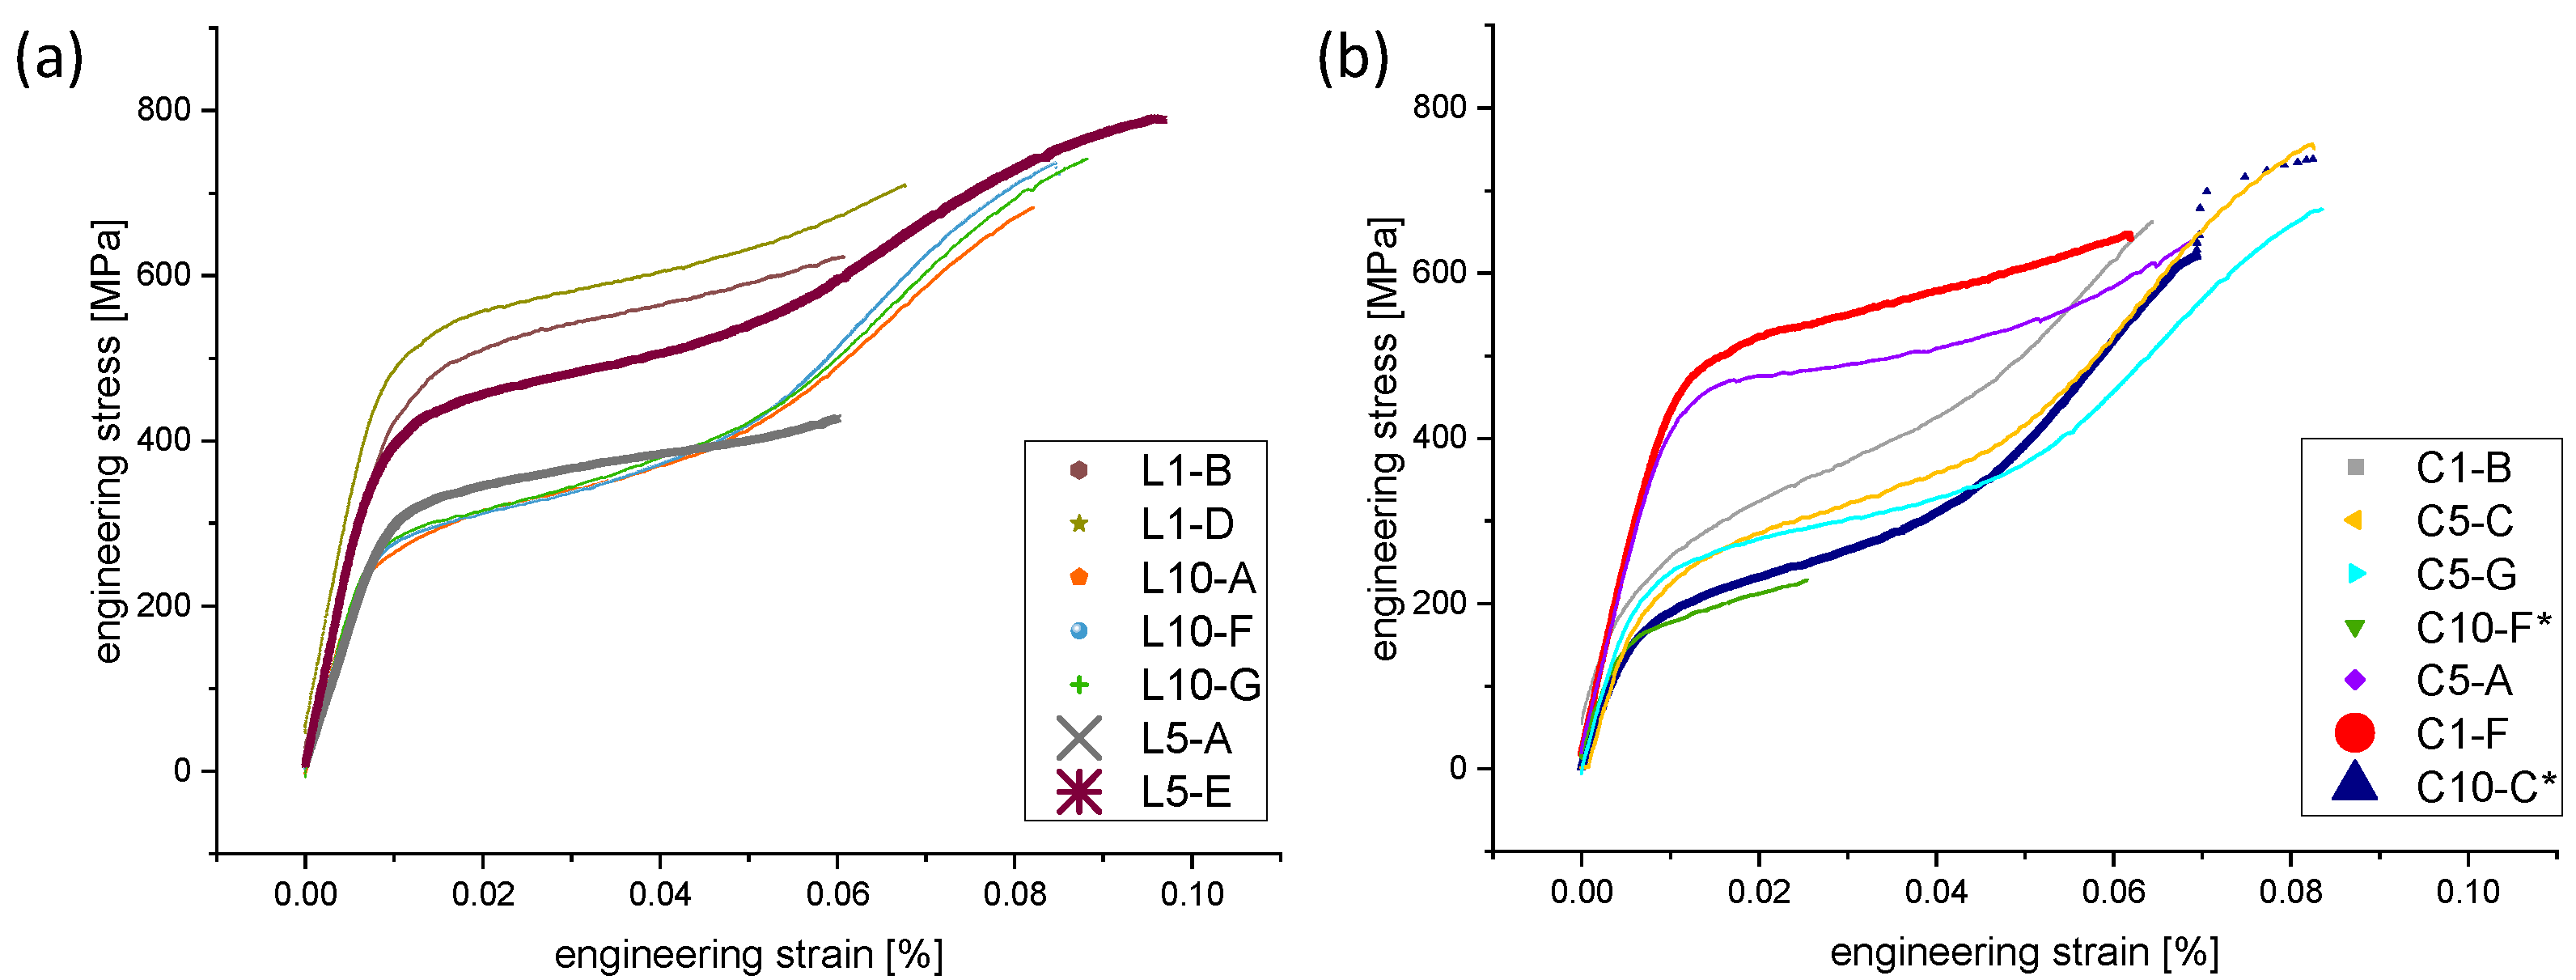
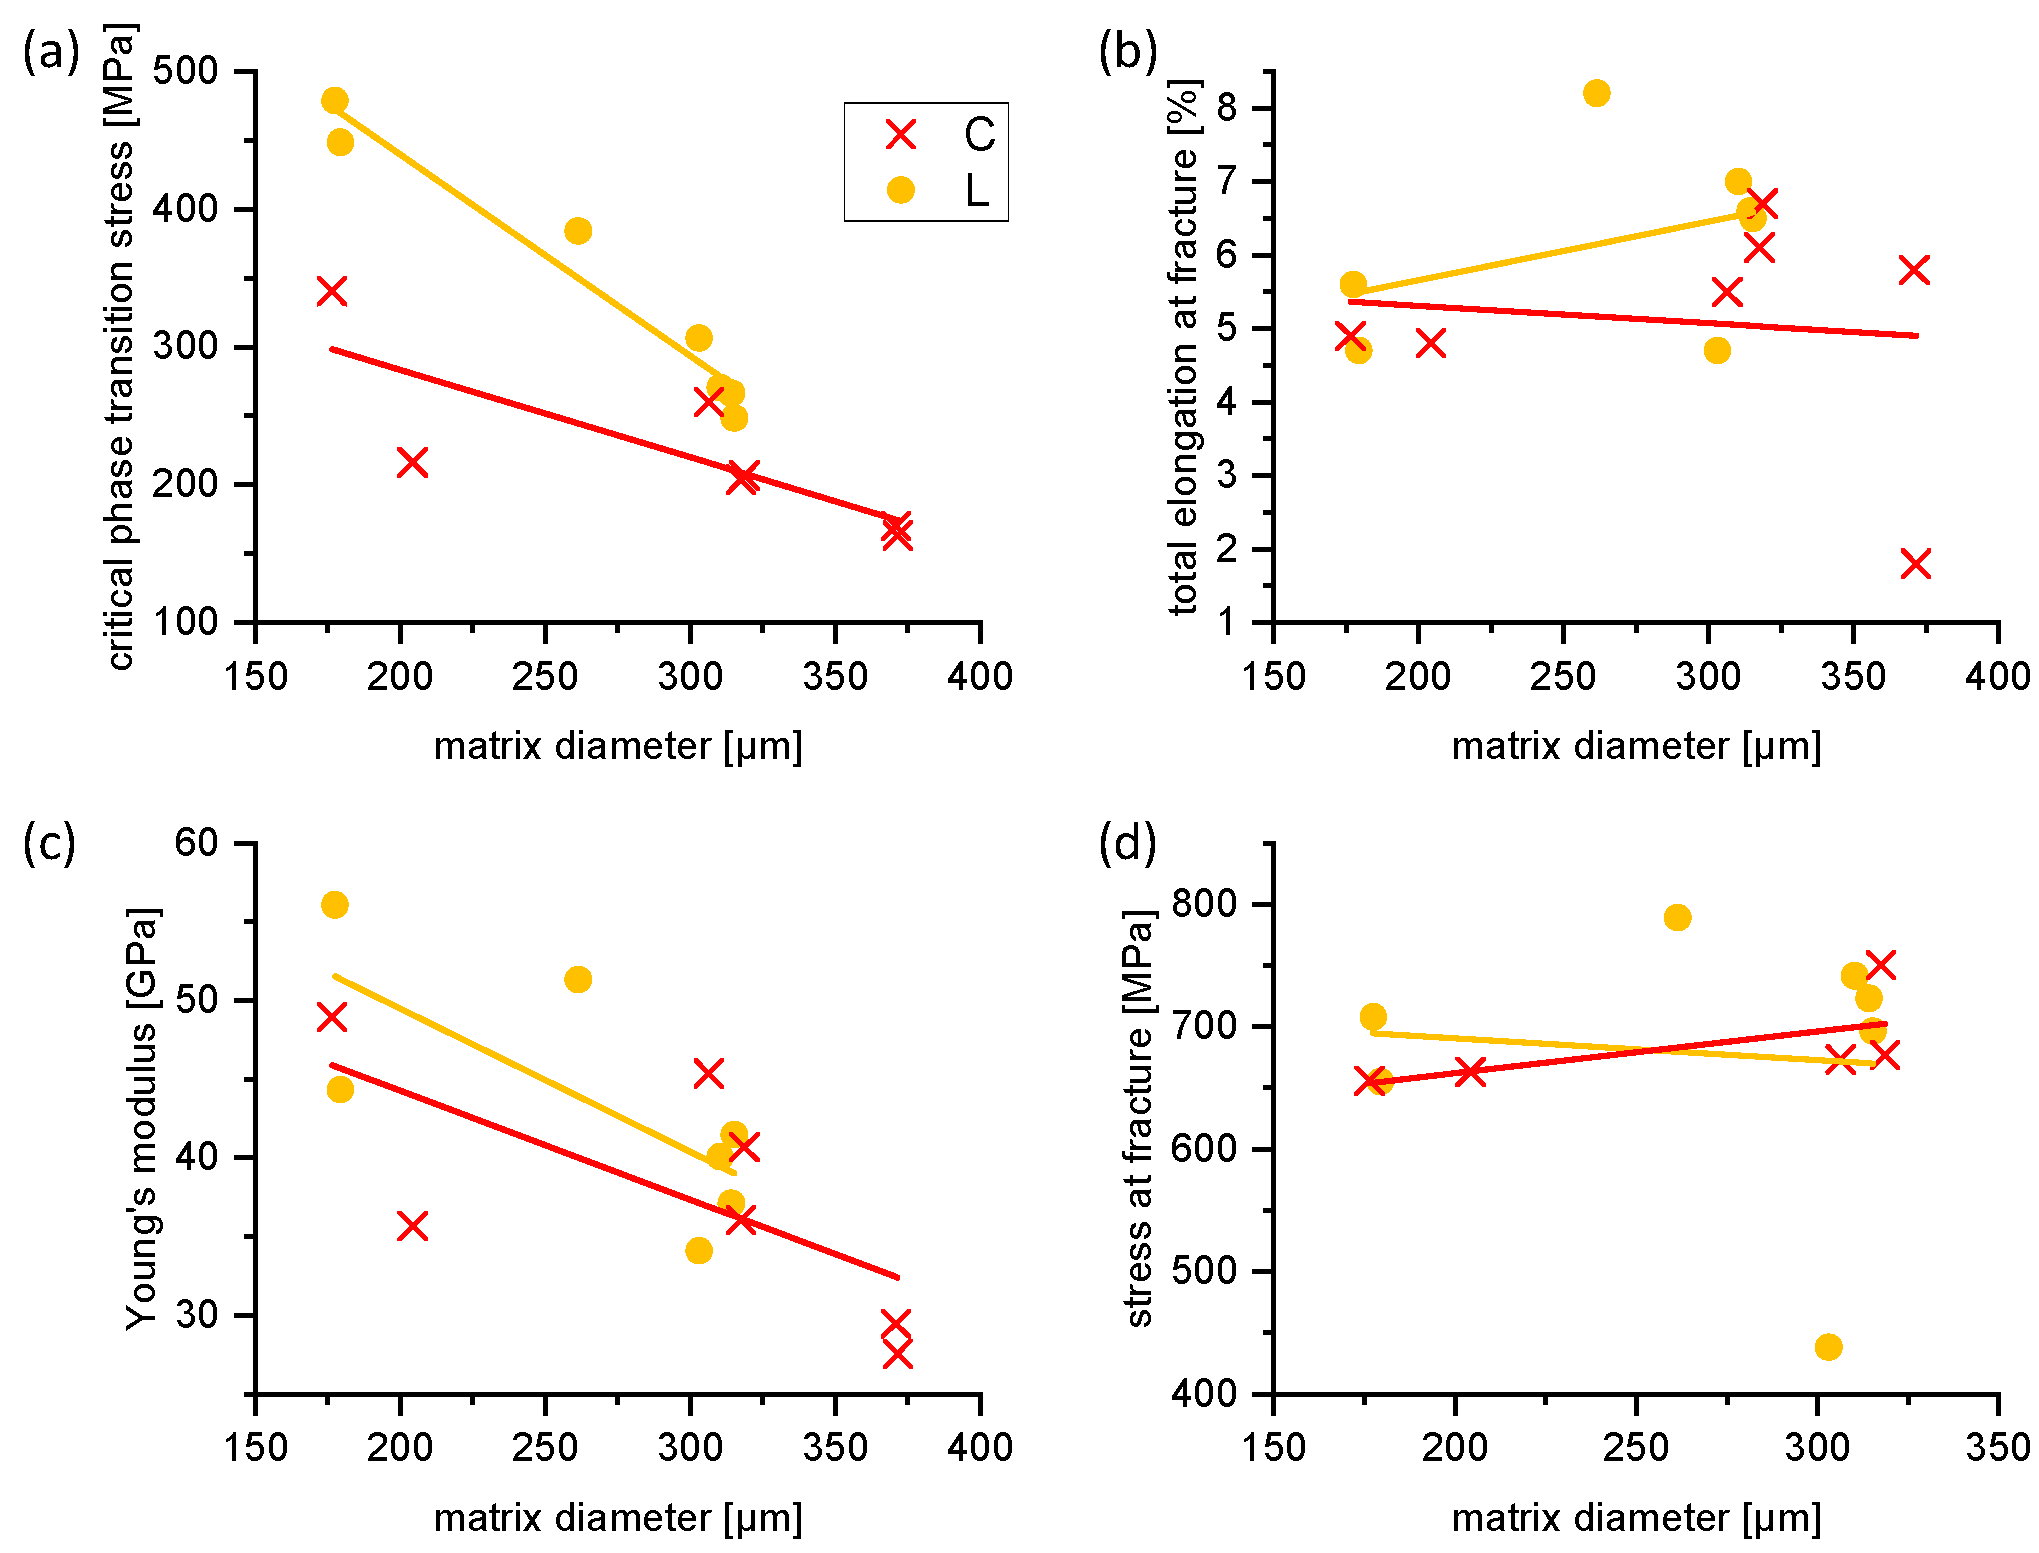
3.3. Microstructure and Micromechanical Behavior
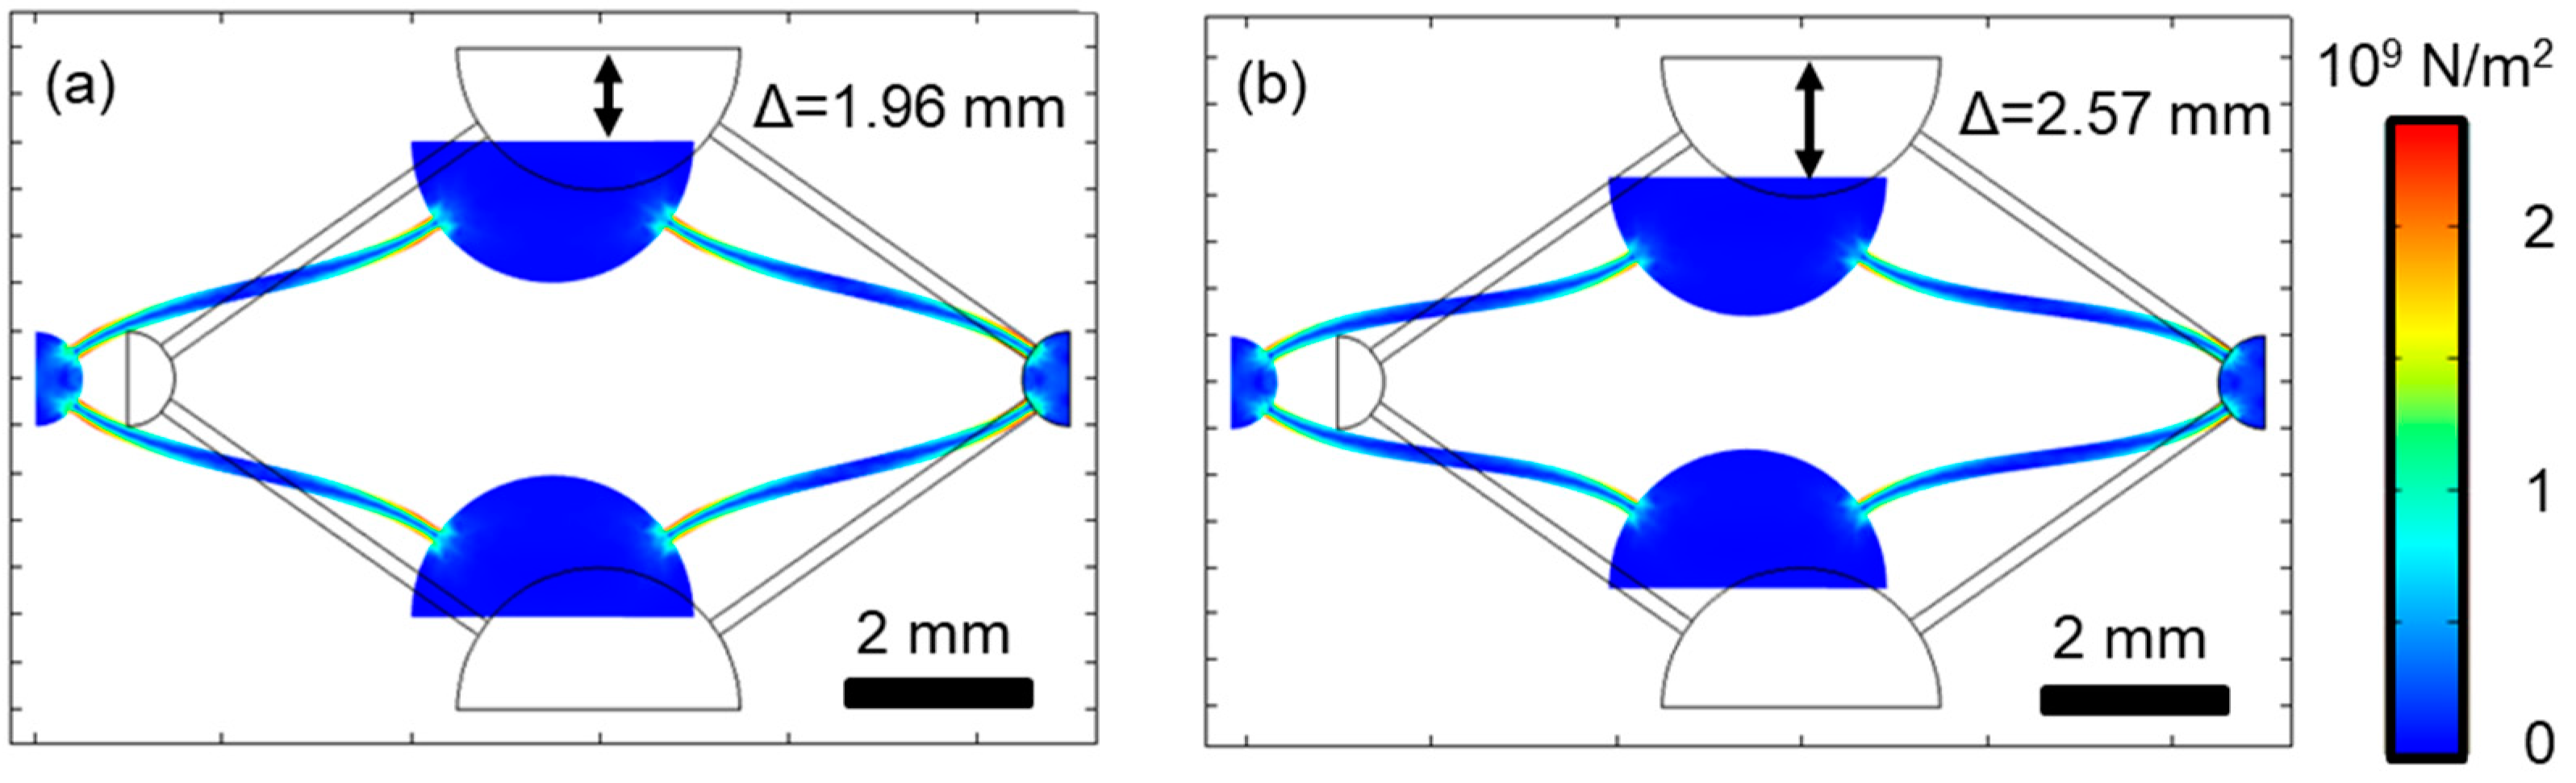
3.4. A Metamaterial Model and Validation Perspective
4. Conclusions
Author Contributions
Funding
Institutional Review Board Statement
Informed Consent Statement
Data Availability Statement
Acknowledgments
Conflicts of Interest
References
- Christensen, J.; Kadic, M.; Wegener, M.; Kraft, O. Vibrant times for mechanical metamaterials. MRS Commun. 2015, 5, 453–462. [Google Scholar] [CrossRef]
- Kadic, M.; Milton, G.W.; van Hecke, M.; Wegener, M. 3D metamaterials. Nat. Rev. Phys. 2019, 1, 198–210. [Google Scholar] [CrossRef]
- Wenz, F.; Schmidt, I.; Leichner, A.; Lichti, T.; Baumann, S.; Andrae, H.; Eberl, C. Designing shape morphing behavior through local programming of mechanical metamaterials. Adv. Mater. 2021, 33, e2008617. [Google Scholar] [CrossRef] [PubMed]
- Wenz, F.; Schönfeld, D.; Fischer, S.C.L.; Pretsch, T.; Eberl, C. Controlling malleability of metamaterials through programmable memory. Adv. Eng. Mater. 2022, 2201022. [Google Scholar] [CrossRef]
- Ren, X.; Das, R.; Tran, P.; Ngo, T.D.; Xie, Y.M. Auxetic metamaterials and structures: A review. Smart Mater. Struct. 2018, 27, 23001. [Google Scholar] [CrossRef]
- Bückmann, T.; Stenger, N.; Kadic, M.; Kaschke, J.; Frölich, A.; Kennerknecht, T.; Eberl, C.; Thiel, M.; Wegener, M. Tailored 3D mechanical metamaterials made by dip-in direct-laser-writing optical lithography. Adv. Mater. 2012, 24, 2710–2714. [Google Scholar] [CrossRef]
- Schaedler, T.A.; Jacobsen, A.J.; Torrents, A.; Sorensen, A.E.; Lian, J.; Greer, J.R.; Valdevit, L.; Carter, W.B. Ultralight metallic microlattices. Science 2011, 334, 962–965. [Google Scholar] [CrossRef] [PubMed]
- Ge, J.; Yan, X.; Lei, Y.; Ahmed, M.; O’Reilly, P.; Zhang, C.; Lupoi, R.; Yin, S. A detailed analysis on the microstructure and compressive properties of selective laser melted Ti6Al4V lattice structures. Mater. Des. 2021, 198, 109292. [Google Scholar] [CrossRef]
- Jia, Z.; Liu, F.; Jiang, X.; Wang, L. Engineering lattice metamaterials for extreme property, programmability, and multifunctionality. J. Appl. Phys. 2020, 127, 150901. [Google Scholar] [CrossRef]
- Jin, L.; Forte, A.E.; Deng, B.; Rafsanjani, A.; Bertoldi, K. Kirigami-inspired inflatables with programmable shapes. Adv. Mater. 2020, 32, e2001863. [Google Scholar] [CrossRef]
- Kok, Y.; Tan, X.P.; Wang, P.; Nai, M.; Loh, N.H.; Liu, E.; Tor, S.B. Anisotropy and heterogeneity of microstructure and mechanical properties in metal additive manufacturing: A critical review. Mater. Des. 2018, 139, 565–586. [Google Scholar] [CrossRef]
- Seifi, M.; Salem, A.; Beuth, J.; Harrysson, O.; Lewandowski, J.J. Overview of materials qualification needs for metal additive manufacturing. JOM 2016, 68, 747–764. [Google Scholar] [CrossRef]
- Yavas, D.; Liu, Q.; Zhang, Z.; Wu, D. Design and fabrication of architected multi-material lattices with tunable stiffness, strength, and energy absorption. Mater. Des. 2022, 217, 110613. [Google Scholar] [CrossRef]
- Fischer, S.C.L.; Hillen, L.; Eberl, C. Mechanical metamaterials on the way from laboratory scale to industrial applications: Challenges for characterization and scalability. Materials 2020, 13, 3605. [Google Scholar] [CrossRef]
- Kappe, K.; Wahl, J.P.; Gutmann, F.; Boyadzhieva, S.M.; Hoschke, K.; Fischer, S.C.L. Design and Manufacturing of a Metal-Based Mechanical Metamaterial with Tunable Damping Properties. Materials 2022, 15, 5644. [Google Scholar] [CrossRef]
- Elahinia, M.; Shayesteh Moghaddam, N.; Taheri Andani, M.; Amerinatanzi, A.; Bimber, B.A.; Hamilton, R.F. Fabrication of NiTi through additive manufacturing: A review. Prog. Mater. Sci. 2016, 83, 630–663. [Google Scholar] [CrossRef]
- Askari, M.; Hutchins, D.A.; Thomas, P.J.; Astolfi, L.; Watson, R.L.; Abdi, M.; Ricci, M.; Laureti, S.; Nie, L.; Freear, S.; et al. Additive manufacturing of metamaterials: A review. Addit. Manuf. 2020, 36, 101562. [Google Scholar] [CrossRef]
- Gebhardt, U.; Gustmann, T.; Giebeler, L.; Hirsch, F.; Hufenbach, J.K.; Kästner, M. Additively manufactured AlSi10Mg lattices—Potential and limits of modelling as-designed structures. Mater. Des. 2022, 220, 110796. [Google Scholar] [CrossRef]
- Korn, H.; Koch, P.; Kordass, R.; Holtzhausen, S.; Schoene, C.; Mueller, B.; Stelzer, R. Adapted scan strategy and slicing tool for improvement of strut precision in lattice structures. In Proceedings of the Summer Topical Meeting “Advancing Precision in Additive Manufacturing”, Berkeley, CA, USA, 22–25 July 2018. [Google Scholar]
- Gustmann, T.; Gutmann, F.; Wenz, F.; Koch, P.; Stelzer, R.; Drossel, W.-G.; Korn, H. Properties of a superelastic NiTi shape memory alloy using laser powder bed fusion and adaptive scanning strategies. Prog. Addit. Manuf. 2020, 5, 11–18. [Google Scholar] [CrossRef]
- Kennerknecht, T. Fatigue of Micro Molded Materials-Aluminum Bronze and Yttria Stabilized Zirconia; Scientific Publishing: Singapore, 2014. [Google Scholar]
- Straub, T. Experimental Investigation of Crack Initiation in Face-Centered Cubic Materials in the High and Very High Cycle Fatigue Regime; Scientific Publishing: Singapore, 2016. [Google Scholar]
- Senn, M. Digital Image Correlation and Tracking. MATLAB Central File Exchange. 2022. Available online: https://www.mathworks.com/matlabcentral/fileexchange/50994-digital-image-correlation-and-tracking (accessed on 3 February 2020).
- Speirs, M.; van Hooreweder, B.; van Humbeeck, J.; Kruth, J.-P. Fatigue behaviour of NiTi shape memory alloy scaffolds produced by SLM, a unit cell design comparison. J. Mech. Behav. Biomed. Mater. 2017, 70, 53–59. [Google Scholar] [CrossRef]
- Brenne, F.; Niendorf, T.; Maier, H.J. Additively manufactured cellular structures: Impact of microstructure and local strains on the monotonic and cyclic behavior under uniaxial and bending load. J. Mater. Process. Technol. 2013, 213, 1558–1564. [Google Scholar] [CrossRef]
- Koch, P.; Korn, H.; Kordass, R.; Holtzhausen, S.; Schoene, C.; Mueller, B.; Stelzer, R. A CAD-Based Workflow and Mechanical Characterization for Additive Manufacturing of Tailored Lattice Structures; University of Texas at Austin: Austin, TX, USA, 2018. [Google Scholar]
- Nagarajan, B.; Hu, Z.; Song, X.; Zhai, W.; Wei, J. Development of micro selective laser melting: The state of the art and future perspectives. Engineering 2019, 5, 702–720. [Google Scholar] [CrossRef]
- Saedi, S.; Turabi, A.S.; Taheri Andani, M.; Haberland, C.; Karaca, H.; Elahinia, M. The influence of heat treatment on the thermomechanical response of Ni-rich NiTi alloys manufactured by selective laser melting. J. Alloys Compd. 2016, 677, 204–210. [Google Scholar] [CrossRef]
- Shaheen, M.Y.; Thornton, A.R.; Luding, S.; Weinhart, T. The influence of material and process parameters on powder spreading in additive manufacturing. Powder Technol. 2021, 383, 564–583. [Google Scholar] [CrossRef]
- Niendorf, T.; Brenne, F.; Krooß, P.; Vollmer, M.; Günther, J.; Schwarze, D.; Biermann, H. Microstructural evolution and functional properties of Fe-Mn-Al-Ni shape memory alloy processed by selective laser melting. Met. Mater. Trans. A 2016, 47, 2569–2573. [Google Scholar] [CrossRef]
- Melton, K.N.; Mercier, O. The mechanical properties of NiTi-based shape memory alloys. Acta Metall. 1981, 29, 393–398. [Google Scholar] [CrossRef]
- Żrodowski, Ł.; Wróblewski, R.; Choma, T.; Morończyk, B.; Ostrysz, M.; Leonowicz, M.; Łacisz, W.; Błyskun, P.; Wróbel, J.S.; Cieślak, G.; et al. Novel cold crucible ultrasonic atomization powder production method for 3D printing. Materials 2021, 14, 2541. [Google Scholar] [CrossRef]
- Hinrichs, F.; Kauffmann, A.; Schliephake, D.; Seils, S.; Obert, S.; Ratschbacher, K.; Allen, M.; Pundt, A.; Heilmaier, M. Flexible powder production for additive manufacturing of refractory metal-based alloys. Metals 2021, 11, 1723. [Google Scholar] [CrossRef]
- Hall, E.O. The deformation and ageing of mild steel: III discussion of results. Proc. Phys. Soc. B 1951, 64, 747–753. [Google Scholar] [CrossRef]
- Petch, N.J. The cleavage strength of polycrystals. J. Iron Steel Inst. 1953, 174, 25–28. [Google Scholar]
- Alagha, A.N.; Hussain, S.; Zaki, W. Additive manufacturing of shape memory alloys: A review with emphasis on powder bed systems. Mater. Des. 2021, 204, 109654. [Google Scholar] [CrossRef]
- Ferretto, I.; Kim, D.; Della Ventura, N.M.; Shahverdi, M.; Lee, W.; Leinenbach, C. Laser powder bed fusion of a Fe–Mn–Si shape memory alloy. Addit. Manuf. 2021, 46, 102071. [Google Scholar] [CrossRef]
- Gustmann, T.; dos Santos, J.M.; Gargarella, P.; Kühn, U.; van Humbeeck, J.; Pauly, S. Properties of Cu-based shape-memory alloys prepared by selective laser melting. Shap. Mem. Superelasticity 2017, 3, 24–36. [Google Scholar] [CrossRef]
- Lauhoff, C.; Sommer, N.; Vollmer, M.; Mienert, G.; Krooß, P.; Böhm, S.; Niendorf, T. Excellent superelasticity in a Co-Ni-Ga high-temperature shape memory alloy processed by directed energy deposition. Mater. Res. Lett. 2020, 8, 314–320. [Google Scholar] [CrossRef]


| Specimen | Type of Quasi-P Scanning | Vector Length Factor | Strut Diameter (µm) | Morphology |
|---|---|---|---|---|
| L1 | L-line | 1 | 180 ± 9 | Even and cylindrical |
| L5 | L-line | 5 | 221 ± 8 | |
| L10 | L-line | 10 | 273 ± 6 | |
| C1 | C-cross | 1 | 180 ± 6 | |
| C5 | C-cross | 5 | 248 ± 7 | |
| C10 | C-cross | 10 | 301 ± 7 |
| Specimen | Average Grain Size (µm) | Critical Phase Transition Stress (MPa) |
|---|---|---|
| C1-F | 23 | 340 |
| L5-A | 18 | 306 |
| L5-E | 25 | 384 |
| C10-C | 78 | 163 |
Disclaimer/Publisher’s Note: The statements, opinions and data contained in all publications are solely those of the individual author(s) and contributor(s) and not of MDPI and/or the editor(s). MDPI and/or the editor(s) disclaim responsibility for any injury to people or property resulting from any ideas, methods, instructions or products referred to in the content. |
© 2023 by the authors. Licensee MDPI, Basel, Switzerland. This article is an open access article distributed under the terms and conditions of the Creative Commons Attribution (CC BY) license (https://creativecommons.org/licenses/by/4.0/).
Share and Cite
Straub, T.; Fell, J.; Zabler, S.; Gustmann, T.; Korn, H.; Fischer, S.C.L. Characterization of Filigree Additively Manufactured NiTi Structures Using Micro Tomography and Micromechanical Testing for Metamaterial Material Models. Materials 2023, 16, 676. https://doi.org/10.3390/ma16020676
Straub T, Fell J, Zabler S, Gustmann T, Korn H, Fischer SCL. Characterization of Filigree Additively Manufactured NiTi Structures Using Micro Tomography and Micromechanical Testing for Metamaterial Material Models. Materials. 2023; 16(2):676. https://doi.org/10.3390/ma16020676
Chicago/Turabian StyleStraub, Thomas, Jonas Fell, Simon Zabler, Tobias Gustmann, Hannes Korn, and Sarah C. L. Fischer. 2023. "Characterization of Filigree Additively Manufactured NiTi Structures Using Micro Tomography and Micromechanical Testing for Metamaterial Material Models" Materials 16, no. 2: 676. https://doi.org/10.3390/ma16020676
APA StyleStraub, T., Fell, J., Zabler, S., Gustmann, T., Korn, H., & Fischer, S. C. L. (2023). Characterization of Filigree Additively Manufactured NiTi Structures Using Micro Tomography and Micromechanical Testing for Metamaterial Material Models. Materials, 16(2), 676. https://doi.org/10.3390/ma16020676