


Performance of Anticorrosive Paint Systems for Carbon Steel in the Antarctic Marine Environment


 , ,
, ,  and
and
Abstract
:1. Introduction
- -
- A primer layer, which is in contact with the metal and fulfills the function of generating the necessary adhesion or anchorage to support the rest of the paint layers without any sagging of the complete system. In addition, the primer layer has additives that act as passive inhibitors, which protect the metal once it is exposed to the corrosive environment.
- -
- An intermediate layer, which provides volume or thickness to generate a broader physical barrier effect and hinder the advance of humidity and/or meteorochemical agents toward the metal surface.
- -
- A top coat, which fulfills a special and important function, namely, to protect the entire paint system from the elements. This top layer must have a high resistance to humidity, chemical agents, UV radiation, and abrasion, among other qualities. It is the first protection shield that allows the underlying layers to fulfill their function.
2. Experimental Procedures
2.1. Materials
2.1.1. Metal Substrate
2.1.2. Paint Systems
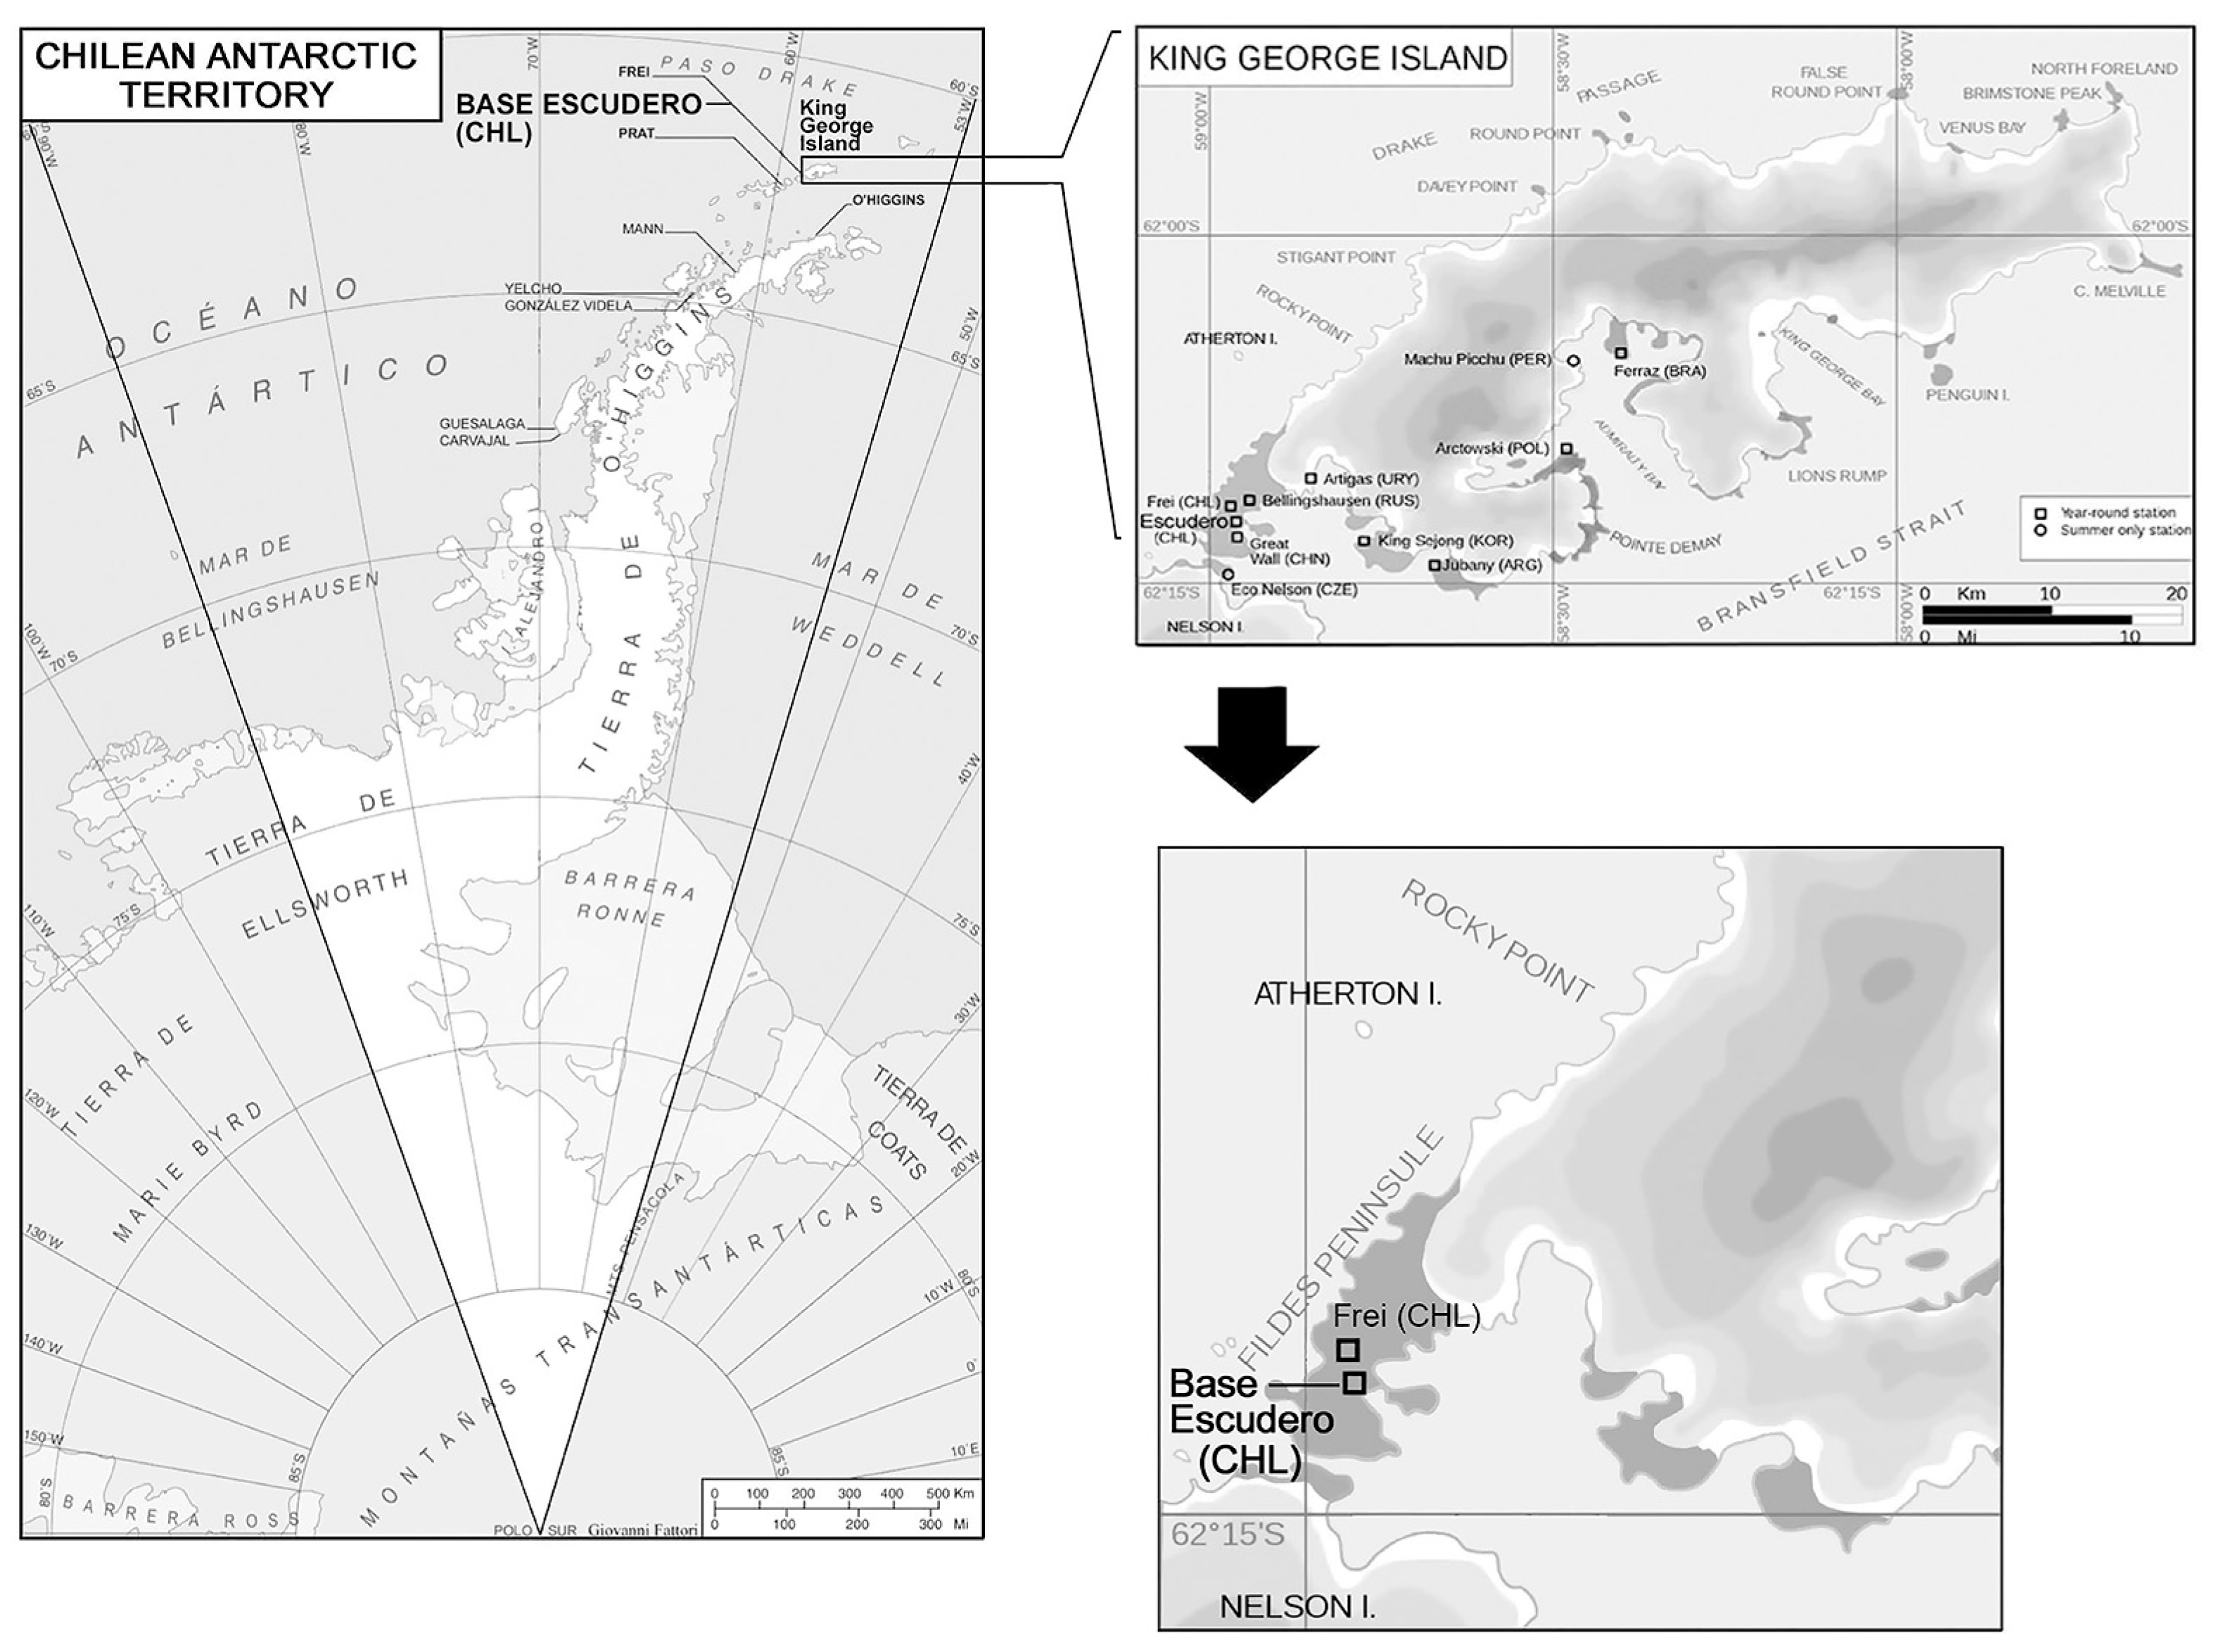
2.2. Field-Test Procedures
2.3. Meteorological and Pollution Data
2.4. Corrosion Testing of Bare Samples
2.5. Evaluation of Paint Systems
3. Results and Discussion
3.1. Characterization of the Test Atmosphere
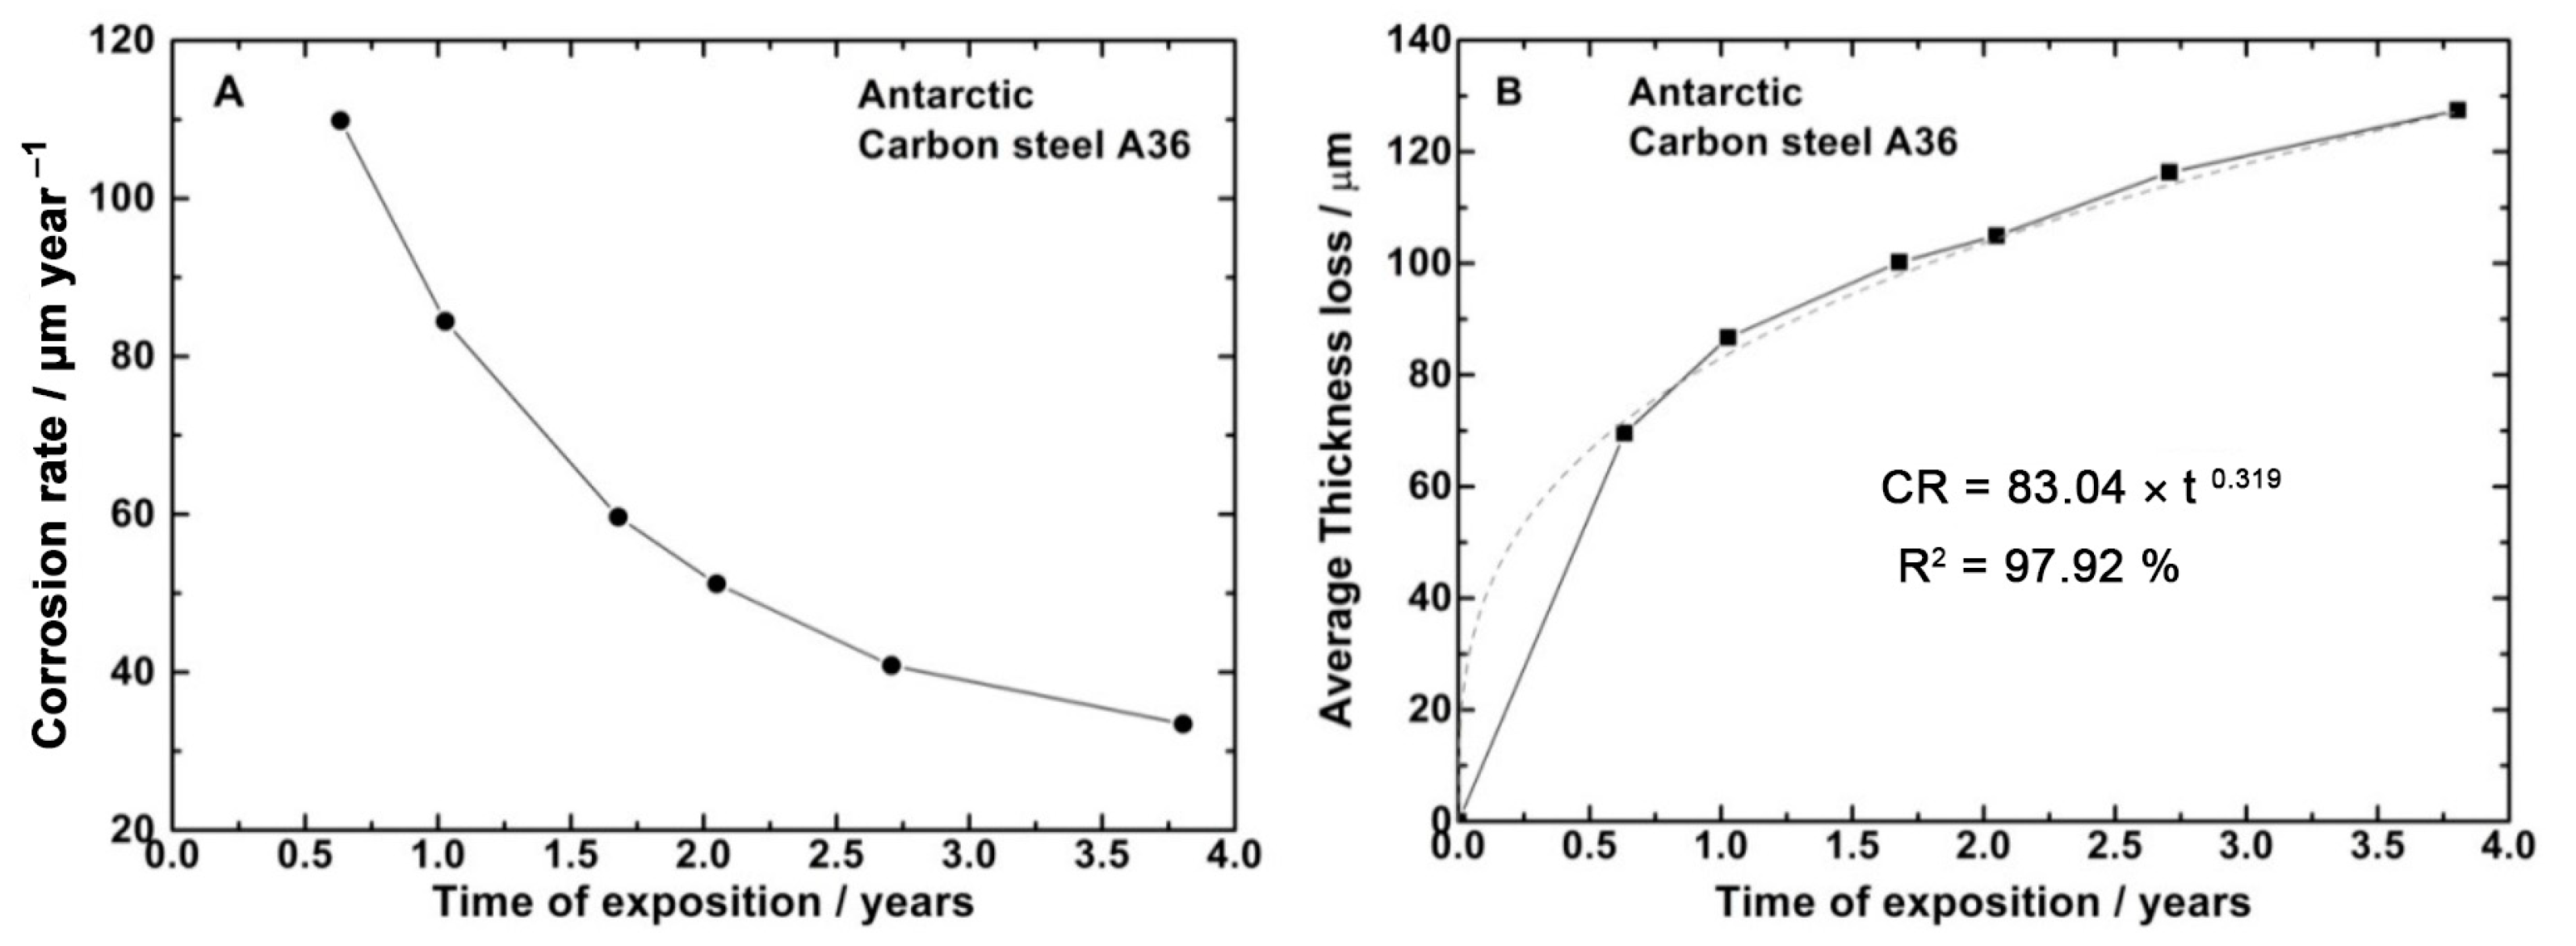
3.2. Corrosion of Carbon Steel
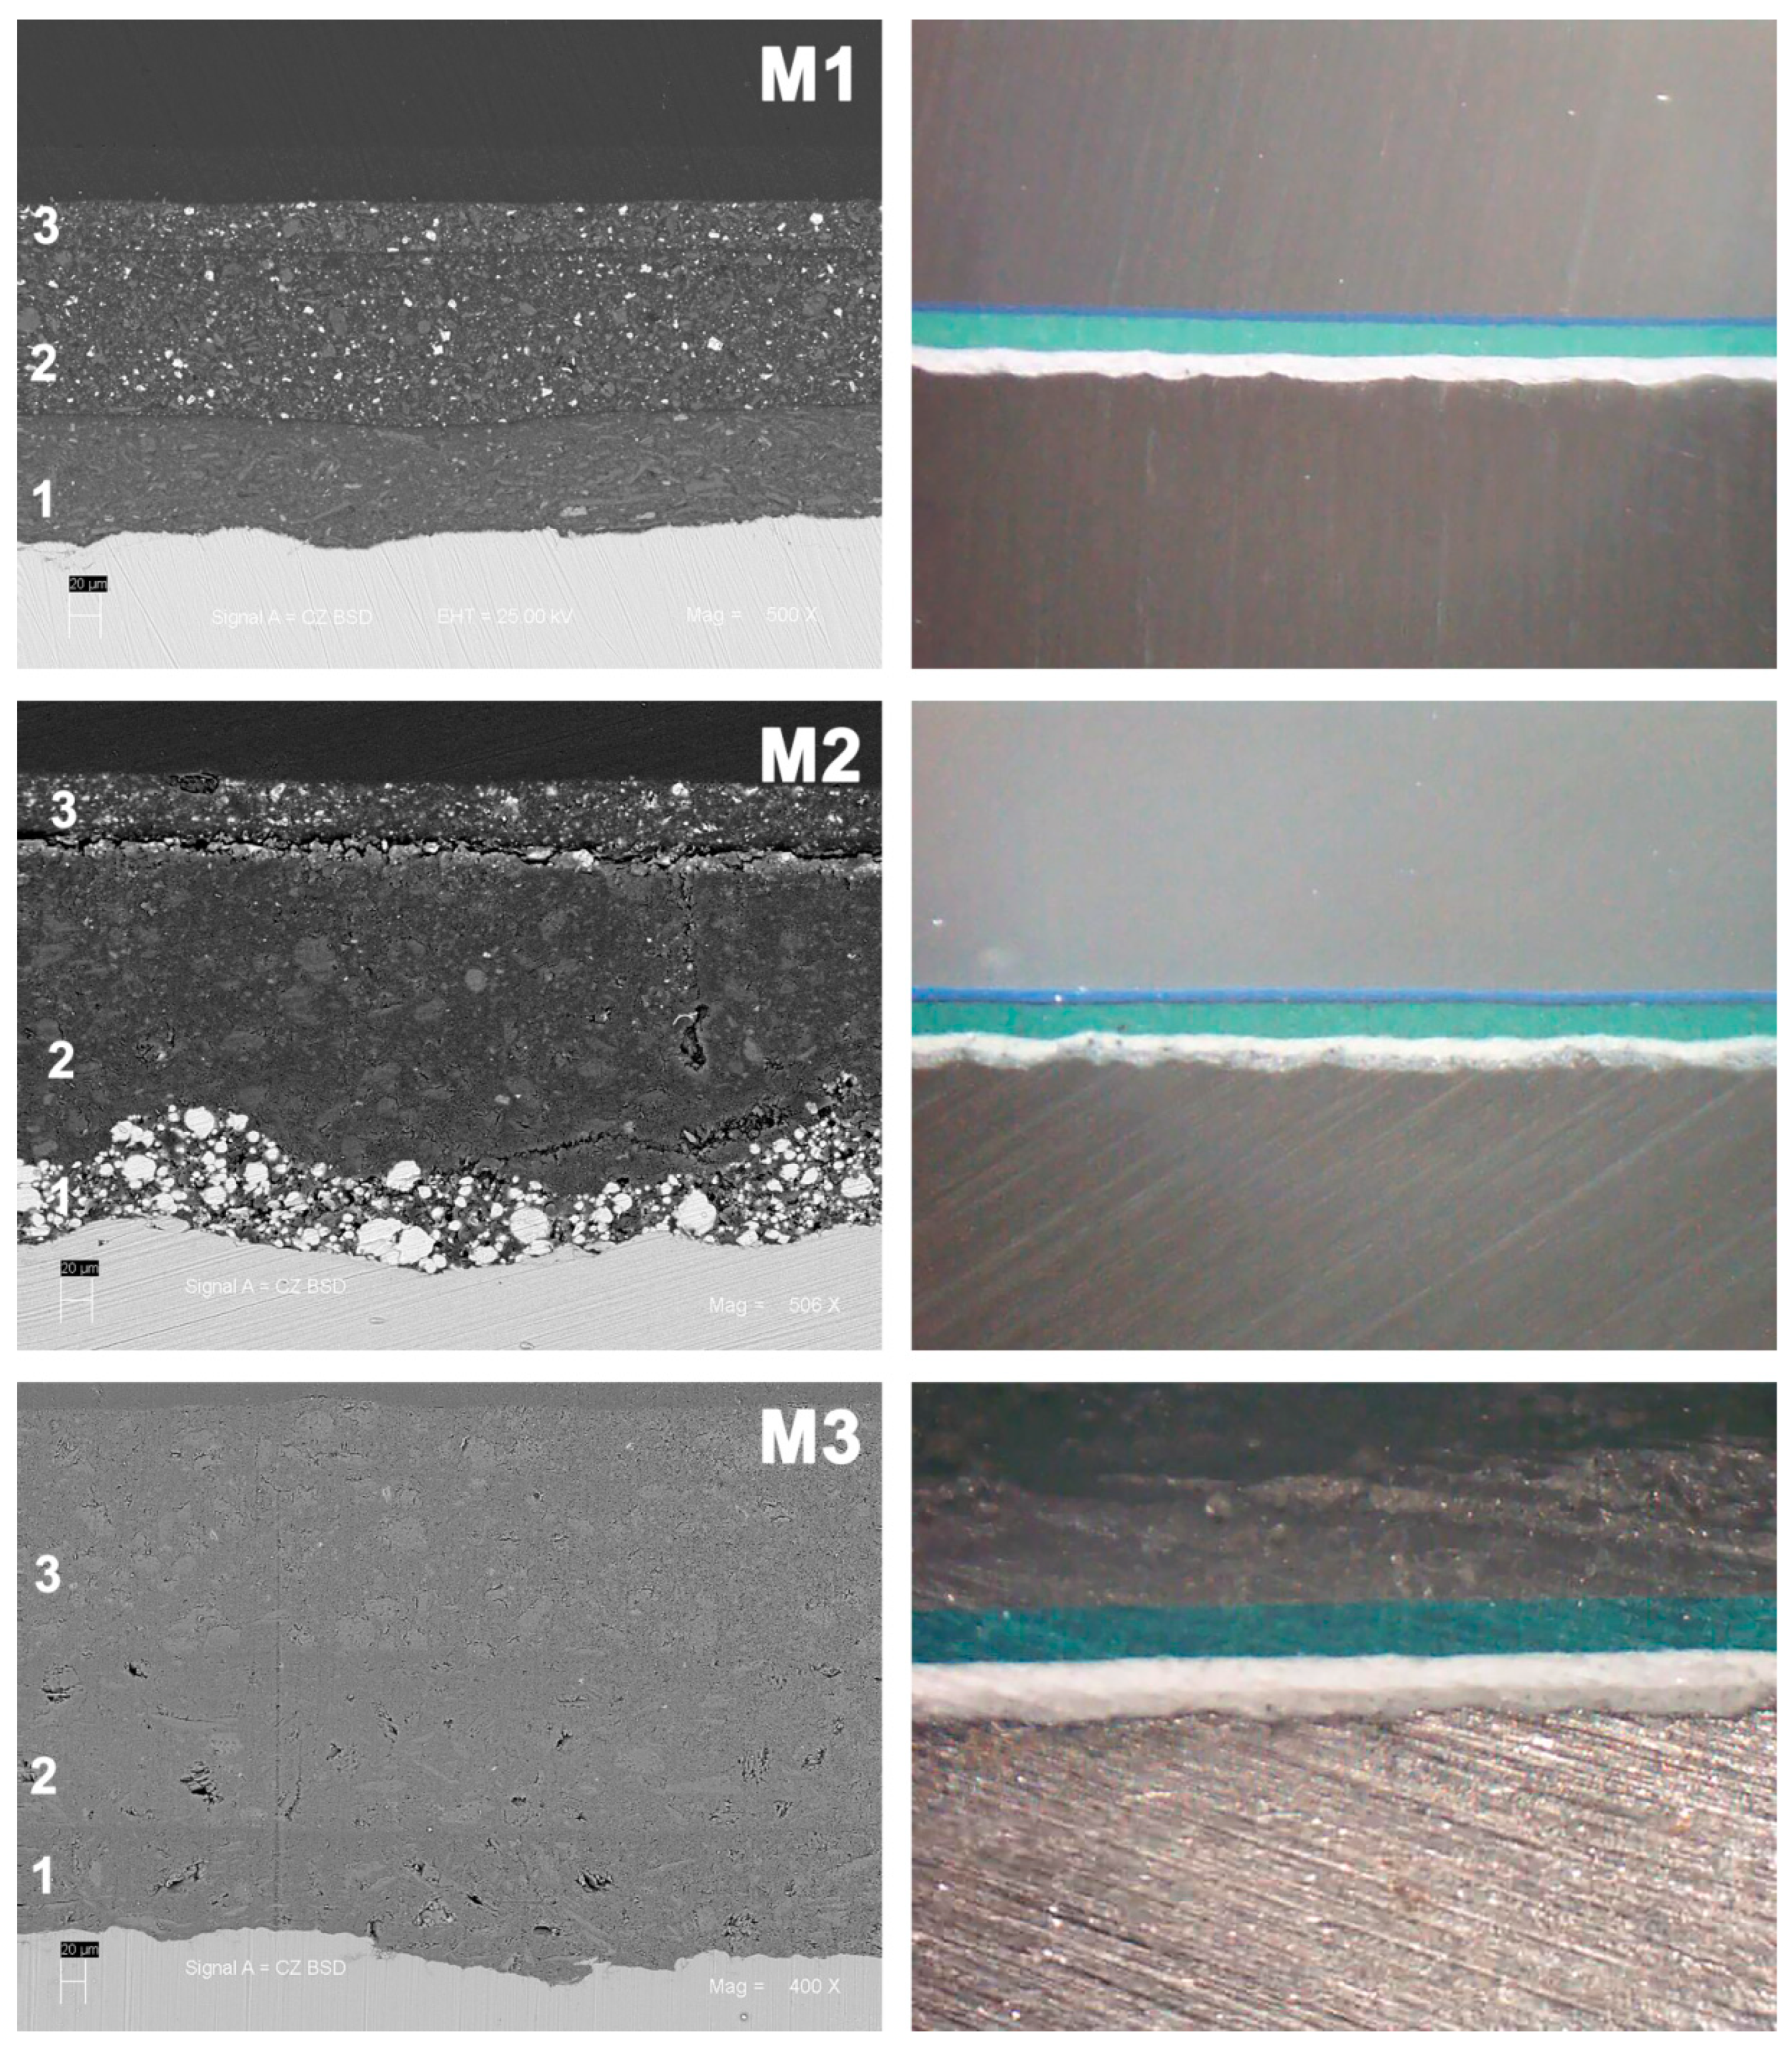
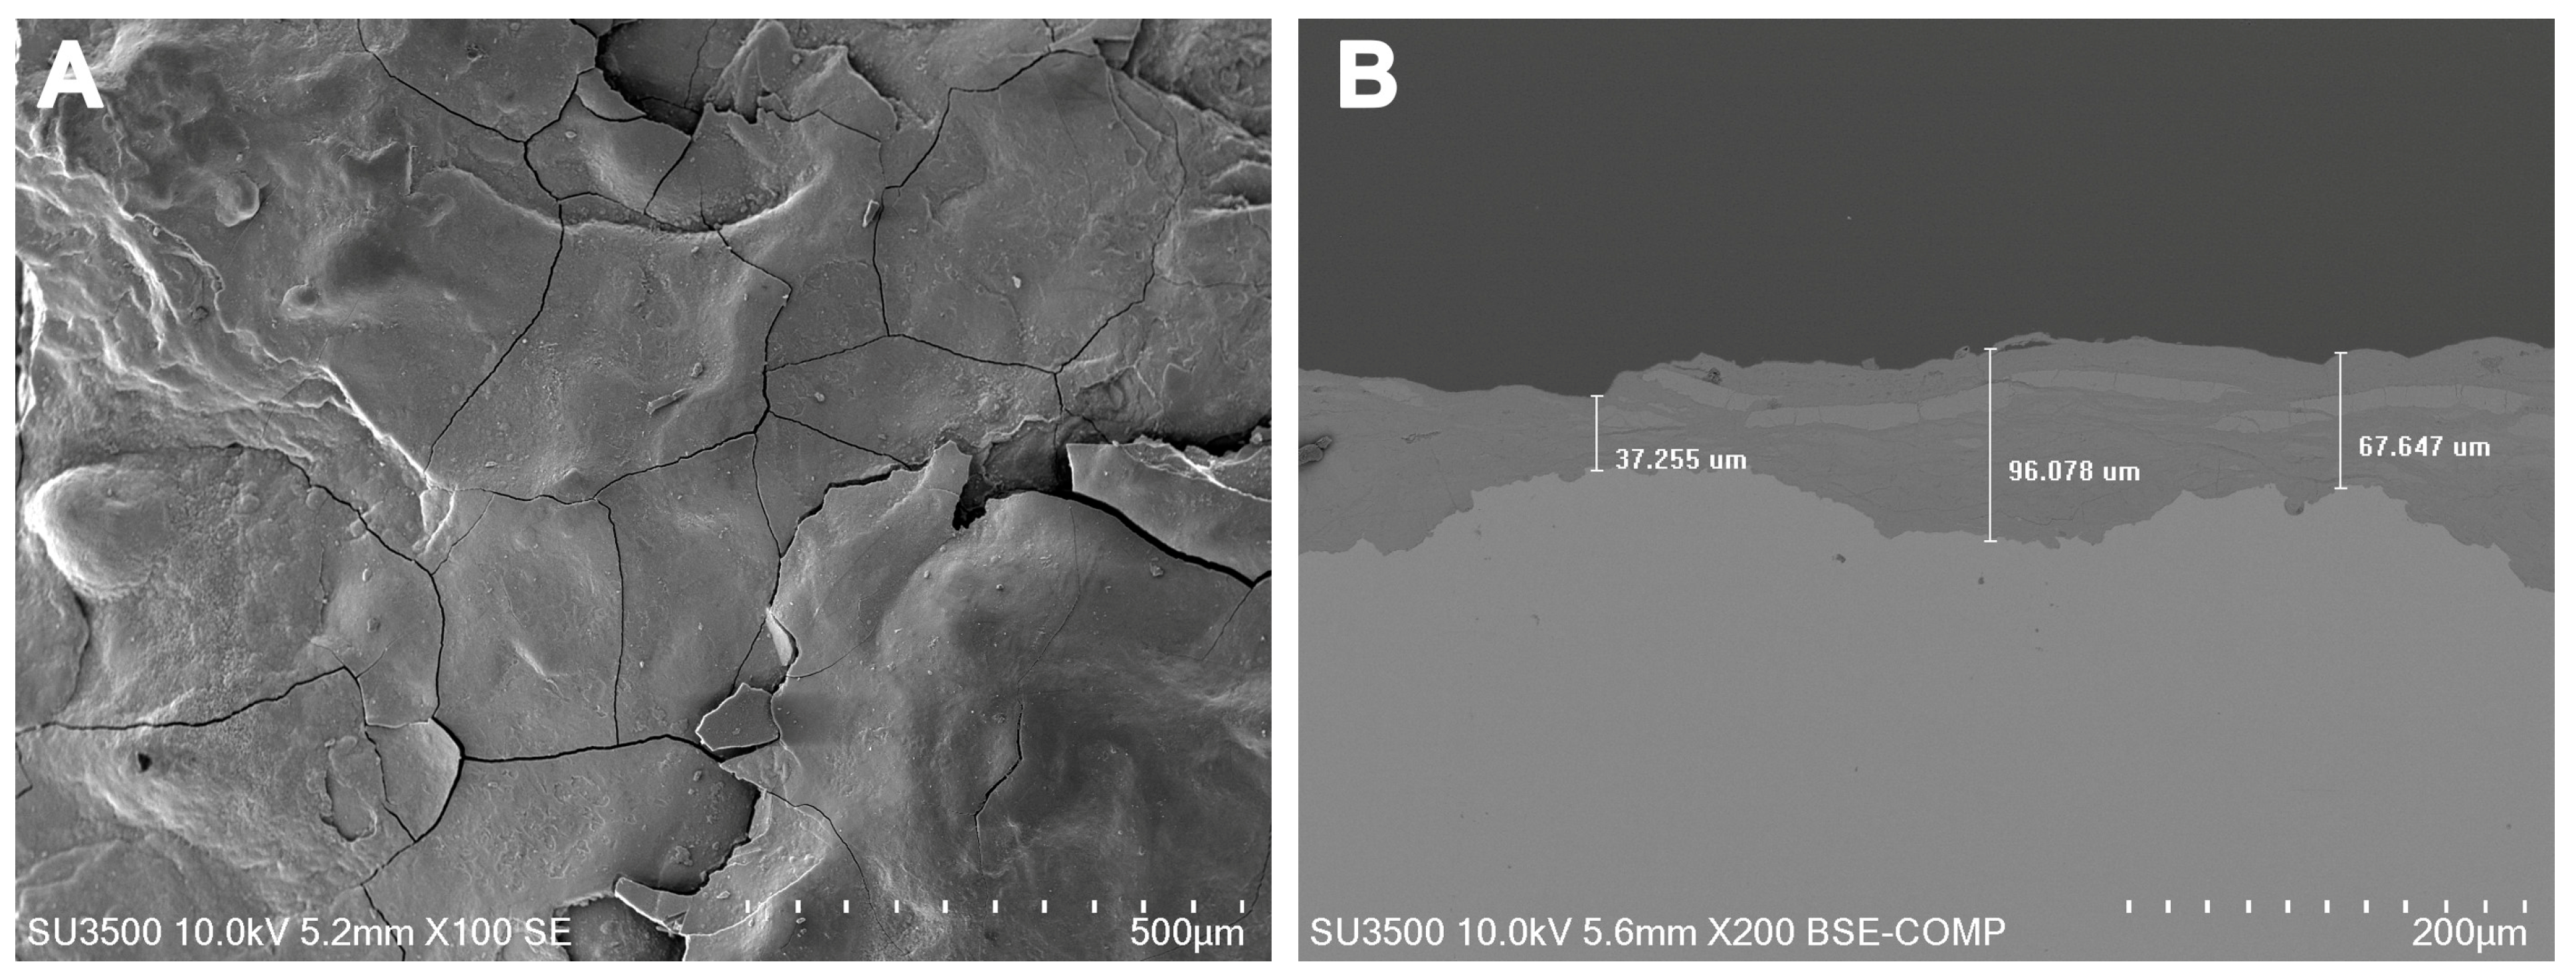
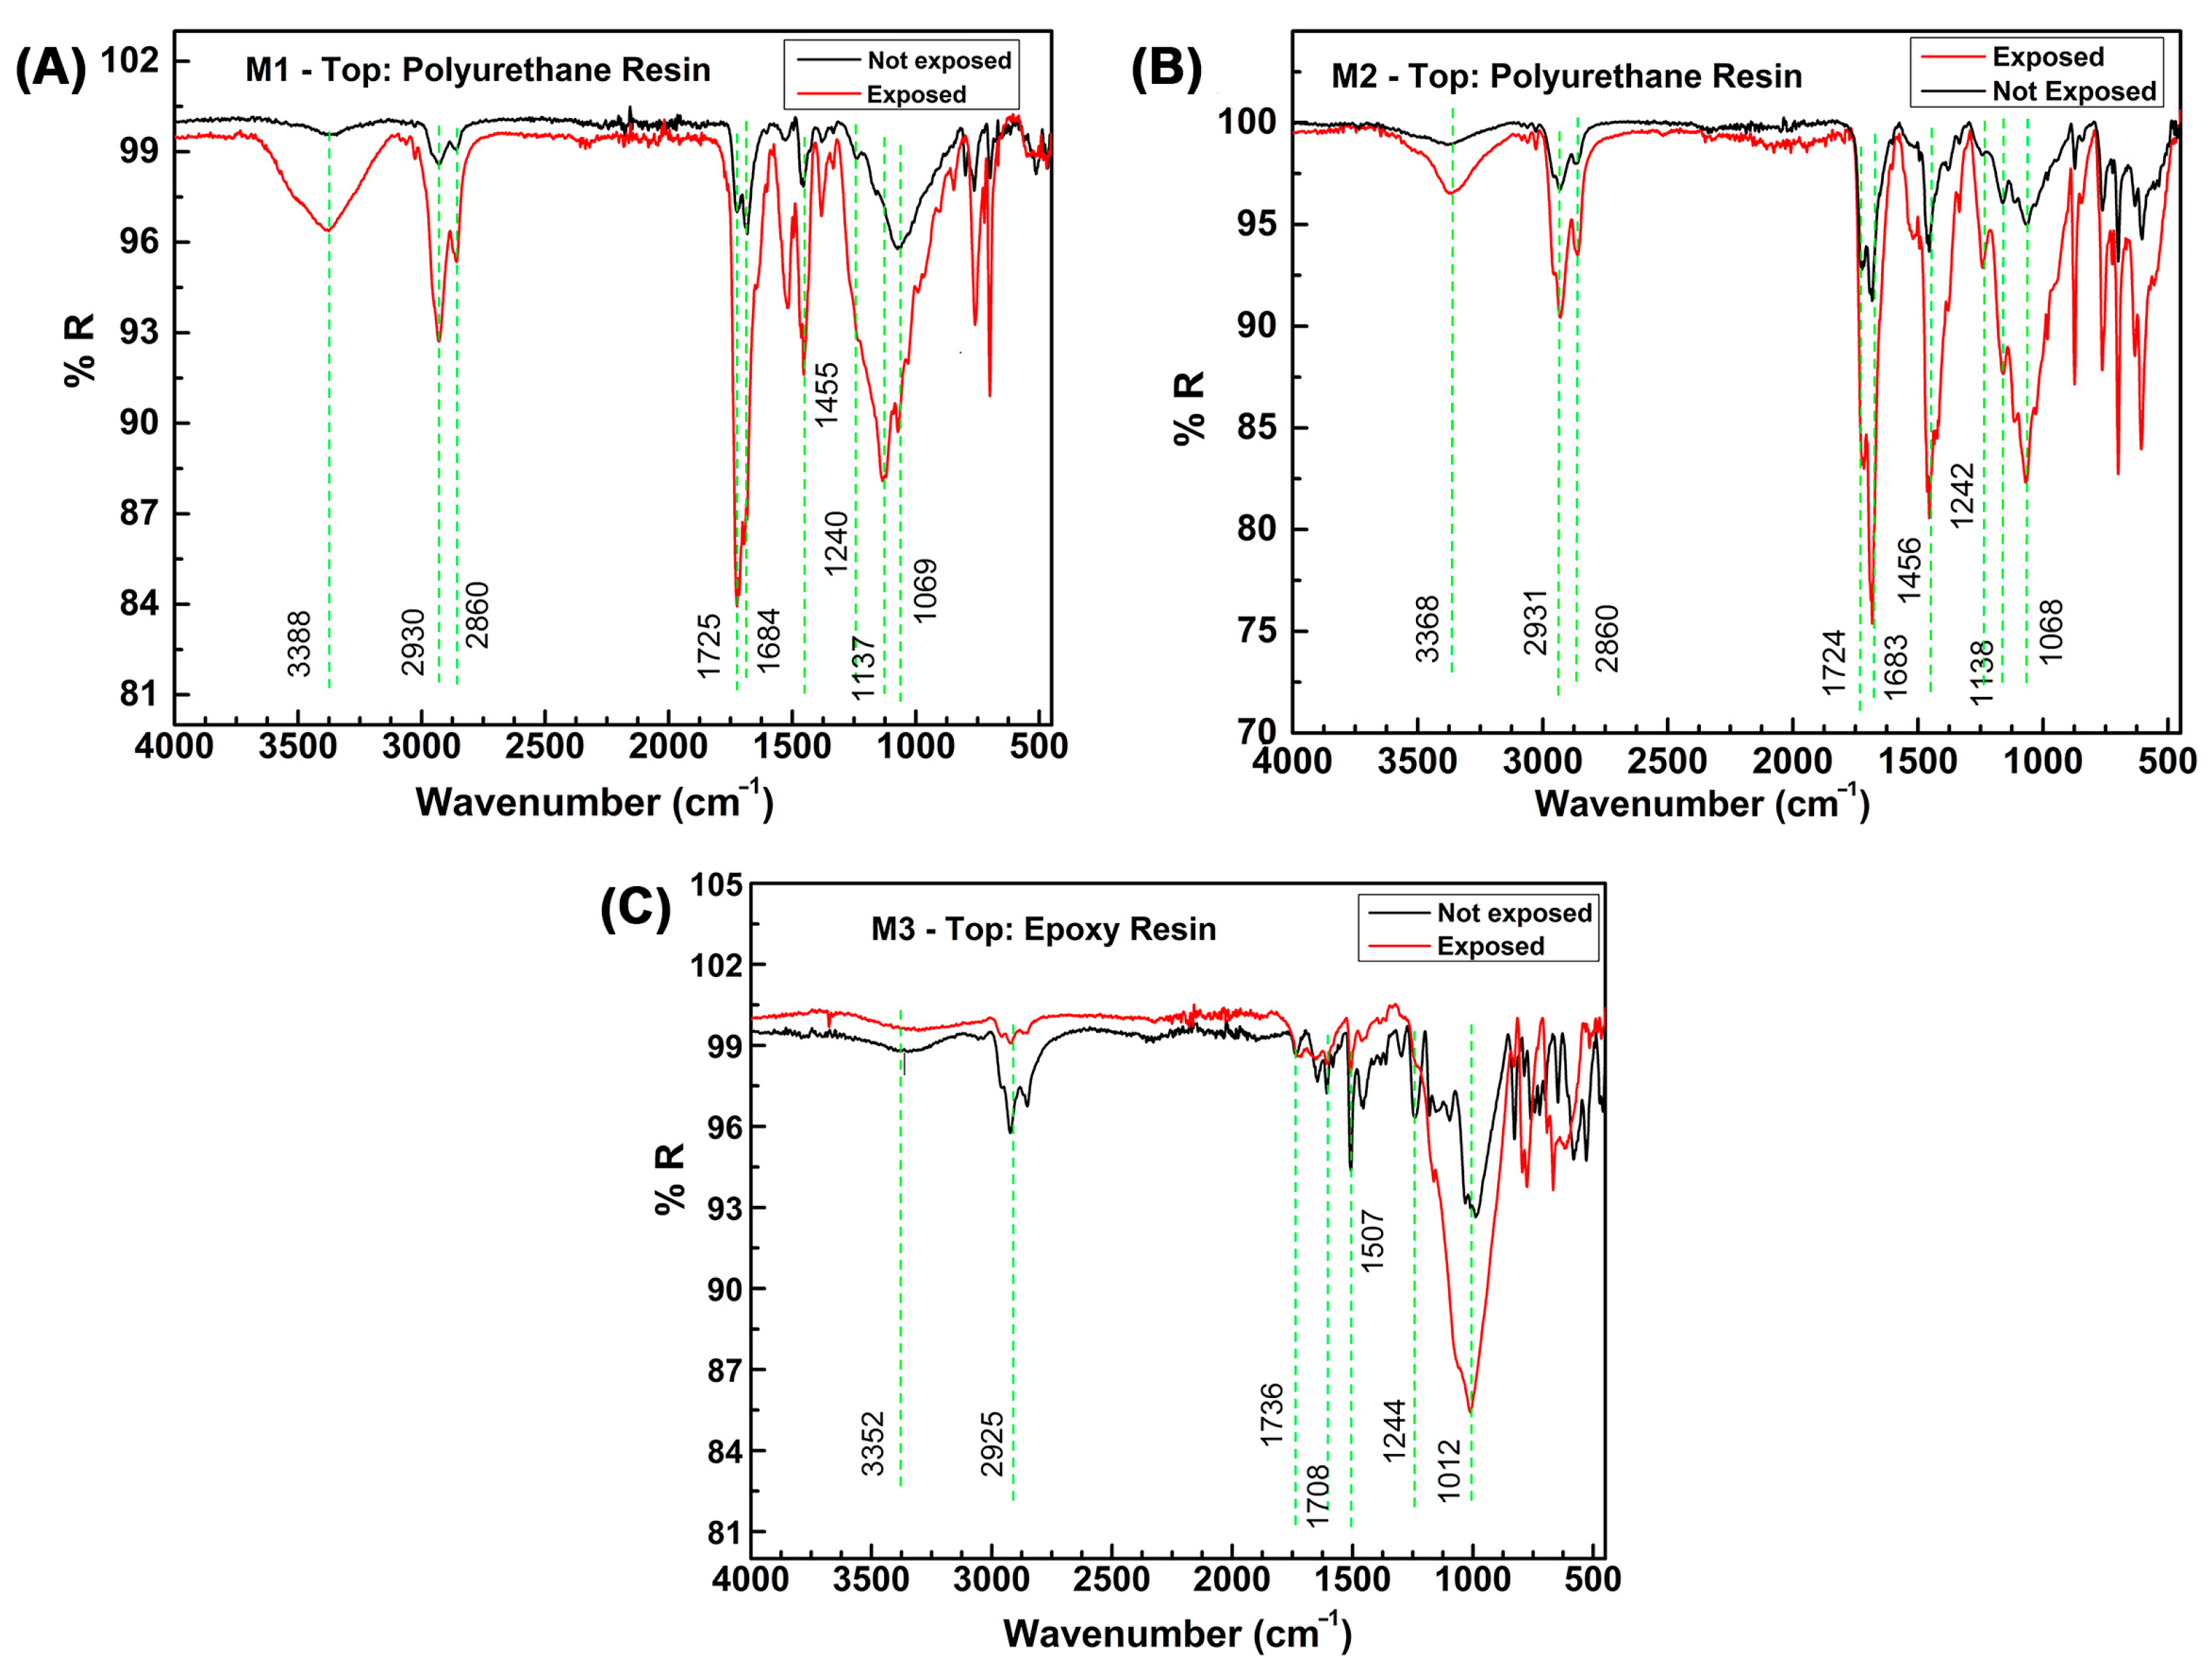
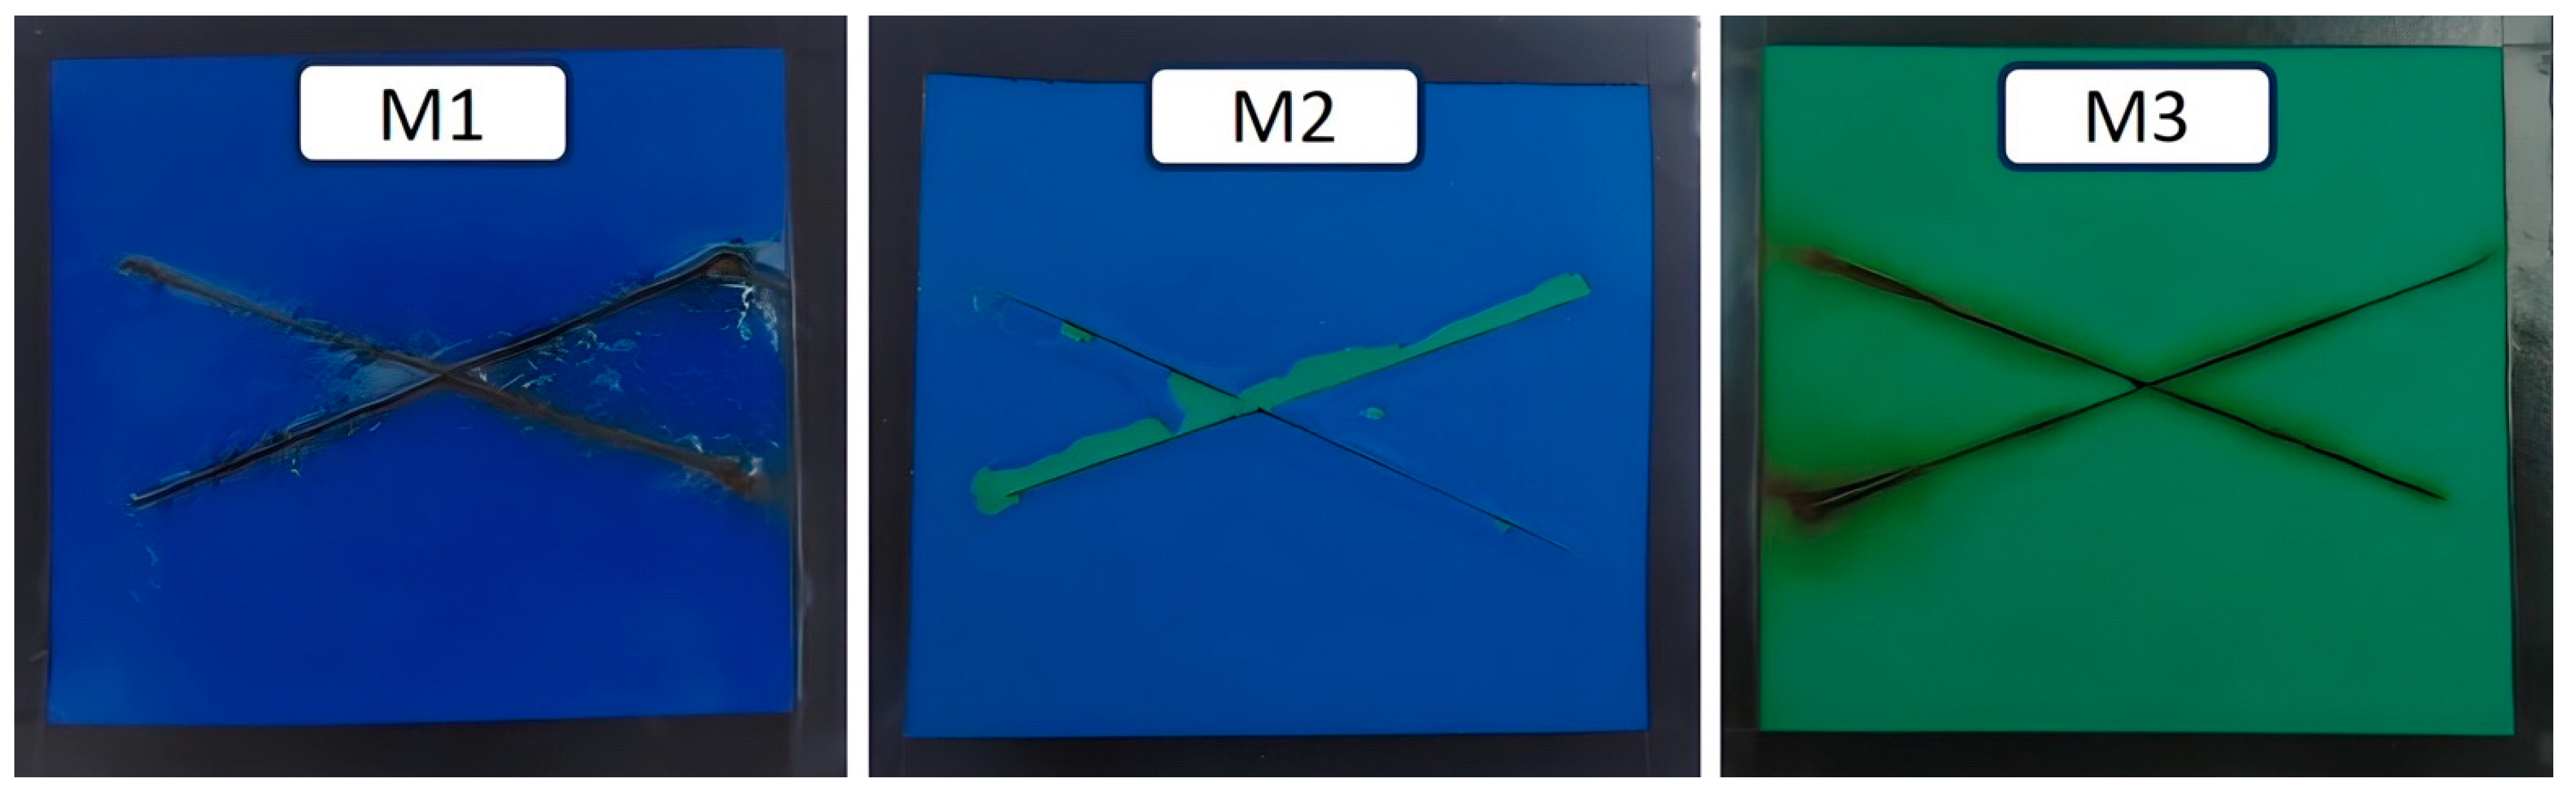
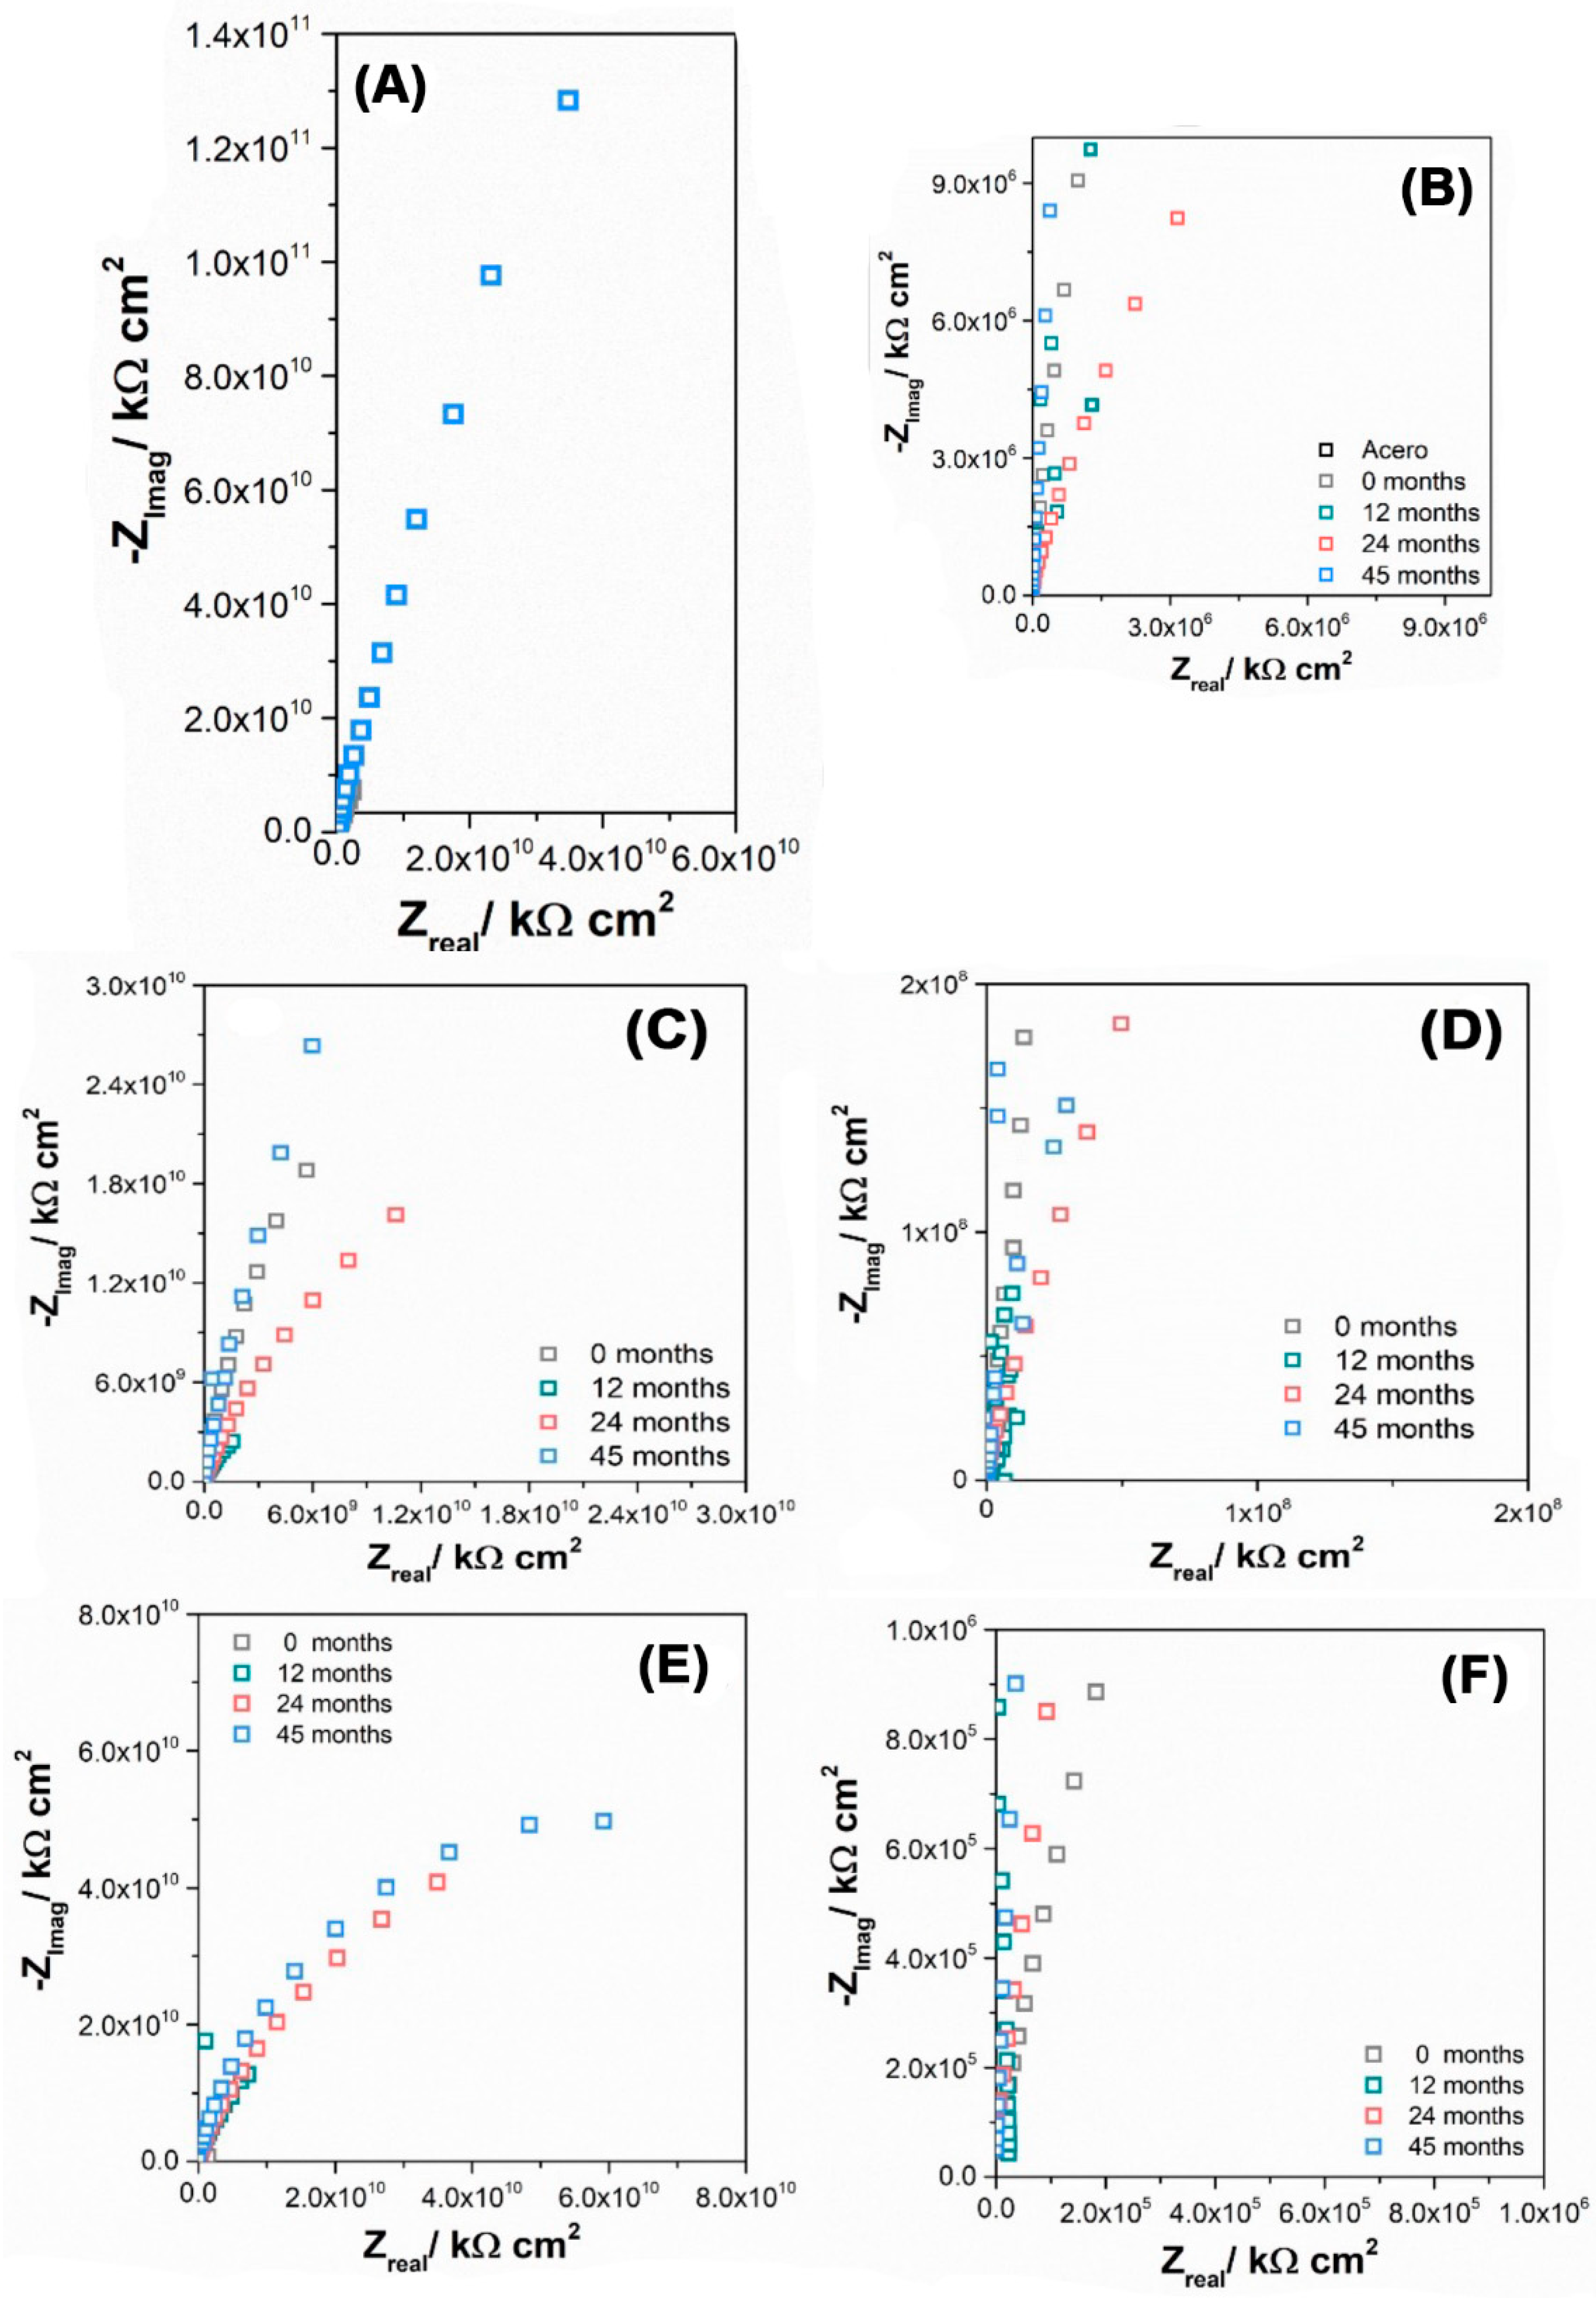
3.3. Evaluation of Coating Deterioration
- (i)
- Excellent protection if log |Z|0.1 is >10;
- (ii)
- Good protection if log |Z|0.1 is >8;
- (iii)
- Poor protection if log |Z|0.1 is <4.
4. Conclusions
Supplementary Materials
Author Contributions
Funding
Institutional Review Board Statement
Informed Consent Statement
Data Availability Statement
Acknowledgments
Conflicts of Interest
References
- Mikhailov, A.A.; Strekalov, P.V.; Panchenko, Y.M. Atmospheric corrosion of metals in regions of cold and extremely cold climate (a review). Prot. Met. 2008, 44, 644–659. [Google Scholar] [CrossRef]
- Morcillo, M. Programa Iberoamericano de Ciência y Tecnologia para el Desarrollo. In Corrosion y Proteccion de Metales en las Atmosferas de Iberoamerica; CYTED: Madrid, España, 1998; ISBN 8493044814. [Google Scholar]
- Morcillo, M.; Chico, B.; de la Fuente, D.; Almeida, E.; Joseph, G.; Rivero, S.; Rosales, B. Atmospheric corrosion of reference metals in Antarctic sites. Cold Reg. Sci. Technol. 2004, 40, 165–178. [Google Scholar] [CrossRef]
- Morcillo, M. Atmospheric Corrosion: Their Prevention by Coating; Proyectings MICAT & Patina; CYTED: Madrid, España, 15.
- Momber, A.W.; Irmer, M.; Glück, N. Performance characteristics of protective coatings under low-temperature offshore conditions. Part 1: Experimental set-up and corrosion protection performance. Cold Reg. Sci. Technol. 2016, 127, 76–82. [Google Scholar] [CrossRef]
- Momber, A.W.; Irmer, M.; Glück, N. Performance characteristics of protective coatings under low-temperature offshore conditions. Part 2: Surface status, hoarfrost accretion and mechanical properties. Cold Reg. Sci. Technol. 2016, 127, 109–114. [Google Scholar] [CrossRef]
- Momber, A.W.; Irmer, M.; Glück, N.; Plagemann, P. Corrosion Protection Performance of Organic Offshore Coating Systems at −60 °C Temperature Shock. J. Offshore Mech. Arct. Eng. 2016, 138, 64501. [Google Scholar] [CrossRef]
- Sun, Y.; Man, C.; Kong, D.; Cui, Z.; Wang, X.; Dong, C.; Cui, H. Correlation between low-temperature anticorrosion performance and mechanical properties of composite coatings reinforced by modified Fe3O4. Prog. Org. Coat. 2022, 165, 106737. [Google Scholar] [CrossRef]
- Yu, M.; Fan, C.; Ge, F.; Lu, Q.; Wang, X.; Cui, Z. Anticorrosion behavior of organic offshore coating systems in UV, salt spray and low temperature alternation simulated Arctic offshore environment. Mater. Today Commun. 2021, 28, 102545. [Google Scholar] [CrossRef]
- González-García, Y.; González, S.; Souto, R.M. Electrochemical and structural properties of a polyurethane coating on steel substrates for corrosion protection. Corros. Sci. 2007, 49, 3514–3526. [Google Scholar] [CrossRef]
- Hainsworth, S.V.; Kilgallon, P.J. Temperature-variant scratch deformation response of automotive paint systems. Prog. Org. Coat. 2008, 62, 21–27. [Google Scholar] [CrossRef]
- Gradinaru, L.M.; Vlad, S.; Spiridon, I.; Petrescu, M. Durability of polyurethane membranes in artificial weathering environment. Polym. Test. 2019, 80, 106144. [Google Scholar] [CrossRef]
- Xue, X.; Lu, J. Electrochemical Impedance Spectroscopy Investigation of a Polyurethane Coating on Bridge 16Mnq Steel Surface. Int. J. Electrochem. Sci. 2017, 12, 3179–3187. [Google Scholar] [CrossRef]
- Shi, X.; Nguyen, T.A.; Suo, Z.; Liu, Y.; Avci, R. Effect of nanoparticles on the anticorrosion and mechanical properties of epoxy coating. Surf. Coat. Technol. 2009, 204, 237–245. [Google Scholar] [CrossRef]
- Man, C.; Wang, Y.; Li, W.; Kong, D.; Yao, J.; Grothe, H.; Cui, Z.; Wang, X.; Dong, C. The anti-corrosion performance of the epoxy coating enhanced via 5-Amino-1,3,4-thiadiazole-2-thiol grafted graphene oxide at ambient and low temperatures. Prog. Org. Coatings 2021, 159, 106441. [Google Scholar] [CrossRef]
- Zhang, S.; He, Y.; Zhang, T.; Wang, G.; Du, X. Long-Term Atmospheric Corrosion Behavior of Epoxy Prime Coated Aluminum Alloy 7075-T6 in Coastal Environment. Materials 2018, 11, 965. [Google Scholar] [CrossRef] [PubMed]
- Vera, R.; Cruz, E.; Bagnara, M.; Araya, R.; Henríquez, R.; Díaz-Gómez, A.; Rojas, P. Evaluation of Anticorrosive Coatings on Carbon Steel in Marine Environments: Accelerated Corrosion Test and Field Exposure. Int. J. Electrochem. Sci. 2018, 13, 898–914. [Google Scholar] [CrossRef]
- Takahashi, M.; Deguchi, H.; Hayashi, Y.; Kimura, A.; Hanaki, K.; Tsuchiya, H.; Yamashita, M.; Fujimoto, S. Corrosion behavior of carbon steel coated with a zinc-rich paint containing metallic compounds under wet and dry cyclic conditions. Mater. Corros. 2021, 72, 1787–1795. [Google Scholar] [CrossRef]
- Aparna, A.; Sethulekshmi, A.S.; Saritha, A.; Joseph, K. Recent advances in superhydrophobic epoxy based nanocomposite coatings and their applications. Prog. Org. Coat. 2022, 166, 106819. [Google Scholar] [CrossRef]
- Fihri, A.; Bovero, E.; Al-Shahrani, A.; Al-Ghamdi, A.; Alabedi, G. Recent progress in superhydrophobic coatings used for steel protection: A review. Colloids Surf. A Physicochem. Eng. Asp. 2017, 520, 378–390. [Google Scholar] [CrossRef]
- ISO12944-5; Paints and Varnishes. Corrosion Protection of Steel Structures by Protective Paint Systems. ISO: Geneva, Switzerland, 2000.
- ASTM G62-07; Standard Test Methods for Holiday Detection in Pipeline Coatings. ASTM International: West Conshohocken, PN, USA, 2013.
- ISO 9223; Corrosion of Metals and Alloys—Classification, Determination and Estimation. ISO: Geneva, Switzerland, 2002.
- ASTM G50-20; Standard Practice for Conducting Atmospheric Corrosion Tests on Metals. ASTM International: West Conshohocken, PN, USA, 2020.
- ISO 9226:2012; Corrosion of Metals and Alloys—Corrosivity of Atmospheres—Determination of Corrosion Rate of Standard Specimens for the Evaluation of Corrosivity. ISO: Geneva, Switzerland, 2012.
- ISO 2808; Paints and Varnishes—Determination of Film Thickness. ISO: Geneva, Switzerland, 2007.
- ASTM; Farrakhov, R.; Melnichuk, O.; Parfenov, E.; Mukaeva, V.; Raab, A.; Sheremetyev, V.; Zhukova, Y.; Prokoshkin, S.; Lin, M.H.; et al. D4541-09: Standard Test Method for Pull-Off Strength of Coatings Using Portable Adhesion. Mater. Trans. 2021, 257, 2904–2905. [Google Scholar] [CrossRef]
- ASTM D714-02; Standard Test Method for Evaluating Degree of Blistering of Paints. ASTM International: West Conshohocken, PN, USA, 2006.
- ASTM D4060; Standard Test Method for Abrasion Resistance of Organic Coatings by the Taber Abraser. ASTM International: West Conshohocken, PN, USA, 2014. [CrossRef]
- Rosales, B.; Fernández, A.; Moriena, G. Corrosión marina de acero, Zn, Cu y Al en la Antártida. In Proceedings of the 2nd NACE Latin-American Region Corrosion Congress, NACE, LA, USA, September 1996. [Google Scholar]
- Panchenko, Y.M.; Marshakov, A.I.; Igonin, T.N.; Kovtanyuk, V.V.; Nikolaeva, L.A. Long-term forecast of corrosion mass losses of technically important metals in various world regions using a power function. Corros. Sci. 2014, 88, 306–316. [Google Scholar] [CrossRef]
- Panchenko, Y.M.; Marshakov, A.I. Long-term prediction of metal corrosion losses in atmosphere using a power-linear function. Corros. Sci. 2016, 109, 217–229. [Google Scholar] [CrossRef]
- Gießgen, T.; Mittelbach, A.; Höche, D.; Zheludkevich, M.; Kainer, K.U. Enhanced predictive corrosion modeling with implicit corrosion products. Mater. Corros. 2019, 70, 2247–2255. [Google Scholar] [CrossRef]
- Martínez, C.; Briones, F.; Villarroel, M.; Vera, R. Effect of Atmospheric Corrosion on the Mechanical Properties of SAE 1020 Structural Steel. Materials 2018, 11, 591. [Google Scholar] [CrossRef]
- Morcillo, M.; Almeida, E.; Rosales, B.; Uruchurtu, J.; Marrocos, M. Corrosion y Proteccion de Metales en las Atmosferas de Iberoamerica, Parte I; CYTED: Madrid, España, 1998; ISBN 8493044814. [Google Scholar]
- Marco, J.; Gracia, M.; Gancedo, J.; Martín-Luengo, M.; Joseph, G. Characterization of the corrosion products formed on carbon steel after exposure to the open atmosphere in the Antarctic and Easter Island. Corros. Sci. 2000, 42, 753–771. [Google Scholar] [CrossRef]
- Morcillo, M.; Alcántara, J.; Díaz, I.; Chico, B.; Simancas, J.; De la Fuente, D. Marine atmospheric corrosion of carbon steels. Rev. Metal. 2015, 51, e045. [Google Scholar] [CrossRef]
- ISO 4628-2; Paints and Varnishes—Evaluation of Degradation of Coatings—Designation of Quantity and Size of Defects, and of Intensity of Uniform Changes in Appearance—Part 2: ASSESSMENT of Degree of Blistering. ISO: Geneva, Switzerland, 2016.
- ISO 4628-3; Paints and Varnishes —Evaluation of Degradation of Coatings —Designation of Quantity and Size of Defects, and of Intensity of Uniform Changes in Appearance—Part 3: Assessment of Degree of Rusting. ISO: Geneva, Switzerland, 2016.
- ISO 4628-4; Paints and Varnishes—Evaluation of Degradation of Coatings—Designation of Quantity and Size of Defects, and of Intensity of Uniform Changes in Appearance—Part 4: Assessment of Degree of Cracking. ISO: Geneva, Switzerland, 2016.
- ISO 4628-5; Paints and Varnishes—Evaluation of Degradation of Coatings—Designation of Quantity and Size of Defects, and of Intensity of Uniform Changes in Appearance—Part 5: Assessment of Degree of Flaking. ISO: Geneva, Switzerland, 2016.
- ISO 4628-6; Paints and Varnishes—Corrosion Protection of Steel Structures by Protective Paint Systems—Part 6: Laboratory Performance Test Methods. ISO: Geneva, Switzerland, 2018.
- Negele, O.; Funke, W. Internal stress and wet adhesion of organic coatings. Prog. Org. Coat. 1996, 28, 285–289. [Google Scholar] [CrossRef]
- Mansfeld, F.; Xiao, H.; Han, L.T.; Lee, C.C. Electrochemical impedance and noise data for polymer coated steel exposed at remote marine test sites. Prog. Org. Coat. 1997, 30, 89–100. [Google Scholar] [CrossRef]
- van der Wel, G.K.; Adan, O.C.G. Moisture in organic coatings—A review. Prog. Org. Coat. 1999, 37, 1–14. [Google Scholar] [CrossRef]
- Kada, I.; Trinh, D.; Mallarino, S.; Touzain, S. Physical ageing effect on water uptake and adhesion of epoxy coatings by EIS and the blister test. Electrochim. Acta 2023, 454, 142381. [Google Scholar] [CrossRef]
- Khotbehsara, M.M.; Manalo, A.; Aravinthan, T.; Ferdous, W.; Benmokrane, B.; Nguyen, K.T.Q. Synergistic effects of hygrothermal conditions and solar ultraviolet radiation on the properties of structural particulate-filled epoxy polymer coatings. Constr. Build. Mater. 2021, 277, 122336. [Google Scholar] [CrossRef]
- Xia, L.; Chen, J.; Fan, D.; Kong, M.; Lv, Y.; Huang, Y.; Li, G. Paradox effects of flake carbonyl iron on the photodegradation behaviors of epoxy-based wave-absorbing coatings: Photo-catalytic and UV blocking. Prog. Org. Coatings 2022, 163, 106642. [Google Scholar] [CrossRef]
- Atluri, V.; Jin, J.; Shrimali, K.; Dang, L.; Wang, X.; Miller, J.D. The hydrophobic surface state of talc as influenced by aluminum substitution in the tetrahedral layer. J. Colloid Interface Sci. 2019, 536, 737–748. [Google Scholar] [CrossRef]
- Werner, R.; Krysztafkiewicz, A.; Dec, A.; Jesionowski, T. Effect of surface modification on physicochemical properties of precipitated sodium–aluminium silicate, used as a pigment in acrylic dispersion paints. Dye. Pigment. 2001, 50, 41–54. [Google Scholar] [CrossRef]
- Wang, H.; Feng, P.; Lv, Y.; Geng, Z.; Liu, Q.; Liu, X. A comparative study on UV degradation of organic coatings for concrete: Structure, adhesion, and protection performance. Prog. Org. Coat. 2020, 149, 105892. [Google Scholar] [CrossRef]
- Ghosh, M.; Gupta, S.; Kumar, V.S.K. Studies on the loss of gloss of shellac and polyurethane finishes exposed to UV. Maderas Cienc. Tecnol. 2015, 17, 39–44. [Google Scholar] [CrossRef]
- Nikafshar, S.; McCracken, J.; Dunne, K.; Nejad, M. Improving UV-stability of epoxy coating using encapsulated halloysite nanotubes with organic UV-stabilizers and lignin. Prog. Org. Coat. 2021, 151, 106108. [Google Scholar] [CrossRef]
- Musto, P.; Abbate, M.; Pannico, M.; Scarinzi, G.; Ragosta, G. Improving the photo-oxidative stability of epoxy resins by use of functional POSS additives: A spectroscopic, mechanical and morphological study. Polymer 2012, 53, 5016–5036. [Google Scholar] [CrossRef]
- Li, Y.-Q.; Fu, S.-Y.; Mai, Y.-W. Preparation and characterization of transparent ZnO/epoxy nanocomposites with high-UV shielding efficiency. Polymer 2006, 47, 2127–2132. [Google Scholar] [CrossRef]
- National Aeronautics and Space Administration, Goddard Space Flight Center. Available online: Https://www.cdc.gov/spanish/nceh/especiales/radiacionuv/index.html (accessed on 31 July 2023).
- Watch, N.O. NASA Ozone Watch, 25 September 2017. Available online: https://ozonewatch.gsfc.nasa.gov/monthly/monthly_2017-09_SH.html (accessed on 29 June 2023).
- Watch, N.O. NASA Ozone Watch, 20 September 2018. Available online: https://ozonewatch.gsfc.nasa.gov/monthly/monthly_2018-09_SH.html (accessed on 29 June 2023).
- Watch, N.O. NASA Ozone Watch, 20 October 2016. Available online: https://ozonewatch.gsfc.nasa.gov/monthly/monthly_2016-10_NH.html (accessed on 29 June 2023).
- Watch, N.O. NASA Ozone Watch, 20 October 2015. Available online: https://ozonewatch.gsfc.nasa.gov/monthly/monthly_2015-10_NH.html (accessed on 29 June 2023).
- 11ª Jornada, Febrero 2010; Museo Nacional Centro de Arte Reina Sofía (aut.): Madrid, Spain, 2010; pp. 271–282. ISBN 978-84-8026-430-3.
- Then, E. Polymers in Conservation; Allen, N.S., Edge, M.D., Horie, C.V., Eds.; Royal Society of Chemistry: Cambridge, UK, 1992; p. Xiii + 216. ISBN 0-85186-247-0. [Google Scholar]
- Hu, J.; Li, X.; Gao, J.; Zhao, Q. UV aging characterization of epoxy varnish coated steel upon exposure to artificial weathering environment. Mater. Des. 2009, 30, 1542–1547. [Google Scholar] [CrossRef]
- Felipe, A.; Vicente, J. Pinturas, Barnices y Afines: Composición, formulación y Caracterización. Escuela Técnica Superior de Ingenieros Industriales, Universidad Politécnica de Madrid, (Madrid, Spain). 2016. Available online: https://api.semanticscholar.org/CorpusID:192519932 (accessed on 29 June 2023).
- Muñoz, L.; Sancy, M.; Guerra, C.; Flores, M.; Molina, P.; Muñoz, H.; Bruna, T.; Arcos, C.; Urzúa, M.; Encinas, M.V.; et al. Comparison of the protective efficiency of polymethacrylates with different side chain length for AA2024 alloy. J. Mater. Res. Technol. 2021, 15, 7125–7135. [Google Scholar] [CrossRef]
- Lee, C.-Y.; Lee, S.-K.; Park, J.-H.; Lee, Y.-J. Novel approach to correlate degree of surface deterioration to coating impedance for laboratory test panels coated with two types of primers. Corros. Eng. Sci. Technol. 2012, 47, 411–420. [Google Scholar] [CrossRef]


| C | Si | Mn | P | S | Cr | Ni | Mo | Al |
| 0.185 | 0.136 | 0.388 | 0.014 | 0.008 | 0.032 | 0.020 | 0.002 | 0.037 |
| Cu | Co | Ti | Nb | V | W | Sn | B | Fe |
| 0.012 | 0.008 | 0.001 | <0.001 | 0.002 | 0.009 | 0.012 | 0.0008 | All else |
| System (Corrosivity) | Primer | Intermediate Coat | Top Coat | Average Total Thickness (µm) |
|---|---|---|---|---|
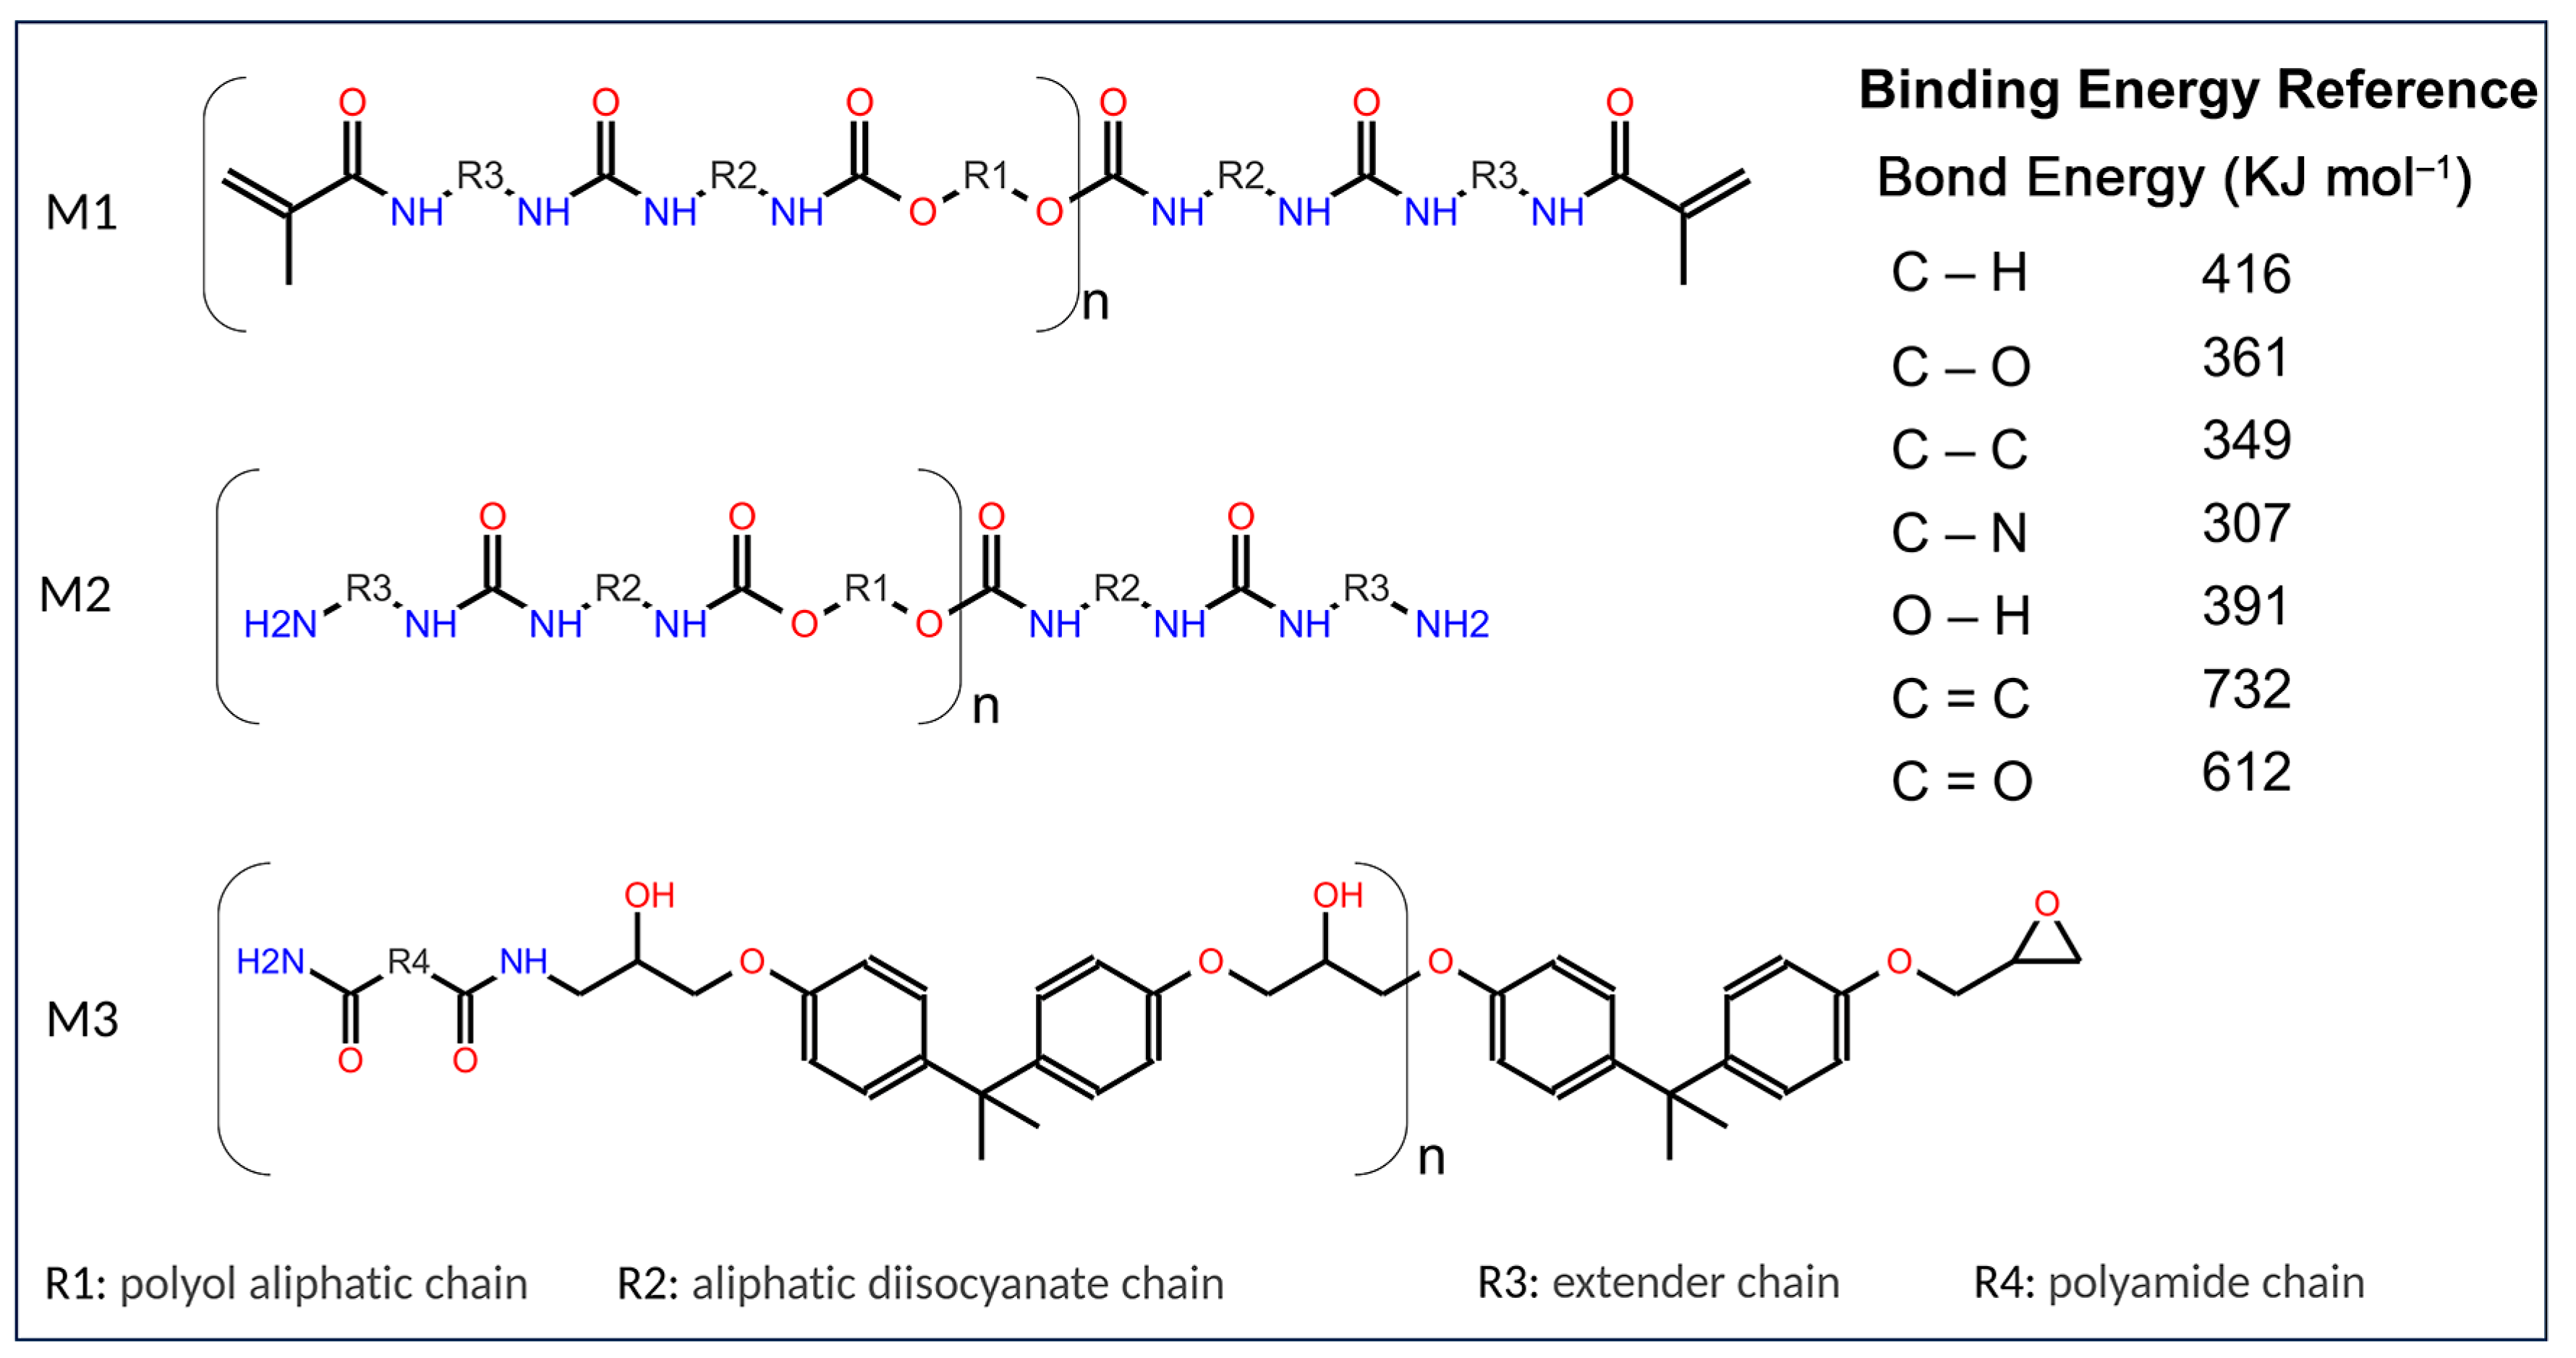
| M1 | Self-priming epoxy | Enamel Epoxy | Polyurethane Acrylic–aliphatic (blue color) | 259 ± 30 |
| M2 | Zn-rich epoxy | Enamel Epoxy | Polyurethane aliphatic (blue color) | 306 ± 37 |
| M3 | Self-priming epoxy | Enamel Epoxy | Epoxy (green color) | 390 ± 26 |
| M1 | M2 | M3 |
|---|---|---|
| Polyurethane aliphatic acrylic | Polyurethane aliphatic | Polyamide epoxy |
| High gloss and chemical resistance | Brilliant | Semi-gloss |
| Solids 65 +/−3% | Solids 67 +/−1% | High solids 80 +/−1% |
| Good color retention and high UV fastness | Good gloss and color retention | Generates a thick, durable, tenacious coating |
| Exposure Period (Years) | Temperature (°C) | RH (%) | V. Wind (m/s) | Cumulative Solar Radiation (kW/m2) | Cumulative Precipitation (mm) |
|---|---|---|---|---|---|
| 1 (2014–2015) | −3.0 | 88.0 | 17.4 | 1368.3 | 867.8 |
| 2 (2015–2016) | −3.0 | 89.0 | 17.9 | 1687.9 | 843.0 |
| 3 (2016–2017) | −1.6 | 89.0 | 22.6 | 1426.5 | 879.2 |
| 4 (2017–2018) | −2.5 | 88.5 | 19.2 | 1389.2 | 858.4 |
| Exposure Period (Years) | Chloride Deposits (mg/m2 Day) | SO2 Deposits (mg/m2día) | TOW (Hours/Year) | Corrosivity Category (ISO 9223) |
|---|---|---|---|---|
| 1 (2014–2015) | 22.536 | 3.365 | 3918.8 | S1P0τ4/C3 |
| 2 (2015–2016) | 35.483 | 2.321 | 4520.4 | S1P0τ4/C3 |
| 3 (2016–2017) | 28.982 | 2.076 | 4921.2 | S1P0τ4/C3 |
| 4 (2017–2018) | 32.479 | 2.856 | 4765.2 | S1P0τ4/C3 |
| Quantity (Density) at 45 Months of Exposure | ||||
|---|---|---|---|---|
| Paint System | Blistering (ISO 4628-2) | Rusting (ISO 4628-3) | Cracking (ISO 4628-4) | Flaking (ISO 4628-5) |
| M1 | 2(S2) | Ri 0 | 1(S1)a | 1(S0)a |
| M2 | 2(S2) | Ri 0 | 1(S1)a | 1(S0)a |
| M3 | 2(S2) | Ri 0 | 1(S1)a | 1(S1)a |
| Initial | 45 Months of Exposure | ||||||
|---|---|---|---|---|---|---|---|
| Paint System | Tensile Strength (MPa) | Type of Failure/Layer | % Failure | Paint System | Tensile Strength (MPa) | Type of Failure/Layer | % Failure |
| M1 | 9.9 |
| 50 20 30 | M1 | 9.6 |
| 100 |
| M2 | 11.7 |
| 80 20 | M2 | 7.5 |
| 100 |
| M3 | 8.9 |
| 90 10 | M3 | 7.7 |
| 90 10 |
| System | θWater (°) | θdiiodometane (°) | γ (Mn/m) | ||
|---|---|---|---|---|---|
| Initial | |||||
| M1 | 75.1 ± 4.2 | 47.3 ± 0.17 | 44.77 ± 5.53 | 30.87 ± 0.65 | 13.89 ± 4.88 |
| M2 | 77.9 ± 6.4 | 67.9 ± 0.14 | 47.23 ± 9.32 | 31.25 ± 1.02 | 15.98 ± 8.29 |
| M3 | 116.5 ± 7.7 | 67.9 ± 0.14 | 40.49 ± 0.32 | 45.96 ± 0.49 | 35.02 ± 0.33 |
| 45 Months | |||||
| M1 | 67.8 ± 0.3 | 55.58 ± 0.24 | 47.25 ± 7.50 | 29.00 ± 0.74 | 18.25 ± 6.76 |
| M2 | 60.3 ± 4.7 | 58.32 ± 0.32 | 51.00 ± 8.69 | 25.89 ± 0.74 | 25.11 ± 7.95 |
| M3 | 84.1 ± 5.8 | 43.56 ± 0.38 | 41.33 ± 5.33 | 35.52 ± 0.96 | 5.81 ± 4.37 |
| Abrasion Index (mg/1000 Cycles) | ||
|---|---|---|
| Paint System | Initial | 45 Months |
| M1 | 102 ± 20 | 140 ± 4 |
| M2 | 150 ± 35 | 220 ± 20 |
| M3 | 142 ± 21 | 260 ± 20 |
| Paint System | Brightness (GU) | Color (CMC) | |
|---|---|---|---|
| Initial | 45 Months | 45 Months | |
| M1 | 86.7 | 80.8 | 5.73 |
| M2 | 65.5 | 30.2 | 1.30 |
| M3 | 11.6 | 1.3 | 4.13 |
| Time (Months) | Probe | |Z|0.1Hz × 1010/Ω cm2 | QCPE/Fs(α−1)cm−2 × 10−11 | |
|---|---|---|---|---|
| 0 | M1 | 2.70 | 0.931 | 7.45 |
| 12 | 1.24 | 0.981 | 3.75 | |
| 24 | 0.13 | 0.953 | 5.63 | |
| 45 | 2.53 | 0.975 | 4.37 | |
| 0 | M2 | 1.05 | 0.923 | 13.9 |
| 12 | 0.31 | 0.929 | 12.4 | |
| 24 | 0.75 | 0.954 | 10.6 | |
| 45 | 1.58 | 0.922 | 7.11 | |
| 0 | M3 | 3.60 | n.d | n.d |
| 12 | 1.48 | 0.991 | 3.39 | |
| 24 | 1.18 | 0.963 | 5.35 | |
| 45 | 1.94 | 0.974 | 4.05 |
Disclaimer/Publisher’s Note: The statements, opinions and data contained in all publications are solely those of the individual author(s) and contributor(s) and not of MDPI and/or the editor(s). MDPI and/or the editor(s) disclaim responsibility for any injury to people or property resulting from any ideas, methods, instructions or products referred to in the content. |
© 2023 by the authors. Licensee MDPI, Basel, Switzerland. This article is an open access article distributed under the terms and conditions of the Creative Commons Attribution (CC BY) license (https://creativecommons.org/licenses/by/4.0/).
Share and Cite
Vera, R.; Bagnara, M.; Henríquez, R.; Muñoz, L.; Rojas, P.; Díaz-Gómez, A. Performance of Anticorrosive Paint Systems for Carbon Steel in the Antarctic Marine Environment. Materials 2023, 16, 5713. https://doi.org/10.3390/ma16165713
Vera R, Bagnara M, Henríquez R, Muñoz L, Rojas P, Díaz-Gómez A. Performance of Anticorrosive Paint Systems for Carbon Steel in the Antarctic Marine Environment. Materials. 2023; 16(16):5713. https://doi.org/10.3390/ma16165713
Chicago/Turabian StyleVera, Rosa, Margarita Bagnara, Rodrigo Henríquez, Lisa Muñoz, Paula Rojas, and Andrés Díaz-Gómez. 2023. "Performance of Anticorrosive Paint Systems for Carbon Steel in the Antarctic Marine Environment" Materials 16, no. 16: 5713. https://doi.org/10.3390/ma16165713
APA StyleVera, R., Bagnara, M., Henríquez, R., Muñoz, L., Rojas, P., & Díaz-Gómez, A. (2023). Performance of Anticorrosive Paint Systems for Carbon Steel in the Antarctic Marine Environment. Materials, 16(16), 5713. https://doi.org/10.3390/ma16165713