
Combined Effects of HA Concentration and Unit Cell Geometry on the Biomechanical Behavior of PCL/HA Scaffold for Tissue Engineering Applications Produced by LPBF


 ,
,  ,
,  , , , and
Abstract
1. Introduction
2. Materials and Methods
2.1. Design and Production
2.2. Morphological and Structural Characterization
2.3. Haralick’s Surface Analysis
2.4. Roughness
2.5. XµCT
2.6. Mechanical Tests
2.7. Biological Tests
2.7.1. Cell Culture and Seeding
2.7.2. Cell Viability
2.7.3. Cell Morphology
2.8. PhC-XµCT
3. Results
3.1. Powder Characterization
3.2. Scaffold Characterization
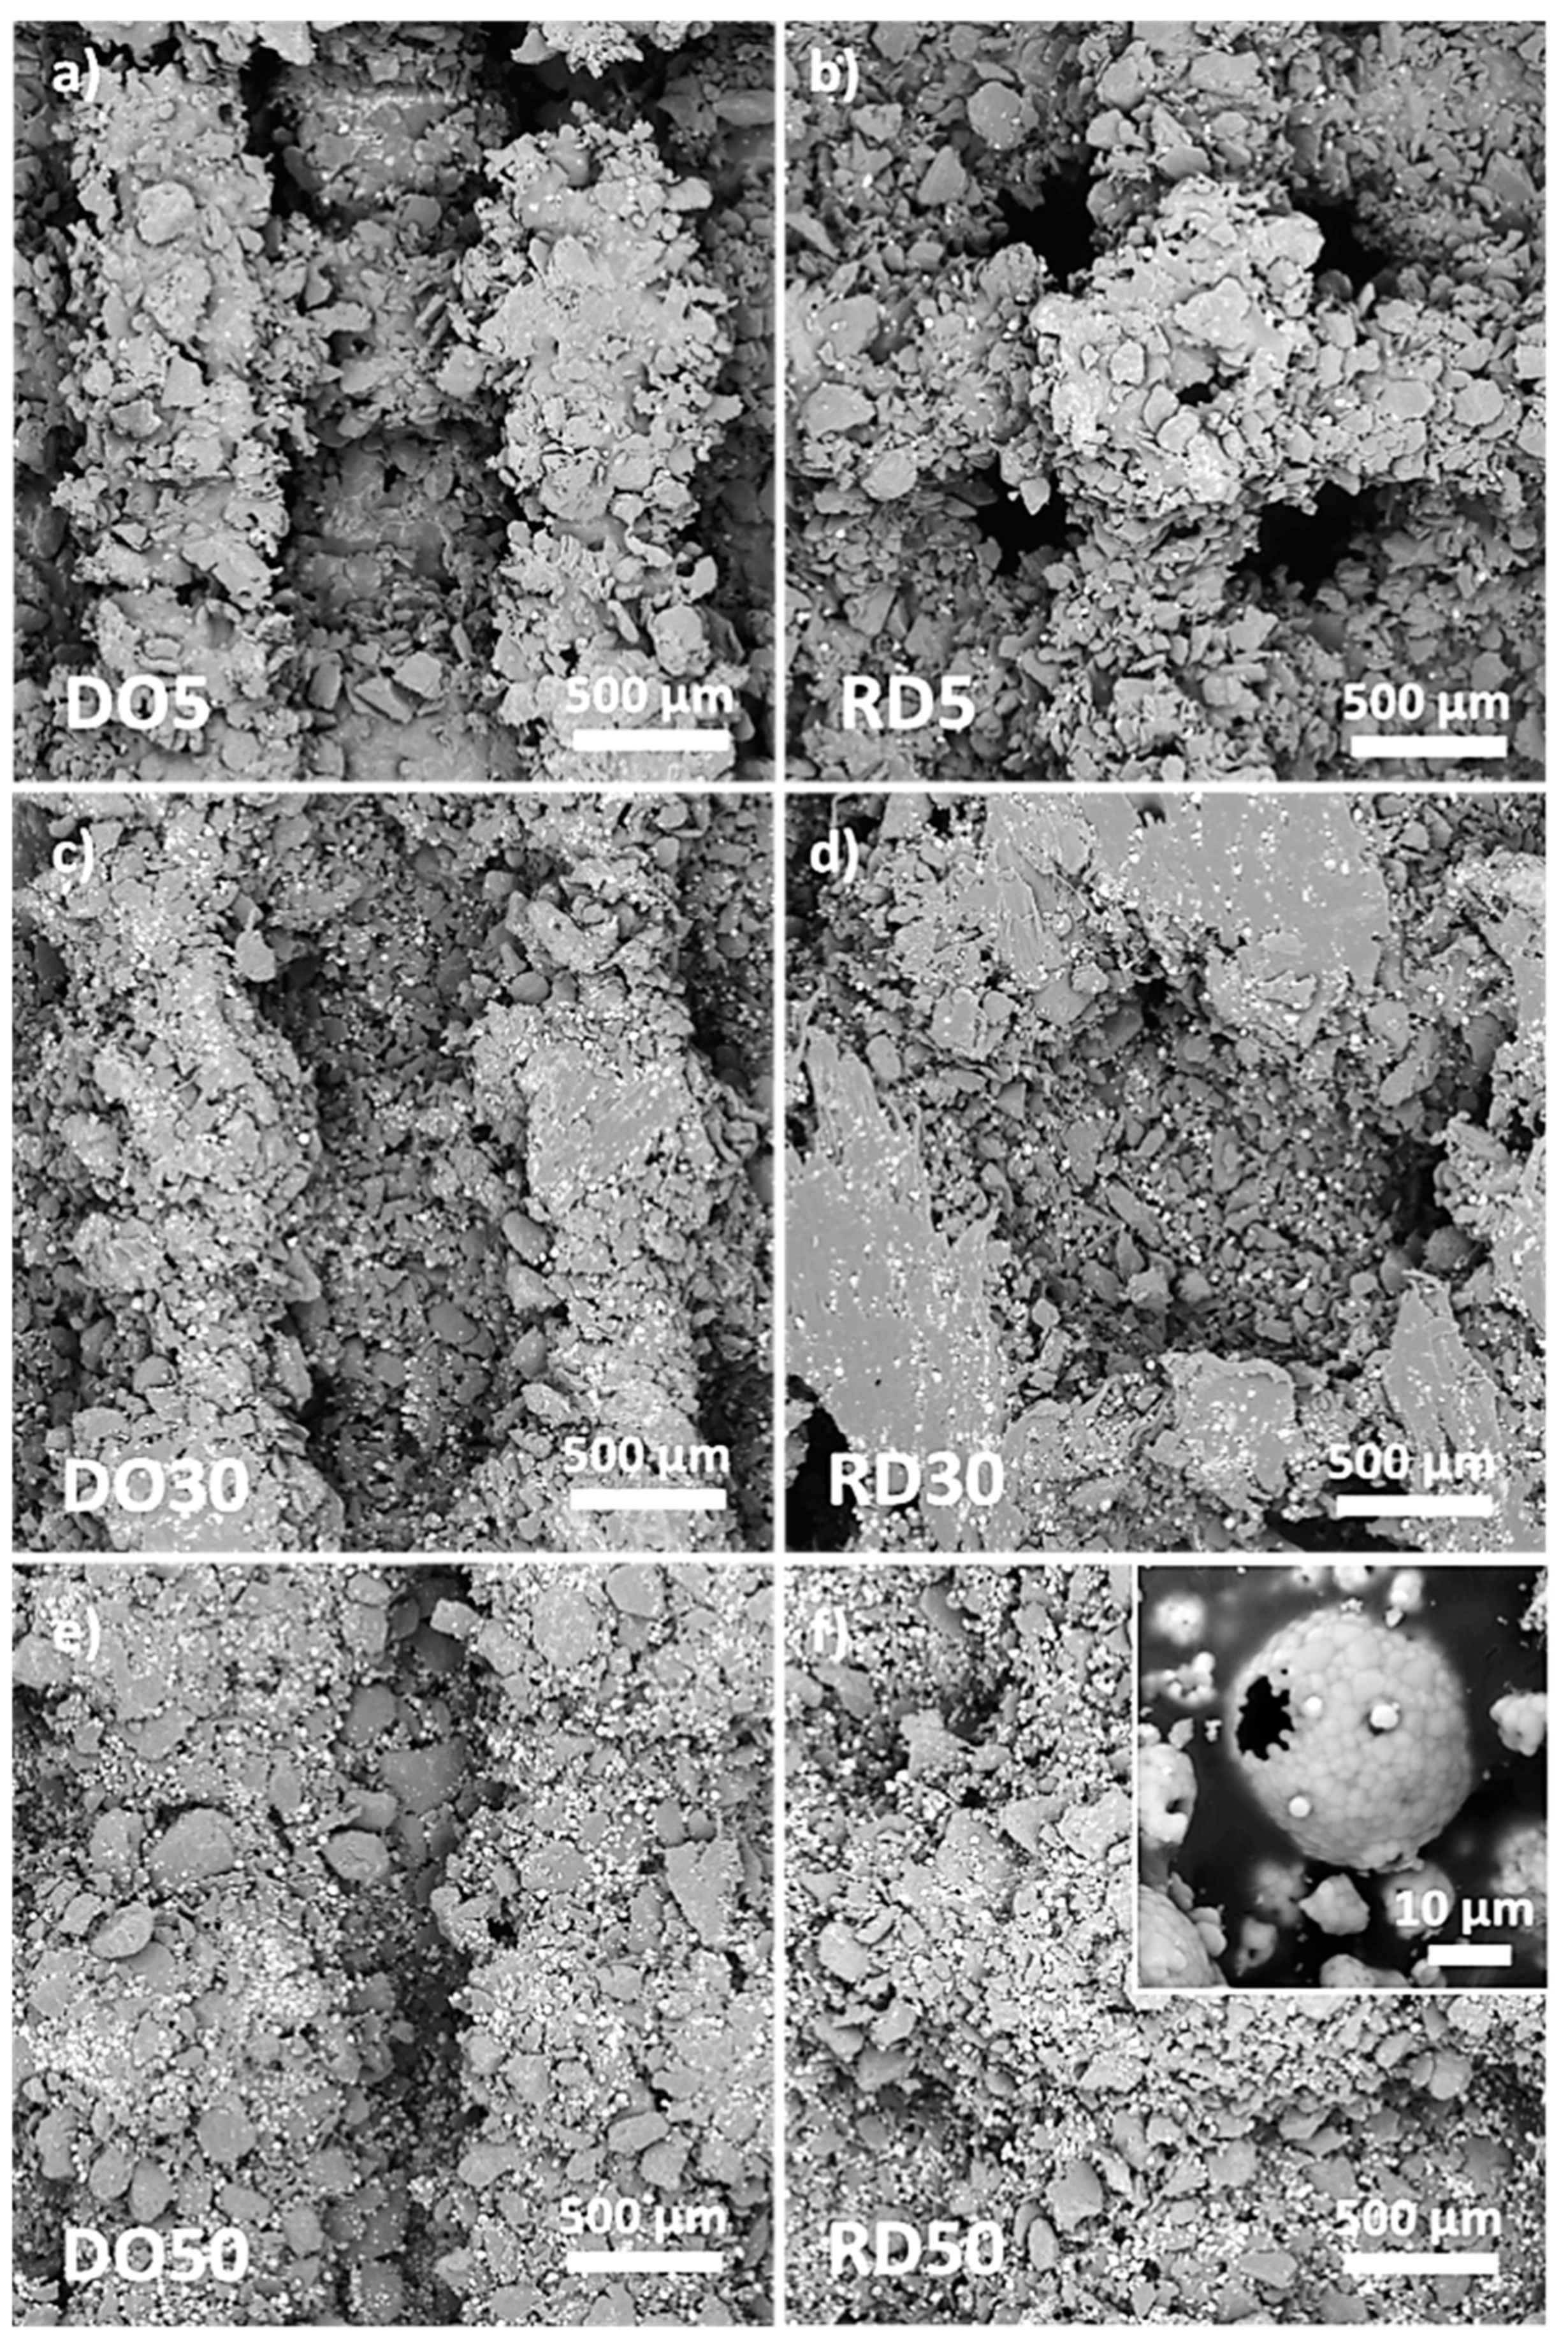
3.2.1. SEM Analysis
3.2.2. Haralick’s Surface Analysis
3.2.3. Roughness
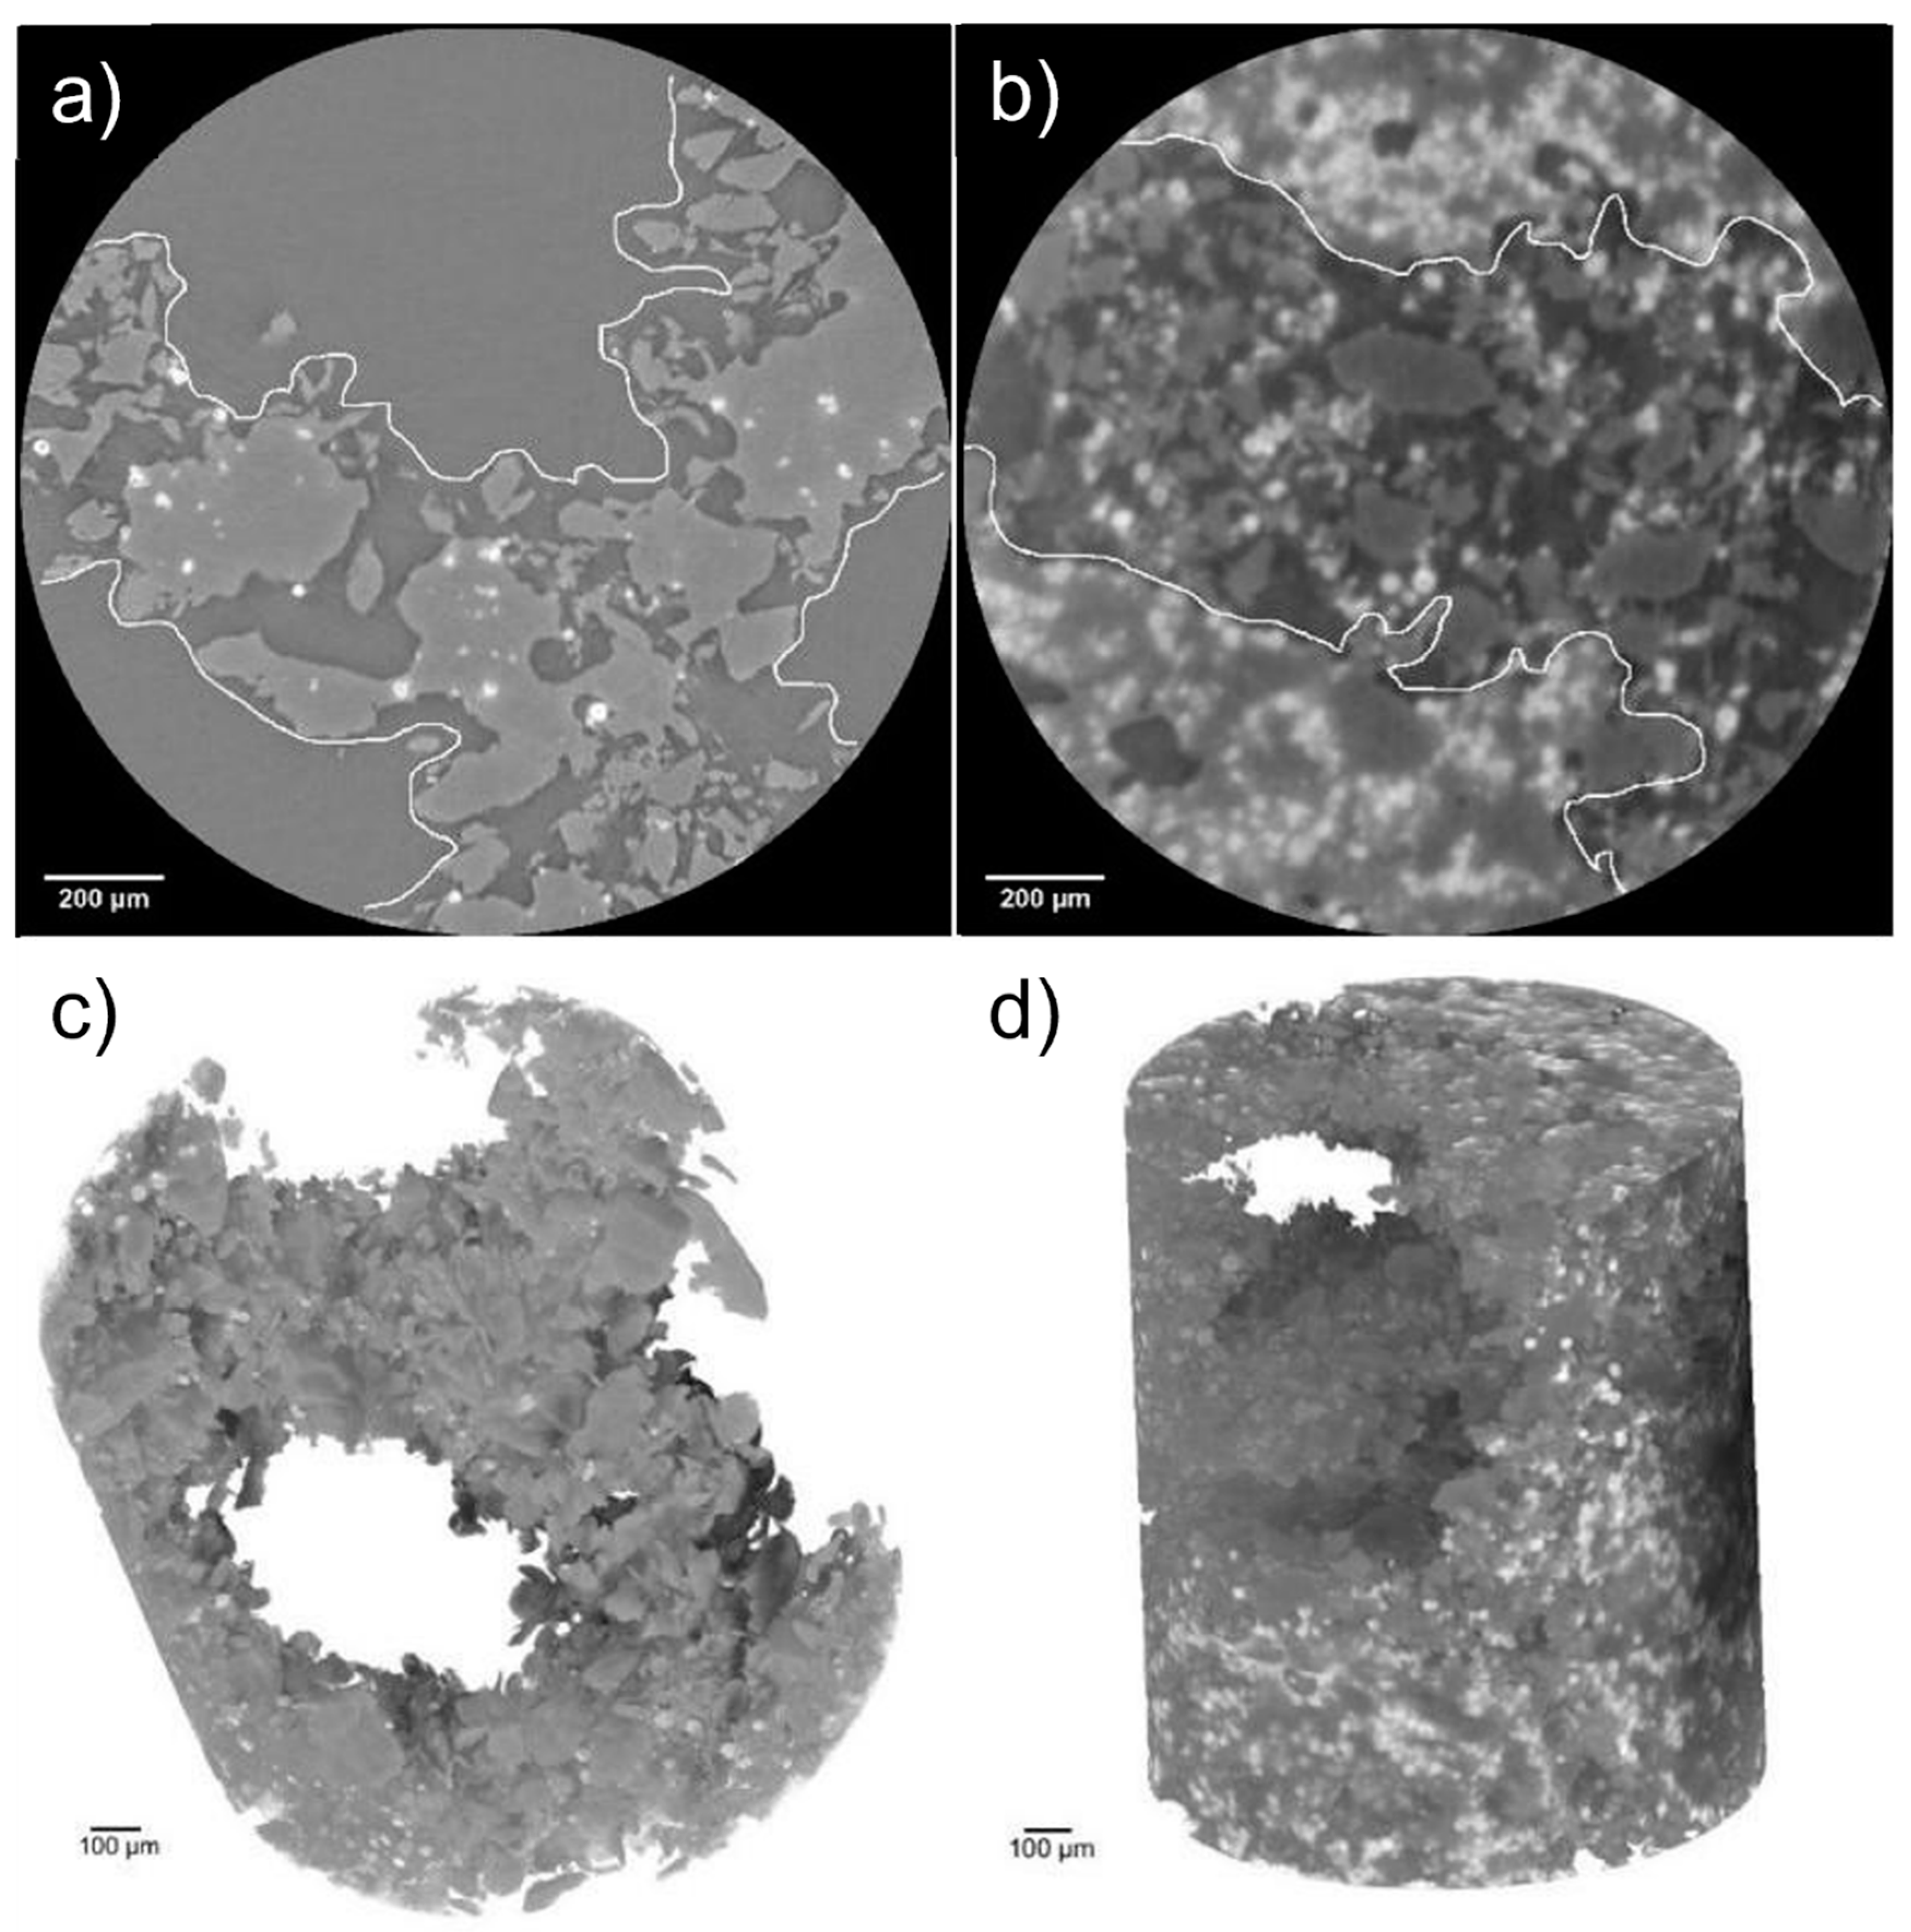
3.2.4. XµCT
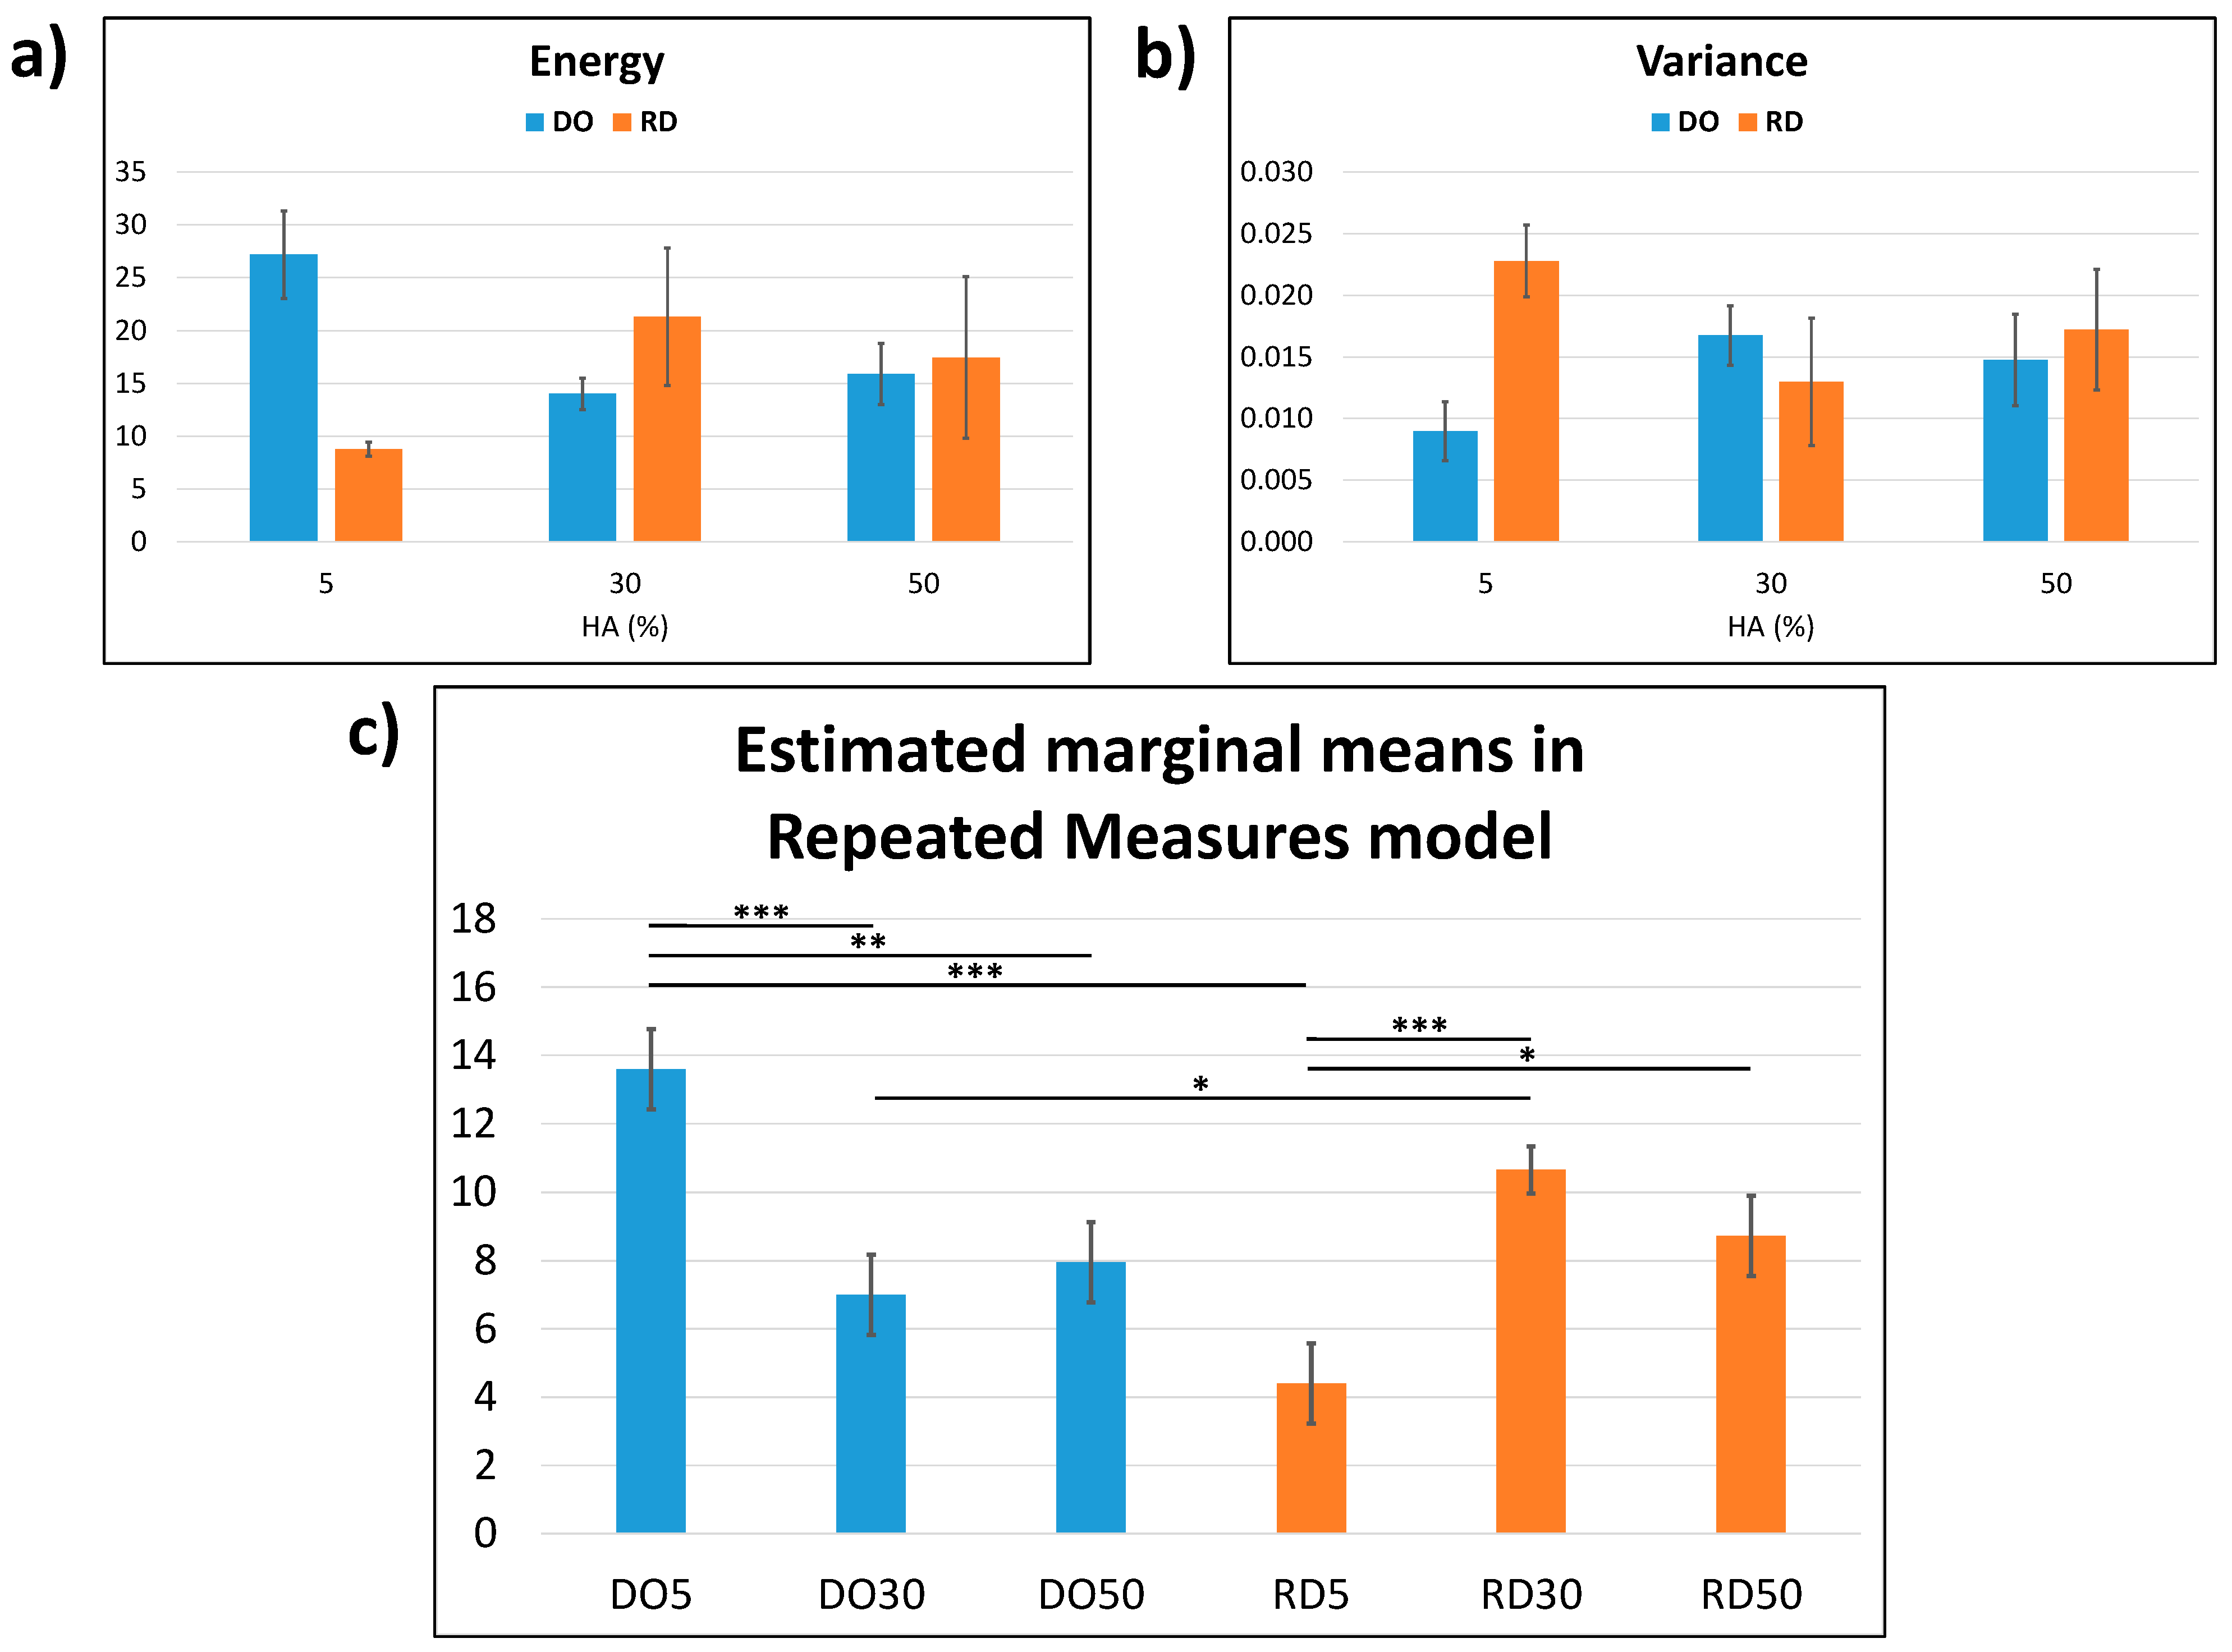
3.3. Mechanical Test
3.4. Cell Adhesion and Proliferation
3.5. PhC-XµCT
4. Discussion
5. Conclusions
- Mechanical tests evidenced three deformation regimes: elastic, plastic and densification:
- ○
- In the elastic regime, geometry of the elementary unit cell governs the behavior of the scaffold containing the lowest amount of HA (5 wt.%), while at higher concentrations (30 wt.% and 50 wt.% HA) the mechanical response depends on the material properties;
- ○
- In the plastic regime, for scaffolds with 5 and 30 wt.% HA, the DO geometry requires higher load to achieve the same deformation value of RD, while for scaffolds with 50 wt.% HA the load values are almost the same;
- ○
- In the densification regime, the ultimate compressive strength decreases with an increasing of HA amount;
- Regardless of elementary unit cell geometry (DO or RD) or HA amount (5, 30 or 50 wt.%), scaffolds presented an ultimate compressive strength value in the range of human mandibular trabecular bone;
- The biological response of hMSCs after 24 h of culture is mostly affected by material composition, with enhancement of cell adhesion for HA amounts of 30 and 50 wt.%;
- After 4 days of culture, cell viability is affected by elementary unit cell geometry, with RD30 and RD50 being the most favorable environments for cell proliferation. Moreover, higher micro-porosity values accelerate the biomaterial degradative process.
Author Contributions
Funding
Institutional Review Board Statement
Informed Consent Statement
Data Availability Statement
Acknowledgments
Conflicts of Interest
References
- Codrea, C.I.; Croitoru, A.M.; Baciu, C.C.; Melinescu, A.; Ficai, D.; Fruth, V.; Ficai, A. Advances in Osteoporotic Bone Tissue Engineering. J. Clin. Med. 2021, 10, 253. [Google Scholar] [CrossRef]
- Roseti, L.; Parisi, V.; Petretta, M.; Cavallo, C.; Desando, G.; Bartolotti, I.; Grigolo, B. Scaffolds for bone tissue engineering: State of the art and new perspectives. Mater. Sci. Eng. C 2017, 78, 1246–1262. [Google Scholar] [CrossRef]
- Velasco, M.A.; Narváez-Tovar, C.A.; Garzón-Alvarado, D.A. Design, materials, and mechanobiology of biodegradable scaffolds for bone tissue engineering. BioMed Res. Int. 2015, 2015, 729076. [Google Scholar] [CrossRef]
- Chan, B.P.; Leong, K.W. Scaffolding in tissue engineering: General approaches and tissue-specific considerations. Eur. Spine J. 2008, 17, 467–479. [Google Scholar] [CrossRef]
- Machałowski, T.; Idaszek, J.; Chlanda, A.; Heljak, M.; Piasecki, A.; Święszkowski, W.; Jesionowski, T. Naturally prefabricated 3D chitinous skeletal scaffold of marine demosponge origin, biomineralized ex vivo as a functional biomaterial. Carbohydr. Polym. 2022, 275, 118750. [Google Scholar] [CrossRef]
- Abdulghani, S.; Mitchell, G.R. Biomaterials for in situ tissue regeneration: A review. Biomolecules 2019, 9, 750. [Google Scholar] [CrossRef]
- Park, S.B.; Lih, E.; Park, K.S.; Joung, Y.K.; Han, D.K. Biopolymer-based functional composites for medical applications. Prog. Polym. Sci. 2017, 68, 77–105. [Google Scholar] [CrossRef]
- Dwivedi, R.; Pandey, R.; Kumar, S.; Mehrotra, D. Poly hydroxyalkanoates (PHA): Role in bone scaffolds. J. Oral Biol. Craniofacial Res. 2020, 10, 389–392. [Google Scholar] [CrossRef]
- Siddiqui, N.; Asawa, S.; Birru, B.; Baadhe, R.; Rao, S. PCL-based composite scaffold matrices for tissue engineering applications. Mol. Biotechnol. 2018, 60, 506–532. [Google Scholar] [CrossRef]
- Bartnikowski, M.; Dargaville, T.R.; Ivanovski, S.; Hutmacher, D.W. Degradation mechanisms of polycaprolactone in the context of chemistry, geometry and environment. Prog. Polym. Sci. 2019, 96, 1–20. [Google Scholar] [CrossRef]
- Rogowska-Tylman, J.; Locs, J.; Salma, I.; Woźniak, B.; Pilmane, M.; Zalite, V.; Wojnarowicz, J.; Kędzierska-Sar, A.; Chudoba, T.; Szlązak, K.; et al. In vivo and in vitro study of a novel nanohydroxyapatite sonocoated scaffolds for enhanced bone regeneration. Mater. Sci. Eng. C 2019, 99, 669–684. [Google Scholar] [CrossRef]
- Hasirci, V.; Hasirci, N. Fundamentals of Biomaterials; Springer: New York, NY, USA, 2018. [Google Scholar]
- González-Henríquez, C.M.; Rodríguez-Umanzor, F.E.; Acuña-Ruiz, N.F.; Vera-Rojas, G.E.; Terraza-Inostroza, C.; Cohn-Inostroza, N.A.; Utrera, A.; Sarabia-Vallejos, M.A.; Rodríguez-Hernández, J. Fabrication and Testing of Multi-Hierarchical Porous Scaffolds Designed for Bone Regeneration via Additive Manufacturing Processes. Polymers 2022, 14, 4041. [Google Scholar] [CrossRef]
- Backes, E.H.; Harb, S.V.; Beatrice, C.A.G.; Shimomura, K.M.B.; Passador, F.R.; Costa, L.C.; Pessan, L.A. Polycaprolactone usage in additive manufacturing strategies for tissue engineering applications: A review. J. Biomed. Mater. Res. Part B Appl. Biomater. 2022, 110, 1479–1503. [Google Scholar] [CrossRef] [PubMed]
- Eosoly, S.; Lohfeld, S.; Brabazon, D. Effect of hydroxyapatite on biodegradable scaffolds fabricated by SLS. Key Eng. Mater. 2009, 396–398, 659–662. [Google Scholar] [CrossRef]
- Eosoly, S.; Brabazon, D.; Lohfeld, S.; Looney, L. Selective laser sintering of hydroxyapatite/poly-e-caprolactone scaffolds. Acta Biomater. 2010, 6, 2511–2517. [Google Scholar] [CrossRef] [PubMed]
- Eosoly, S.; Vrana, N.E.; Lohfeld, S.; Hindie, M.; Looney, L. Interaction of cell culture with composition effects on the mechanical properties of polycaprolactonehydroxyapatite scaffolds fabricated via selective laser sintering (SLS). Mater. Sci. Eng. C 2012, 32, 2250–2257. [Google Scholar] [CrossRef]
- Eshraghi, S.; Das, S. Micromechanical finite-element modeling and experimental characterization of the compressive mechanical properties of polycaprolactone–hydroxyapatite composite scaffolds prepared by selective laser sintering for bone tissue engineering. Acta Biomater. 2012, 8, 3138–3143. [Google Scholar] [CrossRef]
- Wiria, F.E.; Leong, K.F.; Chua, C.K.; Liu, Y. Poly-e-caprolactone/hydroxyapatite for tissue engineering scaffold fabrication via selective laser sintering. Acta Biomater. 2007, 3, 1–12. [Google Scholar] [CrossRef]
- Gatto, M.L.; Furlani, M.; Giuliani, A.; Bloise, N.; Fassina, L.; Visai, L.; Mengucci, P. Biomechanical performances of PCL/HA micro-and macro-porous lattice scaffolds fabricated via laser powder bed fusion for bone tissue engineering. Mater. Sci. Eng. C 2021, 128, 112300. [Google Scholar] [CrossRef]
- Rezania, N.; Asadi-Eydivand, M.; Abolfathi, N.; Bonakdar, S.; Mehrjoo, M.; Solati-Hashjin, M. Three-dimensional printing of polycaprolactone/hydroxyapatite bone tissue engineering scaffolds mechanical properties and biological behavior. J. Mater. Sci. Mater. Med. 2022, 33, 31. [Google Scholar] [CrossRef]
- Liu, F.; Kang, H.; Liu, Z.; Jin, S.; Yan, G.; Sun, Y.; Li, F.; Zhan, H.; Gu, Y. 3D Printed multi-functional scaffolds based on poly (ε-caprolactone) and hydroxyapatite composites. Nanomaterials 2021, 11, 2456. [Google Scholar] [CrossRef] [PubMed]
- Kim, C.G.; Han, K.S.; Lee, S.; Kim, M.C.; Kim, S.Y.; Nah, J. Fabrication of Biocompatible Polycaprolactone–Hydroxyapatite Composite Filaments for the FDM 3D Printing of Bone Scaffolds. Appl. Sci. 2021, 11, 6351. [Google Scholar] [CrossRef]
- Schindelin, J.; Arganda-Carreras, I.; Frise, E.; Kaynig, V.; Longair, M.; Pietzsch, T.; Preibisch, S.; Rueden, C.; Saalfeld, S.; Schmid, B.; et al. Fiji: An open-source platform for biological-image analysis. Nat. Methods 2012, 9, 676–682. [Google Scholar] [CrossRef] [PubMed]
- Haralick, R.M.; Shanmugam, K.; Dinstein, I. Textural Features for Image Classification. IEEE Trans. Syst. Man Cybern. 1973, SMC-3, 610–621. [Google Scholar] [CrossRef]
- Bloise, N.; Fassina, L.; Focarete, M.L.; Lotti, N.; Visai, L. Haralick’s texture analysis to predict cellular proliferation on randomly oriented electrospun nanomaterials. Nanoscale Adv. 2022, 4, 1330–1335. [Google Scholar] [CrossRef]
- Bloise, N.; Waldorff, E.I.; Montagna, G.; Bruni, G.; Fassina, L.; Fang, S.; Zhang, N.; Jiang, J.; Ryaby, J.T.; Visai, L. Early Osteogenic Marker Expression in hMSCs Cultured onto Acid Etching-Derived Micro- and Nanotopography 3D-Printed Titanium Surfaces. Int. J. Mol. Sci. 2022, 23, 7070. [Google Scholar] [CrossRef]
- ISO 25178-603:2013. Geometrical Product Specifications (GPS)—Surface Texture: Areal—Part 603: Nominal Characteristics of Non-Contact (Phase-Shifting Interferometric Microscopy) Instruments. International Organization for Standardization: Geneva, Switzerland, 2013.
- ASTM D 1621e10. Standard Test Method for Compressive Properties of Rigid Cellular Plastics. ASTM International: West Conshohocken, PA, USA, 2003.
- Bernardo, M.E.; Avanzini, M.A.; Perotti, C.; Cometa, A.M.; Moretta, A.; Lenta, E.; Del Fante, C.; Novara, F.; de Silvestri, A.; Amendola, G.; et al. Optimization of in vitro expansion of human multipotent mesenchymal stromal cells for cell-therapy approaches: Further insights in the search for a fetal calf serum substitute. J. Cell. Physiol. 2007, 211, 121–130. [Google Scholar] [CrossRef]
- Ceccarelli, G.; Bloise, N.; Mantelli, M.; Gastaldi, G.; Fassina, L.; De Angelis, M.G.C.; Ferrari, D.; Imbriani, M.; Visai, L. A comparative analysis of the in vitro effects of pulsed electromagnetic field treatment on osteogenic differentiation of two different mesenchymal cell lineages. BioRes. Open Access 2013, 2, 283–294. [Google Scholar] [CrossRef]
- Hosseini, M.; Khalil-Allafi, J.; Etminanfar, M.; Safavi, M.S.; Bloise, N.; Ghalandarzadeh, A. Tackling the challenges facing the clinical applications of pure PEO hydroxyapatite layers: Co-deposition of YSZ nanoparticles. Mater. Chem. Phys. 2023, 293, 126899. [Google Scholar] [CrossRef]
- Brun, F.; Massimi, L.; Fratini, M.; Dreossi, D.; Billé, F.; Accardo, A.; Pugliese, R.; Cedola, A. SYRMEP Tomo project: A graphical user interface for customizing CT reconstruction workflows. Adv. Struct. Chem. Imaging 2017, 3, 1–9. [Google Scholar] [CrossRef]
- Paganin, D.; Mayo, S.C.; Gureyev, T.E.; Miller, P.R.; Wilkins, S.W. Simultaneous phase and amplitude extraction from a single defocused image of a homogeneous object. J. Microsc. 2002, 206 Pt 1, 33–40. [Google Scholar] [CrossRef] [PubMed]
- MathWorks, Help Center. Available online: https://it.mathworks.com/help/stats/repeatedmeasuresmodel.multcompare.html (accessed on 1 February 2023).
- Gatto, A.; Bassoli, E.; Denti, L. Reinforcement effectiveness on mechanical performances of composites obtained by powder bed fusion. Int. J. Mech. Eng. Technol. 2017, 8, 516–525. [Google Scholar]
- Misch, C.E.; Qu, Z.; Bidez, M.W. Mechanical properties of trabecular bone in the human mandible: Implications for dental implant treatment planning and surgical placement. J. Oral Maxillofac. Surg. 1999, 57, 700–706. [Google Scholar] [CrossRef] [PubMed]


| Phase | Parameter | DO5 | RD5 | DO30 | RD30 | DO50 | RD50 |
|---|---|---|---|---|---|---|---|
| Acquisition | Pixel size [μm] | 11.5 | |||||
| Rotation step [deg.] | 0.4 for 180 | ||||||
| Frame averaging | 2 | ||||||
| Al filter [mm] | No filter | 0.25 | 0.25 | ||||
| Exposure time [s] | 1.6 | 3 | 4 | ||||
| Reconstruction | Smoothing | 1 | 2 | 2 | |||
| Ring artifact reduction | 2 | 2 | 2 | ||||
| Beam hardening correction [%] | 5 | 20 | 25 | ||||
| Ca/P (at.%) | |||
|---|---|---|---|
| HA 5% | HA 30% | HA 50% | |
| Powder | 1.6 ± 0.2 | 2.1 ± 0.1 | 2.1 ± 0.1 |
| DO | 1.9 ± 0.1 | 2.3 ± 0.4 | 2.1 ± 0.2 |
| RD | 1.9 ± 0.1 | 1.7 ± 0.3 | 2.1 ± 0.1 |
| Parameter | DO | RD | |||||
|---|---|---|---|---|---|---|---|
| DO5 | DO30 | DO50 | RD5 | RD30 | RD50 | ||
| Ssk | Symmetry of roughness profile with respect to mean line | −0.5 | −0.24 | −1.3 | −0.6 | −0.4 | 0.2 |
| Sku | Sharpness of roughness profile | 2.6 | 2.4 | 4.4 | 2.8 | 4.28 | 3.2 |
| Parameter | DO | RD | ||||
|---|---|---|---|---|---|---|
| DO5 | DO30 | DO50 | RD5 | RD30 | RD50 | |
| Total porosity [%] | 65 ± 1 | 56 ± 4 | 64 ± 2 | 70 ± 1 | 53 ± 1 | 69.5 ± 0.5 |
| Scaffold micro-porosity [%] | 1.9 ± 0.1 | 5.9 ± 0.4 | 4.6 ± 0.4 | 1.4 ± 0.1 | 3.7 ± 0.3 | 3.1 ± 0.1 |
| Mechanical Parameter | DO | RD | ||||
|---|---|---|---|---|---|---|
| DO5 | DO30 | DO50 | RD5 | RD30 | RD50 | |
| E (MPa) | 10.8 ± 0.6 | 13 ± 2 | 8 ± 2 | 7.2 ± 0.5 | 11.6 ± 0.7 | 6.3 ± 0.1 |
| σUC (MPa) | 2.8 ± 0.7 | 2.20 ± 0.05 | 1.5 ± 0.6 | 1.9 ± 0.1 | 2.4 ± 0.2 | 1.07 ± 0.01 |
| DO | RD | |||||
|---|---|---|---|---|---|---|
| DO5 | DO30 | DO50 | RD5 | RD30 | RD50 | |
| HA [wt.%] | 9 ± 2 | 50 ± 20 | 70 ± 20 | 8 ± 1 | 50 ±10 | 70 ± 20 |
Disclaimer/Publisher’s Note: The statements, opinions and data contained in all publications are solely those of the individual author(s) and contributor(s) and not of MDPI and/or the editor(s). MDPI and/or the editor(s) disclaim responsibility for any injury to people or property resulting from any ideas, methods, instructions or products referred to in the content. |
© 2023 by the authors. Licensee MDPI, Basel, Switzerland. This article is an open access article distributed under the terms and conditions of the Creative Commons Attribution (CC BY) license (https://creativecommons.org/licenses/by/4.0/).
Share and Cite
Gatto, M.L.; Furlani, M.; Giuliani, A.; Cabibbo, M.; Bloise, N.; Fassina, L.; Petruczuk, M.; Visai, L.; Mengucci, P. Combined Effects of HA Concentration and Unit Cell Geometry on the Biomechanical Behavior of PCL/HA Scaffold for Tissue Engineering Applications Produced by LPBF. Materials 2023, 16, 4950. https://doi.org/10.3390/ma16144950
Gatto ML, Furlani M, Giuliani A, Cabibbo M, Bloise N, Fassina L, Petruczuk M, Visai L, Mengucci P. Combined Effects of HA Concentration and Unit Cell Geometry on the Biomechanical Behavior of PCL/HA Scaffold for Tissue Engineering Applications Produced by LPBF. Materials. 2023; 16(14):4950. https://doi.org/10.3390/ma16144950
Chicago/Turabian StyleGatto, Maria Laura, Michele Furlani, Alessandra Giuliani, Marcello Cabibbo, Nora Bloise, Lorenzo Fassina, Marlena Petruczuk, Livia Visai, and Paolo Mengucci. 2023. "Combined Effects of HA Concentration and Unit Cell Geometry on the Biomechanical Behavior of PCL/HA Scaffold for Tissue Engineering Applications Produced by LPBF" Materials 16, no. 14: 4950. https://doi.org/10.3390/ma16144950
APA StyleGatto, M. L., Furlani, M., Giuliani, A., Cabibbo, M., Bloise, N., Fassina, L., Petruczuk, M., Visai, L., & Mengucci, P. (2023). Combined Effects of HA Concentration and Unit Cell Geometry on the Biomechanical Behavior of PCL/HA Scaffold for Tissue Engineering Applications Produced by LPBF. Materials, 16(14), 4950. https://doi.org/10.3390/ma16144950