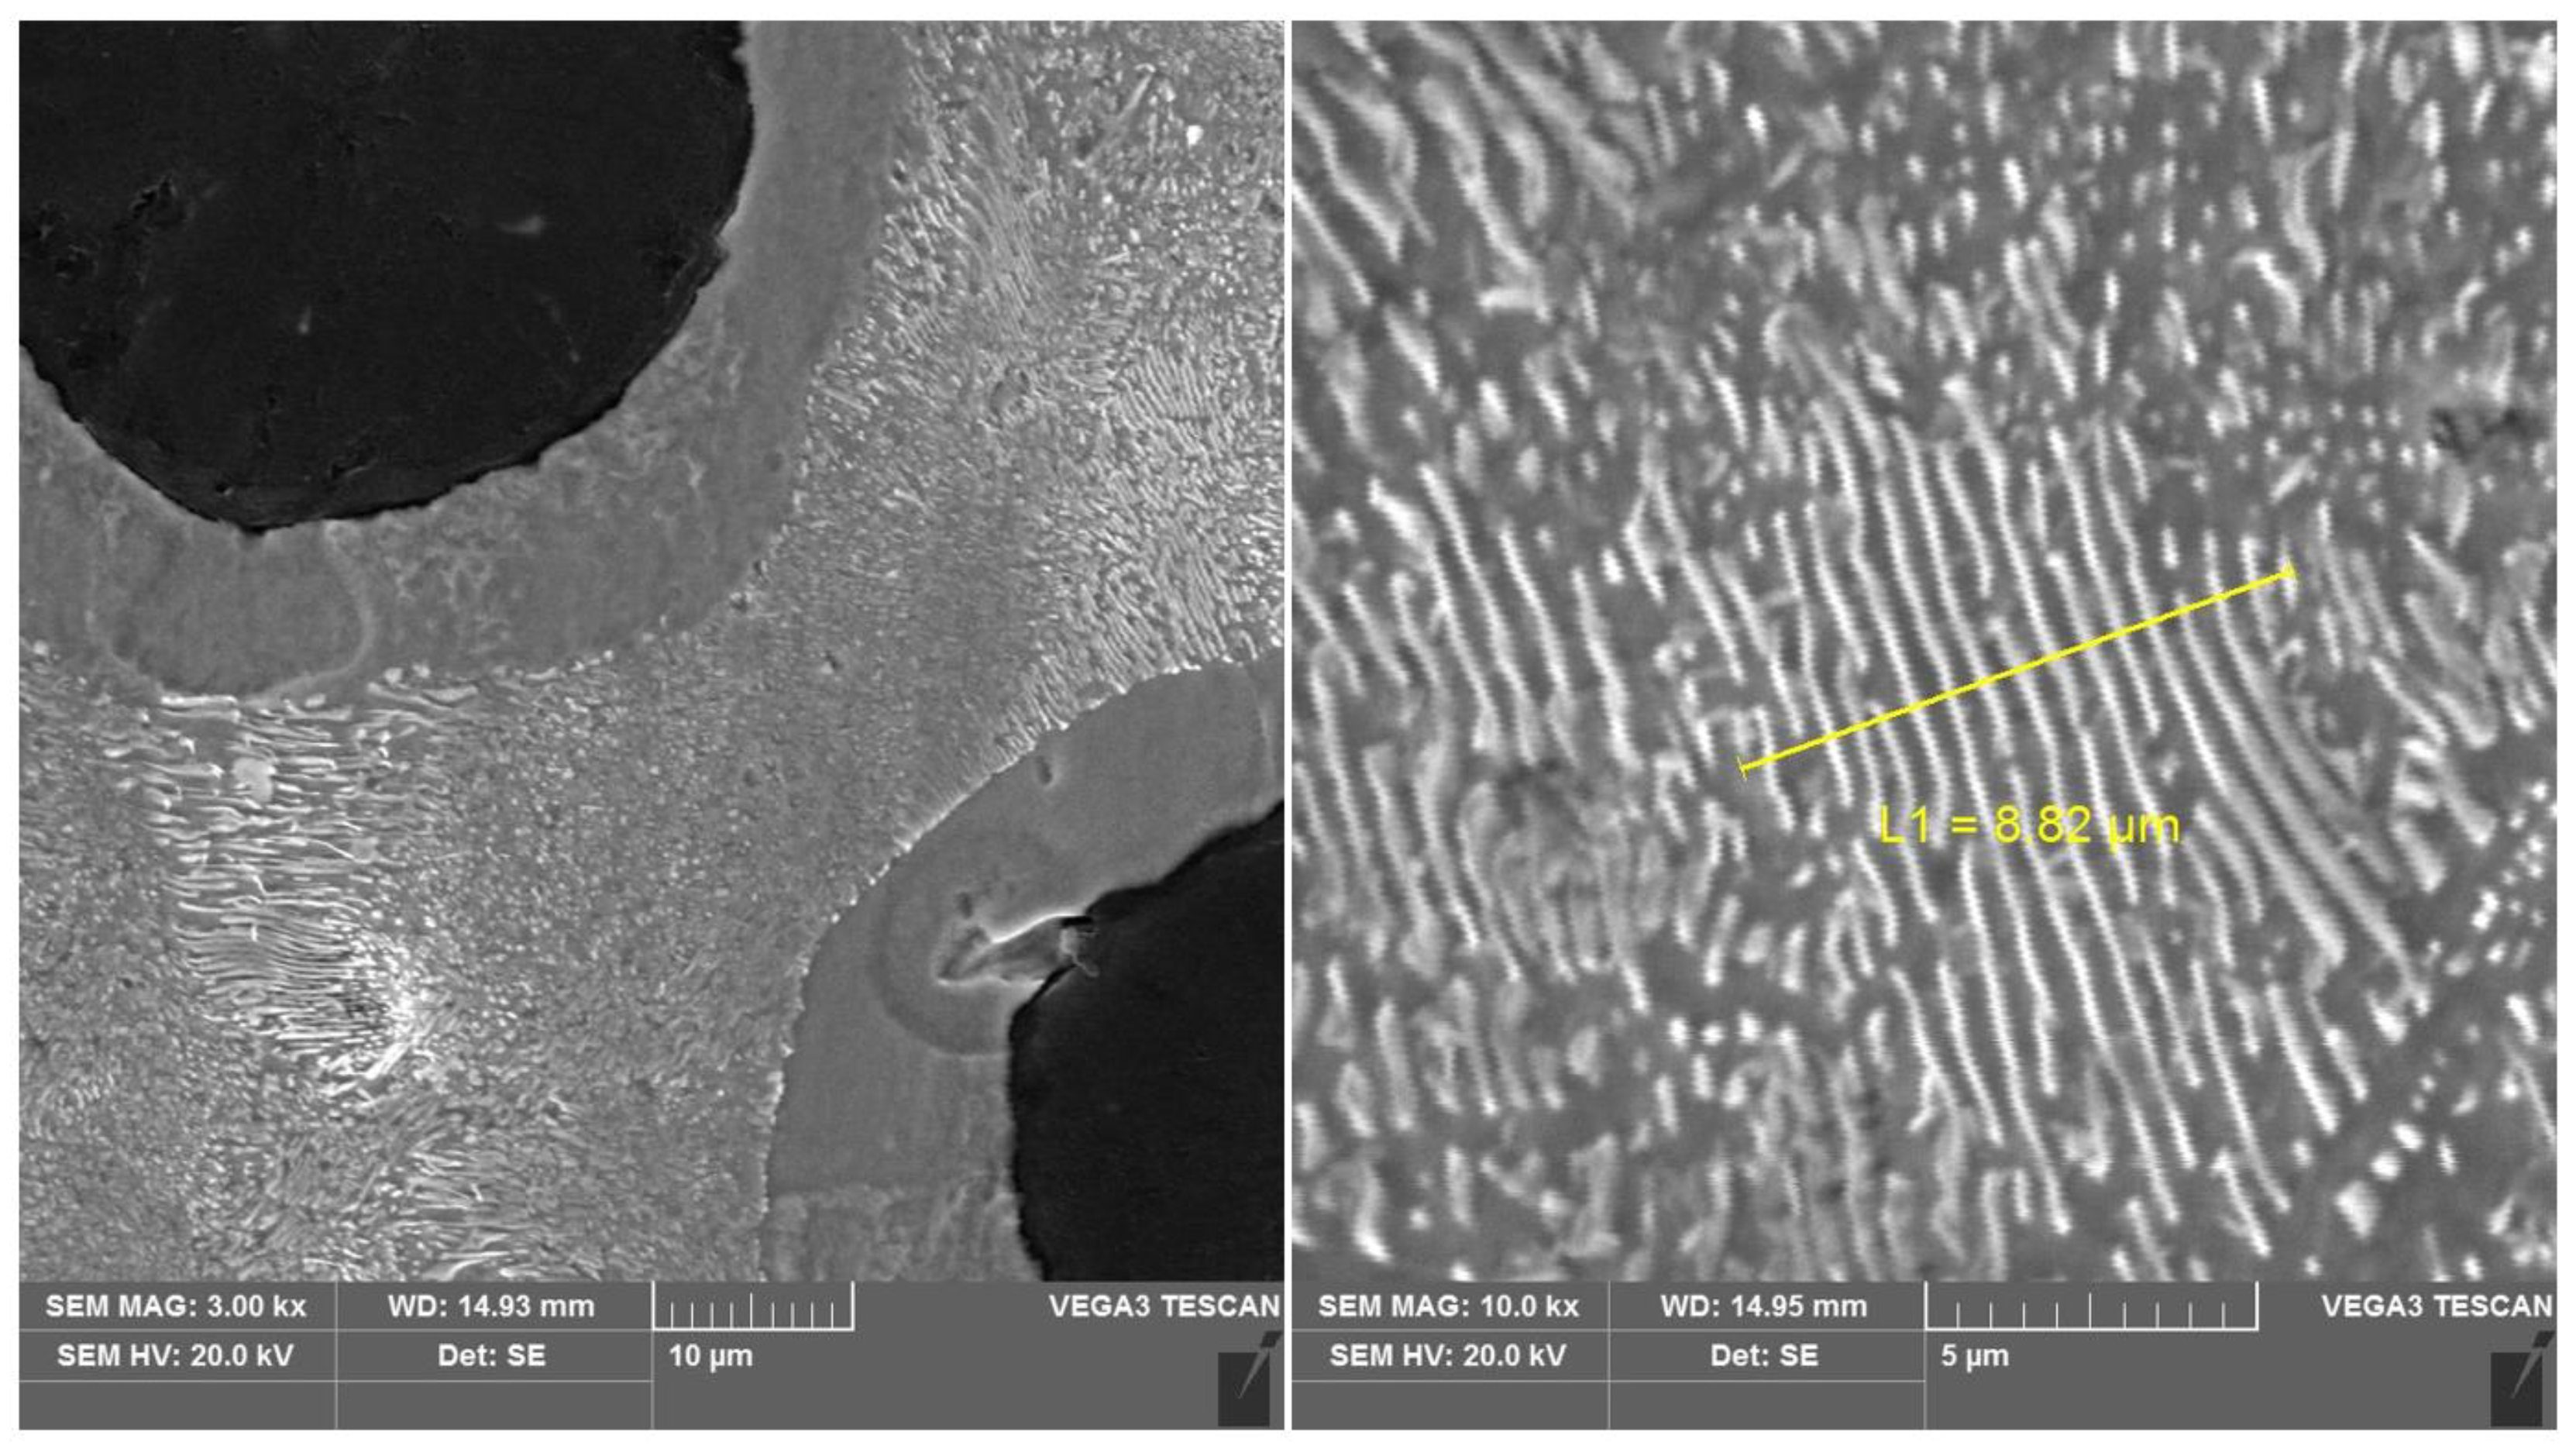
Figure 1.
Microstructure of ductile iron before heat treatment of austempering.
Figure 1.
Microstructure of ductile iron before heat treatment of austempering.
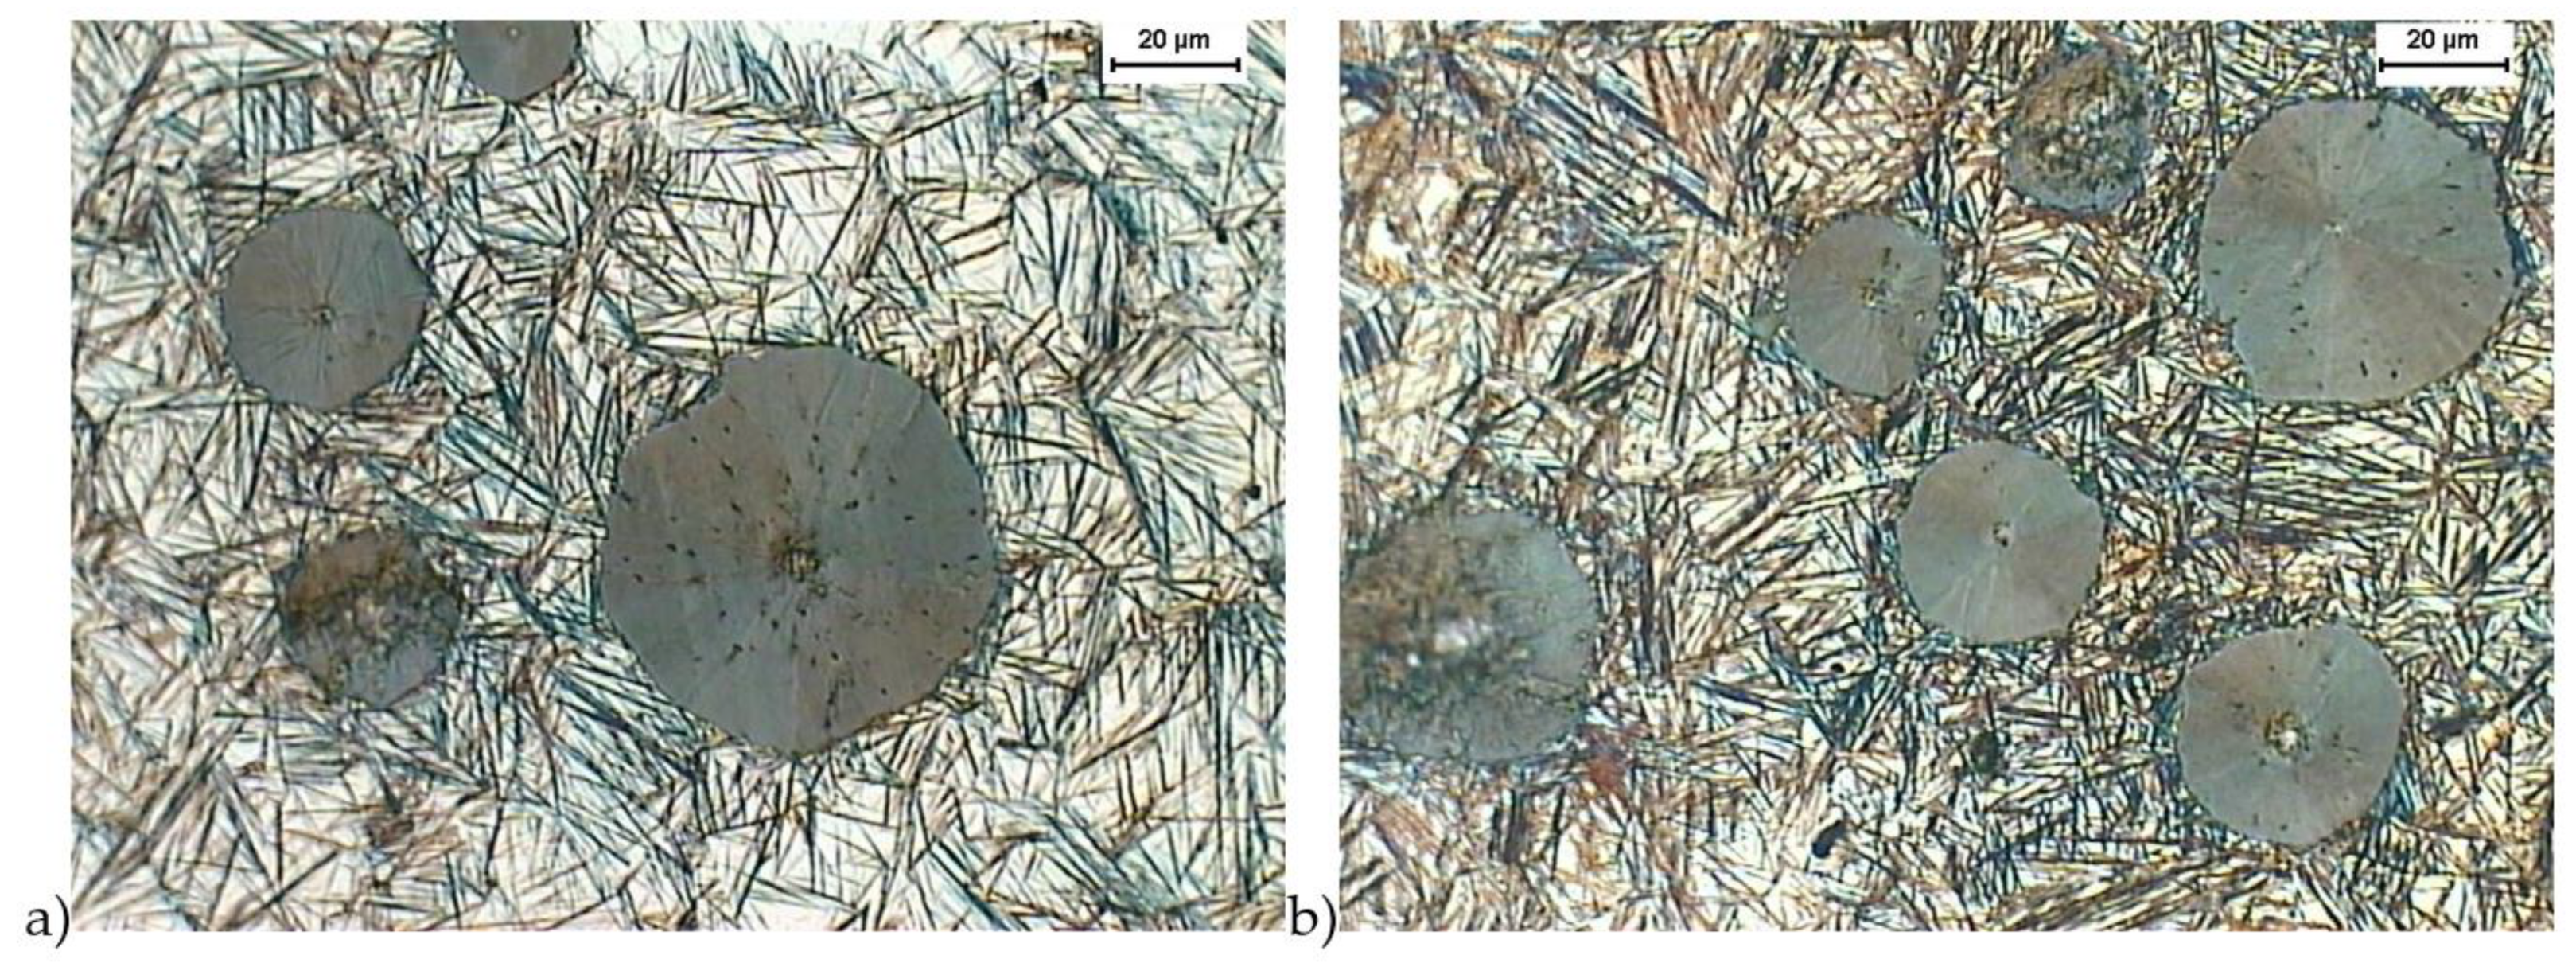
Figure 2.
Microstructure of cast iron obtained because of quenching with isothermal transformation of ductile iron to the austempering temperature, Taustempering = 280 °C, austempering time, τaustempering = 30 min (a) and 120 min (b), etched with 4% nital reagent.
Figure 2.
Microstructure of cast iron obtained because of quenching with isothermal transformation of ductile iron to the austempering temperature, Taustempering = 280 °C, austempering time, τaustempering = 30 min (a) and 120 min (b), etched with 4% nital reagent.
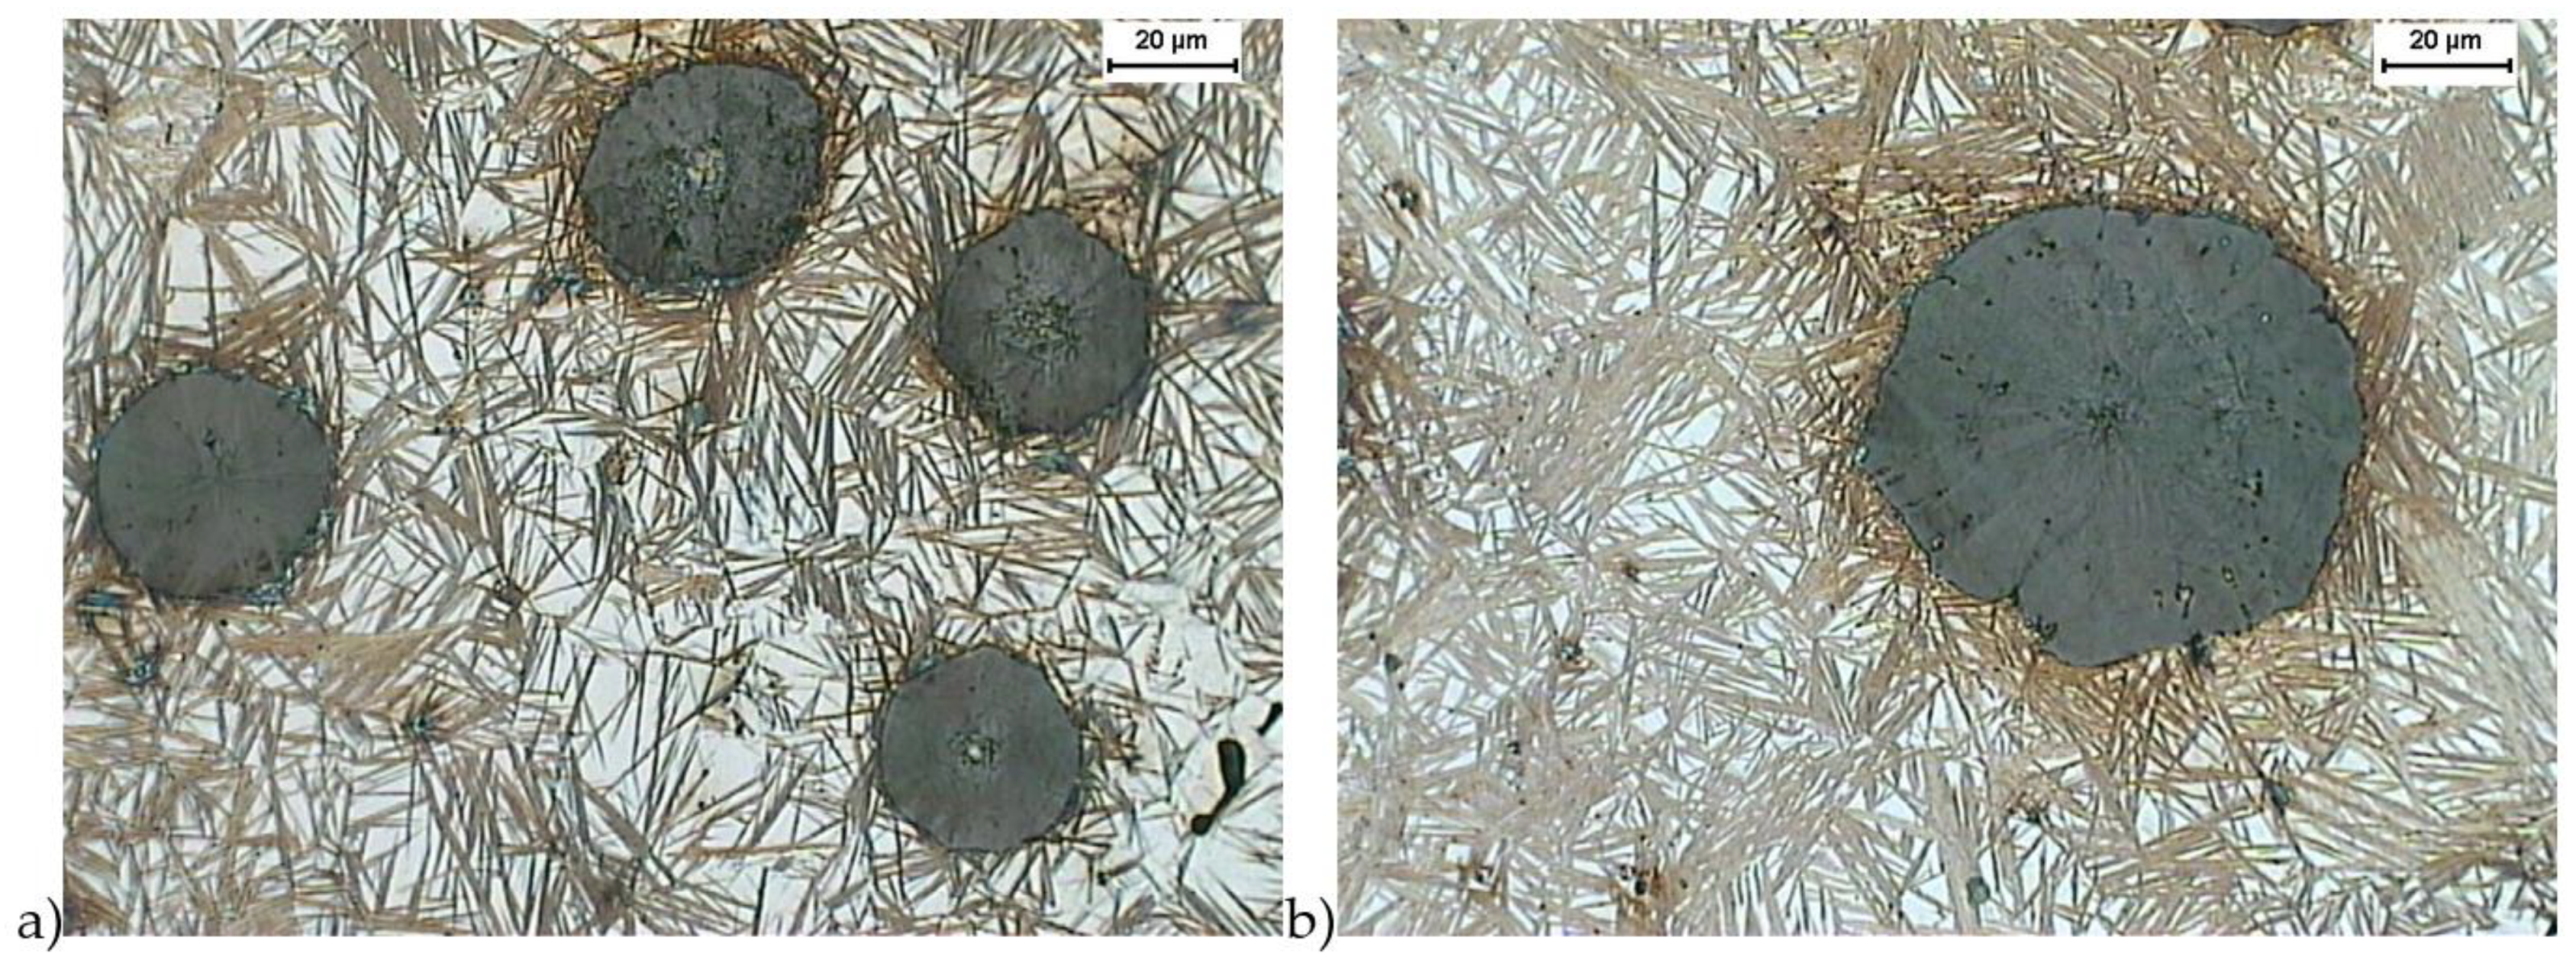
Figure 3.
Microstructure of cast iron obtained because of quenching with isothermal transformation of ductile iron to the austempering temperature, Taustempering = 430 °C, austempering time, τaustempering = 30 min (a) and 120 min (b), etched with 4% nital reagent.
Figure 3.
Microstructure of cast iron obtained because of quenching with isothermal transformation of ductile iron to the austempering temperature, Taustempering = 430 °C, austempering time, τaustempering = 30 min (a) and 120 min (b), etched with 4% nital reagent.
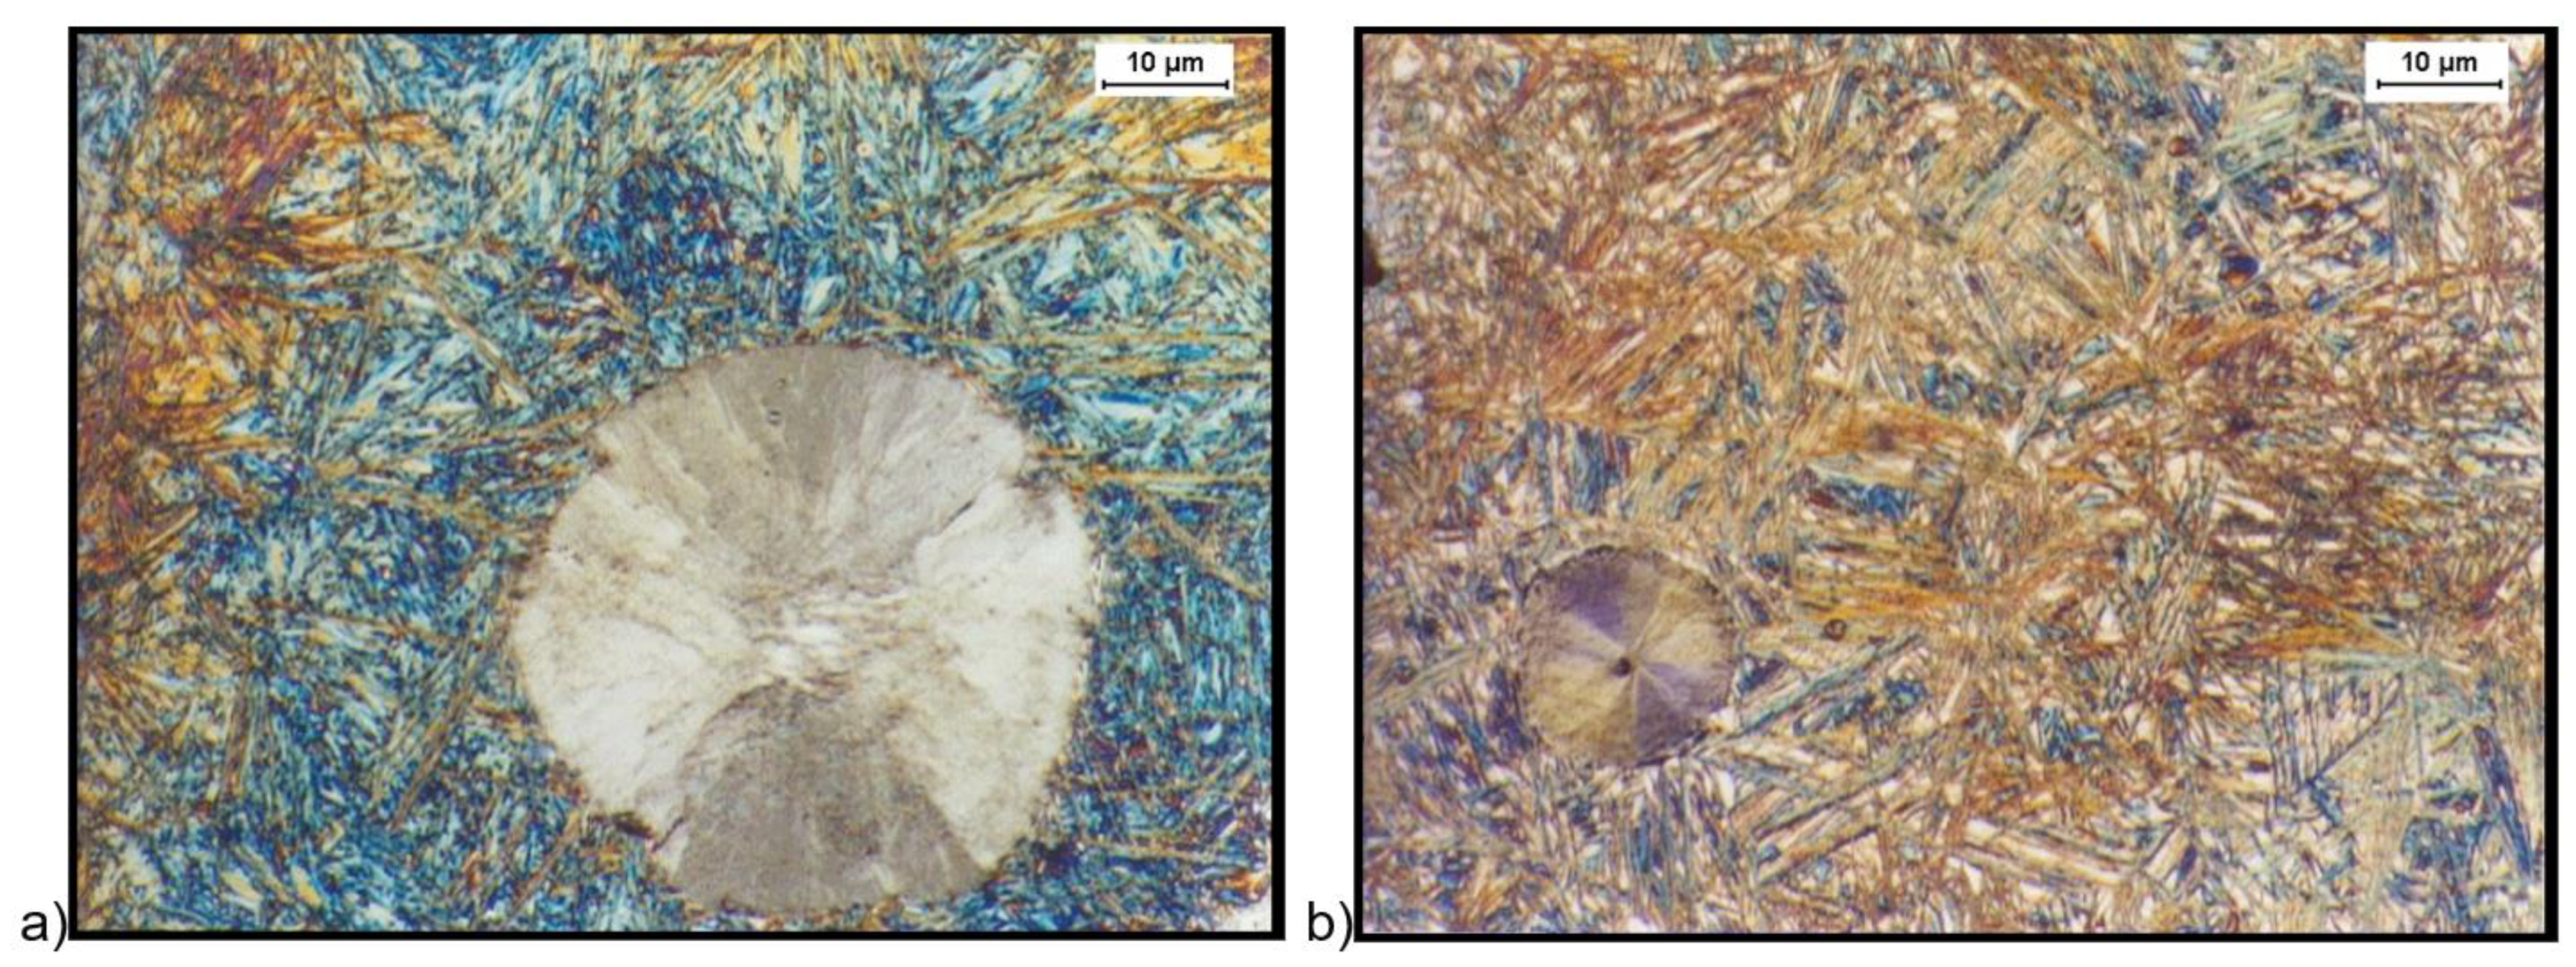
Figure 4.
Microstructure of cast iron obtained because of quenching with isothermal transformation of ductile iron to the austempering temperature, Taustempering = 280 °C, and austempering time τaustempering = 30 min, (a) and 120 min (b), etched with B-M reagent.
Figure 4.
Microstructure of cast iron obtained because of quenching with isothermal transformation of ductile iron to the austempering temperature, Taustempering = 280 °C, and austempering time τaustempering = 30 min, (a) and 120 min (b), etched with B-M reagent.
Figure 5.
Microstructure of cast iron obtained because of quenching with isothermal transformation of ductile iron to the austempering temperature, Taustempering = 430 °C, and austempering time, τaustempering = 30 min (a), and 120 min (b), etched with B-M reagent.
Figure 5.
Microstructure of cast iron obtained because of quenching with isothermal transformation of ductile iron to the austempering temperature, Taustempering = 430 °C, and austempering time, τaustempering = 30 min (a), and 120 min (b), etched with B-M reagent.
Figure 6.
Scanning electron microscopic images of ductile iron austempered at a 280 °C temperature for different austempered time: (a) 30 min; (b) 120 min.
Figure 6.
Scanning electron microscopic images of ductile iron austempered at a 280 °C temperature for different austempered time: (a) 30 min; (b) 120 min.
Figure 7.
Scanning electron microscopic images of ductile iron austempered at a 430 °C temperature for different austempered time: (a) 30 min; (b) 120 min.
Figure 7.
Scanning electron microscopic images of ductile iron austempered at a 430 °C temperature for different austempered time: (a) 30 min; (b) 120 min.
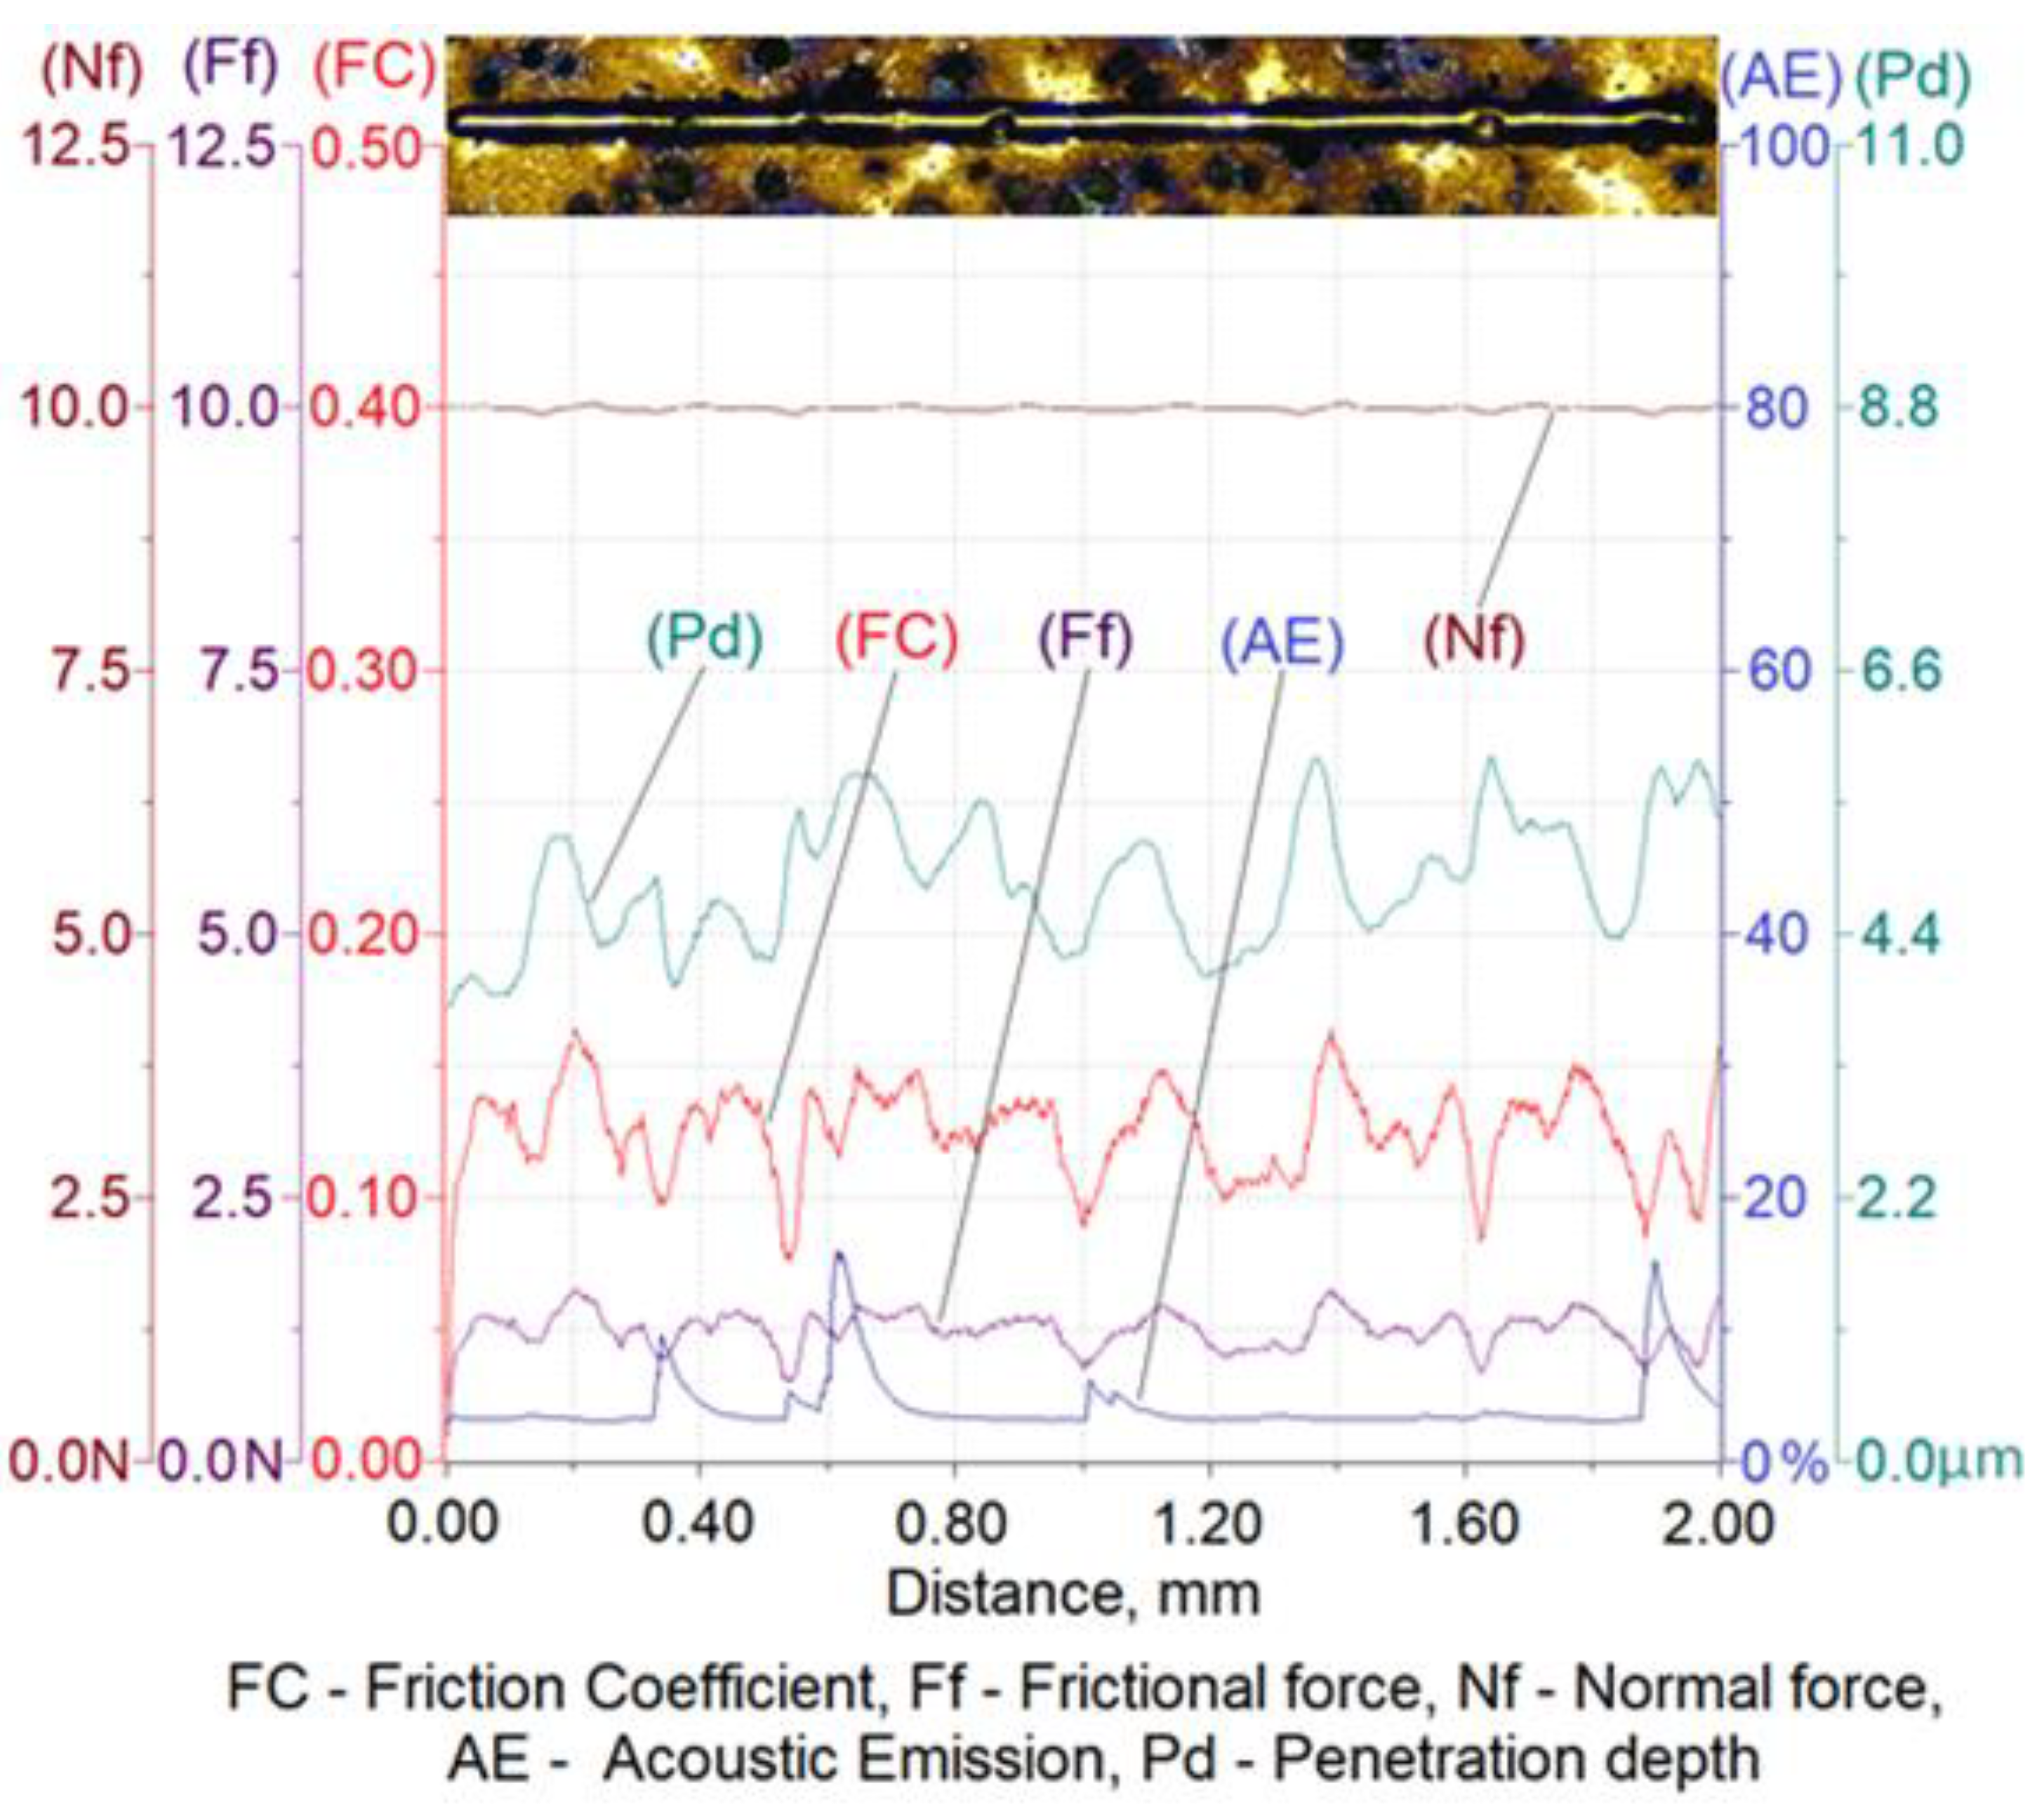
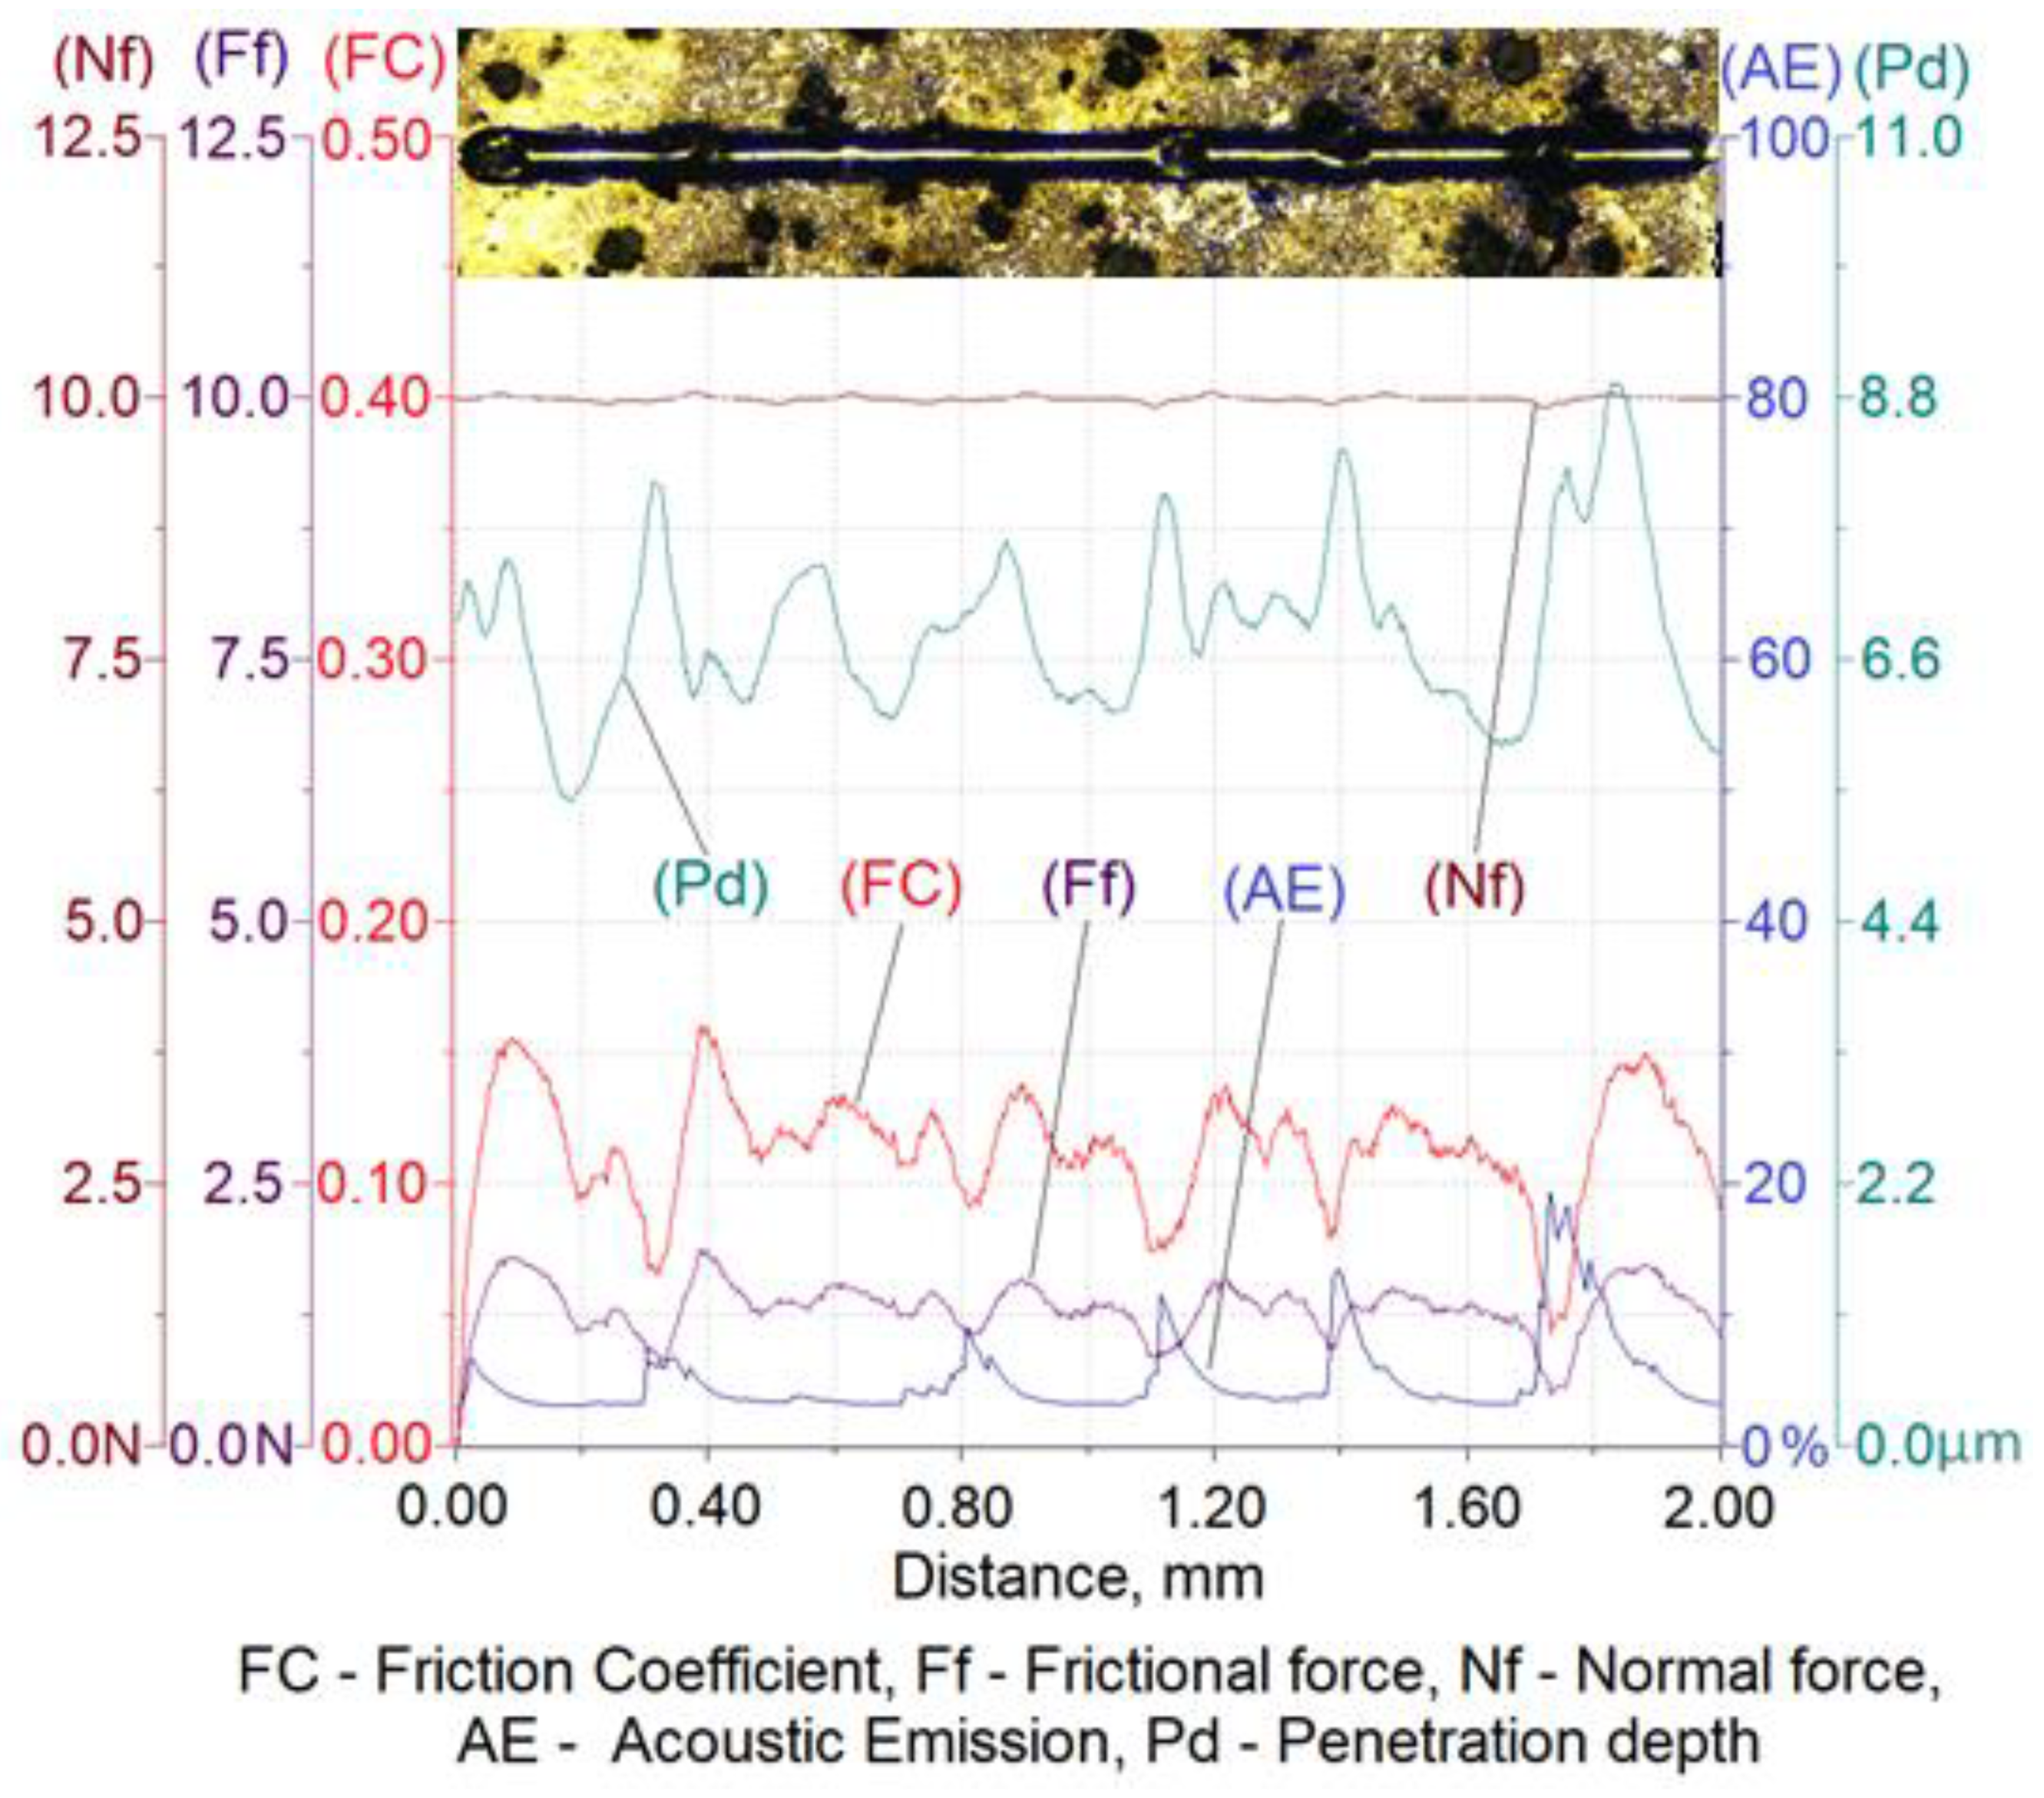
Figure 8.
Results of ADI cast iron scratch susceptibility tests in variant 2.1.
Figure 8.
Results of ADI cast iron scratch susceptibility tests in variant 2.1.
Figure 9.
Results of ADI cast iron scratch susceptibility tests in variant 6.1.
Figure 9.
Results of ADI cast iron scratch susceptibility tests in variant 6.1.
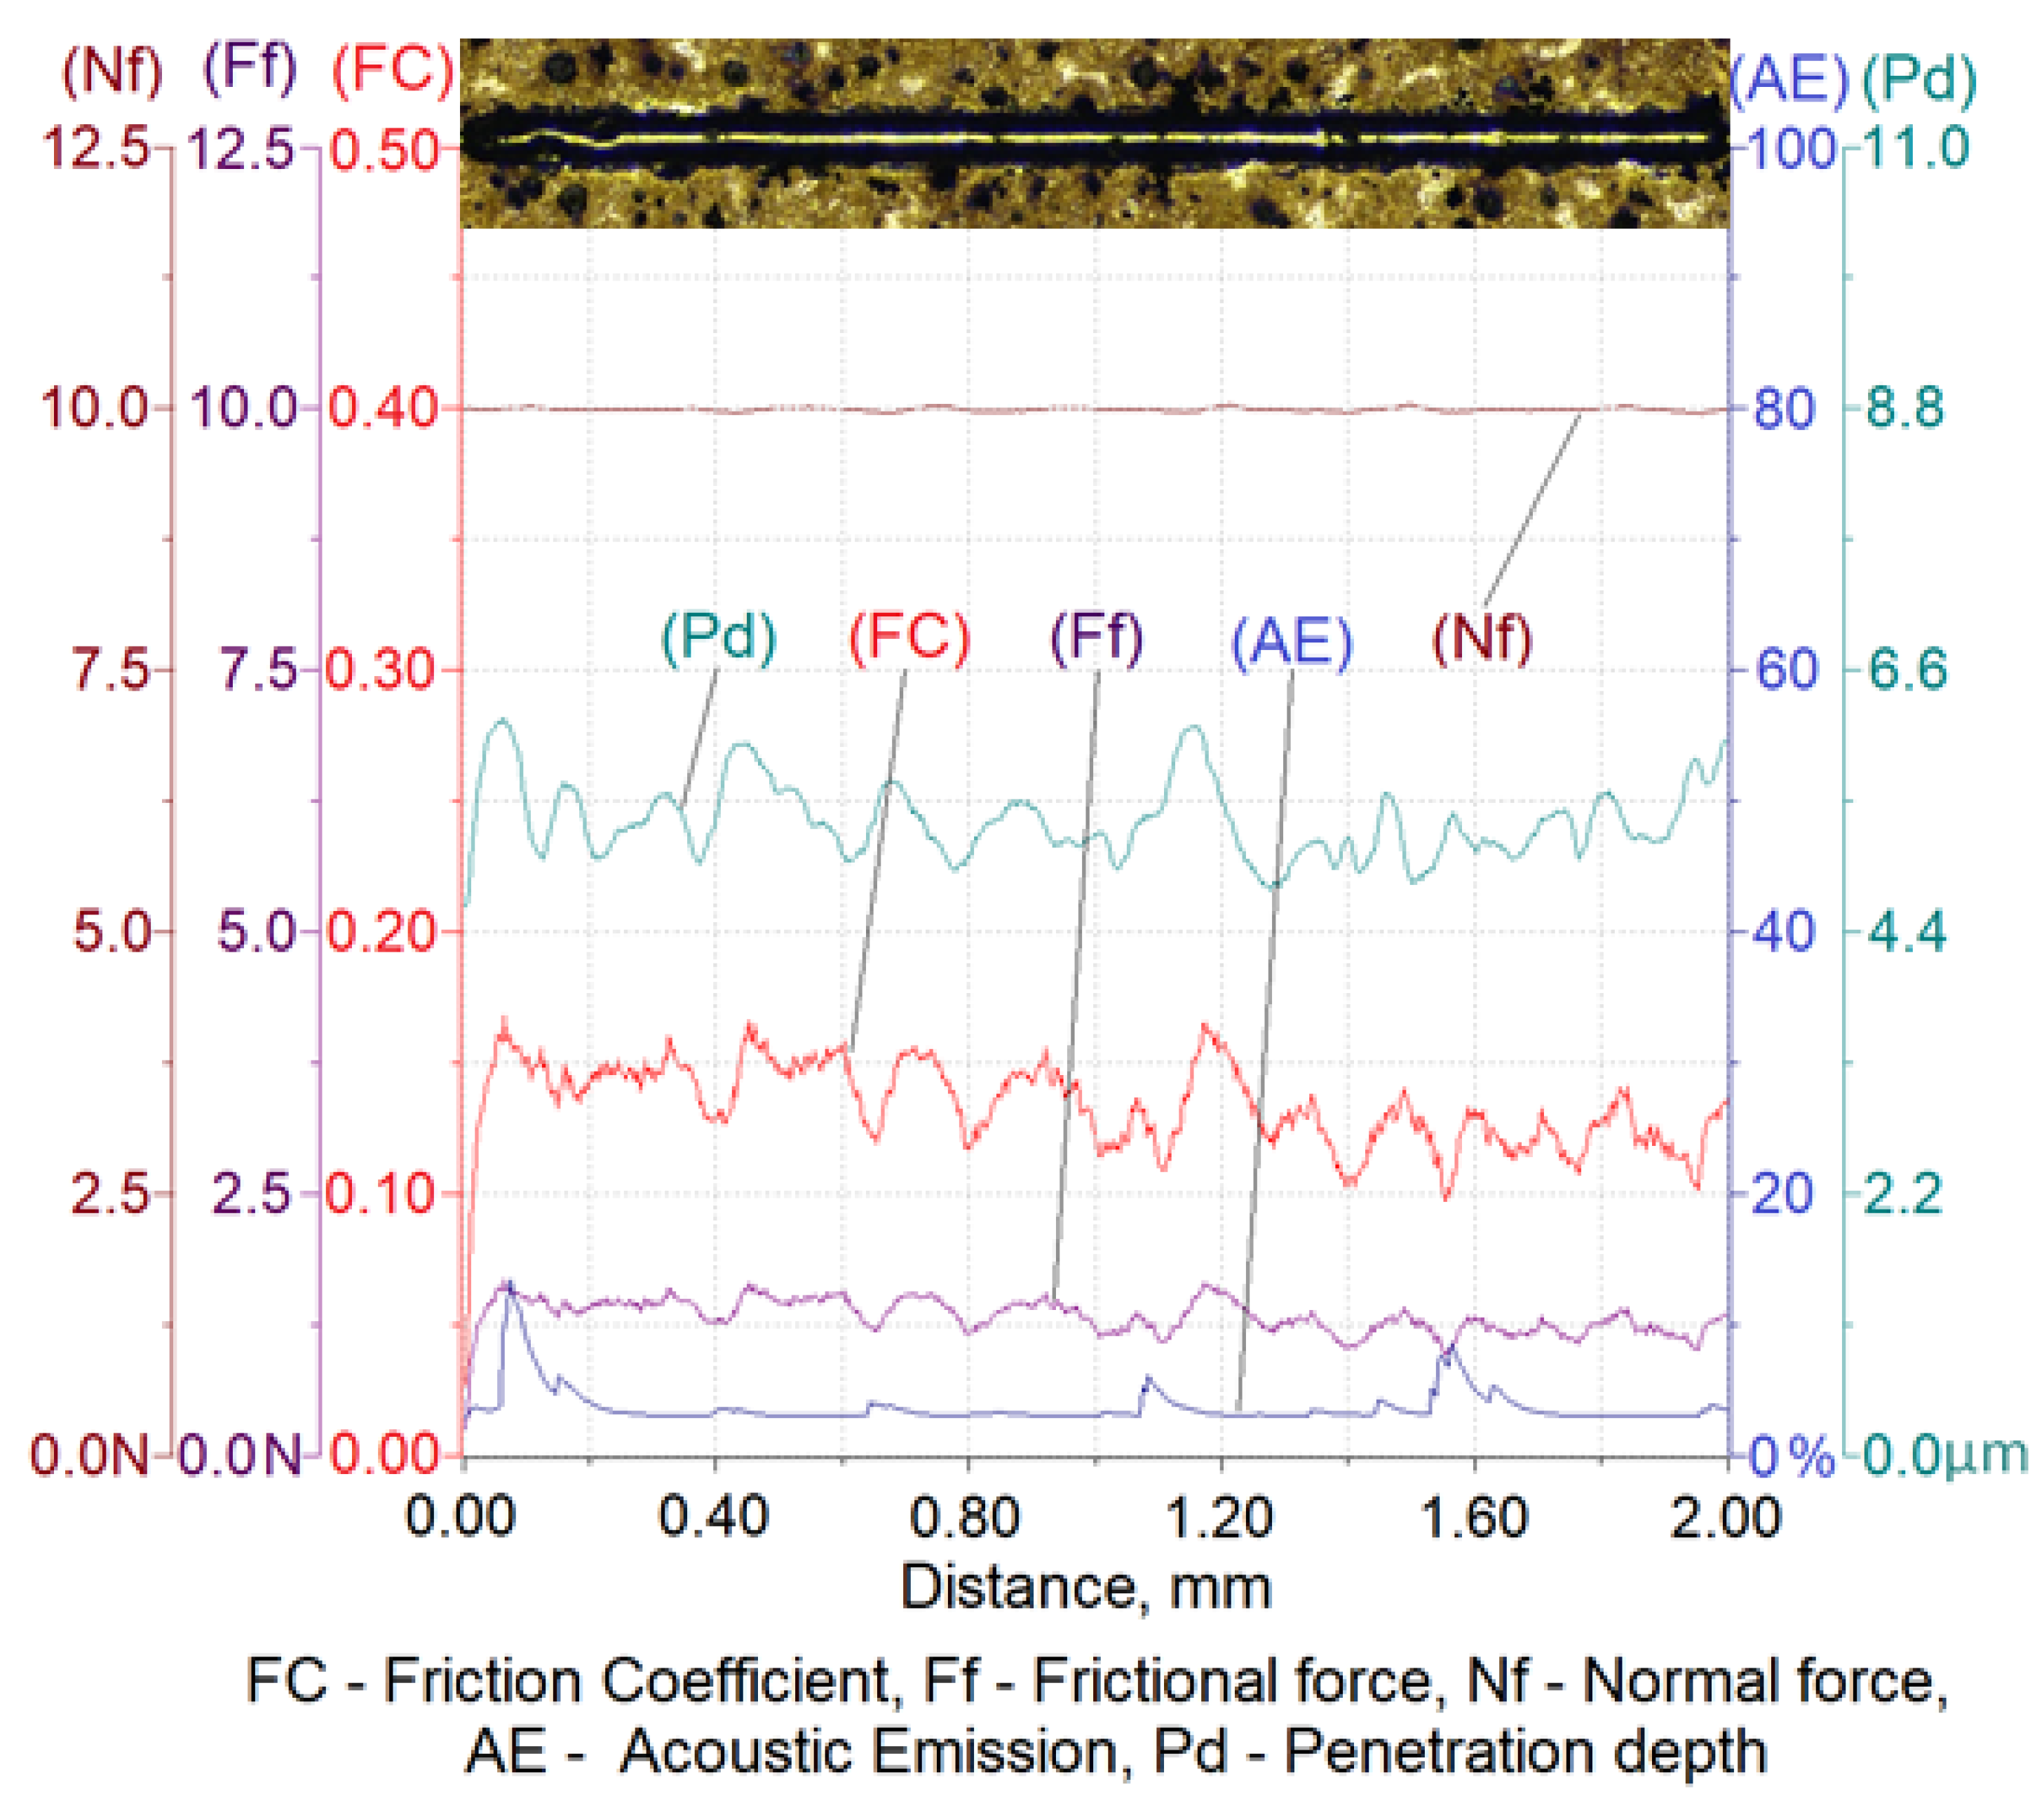
Figure 10.
Results of ADI cast iron scratch susceptibility tests in variant 2.2.
Figure 10.
Results of ADI cast iron scratch susceptibility tests in variant 2.2.
Figure 11.
Results of ADI cast iron scratch susceptibility tests in variant 6.2.
Figure 11.
Results of ADI cast iron scratch susceptibility tests in variant 6.2.
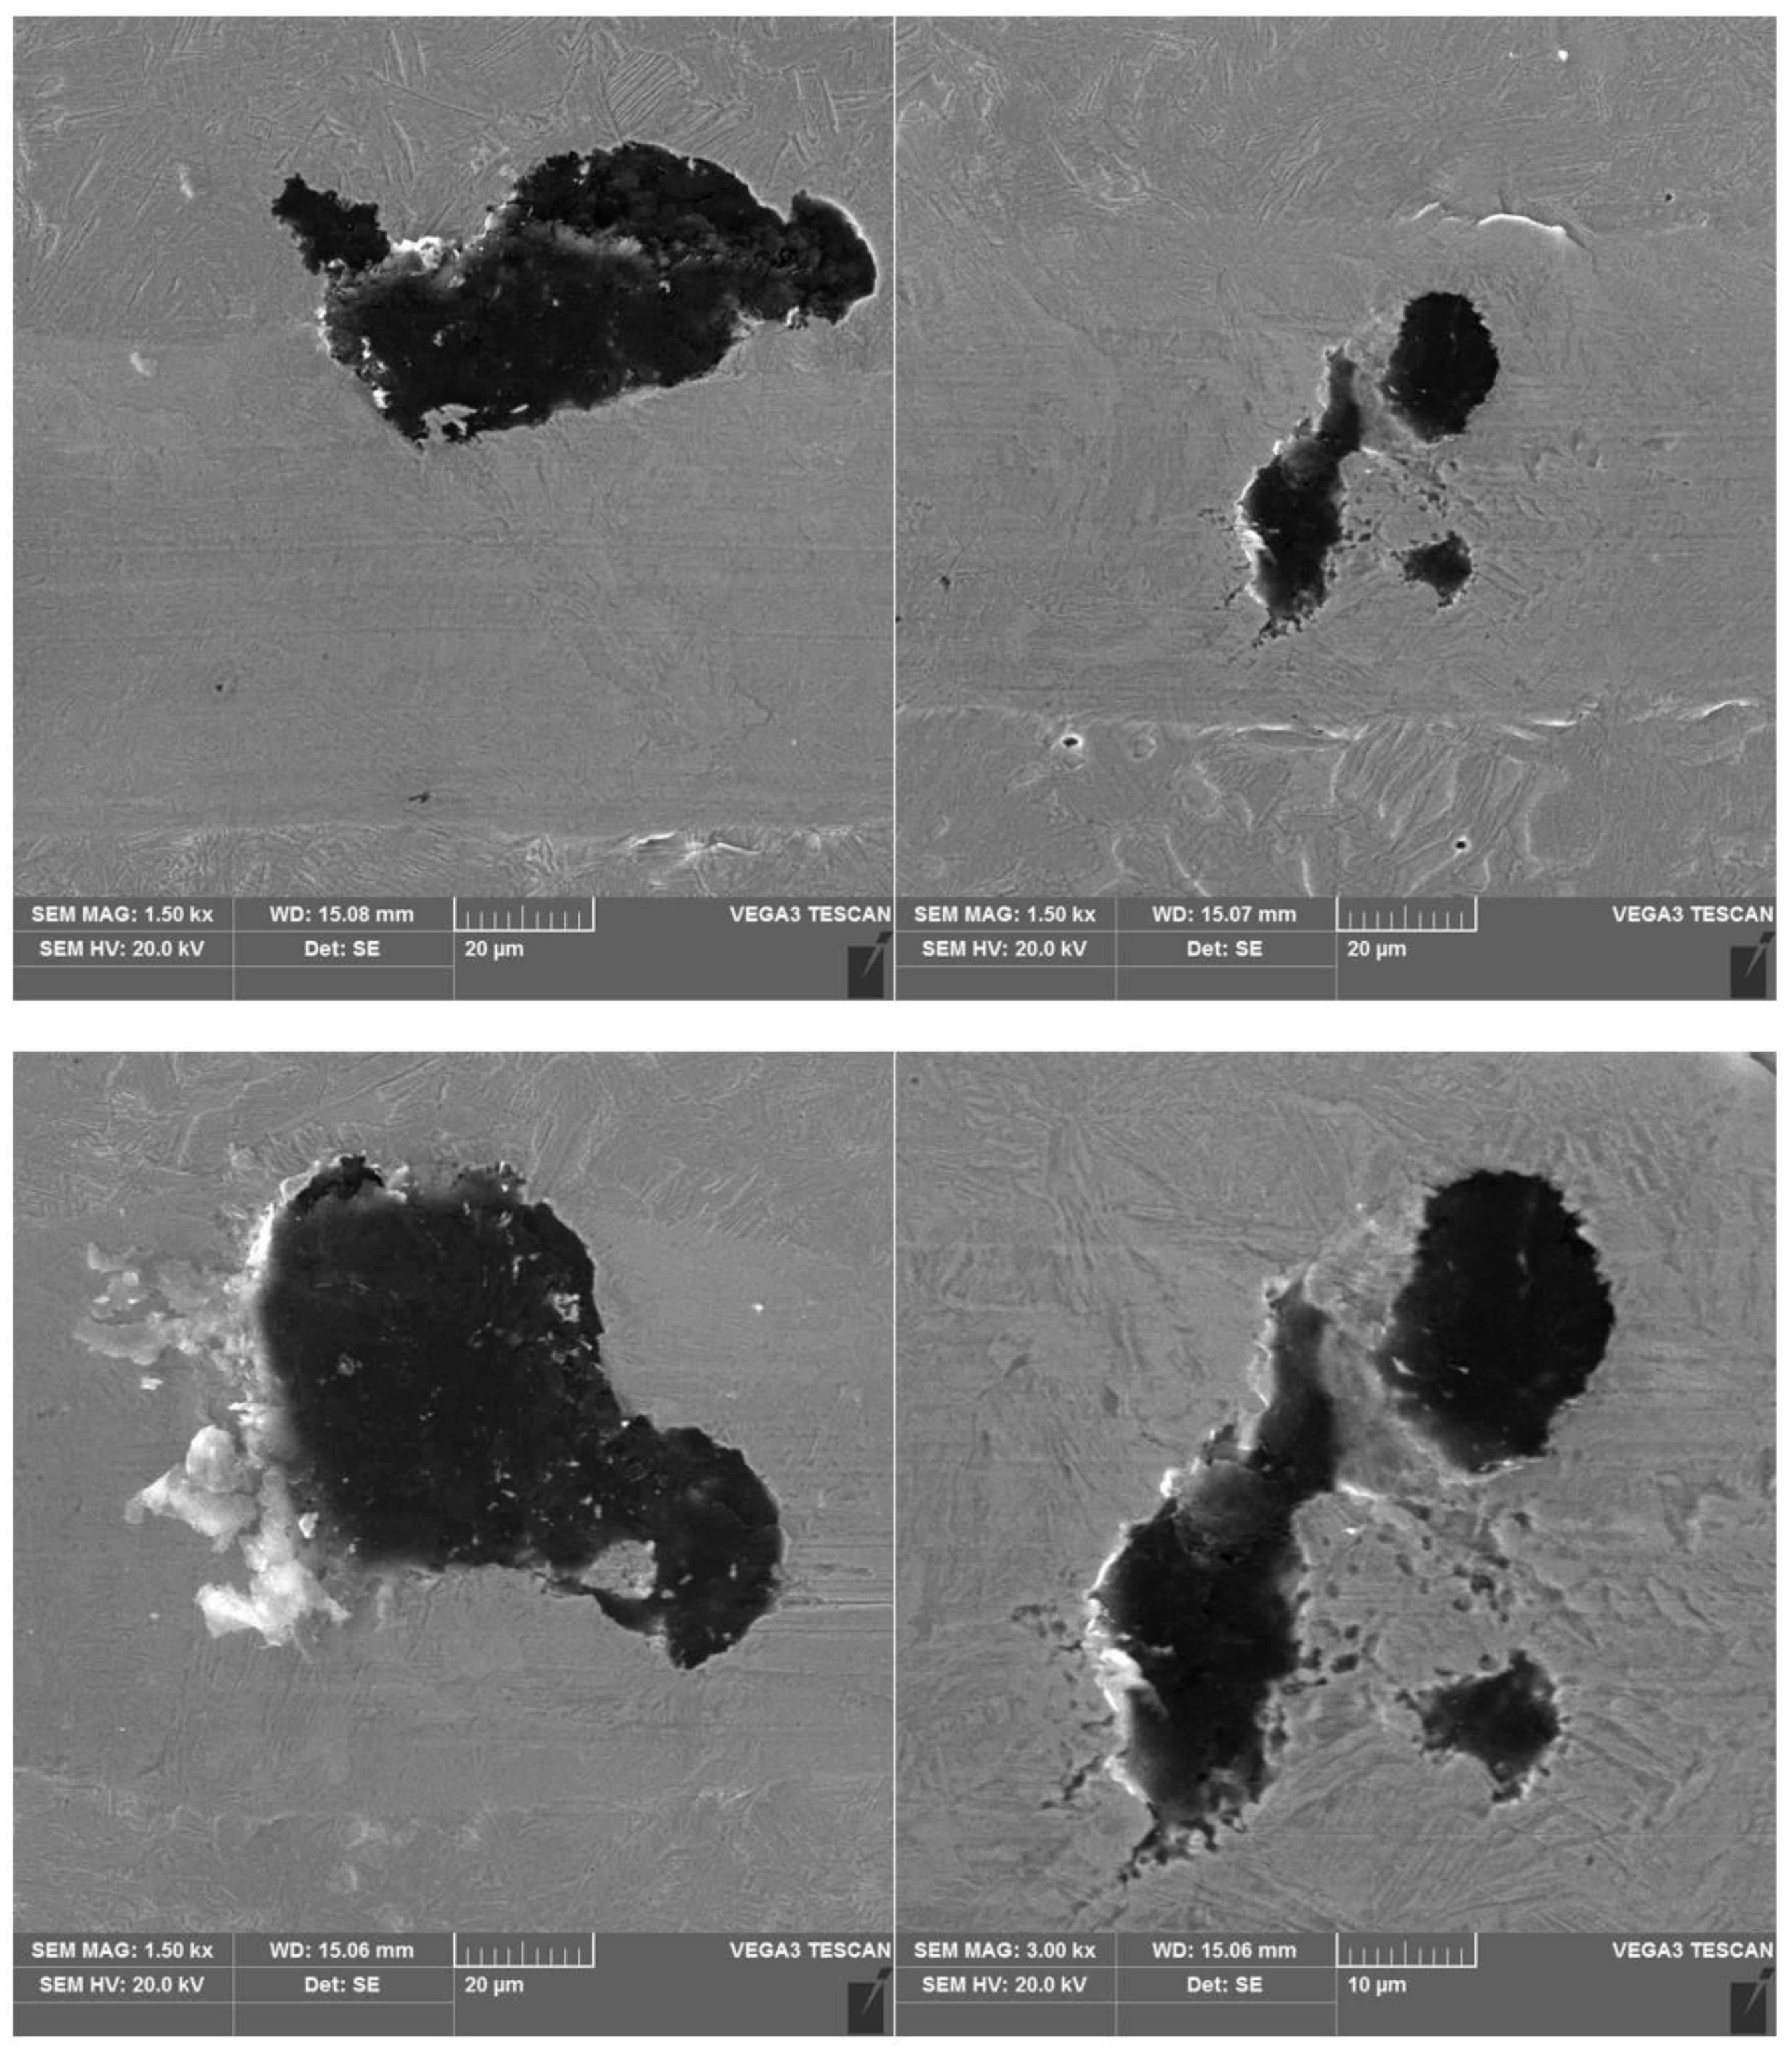
Figure 12.
SEM images of a scratch made on an ADI cast iron sample—variant 2.1.
Figure 12.
SEM images of a scratch made on an ADI cast iron sample—variant 2.1.
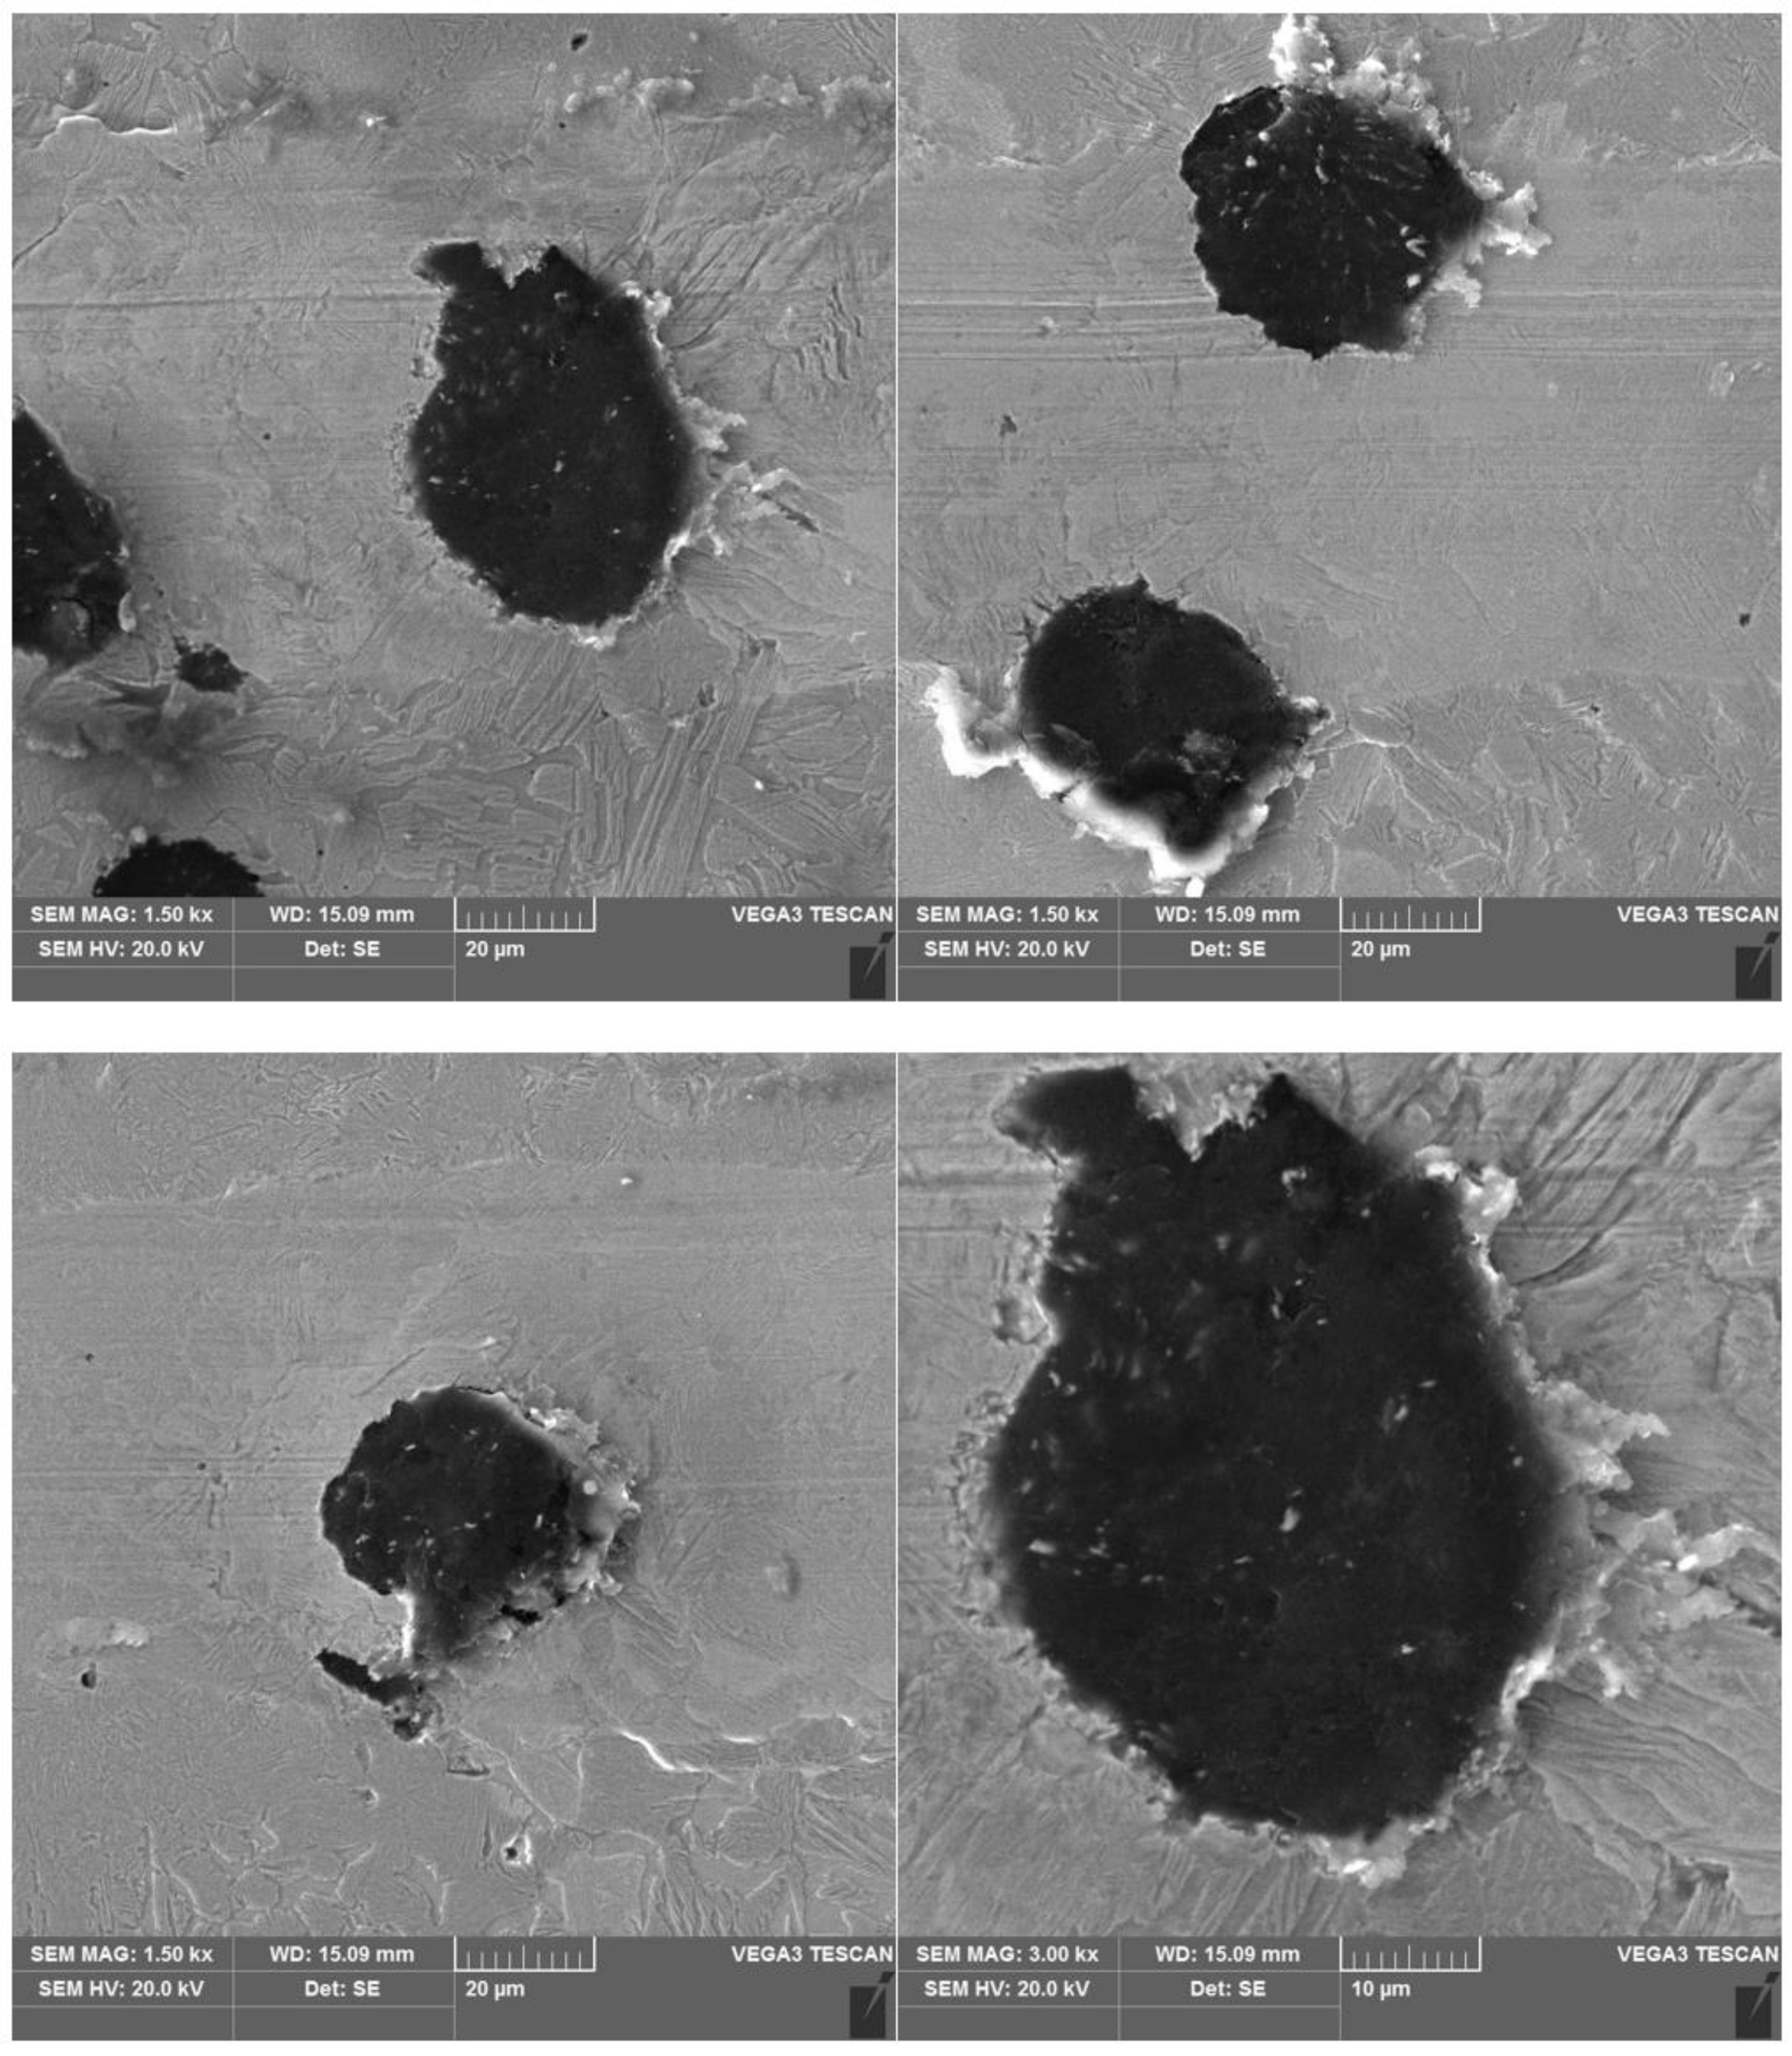
Figure 13.
SEM images of a scratch made on an ADI cast iron sample—variant 6.1.
Figure 13.
SEM images of a scratch made on an ADI cast iron sample—variant 6.1.
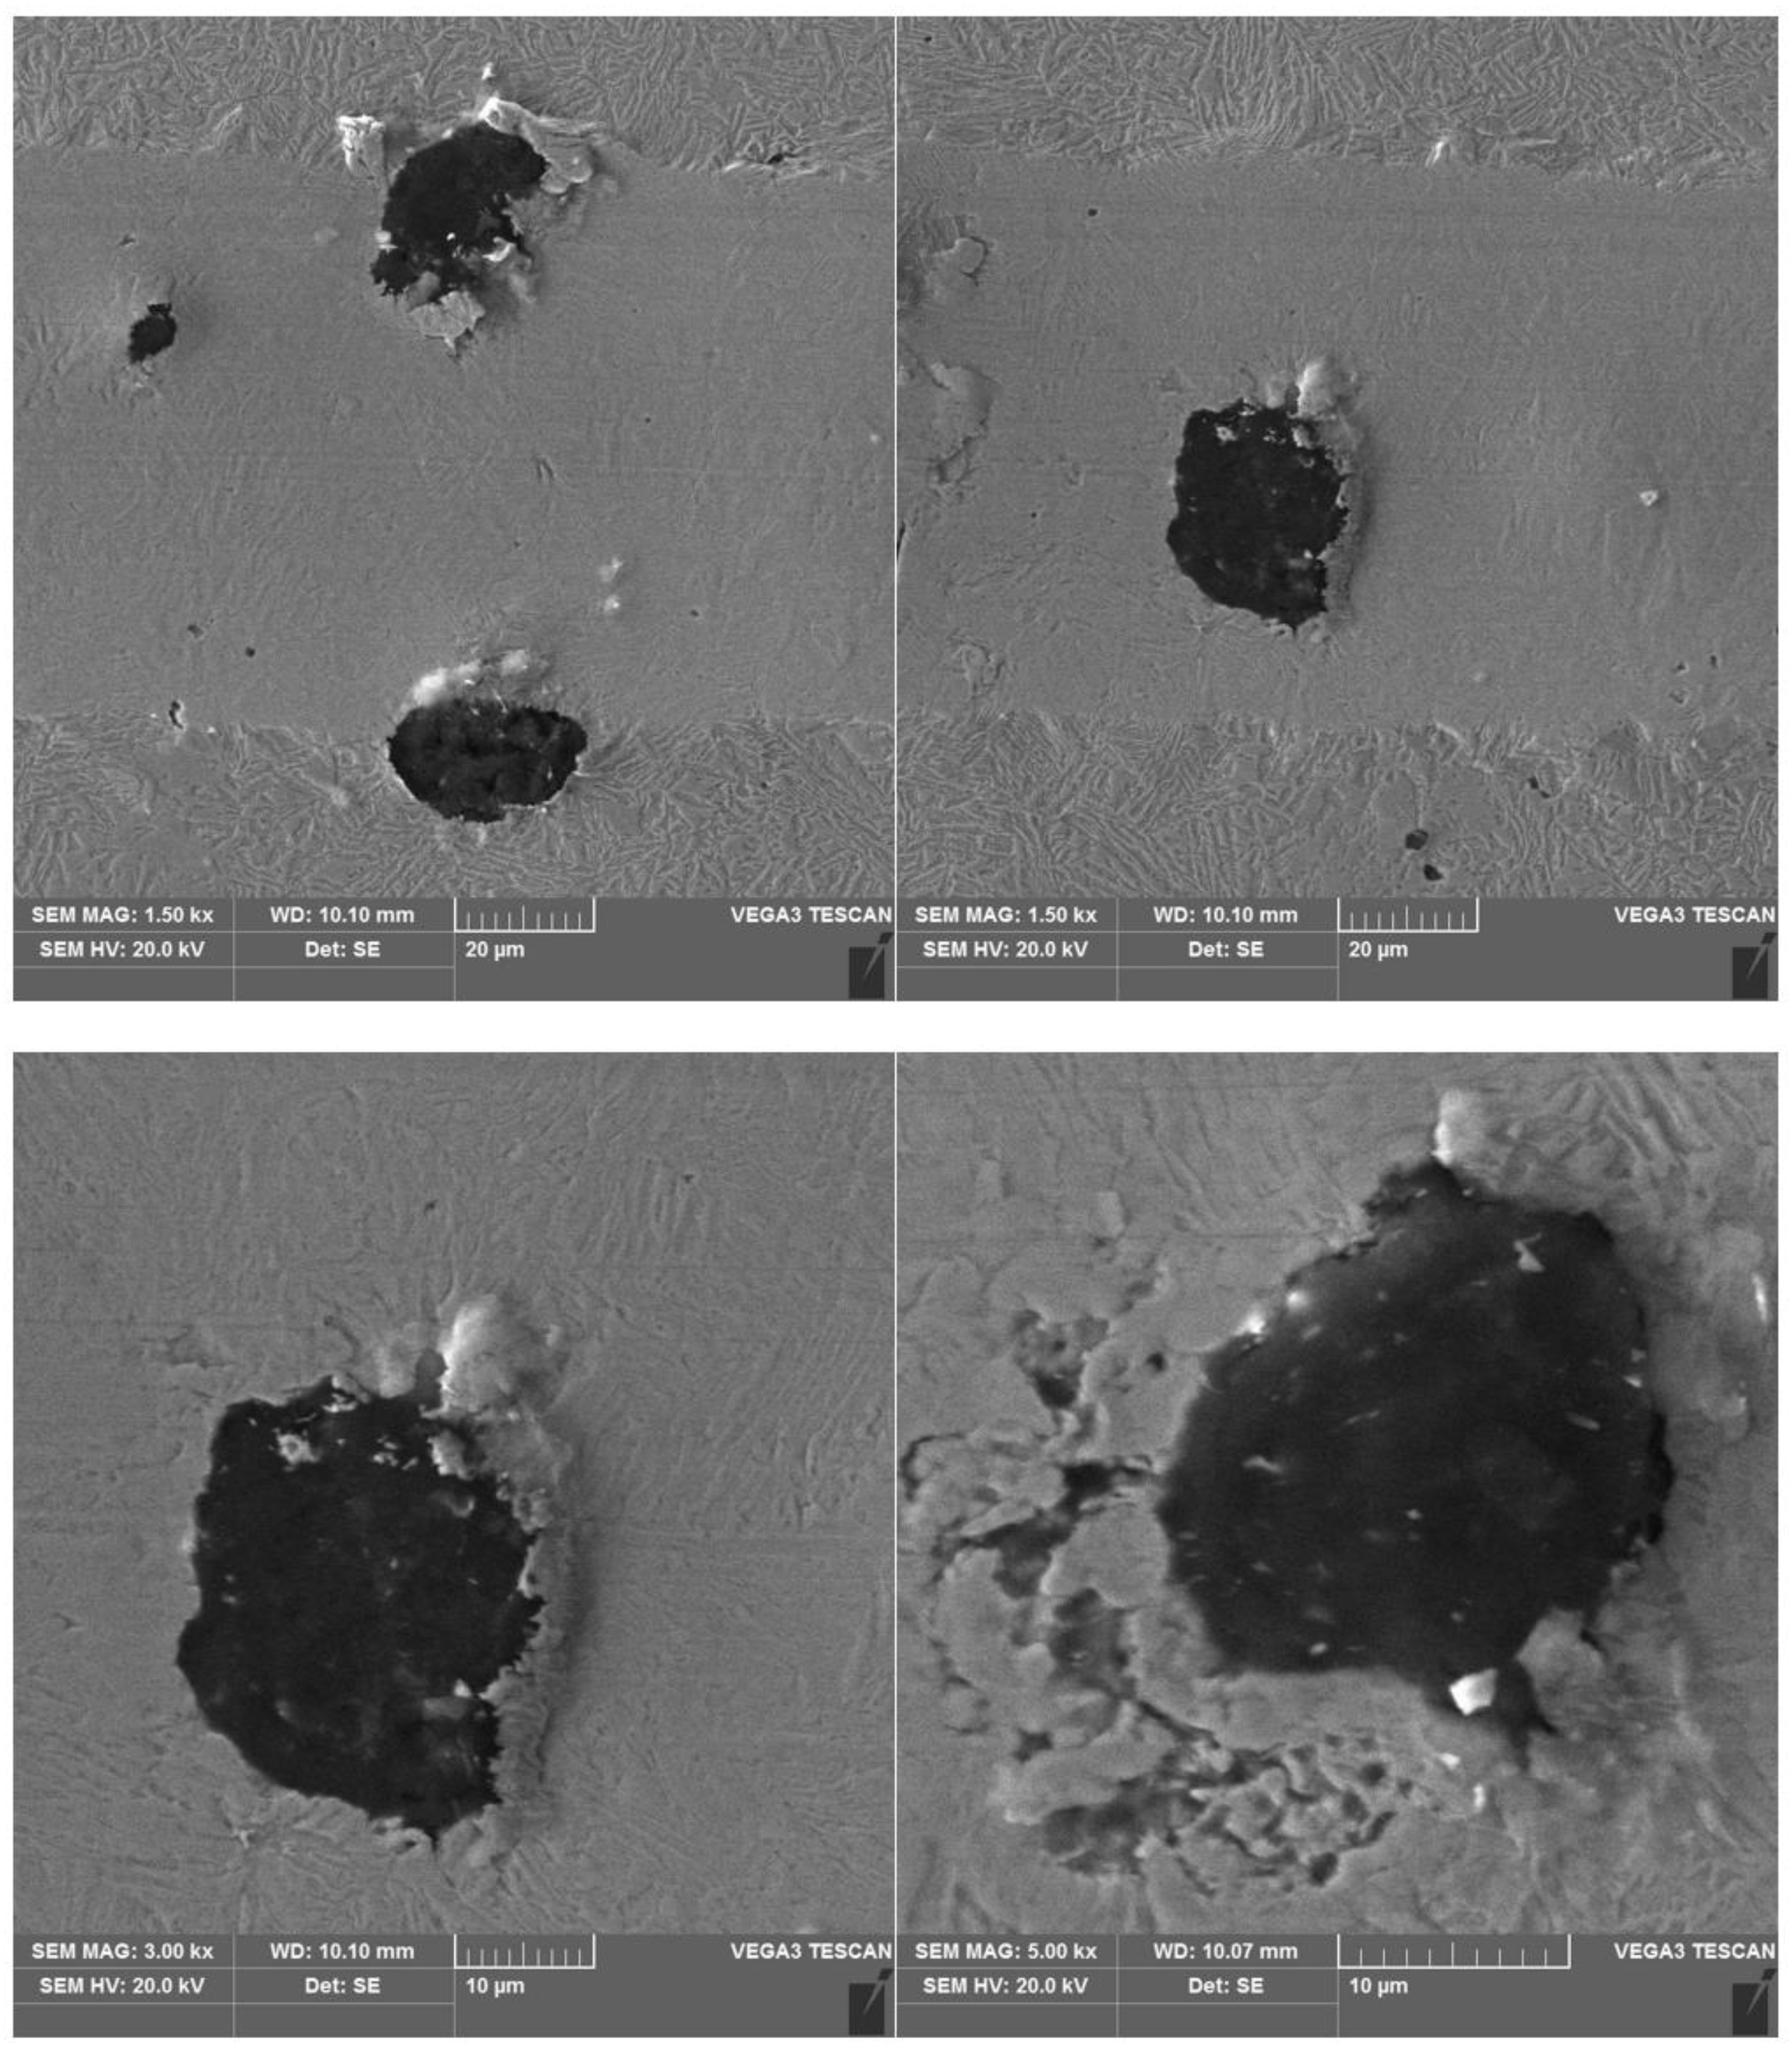
Figure 14.
SEM images of a scratch made on an ADI cast iron sample—variant 2.2.
Figure 14.
SEM images of a scratch made on an ADI cast iron sample—variant 2.2.
Figure 15.
SEM images of a scratch made on an ADI cast iron sample—variant 6.2.
Figure 15.
SEM images of a scratch made on an ADI cast iron sample—variant 6.2.
Figure 16.
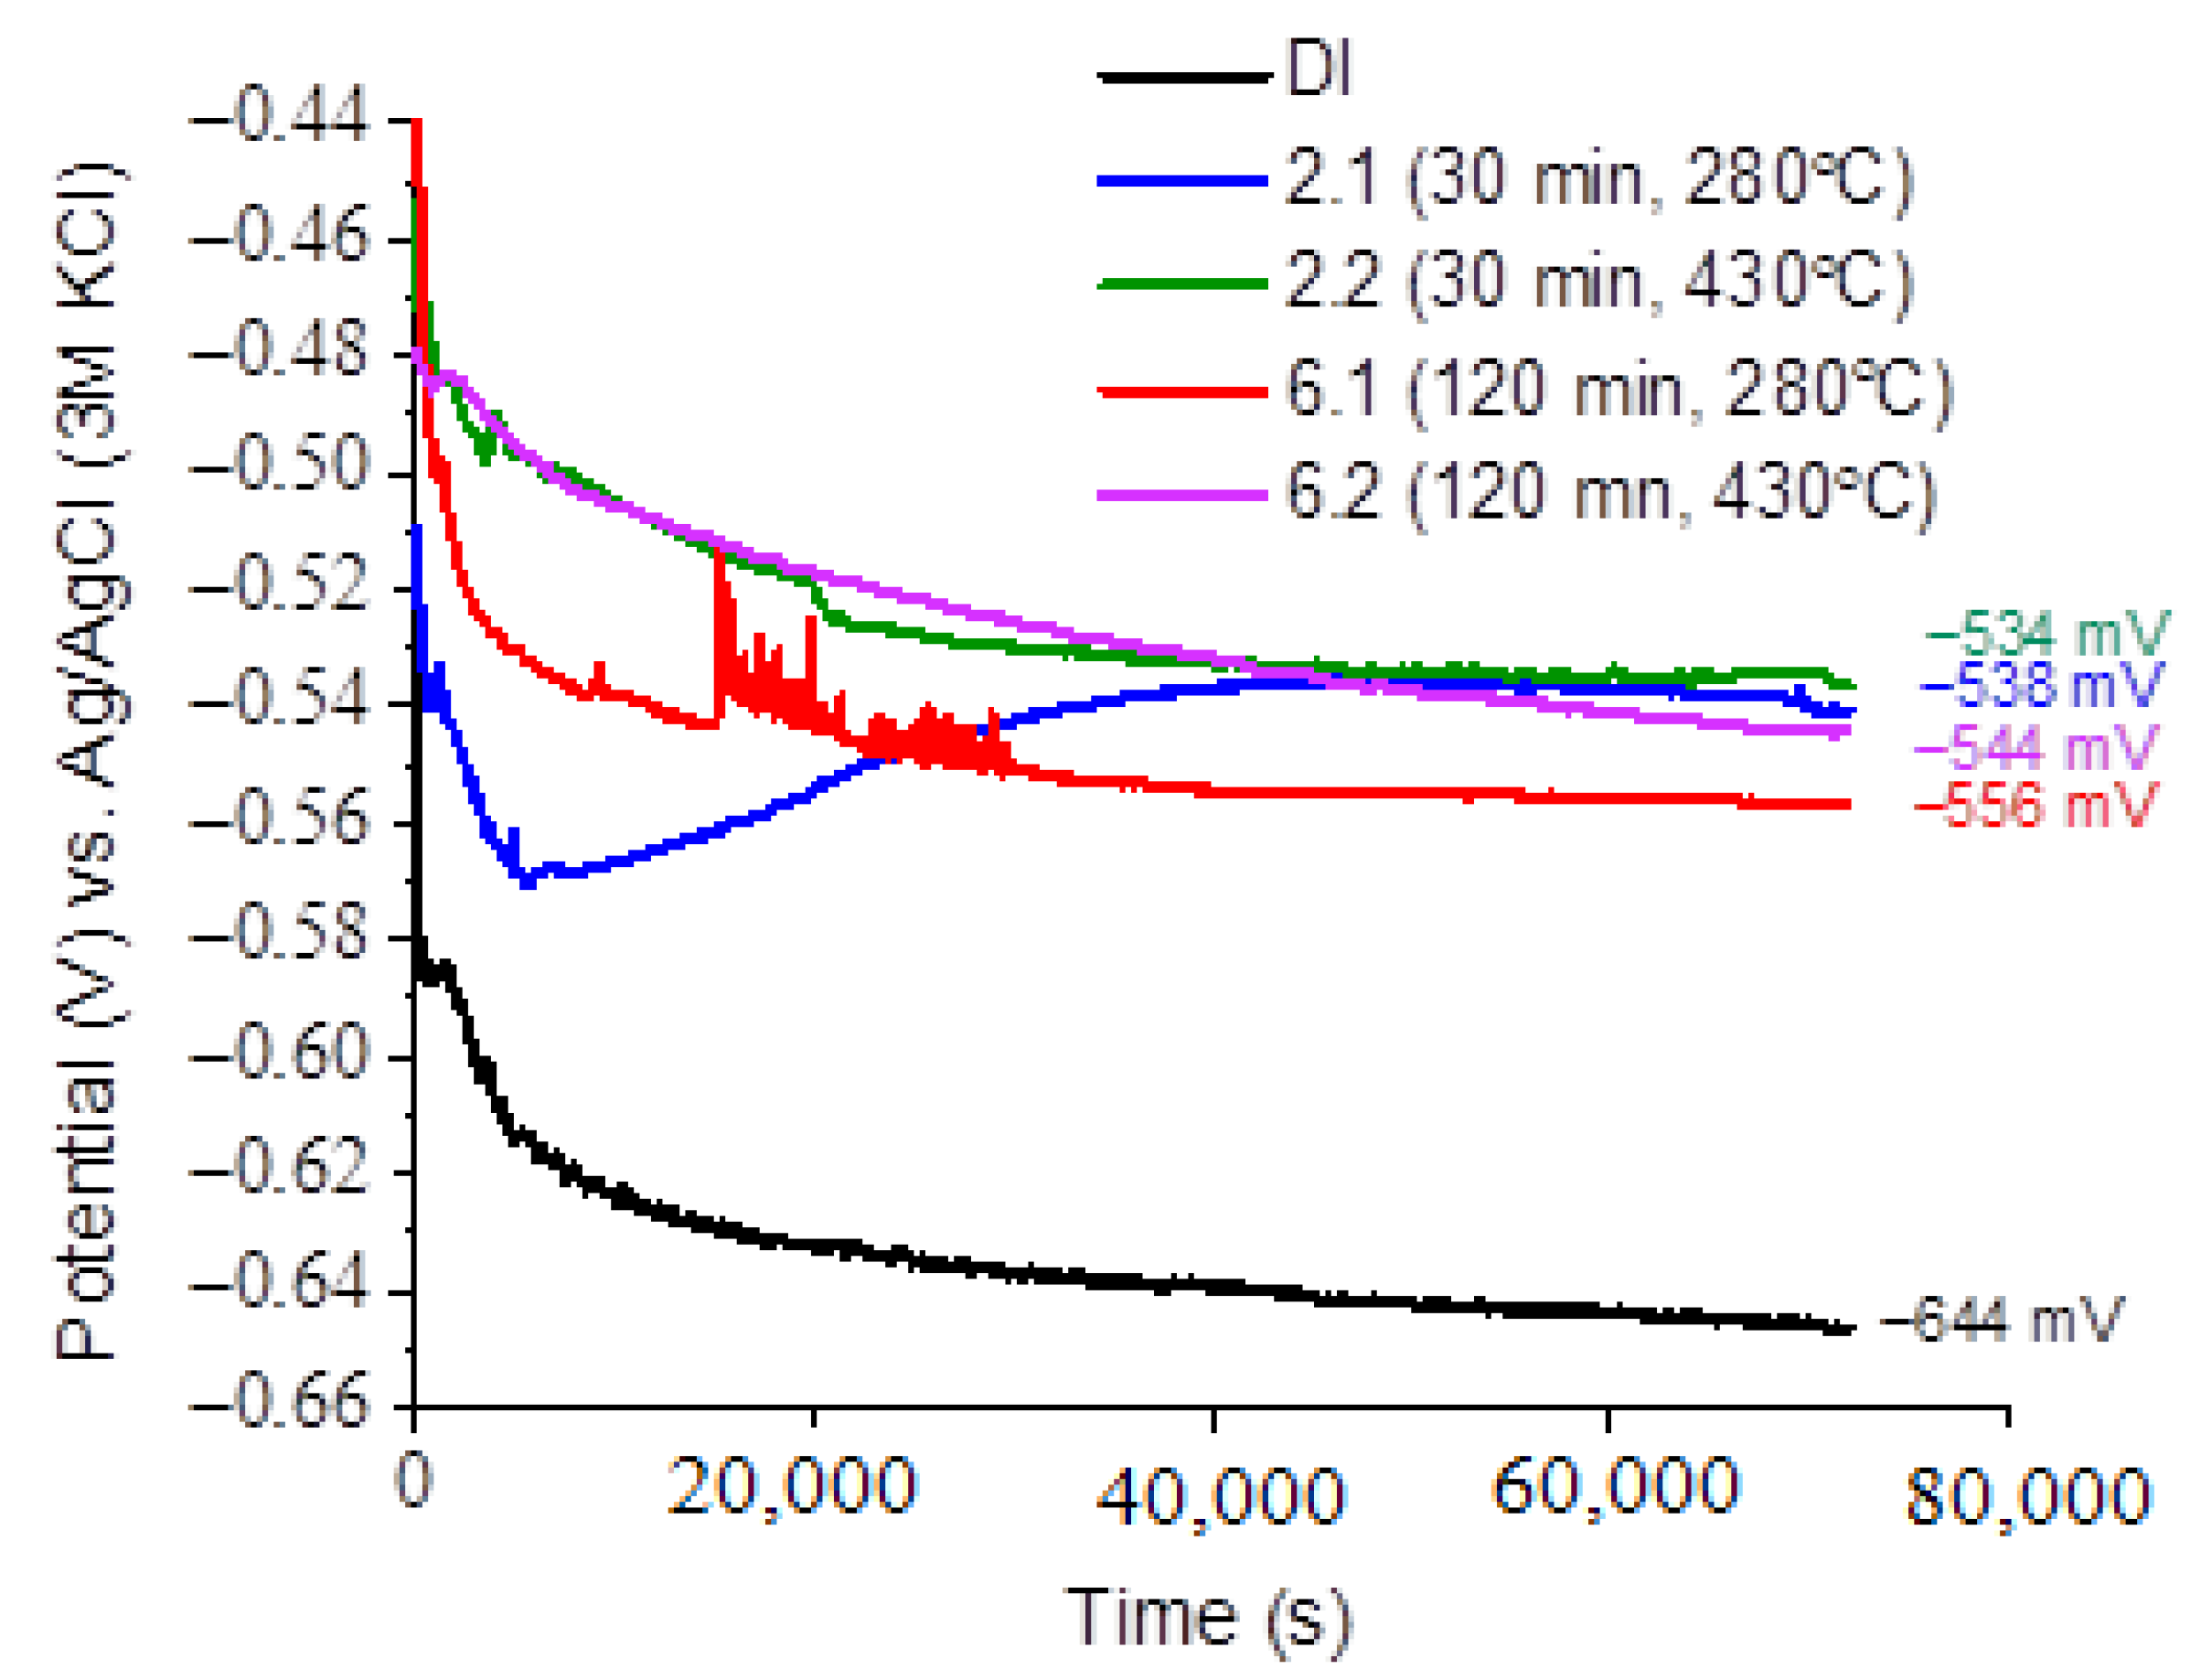
Evolution of open circuit potential (OCP) versus time in 0.05 M NaCl solution.
Figure 16.
Evolution of open circuit potential (OCP) versus time in 0.05 M NaCl solution.
Figure 17.
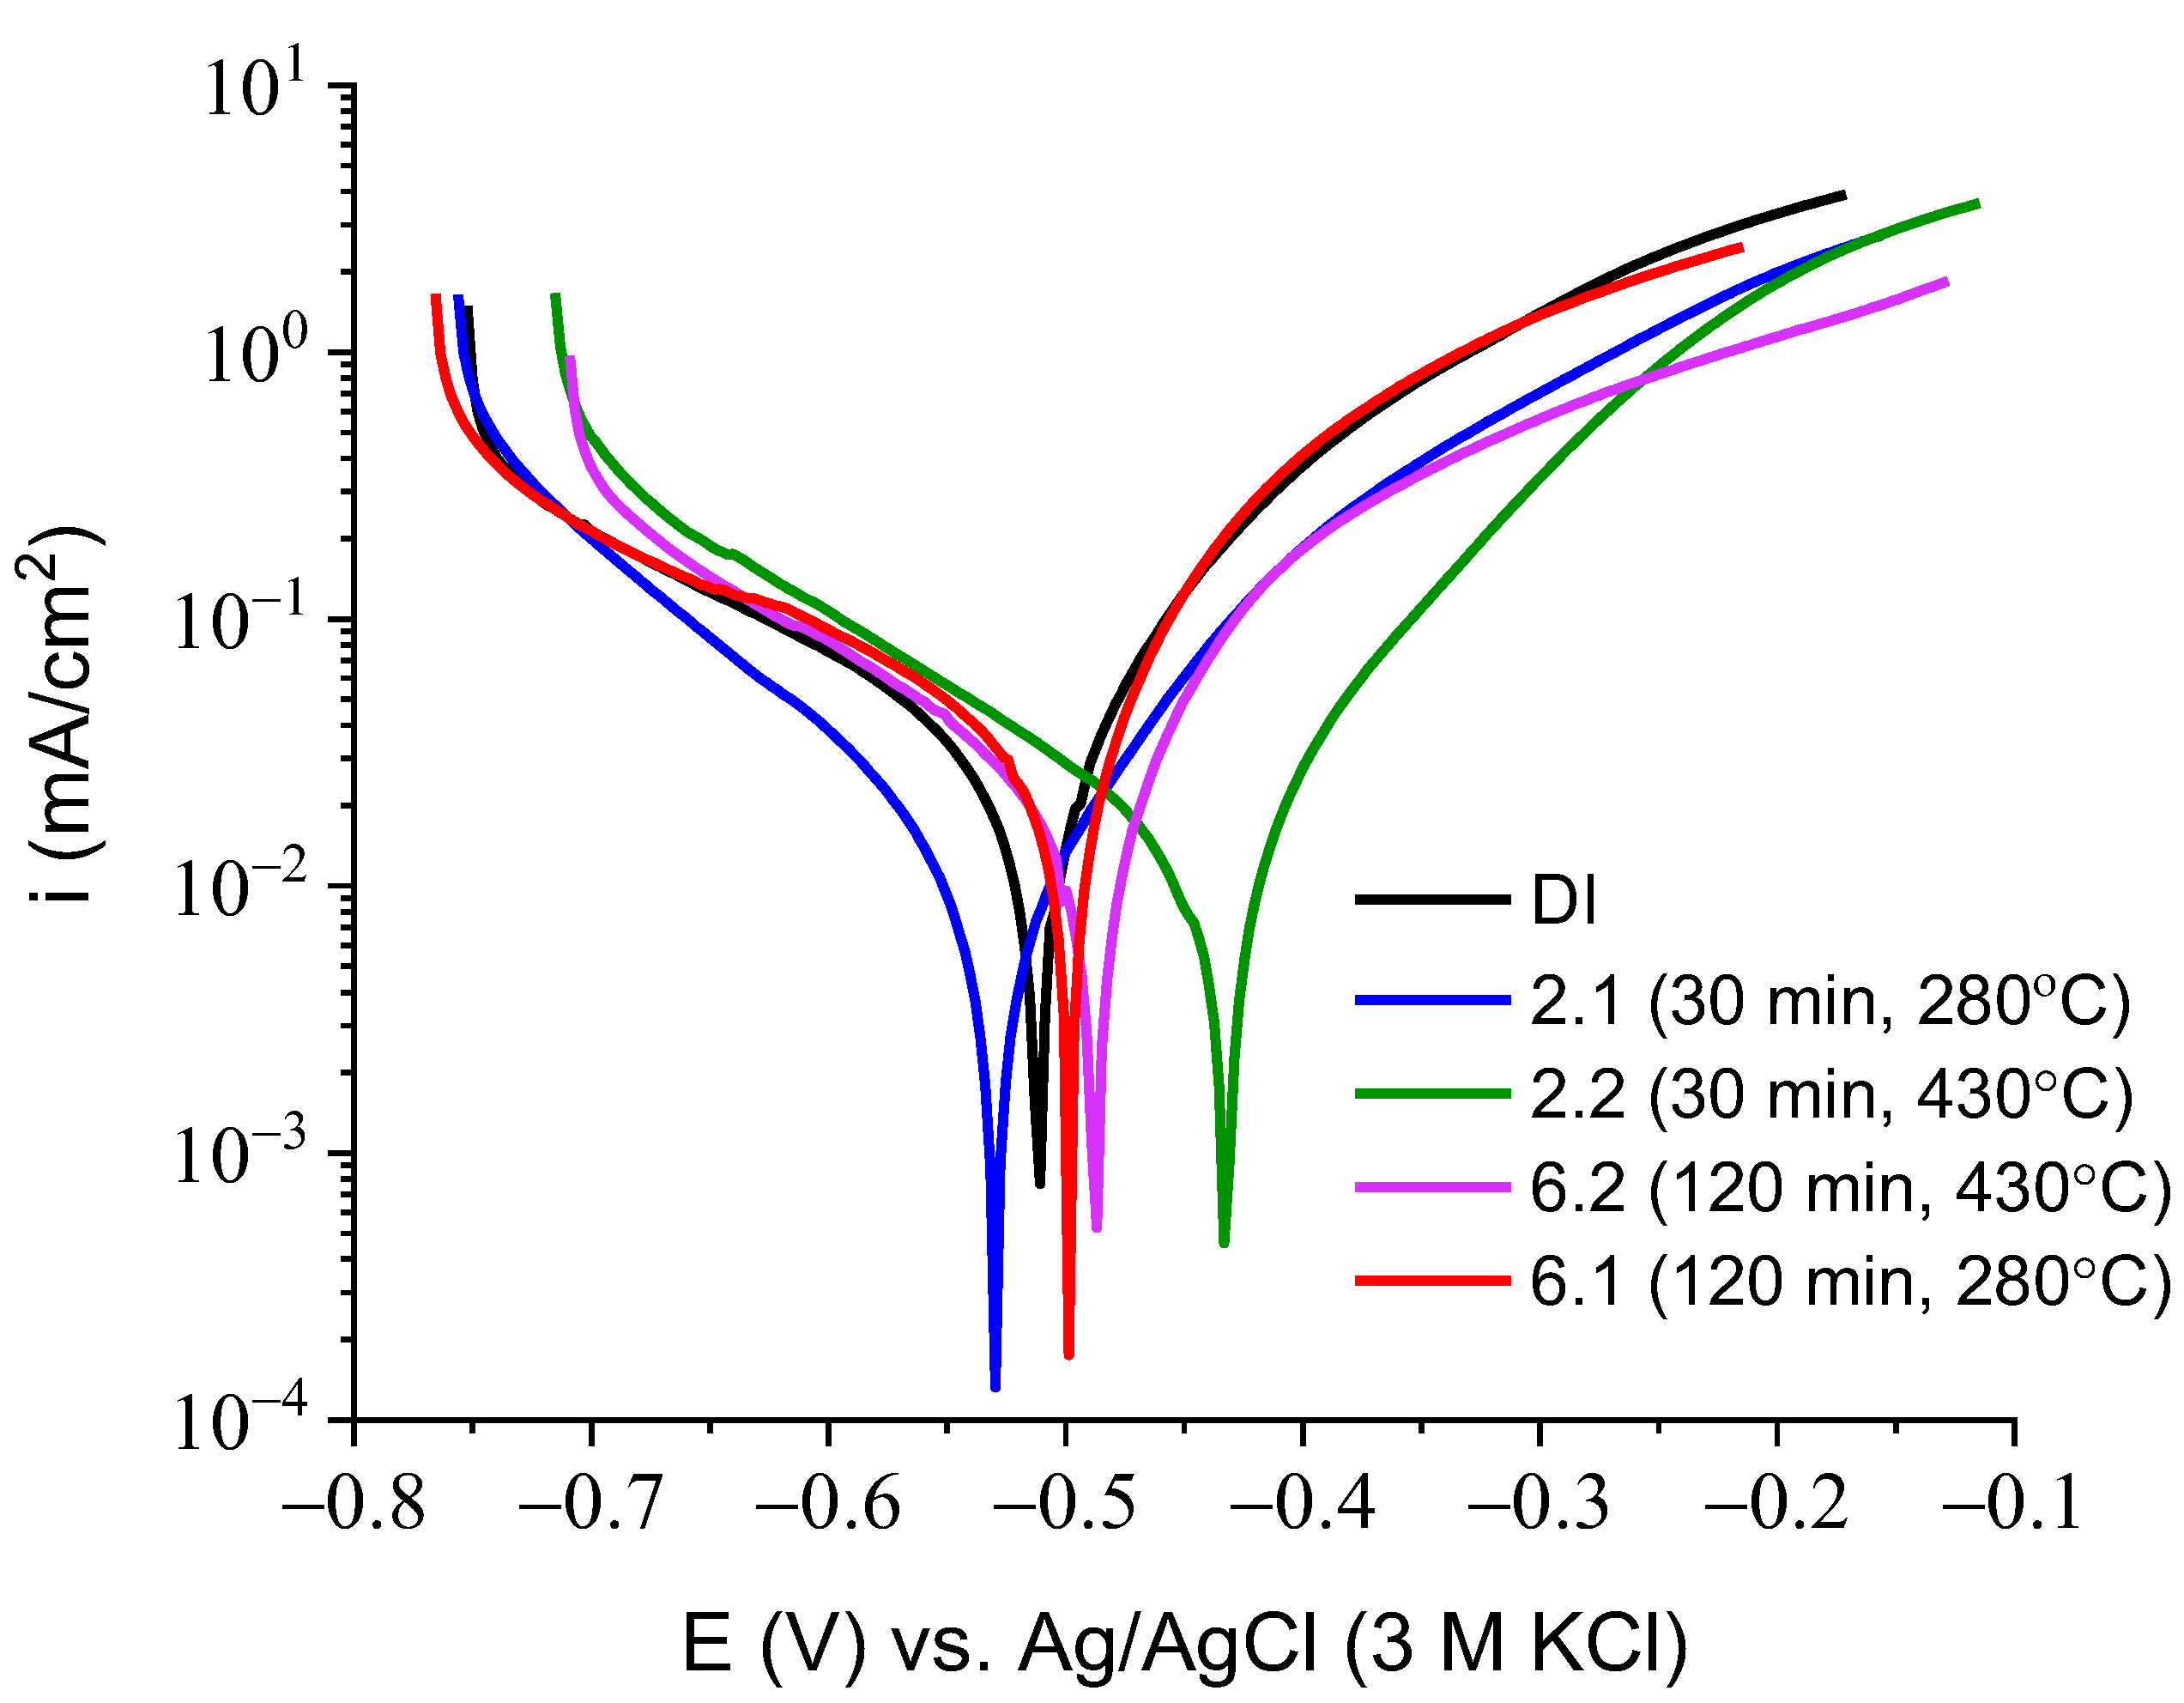
LSV curves measured for ductile iron in the 0.05 M NaCl solution. Potential scan rate of 1 mV/s.
Figure 17.
LSV curves measured for ductile iron in the 0.05 M NaCl solution. Potential scan rate of 1 mV/s.
Figure 18.
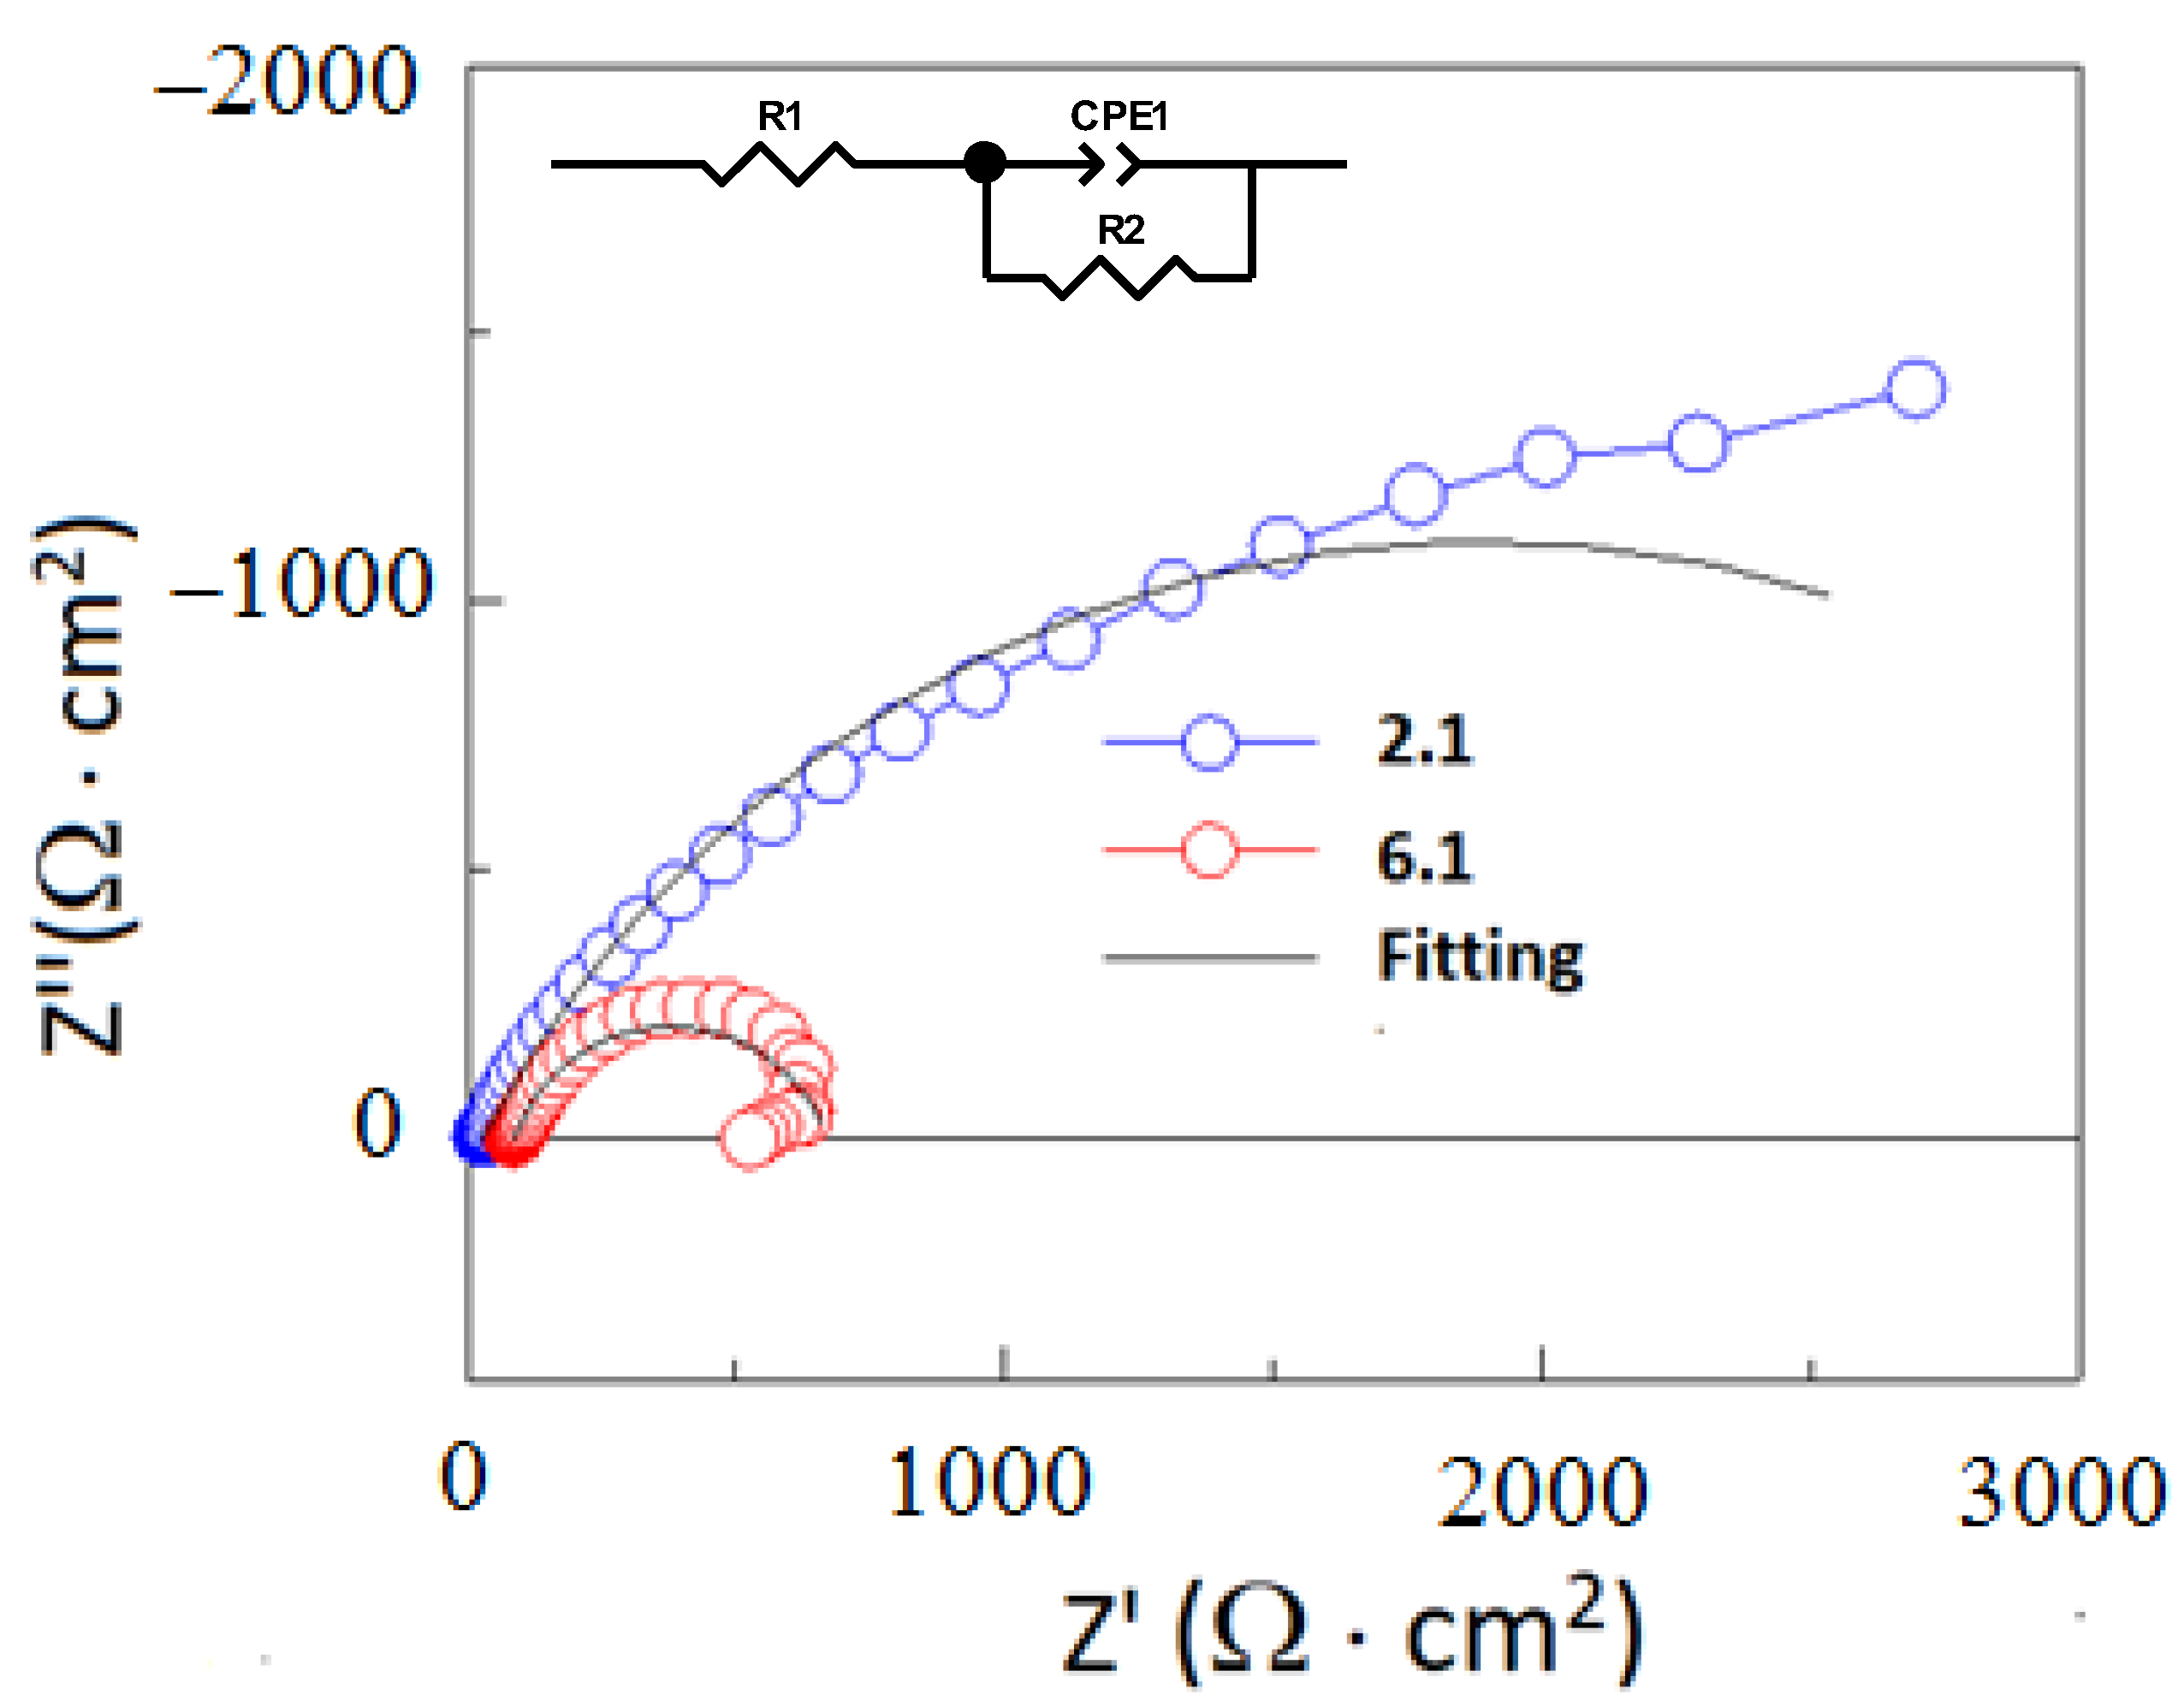
EIS spectra performed for 2.1 and 6.1 specimens at OCP in a 0.05 M NaCl solution. The electrical equivalent circuit.
Figure 18.
EIS spectra performed for 2.1 and 6.1 specimens at OCP in a 0.05 M NaCl solution. The electrical equivalent circuit.
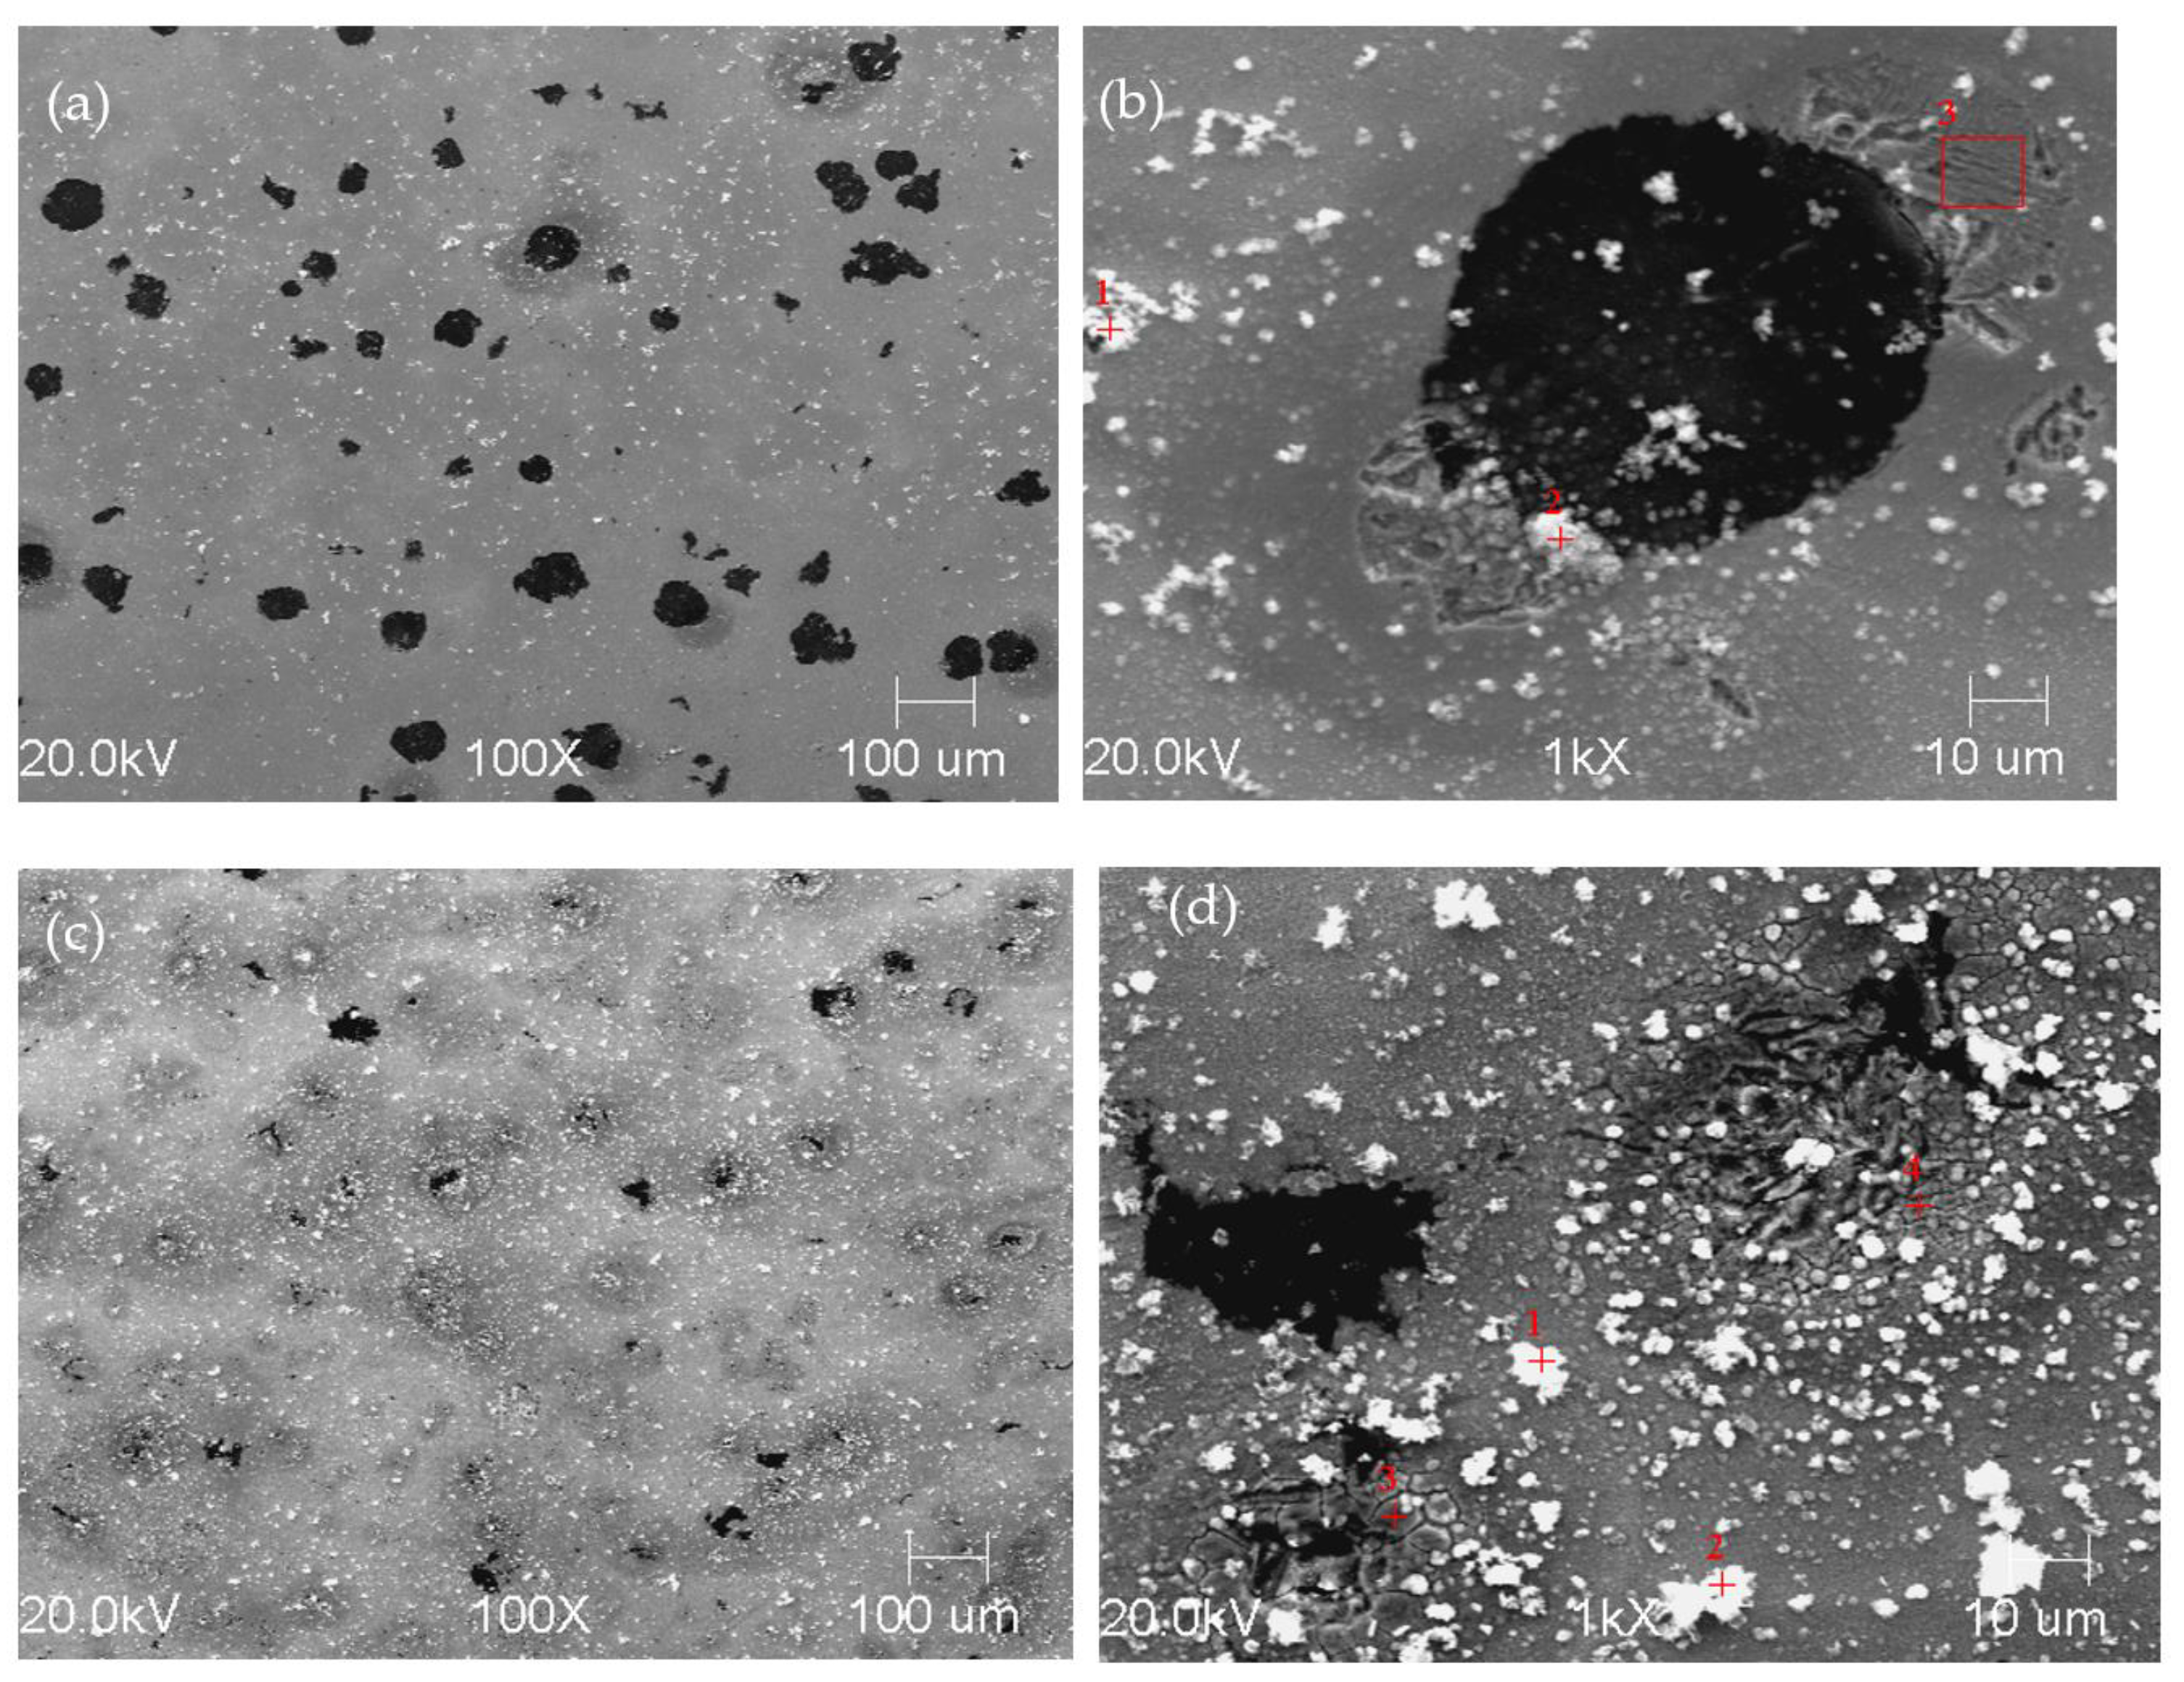
Figure 19.
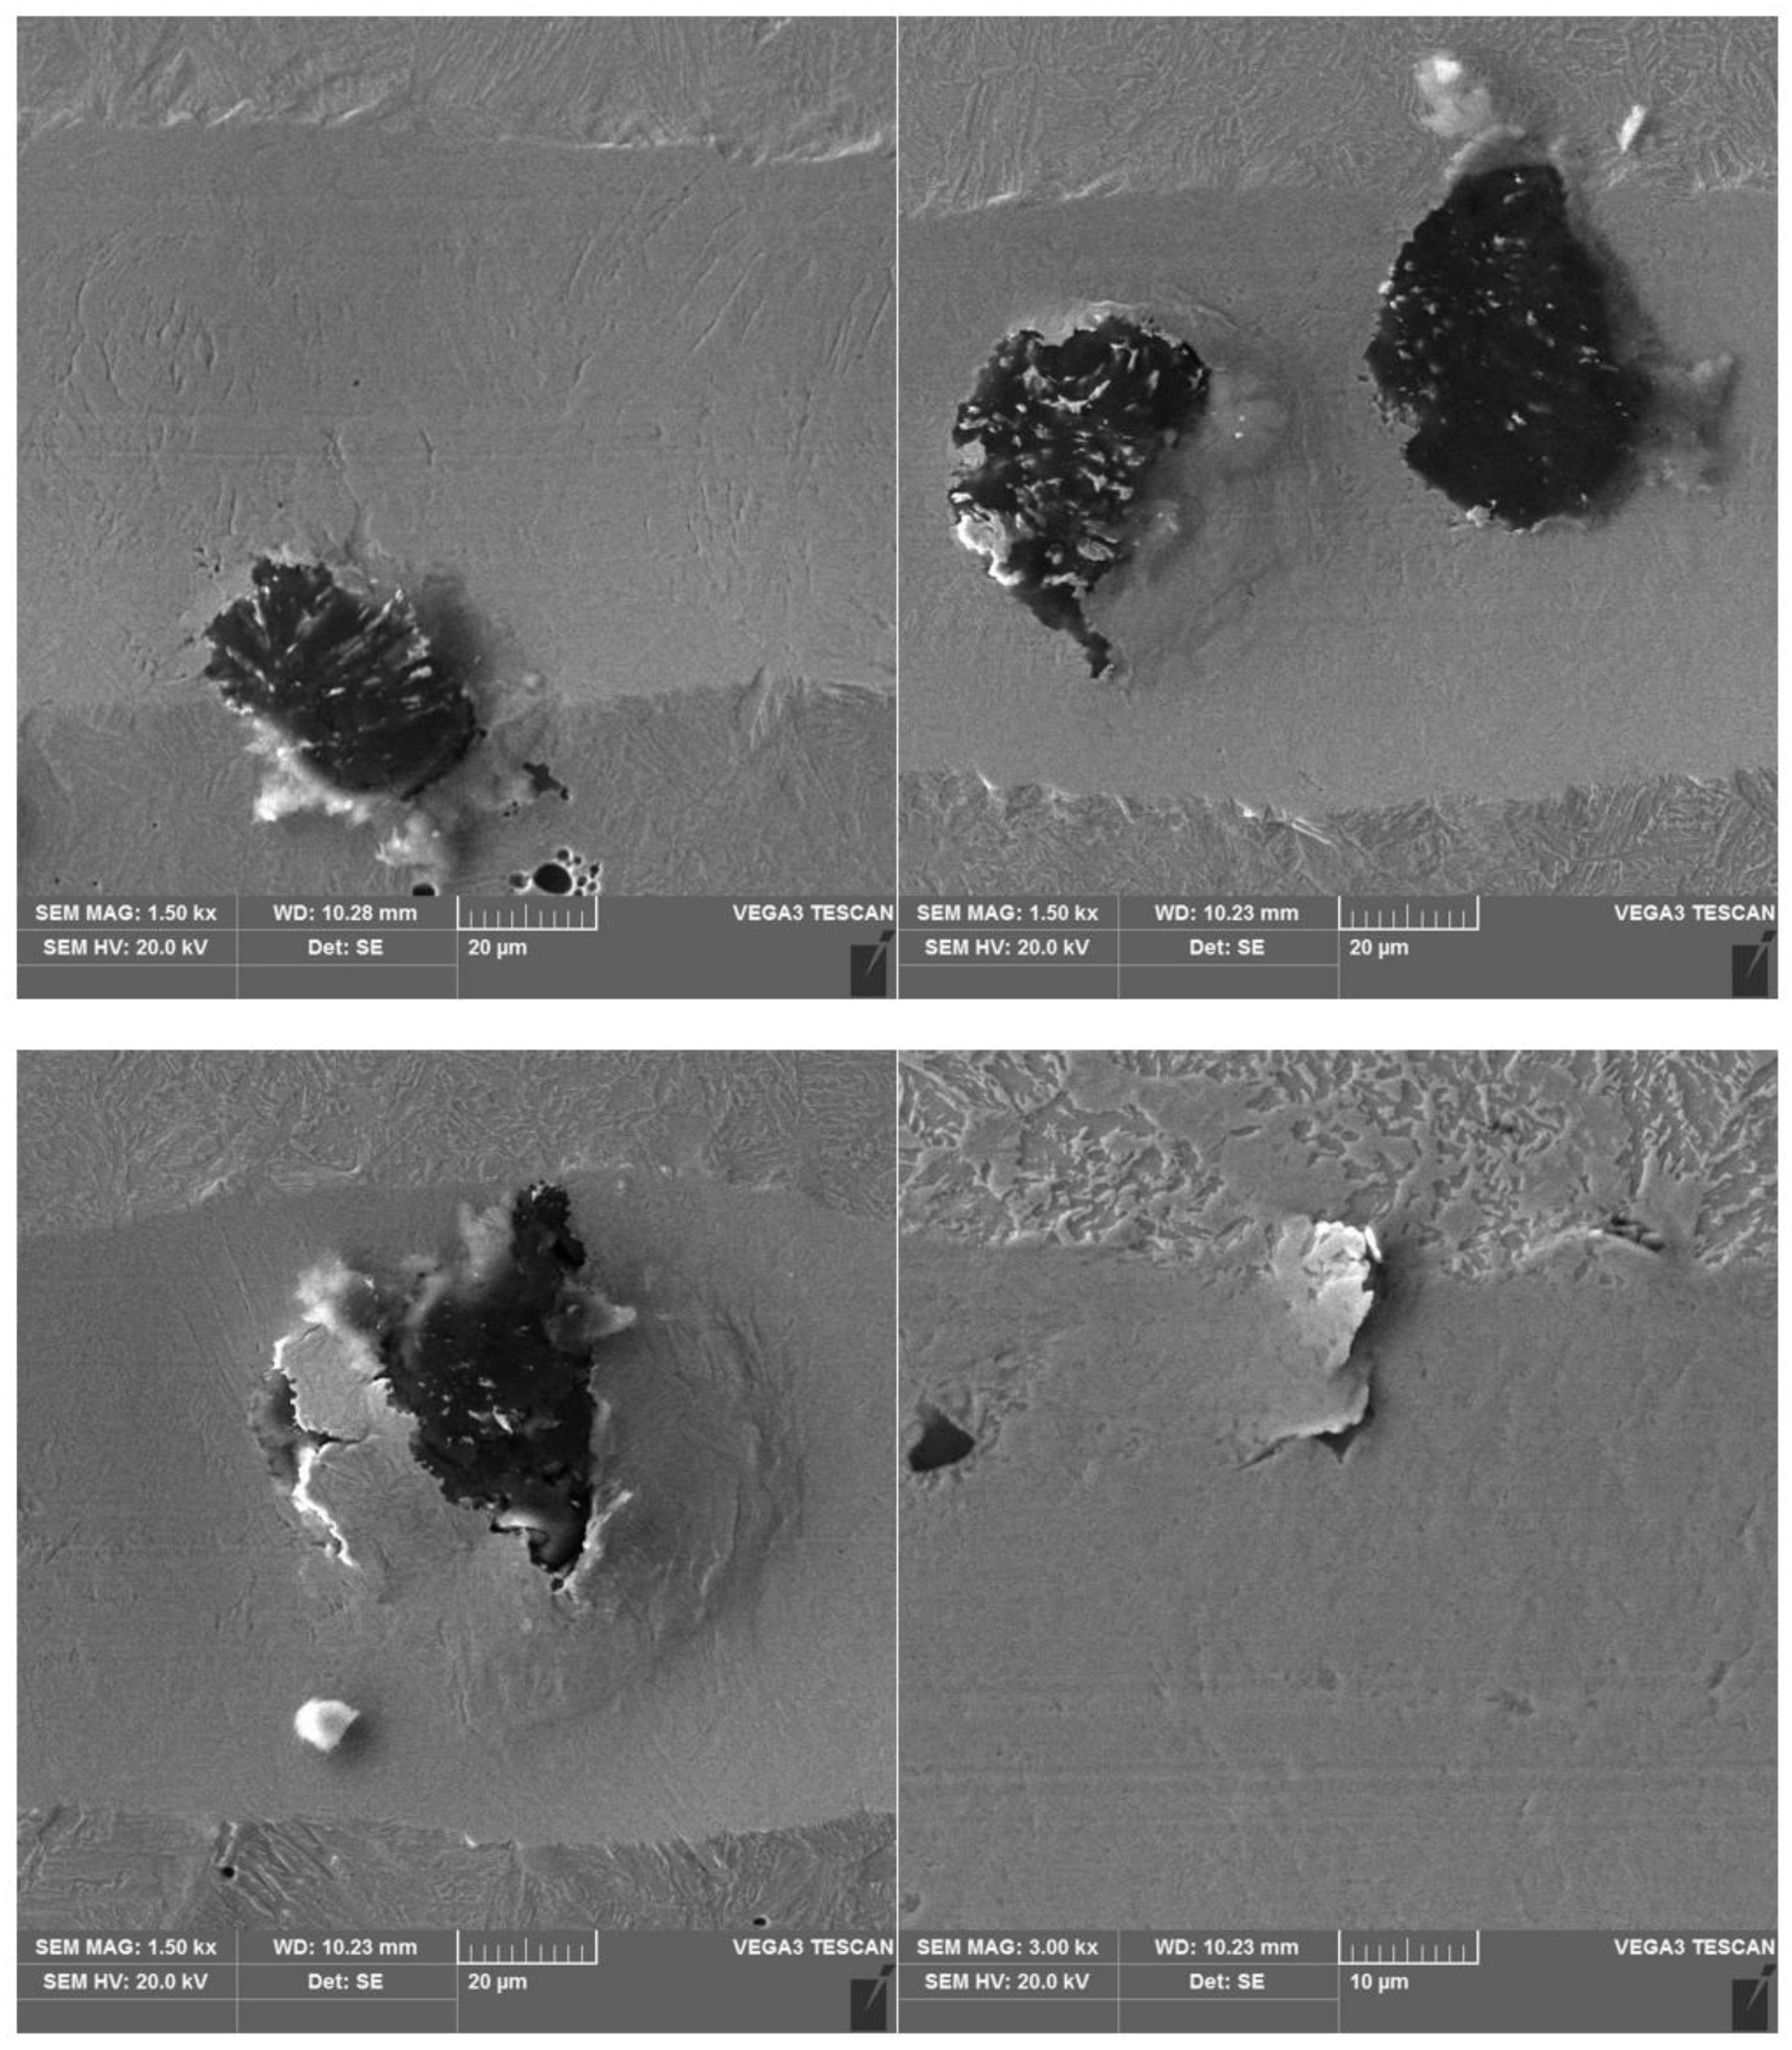
SEM images of specimen 2.1 (a,b) and 6.1 (c,d) revealed after exposition of specimens in 0.05 M NaCl solution for 1 h.
Figure 19.
SEM images of specimen 2.1 (a,b) and 6.1 (c,d) revealed after exposition of specimens in 0.05 M NaCl solution for 1 h.
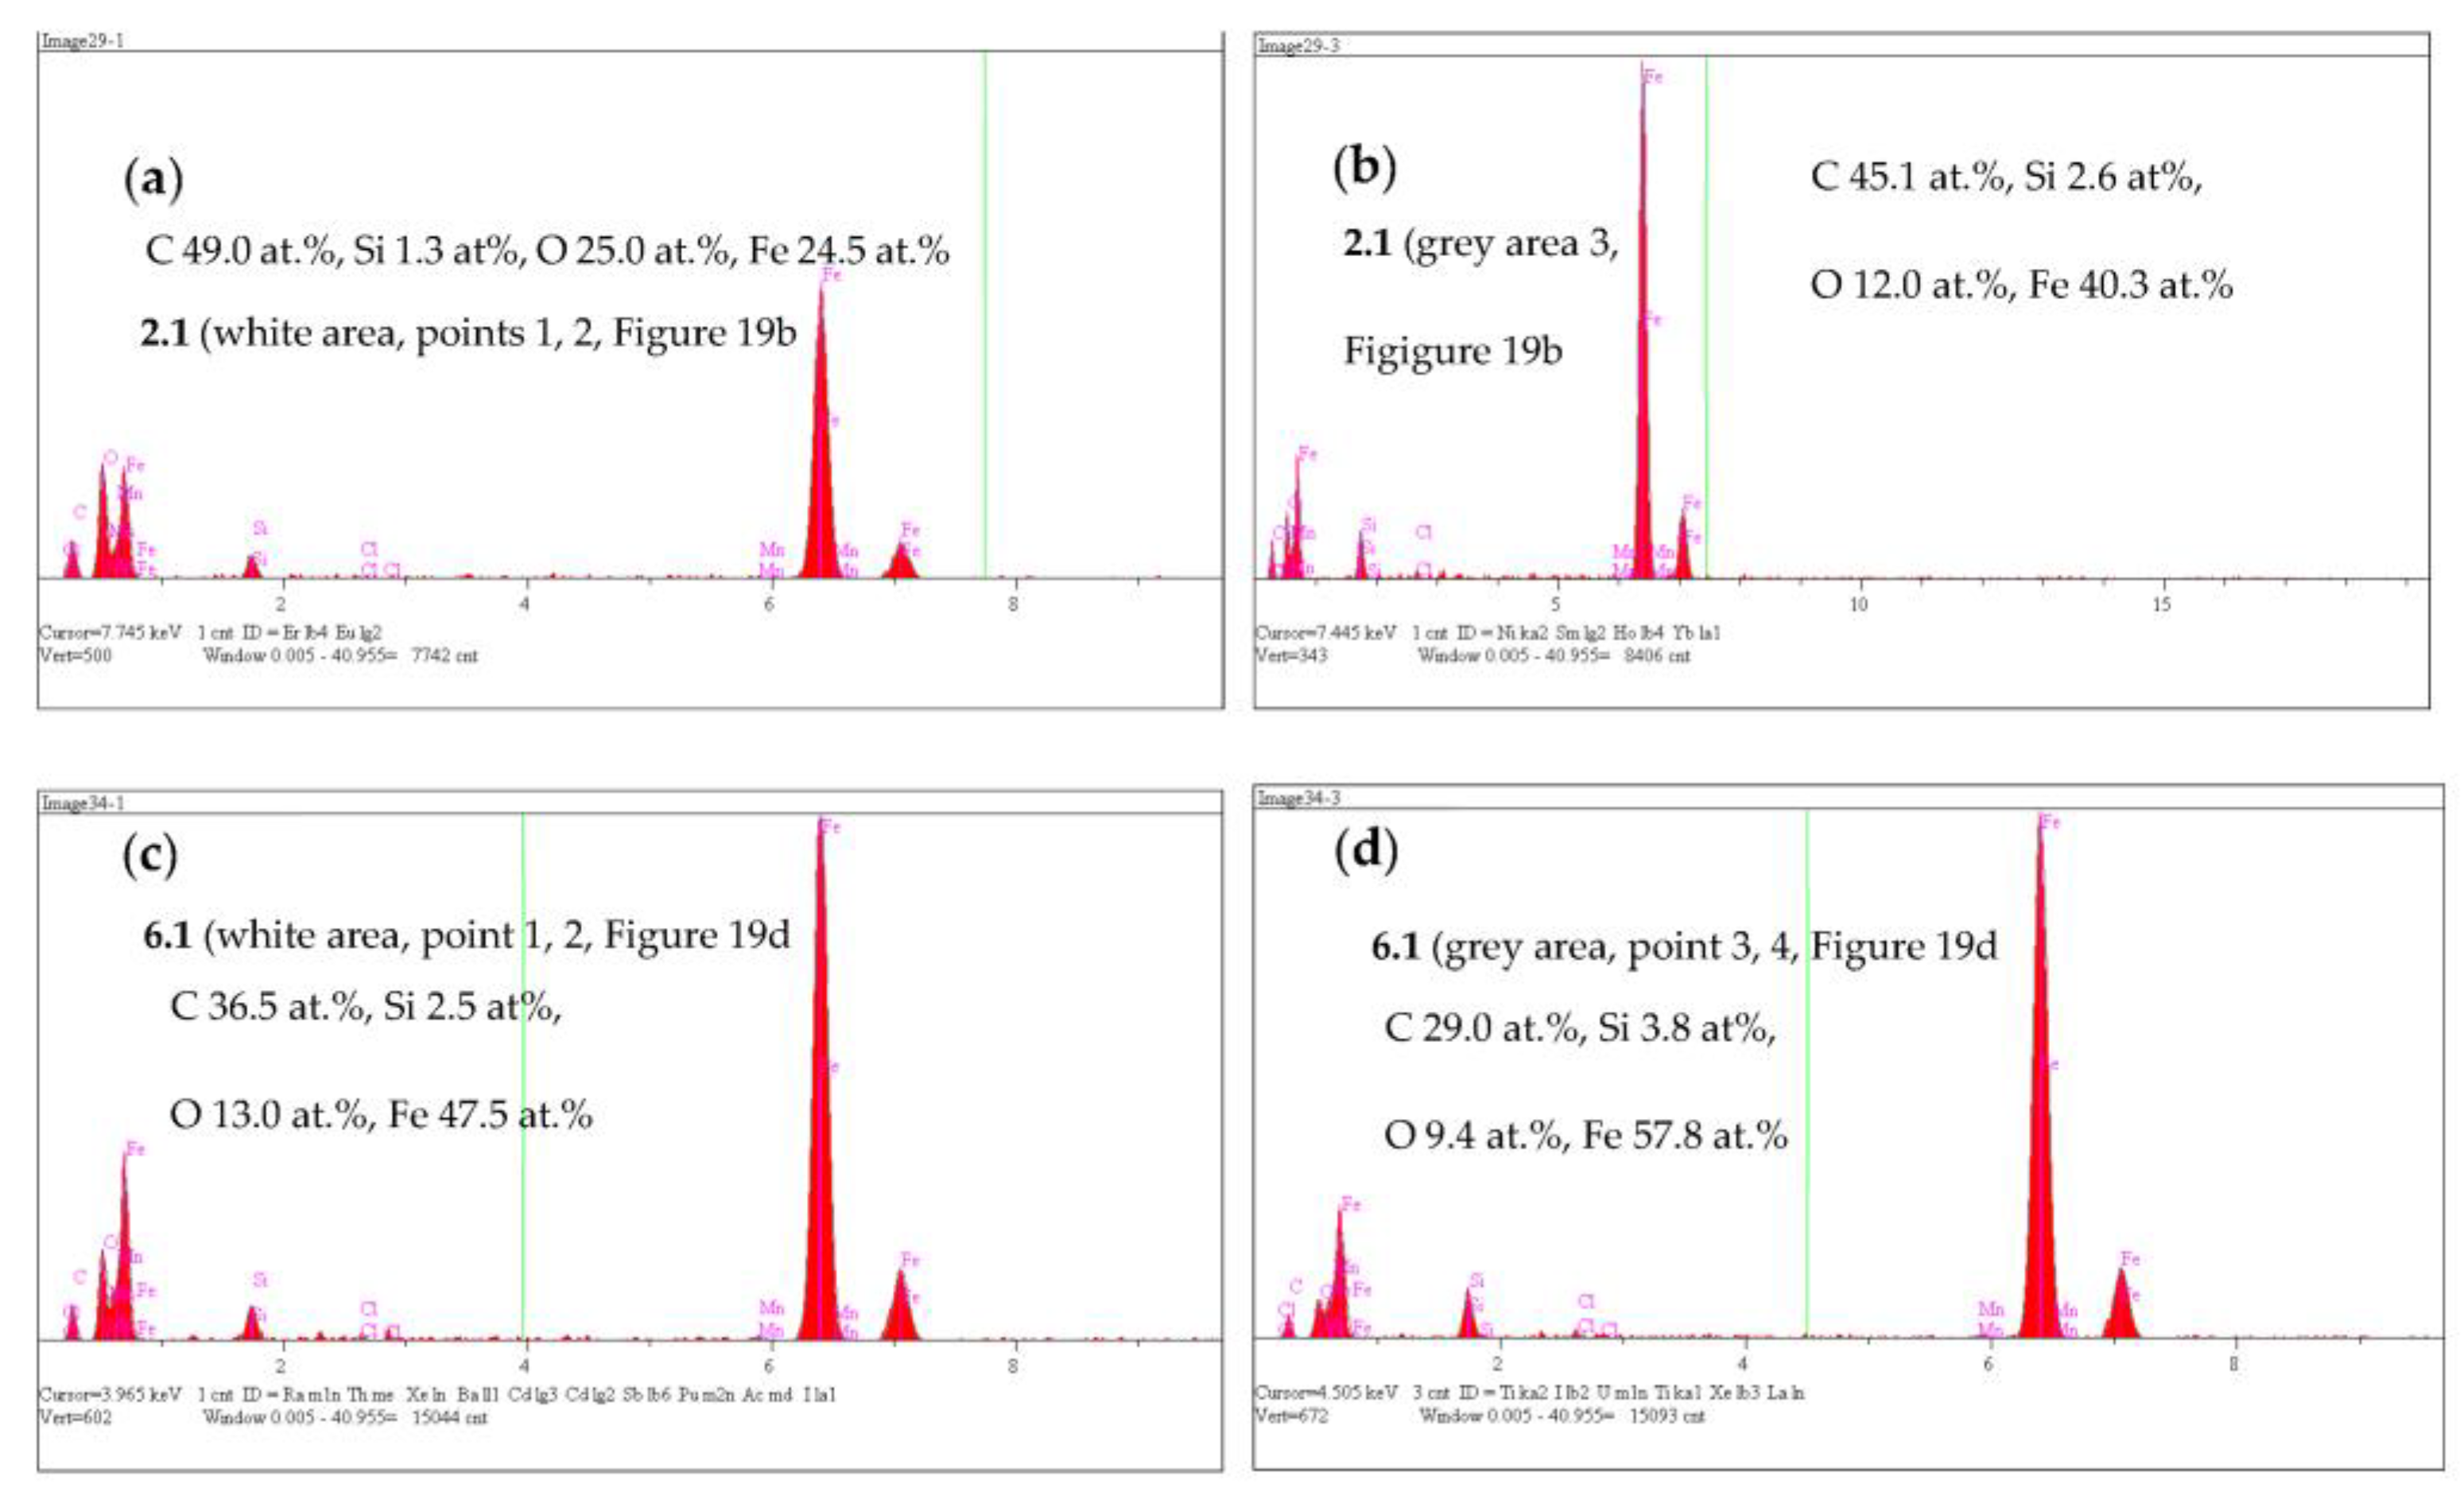
Figure 20.
EDS spectra of corrosion products formed at 2.1 specimen (a,b) and 6.1 (c,d).
Figure 20.
EDS spectra of corrosion products formed at 2.1 specimen (a,b) and 6.1 (c,d).
Table 1.
Chemical composition of ductile iron.
Table 1.
Chemical composition of ductile iron.
| C, wt.% | Mn, wt.% | Si, wt.% | P, wt.% | S, wt.% | Cr, wt.% | Ni, wt.% | Cu, wt.% | Mg, wt.% | Mo, wt.% | Ti, wt.% | Sn, wt.% | Pb, wt.% | V, wt.% | W, wt.% | Zn, wt.% |
|---|
| 3.48 | 0.63 | 2.56 | 0.03 | 0.017 | 0.06 | 0.04 | 0.32 | 0.054 | 0.07 | 0.015 | 0.006 | 0.001 | 0.009 | 0.038 | 0.003 |
Table 2.
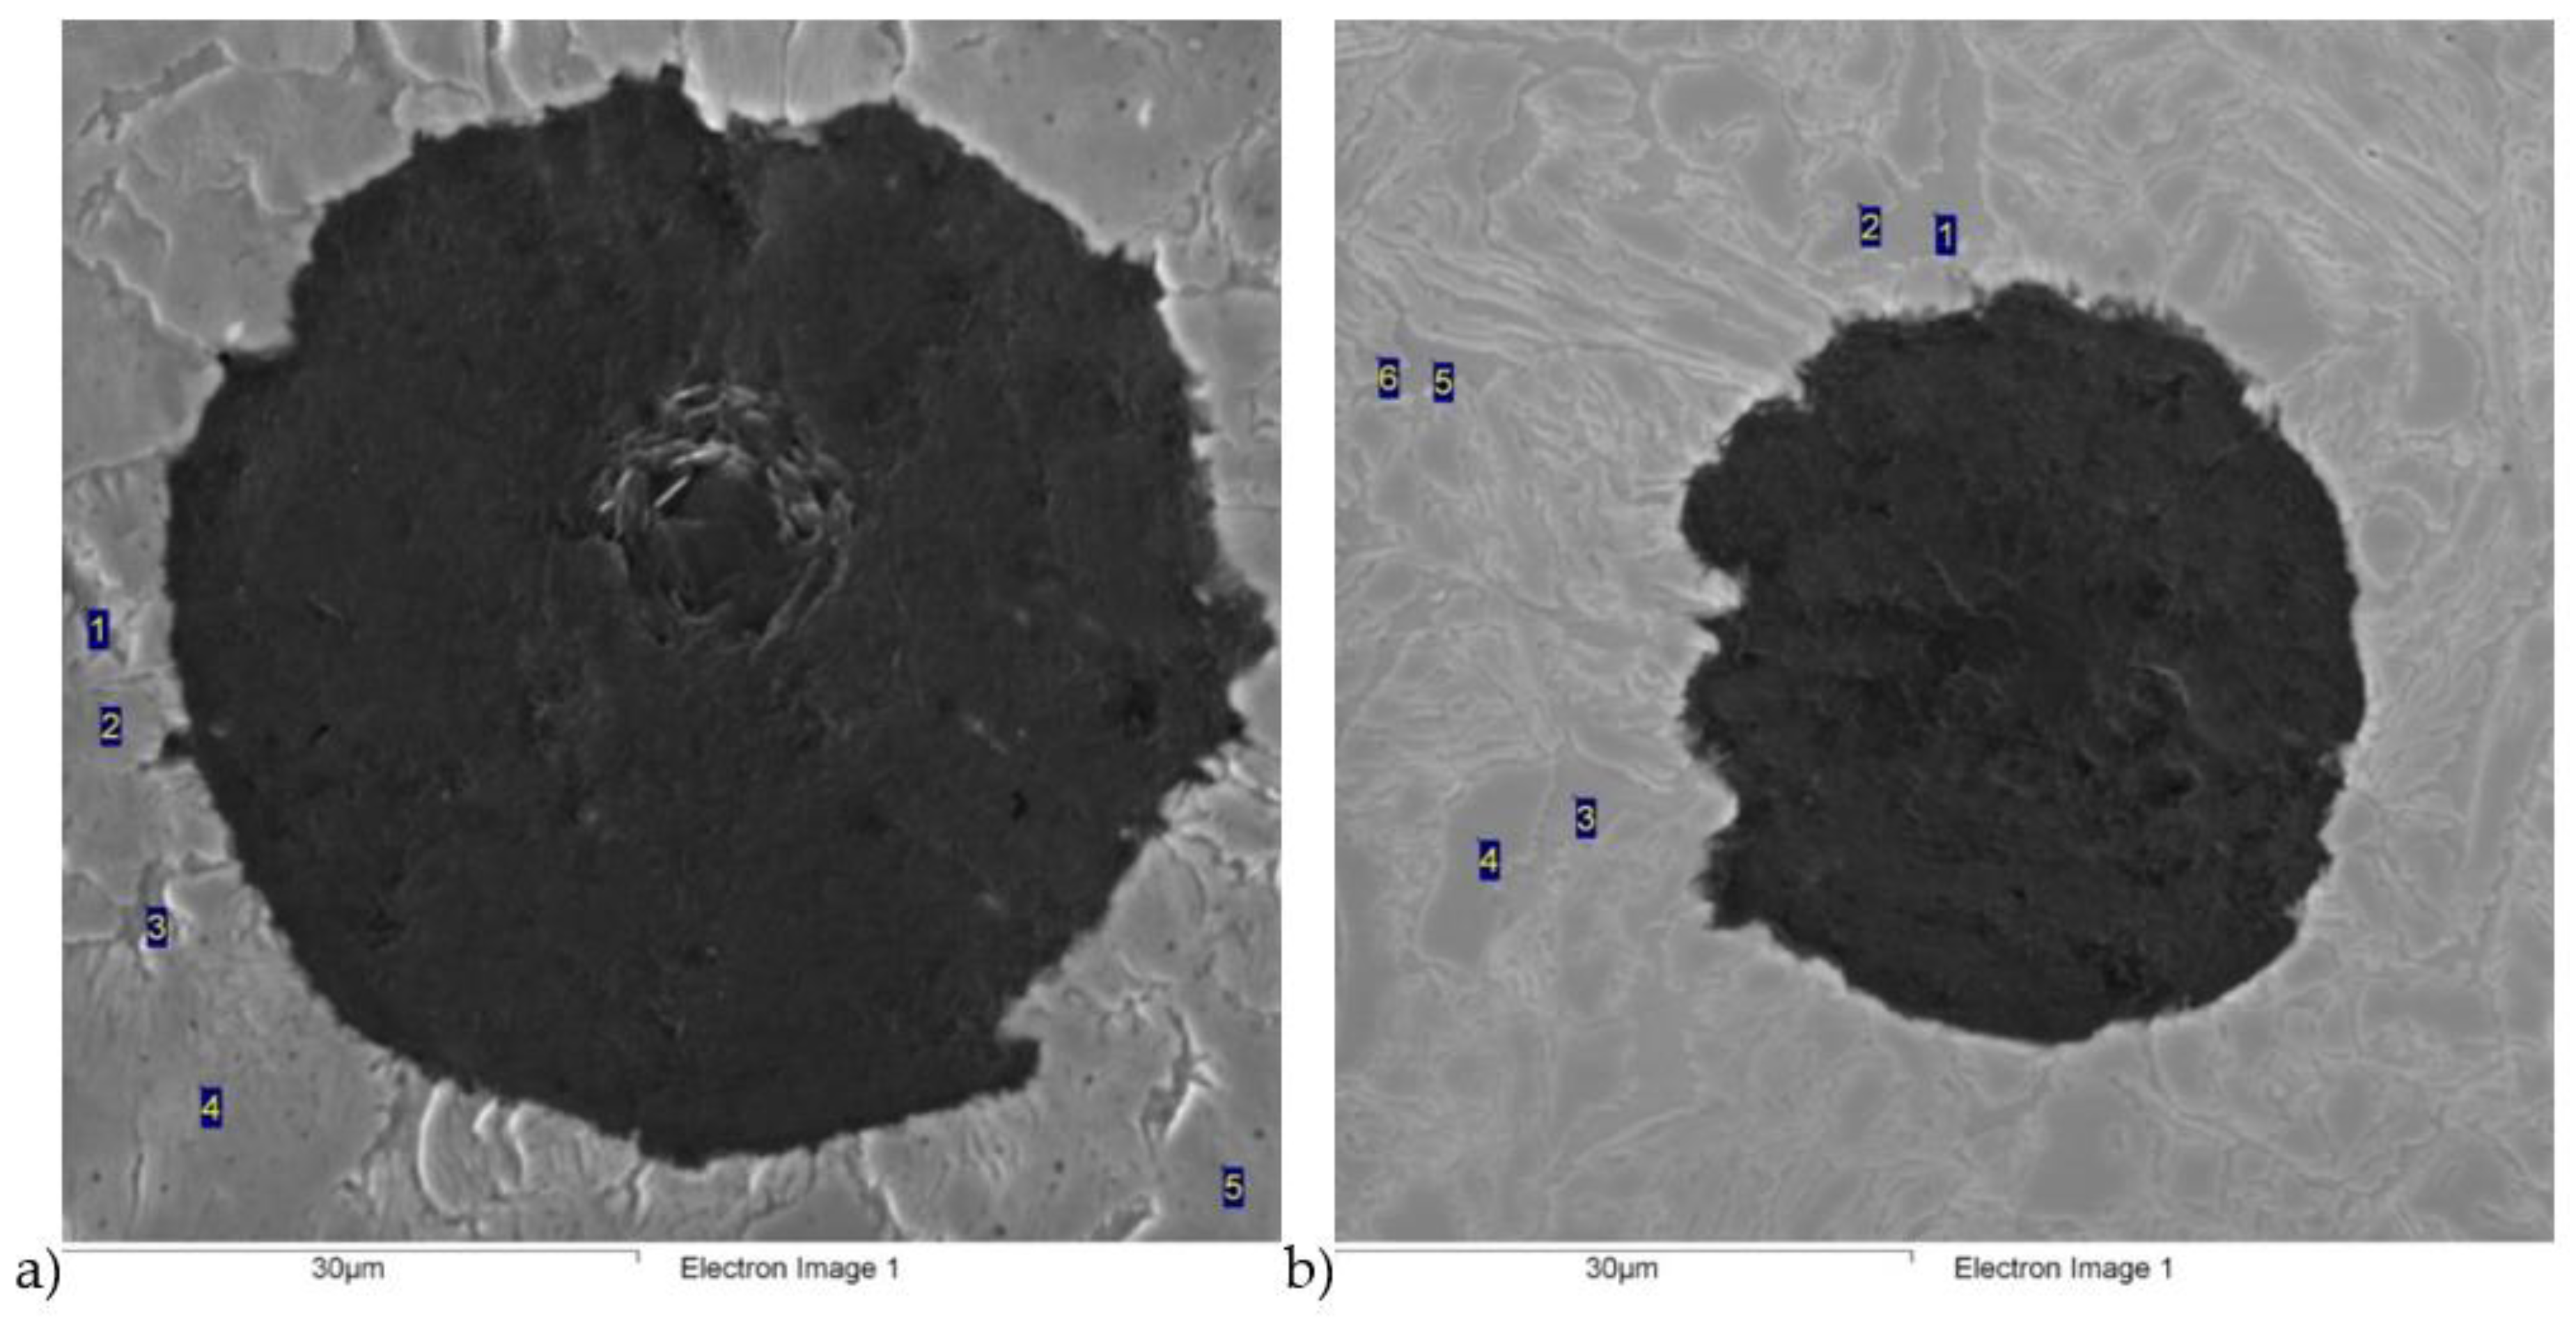
Point analysis of chemical composition for
Figure 4a.
Table 2.
Point analysis of chemical composition for
Figure 4a.
| Number | C, wt.% | Si, wt.% | Mn, wt.% | Fe, wt.% | Cu, wt.% |
|---|
| 1 | 1.25 | 3.38 | 0.20 | 94.78 | 0.38 |
| 2 | 2.11 | 2.79 | 0.47 | 94.35 | 0.28 |
| 3 | 1.20 | 3.99 | 0.21 | 94.32 | 0.27 |
| 4 | 2.09 | 3.13 | 0.52 | 93.69 | 0.57 |
| 5 | 2.13 | 2.95 | 0.35 | 94.03 | 0.54 |
Table 3.
Point analysis of chemical composition for
Figure 4b.
Table 3.
Point analysis of chemical composition for
Figure 4b.
| Number | C, wt.% | Si, wt.% | Mn, wt.% | Fe, wt.% | Cu, wt.% |
|---|
| 1 | 1.11 | 4.03 | 0.08 | 94.31 | 0.47 |
| 2 | 1.94 | 2.96 | 0.30 | 94.34 | 0.46 |
| 3 | 0.90 | 4.07 | 0.02 | 94.74 | 0.27 |
| 4 | 2.75 | 2.95 | 0.32 | 93.45 | 0.52 |
| 5 | 0.98 | 3.70 | 0.11 | 94.65 | 0.56 |
| 6 | 2.30 | 2.80 | 0.44 | 94.09 | 0.37 |
Table 4.
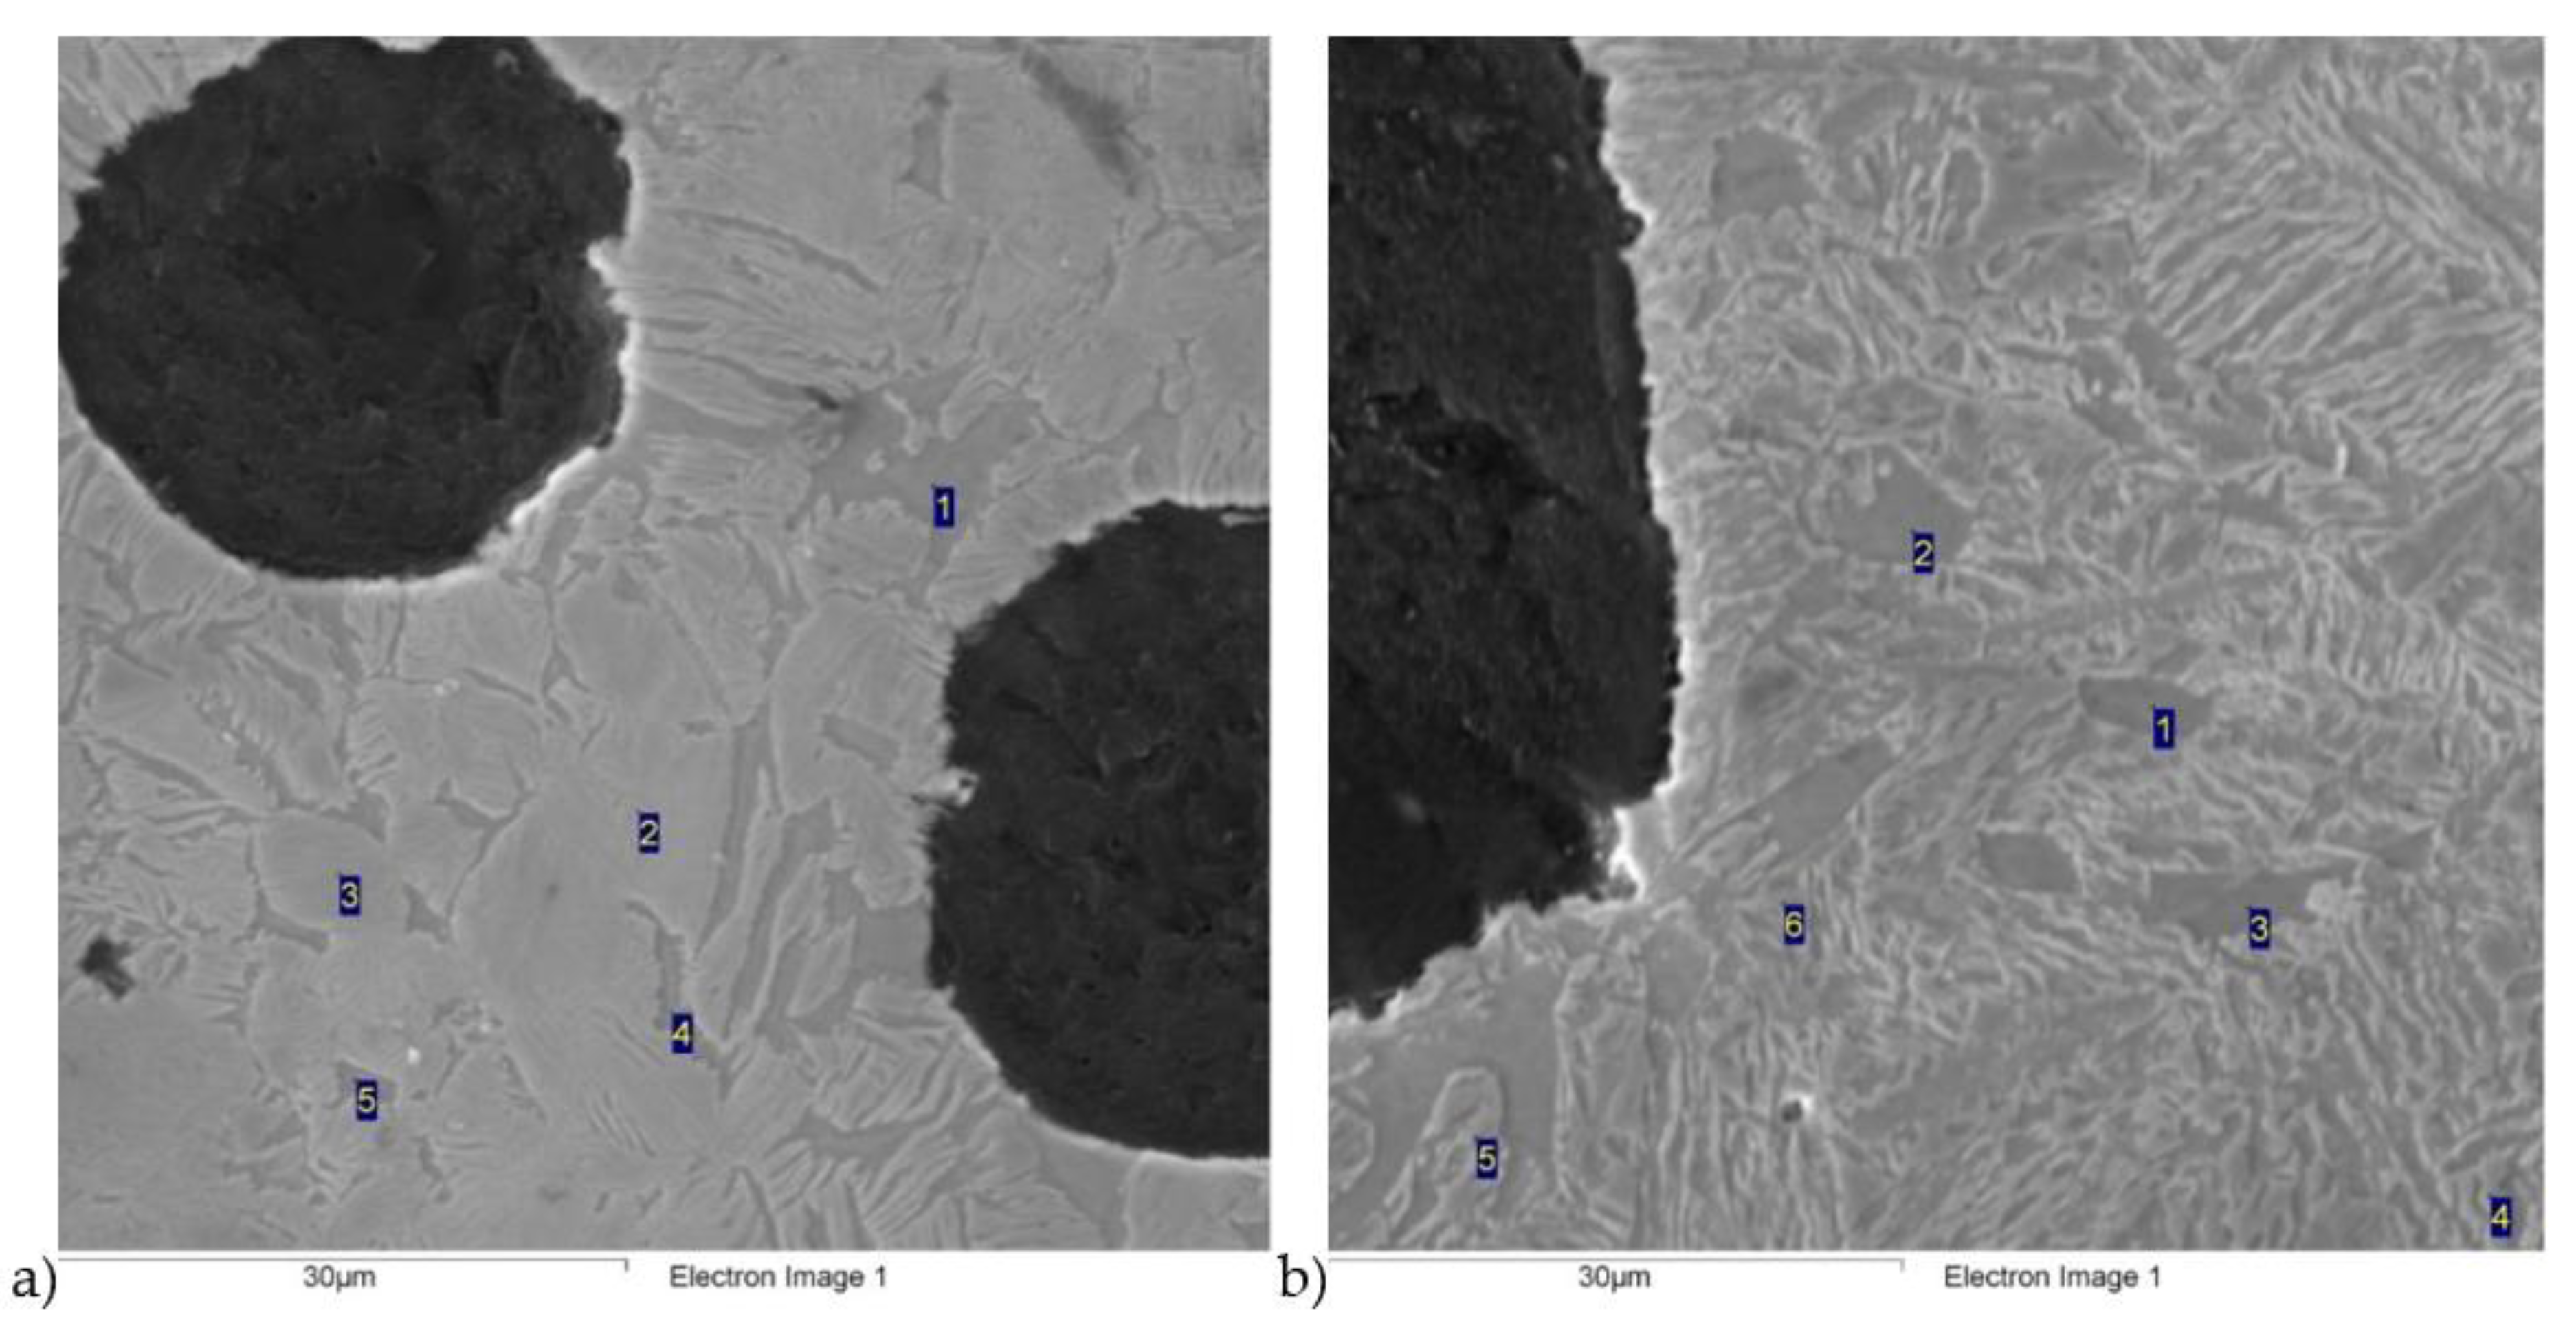
Point analysis of chemical composition for
Figure 5a.
Table 4.
Point analysis of chemical composition for
Figure 5a.
| Number | C, wt.% | Si, wt.% | Mn, wt.% | Fe, wt.% | Cu, wt.% |
|---|
| 1 | 1.39 | 3.79 | 0.21 | 94.23 | 0.39 |
| 2 | 2.91 | 3.12 | 0.23 | 93.30 | 0.44 |
| 3 | 2.94 | 2.50 | 0.51 | 93.80 | 0.25 |
| 4 | 1.21 | 3.58 | 0.23 | 94.58 | 0.40 |
| 5 | 1.00 | 3.86 | 0.14 | 94.53 | 0.47 |
Table 5.
Point analysis of chemical composition for
Figure 5b.
Table 5.
Point analysis of chemical composition for
Figure 5b.
| Number | C, wt.% | Si, wt.% | Mn, wt.% | Fe, wt.% | Cu, wt.% |
|---|
| 1 | 1.18 | 3.97 | 0.15 | 94.49 | 0.21 |
| 2 | 1.31 | 4.25 | 0.04 | 93.99 | 0.41 |
| 3 | 1.11 | 3.94 | 0.16 | 94.62 | 0.18 |
| 4 | 3.77 | 2.60 | 0.29 | 93.08 | 0.25 |
| 5 | 4.71 | 2.51 | 0.28 | 92.08 | 0.42 |
| 6 | 3.92 | 2.99 | 0.37 | 92.26 | 0.46 |
Table 6.
Values of scratch depth, Pd, friction force, Ff, friction coefficient, FC and acoustic emission signal index, AE of scratches made on four variants of ADI cast iron.
Table 6.
Values of scratch depth, Pd, friction force, Ff, friction coefficient, FC and acoustic emission signal index, AE of scratches made on four variants of ADI cast iron.
| Parameter | Sample Variant |
|---|
| 2.1 | 6.1 | 2.2 | 6.2 |
|---|
| Pd, μm | minimum | 3.91 | 5.23 | 4.77 | 5.41 |
| maximum | 5.89 | 8.47 | 6.20 | 8.93 |
| average | 4.90 | 6.85 | 5.49 | 7.17 |
| Ff, N | minimum | 0.77 | 0.67 | 0.98 | 0.52 |
| maximum | 1.64 | 2.22 | 1.64 | 1.86 |
| average | 1.20 | 1.44 | 1.31 | 1.19 |
| FC | minimum | 0.077 | 0.067 | 0.098 | 0.052 |
| maximum | 0.164 | 0.222 | 0.164 | 0.186 |
| average | 0.120 | 0.144 | 0.131 | 0.119 |
Table 7.
Data calculated from the electrochemical measurements (LSV curves).
Table 7.
Data calculated from the electrochemical measurements (LSV curves).
| Specimen | Ecorr [mV] | Icorr [A] | CR [mm/y] |
|---|
| DI | −513 | 2.4·10−5 | 0.36 |
| 2.1 | −523 | 1.0·10−5 | 0.15 |
| 2.2 | −451 | 1.0·10−5 | 0.15 |
| 6.1 | −502 | 2.1·10−5 | 0.31 |
| 6.2 | −492 | 1.7·10−5 | 0.25 |
Table 8.
Data of the fitting parameters obtained for the EIS diagrams of 2.1 and 6.1 specimens.
Table 8.
Data of the fitting parameters obtained for the EIS diagrams of 2.1 and 6.1 specimens.
| | Sample 2.1 | Sample 6.1 |
|---|
| R1 [Ω·cm2] | 29.0 ± 0.35 | 38.0 ± 0.4 |
| CPE1-T [Ω−1·cm−2·sp] | 0.00102 ± 1.7×10⁻⁵ | 0.00091 ± 1.6×10⁻⁵ |
| CPE1-P | 0.7 ± 0.005 | 0.77 ± 0.006 |
| R2 [Ω·cm2] | 3087 ± 114 | 621 ± 7.8 |
