
Comparative Analysis of Bone Ingrowth in 3D-Printed Titanium Lattice Structures with Different Patterns


 ,
,  ,
, 
Abstract
1. Introduction
2. Materials and Methods
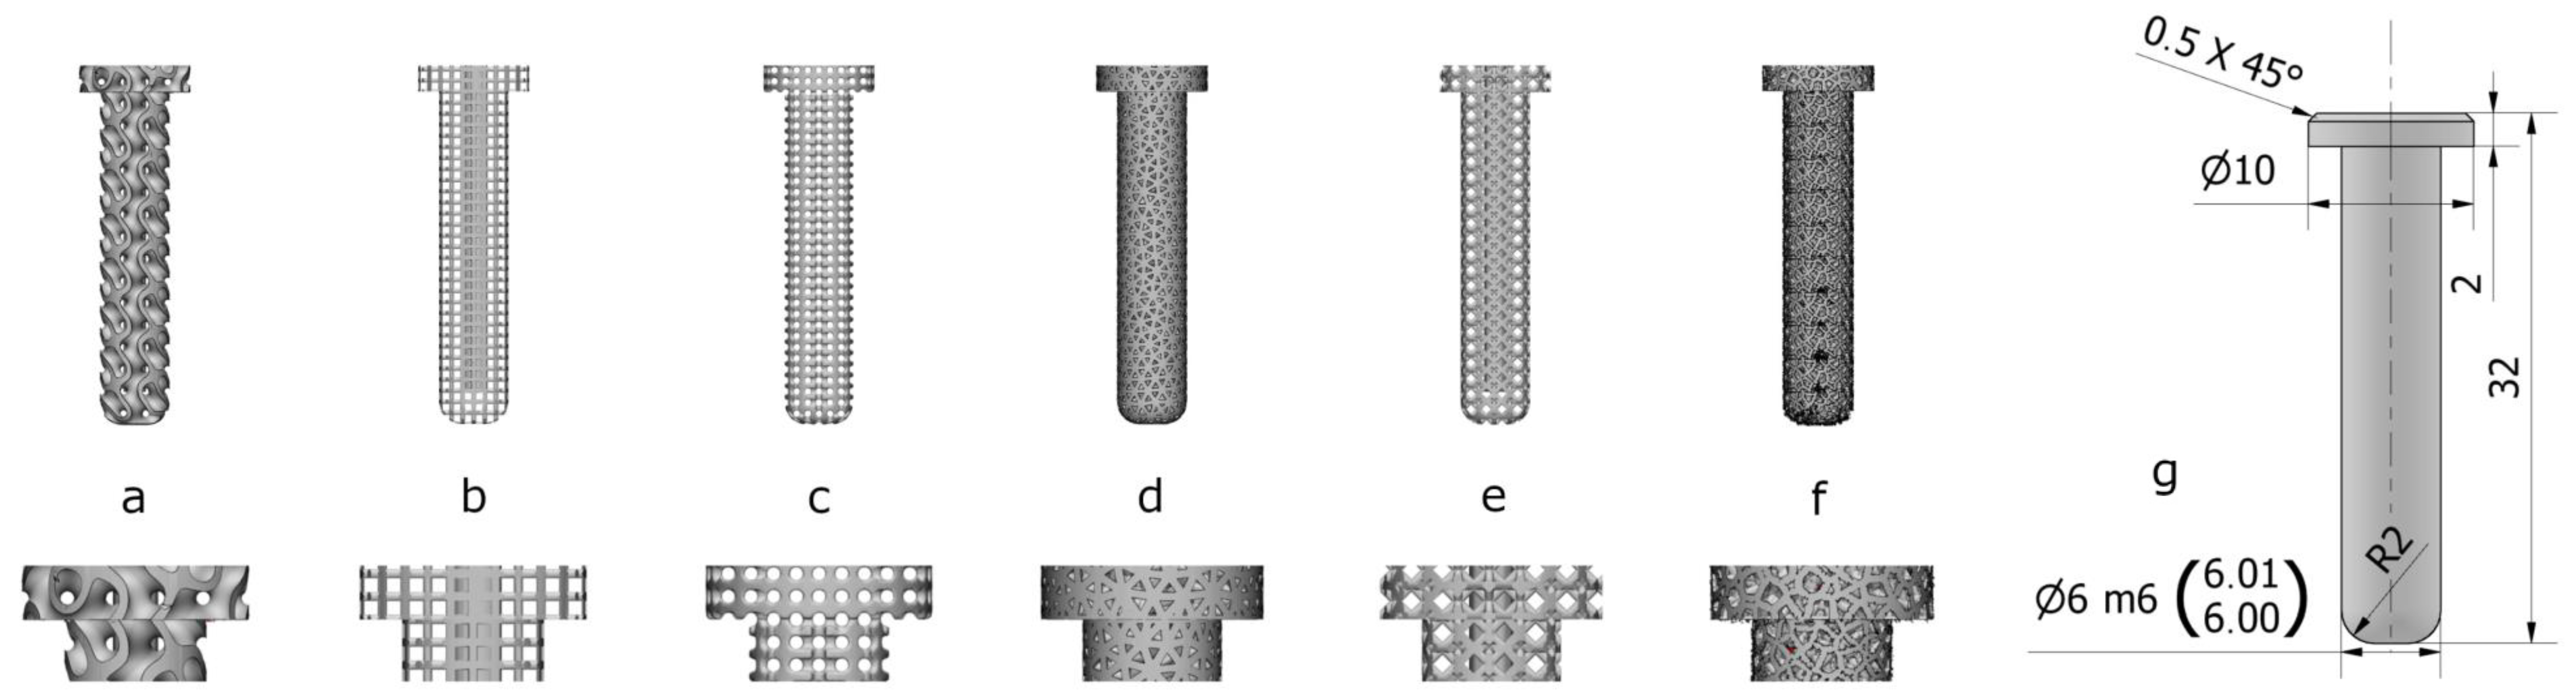
2.1. Design and Manufacture of Implants
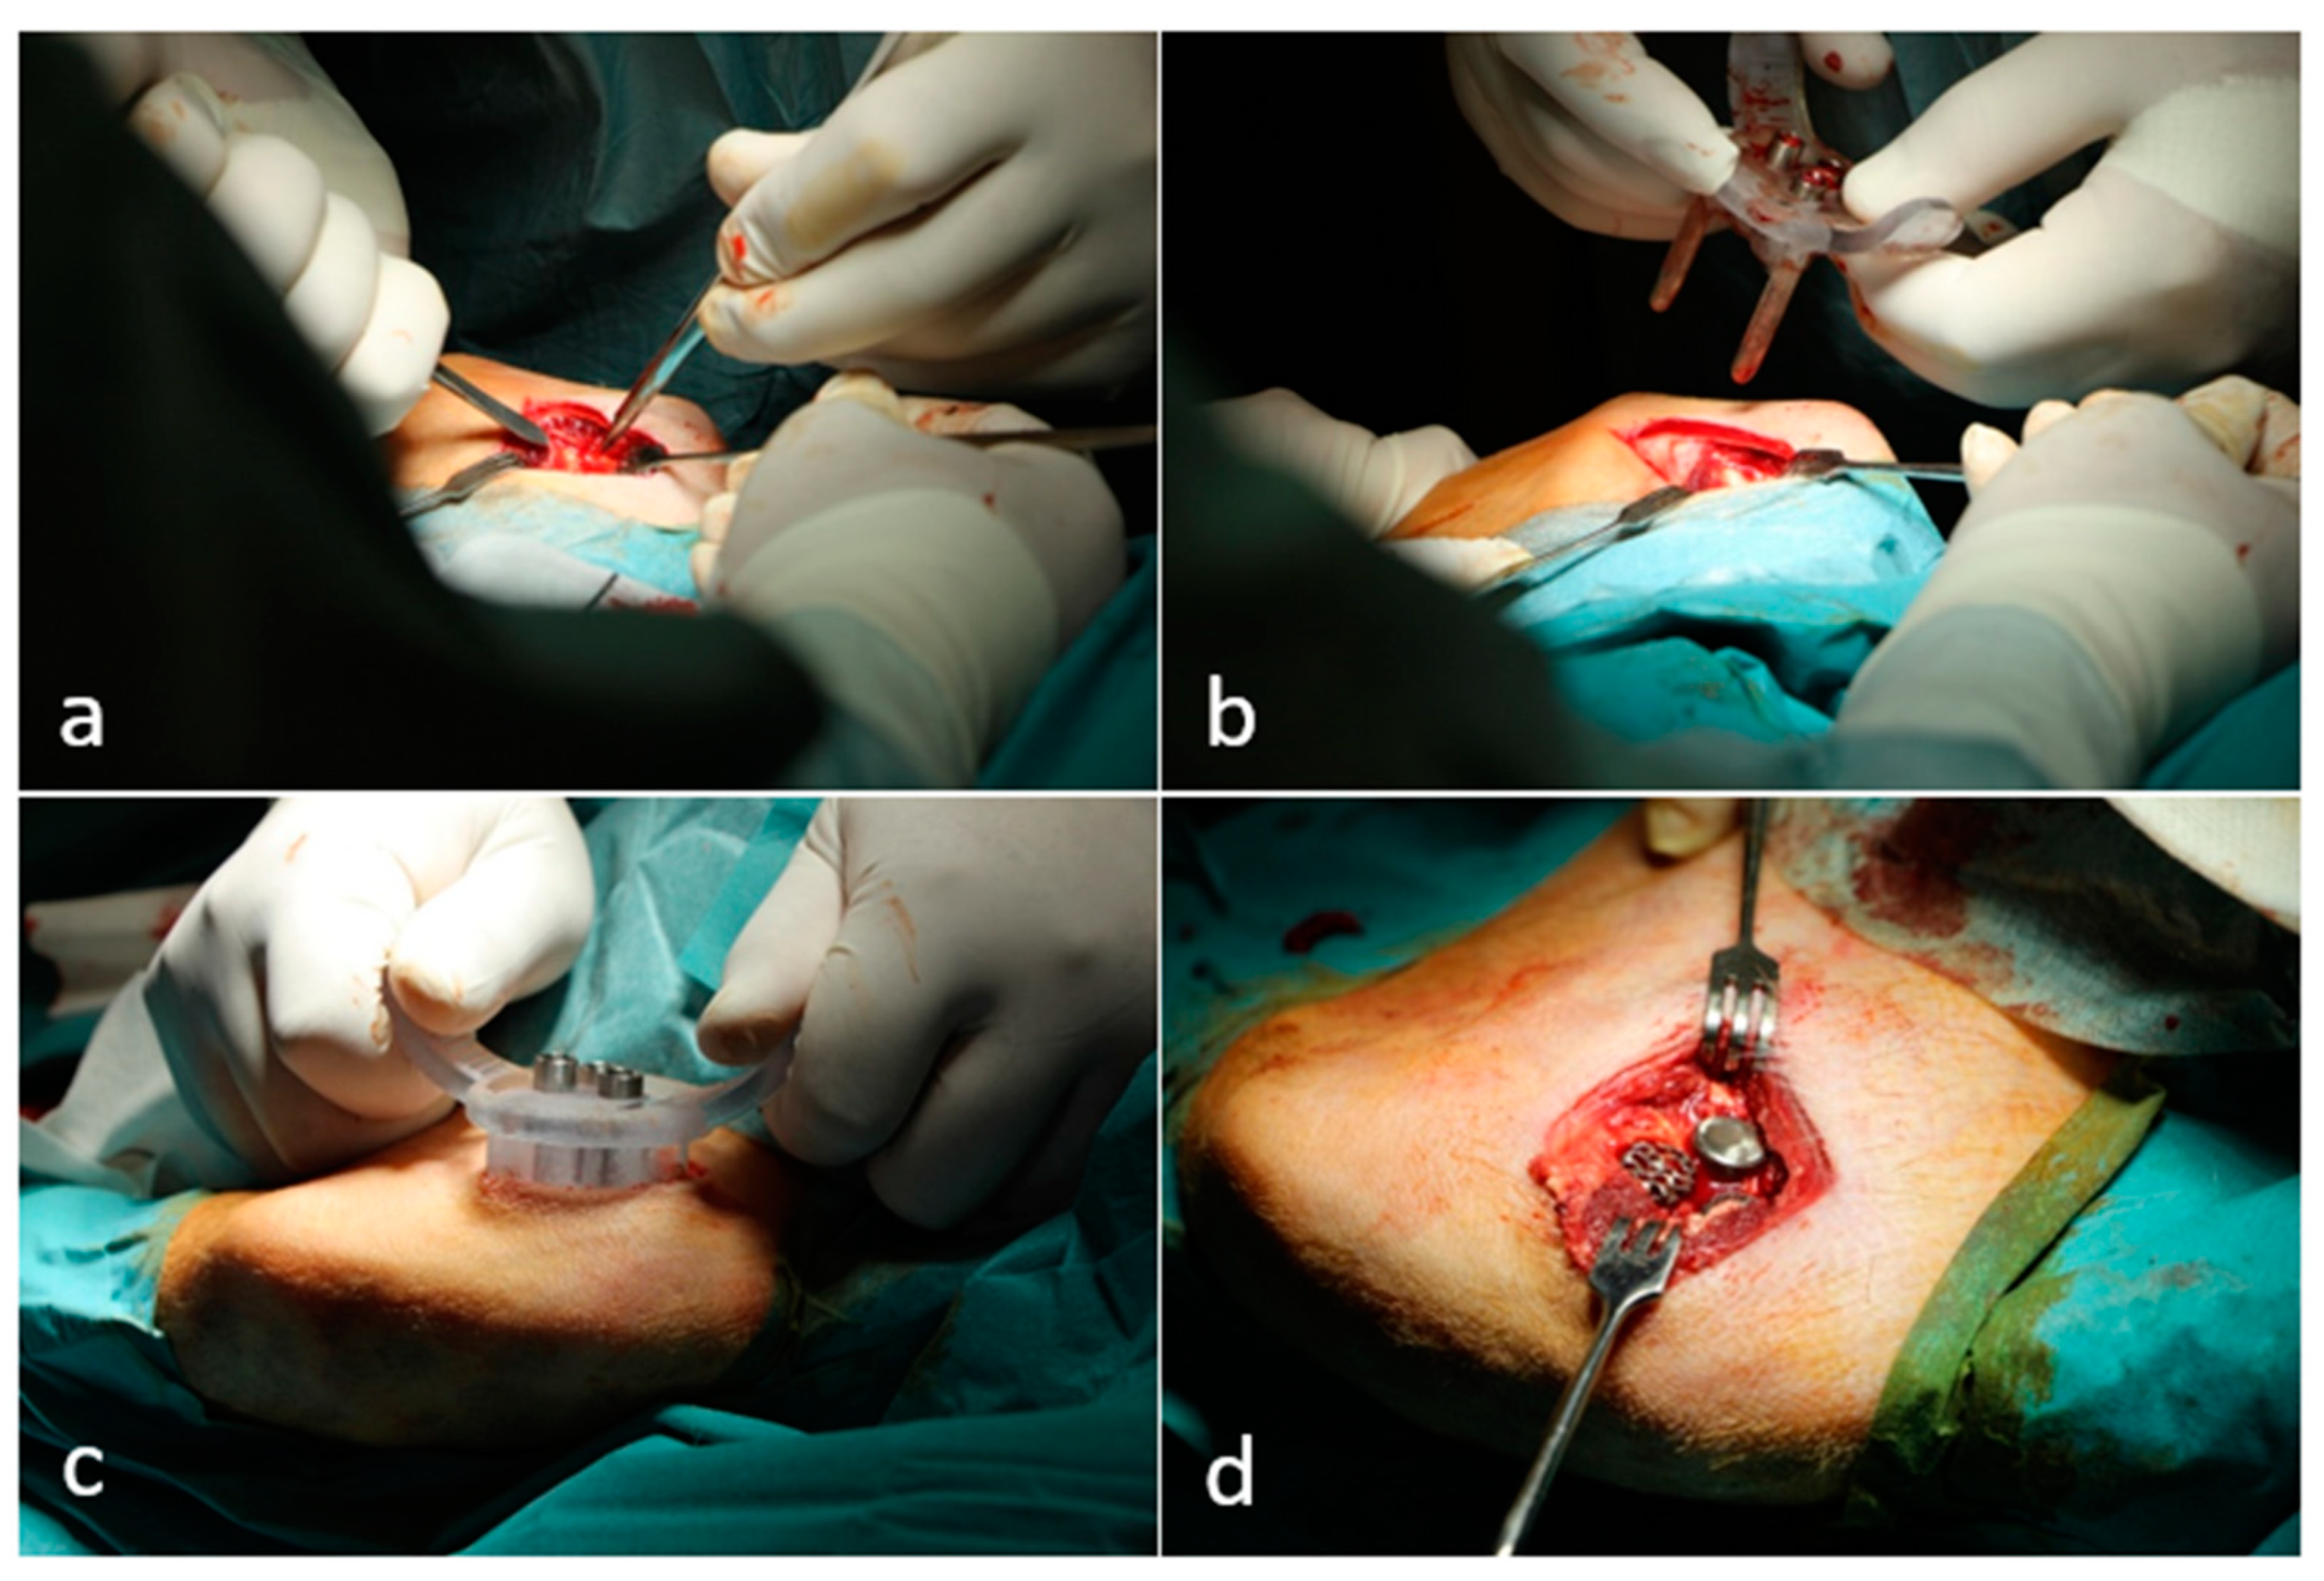
2.2. Animal Experiment and Surgical Technique
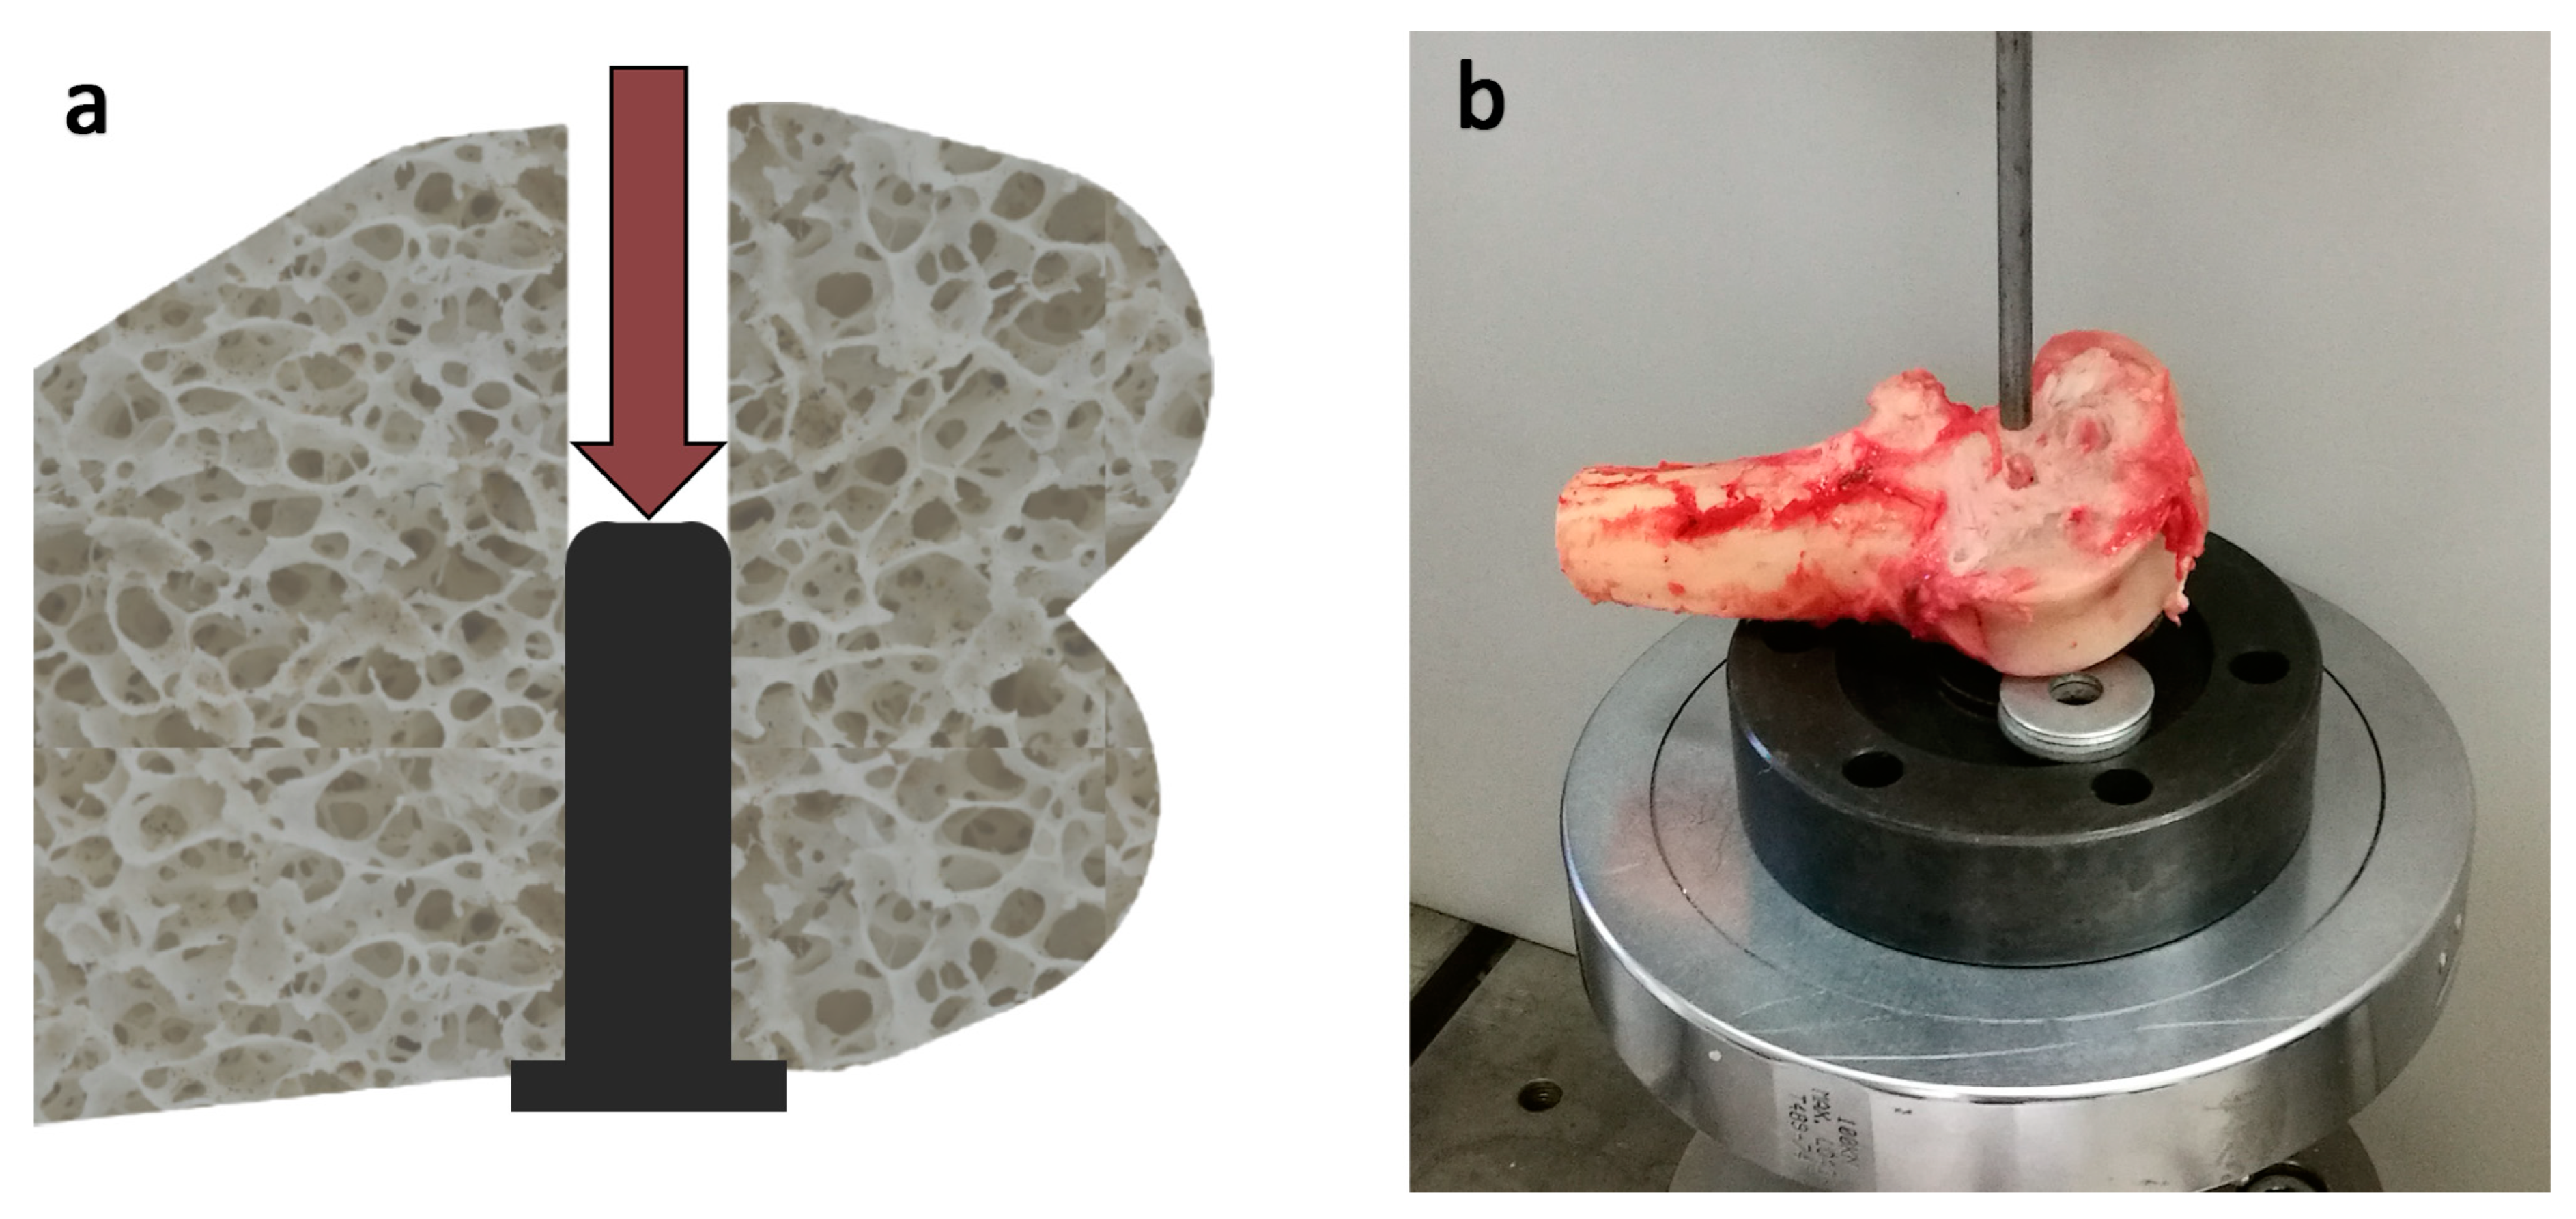
2.3. Mechanical Evaluation
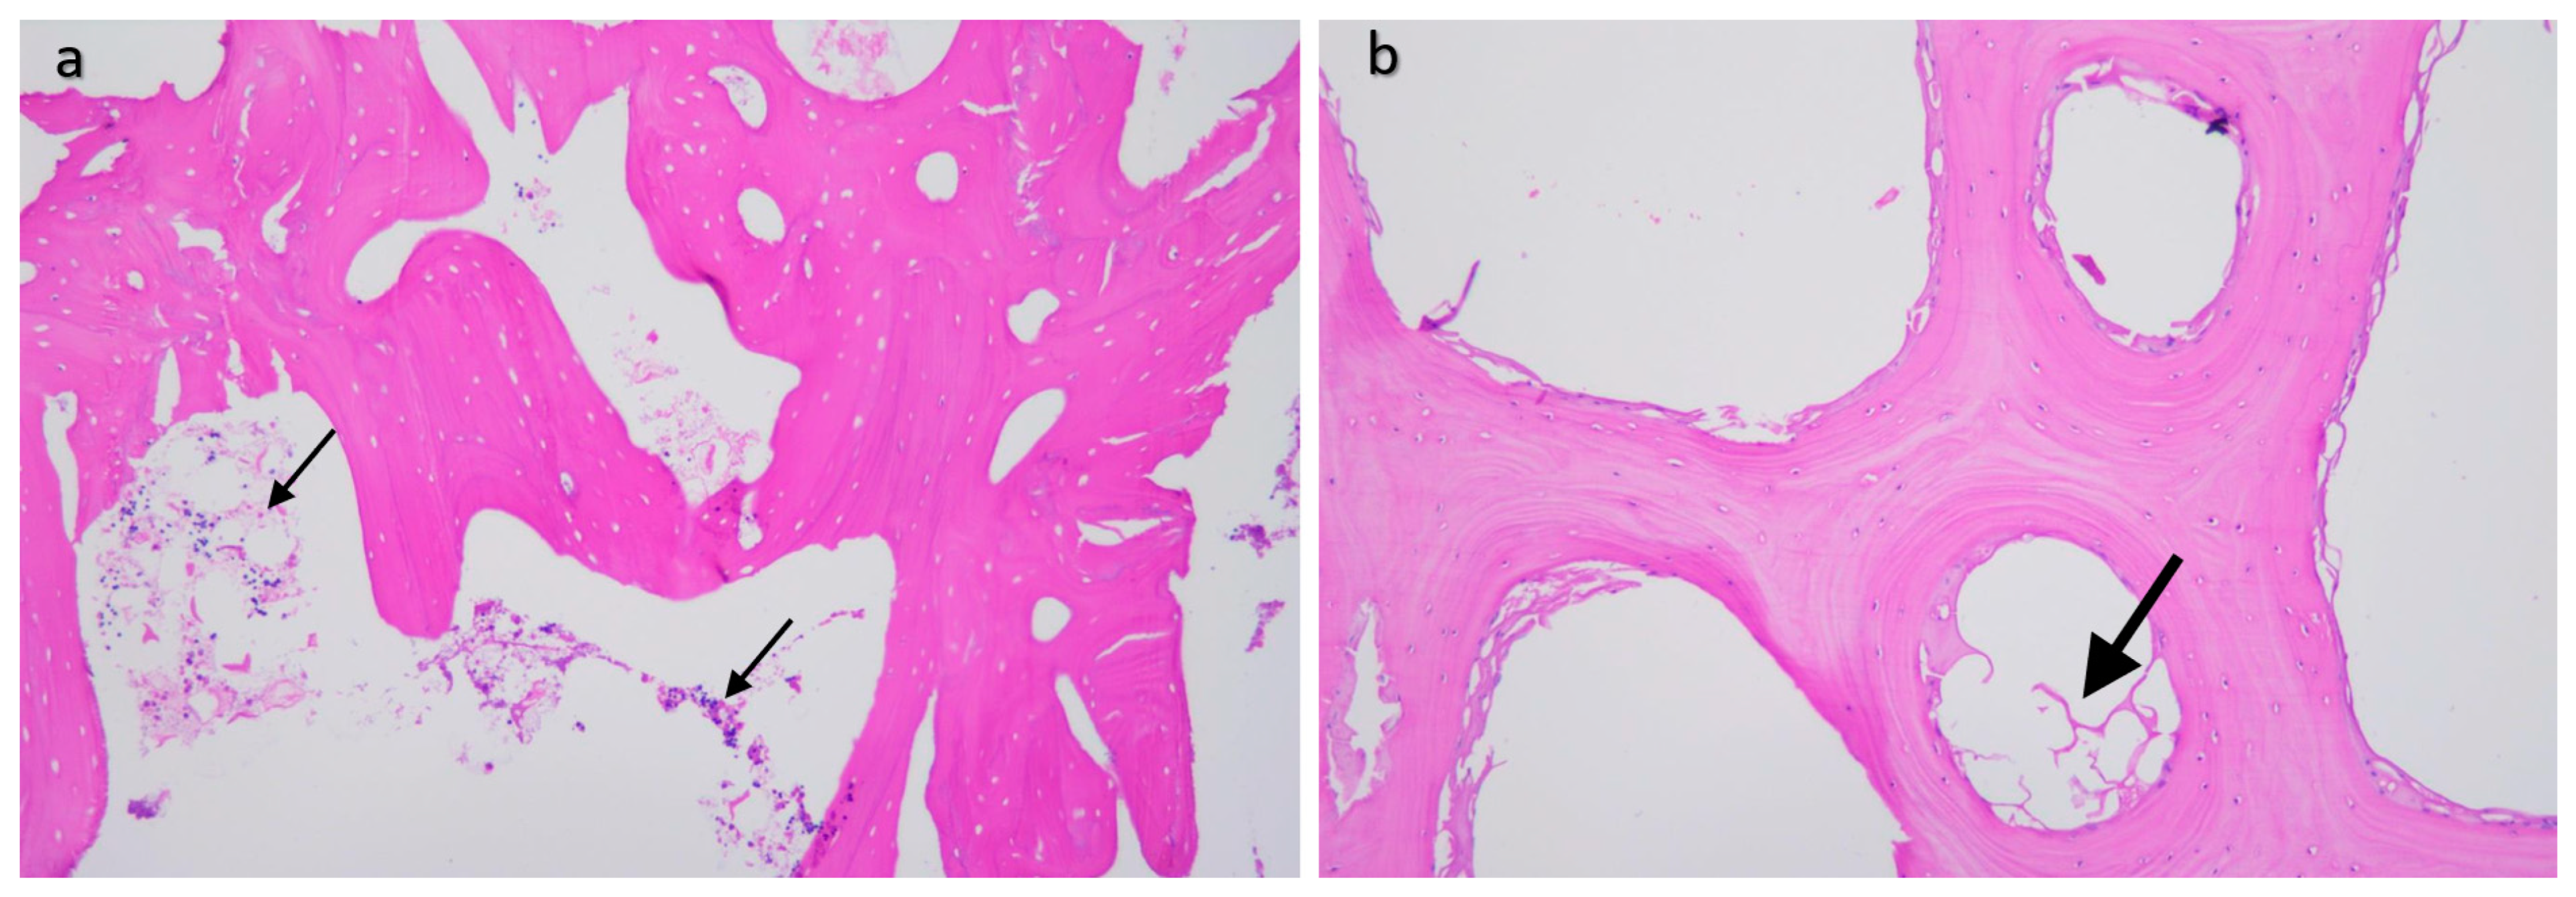
2.4. Histological Processing
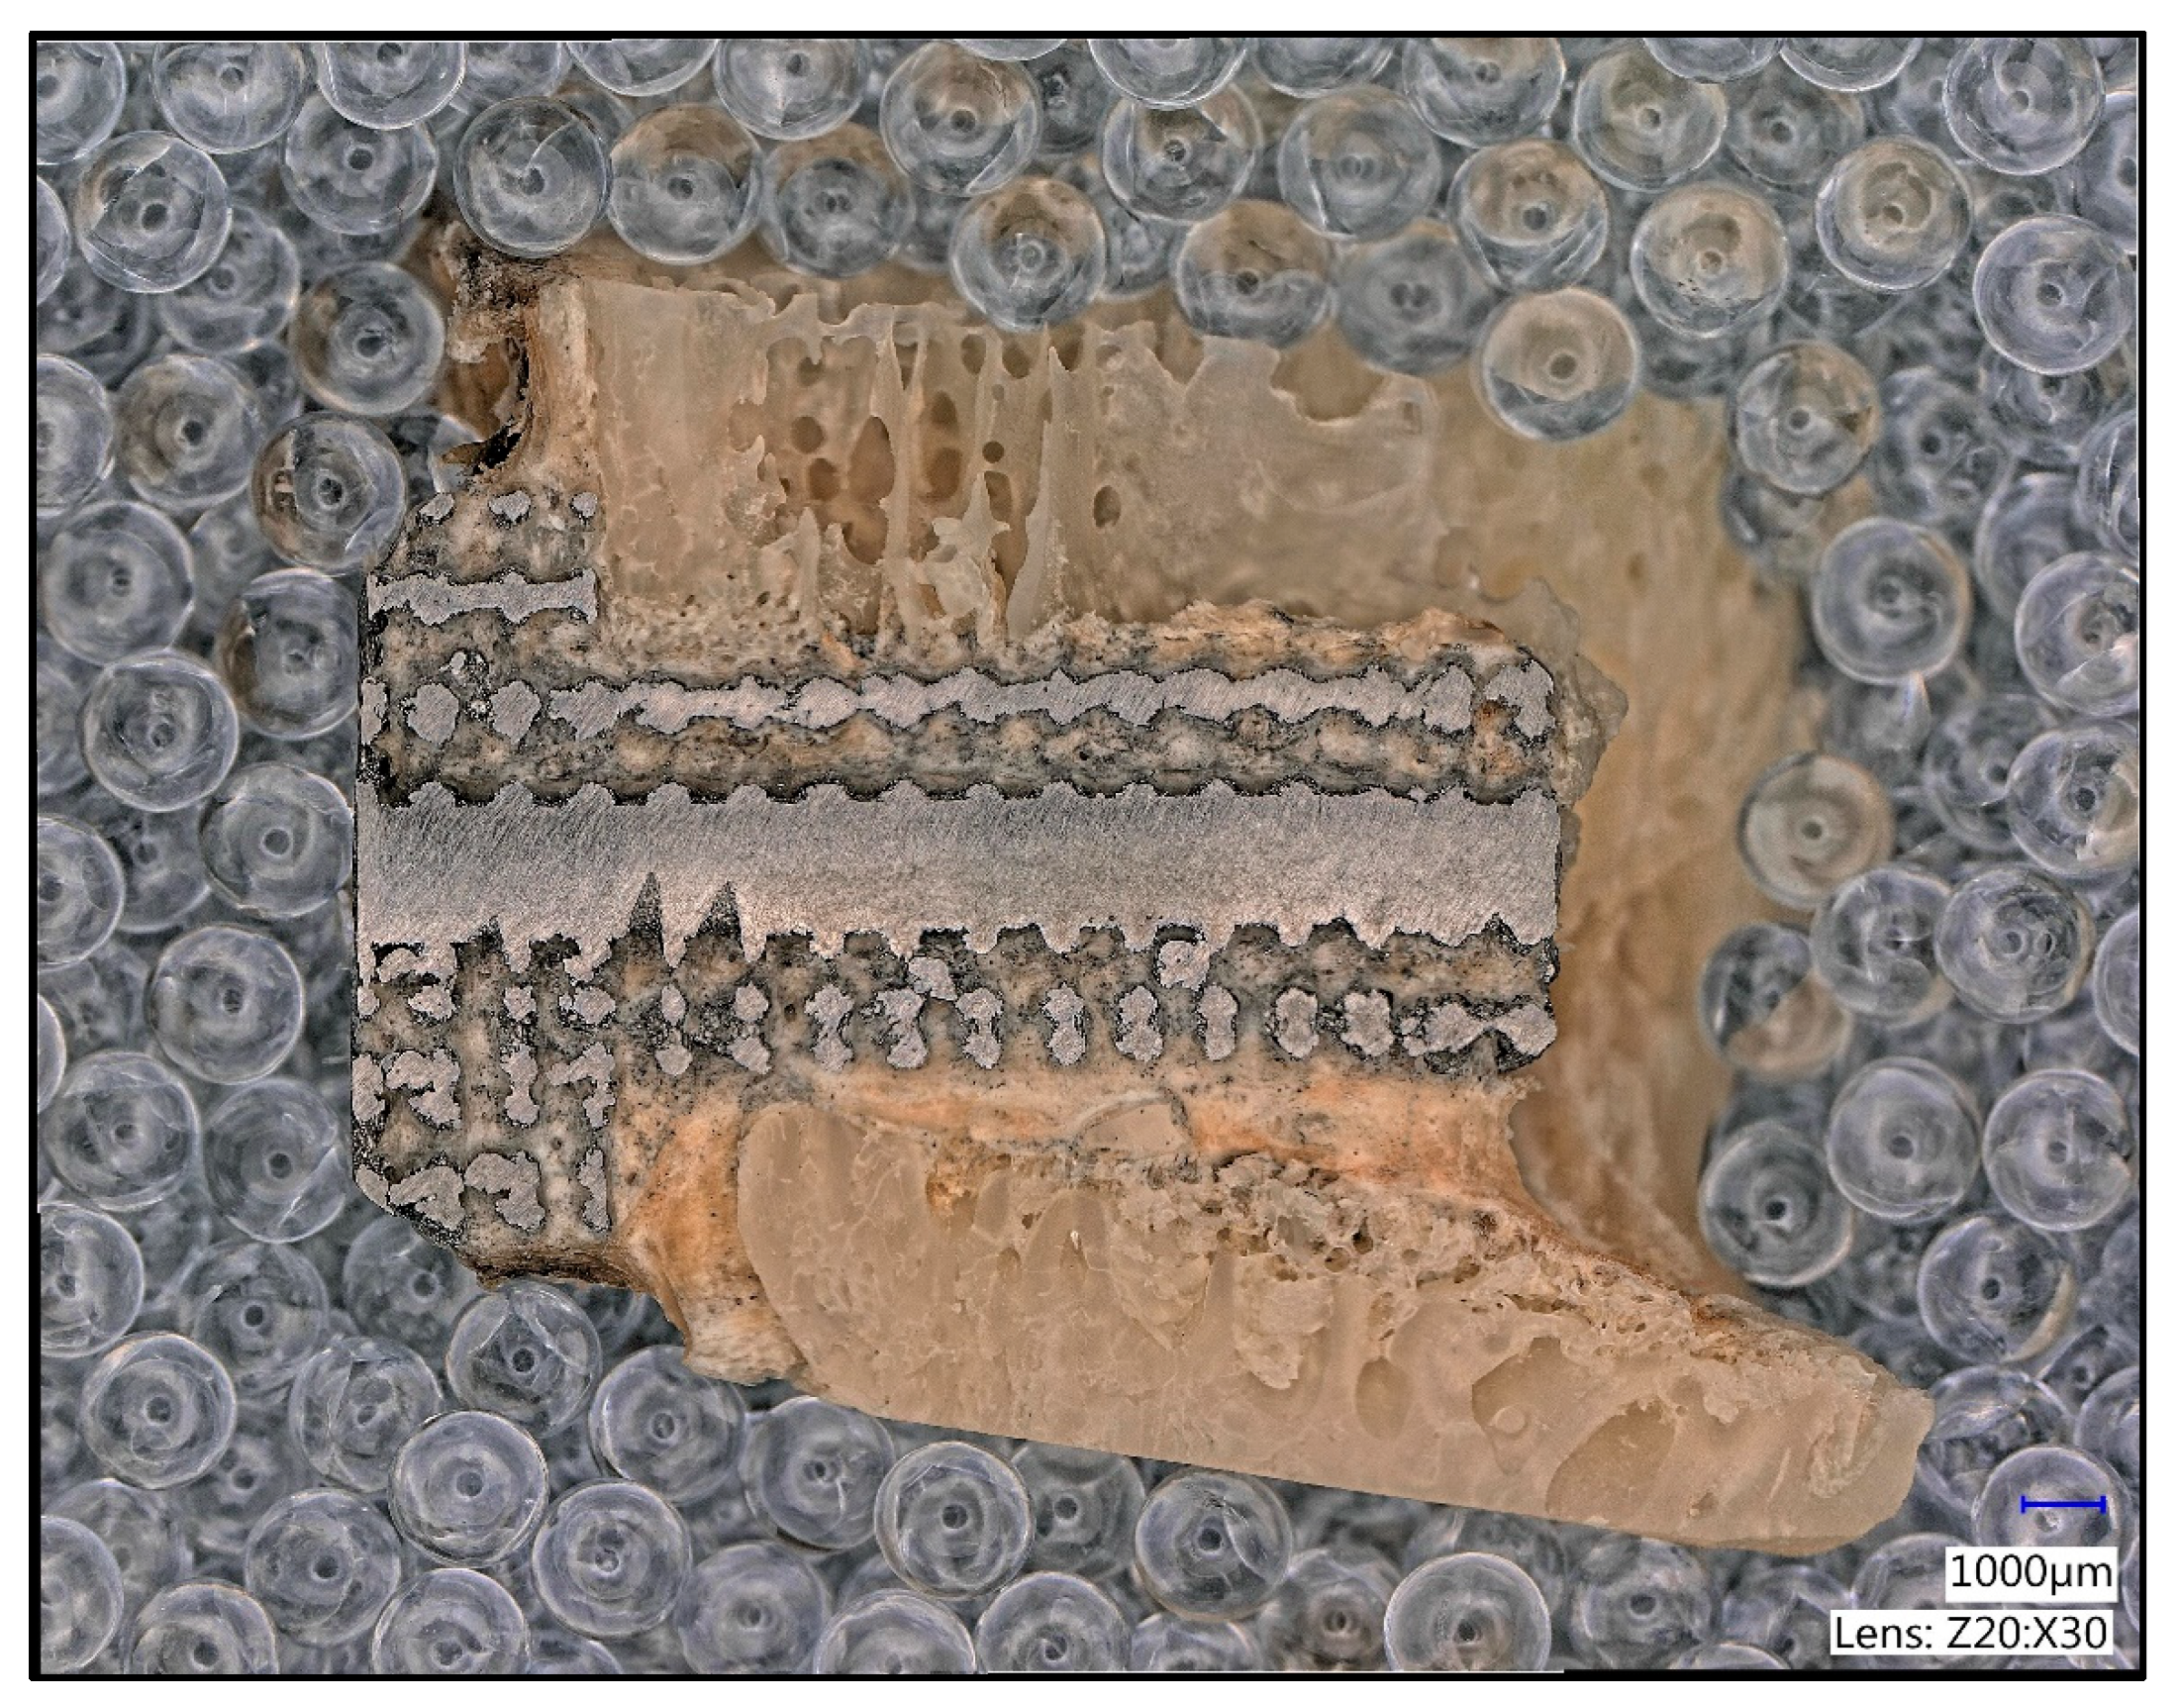
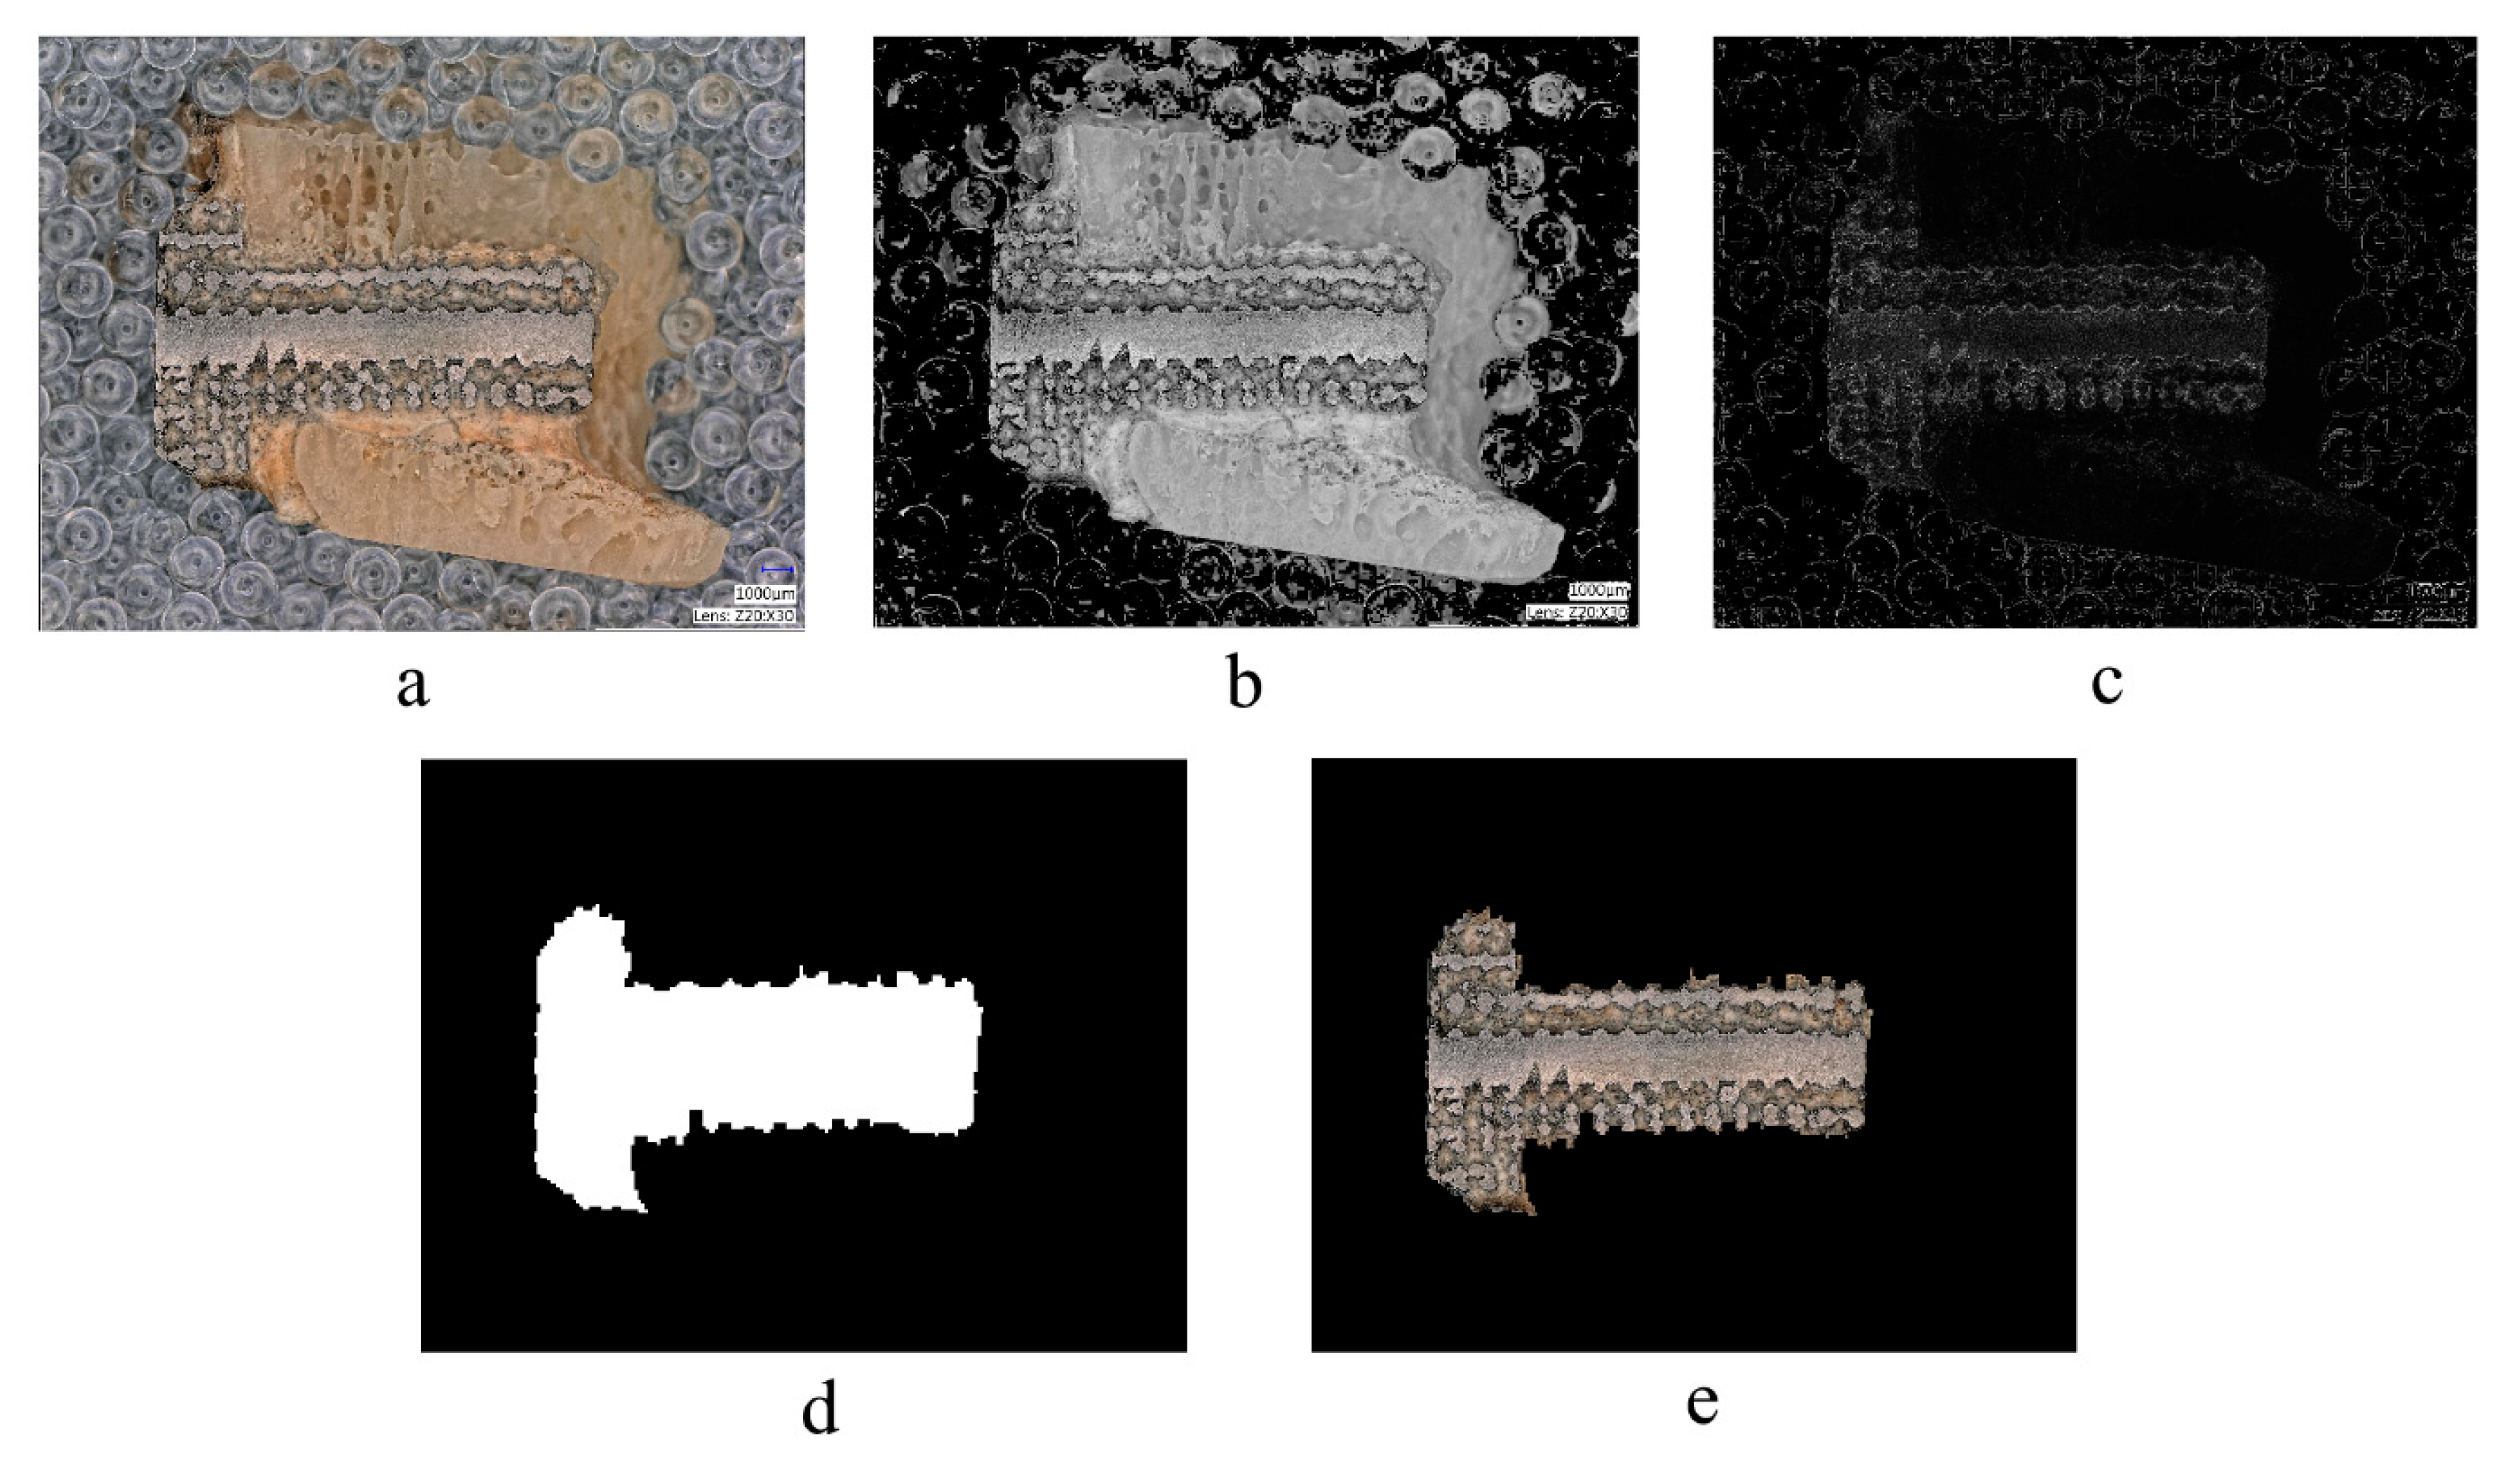
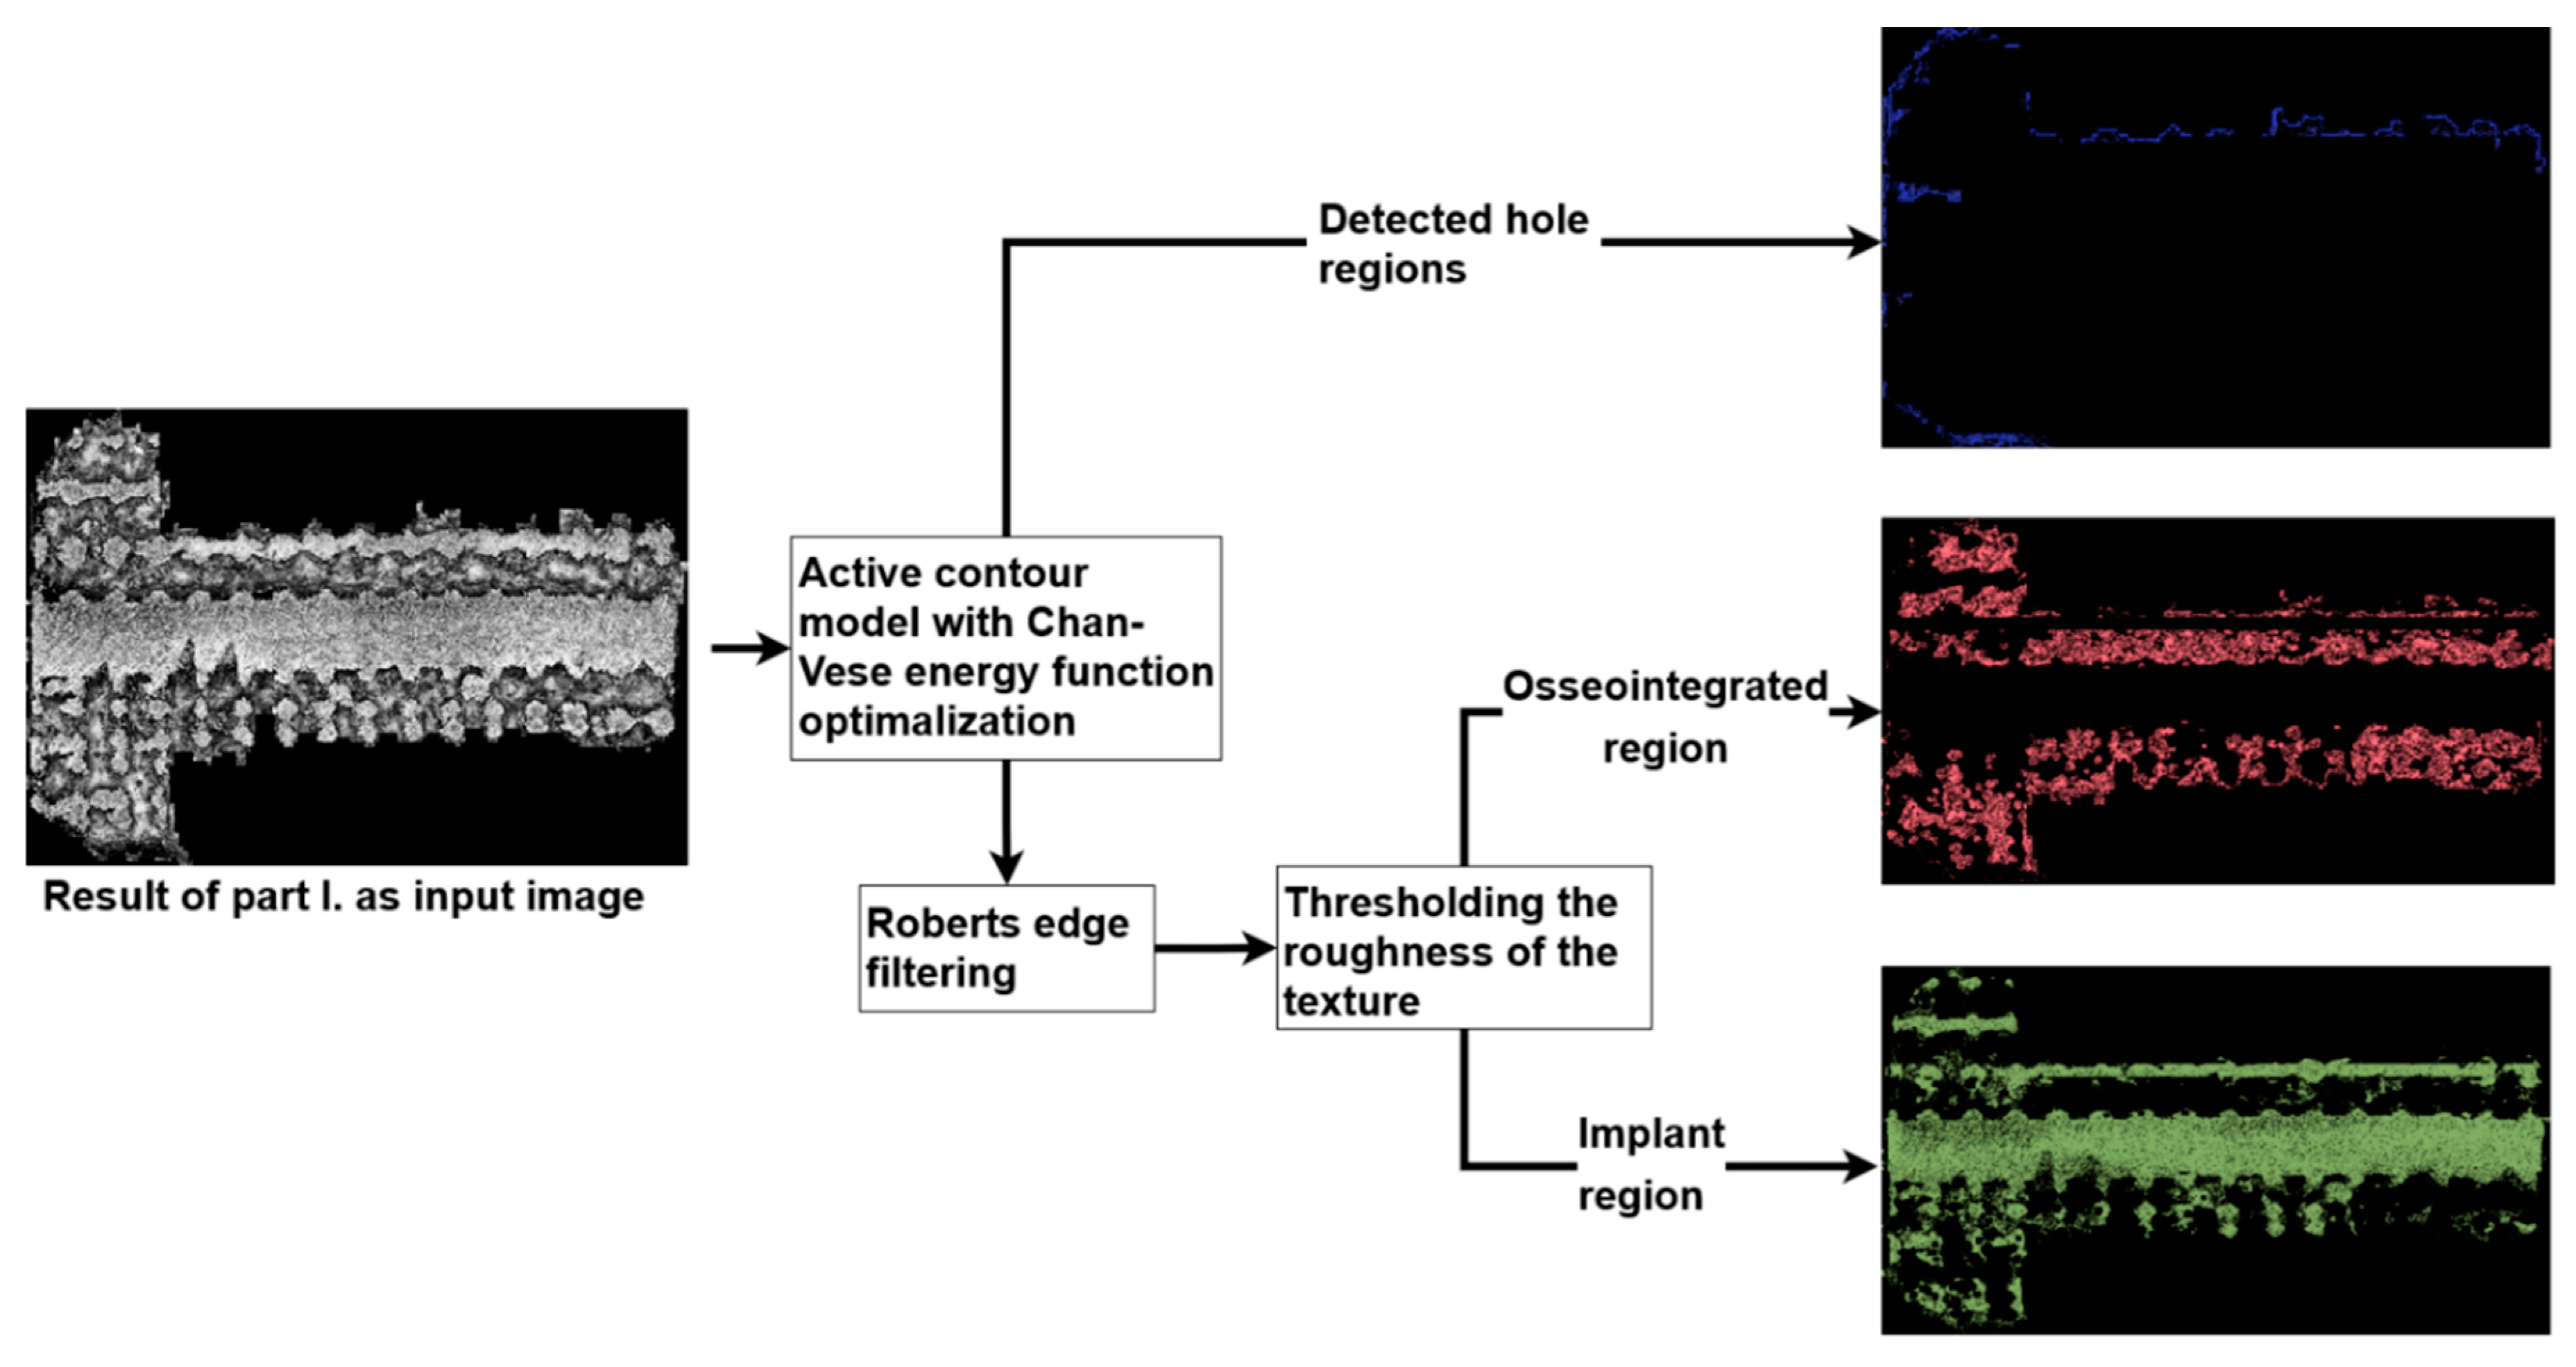
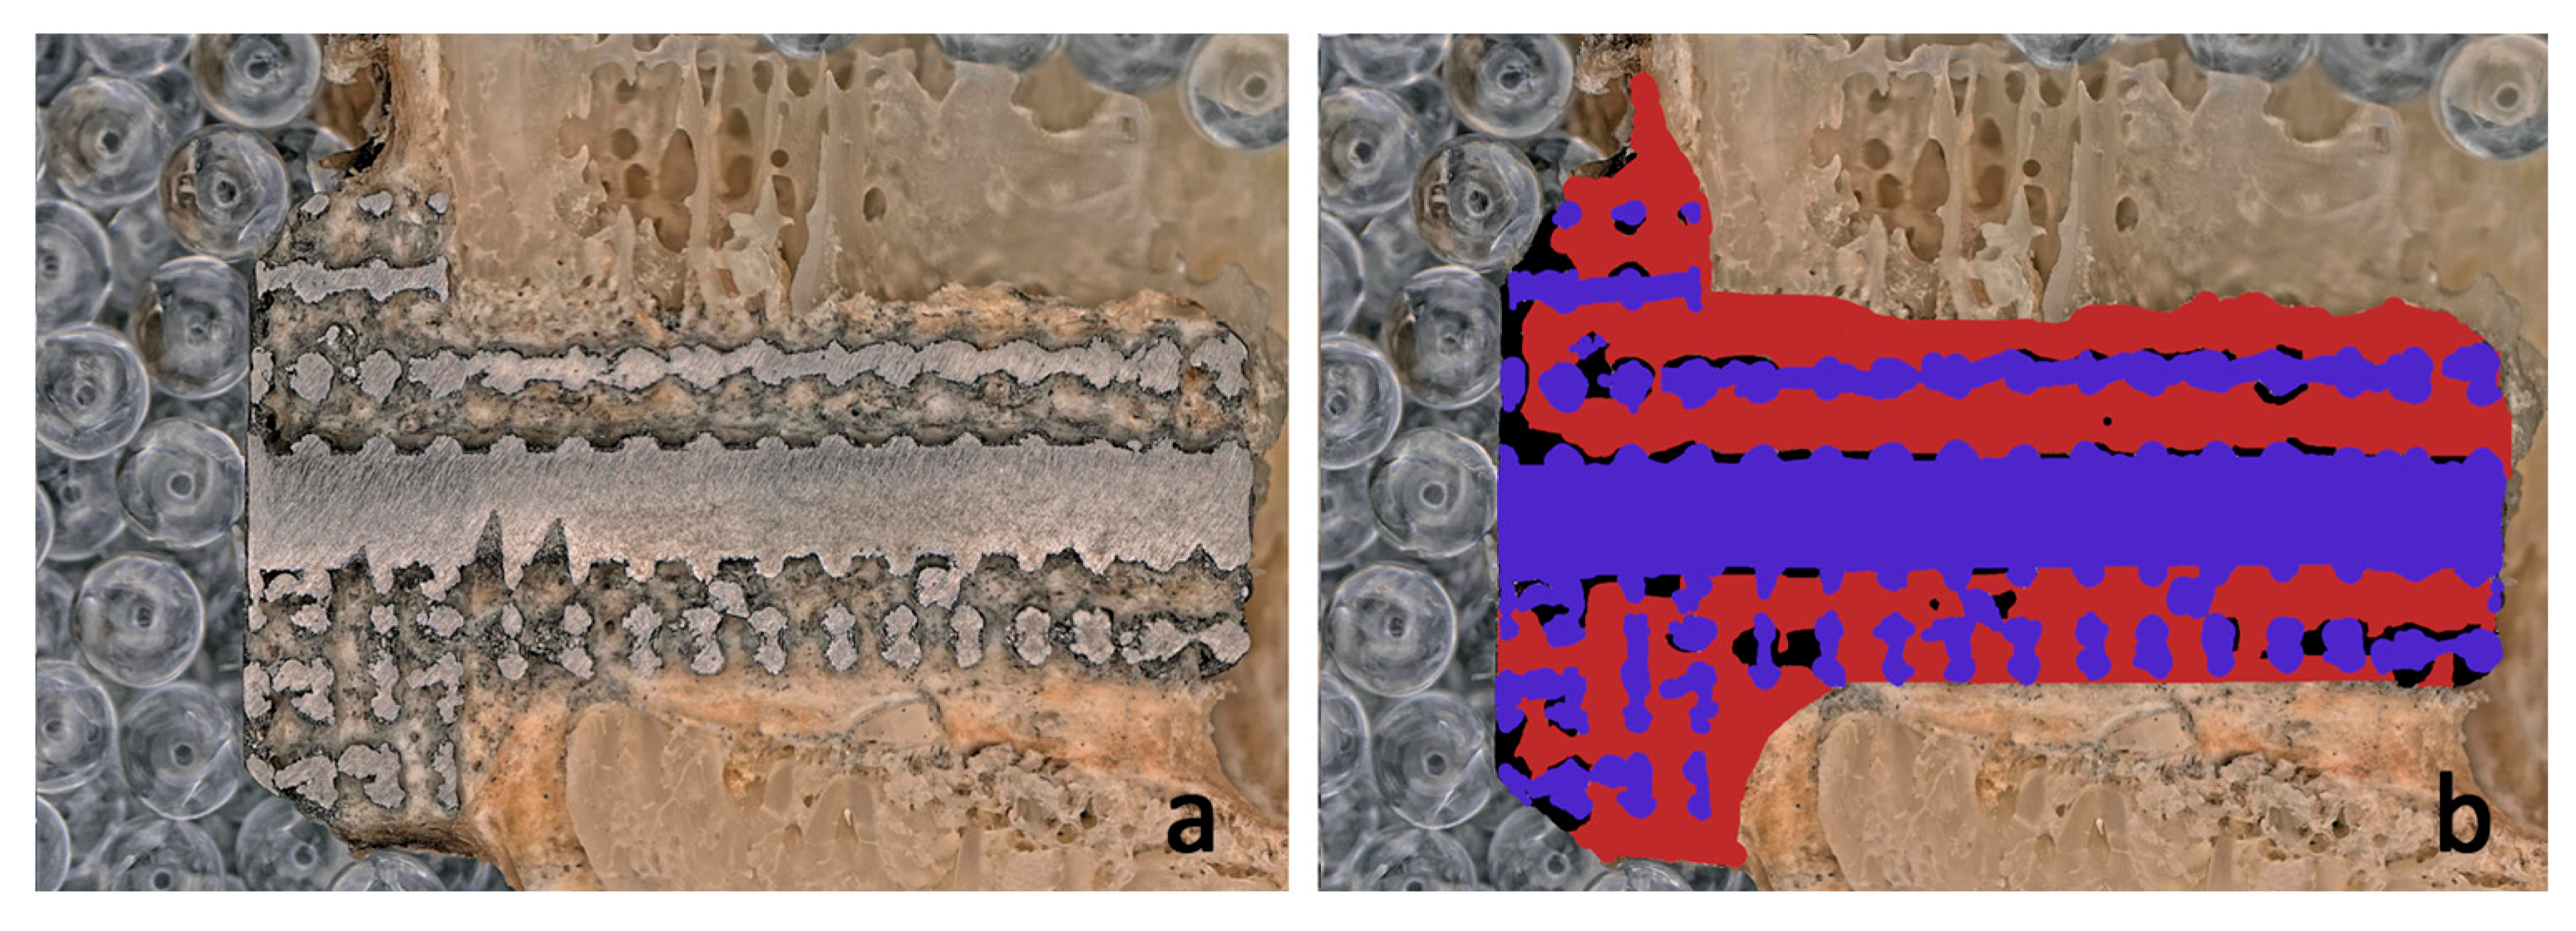
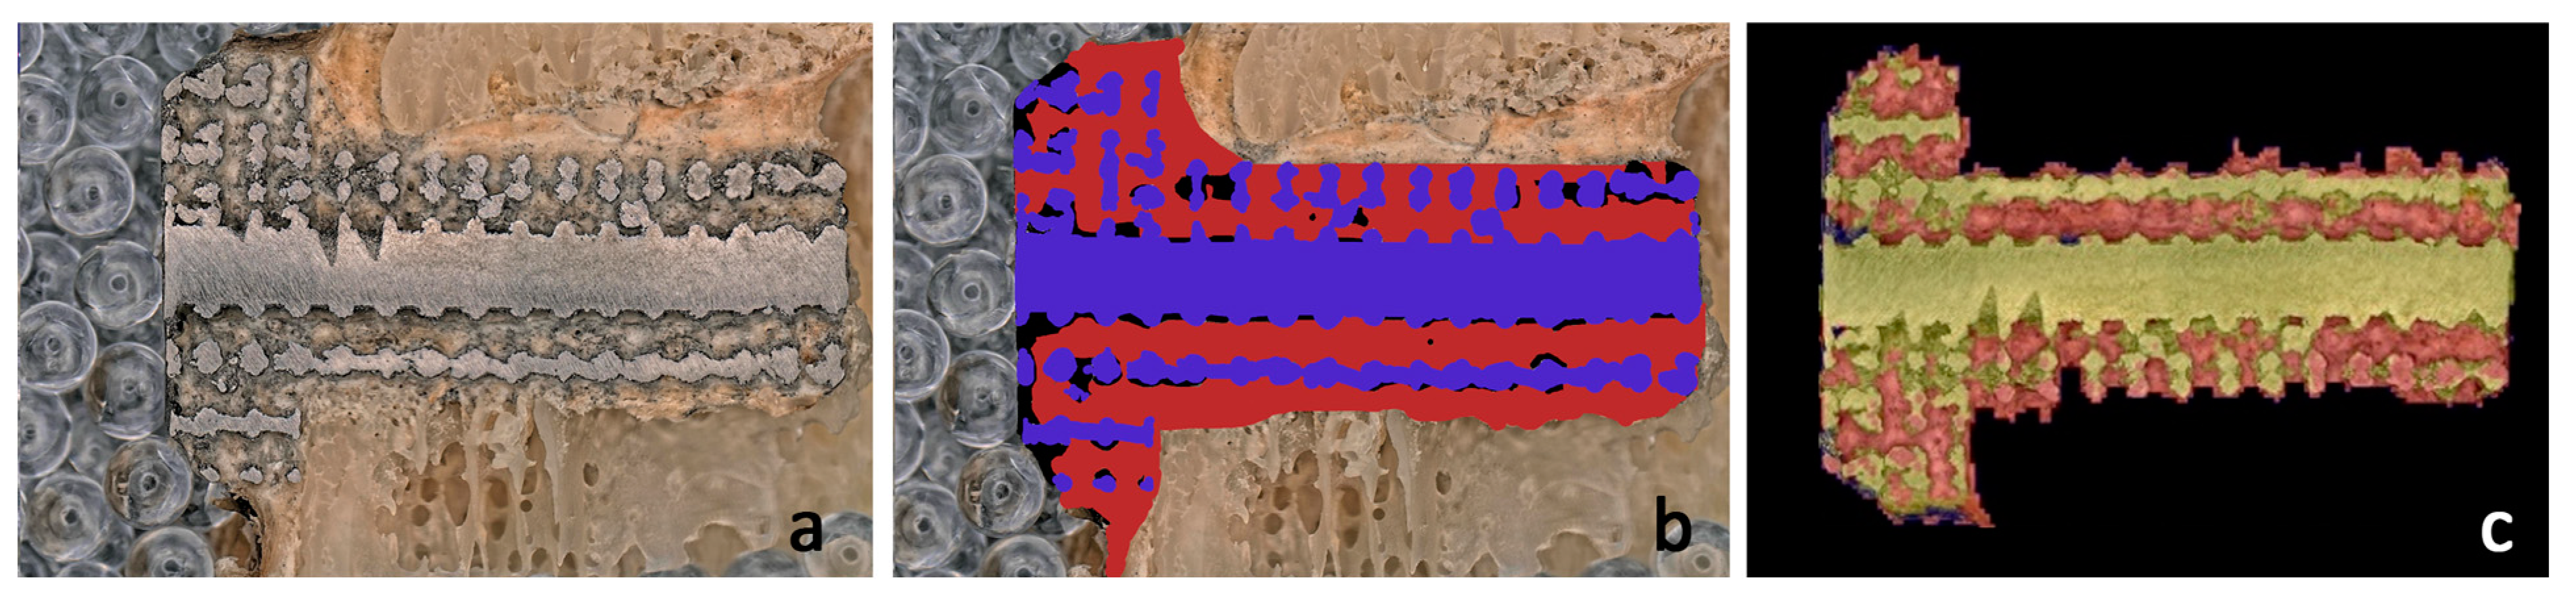
2.5. Image Processing Algorithm
2.6. Manual Image Processing
2.7. Statistical Analysis
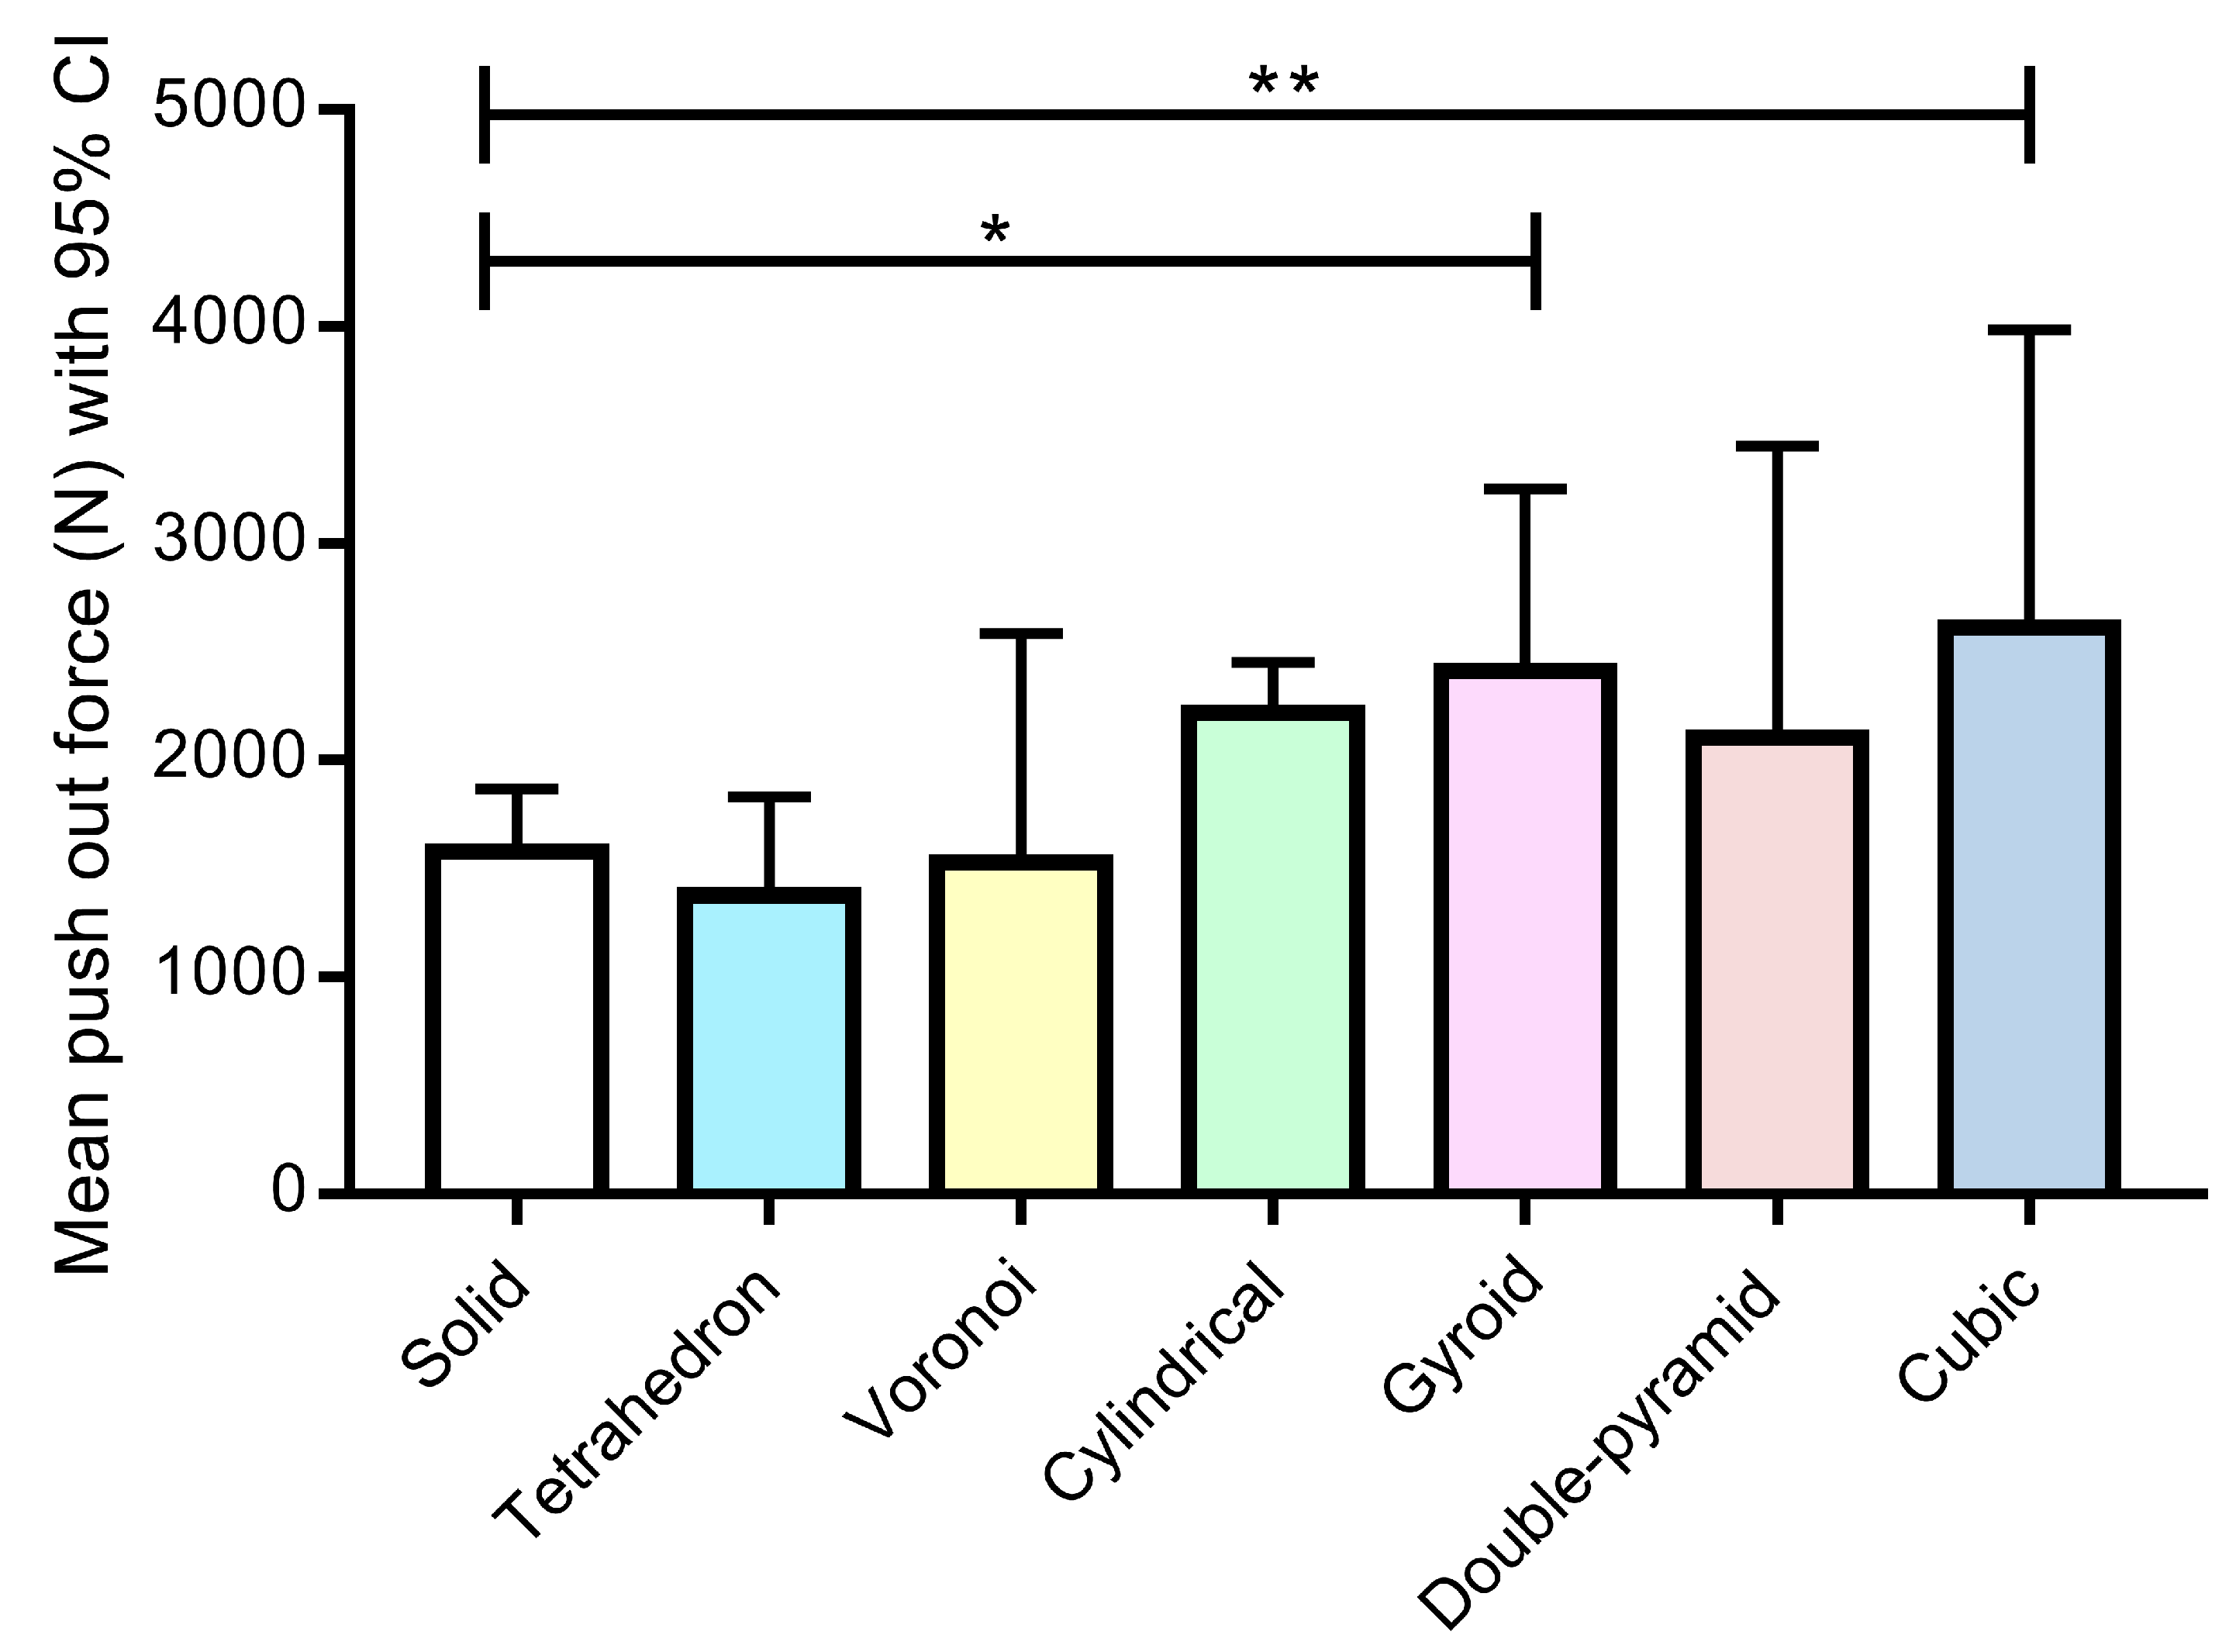
- There is no significant difference in the push-out force between the solid grid and the other grid types.
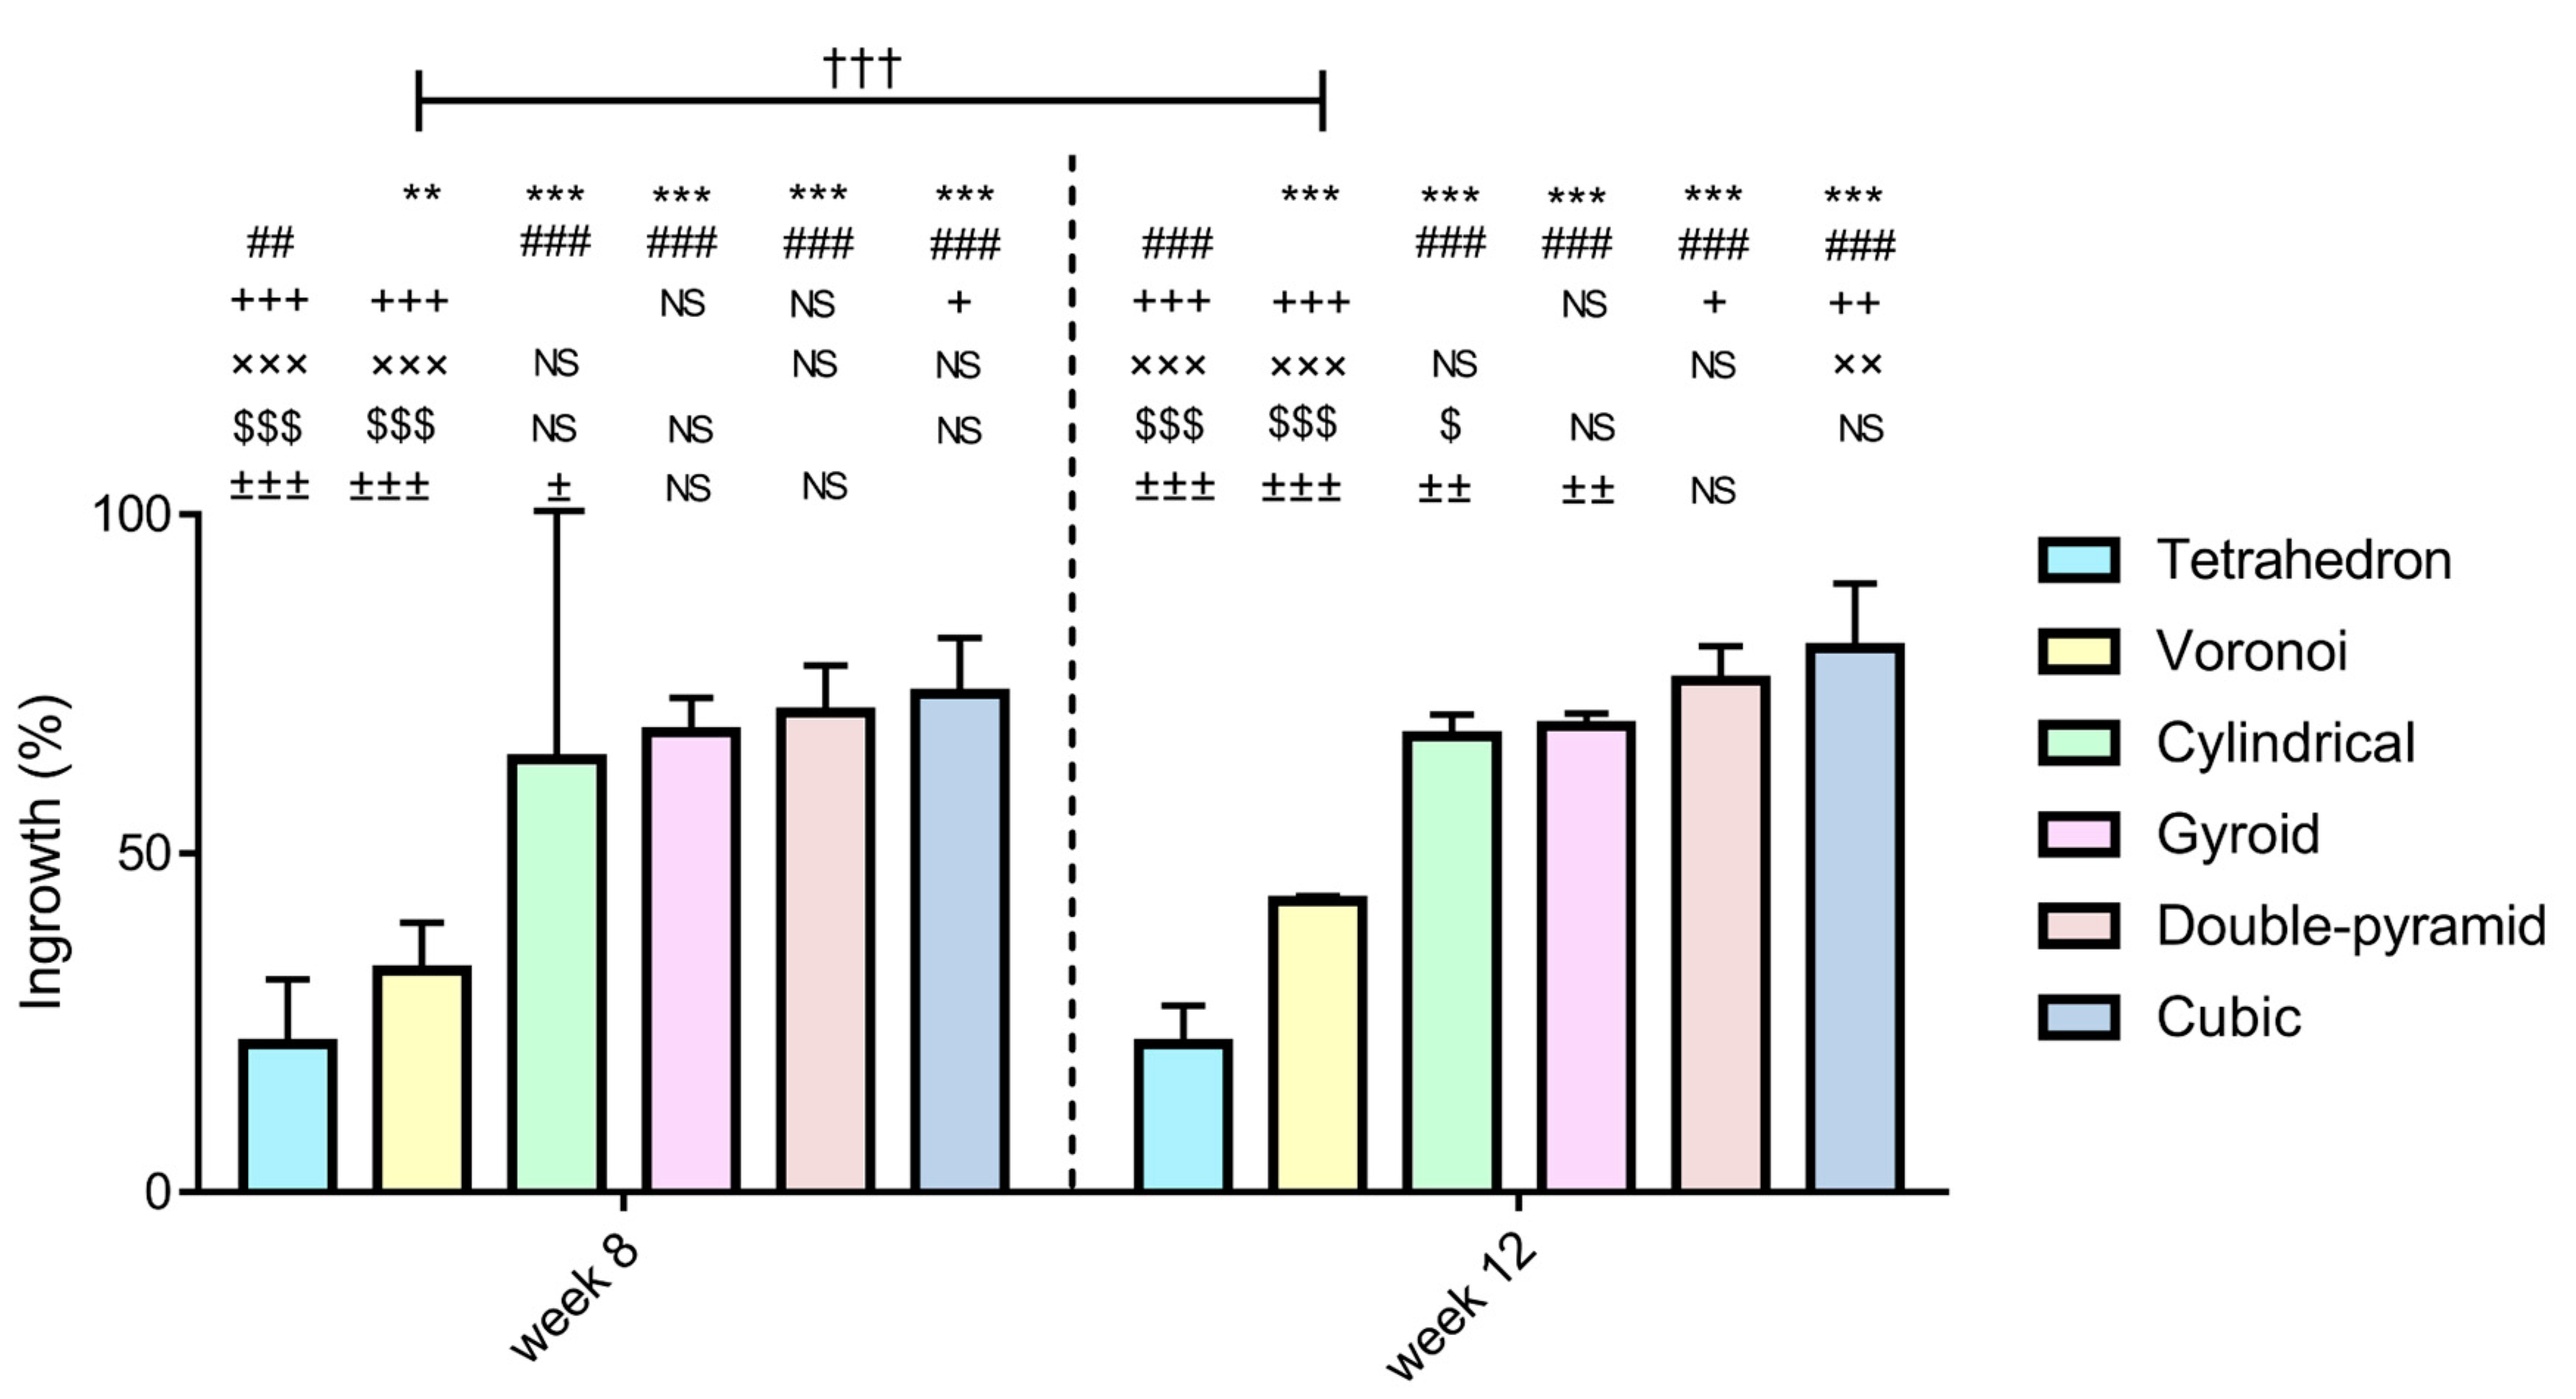
- There is no significant difference in ingrowth between the examined grid types at week 8 and week 12, and the ingrowth over time within each grid type does not change significantly.
3. Results and Discussion
3.1. Mechanical Evaluation
3.2. Comparison of the Results of the Image Processing Algorithm and Manual Drawing
3.3. Bone Ingrowth Efficiency in Terms of Lattice Type and Time Elapsed after Implantation
4. Conclusions
- The shape of the lattice structure of 3D-printed titanium implants has a great influence on bone ingrowth.
- The results of statistical and classical histological processing confirm that our newly developed image processing algorithms are suitable for the accurate and precise determination of the extent of bone growth.
- The lattice shapes containing round-shaped and quasi-round-shaped holes, i.e., the gyroid, double pyramid, and cube, facilitate more bone ingrowth. Additionally, considerably high bone ingrowth rates (60–80%) can be detected in the case of these most successful lattice types in sheep femoral condyles after 12 weeks.
Author Contributions
Funding
Institutional Review Board Statement
Informed Consent Statement
Data Availability Statement
Acknowledgments
Conflicts of Interest
References
- Ryan, G.; Pandit, A.; Apatsidis, D.P. Fabrication methods of porous metals for use in orthopaedic applications. Biomaterials 2006, 27, 2651–2670. [Google Scholar] [CrossRef] [PubMed]
- Vafaeefar, M.; Moerman, K.M.; Kavousi, M.; Vaughan, T.J. A morphological, topological and mechanical investigation of gyroid, spinodoid and dual-lattice algorithms as structural models of trabecular bone. J. Mech. Behav. Biomed. Mater. 2023, 138, 105584. [Google Scholar] [CrossRef] [PubMed]
- Li, F.; Li, J.; Xu, G.; Liu, G.; Kou, H.; Zhou, L. Fabrication, pore structure and compressive behavior of anisotropic porous titanium for human trabecular bone implant applications. J. Mech. Behav. Biomed. Mater. 2015, 46, 104–114. [Google Scholar] [CrossRef] [PubMed]
- Torres, Y.; Lascano, S.; Bris, J.; Pavon, J.; Rodriguez, J.A. Development of porous titanium for biomedical applications: A comparison between loose sintering and space-holder techniques. Mater. Sci. Eng. C 2014, 37, 148–155. [Google Scholar] [CrossRef]
- Colombo, P.; Dunand, D.C.; Kumar, V. Porous materials: Less is more. J. Mater. Res. 2013, 28, 2187–2190. [Google Scholar] [CrossRef]
- Geetha, M.; Singh, A.K.; Asokamani, R.; Gogia, A.K. Ti based biomaterials, the ultimate choice for orthopaedic implants – A review. Prog. Mater. Sci. 2009, 54, 397–425. [Google Scholar] [CrossRef]
- Wang, C.; Sun, B.; Zhang, Y.; Wang, C.; Yang, G. Design of a Novel Trabecular Acetabular Cup and Selective Laser Melting Fabrication. Materials 2022, 15, 6142. [Google Scholar] [CrossRef]
- Tao, P.; Zhong, J.; Li, H.; Hu, Q.; Gong, S.; Xu, Q. Microstructure, Mechanical Properties, and Constitutive Models for Ti–6Al–4V Alloy Fabricated by Selective Laser Melting (SLM). Materials 2019, 9, 447. [Google Scholar] [CrossRef]
- Parthasarathy, J.; Starly, B.; Raman, S.; Christensen, A. Mechanical evaluation of porous titanium (Ti6Al4V) structures with electron beam melting (EBM). J. Mech. Behav. Biomed. Mater. 2010, 3, 249–259. [Google Scholar] [CrossRef]
- Frosch, K.H.; Sondergeld, I.; Dresing, K.; Rudy, T.; Lohmann, C.H.; Rabba, J.; Schild, D.; Breme, J.; Stuermer, K.M. Autologous osteoblasts enhance osseointegration of porous titanium implants. J. Orthopaed. Res. 2003, 21, 213–223. [Google Scholar] [CrossRef]
- Boyan, B.D.; Schwartz, Z.; Lohmann, C.H.; Sylvia, V.L.; Cohran, D.L.; Dean, D.D.; Puzas, J.E. Pretreatment of bone with osteoclasts affects phenotypic expression of osteoblast-like cells. J. Orthop. Res. 2003, 21, 638–647. [Google Scholar] [CrossRef] [PubMed]
- Chang, B.; Song, W.; Han, T.; Yan, J.; Li, F.; Zhao, L.; Kou, H.; Zhang, Y. Influence of pore size of porous titanium fabricated by vacuum diffusion bonding of titanium meshes on cell penetration and bone ingrowth. Acta Biomater. 2016, 33, 311–321. [Google Scholar] [CrossRef] [PubMed]
- Marin, E.; Fedrizzi, L.; Zagra, L. Porous metallic structures for orthopaedic applications: A short review of materials and technologies. Eur. Orthop. Traumatol. 2010, 1, 103–109. [Google Scholar] [CrossRef]
- Nouri, A.; Hodgson, P.D.; Wen, C. Biomimetic Porous Titanium Scaffolds for Orthopedic and Dental Applications. In Biomimetics Learning from Nature; IntechOpen: London, UK, 2010; pp. 415–450. [Google Scholar]
- Luo, C.; Wang, C.; Wu, X.; Xie, X.; Wang, C.; Zhao, C.; Zou, C.; Lv, F.; Huang, W.; Liao, J. Influence of porous tantalum scaffold pore size on osteogenesis and osteointegration: A comprehensive study based on 3D-printing technology. Mater. Sci. Eng. C 2021, 129, 112382. [Google Scholar] [CrossRef] [PubMed]
- Karageorgiou, V.; Kaplan, D. Porosity of 3D biomaterial scaffolds and osteogenesis. Biomaterials 2005, 26, 5474–5491. [Google Scholar] [CrossRef]
- Fukuda, A.; Takemoto, M.; Saito, T.; Fujibayashi, S.; Neo, M.; Pattanayak, D.K.; Matsushita, T.; Sasaki, K.; Nishida, N.; Kokubo, T.; et al. Osteoinduction of porous Ti implants with a channel structure fabricated by selective laser melting. Acta Biomater. 2011, 7, 2327–2336. [Google Scholar] [CrossRef] [PubMed]
- Ran, Q.; Yang, W.; Hu, Y.; Shen, X.; Yu, Y.; Xiang, Y.; Cai, K. Osteogenesis of 3D printed porous Ti6Al4V implants with different pore sizes. J. Mech. Behav. Biomed. Mater. 2018, 84, 1–11. [Google Scholar] [CrossRef] [PubMed]
- Buj-Corral, I.; Bagheri, A.; Petit-Rojo, O. 3D Printing of Porous Scaffolds with Controlled Porosity and Pore Size Values. Materials 2018, 11, 1532. [Google Scholar] [CrossRef]
- Taniguchi, N.; Fujibayashi, S.; Takemoto, M.; Sasaki, K.; Otsuki, B.; Nakamura, T.; Matsushita, T.; Kokubo, T.; Matsuda, S. Effect of pore size on bone ingrowth into porous titanium implants fabricated by additive manufacturing: An in vivo experiment. Mater. Sci. Eng. C 2016, 59, 690–701. [Google Scholar] [CrossRef]
- Van Bael, S.; Chai, Y.C.; Truscello, S.; Moesen, M.; Kerckhofs, G.; Van Oosterwyck, H.; Kruth, J.P.; Schrooten, J. The effect of pore geometry on the in vitro biological behavior of human periosteum-derived cells seeded on selective laser-melted Ti6Al4V bone scaffolds. Acta Biomater. 2012, 8, 2824–2834. [Google Scholar] [CrossRef]
- Lim, H.K.; Ryu, M.; Woo, S.H.; Song, I.S.; Choi, Y.J.; Lee, U.L. Bone Conduction Capacity of Highly Porous 3D-Printed Titanium Scaffolds Based on Different Pore Designs. Materials 2021, 14, 3892. [Google Scholar] [CrossRef]
- Sharp, R.; Pelletier, M.H.; Walsh, W.R.; Kelly, C.N.; Gall, K. Corrosion Resistance of 3D Printed Ti6Al4V Gyroid Lattices with Varying Porosity. Genes 2022, 15, 4805. [Google Scholar] [CrossRef] [PubMed]
- Pobloth, A.M.; Mersiowsky, M.J.; Kliemt, L.; Schell, H.; Dienelt, A.; Pfitzner, B.M.; Burgkart, R.; Detsch, R.; Wulsten, D.; Boccaccini, A.R.; et al. Bioactive coating of zirconia toughened alumina ceramic implants improves cancellous osseointegration. Sci. Rep. 2019, 9, 16692. [Google Scholar] [CrossRef] [PubMed]
- Glasbey, C.A. An analysis of histogram based thresholding algorithms. CVGIP Graph. Model. Image Process. 1993, 55, 532–537. [Google Scholar] [CrossRef]
- Sobel, I.; Feldman, G. An Isotropic 3x3 Image Gradient Operator. 1990. [Google Scholar] [CrossRef]
- Chan, T.; Vese, L. An active contour model without edges. In Scale-Space Theories in Computer Vision; Springer: Berlin/Heidelberg, Germany, 1999; pp. 141–151. [Google Scholar]
- Roberts, L.G. Machine perception of three dimensional solids. In Computer Methods in Image Analysis; The Institute of Electrical and Electronics Engineers, Inc.: New York, NY, USA, 1980; pp. 285–323. [Google Scholar]
- Pearce, A.I.; Richards, R.G.; Milz, S.; Schneider, E.; Pearce, S.G. Animal models for implant biomaterial research in bone: A review. Eur. Cell. Mater. 2007, 13, 1–10. [Google Scholar] [CrossRef] [PubMed]
- Maconachie, T.; Leary, M.; Lozanovski, B.; Zhang, X.; Qian, M.; Faruque, O.; Brandt, M. SLM lattice structures: Properties, performance, applications and challenges. Mater. Des. 2019, 183, 108137. [Google Scholar] [CrossRef]
- Kelly, C.N.; Wang, T.; Crowley, J.; Wills, D.; Pelletier, M.H.; Westrick, E.R.; Adams, S.B.; Gall, K.; Walsh, W.R. High-strength, porous additively manufactured implants with optimized mechanical osseointegration. Biomaterials 2021, 279, 121206. [Google Scholar] [CrossRef]
- Derby, B. Printing and prototyping of tissues and scaffolds. Science 2012, 338, 921–926. [Google Scholar] [CrossRef]
- Deng, F.; Liu, L.; Li, Z.; Liu, J. 3D printed Ti6Al4V bone scaffolds with different pore structure effects on bone ingrowth. J. Biol. Eng. 2021, 15, 4. [Google Scholar] [CrossRef]
- Park, K.; Min, K.; Roh, Y. Design Optimization of Lattice Structures under Compression: Study of Unit Cell Types and Cell Arrangements. Materials 2022, 15, 97. [Google Scholar] [CrossRef]
- Bogusz, P.; Poplawski, A.; Stankiewicz, M.; Kowalski, B. Experimental Research of Selected Lattice Structures Developed with 3D Printing Technology. Materials 2022, 15, 378. [Google Scholar] [CrossRef] [PubMed]
- Kladovasilakis, N.; Tsongas, K.; Karalekas, D.; Tzetzis, D. Architected materials for Additive Manufacturing: A Comprehensive Review. Materials 2022, 15, 5919. [Google Scholar] [CrossRef] [PubMed]
- Tseng, S.-F.; Wang, I.H.; Chang, C.-M.; Lee, C.-C.; Yeh, D.-Y.; Chen, T.-W.; Yeh, A.-C. Mechanical characteristic comparison of additively manufactured Ti–6Al–4V lattice structures in biocompatible bone tissue growth. Mater. Sci. Eng. A 2022, 857, 144045. [Google Scholar] [CrossRef]
- Arabnejad, S.; Burnett Johnston, R.; Pura, J.A.; Singh, B.; Tanzer, M.; Pasini, D. High-strength porous biomaterials for bone replacement: A strategy to assess the interplay between cell morphology, mechanical properties, bone ingrowth and manufacturing constraints. Acta Biomater. 2016, 30, 345–356. [Google Scholar] [CrossRef]
- Chen, Z.; Yan, X.; Yin, S.; Liu, L.; Liu, X.; Zhao, G.; Ma, W.; Qi, W.; Ren, Z.; Liao, H.; et al. Influence of the pore size and porosity of selective laser melted Ti6Al4V ELI porous scaffold on cell proliferation, osteogenesis and bone ingrowth. Mater. Sci. Eng. C 2020, 106, 110289. [Google Scholar] [CrossRef]
- Biemond, J.E.; Aquarius, R.; Verdonschot, N.; Buma, P. Frictional and bone ingrowth properties of engineered surface topographies produced by electron beam technology. Arch. Orthop. Trauma Surg. 2011, 131, 711–718. [Google Scholar] [CrossRef]


| Fabrication Technique | Surgical Area/Experimental Type | Scaffold Design | Species | Pore Size (µm) | Author and Reference |
|---|---|---|---|---|---|
| n.a. | distal femur | titanium implants coated with autologous osteoblasts | rabbit | 400–600 | Frosch et al. [10] |
| n.a. | hip, intramedullary region | trabecular | canine, rabbit | >100 | Marin et al. [13] |
| n.a. | trabeculae | no data | no data | 200–300 | Nouri et al. [14] |
| vacuum diffusion bonding of titanium meshes | plate (in vitro assay) | random | rat (stem cells) | 300–400 | Chang et al. [12] |
| FDM | finite element analysis (in vitro) | trabecular | n.a. | 250–500 | Buj-Corral et. al. [19] |
| SLM | dorsal muscles | channel implant (with four square channels) | canine | ≥500 | Fukuda et al. [17] |
| SLM | in vitro and in vivo (femur) | versatile porous scaffolds | rabbit | 600 | Ran et al. [18] |
| SLM | metaphysis of the tibia | diamond crystal lattice | rabbit | 600 | Taniguchi et al. [20] |
| SLM | plate (in vitro assay), mechanical compression testing, computational fluid dynamical analysis | triangular, hexagonal, rectangular | human (stem cells) | 500 | Van Bael et al. [21] |
| SLM | medial femur | octadense, gyroid, dode, | rabbit | 1000 | Lim et al. [22] |
| LPBF | cyclic potentiodynamic polarization, post corrosion analysis | gyroid | n.a. | no data, only porosity | Sharp et al. [23] |
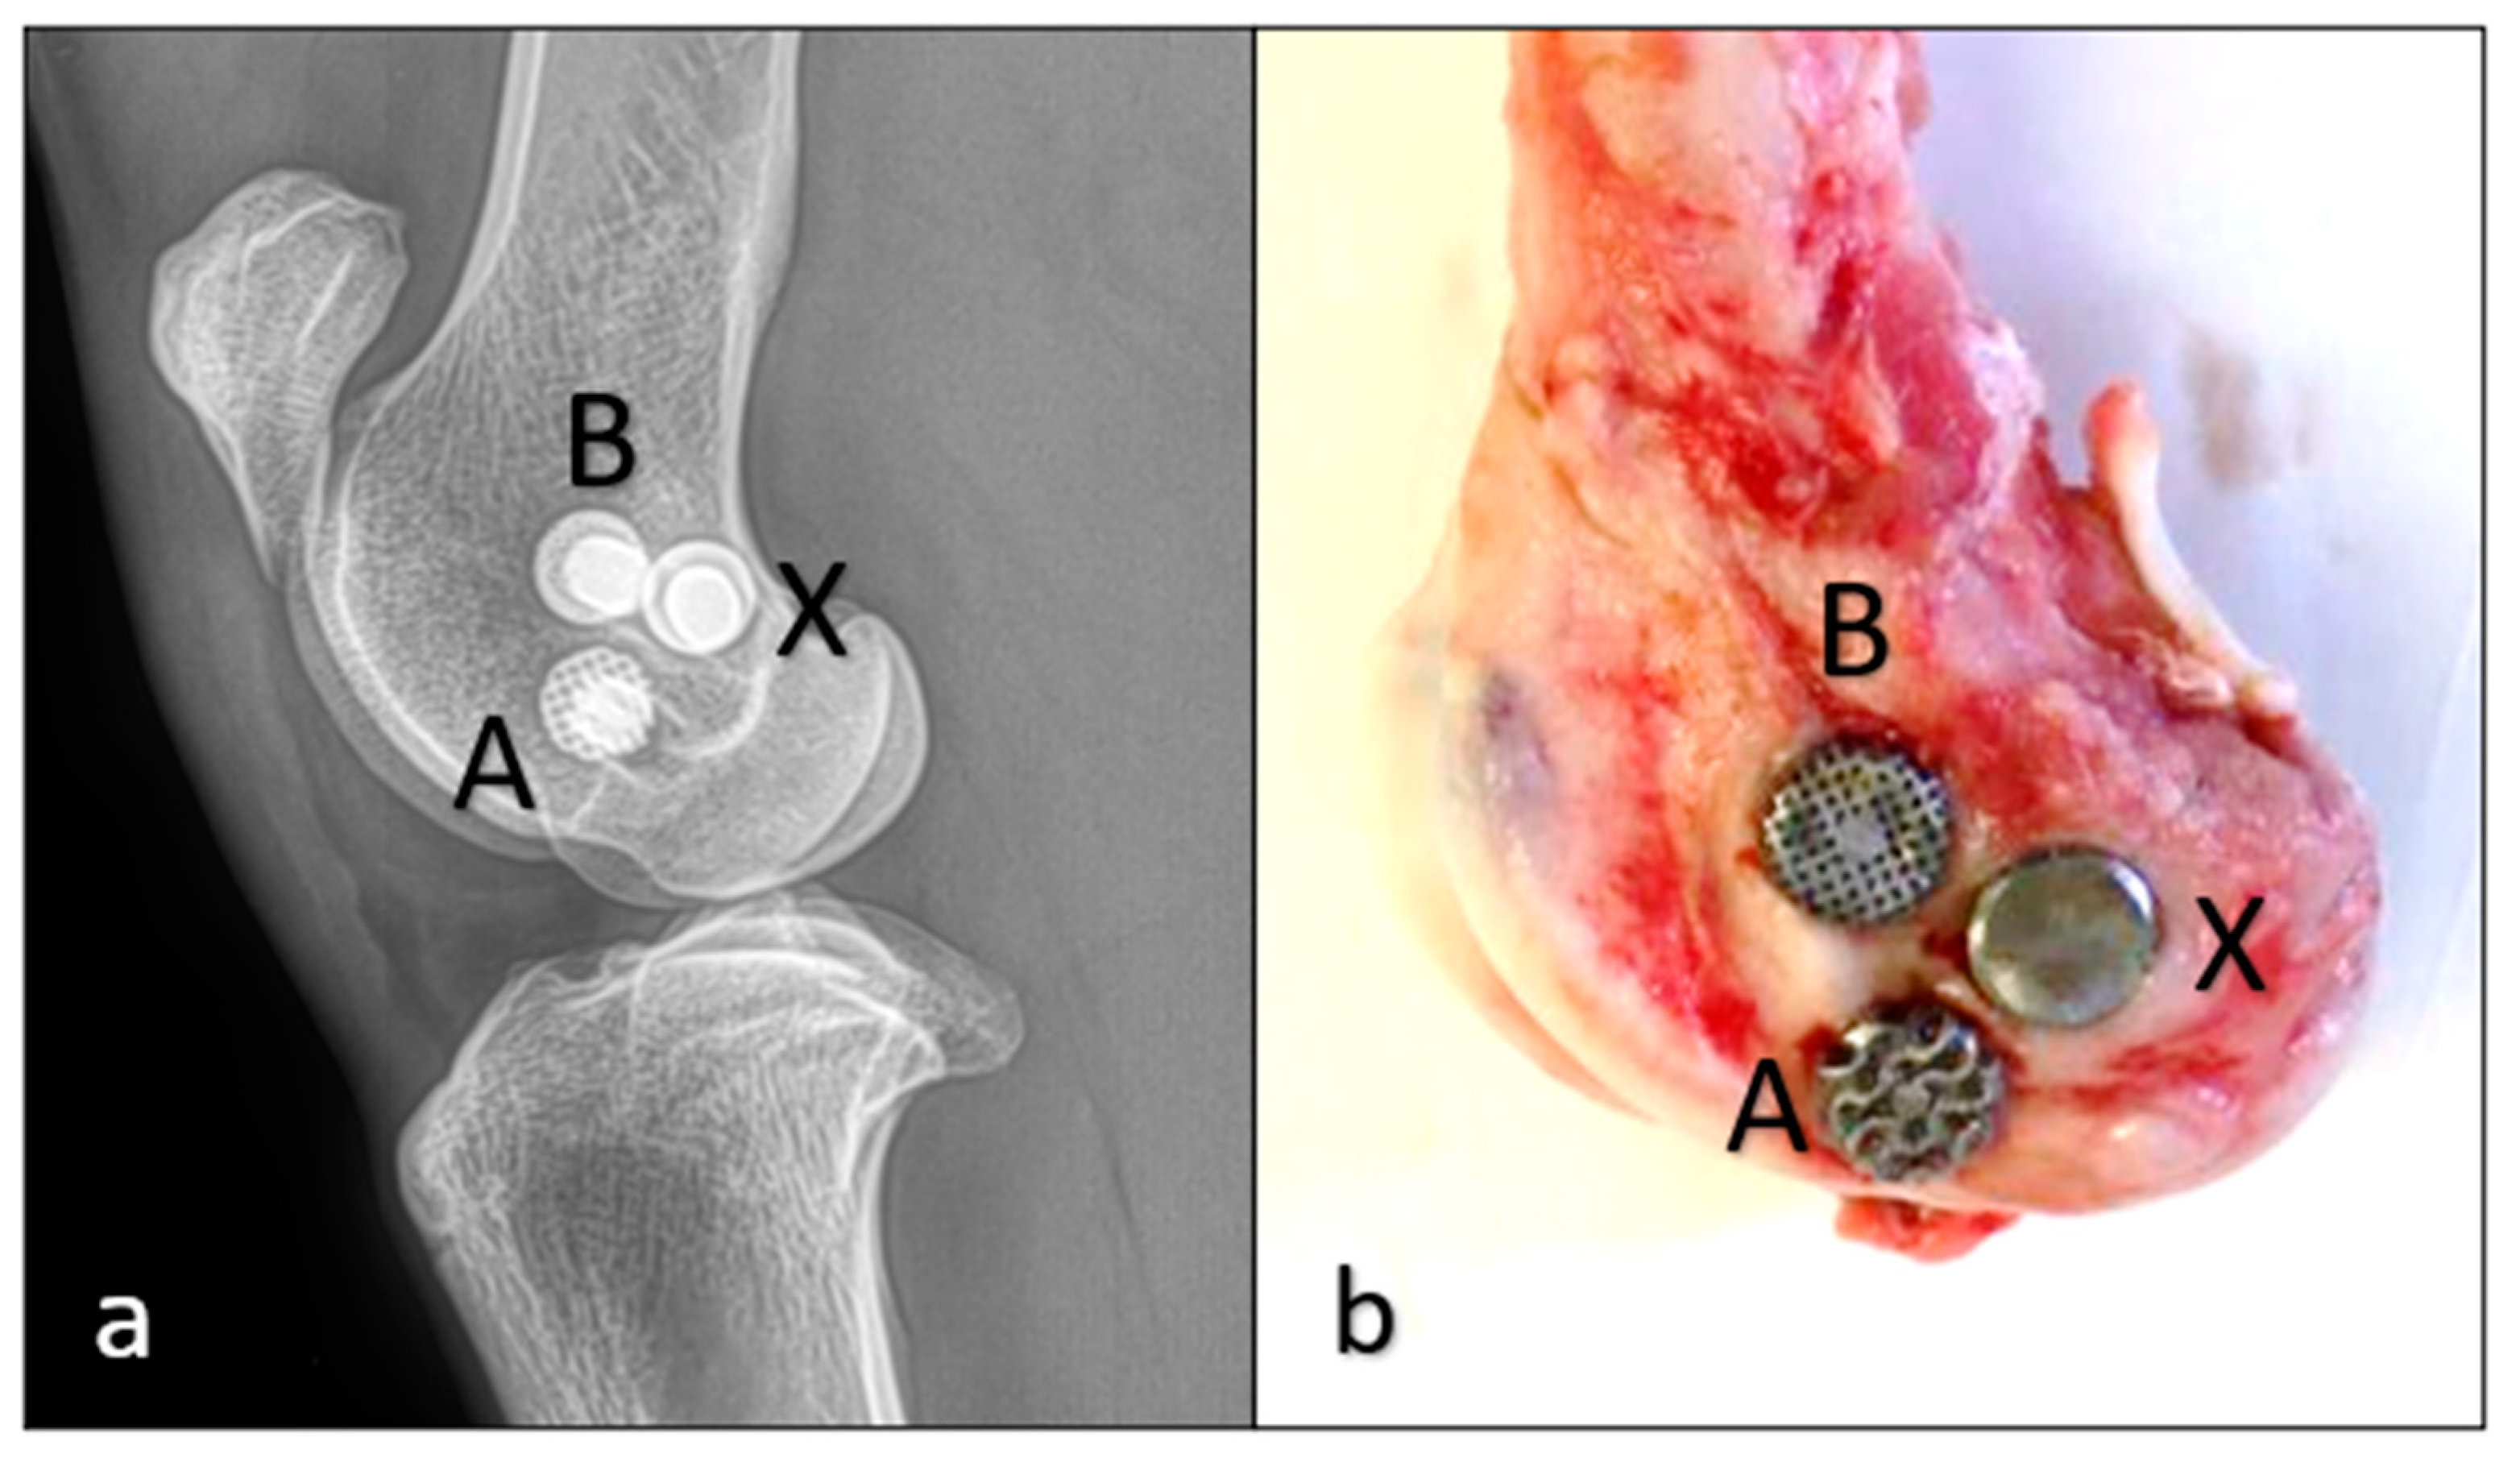
| EMB | femur condylus | gyroid, cubic, double- pyramid, tetrahedron, Voronoi, cylindrical | sheep | 600 | current study |
| Layer height | 30 µm |
| Laser power | 280 W |
| Laser speed | 1200 mm/s |
| Hatch distance | 0.14 mm |
| Energy input | 55.56 J/mm3 |
| Exposure pattern | No pattern |
| Hatch sorting | Time optimized |
| Hatch features | SkyWriting |
| Hatch rotation angle | 67° |
| Hatch offset | 0.015 mm |
| Exposure mode | Single exposure |
| Sheep | Grid Shape of Implanted Implants | Time of Euthanasia |
|---|---|---|
| 1. | “A” gyroid, “B” cube, “X” solid | 8 weeks |
| 2. | “A” gyroid, “B” cube, “X” solid | 8 weeks |
| 3. | “A” gyroid, “B” cube, “X” solid | 12 weeks |
| 4. | “A” gyroid, “B” cube, “X” solid | 12 weeks |
| 5. | “C” cylinder, “D” tetrahedron, “X” solid | 8 weeks |
| 6. | “C” cylinder, “D” tetrahedron, “X” solid | 8 weeks |
| 7. | “C” cylinder, “D” tetrahedron, “X” solid | 12 weeks |
| 8. | “C” cylinder, “D” tetrahedron, “X” solid | 12 weeks |
| 9. | “E” double pyramid, “F” Voronoi, “X” solid | 8 weeks |
| 10. | “E” double pyramid, “F” Voronoi, “X” solid | 8 weeks |
| 11. | “E” double pyramid, “F” Voronoi, “X” solid | 12 weeks |
| 12. | “E” double pyramid, “F” Voronoi, “X” solid | 12 weeks |
| Type of Lattice | Cube | Gyroid | Double Pyramid |
|---|---|---|---|
| Input image |  |  |  |
| Result image |  |  |  |
| ratio | 90.67% | 66.77% | 50.1% |
Disclaimer/Publisher’s Note: The statements, opinions and data contained in all publications are solely those of the individual author(s) and contributor(s) and not of MDPI and/or the editor(s). MDPI and/or the editor(s) disclaim responsibility for any injury to people or property resulting from any ideas, methods, instructions or products referred to in the content. |
© 2023 by the authors. Licensee MDPI, Basel, Switzerland. This article is an open access article distributed under the terms and conditions of the Creative Commons Attribution (CC BY) license (https://creativecommons.org/licenses/by/4.0/).
Share and Cite
Kovács, Á.É.; Csernátony, Z.; Csámer, L.; Méhes, G.; Szabó, D.; Veres, M.; Braun, M.; Harangi, B.; Serbán, N.; Zhang, L.; et al. Comparative Analysis of Bone Ingrowth in 3D-Printed Titanium Lattice Structures with Different Patterns. Materials 2023, 16, 3861. https://doi.org/10.3390/ma16103861
Kovács ÁÉ, Csernátony Z, Csámer L, Méhes G, Szabó D, Veres M, Braun M, Harangi B, Serbán N, Zhang L, et al. Comparative Analysis of Bone Ingrowth in 3D-Printed Titanium Lattice Structures with Different Patterns. Materials. 2023; 16(10):3861. https://doi.org/10.3390/ma16103861
Chicago/Turabian StyleKovács, Ágnes Éva, Zoltán Csernátony, Loránd Csámer, Gábor Méhes, Dániel Szabó, Mihály Veres, Mihály Braun, Balázs Harangi, Norbert Serbán, Lei Zhang, and et al. 2023. "Comparative Analysis of Bone Ingrowth in 3D-Printed Titanium Lattice Structures with Different Patterns" Materials 16, no. 10: 3861. https://doi.org/10.3390/ma16103861
APA StyleKovács, Á. É., Csernátony, Z., Csámer, L., Méhes, G., Szabó, D., Veres, M., Braun, M., Harangi, B., Serbán, N., Zhang, L., Falk, G., Soósné Horváth, H., & Manó, S. (2023). Comparative Analysis of Bone Ingrowth in 3D-Printed Titanium Lattice Structures with Different Patterns. Materials, 16(10), 3861. https://doi.org/10.3390/ma16103861