Article

Bacteria and Soil Enzymes Supporting the Valorization of Forested Soils

Department of Soil Science and Microbiology, University of Warmia and Mazury in Olsztyn, Plac Łódzki 3, 10-727 Olsztyn, Poland
*
Author to whom correspondence should be addressed.
Materials 2022, 15(9), 3287; https://doi.org/10.3390/ma15093287
Submission received: 23 March 2022 / Revised: 27 April 2022 / Accepted: 2 May 2022 / Published: 4 May 2022
(This article belongs to the Special Issue Feature Paper in Section Catalytic Materials)

Abstract

:
To decompose forest biomass, microorganisms use specific enzymes from the class of oxidoreductases and hydrolases, which are produced by bacteria and soil fungi. In post-agricultural forest soils, bacteria adapt more easily to changing ecological conditions than fungi. The unique features of bacteria, i.e., tolerance and the ability to degrade a wide range of chemical compounds, prompted us to conduct research that contributes to the improvement of the broadly understood circular management of biomass production and economic efficiency. This study aimed to analyze changes in the microbiological activity and the activities of dehydrogenases, catalase, β-glucosidase, urease, arylsulfatase, acid phosphatase, and alkaline phosphatase in the soil sampled from under Picea abies (Pa), Pinus sylvestris (Ps), Larix decidua (Ld), Quercus robur (Qr), and Betula pendula (Bp), after 19 years. The control object was unforested soil. The studies allowed one to demonstrate the relationship between the activity of soil enzymes and the assemblages of culturable microorganisms and bacteria determined by the metagenomic method and tree species. Thus, it is possible to design the selection of tree species catalyzing enzymatic processes in soil. The strongest growth promoter of microorganisms turned out to be Quercus robur L., followed by Picea abies L., whereas the weakest promoters appeared to be Pinus sylvestris L. and Larix decidua M.

1. Introduction

The exclusion of lands from agricultural production, and a change in soil management involving afforestation, has recently become a reversed trend of deforestation and land protection both in Europe and beyond [1,2]. The afforestation of weak soils prevents desertification, thereby minimizing the risk of soil erosion and contributing to the alleviation of climate changes [3]. A broad spectrum of the changes observed in the natural environment that are related to land use has recently spurred huge interest [1,4,5,6,7] as it affects the enzymatic and microbiological activity of soils [8,9]. Being the major element of the soil ecosystem, the soil microbiome is strongly related to the pedogenic processes responsible for soil formation. This aspect is often neglected and underestimated in research, while any modification in the composition of soil microorganisms affects organic matter degradation and the humification processes, and thus the accumulation of humus, which, thanks to its capacity to accumulate water as well as macro- and micro-nutrients, influences the contents of the nutrients available to plants [10]. Despite accounting for only a small part of the organic matter in the soil, microorganisms play a key role in its degradation and nutrient cycle [8].
According to Chao et al. [11], the concentration of CO2 in the air increases along with organic carbon degradation in the soil and plant biomass production. Potthoff et al. [12] found a higher content of CO2 in soils covered with vegetation than in black fallow soils. In turn, Wang et al. [10] claimed that drought is the factor that most significantly influences the carbon content of the soil because it reduces the absolute amount of carbon present in the soil, possibly due to a significant reduction in its photosynthetic fixation. Photosynthetic carbon is transferred to the soil via various routes, including by its allocation to mycorrhizal fungi [10]. The content of CO2 in the Earth’s atmosphere is growing rapidly and, according to many authors [13], it will increase in the future. In 2005–2010, the CO2 level increased by 3%, and in 2010–2020 by 6% (https://climate.nasa.gov/vital-signs/carbon-dioxide/, accessed on 21 February 2021) [14], while according to the Mouna Loa Observatory in Hawaii, its current level is at 0.0417% [14].
Soil plays a significant role in atmospheric CO2 sequestration. Carbon dioxide absorbs heat energy from the Earth’s surface, which causes the temperature to increase and climate changes to appear [13]. Forests are also capable of capturing and storing atmospheric CO2. The potentially important role of forest ecosystems in mitigating climate changes suggests a strong need for their more detailed research [15].
The research by Smal et al. [2] has shown that afforestation of post-agricultural soils allowed for their transformation into typical forest soils. However, it remains unknown whether the changes in soil properties, including changes in enzymatic activity, follow the same direction and steady pace, as well as how long it takes to develop the conditions characteristic for a stabilized forest ecosystem. According to Dhillion et al. [16], the amount of carbon pervading the soil in the form of CO2 is largely determined by the activity of microorganisms. Increased CO2 content stimulates organic matter degradation and leads to the regression or release of nutrients in the soil [17,18]. The microbial biomass of soil is an important ecological indicator of its fertility and quality [19,20]. Changes in the microbial populations in response to increased CO2 levels were observed by Drigo et al. [21]. They afflicted separate groups of opportunistic microorganisms closely related to plants. Changes in the number and diversity of microorganisms in the rhizosphere have been found to depend on the species of plants present; the stage of their development; the morphology of their root system; pH; and the composition of the released chemicals [22,23]. According to Uksa et al. [24], young plant roots stimulate microbial growth more actively due to the intense dynamics of the physiological and biochemical processes in their cells. In contrast, the roots of mature and aging plants release more complex carbon compounds and/or secondary metabolites, thereby enriching more specialized microbial communities [25,26]. The impact of plants on the communities of microorganisms is related to the activity of soil enzymes [27,28], which is difficult to interpret due to the lack of threshold values defined for various ecosystems [29,30]. Nevertheless, enzyme activities reflect the processes ongoing in the soil. Therefore, understanding soil enzyme responses to land-use changes is critical to soil health and to increasing its productivity [27,31]. According to Pandey et al. [32] and de Medeiros et al. [33], enzymatic activity is considered to be one of the most sensitive indicators of soil fertility and productivity, as well as of soil microorganism diversity. Our research hypothesized that the microbiological and enzymatic properties change depending on the type of land use/land cover and that the species composition of trees used for afforestation has a significant impact on the composition of the soil bacterial communities and the activity of enzymes involved in the carbon, nitrogen, phosphorus, and sulfur cycles. This hypothesis was verified in studies aimed to determine the diversity of bacteria at various taxonomic levels and the activities of dehydrogenases, catalase, β-glucosidase, urease, acid and alkaline phosphatase, and arylsulfatase in the soil afforested with Picea abies L., Pinus sylvestris L., Larix decidua M., Quercus robulaur L., and Betula pendula L.

2. Materials and Methods

2.1. Characteristics of the Study Area

The research was carried out in 2020 and aimed to analyze the microbiological and biochemical properties of the soil from the post-agricultural forest located in Narajty in the Pasym commune (53°36′00.8″ N 20°47′25.1″ E) of the Warmian–Masurian Voivodeship (Poland) (Figure 1).
According to the physico-geographical division, the study area is located in the Olsztyn Lakeland (842.81), which is part of the Masurian Lakeland (842.8), which is included in the East European Plain [34]. The landscape of the Olsztyn Lakeland was shaped as a result of the Pleistocene glaciation. The area has a warm temperate transition climate. The average annual air temperature in 2018 was +9.0 °C and was 1.1 °C higher than the average value for the twenty-year period of 1998–2018 [35]. The annual sum of precipitation reached 550 mm and was 16% lower than the average for the two decades (1998–2018).
The forest that was the subject of the research was established in 2006 on 4.87 ha of arable land with a grain size composition of loamy sand (Table S1). It was established using the following tree species: 15,900 seedlings of English oak (Quercus robur L.—Qr) planted on the area of 1.95 ha; 4500 seedlings of Norway spruce (Picea abies L.—Pa) planted on the area of 0.97 ha; 7700 seedlings of Scots pine (Pinus sylvestris L.—Ps) planted on the area of 0.97 ha; 700 seedlings of European larch (Larix decidua M.—Ld) planted on the area of 0.43 ha; and 2400 seedlings of warty birch (Betula pendula L.—Bp) planted on the area of 0.55 ha. The seedlings of Picea abies L., Pinus sylvestris L., and Larix decidua M. were planted between the oak seedlings. Each of these species was planted in three clumps. The area afforested with Quercus robur L., Picea abies L., Pinus sylvestris L., and Larix decidua M. was surrounded by Betula pendula L., which was planted in four rows around the plot. Three rectangular-shaped plots (20 m × 5 m) were marked out in the non-afforested area surrounding the forest and in the area that was afforested with the individual tree species, which gave 18 plots in total. From each plot, 20 single soil samples were collected from a depth of 0–20 cm and combined into 18 bulk samples (3 plots × 6 test objects). The individual soil samples were collected with an Egners Riehm’s staff.

2.2. Chemical and Physicochemical Analyses of Soil

For physicochemical analyses, the soil was dried at a temperature of 60 °C to the air-dry weight and sieved through a screen with a mesh diameter of 2 mm. The soil samples were determined for grain size composition, using a laser meter; organic carbon content, with the Tiurin method [36]; total nitrogen content, with the Kjeldahl method [37]; the contents of available phosphorus and potassium, with the Egner et al. [38] method; magnesium content, using atomic absorption spectrometry [39]; the contents of exchangeable K+, Ca2+, Mg2+, and Na+ cations, according to ISO 11,260 standard [40]; pH value, with the potentiometric method [41]; and hydrolytic acidity (HAC), the content of exchangeable base cations (EBC), and cation exchange capacity (CEC), according to Carter and Gregorich [42]. Chemical and physicochemical properties were determined with the following equipment: Malvern Mastersizer 2000 Laser Diffraction (Malvern, Worcestershire, UK), Spectrophotometer SQ118 (Merc, Darmstadt, Germany), Buchi B-324 distiller (Buchi, Flawil, Switzerland), Jenway 6705 UV/VIS spectrophotometer (Jenway LTD, Staffordshire, UK), Jenway PFP 7 flame photometer (Jenway LTD, Staffordshire, UK), and atomic absorption spectrophotometer GBC 932AA (GBC Scientific Equipment, Braeside, Australia). The results of these determinations are presented in Tables S2 and S3.

2.3. Microbiological and Enzymatic Analyses of Soil

The serial dilution method was employed to determine counts of copiotrophic bacteria (Cop), actinobacteria (Act), and fungi (Fun) in the soil samples, using culture media characterized in the work by [29]. The Cop, Act, and Fun colonies were used to determine the colony development index (CD) and the ecophysiological diversity index (EP) of these microorganisms. The number of colony-forming units (cfu) was established using a colony counter. Microbial counts determined for 10 subsequent days were used to compute the colony development index (CD) and the ecophysiological diversity index (EP) of microorganisms, according to De Leij et al. [43] based on the following formulas:
CD = [N1/1 + N2/2 + N3/3… N10/10] · 100
where N1, N2, N3, …, N10 are the sum of ratios of the number of colonies of microorganisms identified in particular days (1, 2, 3, …, 10) to the total number of colonies identified throughout the study period, and
EP = −Σ(pi·log10 pi)
where pi represents the ratio of the number of colonies of microorganisms identified in particular days to the total number of colonies identified throughout the study period.
The colony development index (CD) indicates the rate of succession of microorganisms in the environment, while the ecophysiological diversity index (EP) of microorganisms indicates the ecophysiological diversity of microorganisms determined by changing environmental conditions. The detailed procedures used to determine counts of microorganisms and calculate values of CD and EP indices were described in our previous work [44].
Furthermore, DNA was isolated from soil samples using the Genomic Mini AX Bacteria+ kit (A&A Biotechnology). The 1055F (5′-ATGGCTGTCGTCAGCT-3′) and 1392R (5′-ACGGGCGGTGTGTAC-3′) primers were used in the PCR reaction mixture, whereas the 341F and 785R primers were used for the amplification of the hypervariable V3-V4 region of the 16S rRNA gene. New-generation sequencing was conducted on the Ilummina MiSeq v2 platform (Illumina Inc., San Diego, CA, USA) in the paired-end (PE) technology, 2 × 250 pz. The bioinformatic analysis was carried out using QIIME packages based on reference databases of sequences GreenGenes v13_8 (Genomed S.A., Warsaw, Poland). Sequencing data have been deposited with GenBank NCBI https://www.ncbi.nlm.nih.gov/ (accessed on 21 February 2021) under accession numbers MW601841-MW601938. The resulting sequences were grouped into operational taxonomic units (OTU), which were employed to determine the diversity of bacteria using the Shannon–Wiener index (H’) [45]. The exact procedure of the metagenomic analyses was provided in our earlier work [43]. The accuracy of the taxonomic classification of bacteria varied. On average, regardless of the study object, 100% of the OTU were classified to the phylum, 99% to the class, 90% to the order, 63% to the family, and barely 23% to the genus (Figure 2).
The soil samples were also analyzed for enzymatic activity, including the activities of dehydrogenases, according to Öhlinger [46]; catalase, according to Johnson and Temple [47]; and urease, acid phosphatase, alkaline phosphatase, β-glucosidase, and arylsulfatase, according to Alef and Nannpieri [48]. The activity of dehydrogenases was expressed in the mMol triphenyl formazan (TFF); that of catalase in Mol O2; that of urease in mMol N-NH4+; and those of acid phosphatase, alkaline phosphatase, β-glucosidase, and arylsulfatase in mMol 4-nitrophenol (PN) per 1 kg of soil dry matter per 1 h.

2.4. Statistical Analysis

The statistical analysis of results was carried out using the Statistica 13.3 package TIBCO Software Inc. [49]. The normality of distribution was checked with the Shapiro–Wilk test [50] and the Kruskal–Wallis test [51]. The results featuring normal distribution were then analyzed with the Duncan post-hoc test, whereas those not featuring normal distribution were compared using the Dunn post-hoc test in Bonferroni’s modification.
The counts of microorganisms and the activities of soil enzymes were verified in the principal component analysis (PCA). Additional computations were made for the index of a tree stand effect (IFT) on the microbiological and enzymatic properties of the soil:
IF T = A T A 0 1
where
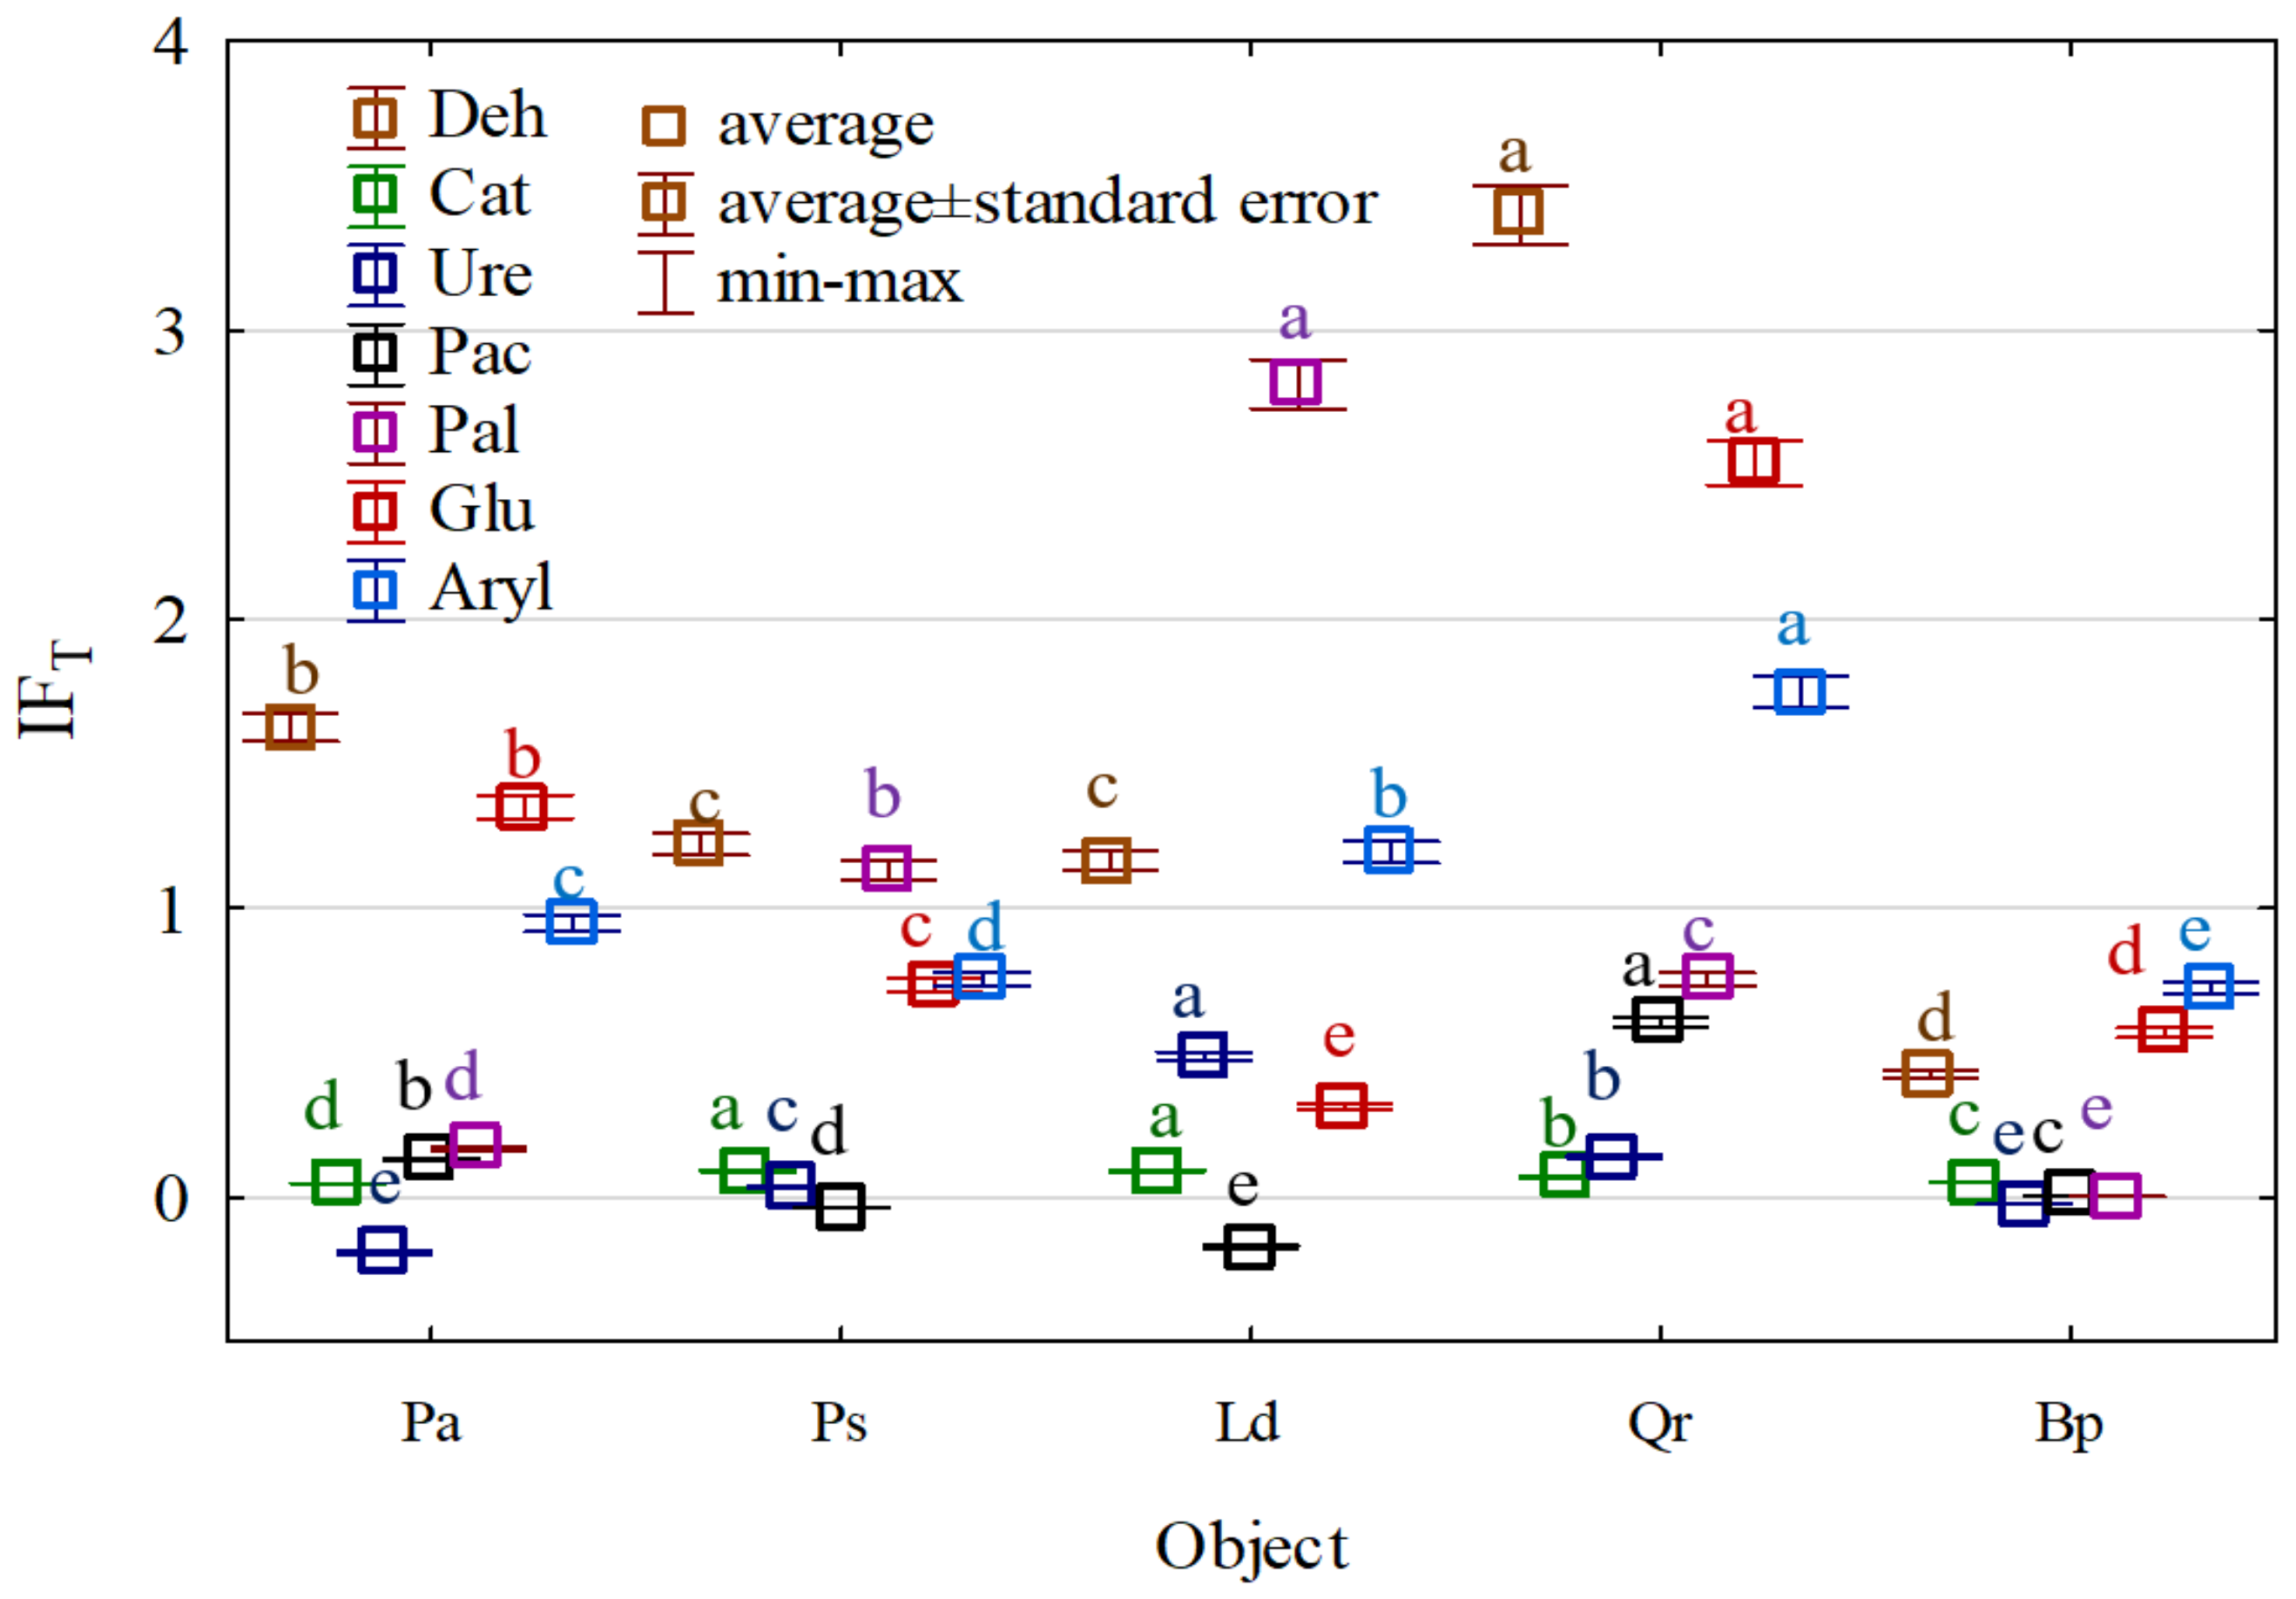
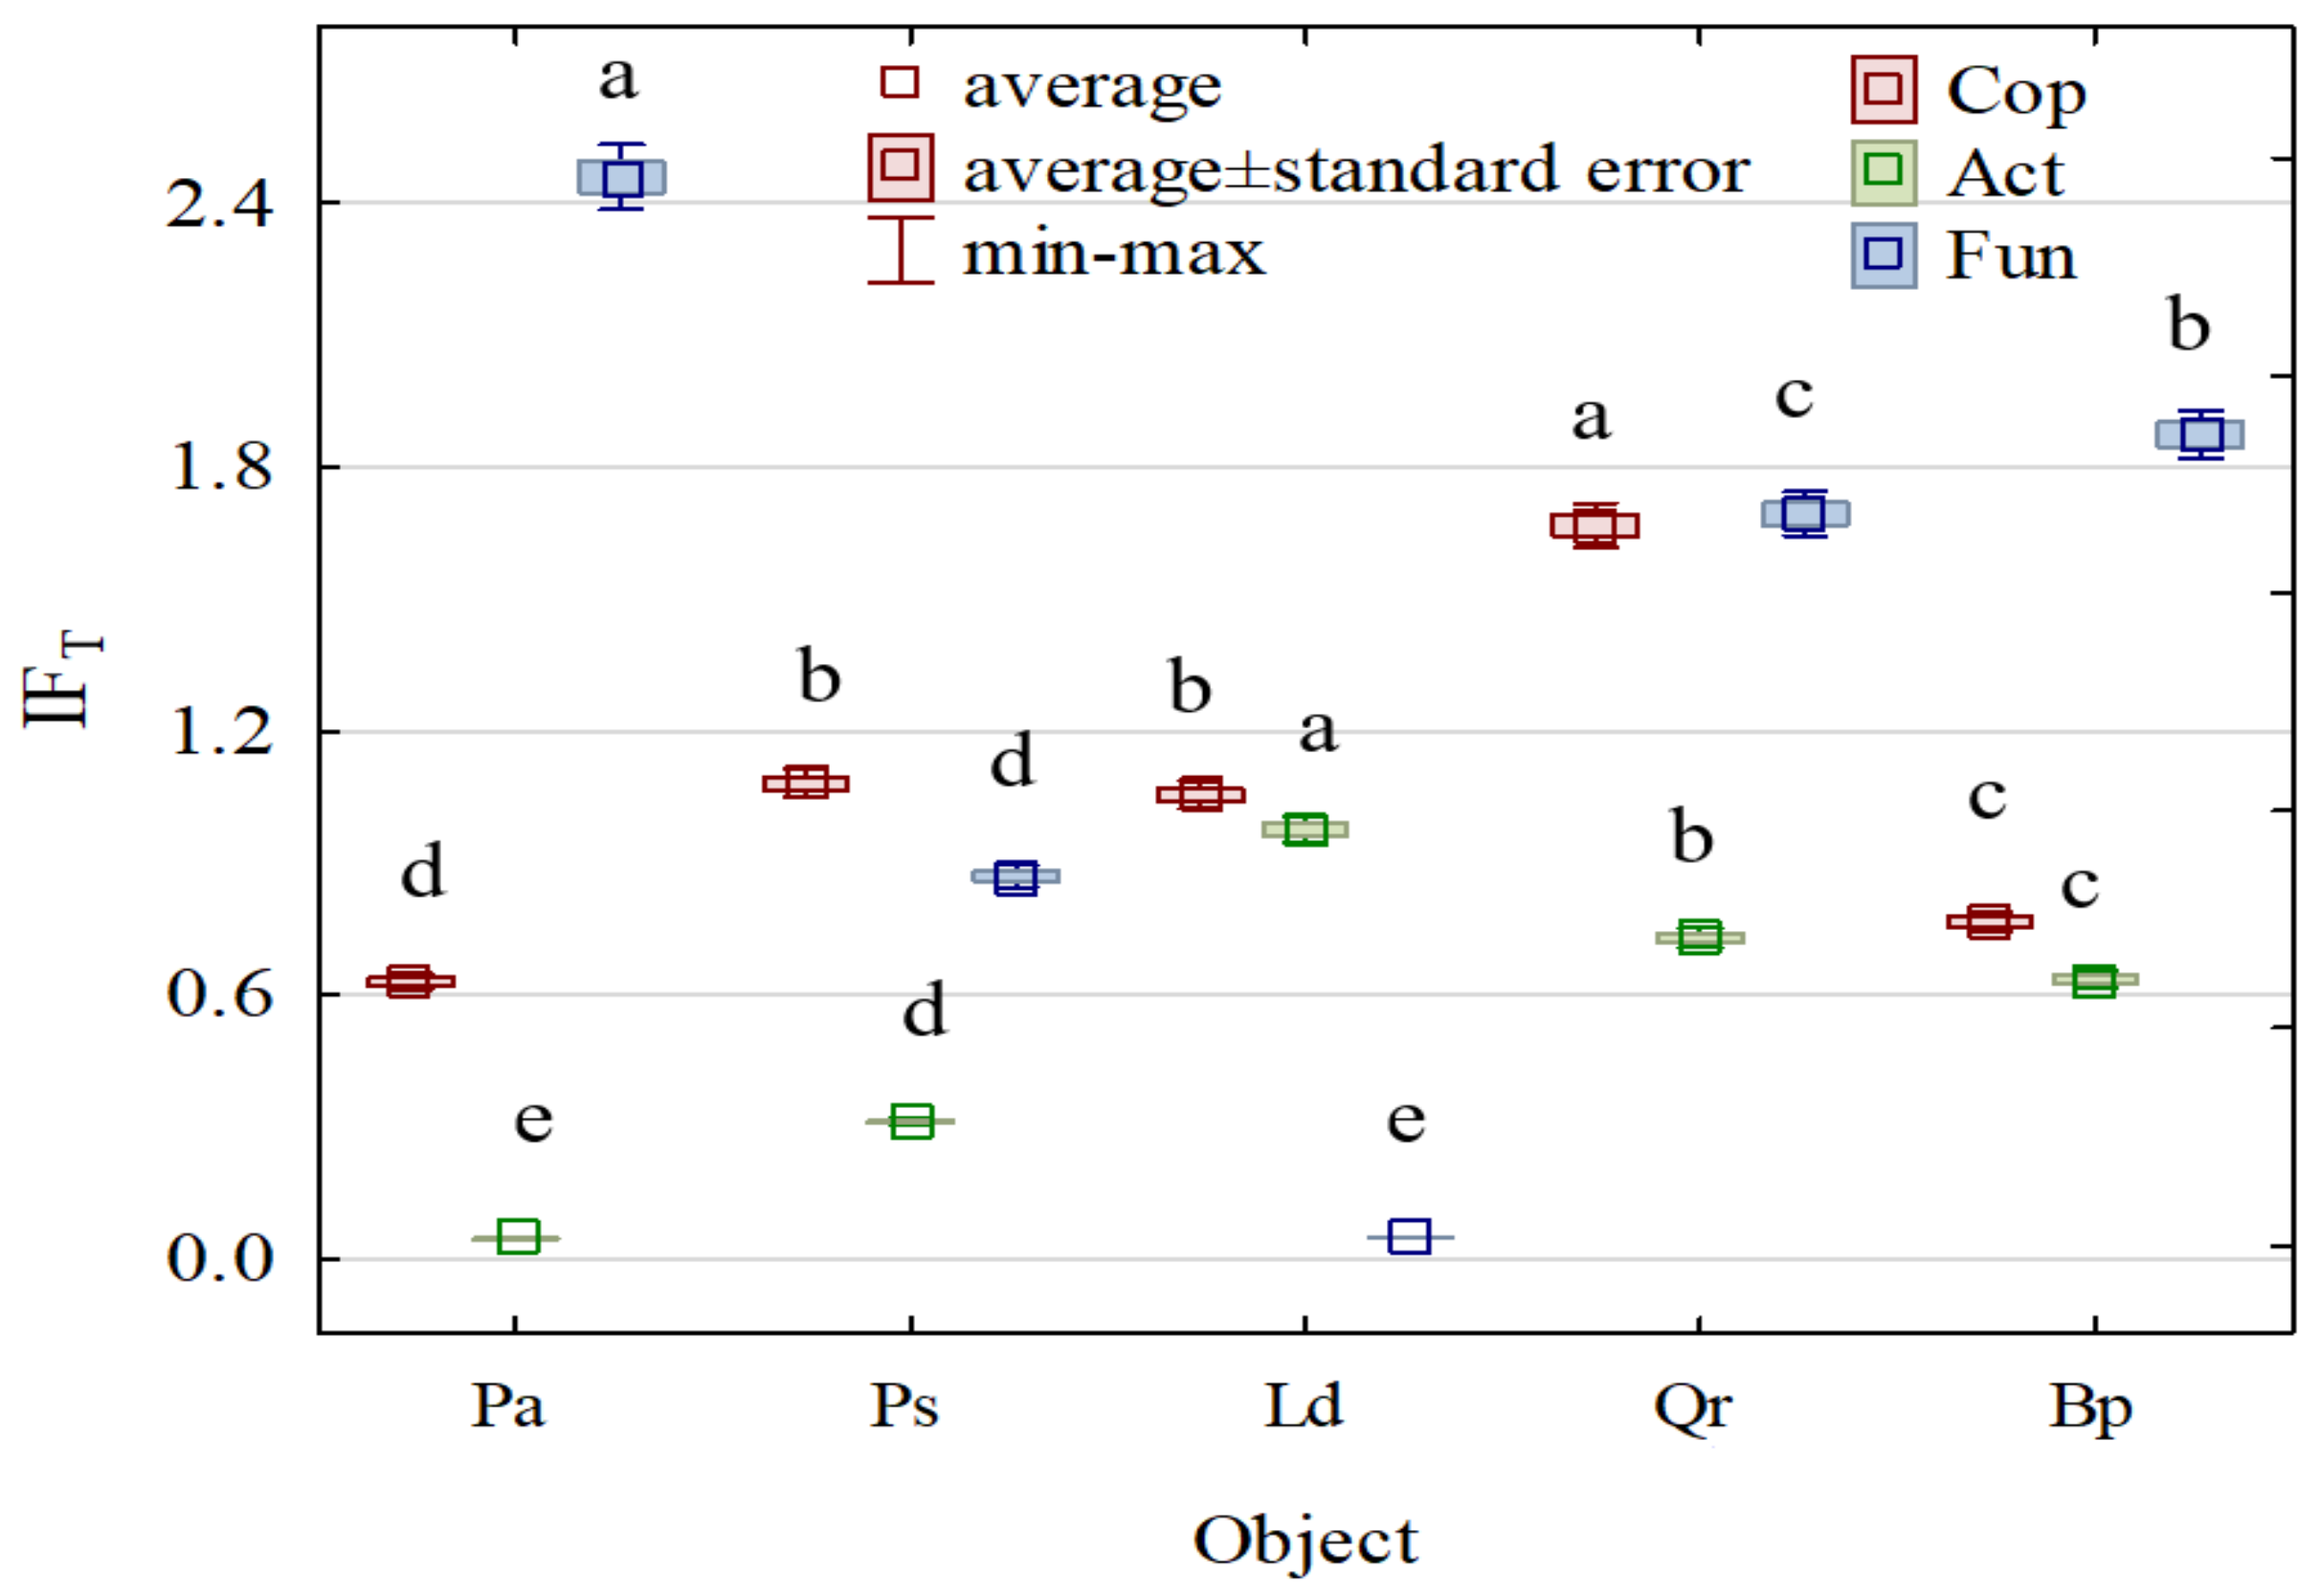
  • IFT—the index of a tree stand effect;
  • AT—the count of microorganisms/the activity of enzymes in the soil from the afforested area;
  • A0—the count of microorganisms/the activity of enzymes in the soil from the non-afforested area.
A negative value of IFT indicates an adverse effect, IFT = 0 indicates no effect, and a positive value of IFT indicates a positive effect, of afforestation.
The metagenomic data obtained were presented graphically using the STAMP 2.1.3. software [52]. Data in the circular arrangement were analyzed using the Circos 0.68 package [53], where the presented OTU values are directly proportional to the width of each band linking bacterial taxa with the characterized object. Different colors are assigned to each bacterial family. The external ring represents the total percentage of 16S sequences, whereas the internal ring represents the number of 16S amplicon sequences assigned to a given taxon. A heat map characterizing bacterial genera was plotted using the RStudio v1.2.5033 software (RStudio 2019), the R v3.6.2 system (R Core 2019), and the gplots library [54]. The Venn diagram was plotted using a tool for the analysis of sets [55]. All graphical data are presented after eliminating OTU smaller than 1% of the total OTU number.

3. Results

Soil afforestation with various tree species had a positive effect on the proliferation of soil microorganisms (Figure 3), although it obviously limited the counts of microorganisms to a different extent. Nevertheless, regardless of tree species, the strongest tree stand’s effect was noted on the number of fungi, followed by the number of copiotrophic bacteria, whereas the weakest one was noted on the number of actinobacteria. The individual tree species caused the most significant differences in the population of soil fungi. Picea abies L. caused the greatest increase in their number (IFT = 2.460), followed by Betula pendula L. (IFT = 1.875) and Quercus robur L. (IFT = 1.694), whereas Larix decidua M. caused the smallest increase in their population (IFT = 0.049). In contrast to fungi, the weakest effect of afforestation on copiotrophic bacteria and actinobacteria was attributable to Picea abies L. (IFT = 0.630 and IFT = 0.046, respectively). The most intensive proliferation of copiotrophic bacteria was observed in the soil sampled from the areas afforested with Quercus robur L. (IFT = 1.668), Pinus sylvestris L. (IFT = 1.081), and Larix decidua M. (1.055), whereas that of actinobacteria was observed in the soil sampled from the areas afforested with Larix decidua M. (IFT = 0.977), Quercus robur L. (IFT = 0.730), and Betula pendula L. (IFT = 0.635).
The afforestation caused less significant changes in the colony development index (CD) values than in the counts of the microorganisms (Figure 4). European oak triggered the most significant changes in the CD values of copiotrophic bacteria and actinobacteria, whereas Picea abies L. did so in the CD value of fungi. These CD values were significantly lower than the respective CD values obtained for the soil sampled from the non-afforested area, indicating that these tree species modified the structure of copiotrophic bacteria, actinobacteria, and fungi from the k strategists to the R strategists.
Not all tree species had the same effect on the ecophysiological diversity index (EP) of the microorganisms tested (Figure 5). The highest EP values of copiotrophic bacteria and fungi were noted in the soil afforested with Picea abies L. (EP = 0.839 and EP = 0.772, respectively). In the case of actinobacteria, the highest EP values were caused by soil afforestation with Pinus sylvestris L. (EP = 0.810), Larix decidua M. (EP = 0.819), and Quercus robur L. (EP = 0.820), whereas the lowest ones were caused by soil planting with Picea abies L. (EP = 0.663).
The OTU number of bacteria in the soil depended on tree species used for afforestation. It ranged from 50,705 OTU in the soil afforested with Betula pendula L. to 76,682 OTU in the soil afforested with Larix decidua M. Picea abies L. and Pinus sylvestris L. caused minor changes in the relative OTU number, whereas Larix decidua M. increased it by 21%, while Quercus robur L. and Betula pendula L. decreased it by 13% and 21%, respectively, compared to the relative OTU number determined in the control soil. The predominant phylum in the control soil and in all soils from the afforested areas, except for the area planted with Betula pendula L., turned out to be Actinobacteria (Figure 6). Their contribution to the OTU structure ranged from 31.8% in the control soil to 46.1% in the soil afforested with Pinus sylvestris L. In the soils afforested with Picea abies L., Larix decidua M., and Quercus robur L., it accounted for 37.2%, 42.7%, and 40.3%, respectively. The greatest contribution of Proteobacteria (39.4%) and a significantly lower one of Actinobacteria (23.8%) were found only in the soil afforested with Betula pendula L. In the remaining plots, Proteobacteria ranked second after Actinobacteria; however, the relative OTU number of this phylum was less diversified among the plots and ranged from 23.8% in the soil afforested with Pinus sylvestris L. to 30.8% in the control soil and soil afforested with Quercus robur L.
On average, regardless of the plot, the highest numbers of OTU were assigned to the Gaiellaceae, Bradyrhizobiaceae, Rhodospirillaceae, Hyphomicrobiaceae, and Nocardioidaceae families (Figure 7). Nevertheless, the tree stands modified the family structure. Thus, the Gaiellaceae, Bradyrhizobiaceae, and Ktedonobacteraceae families prevailed in the soil afforested with Picea abies L.; the Gaiellaceae, Nocardioidaceae, and Hyphomicrobiaceae families, in the soil planted with Pinus sylvestris L.; the Gaiellaceae, Nocardioidaceae, and Hyphomicrobiaceae families, in the soil afforested with Larix decidua M.; the Gaiellaceae, Nocardioidaceae, and Rhodospirillaceae families, in the soil afforested with Quercus robur L.; and the Burkholderiaceae, Rhodospirillaceae, and Gaiellaceae families, in the soil planted with Betula pendula L.
All tree species significantly decreased the number of OTU assigned to the Koribacteraceae, Sinobacteraceae, Conexibacteraceae, Solibacteraceae, Gemmataceae, and Acetobacteraceae families, whereas they increased the number of OTU classified to the Bradyrhizobiaceae, Burkholderiaceae, and Mycobacteriaceae families. Among all tree stands, Picea abies L. definitely had the strongest effect on the abundance of OTU from the family Bradyrhizobiaceae (an increase by 7.5% compared to the control soil). In turn, Pinus sylvestris L. (increase by 6.5%), Larix decidua M. (increase by 1.5%), and Quercus robur L. (increase by 6.2%) had the strongest impact on Nocardioidaceae OTU abundance, whereas Betula pendula L. did on Burkholderiaceae OTU abundance (increase by 13.2%). Six bacterial genera, i.e., Kribbella and Nocardioides (f_Nocardioidaceae), Iamia (f_Iamiaceae), Mycobacterium (f_Mycobacteriaceae), Pseudonocardia (f_Pseudonocardiaceae), and Streptomyces (f_Streptomycetaceae), were classified in the phylum Actinobacteria; four genera, including Kaistobacter and Sphingomonas (f_Sphingomonadaceae), Burkholderia (f_Burkholderiaceae), and Rhodoplanes (f_Hyphomicrobiaceae), were classified in the phylum Proteobacteria; whereas DA101 genus (f_Chthoniobacteraceae) was classified in the phylum Verrucomicrobia and Bacillus genus (f_Bacillaceae) in the phylum Firmicutes (Figure 8). Regardless of the plot, Rhodoplanes (16,0%) made the greatest contribution to the genus structure, followed by Mycobacterium (14.0%), Burkholderia (13.4%), and DA101 (12.8%). The contribution of the other identified genera was below 10.0% and ranged from 2.6% for Iamia to 8.7% for Kaistobacter.
Regardless of the bacterial genus, the afforestation of arable soil contributed to an increase in the OTU number. Compared to the control soil, the OTU number increased 1.37-fold in the soil afforested with Pinus sylvestris L., 1.35-fold in the soil planted with Larix decidua M., 0.54-fold in the soil afforested with Picea abies L., 0.35-fold in the soil afforested with Quercus robur L., and 0.25-fold in that afforested with Betula pendula L. All tree species increased the OTU numbers of the Sphingomonas and Mycobacterium genera, though to a different extent. Larix decidua M., Pinus sylvestris L., Quercus robur L., and Picea abies L. caused a 63.23-fold, 60.15-fold, 13.00-fold, and 9.69-fold increase in OTU number of the genus Kribbella. This bacterial genus revealed the strongest response to the afforestation. It was followed by the genus Sphingomonas, and then by the Iamia, Mycobacterium, Nocardioides, Streptomyces, and Burkholderia genera.
Considering the above data, it may be concluded that the greatest diversity of bacteria at the class and order level occurred in non-afforested soil and from Betula pendula L.; at the family level, in soil near Quercus robur L.; and at the level of the genus, in Pinus sylvestris L. and Larix decidua M. (Table 1). Bacillus was the most typical of the soil afforested with Picea abies L.; the genus Pseudonocardia, of the soil planted with Pinus sylvestris L.; the Sphingomonas and Iamia genera, of the soil sampled from the Larix decidua M. stand; and the genus Burkholderia, of the soil afforested with Betula pendula L. (Figure 9).
The enzymatic activity of the soil sampled from all tree stands was highly diversified (Figure 10 and Table S4). All tree species stimulated the activities of dehydrogenases, β-glucosidase, and arylsulfatase. In turn, they had the weakest stimulating effect on the activities of catalase, urease, and acid phosphatase. The activity of alkaline phosphatase was positively affected by all tree species, except for Betula pendula L. Despite various fluctuations, data presented in Figure 8 indicate that Quercus robur L. and Larix decidua M. were the strongest promoters of the soil’s enzymatic activity, whereas Betula pendula L. was the poorest one.

4. Discussion

Interactions between vegetation, soil conditions, and climate strongly influence soil microorganisms [8,22,23,26,56]. In the present research, soil afforestation with various tree species promoted the multiplication of these microorganisms. Excluding lands from agricultural production and the afforestation of soils with Picea abies L., Pinus sylvestris L., Larix decidua M., and Quercus robur L. i Betula pendula L. reduced the number of microorganisms to a varying degree; however, regardless of the planting type, the highest indices of forest stand influence were noted on the numbers of fungi, bacteria, and actinomycetes after soil afforestation with Picea abies L. According to Błońska [57], tree species affect soil pH and modify the conditions of organic matter degradation. The high Cmic:Corg ratio in the soil [58] is indicative of the environment promoting the development of microorganisms. A year-long study by Walkiewicz et al. [15] has shown the highest Cmic:Corg ratio in younger stands of coniferous and mixed forests, which is confirmed by our research wherein 19-year-old stands offered favorable conditions for the development of microorganisms. Plantings of common oak, Larix decidua M., and Betula pendula L. promoted the development of copiotrophic bacteria and actinomycetes. Thus, it can be assumed that a higher Cmic:Corg ratio is typical of deciduous forests, which is consistent with the results of a study by Stolnikova et al. [59]. Moreover, the highest values of the ecophysiological diversity index (EP) determined for copiotrophic bacteria and fungi were found in the soil under the Picea abies L. plantings, while those for actinomycetes were found in the soil under the Pinus sylvestris L. plantings. The colony development index (CD) tested in the common oak stand had a weaker effect on the development of colonies of copiotrophic bacteria and actinomycetes, whereas CD determined in the Picea abies L. stand had a weaker effect on the development of fungi. Thus, the present study has shown that the structure of cultured copiotrophic bacteria, actinomycetes, and fungi changed under the influence of tree species composition. This change can be noticed in the proportion of k strategists to R strategists. The R strategy microorganisms are adapted to maximize the population growth rate, while those with the K strategy show a slow growth rate and are in turn adapted to maximize their competitive ability. The rapid development of microorganisms and the cooperation with soil fauna, deemed favorable due to the availability of nutrients, affects the degradation rate of plant litter and dead wood, with the latter representing a significant reservoir of carbon in forest systems [60]. Therefore, the specific responses of the microorganisms are probably due to the differences in carbon supply. According to Lu and Scheu [61] and Fanin et al. [62], the Gram+ bacteria are better at managing persistent carbon resources, while the Gram- ones are associated with slower growth rates. Coniferous forests with a low availability of labile carbon promote the development of oligotrophic microorganisms. These, in turn, are characterized by a low respiration rate and reduced biomass in the near-surface rhizosphere [61,62,63].
Due to the content of nutrients in the plant litter and plant root secretions, forest soils can modify the diversity of soil microorganisms and affect their survivability [26,56,64]. The differences in the structure of the communities colonizing the examined non-afforested soil Picea abies L., Pinus sylvestris L., Larix decidua M., and Quercus robur L. i Betula pendula L., and afforested soils, in our research were strongly related to the species composition of the stand, as evidenced by the OTU number of bacteria, which varied widely from 50,705 OTU in the soil from under the Betula pendula L. to 76,682 OTU in the soil from under the Larix decidua M. According to Ganault et al. [65], deciduous trees are more susceptible to microbial degradation than conifers. Mono-species coniferous stands are often considered to be microhabitats with a low concentration of nutrients or a high content of polyphenols or lignins in the environment [66]. The changes in the structure and diversity are influenced by the properties of the soil, the macrofauna communities, or tree crowns, which by modulating the availability of light have a significant impact on the condition of the ground cover and understory vegetation [56,64,65,66,67].
In turn, according to Norman and Barrett [68] and Baćmaga et al. [64], it is the pH that plays a major role in determining the structure of microbial communities in forest ecosystem soils. In the presented research, it significantly influenced the predominance of the bacterial phyla in the studied soils. Actinobacteria were found to be the major phylum in the non-afforested soil and in the soil under all trees, except for birch. They are associated with acidic, nutrient-poor, and often water-saturated (i.e., anaerobic) soils [56,69] and include aerophilic [70] and oligotrophic [71] groups. According to Shen et al. [72], acidic soils are usually richer in Actinobacteria, while soils with higher pH are mainly colonized by Acidobacteria [73] and Proteobacteria [72,74,75].
Our previous study addressing the changes in the composition of microbial communities of fresh coniferous forest, fresh mixed coniferous forest, fresh mixed forest, and moist mixed forest has shown that, apart from Acidobacteria, a high number of Alphaproteobacteria OTU were also determined in the soil despite its low pH (2.63–3.73). This suggests that the diversity of bacterial communities is not solely determined by soil pH but also by other environmental factors [56,66,76]. Furthermore, a fairly large number of Proteobacteria classes Proteobacteria (α-Proteobacteria, β-Proteobacteria, γ-Proteobacteria, and δ-Proteobacteria) may prefer different growth environments. In our research, the tree stand modified the structure of families. In the case of the soil from under the Picea abies L., the dominant families were Gaiellaceae phylum Actinobacteria, Bradyrhizobiaceae phylum Firmicutes, and Ktedonobacteraceae phylum Chloroflexi. Navarrete et al. [77] and Zhelezova et al. [78] have shown Ktedonobacteraceae (negatively correlated with organic matter content) to be the dominant family of bacteria in sandy soils. Rughöft et al. [79] identified this family of bacteria in savannah soils in the Kruger National Park in South Africa, while Li et al. [80] identified it in soils contaminated with copper. In the present research, the prevailing bacteria in the soil under Pinus sylvestris L. and Larix decidua M. were those of the Gaiellaceae, Nocardioidaceae, and Hyphomicrobiaceae families; in the soil under the oak, those from the Gaiellaceae, Nocardioidaceae, and Rhodospirillaceae families; and in the soils under the Betula pendula L., those from the Burkholderiaceae, Rhodospirillaceae, and Gaiellaceae families. Of the 12 genera classified into the phylum Actinobacteria, Proteobacteria, Verrucomicrobia, and Firmicutes, the Rhodoplanes had the largest share in the genus structure, followed by Mycobacterium, Burkholderia, and DA101. Moreover, all tree species increased the OTU number of the Sphingomonas and Mycobacterium genera, although to a different extent. Larix decidua M., Pinus sylvestris L., Quercus robur L., and Picea abies L. also increased the OTU number of the Kribbella genus. The bacteria of the genus Rhodoplanes and Burkholderia also dominated the bacterial community in the pine forest soils of the Manowo Forest District in northern Poland [81] and in the humid tropical forests of Costa Rica [82]. The genus Rhodoplanes was additionally found to prevail in the soils of the cleared forest in Indonesia [83] and, in our earlier research, in the forests of north-eastern Poland [57]. Moreover, Eaton et al. [82] have drawn attention to the bacteria of the Solibacter, Comomonas, Azospirillum, Geobacter, and Bradyrhizobium genera, whereas Lasota e al. [81] have drawn attention to those of the Skermanella, Tsukamurella, Candidatus Solibacter, and Streptomyces genera. When investigating forest and grass soils of Schwäbische Alb (Germany), Nacke et al. [84] pinpointed Mycobacterium as the most abundant genus of bacteria present in all soil samples and also highlighted Amaricoccus and Methylocapsa occurring in the soils of beech and spruce stands. In turn, Liu et al. [85] found that the soils of the deciduous and coniferous forests and meadows of the Songshan forest reserve in Yanqing (Beijing, China) were most abundant in the DA101 genus bacteria. Analyzing the results cited in the above literature [30,74,81,82,83,84] and the results of our study, it can be concluded that although the composition of bacterial communities in soils and their diversity vary, certain bacterial genera occur in most forest ecosystems, while others constitute the core microbiome of individual habitats. Thus, we have shown that the genus Bacillus is most characteristic for the spruce stand; Sphingomonas and Iamia, for the larch stand; and Burkholderia, for the birch stand. The diversity of bacteria in the soil from under different stands is due to their ecological adaptation to the prevailing habitat conditions.
As sensitive indicators of soil quality changes, the soil enzymes provide valuable information about the condition of the soil environment [2,31,32,33,43,81,86,87,88]. They mediate key soil processes and functions, such as organic matter degradation and nutrient cycle. The enhanced potential enzymatic activity in forest soils and their plant litter is attributed to extracellular enzymes that play important roles in biogeochemical cycles, catalyzing reactions related to organic matter degradation [89]. The activity of extracellular enzymes in litter degradation is mainly regulated by soil microorganisms supplying energy and nutrients for plant growth [90]. Our results confirmed both the higher number of microorganisms and the high activity of soil enzymes responsible for the C, N, and P cycle in the soil. According to the substrate stimulation model, the activity of soil enzymes responsible for the C cycle can be stimulated when the contents of their substrates (glucosides, disaccharides, and cellobioses) increase due to cellulose and hemicellulose degradation [89]. Microorganisms that are easily available and digestible by glucose may increase the content of β-1,4-glucosidase [90]. Our research results showed that all plantings stimulated activities of β-glucosidase and dehydrogenases. Being unable to accumulate in the extracellular environment [91], soil dehydrogenases can use both oxygen molecules as electron and proton acceptors and other compounds that occur in the cells of anaerobic microorganisms [92]. The activity of dehydrogenases is indicative of the presence of viable microbial cells [93,94]. In the present study, their high activity confirmed the high number of microorganisms in the soil from under all tree plantings. The enzymatic activity of the afforested soil was significantly higher than that of the non-afforested control soil. This is confirmed by the data on the positive impact of plant species on the soil microbiome [61,63,88,95] and the activity of enzymes [8,58,96,97] since the biochemical properties of soil are a derivative of plant species diversity and soil microbiome diversity [98,99,100].

5. Conclusions

The afforestation of post-arable soil with Picea abies L., Pinus sylvestris L., Larix decidua M., Quercus robur L., and Betula pendula L. had a beneficial, though varied, effect on the proliferation of soil microorganisms. Their strongest stimulating impact was observed on fungi and copiotrophic bacteria and a slightly lesser one on actinobacteria. The strongest growth promoter of microorganisms turned out to be Quercus robur L., followed by Picea abies L., whereas the weakest promoters appeared to be Pinus sylvestris L. and Larix decidua M. The soil sampled from the area afforested with Quercus robur L. also exhibited the highest enzymatic activity.
Post-arable soil afforestation modified the taxonomic structure; however, some regularities could be observed regardless of the effects of individual tree species. For instance, the OTU number of the Sinobacteraceae family bacteria decreased in all soil samples from the afforested areas. Furthermore, Picea abies, Pinus sylvestris, and Quercus robur L. increased the abundance of Bradyrhizobiaceae, whereas Quercus robur L., Larix decidua M., and Pinus sylvestris L. decreased the abundance of Nocardioidaceae.
The genus Bacillus turned out to be the most typical genus found in the soil from the area afforested with Picea abies L., whereas Pseudonocardia did in that area afforested with Pinus sylvestris L.; Iamia did in that afforested with Larix decidua M.; and Burkholderia did in that afforested with Betula pendula L. The core genus prevailing in the soil samples from the plots afforested with the three species tested turned out to be Rhodoplanes.

Supplementary Materials

The following supporting information can be downloaded at: https://www.mdpi.com/article/10.3390/ma15093287/s1, Table S1: the granulometric composition of soils; Table S2: the physicochemical properties of soils; Table S3: the characteristics of soil; and Table S4: the enzymatic activity in soil, kg−1 DM of soil h−1.

Author Contributions

A.B. and J.W. conceived and designed the ideas and wrote the manuscript with the help of J.K.; A.B. carried out the bioinformatic analysis and visualization of the data, conducted the experiments, and collected and analyzed the data with the help of J.W. and J.K.; all authors contributed to the final version of this manuscript. All authors have read and agreed to the published version of the manuscript.

Funding

This research was funded by the University of Warmia and Mazury in Olsztyn, Faculty of Agriculture and Forestry, Department of Soil Science and Microbiology (grant No. 30.610.006-110), and the project was financially supported by the Minister of Education and Science in the range of the program entitled “Regional Initiative of Excellence” for the years 2019–2022, Project No. 010/RID/2018/19, amount of funding 12.000.000 PLN.

Institutional Review Board Statement

Not applicable.

Informed Consent Statement

Not applicable.

Data Availability Statement

Sequencing data have been deposited with GenBank NCBI. They are available online: https://www.ncbi.nlm.nih.gov/nuccore/?term=MW601841:MW601938[accn] (accessed on 21 February 2021) under accession numbers MW601841–MW601938.

Acknowledgments

The authors thank Miroslaw Kucharski for bioinformatics consultation.

Conflicts of Interest

The authors declare no conflict of interest. The funders had no role in the design of the study; in the collection, analyses, interpretation of data; in the writing of the manuscript; or in the decision to publish the results.

References

  1. Cukor, J.; Vacek, Z.; Vacek, S.; Linda, R.; Podrázský, V. Biomass productivity, forest stability, carbon balance, and soil transformation of agricultural land afforestation: A case study of suitability of native tree species in the submontane zone in Czechia. CATENA 2022, 210, 105893. [Google Scholar] [CrossRef]
  2. Smal, H.; Olszewska, M.; Ligęza, S.; Urban, D. The effect of afforestation of post-arable soils with scots pine (Pinus sylvestris L.) on their enzymatic activity. Acta Agrophysica 2017, 24, 509–521. [Google Scholar]
  3. Mohan, M.; Richardson, G.; Gopan, G.; Aghai, M.M.; Bajaj, S.; Galgamuwa, G.A.P.; Vastaranta, M.; Arachchige, P.S.P.; Amorós, L.; Corte, A.P.D.; et al. UAV-supported forest regeneration: Current trends, challenges and implications. Remote Sens. 2021, 13, 2596. [Google Scholar] [CrossRef]
  4. Goenster, S.; Gründler, C.; Buerkert, A.; Joergensen, R.G. Soil microbial indicators across land use types in the river oasis Bulgan sum center, Western Mongolia. Ecol. Indic. 2017, 76, 111–118. [Google Scholar] [CrossRef]
  5. Lacerda-Júnior, G.V.; Noronha, M.F.; Cabral, L.; Delforno, T.P.; de Sousa, S.T.P.; Fernandes-Júnior, P.I.; Melo, I.S.; Oliveira, V.M. Land use and seasonal effects on the soil microbiome of a Brazilian dry forest. Front. Microbiol. 2019, 10, 648. [Google Scholar] [CrossRef] [Green Version]
  6. Sousa, F.P.; Ferreira, T.; Mendonça, E.; Romero, R.E.; Oliveira, J. Carbon and nitrogen in degraded Brazilian semi-arid soils undergoing desertification. Agric. Ecosyst. Environ. 2012, 148, 11–21. [Google Scholar] [CrossRef]
  7. Thapa, V.R.; Ghimire, R.; Mikha, M.M.; Idowu, O.J.; Marsalis, M.A. Land use effects on soil health in semiarid drylands. Agric. Environ. Lett. 2018, 3, 180022. [Google Scholar] [CrossRef]
  8. Meena, A.; Rao, K.S. Assessment of soil microbial and enzyme activity in the rhizosphere zone under different land use/cover of a semiarid region, India. Ecol. Process. 2021, 10, 16. [Google Scholar] [CrossRef]
  9. Zhao, D.; Li, F.; Yang, Q.; Wang, R.; Song, Y.; Tao, Y. The influence of different types of urban land use on soil microbial biomass and functional diversity in Beijing, China. Soil Use Manag. 2013, 29, 230–239. [Google Scholar] [CrossRef]
  10. Wang, R.; Cavagnaro, T.R.; Jiang, Y.; Keitel, C.; Dijkstra, F.A. Carbon allocation to the rhizosphere is affected by drought and nitrogen addition. J. Ecol. 2021, 109, 3699–3709. [Google Scholar] [CrossRef]
  11. Chao, L.; Liu, Y.; Zhang, W.; Wang, Q.; Guan, X.; Yang, Q.; Chen, L.; Zhang, J.; Hu, B.; Liu, Z.; et al. Root Functional Traits, but Not Biomass, Determine the Magnitude of the Rhizosphere Priming Effect among Eight Tree Species; SSRN Scholarly Paper No. ID 3973502; Social Science Research Network: Rochester, NY, USA, 2021. [Google Scholar] [CrossRef]
  12. Potthoff, M.; Jackson, L.E.; Steenwerth, K.L.; Ramirez, I.; Stromberg, M.R.; Rolston, D.E. Soil biological and chemical properties in restored perennial grassland in California. Restor. Ecol. 2005, 13, 61–73. [Google Scholar] [CrossRef]
  13. Bhargava, S.; Mitra, S. Elevated atmospheric CO2 and the future of crop plants. Plant Breed. 2021, 140, 1–11. [Google Scholar] [CrossRef]
  14. Global Climate Change. Vital Signs of the Planet. Available online: https://climate.nasa.gov/vital-signs/carbon-dioxide/ (accessed on 21 February 2021).
  15. Walkiewicz, A.; Bieganowski, A.; Rafalska, A.; Khalil, M.I.; Osborne, B. Contrasting effects of forest type and stand age on soil microbial activities: An analysis of local scale variability. Biology 2021, 10, 850. [Google Scholar] [CrossRef] [PubMed]
  16. Dhillion, S.S.; Roy, J.; Abrams, M. Assessing the impact of elevated CO2 on soil microbial activity in a Mediterranean model ecosystem. Plant Soil 1995, 187, 333–342. [Google Scholar] [CrossRef]
  17. Babur, E.; Dindaroğlu, T. Seasonal changes of soil organic carbon and microbial biomass carbon in different forest ecosystems. In Environmental Factors Affecting Human Health; IntechOpen: London, UK, 2020; pp. 1–22. [Google Scholar] [CrossRef] [Green Version]
  18. Salazar, S.; Sánchez, L.E.; Alvarez, J.; Valverde, A.; Galindo, P.; Igual, J.M.; Peix, A.; Santa-Regina, I. Correlation among soil enzyme activities under different forest system management practices. Ecol. Eng. 2011, 37, 1123–1131. [Google Scholar] [CrossRef]
  19. Chakrawal, A.; Herrmann, A.M.; Manzoni, S. Leveraging energy flows to quantify microbial traits in soils. Soil Biol. Biochem. 2021, 155, 108169. [Google Scholar] [CrossRef]
  20. Luo, P.; Han, X.; Wang, Y.; Han, M.; Shi, H.; Liu, N.; Bai, H. Influence of long-term fertilization on soil microbial biomass, dehydrogenase activity, and bacterial and fungal community structure in a brown soil of northeast China. Ann. Microbiol. 2015, 65, 533–542. [Google Scholar] [CrossRef] [Green Version]
  21. Drigo, B.; Pijl, A.S.; Duyts, H.; Kielak, A.M.; Gamper, H.A.; Houtekamer, M.J.; Boschker, H.T.S.; Bodelier, P.L.E.; Whiteley, A.S.; van Veen, J.A.; et al. Shifting carbon flow from roots into associated microbial communities in response to elevated atmospheric CO2. Proc. Natl. Acad. Sci. USA 2010, 107, 10938–10942. [Google Scholar] [CrossRef] [Green Version]
  22. DeAngelis, K.M.; Brodie, E.L.; DeSantis, T.Z.; Andersen, G.L.; Lindow, S.E.; Firestone, M.K. Selective progressive response of soil microbial community to wild oat roots. ISME J. 2009, 3, 168–178. [Google Scholar] [CrossRef] [Green Version]
  23. Wang, X.; Wang, Z.; Jiang, P.; He, Y.; Mu, Y.; Lv, X.; Zhuang, L. Bacterial diversity and community structure in the rhizosphere of four Ferula species. Sci. Rep. 2018, 8, 5345. [Google Scholar] [CrossRef] [Green Version]
  24. Uksa, M.; Buegger, F.; Gschwendtner, S.; Lueders, T.; Kublik, S.; Kautz, T.; Athmann, M.; Köpke, U.; Munch, J.C.; Schloter, M.; et al. Bacteria utilizing plant-derived carbon in the rhizosphere of Triticum aestivum change in different depths of an arable soil. Environ. Microbiol. Rep. 2017, 9, 729–741. [Google Scholar] [CrossRef] [PubMed] [Green Version]
  25. Kabir, M.E.; Johansen, C.; Bell, R.W. Subsoil rhizosphere modification by chickpea under a dry topsoil: Implications for phosphorus acquisition. J. Plant Nutr. Soil Sci. 2015, 178, 904–913. [Google Scholar] [CrossRef] [Green Version]
  26. Yang, C.-H.; Crowley, D.E. Rhizosphere microbial community structure in relation to root location and plant iron nutritional status applied and environmental microbiology. Appl. Environ. Microbiol. 2020, 66, 345–351. [Google Scholar] [CrossRef] [PubMed] [Green Version]
  27. Raiesi, F.; Riahi, M. The influence of grazing exclosure on soil C stocks and dynamics, and ecological indicators in upland arid and semi-arid rangelands. Ecol. Indic. 2014, 41, 145–154. [Google Scholar] [CrossRef]
  28. Wang, C.; Han, G.; Jia, Y.; Feng, X.; Guo, P.; Tian, X. Response of litter decomposition and related soil enzyme activities to different forms of nitrogen fertilization in a subtropical forest. Ecol. Res. 2011, 26, 505–513. [Google Scholar] [CrossRef]
  29. Borowik, A.; Wyszkowska, J.; Wyszkowski, M. Resistance of aerobic microorganisms and soil enzyme response to soil contamination with Ekodiesel Ultra fuel. Environ. Sci. Pollut. Res. Int. 2017, 24, 24346–24363. [Google Scholar] [CrossRef] [Green Version]
  30. Liu, D.; Huang, Y.; An, S.; Sun, H.; Bhople, P.; Chen, Z. Soil physicochemical and microbial characteristics of contrasting land-use types along soil depth gradients. CATENA 2018, 162, 345–353. [Google Scholar] [CrossRef]
  31. Acosta-Martínez, V.; Mikha, M.M.; Vigil, M.F. Microbial communities and enzyme activities in soils under alternative crop rotations compared to wheat–fallow for the Central Great Plains. Appl. Soil Ecol. 2007, 37, 41–52. [Google Scholar] [CrossRef]
  32. Pandey, D.; Agrawal, M.; Bohra, J.S. Effects of conventional tillage and no tillage permutations on extracellular soil enzyme activities and microbial biomass under rice cultivation. Soil Tillage Res. 2014, 136, 51–60. [Google Scholar] [CrossRef]
  33. De Medeiros, K.; de Alcantara, N.; de Barros, J.A.; da Silva Moraes, W.; Silva, A.O.; Moreira, K.A. Absolute and specific enzymatic activities of sandy entisol from tropical dry forest, monoculture and intercropping areas. Soil Tillage Res. 2015, 145, 208–215. [Google Scholar] [CrossRef]
  34. Solon, J.; Borzyszkowski, J.; Bidłasik, M.; Richling, A.; Badora, K.; Balon, J.; Teresa, B.-W.; Chab, L.; Dobrowolski, R.; Grzegorczyk, I.; et al. Physico-geographical mesoregions of Poland: Verification and adjustment of boundaries on the basis of contemporary spatial data. Geogr. Pol. 2018, 91, 143–170. [Google Scholar] [CrossRef]
  35. Stan Zdrowotny Lasów W Polsce W 2018 Roku Na Podstawie Badań Monitoringowych. Available online: https://www.bdl.lasy.gov.pl/portal/Media/Default/Publikacje/Stan_zdrowotny_lasow_2018.pdf (accessed on 26 April 2022).
  36. Nelson, D.W.; Sommers, L.E. Total carbon, organic carbon, and organic matter. In Methods of Soil Analysis; John Wiley & Sons, Ltd.: Hoboken, NJ, USA, 1996; pp. 961–1010. [Google Scholar] [CrossRef]
  37. ISO 11261. Soil Quality—Determination of Total Nitrogen—Modified Kjeldahl Method; International Organization for Standardization: Geneva, Switzerland, 1995. [Google Scholar]
  38. Egner, H.; Riehm, H.; Domingo, W.R. Untersuchungen über die chemische Bodenanalyse als Grundlage für die Beurteilung des Nährstozustandes der Böden. II. Chemische Extractionsmethoden zur Phospor und Kaliumbestimmung. Ann. R. Agric. Coll. Swed. 1960, 26, 199–215. [Google Scholar]
  39. Schlichting, E.; Blume, H.P.; Stahr, K. Bodenkundliches Praktikum; Pareys Studientexte 81; Blackwell Wissenschafts-Verlag: Berlin, Germany, 1995. [Google Scholar]
  40. ISO 11260 Preview. Soil Quality—Determination of Effective Cation Exchange Capacity and Base Saturation Level Using Barium Chloride Solution; International Organization for Standardization: Geneva, Switzerland, 2018. [Google Scholar]
  41. ISO 10390. Soil Quality—Determination of pH; International Organization for Standardization: Geneva, Switzerland, 2005. [Google Scholar]
  42. Carter, M.R.; Gregorich, E.G. Soil Sampling and Methods of Analysis, 2nd ed.; CRC Press: Boca Raton, FL, USA, 2008; p. 1224. [Google Scholar]
  43. De Leij, F.A.A.M.; Whipps, J.M.; Lynch, J.M. The use of colony development for the characterization of bacterial communities in soil and on roots. Microb. Ecol. 1993, 27, 81–97. [Google Scholar] [CrossRef] [PubMed]
  44. Borowik, A.; Wyszkowska, J.; Kucharski, M.; Kucharski, J. The role of Dactylis glomerata and diesel oil in the formation of microbiome and soil enzyme activity. Sensors 2020, 20, 3362. [Google Scholar] [CrossRef]
  45. Gomez, E.; Ferreras, L.; Toresani, S. Soil bacterial functional diversity as influenced by organic amendment application. Bioresour. Technol. 2006, 97, 1484–1489. [Google Scholar] [CrossRef]
  46. Öhlinger, R. Dehydrogenase activity with the substrate TTC. In Methods in Soil Biology; Schinner, F., Öhlinger, R., Kandler, E., Margesin, R., Eds.; Springer: Berlin, Germany, 1996; pp. 241–243. [Google Scholar]
  47. Johnson, J.L.; Temple, K.L. Some variables affecting the measurement of “catalase activity” in soil. Soil Sci. Soc. Am. J. 1964, 28, 207–209. [Google Scholar] [CrossRef]
  48. Methods in Applied Soil Microbiology and Biochemistry; Alef, K.; Nannipieri, P. (Eds.) Academic Press: Cambridge, MA, USA, 1998; pp. 316–365. [Google Scholar]
  49. Tibco Software Inc. Statistica (Data Analysis Software System), version 13; Tibco Software Inc.: Palo Alto, CA, USA, 2017; Available online: https://statistica.io (accessed on 17 November 2021).
  50. Shapiro, S.S.; Wilk, M.B. An analysis of variance test for normality (complete samples). Biometrika 1965, 52, 591–611. [Google Scholar] [CrossRef]
  51. Kruskal-Wallis Test. In The Concise Encyclopedia of Statistics; Springer: New York, NY, USA, 2008. [CrossRef]
  52. Parks, D.H.; Tyson, G.W.; Hugenholtz, P.; Beiko, R.G. STAMP: Statistical analysis of taxonomic and functional profiles. Bioinformatics 2014, 30, 3123–3124. [Google Scholar] [CrossRef] [Green Version]
  53. Krzywinski, M.; Schein, J.; Birol, I.; Connors, J.; Gascoyne, R.; Horsman, D.; Jones, S.J.; Marra, M.A. Circos: An information aesthetic for comparative genomics. Genome Res. 2009, 19, 1639–1645. [Google Scholar] [CrossRef] [Green Version]
  54. Warnes, G.R.; Bolker, B.; Bonebakker, L.; Gentleman, R.; Huber, W.; Liaw, A.; Lumley, T.; Maechler, M.; Magnusson, M.; Moeller, S.; et al. Various R programming tools for plotting data. R package version 2.17.0. 2020. Available online: https://CRAN.R-project.org/package=gplots (accessed on 23 February 2020).
  55. Heberle, H.; Meirelles, G.V.; da Silva, F.R.; Telles, G.P.; Minghim, R. InteractiVenn: A web-based tool for the analysis of sets through Venn diagrams. BMC Bioinform. 2015, 16, 169. [Google Scholar] [CrossRef]
  56. Lladó, S.; López-Mondéjar, R.; Baldrian, P. Drivers of microbial community structure in forest soils. Appl. Microbiol. Biotechnol. 2018, 102, 4331–4338. [Google Scholar] [CrossRef] [PubMed]
  57. Błońska, E. Enzyme activity in forest peat soils. Folia For. Pol. Ser. A 2010, 52, 20–25. [Google Scholar] [CrossRef]
  58. Cheng, F.; Peng, X.; Zhao, P.; Yuan, J.; Zhong, C.; Cheng, Y.; Cui, C.; Zhang, S. Soil microbial biomass, basal respiration and enzyme activity of main forest types in the Qinling Mountains. PLoS ONE 2013, 8, e67353. [Google Scholar] [CrossRef] [PubMed]
  59. Stolnikova, E.V.; Ananyeva, N.D.; Chernova, O.V. The microbial biomass and its activity and structure in the soils of old forests in the European Russia. Eurasian Soil Sci. 2011, 44, 437–452. [Google Scholar] [CrossRef]
  60. Shannon, V.L.; Vanguelova, E.I.; Morison, J.I.L.; Shaw, L.J.; Clark, J.M. The contribution of deadwood to soil carbon dynamics in contrasting temperate forest ecosystems. Eur. J. For. Res. 2021, 141, 241–252. [Google Scholar] [CrossRef]
  61. Lu, J.-Z.; Scheu, S. Response of soil microbial communities to mixed beech-conifer forests varies with site conditions. Soil Biol. Biochem. 2021, 155, 108155. [Google Scholar] [CrossRef]
  62. Fanin, N.; Kardol, P.; Farrell, M.; Nilsson, M.-C.; Gundale, M.J.; Wardle, D.A. The ratio of Gram-positive to Gram-negative bacterial PLFA markers as an indicator of carbon availability in organic soils. Soil Biol. Biochem. 2019, 128, 111–114. [Google Scholar] [CrossRef]
  63. Thomson, B.C.; Ostle, N.; McNamara, N.; Bailey, M.J.; Whiteley, A.S.; Griffiths, R.I. Vegetation affects the relative abundances of dominant soil bacterial taxa and soil respiration rates in an upland grassland soil. Microb. Ecol. 2010, 59, 335–343. [Google Scholar] [CrossRef]
  64. Baćmaga, M.; Wyszkowska, J.; Borowik, A.; Kucharski, J.; Paprocki, Ł. Microbiological and biochemical properties in eutric/dystric brunic arenosols, eutric/endocalcaric cambisols, and haplic/albic luvisols soils. J. Soil Sci. Plant Nutr. 2021, 21, 1277–1292. [Google Scholar] [CrossRef]
  65. Ganault, P.; Nahmani, J.; Hättenschwiler, S.; Gillespie, L.M.; David, J.-F.; Henneron, L.; Iorio, E.; Mazzia, C.; Muys, B.; Pasquet, A.; et al. Relative importance of tree species richness, tree functional type, and microenvironment for soil macrofauna communities in European forests. Oecologia 2021, 196, 455–468. [Google Scholar] [CrossRef]
  66. Tláskal, V.; Zrůstová, P.; Vrška, T.; Baldrian, P. Bacteria associated with decomposing dead wood in a natural temperate forest. FEMS Microbiol. Ecol. 2017, 93, fix157. [Google Scholar] [CrossRef] [PubMed]
  67. Gałązka, A.; Marzec-Grządziel, A.; Varsadiya, M.; Niedźwiecki, J.; Gawryjołek, K.; Furtak, K.; Przybyś, M.; Grządziel, J. Biodiversity and metabolic potential of bacteria in bulk soil from the peri-root zone of black alder (Alnus glutinosa), Silver Birch (Betula pendula) and Scots Pine (Pinus sylvestris). Int. J. Mol. Sci. 2022, 23, 2633. [Google Scholar] [CrossRef] [PubMed]
  68. Norman, J.S.; Barrett, J.E. Substrate availability drives spatial patterns in richness of ammonia-oxidizing bacteria and archaea in temperate forest soils. Soil Biol. Biochem. 2016, 94, 169–172. [Google Scholar] [CrossRef] [Green Version]
  69. Hansel, C.M.; Fendorf, S.; Jardine, P.M.; Francis, C.A. Changes in bacterial and archaeal community structure and functional diversity along a geochemically variable soil profile. Appl. Environ. Microbiol. 2008, 74, 5. [Google Scholar] [CrossRef] [PubMed] [Green Version]
  70. Kielak, A.M.; Barreto, C.C.; Kowalchuk, G.A.; van Veen, J.A.; Kuramae, E.E. The ecology of acidobacteria: Moving beyond genes and genomes. Front. Microbiol. 2016, 7, 744. [Google Scholar] [CrossRef] [PubMed] [Green Version]
  71. Fierer, N.; Bradford, M.A.; Jackson, R.B. Toward an ecological classification of soil bacteria. Ecology 2007, 88, 1354–1364. [Google Scholar] [CrossRef]
  72. Shen, C.; Xiong, J.; Zhang, H.; Feng, Y.; Lin, X.; Li, X.; Liang, W.; Chu, H. Soil pH drives the spatial distribution of bacterial communities along elevation on Changbai Mountain. Soil Biol. Biochem. 2013, 57, 204–211. [Google Scholar] [CrossRef]
  73. Yun, Y.; Wang, H.; Man, B.; Xiang, X.; Zhou, J.; Qiu, X.; Duan, Y.; Engel, A.S. The relationship between pH and bacterial communities in a single karst ecosystem and its implication for soil acidification. Front. Microbiol. 2016, 7, 1955. [Google Scholar] [CrossRef]
  74. Baćmaga, M.; Wyszkowska, J.; Borowik, A.; Kucharski, J.; Paprocki, Ł. Role of forest site type in determining bacterial and biochemical properties of soil. Ecol. Indic. 2022, 135, 108557. [Google Scholar] [CrossRef]
  75. Kim, H.-S.; Lee, S.-H.; Jo, H.Y.; Finneran, K.T.; Kwon, M.J. Diversity and composition of soil Acidobacteria and Proteobacteria communities as a bacterial indicator of past land-use change from forest to farmland. Sci. Total Environ. 2021, 797, 148944. [Google Scholar] [CrossRef]
  76. Cheng, J.; Zhao, M.; Cong, J.; Qi, Q.; Xiao, Y.; Cong, W.; Deng, Y.; Zhou, J.; Zhang, Y. Soil pH exerts stronger impacts than vegetation type and plant diversity on soil bacterial community composition in subtropical broad-leaved forests. Plant Soil 2020, 450, 273–286. [Google Scholar] [CrossRef]
  77. Navarrete, A.A.; Tsai, S.M.; Mendes, L.W.; Faust, K.; de Hollander, M.; Cassman, N.A.; Raes, J.; van Veen, J.A.; Kuramae, E.E. Soil microbiome responses to the short-term effects of Amazonian deforestation. Mol. Ecol. 2015, 24, 2433–2448. [Google Scholar] [CrossRef] [PubMed]
  78. Zhelezova, A.; Chernov, T.; Tkhakakhova, A.; Xenofontova, N.; Semenov, M.; Kutovaya, O. Prokaryotic community shifts during soil formation on sands in the tundra zone. PLoS ONE 2019, 14, e0206777. [Google Scholar] [CrossRef] [PubMed] [Green Version]
  79. Rughöft, S.; Herrmann, M.; Lazar, C.S.; Cesarz, S.; Levick, S.R.; Trumbore, S.E.; Küsel, K. Community composition and abundance of bacterial, archaeal and nitrifying populations in savanna soils on contrasting bedrock material in Kruger National Park, South Africa. Front. Microbiol. 2016, 7, 1638. [Google Scholar] [CrossRef] [PubMed]
  80. Li, J.; Wang, J.-T.; Hu, H.-W.; Ma, Y.-B.; Zhang, L.-M.; He, J.-Z. Copper pollution decreases the resistance of soil microbial community to subsequent dry-rewetting disturbance. J. Environ. Sci. China 2016, 39, 155–164. [Google Scholar] [CrossRef] [Green Version]
  81. Lasota, J.; Błońska, E.; Babiak, T.; Piaszczyk, W.; Stępniewska, H.; Jankowiak, R.; Boroń, P.; Lenart-Boroń, A. Effect of charcoal on the properties, enzyme activities and microbial diversity of temperate pine forest soils. Forests 2021, 12, 1488. [Google Scholar] [CrossRef]
  82. Eaton, W.D.; McGee, K.M.; Larimer, M.; Hoke, E.; Karas, O.; Hernandez, B.; Waylan, N.A. Changes in soil bacterial communities, and carbon and nitrogen metrics as potential indicators of land use effects in a humid tropical forest. Pedobiologia 2021, 85–86, 150730. [Google Scholar] [CrossRef]
  83. Pratiwi, E.; Satwika, T.; Agus, F. Analysis of peat bacterial diversity in oil palm plantations and a logged forest in Jambi, Indonesia, using PCR-DGGE technique. IOP Conf. Ser. Earth Environ. Sci. 2021, 648, 012200. [Google Scholar] [CrossRef]
  84. Nacke, H.; Thürmer, A.; Wollherr, A.; Will, C.; Hodac, L.; Herold, N.; Schöning, I.; Schrumpf, M.; Daniel, R. Pyrosequencing-based assessment of bacterial community structure along different management types in German forest and grassland soils. PLoS ONE 2011, 6, e17000. [Google Scholar] [CrossRef] [Green Version]
  85. Liu, Y.; Wang, S.; Wang, Z.; Zhang, Z.; Qin, H.; Wei, Z.; Feng, K.; Li, S.; Wu, Y.; Yin, H.; et al. Soil microbiome mediated nutrients decline during forest degradation process. Soil Ecol. Lett. 2019, 1, 59–71. [Google Scholar] [CrossRef] [Green Version]
  86. Błońska, E.; Lasota, J.; Gruba, P. Effect of temperate forest tree species on soil dehydrogenase and urease activities in relation to other properties of soil derived from loess and glaciofluvial sand. Ecol. Res. 2016, 31, 655–664. [Google Scholar] [CrossRef] [Green Version]
  87. Kaczyńska, G.; Borowik, A.; Wyszkowska, J. Soil dehydrogenases as an indicator of contamination of the environment with petroleum products. Water Air Soil Pollut. 2015, 226, 372. [Google Scholar] [CrossRef] [PubMed] [Green Version]
  88. Wyszkowska, J.; Borowik, A.; Olszewski, J.; Kucharski, J. Soil bacterial community and soil enzyme activity depending on the cultivation of Triticum aestivum, Brassica napus, and Pisum sativum ssp. arvense. Diversity 2019, 11, 246. [Google Scholar] [CrossRef] [Green Version]
  89. Silva-Olaya, A.M.; Mora-Motta, D.A.; Cherubin, M.R.; Grados, D.; Somenahally, A.; Ortiz-Morea, F.A. Soil enzyme responses to land use change in the tropical rainforest of the Colombian Amazon region. PLoS ONE 2021, 16, e0255669. [Google Scholar] [CrossRef] [PubMed]
  90. Hernández, D.; Hobbie, S. The effects of substrate composition, quantity, and diversity on microbial activity. Plant Soil 2010, 335, 397–411. [Google Scholar] [CrossRef]
  91. Zhan, X.; Wu, W.; Zhou, L.; Liang, J.; Jiang, T. Interactive effect of dissolved organic matter and phenanthrene on soil enzymatic activities. J. Environ. Sci. China 2010, 22, 607–614. [Google Scholar] [CrossRef]
  92. Brzezińska, M.; Stępniewski, W.; Stępniewska, Z.; Przywara, G.; Włodarczyk, T. Effect of oxygen deficiency on soil dehydrogenase activity in a pot experiment with triticale cv. Jago vegetation. Int. Agrophysics 2001, 15, 145–149. [Google Scholar]
  93. Andreoni, V.; Cavalca, L.; Rao, M.A.; Nocerino, G.; Bernasconi, S.; Dell’Amico, E.; Colombo, M.; Gianfreda, L. Bacterial communities and enzyme activities of PAHs polluted soils. Chemosphere 2004, 57, 401–412. [Google Scholar] [CrossRef]
  94. Zaborowska, M.; Wyszkowska, J.; Kucharski, J. Role of Chlorella sp. and rhamnolipid 90 in maintaining homeostasis in soil contaminated with bisphenol A. J. Soils Sediments 2021, 21, 27–41. [Google Scholar] [CrossRef]
  95. De la Peña, E.; Baeten, L.; Steel, H.; Viaene, N.; De Sutter, N.; De Schrijver, A.; Verheyen, K. Beyond plant–soil feedbacks: Mechanisms driving plant community shifts due to land-use legacies in post-agricultural forests. Funct. Ecol. 2016, 30, 1073–1085. [Google Scholar] [CrossRef] [Green Version]
  96. Borowik, A.; Wyszkowska, J.; Kucharski, J. Impact of various grass species on soil bacteriobiome. Diversity 2020, 12, 212. [Google Scholar] [CrossRef]
  97. Dinesh, R.; Chaudhuri, S.; Sheeja, T. Soil biochemical and microbial indices in wet tropical forests: Effects of deforestation and cultivation. J. Plant Nutr. Soil Sci. 2004, 167, 24–32. [Google Scholar] [CrossRef]
  98. Chen, D.; Wang, X.; Carrión, V.J.; Yin, S.; Yue, Z.; Liao, Y.; Dong, Y.; Li, X. Acidic amelioration of soil amendments improves soil health by impacting rhizosphere microbial assemblies. Soil Biol. Biochem. 2022, 167, 108599. [Google Scholar] [CrossRef]
  99. Costantini, E.A.C.; Mocali, S. Soil health, soil genetic horizons and biodiversity. J. Plant Nutr. Soil Sci. 2022, 185, 24–34. [Google Scholar] [CrossRef]
  100. Mocali, S.; Gelsomino, A.; Nannipieri, P.; Pastorelli, R.; Giagnoni, L.; Petrovicova, B.; Renella, G. Short-term resilience of soil microbial communities and functions following severe environmental changes. Agriculture 2022, 12, 268. [Google Scholar] [CrossRef]
Figure 1. A map of the soil sampling sites. The Narajty in the Pasym commune (53°36′00.8″ N 20°47′25.1″ E) of the Warmian–Masurian Voivodeship (Poland). Materials 15 03287 i001
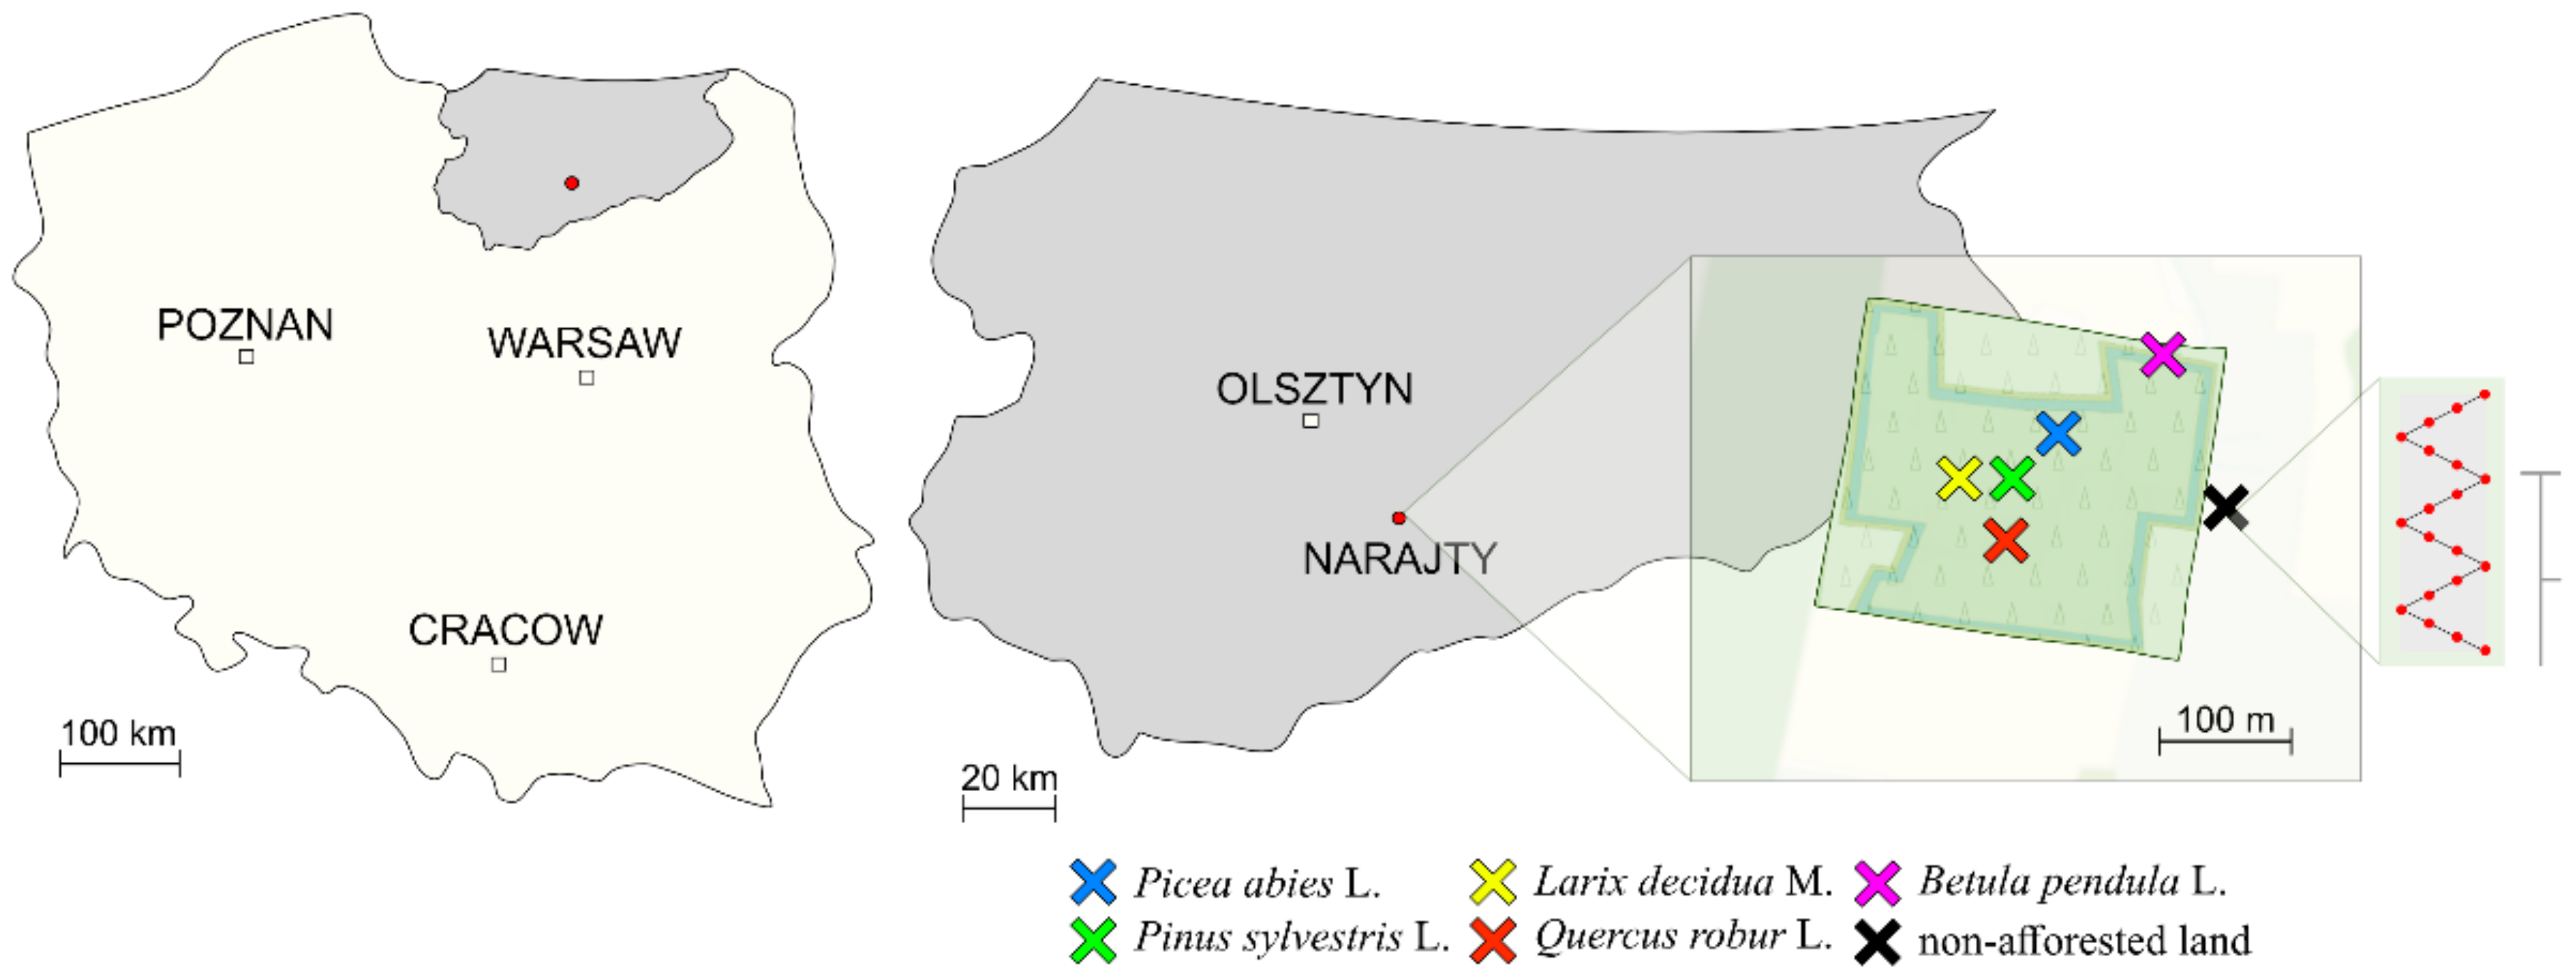
—15,900 seedlings of English oak (Quercus robur L.—Qr) planted on the area of 1.95 ha; Materials 15 03287 i002—4500 seedlings of Norway spruce (Picea abies L.—Pa) planted on the area of 0.97 ha; Materials 15 03287 i003—7700 seedlings of Scots pine (Pinus sylvestris L.—Ps) planted on the area of 0.97 ha; Materials 15 03287 i004—700 seedlings of European larch (Larix decidua M.—Ld) planted on the area of 0.43 ha; Materials 15 03287 i005—2400 seedlings of warty birch (Betula pendula L.—Bp) planted on the area of 0.55 ha; and Materials 15 03287 i006—non-afforested land. Materials 15 03287 i007—a soil sampling scheme with the use of Egners Riehm’s staff.
Materials 15 03287 g001
Figure 2. The total number of OTU. C—non-afforested land, Pa—Picea abies L., Ps—Pinus sylvestris L., Ld—Larix decidua M., Qr—Quercus robur L., and Bp—Betula pendula L.
Materials 15 03287 g002
Figure 3. The index of the stand influence on the number of microorganisms. Pa—Picea abies L., Ps—Pinus sylvestris L., Ld—Larix decidua M., Qr—Quercus robur L., Bp—Betula pendula L., Cop—copiotrophic bacteria, Act—actinomycetes, and Fun—fungi. Homogeneous groups (denoted with letters a–e) were calculated separately for each microorganism.
Materials 15 03287 g003
Figure 4. The colony development index (CD) for Cop—copiotrophic bacteria, Act—actinomycetes and Fun—fungi. C—non-afforested land, Pa—Picea abies L., Ps—Pinus sylvestris L., Ld—Larix decidua M., Qr—Quercus robur L., and Bp—Betula pendula L. Homogeneous groups (denoted with letters a–c) were calculated separately for each microorganism.
Materials 15 03287 g004
Figure 5. The ecophysiological diversity factor (EP) for Cop—copiotrophic bacteria, Act—actinomycetes and Fun—fungi. C—non-afforested land, Pa—Picea abies L., Ps—Pinus sylvestris L., Ld—Larix decidua M., Qr—Quercus robur L., and Bp—Betula pendula L. Homogeneous groups (denoted with letters a–c) were calculated separately for each microorganism.
Materials 15 03287 g005
Figure 6. The relative abundance of the dominant phylum bacteria in forest soils with the difference between the proportions ≥1%. C—non-afforested land, Pa—Picea abies L., Ps—Pinus sylvestris L., Ld—Larix decidua M., Qr—Quercus robur L., and Bp—Betula pendula L.
Materials 15 03287 g006aMaterials 15 03287 g006b
Figure 7. The relative abundance of the dominant families’ bacteria in forest soils with the difference between the proportions ≥1%. The operational taxonomic unit (OTU) values of families’ bacteria provide data in direct proportion to the width of each band connecting the bacterial taxa to the respective soil sample. A specific color is assigned to each family of bacteria. The inner ring represents the number of 16S amplicon sequences assigned to a given taxon, while the outer ring represents the total percentage of 16S sequences. C—non-afforested land, Pa—Picea abies L., Ps—Pinus sylvestris L., Ld—Larix decidua M., Qr—Quercus robur L., and Bp—Betula pendula L.
Materials 15 03287 g007
Figure 8. A heat map presenting associations between bacterial genera in the forest soils tested with the difference between ratios ≥1%. The smallest amounts of bacterial OTU are shown in yellow, while the largest amounts of OTU are shown in black. The blue line shown in the “color key and histogram” shows how many times each data point appears in the matrix used in the heat map.C—non-afforested land, Pa—Picea abies L., Ps—Pinus sylvestris L., Ld—Larix decidua M., Qr—Quercus robur L., and Bp—Betula pendula L.
Materials 15 03287 g008
Figure 9. A Venn diagram showing common and unique species of bacteria in forest soils with the difference between the proportions ≥1%. Pa—Picea abies L., Ps—Pinus sylvestris L., Ld—Larix decidua M., Qr—Quercus robur L., and Bp—Betula pendula L.
Materials 15 03287 g009
Figure 10. The index of forest stand influence on enzyme activity. Deh—dehydrogenases; Ure—urease, Pal—alkaline phosphatase, Pac—acid phosphatase, Aryl—arylsulphatase, Glu—β-glucosidase. Pa—Picea abies L., Ps—Pinus sylvestris L., Ld—Larix decidua M., Qr—Quercus robur L., and Bp—Betula pendula L. Homogeneous groups (denoted with letters a–e) were calculated separately for each enzyme.
Materials 15 03287 g010
Table 1. The Shannon–Weaver (H’) indexes of microbial diversity (greater than or equal to 1%).
TaxaCPaPsLdQrBp
Phylum1.86 a1.86 a1.62 b1.61 b1.67 b1.82 a
Class2.72 a2.47 b2.50 b2.50 b2.54 b2.67 a
Order2.90 a2.70 c2.62 c2.68 c2.78 b2.93 a
Family3.08 b3.05 b2.99 b3.05 b3.17 a3.02 b
Genus2.05 d2.16 c2.32 a2.37 a2.25 b1.68 e
C—non-afforested land, Pa—Picea abies L., Ps—Pinus sylvestris L., Ld—Larix decidua M., Qr—Quercus robur L., and Bp—Betula pendula L. Homogeneous groups (denoted with letters a–e) were calculated separately for each taxa.
Publisher’s Note: MDPI stays neutral with regard to jurisdictional claims in published maps and institutional affiliations.

