
Oxyalkylation of Lignoboost™ Kraft Lignin with Propylene Carbonate: Design of Experiments towards Synthesis Optimization

 ,
,  , and
, and
Abstract
:1. Introduction
2. Materials and Methods
2.1. Materials
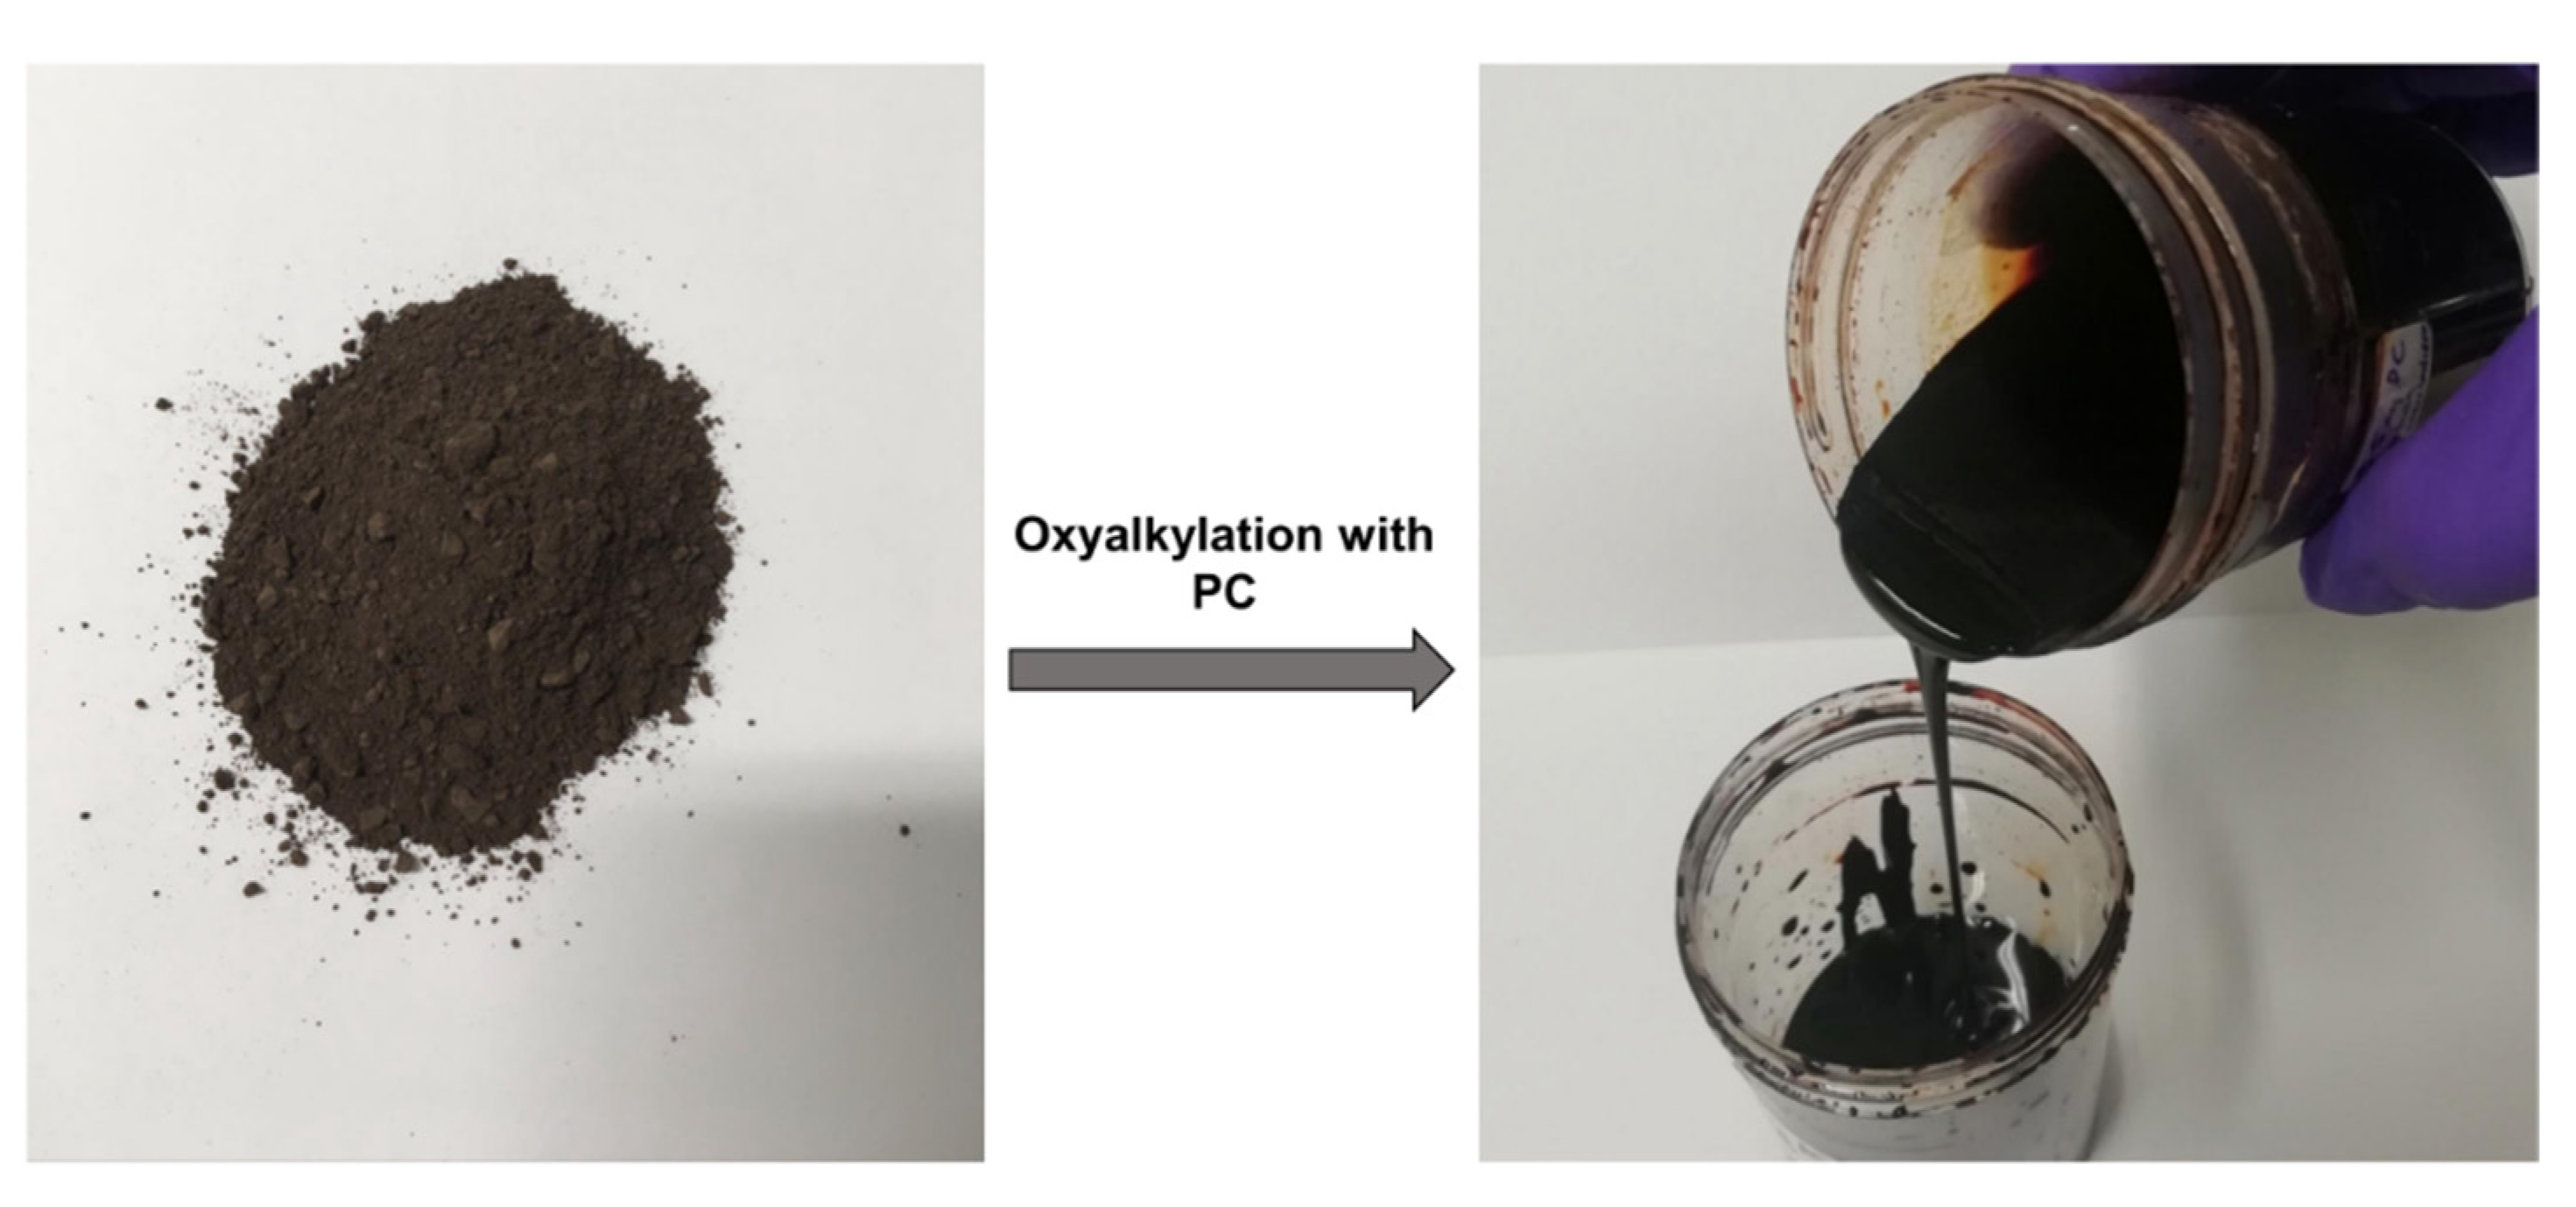
2.2. Oxyalkylation of Kraft Lignin
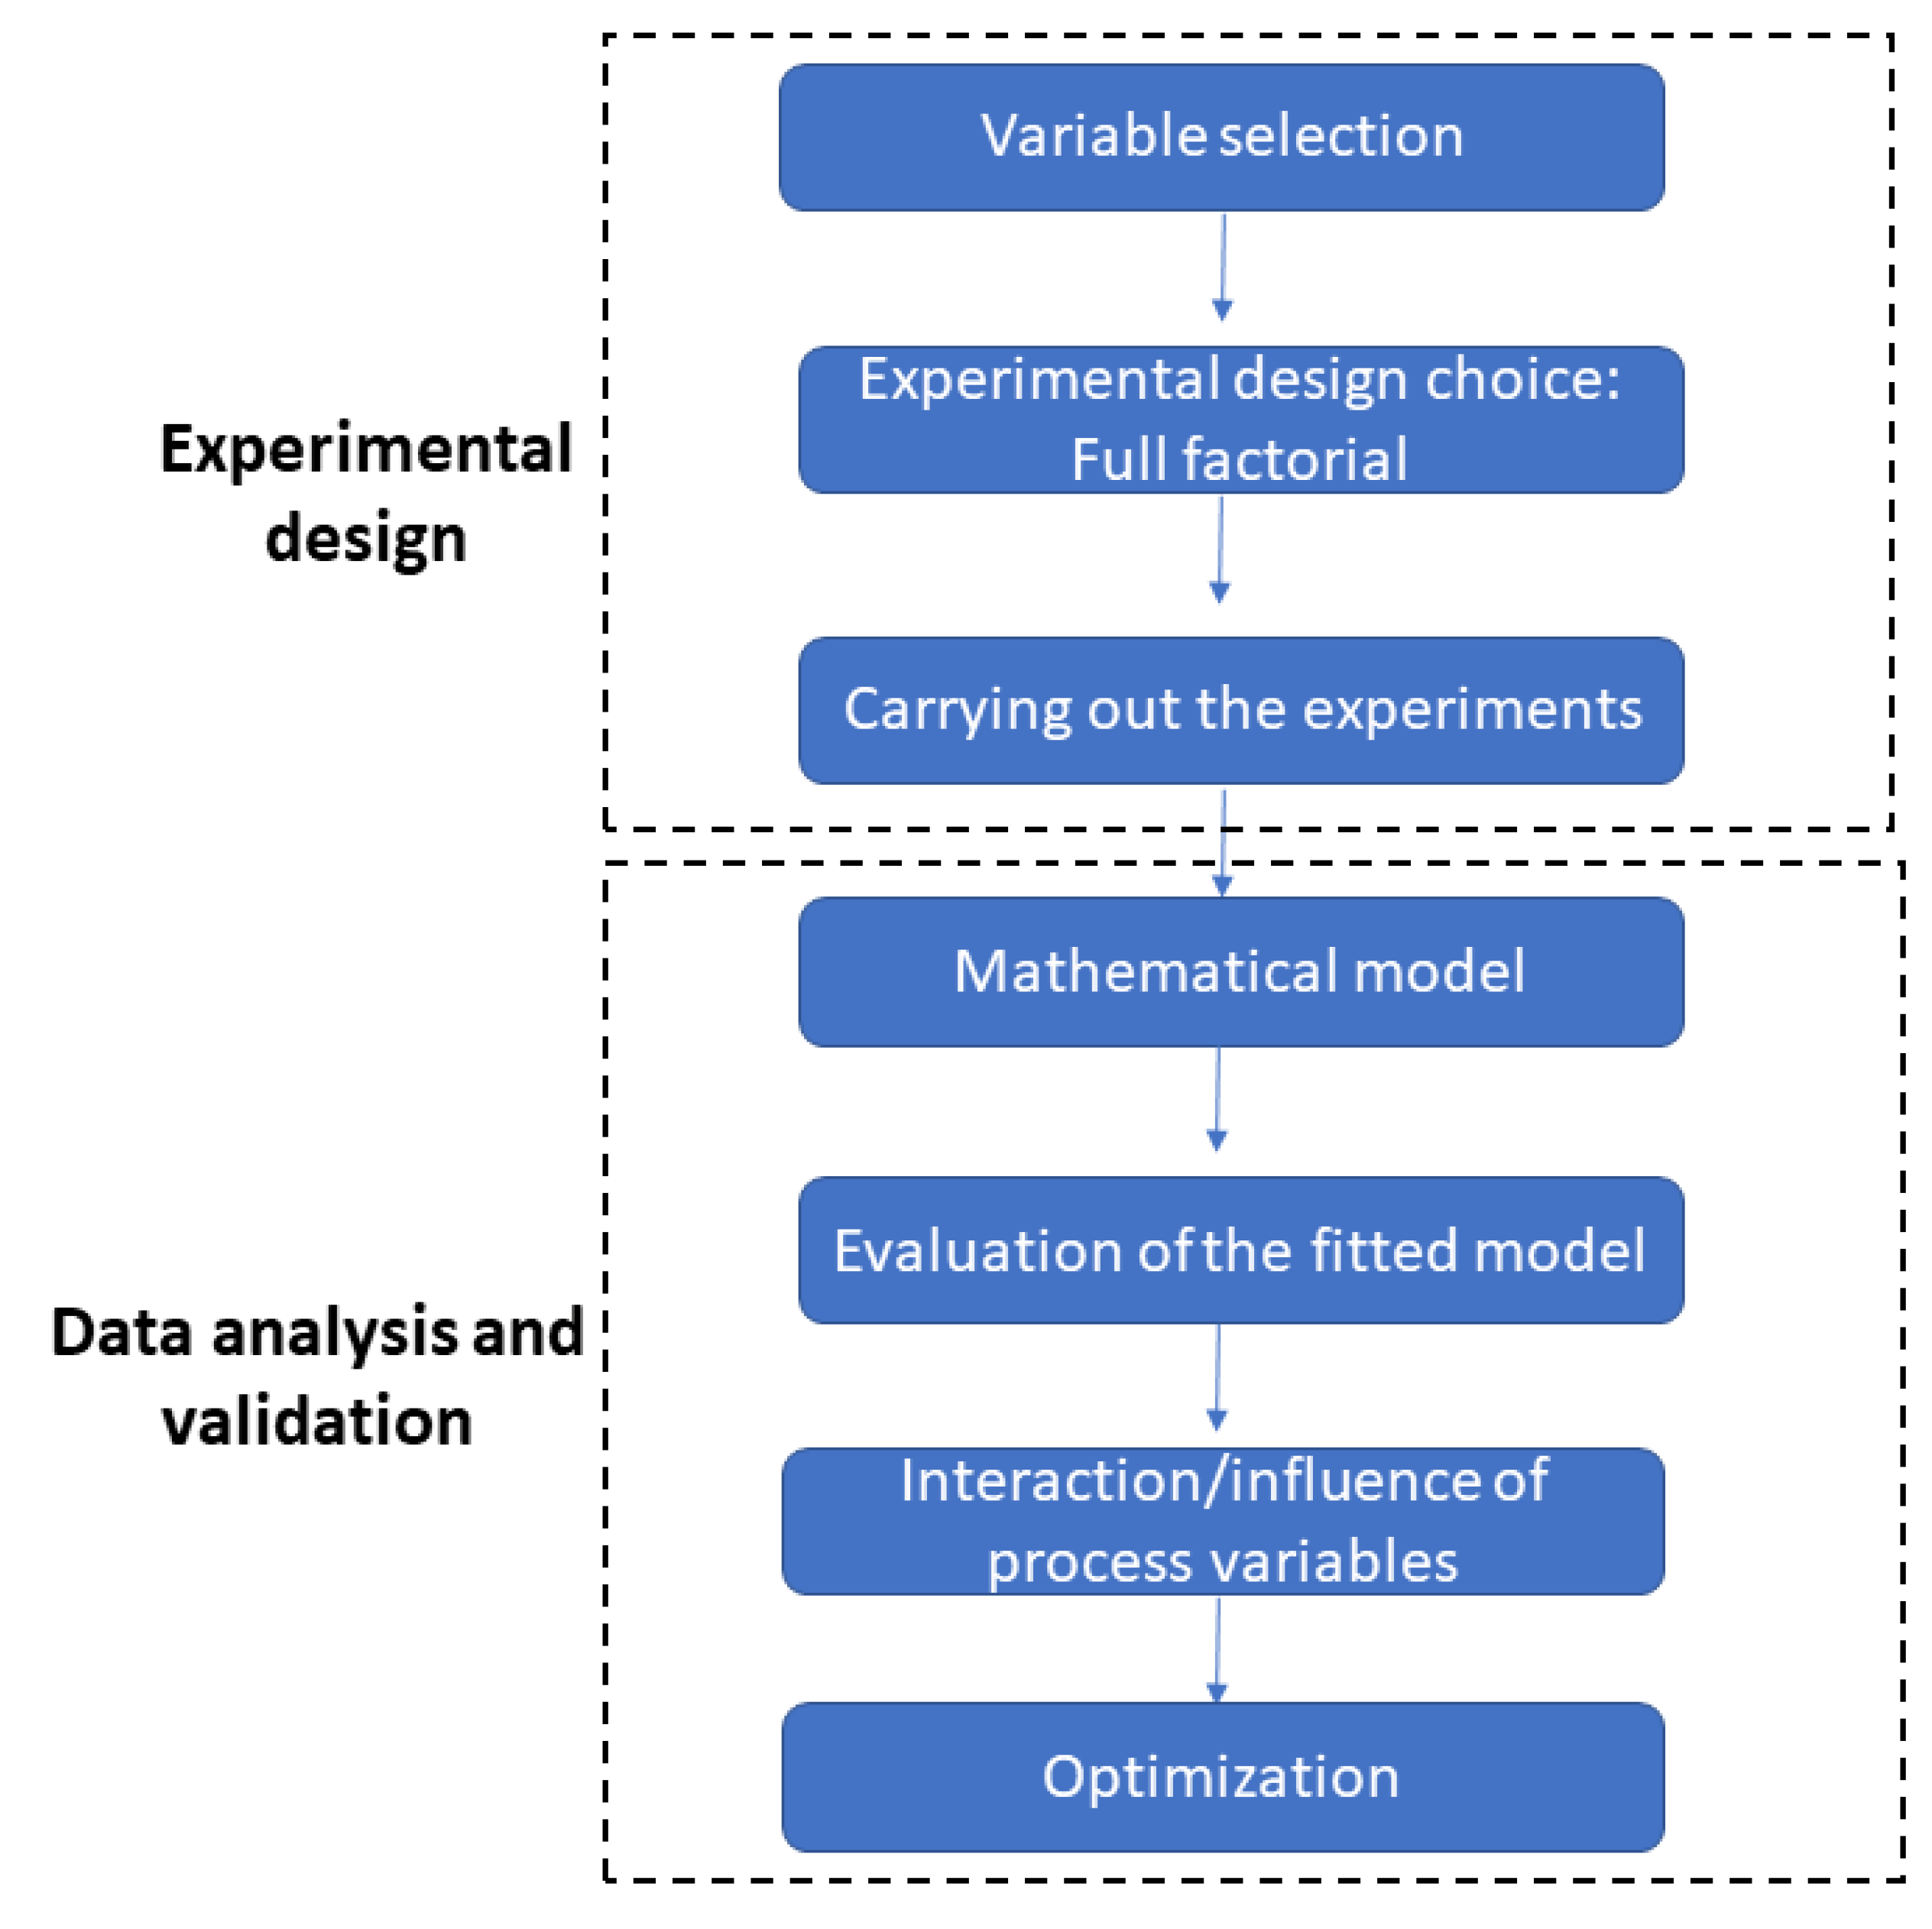
2.3. Design of Experiments (DoE)
2.4. Lignin-Based Polyol and Lignin Characterization
3. Results and Discussion
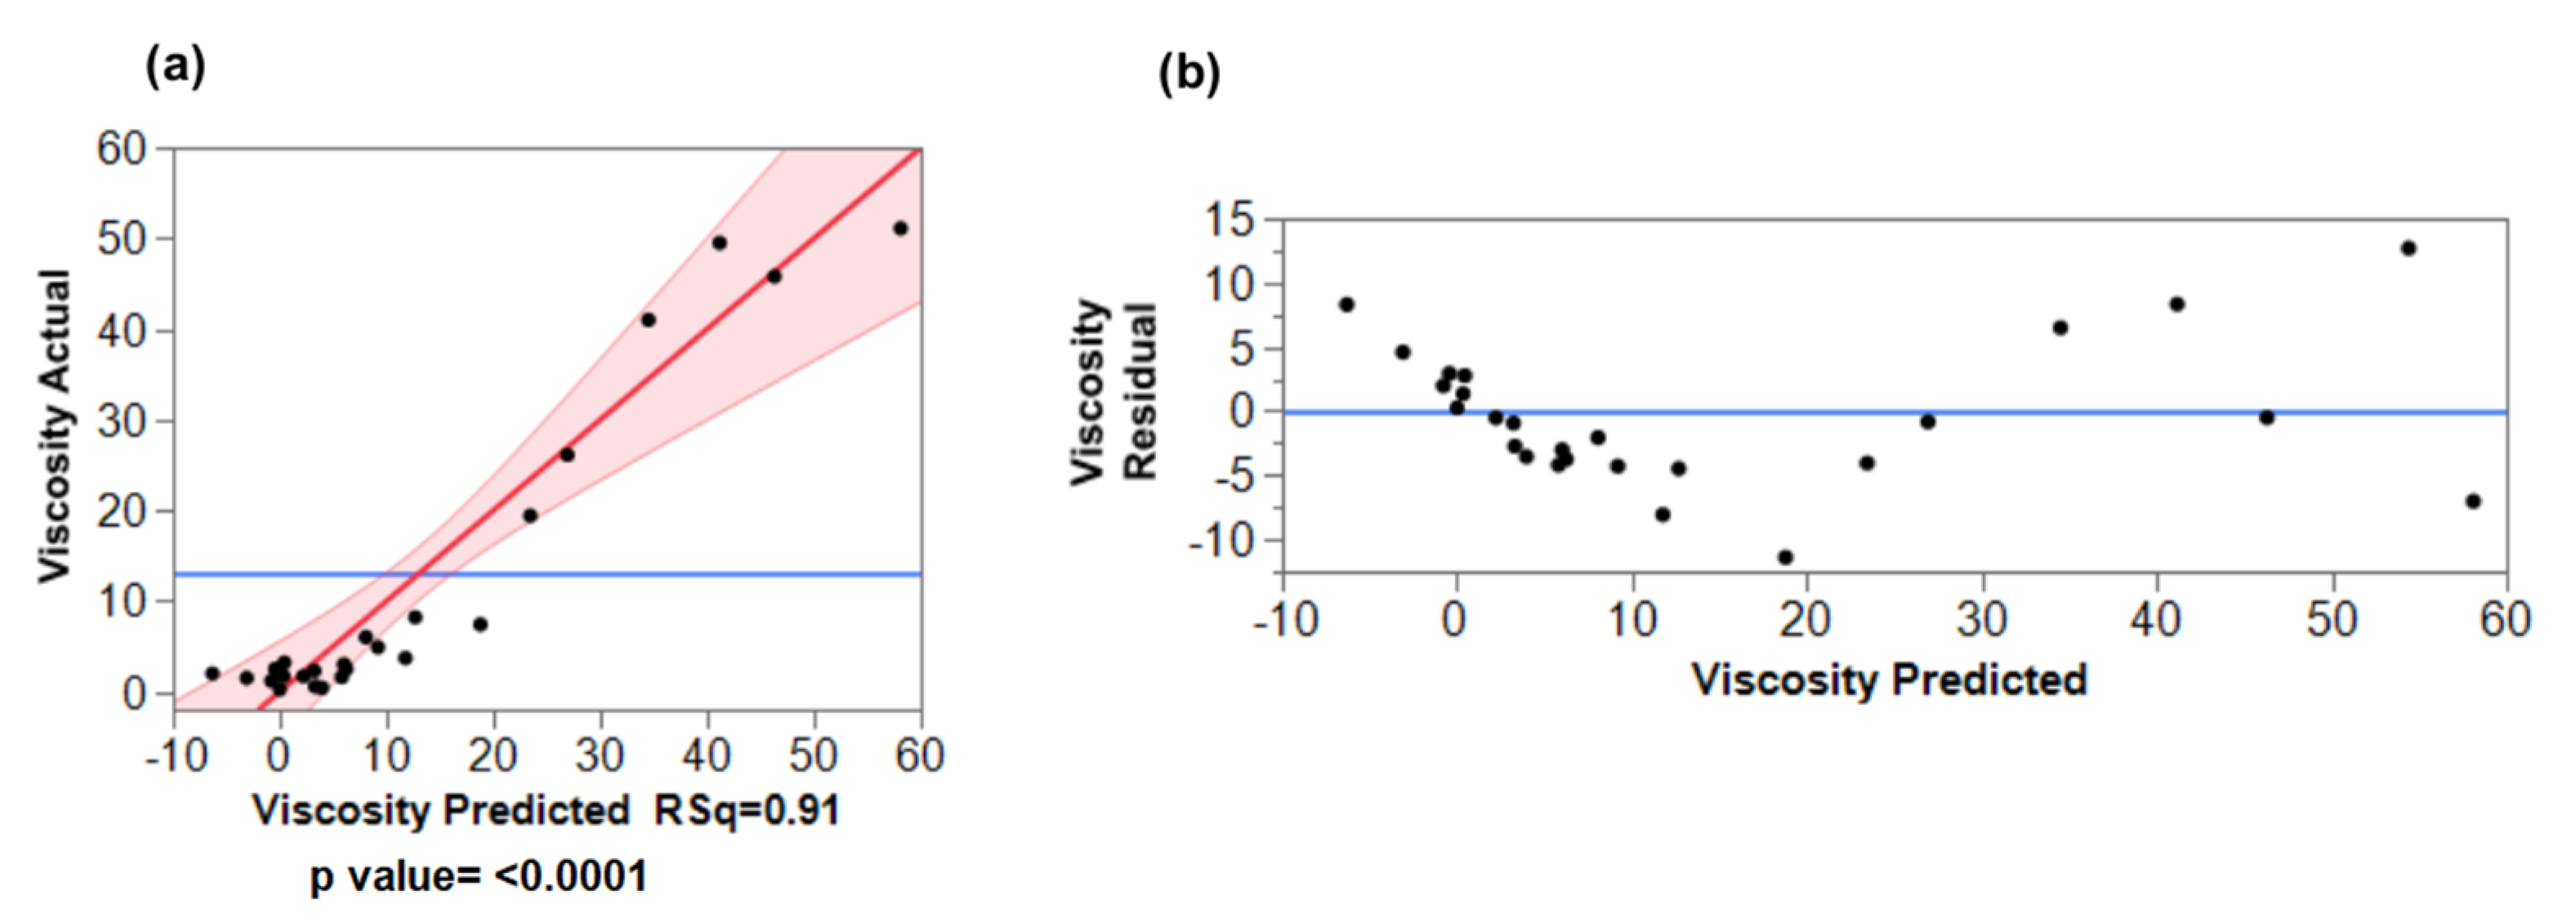
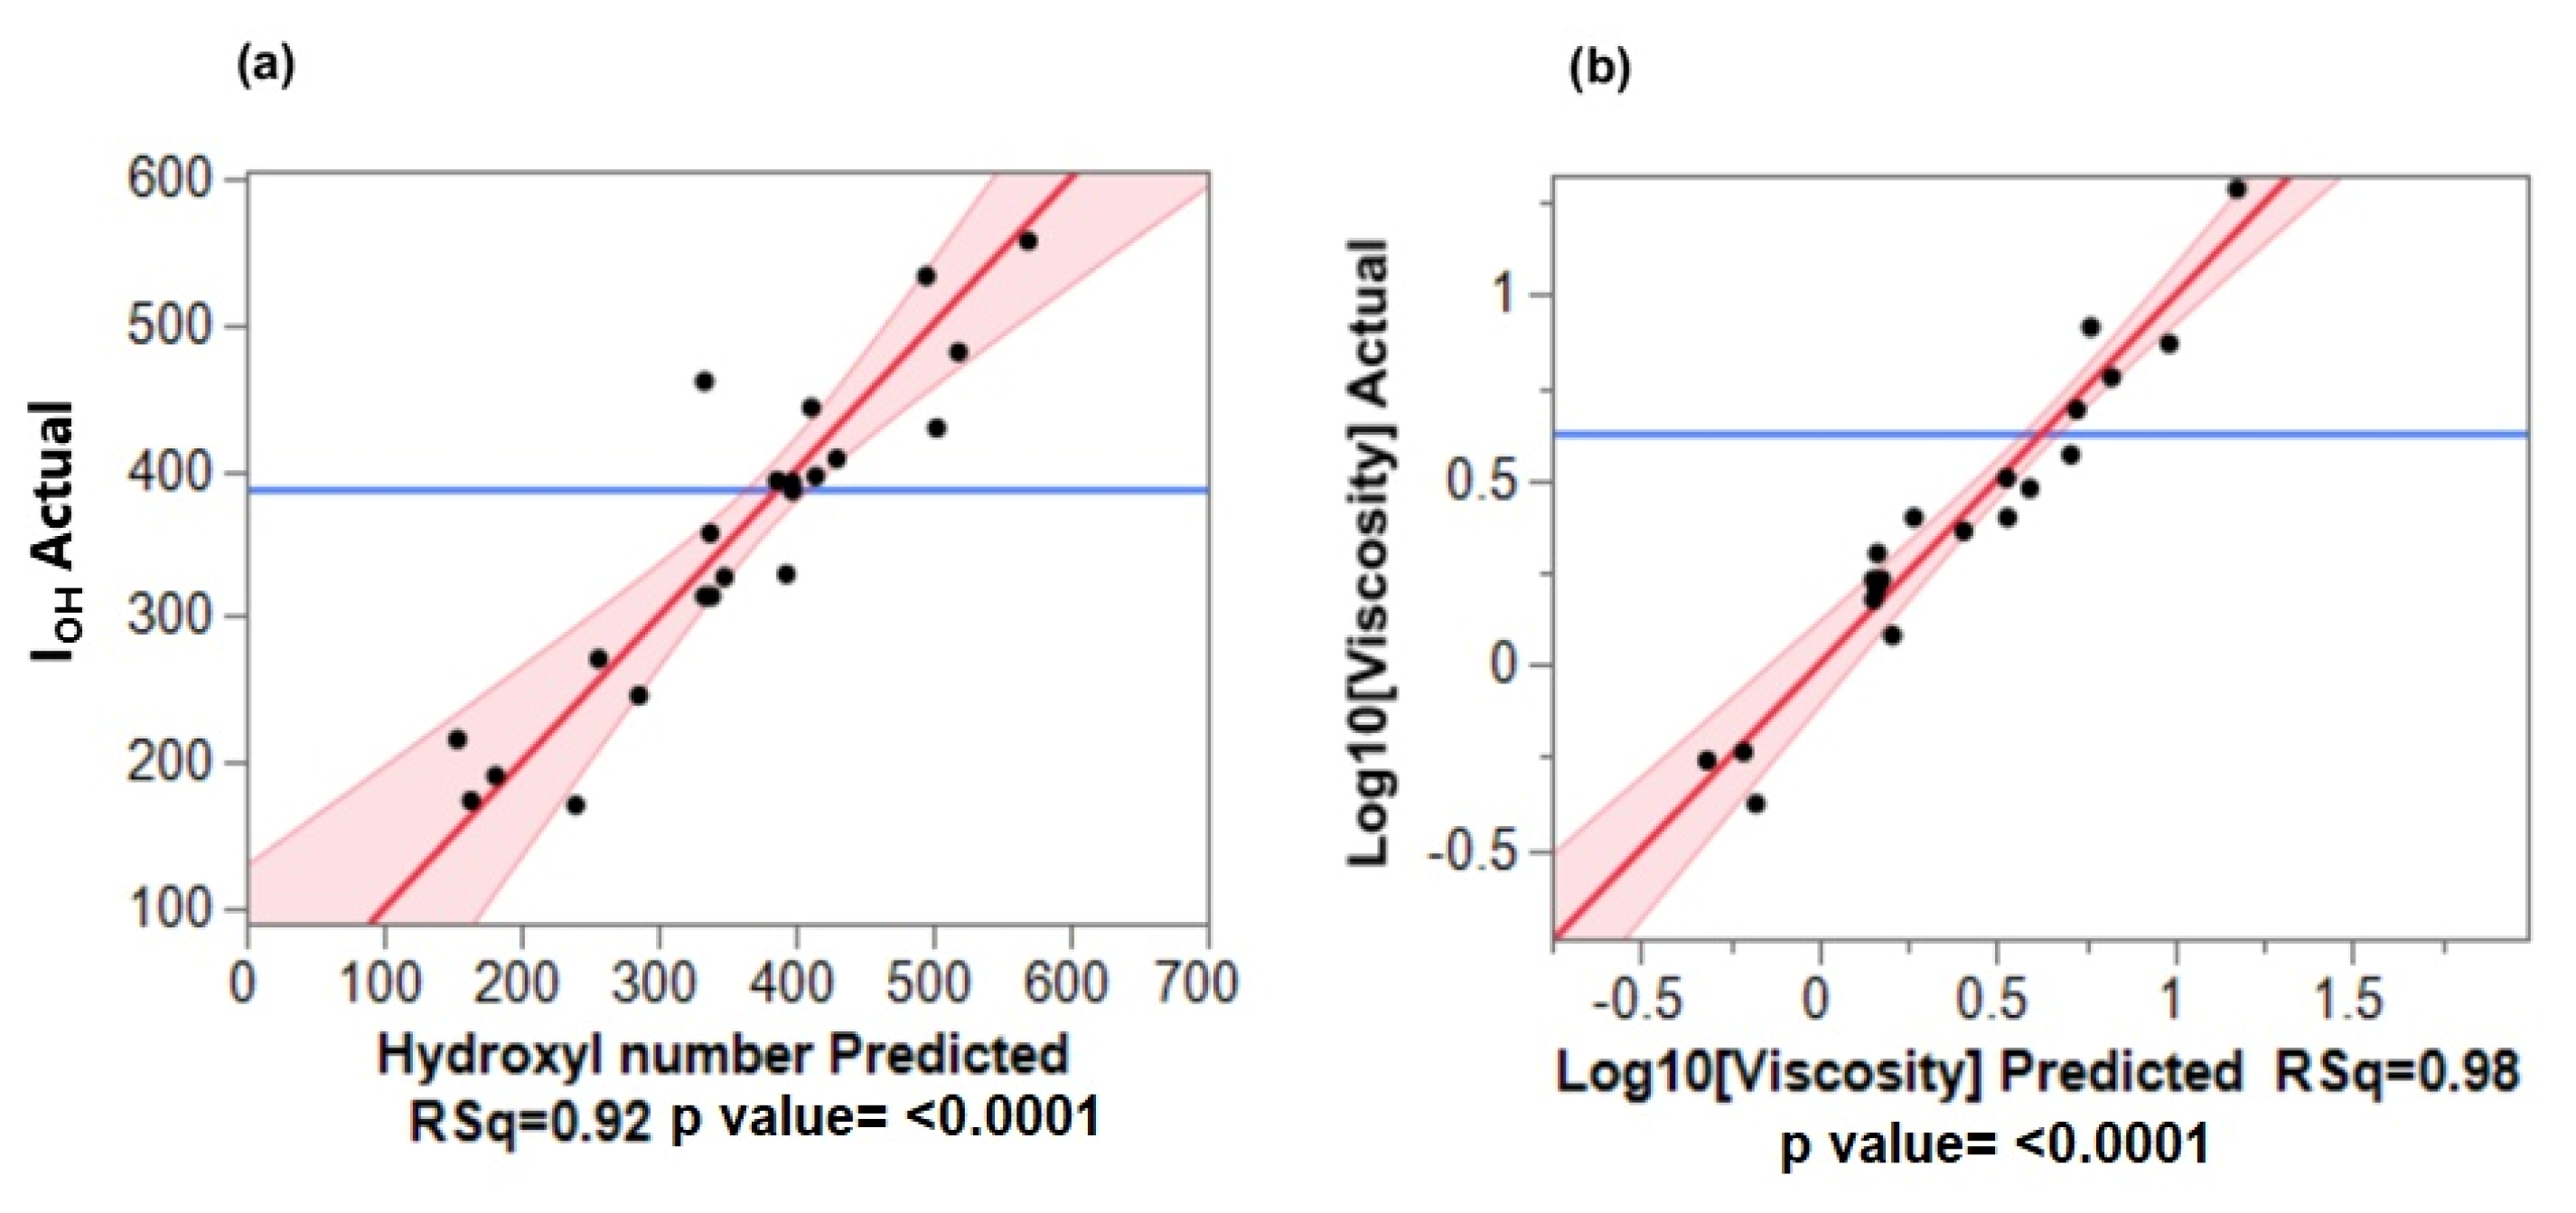
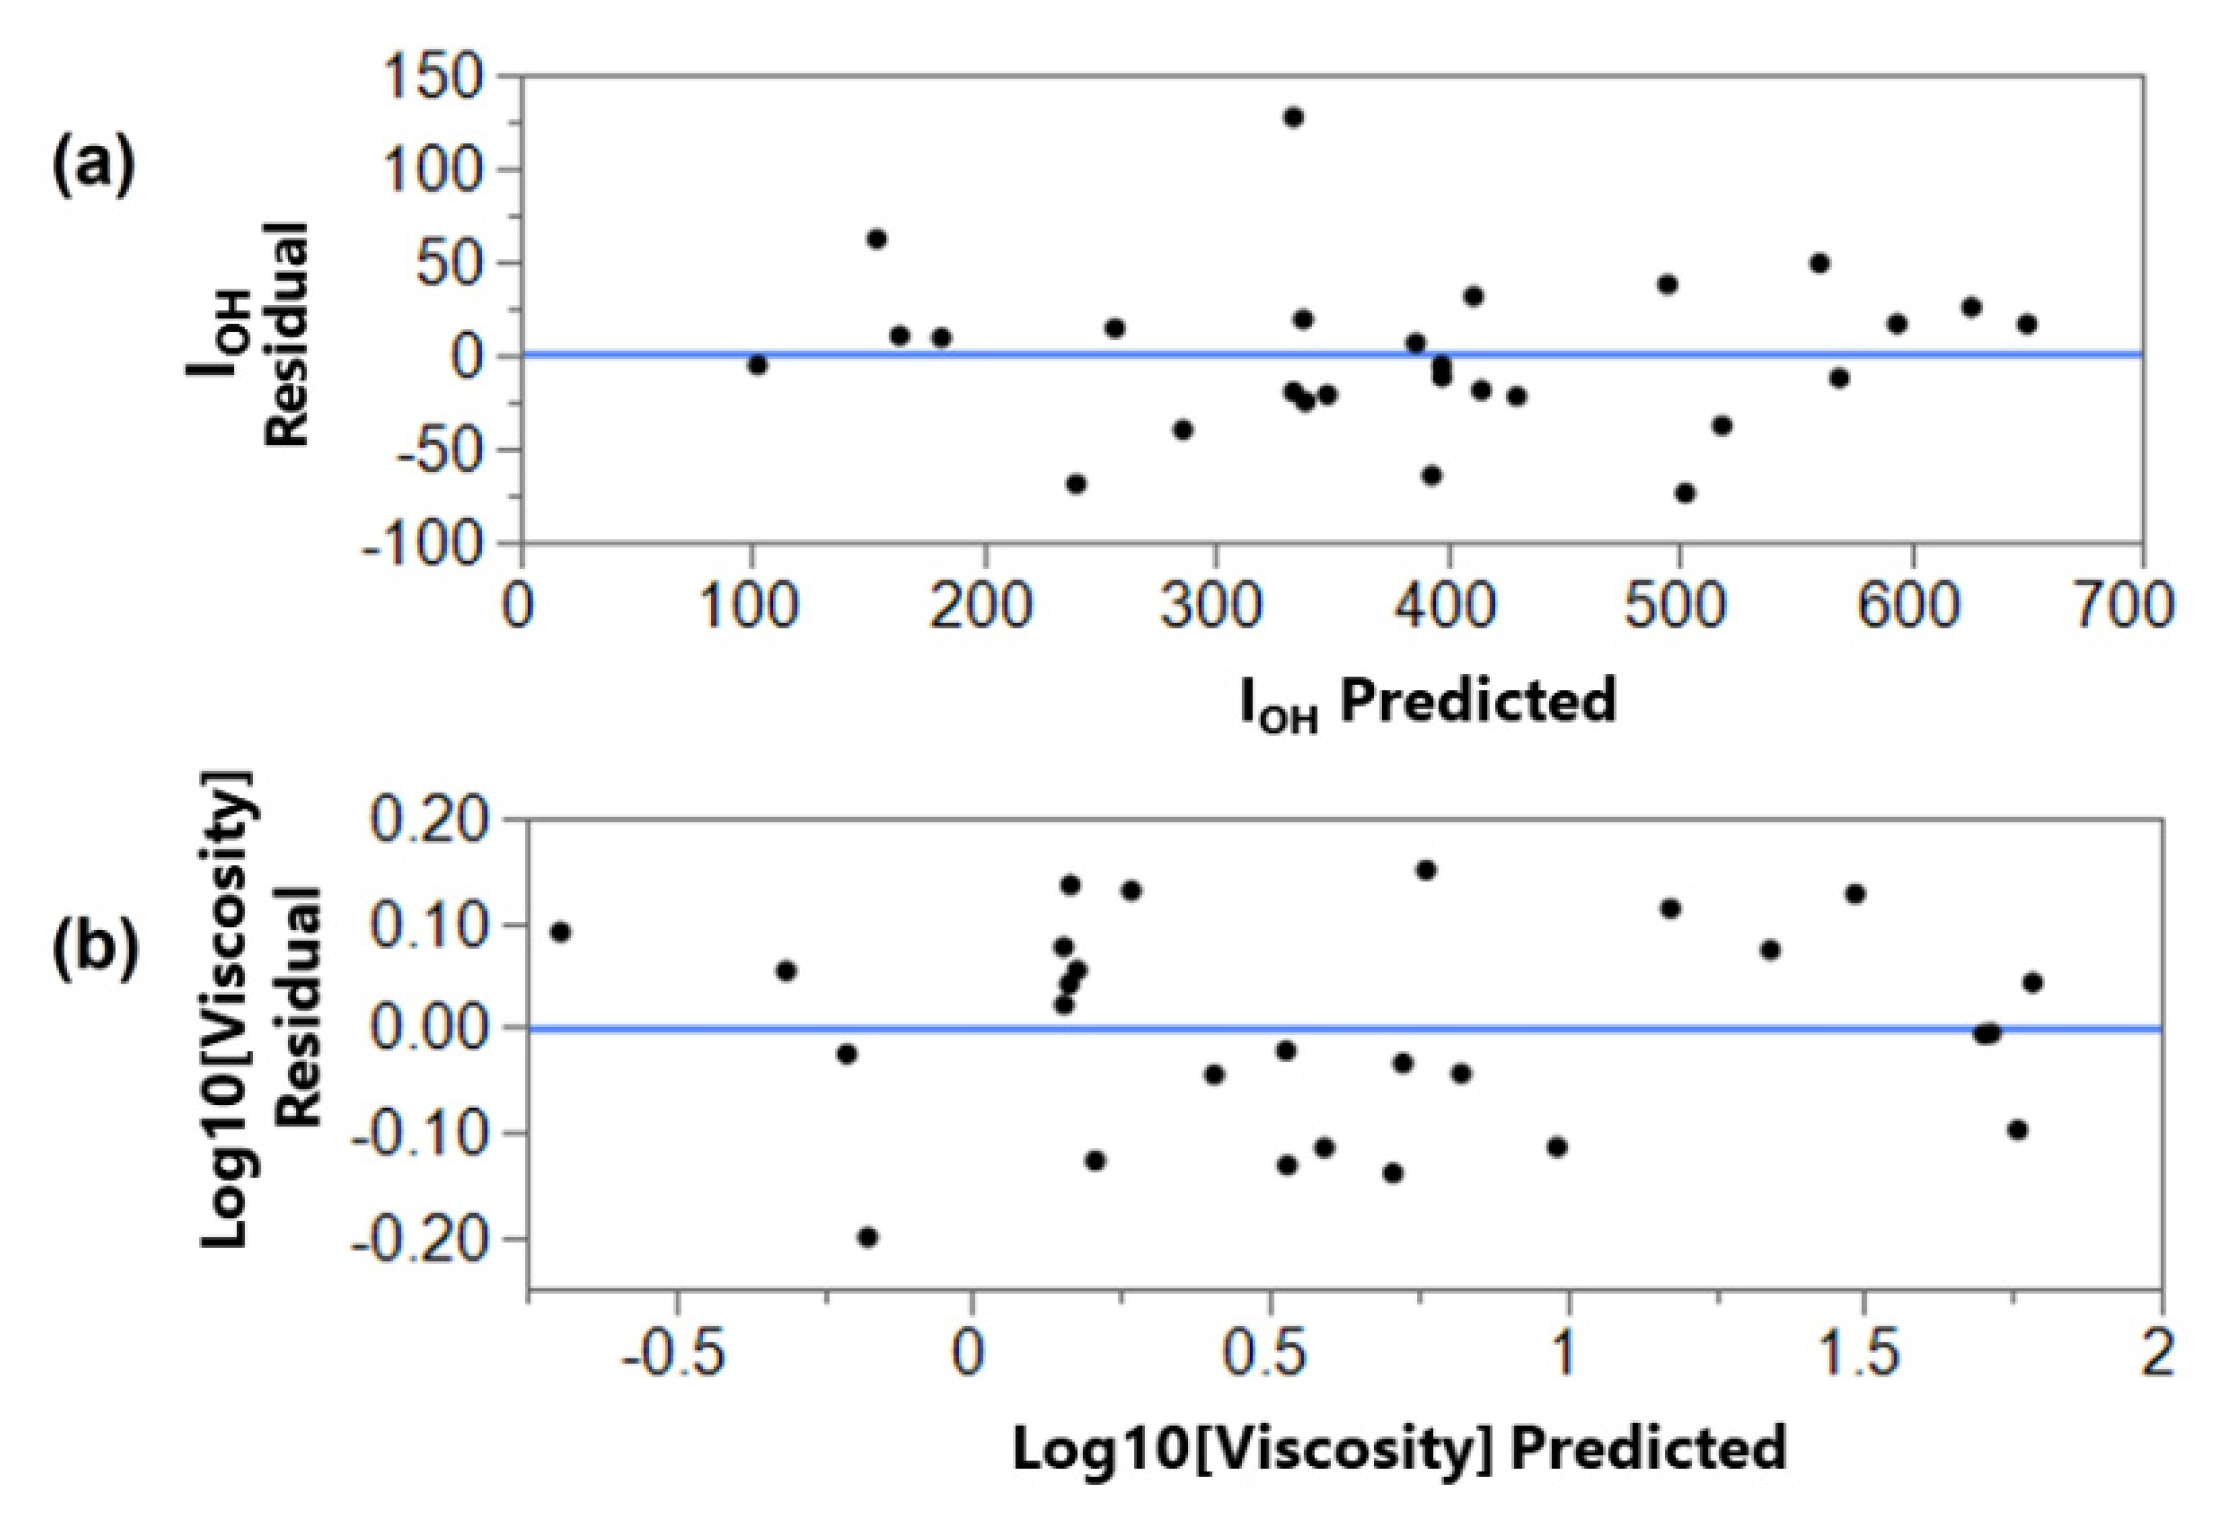
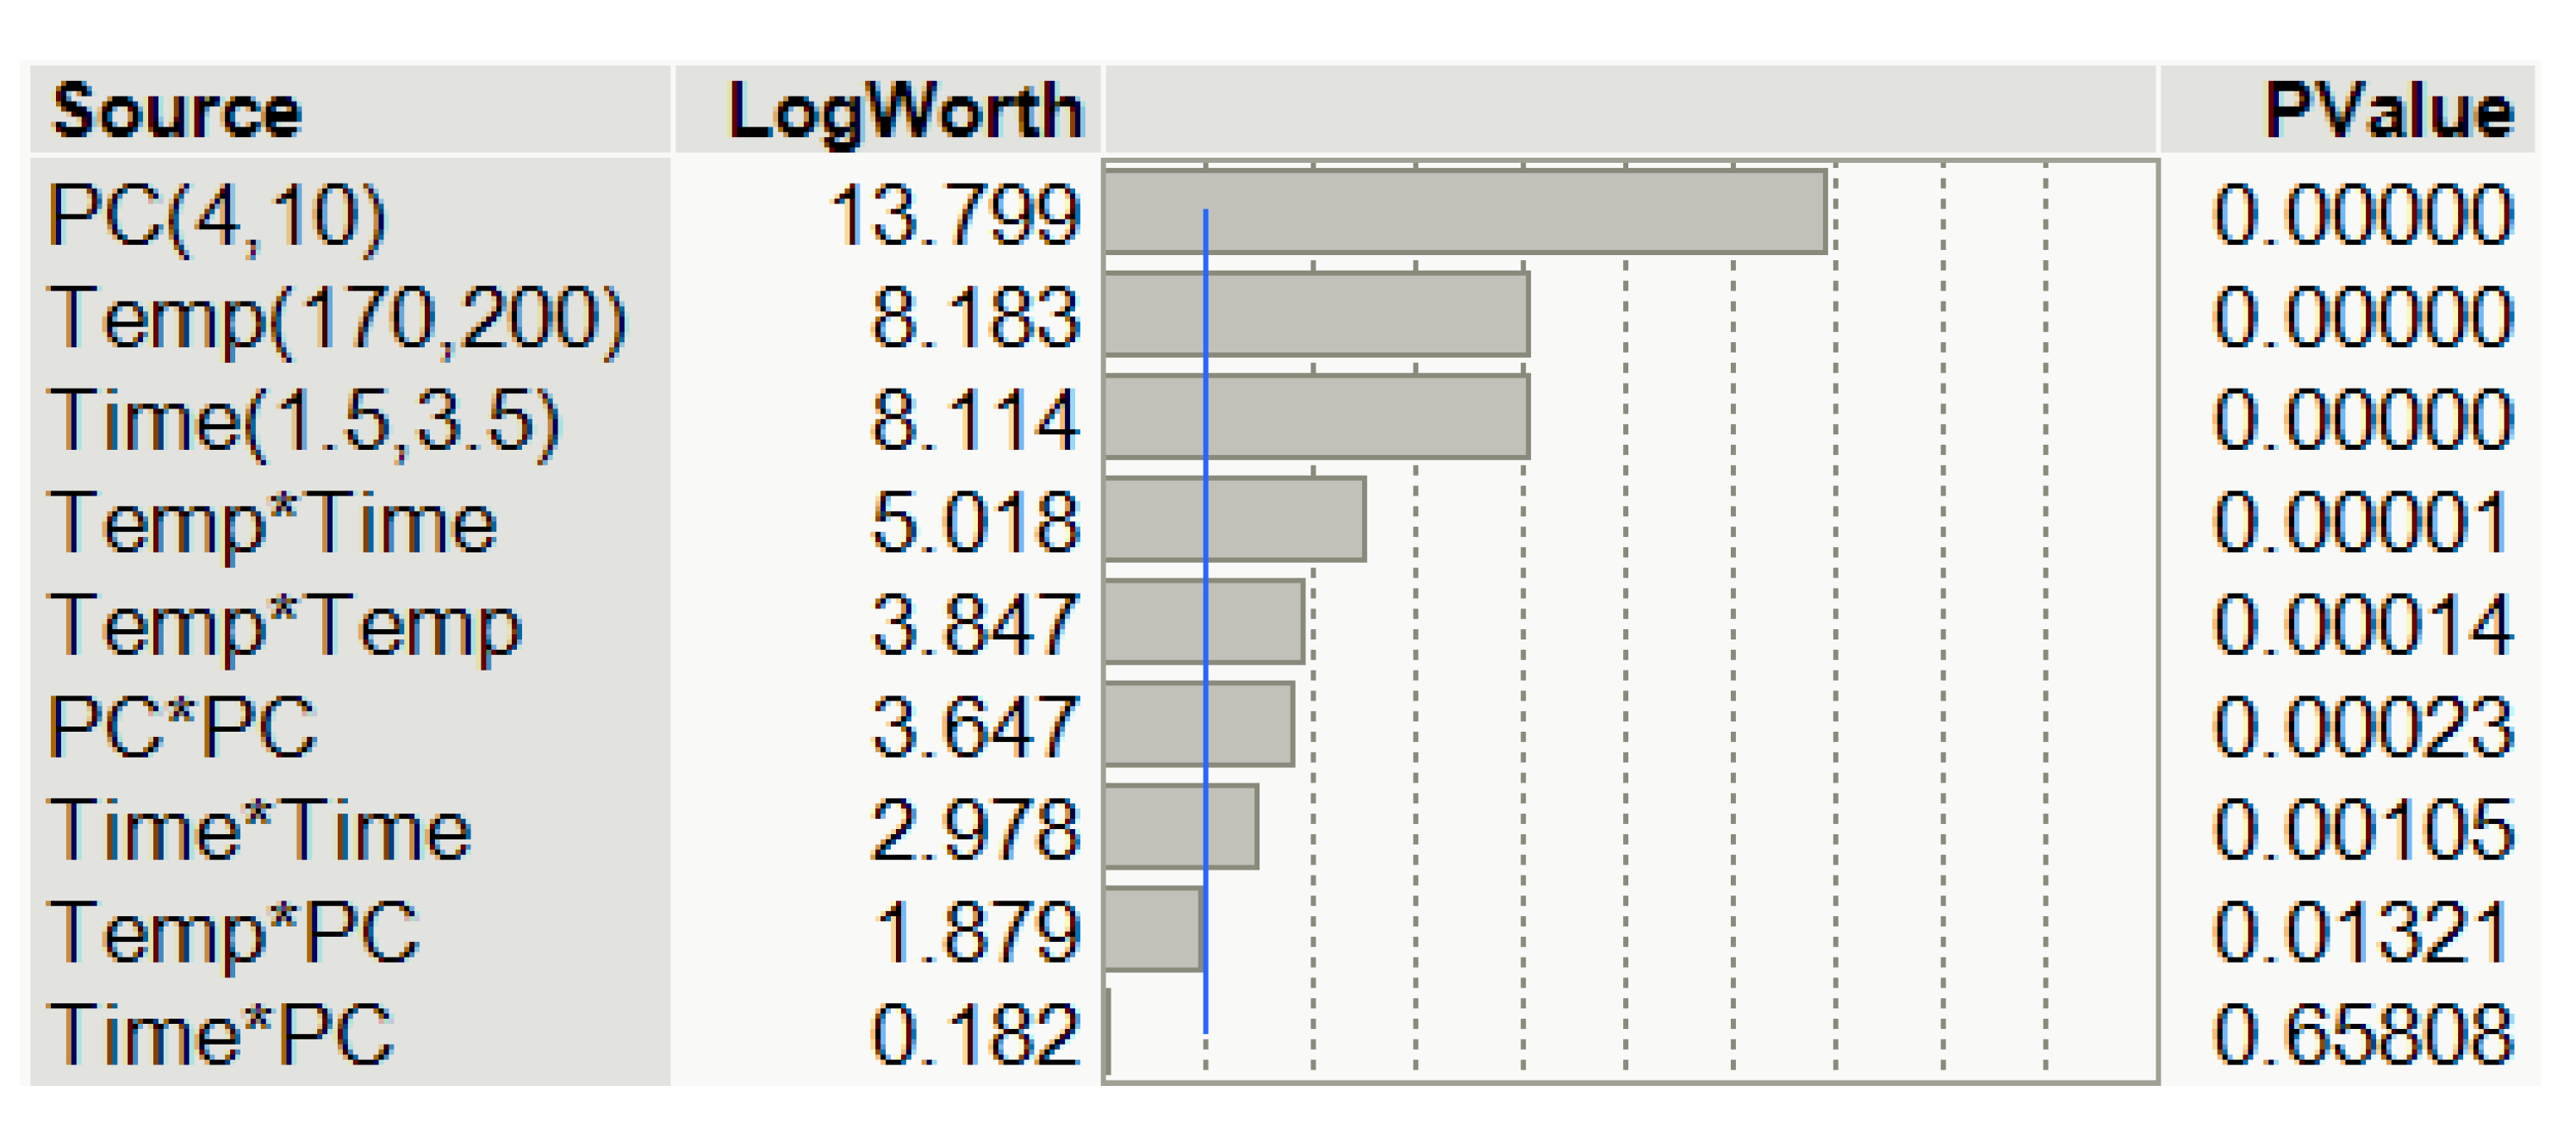
3.1. The Mathematical Model and Its Evaluation
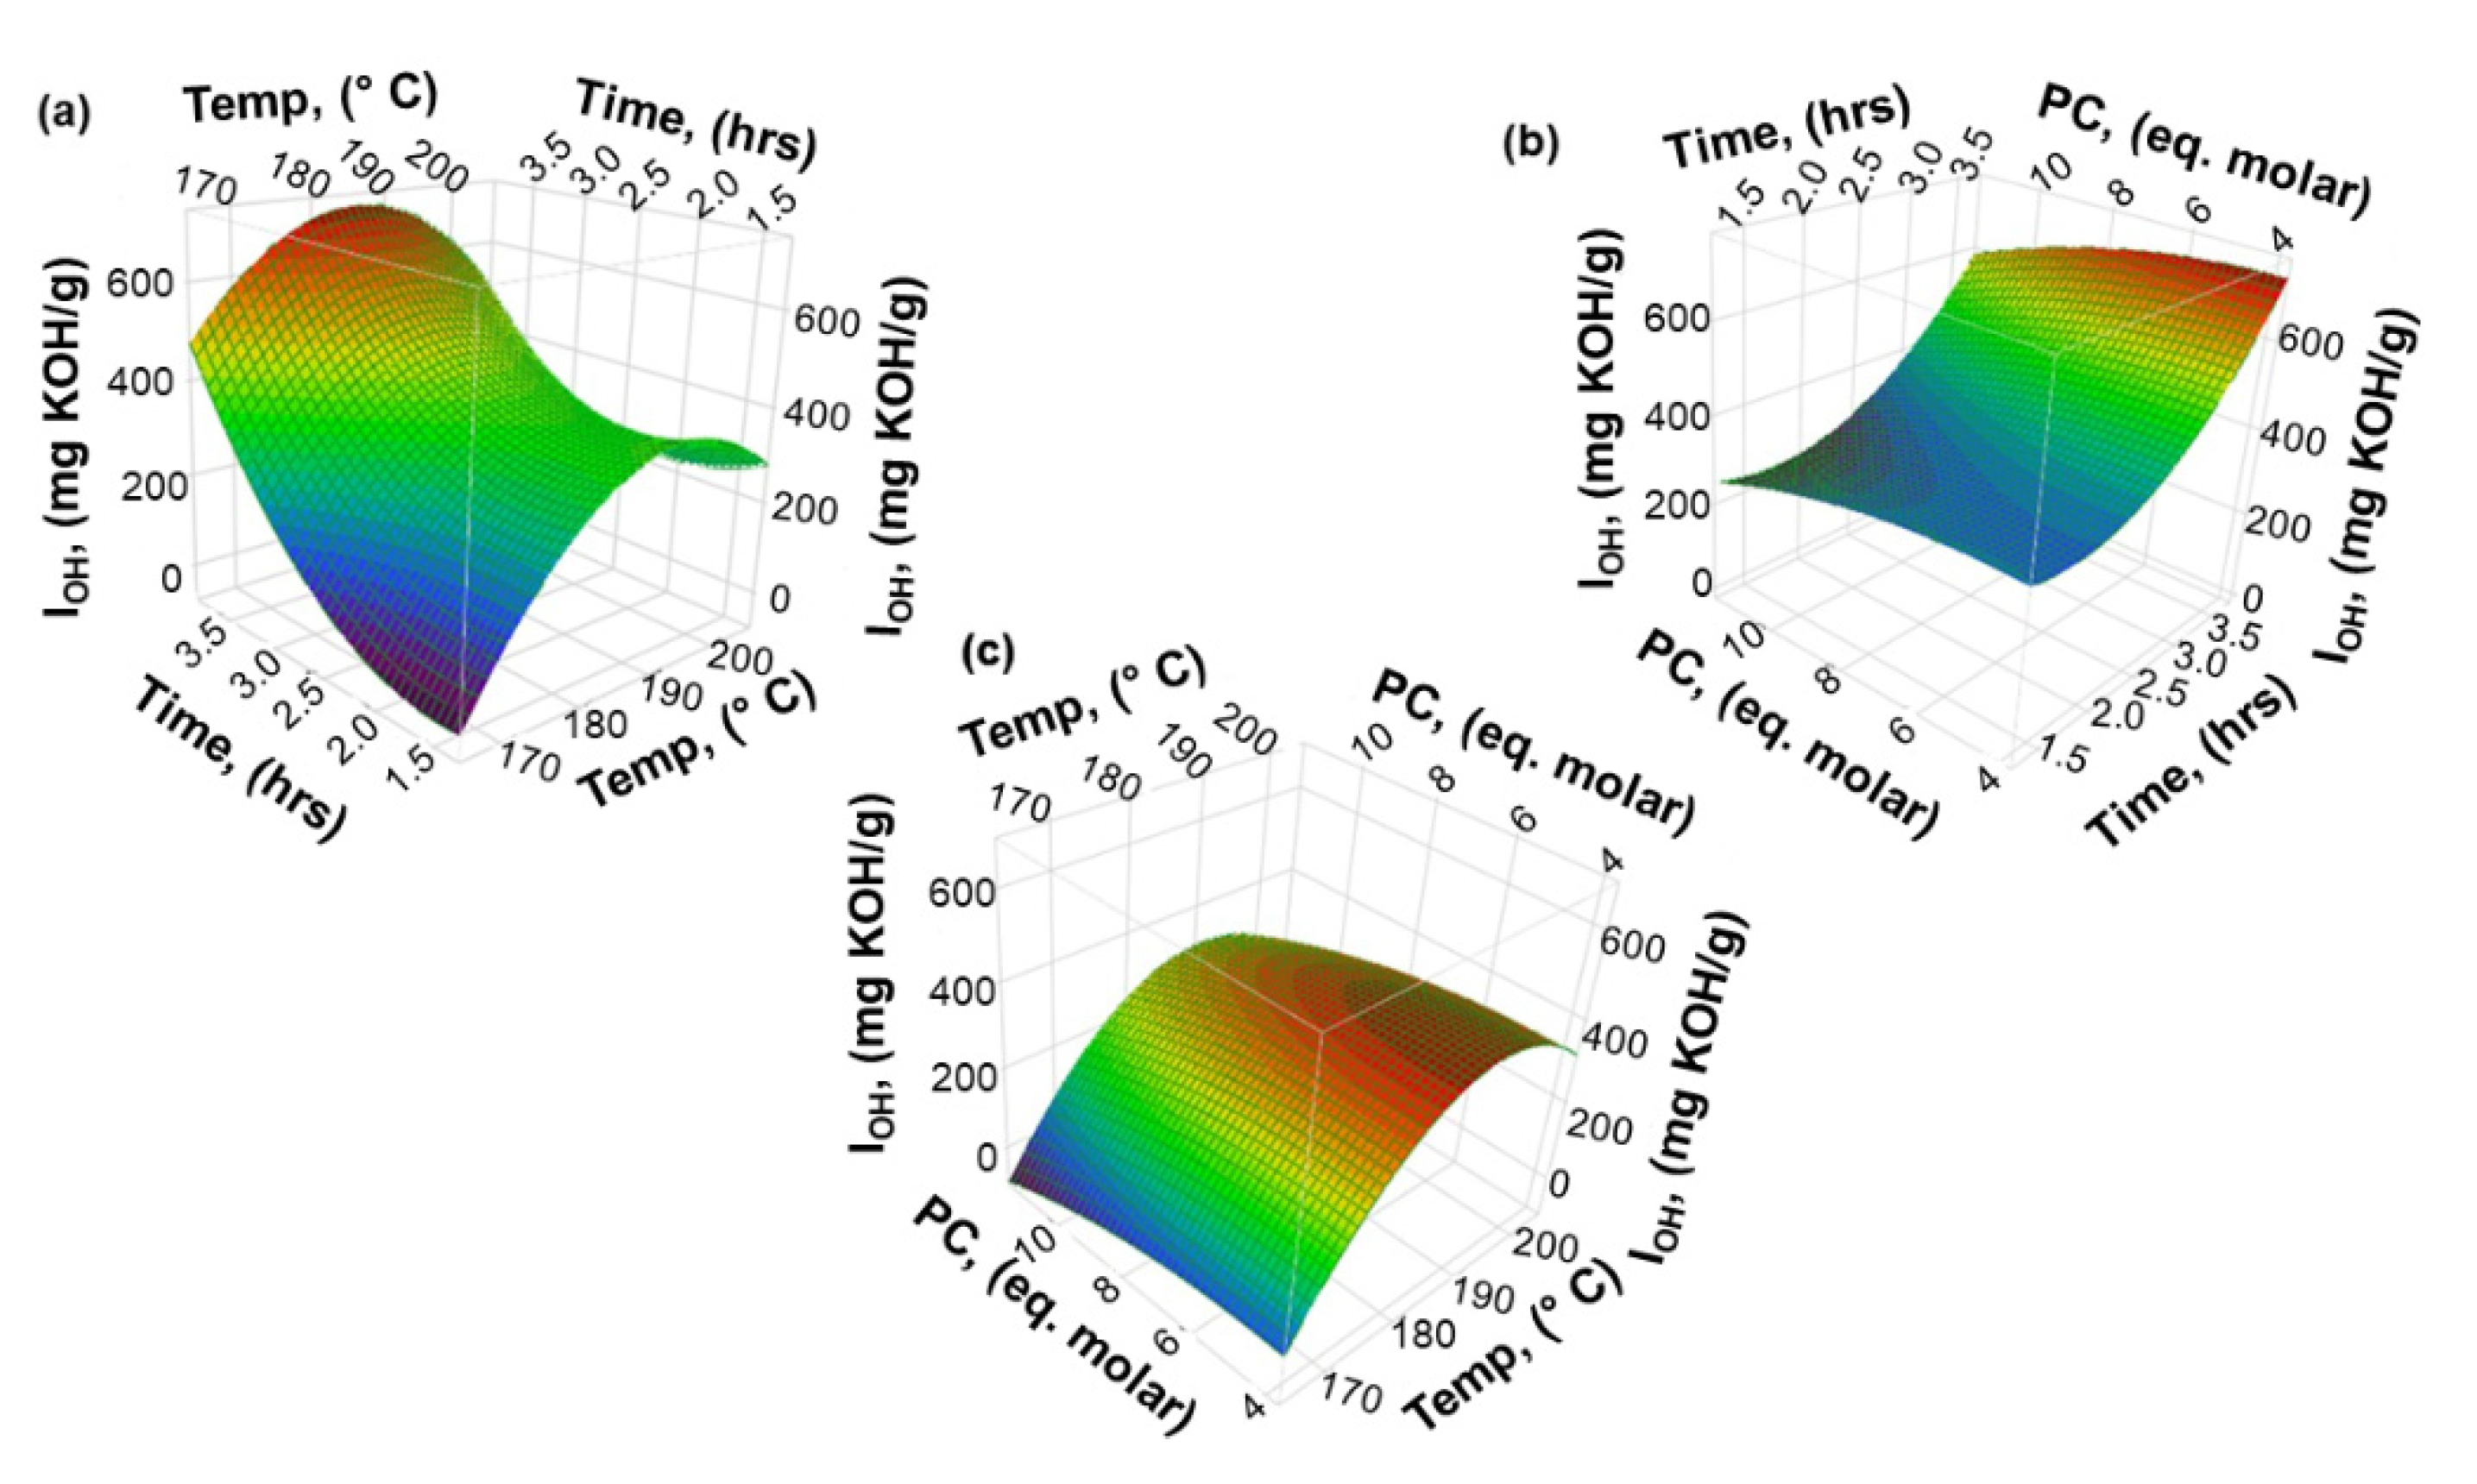
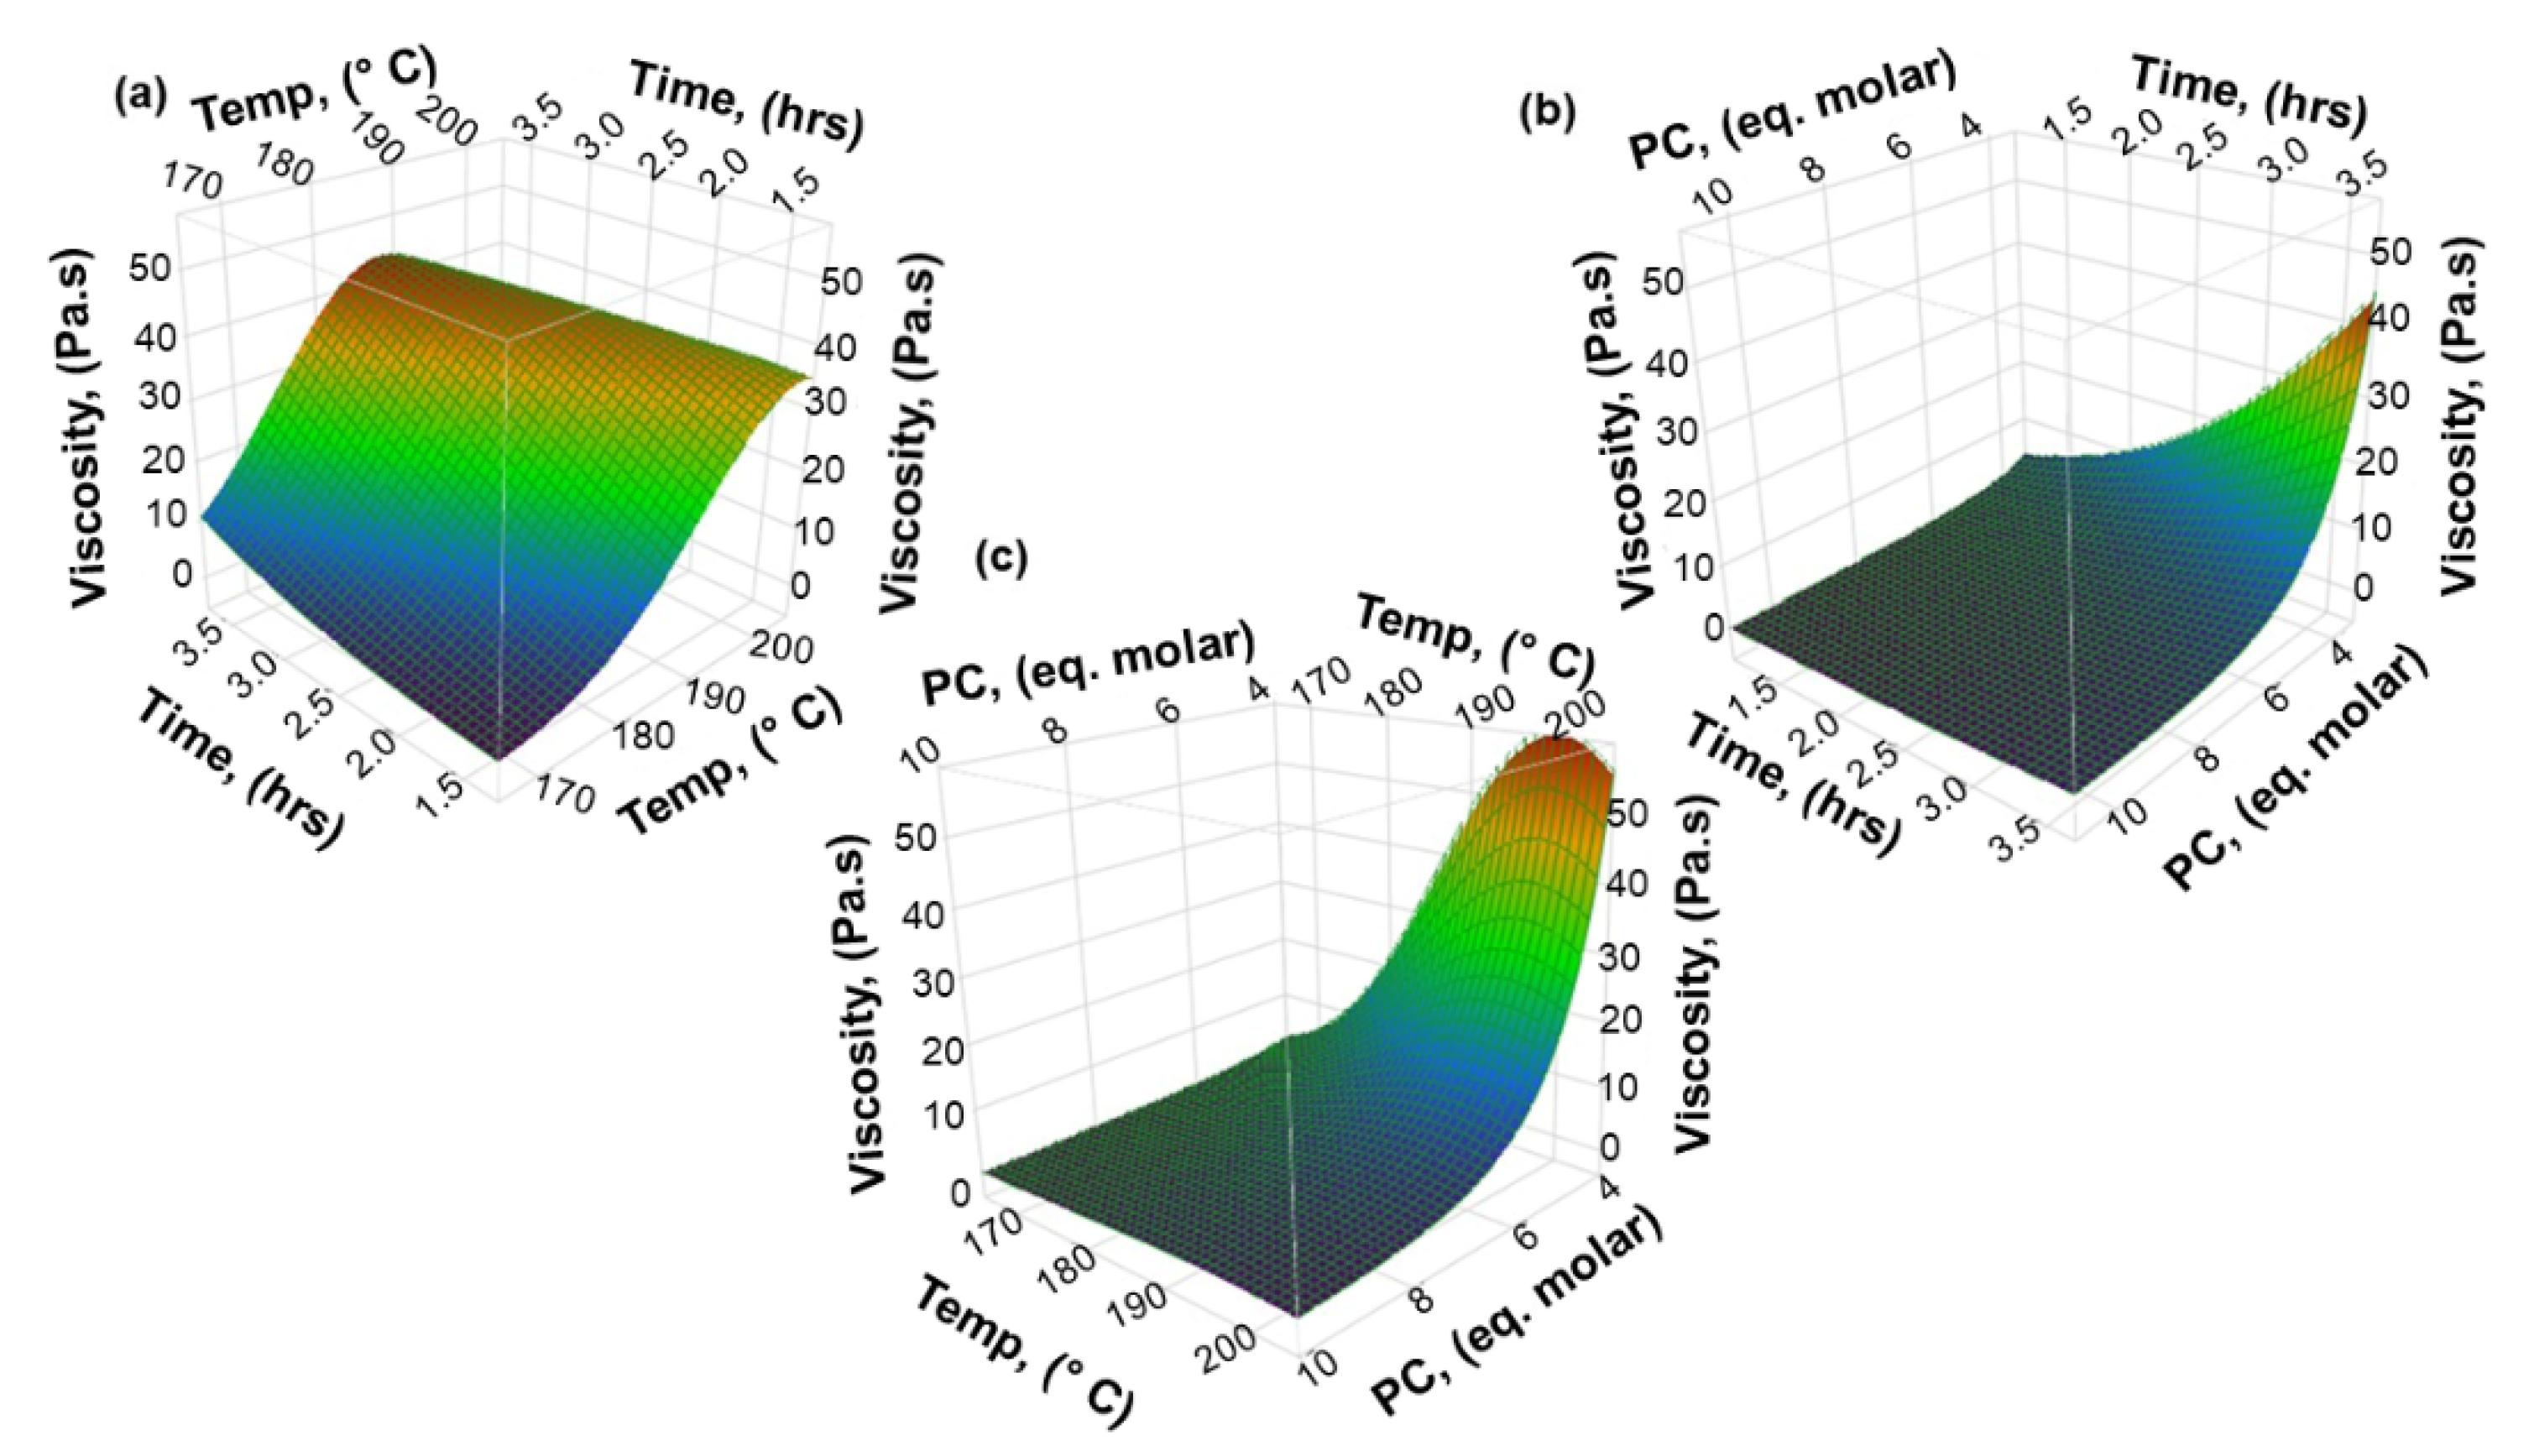
3.2. The Effect of Process Variables on the Hydroxyl Number and Viscosity of Lignin-Based Polyol
3.2.1. Hydroxyl Number (IOH)
3.2.2. Viscosity
3.3. Validation of the Fitted Regression Models
3.4. Optimization of the Process
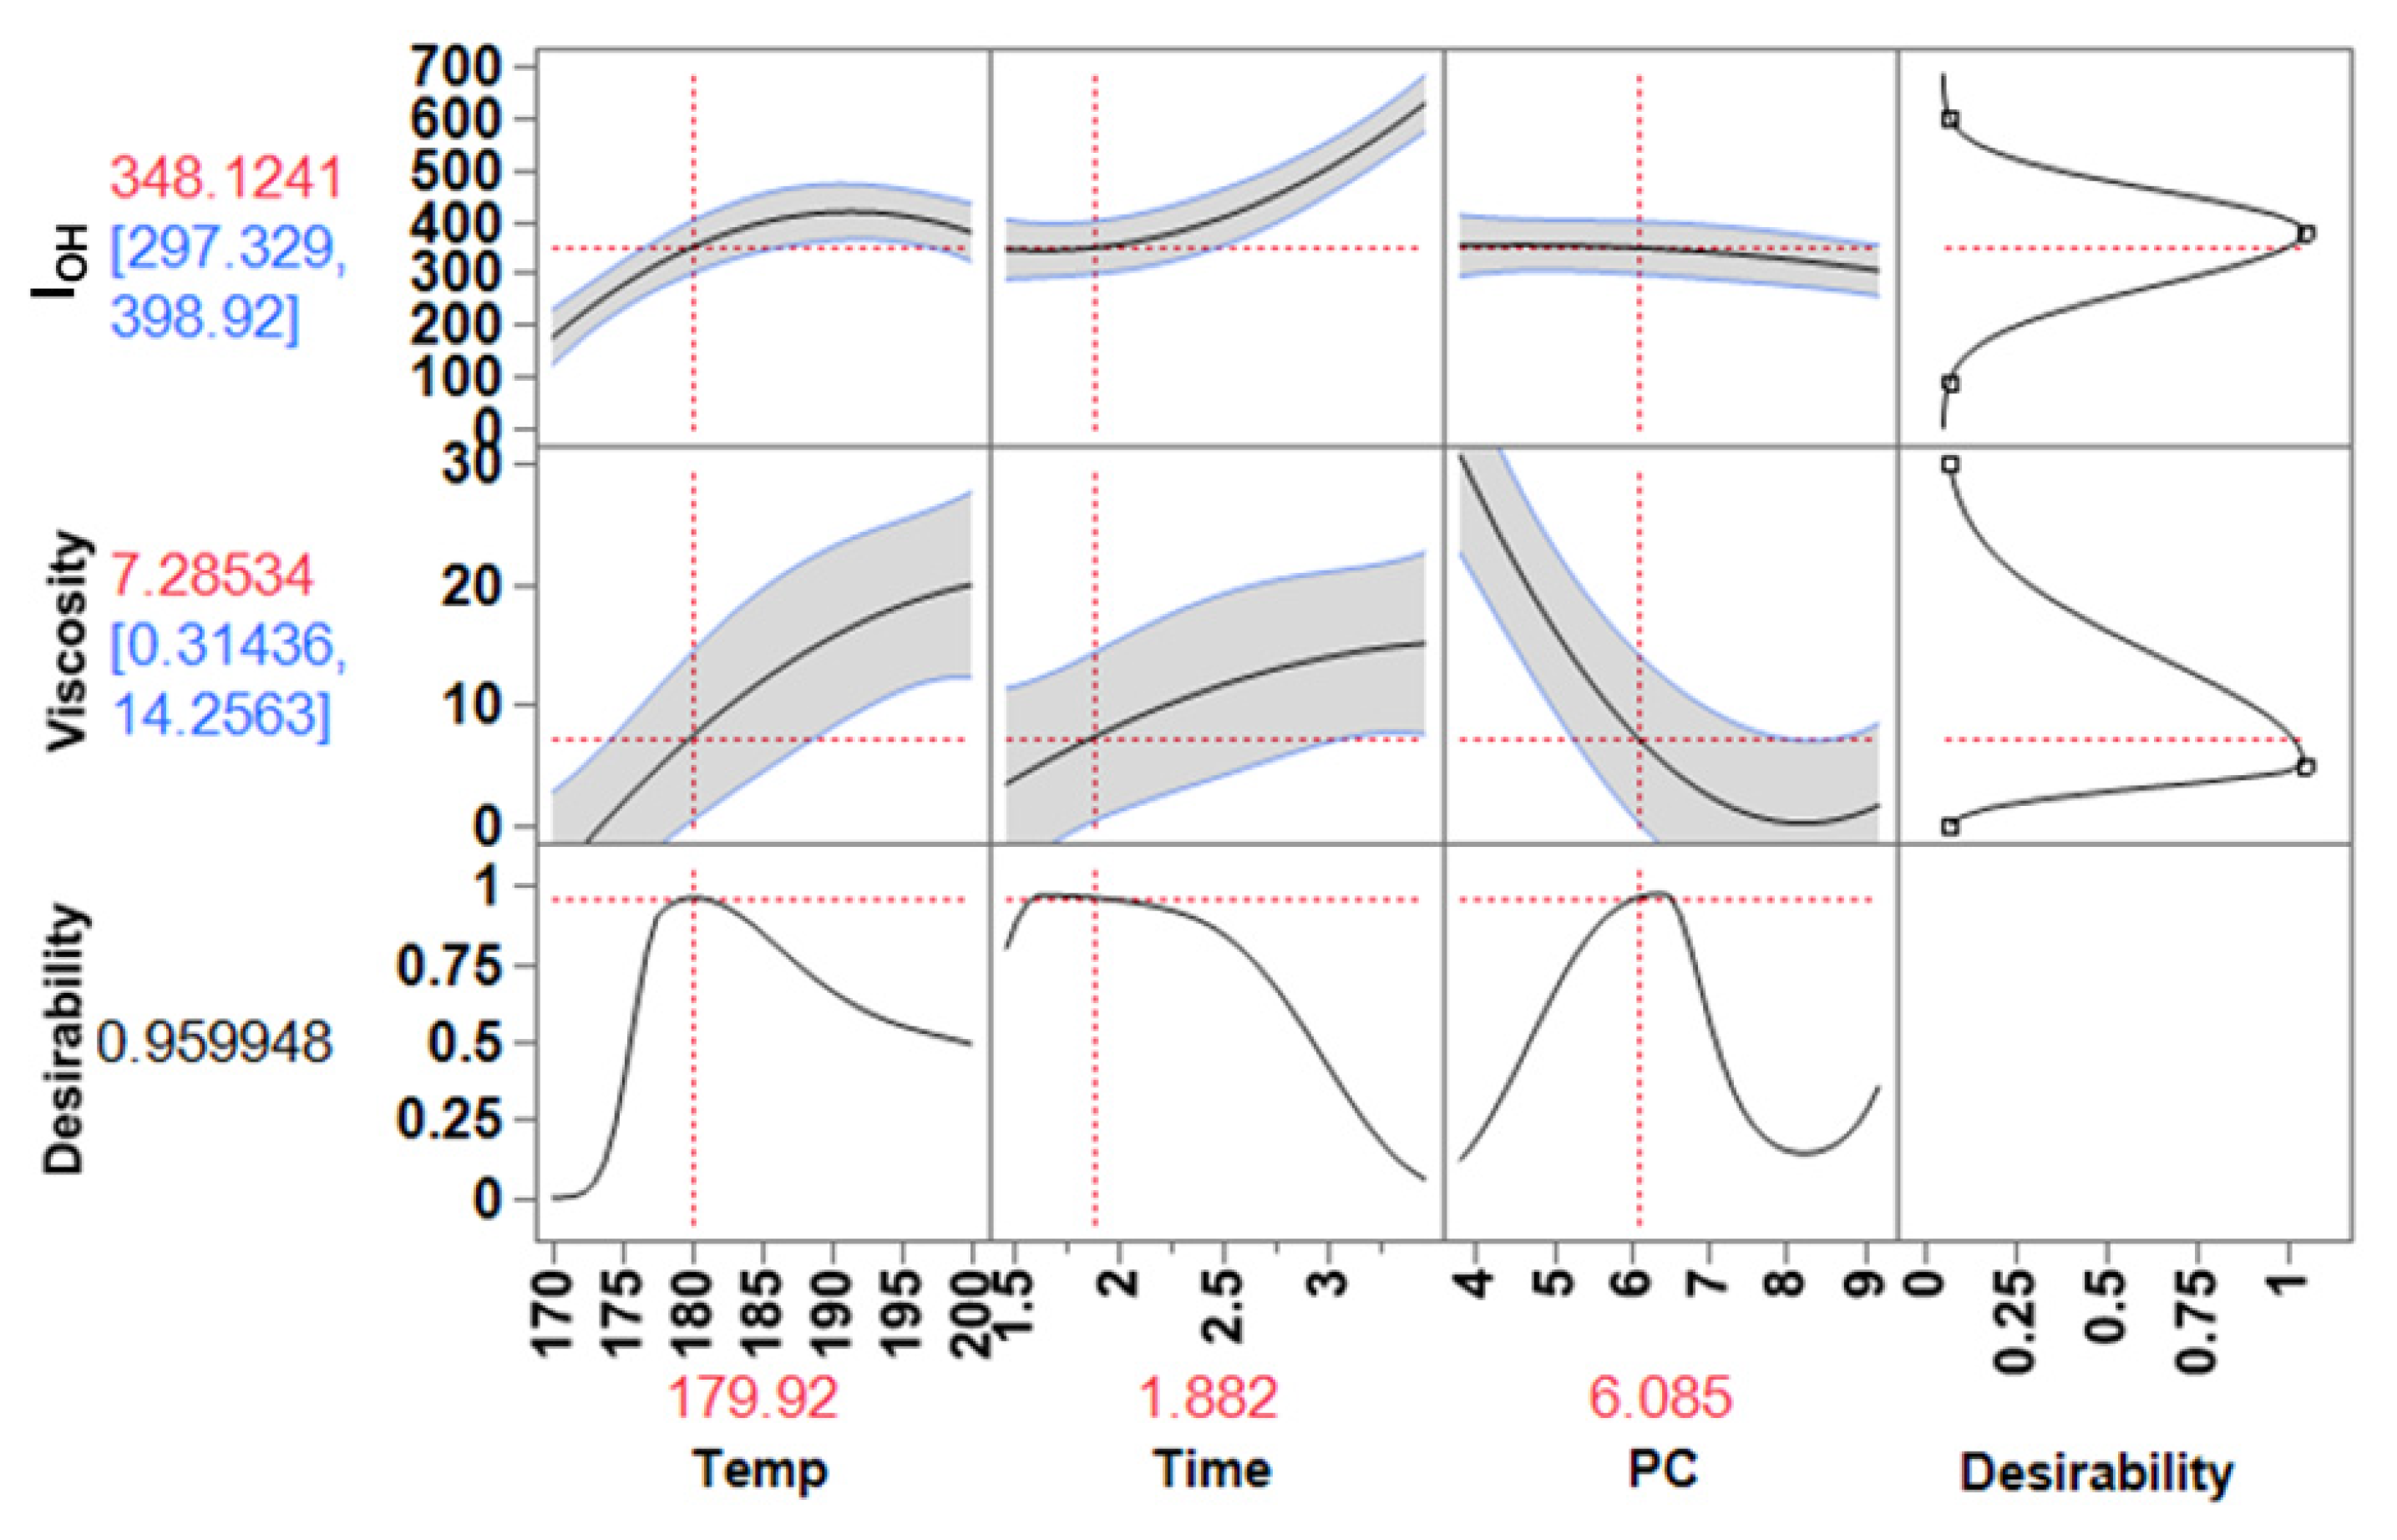
3.4.1. Rigid Foams
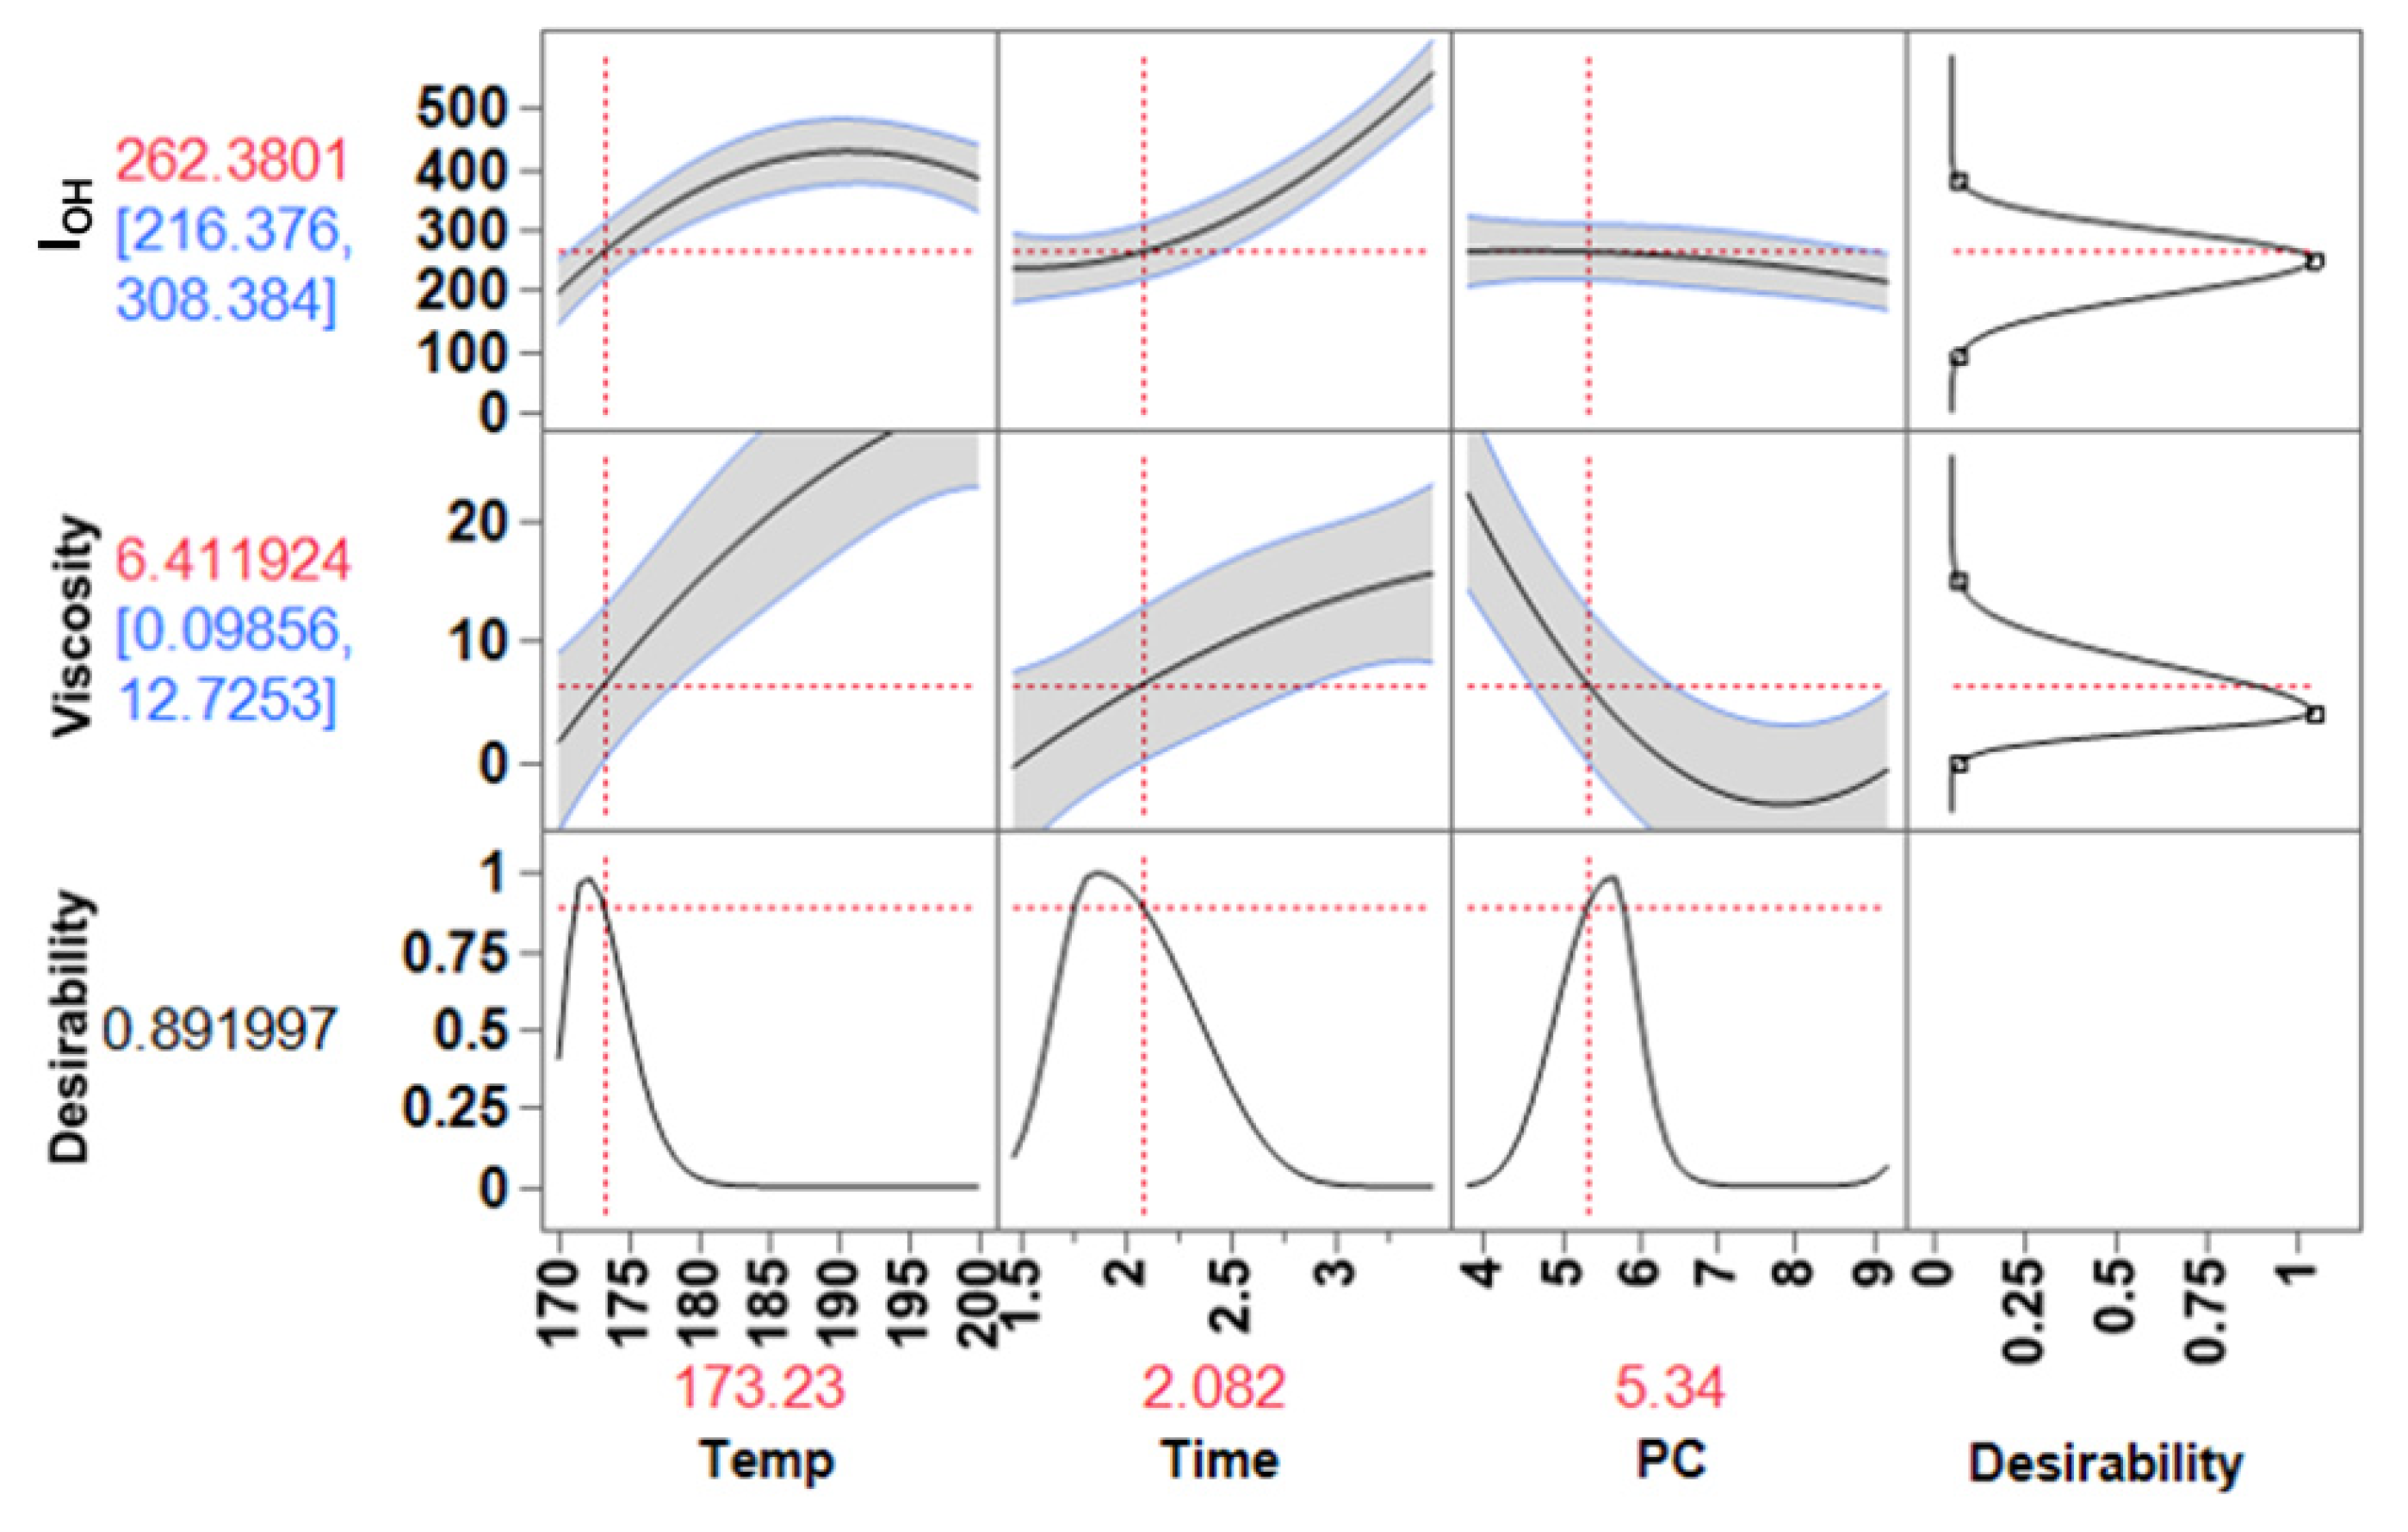
3.4.2. Adhesives
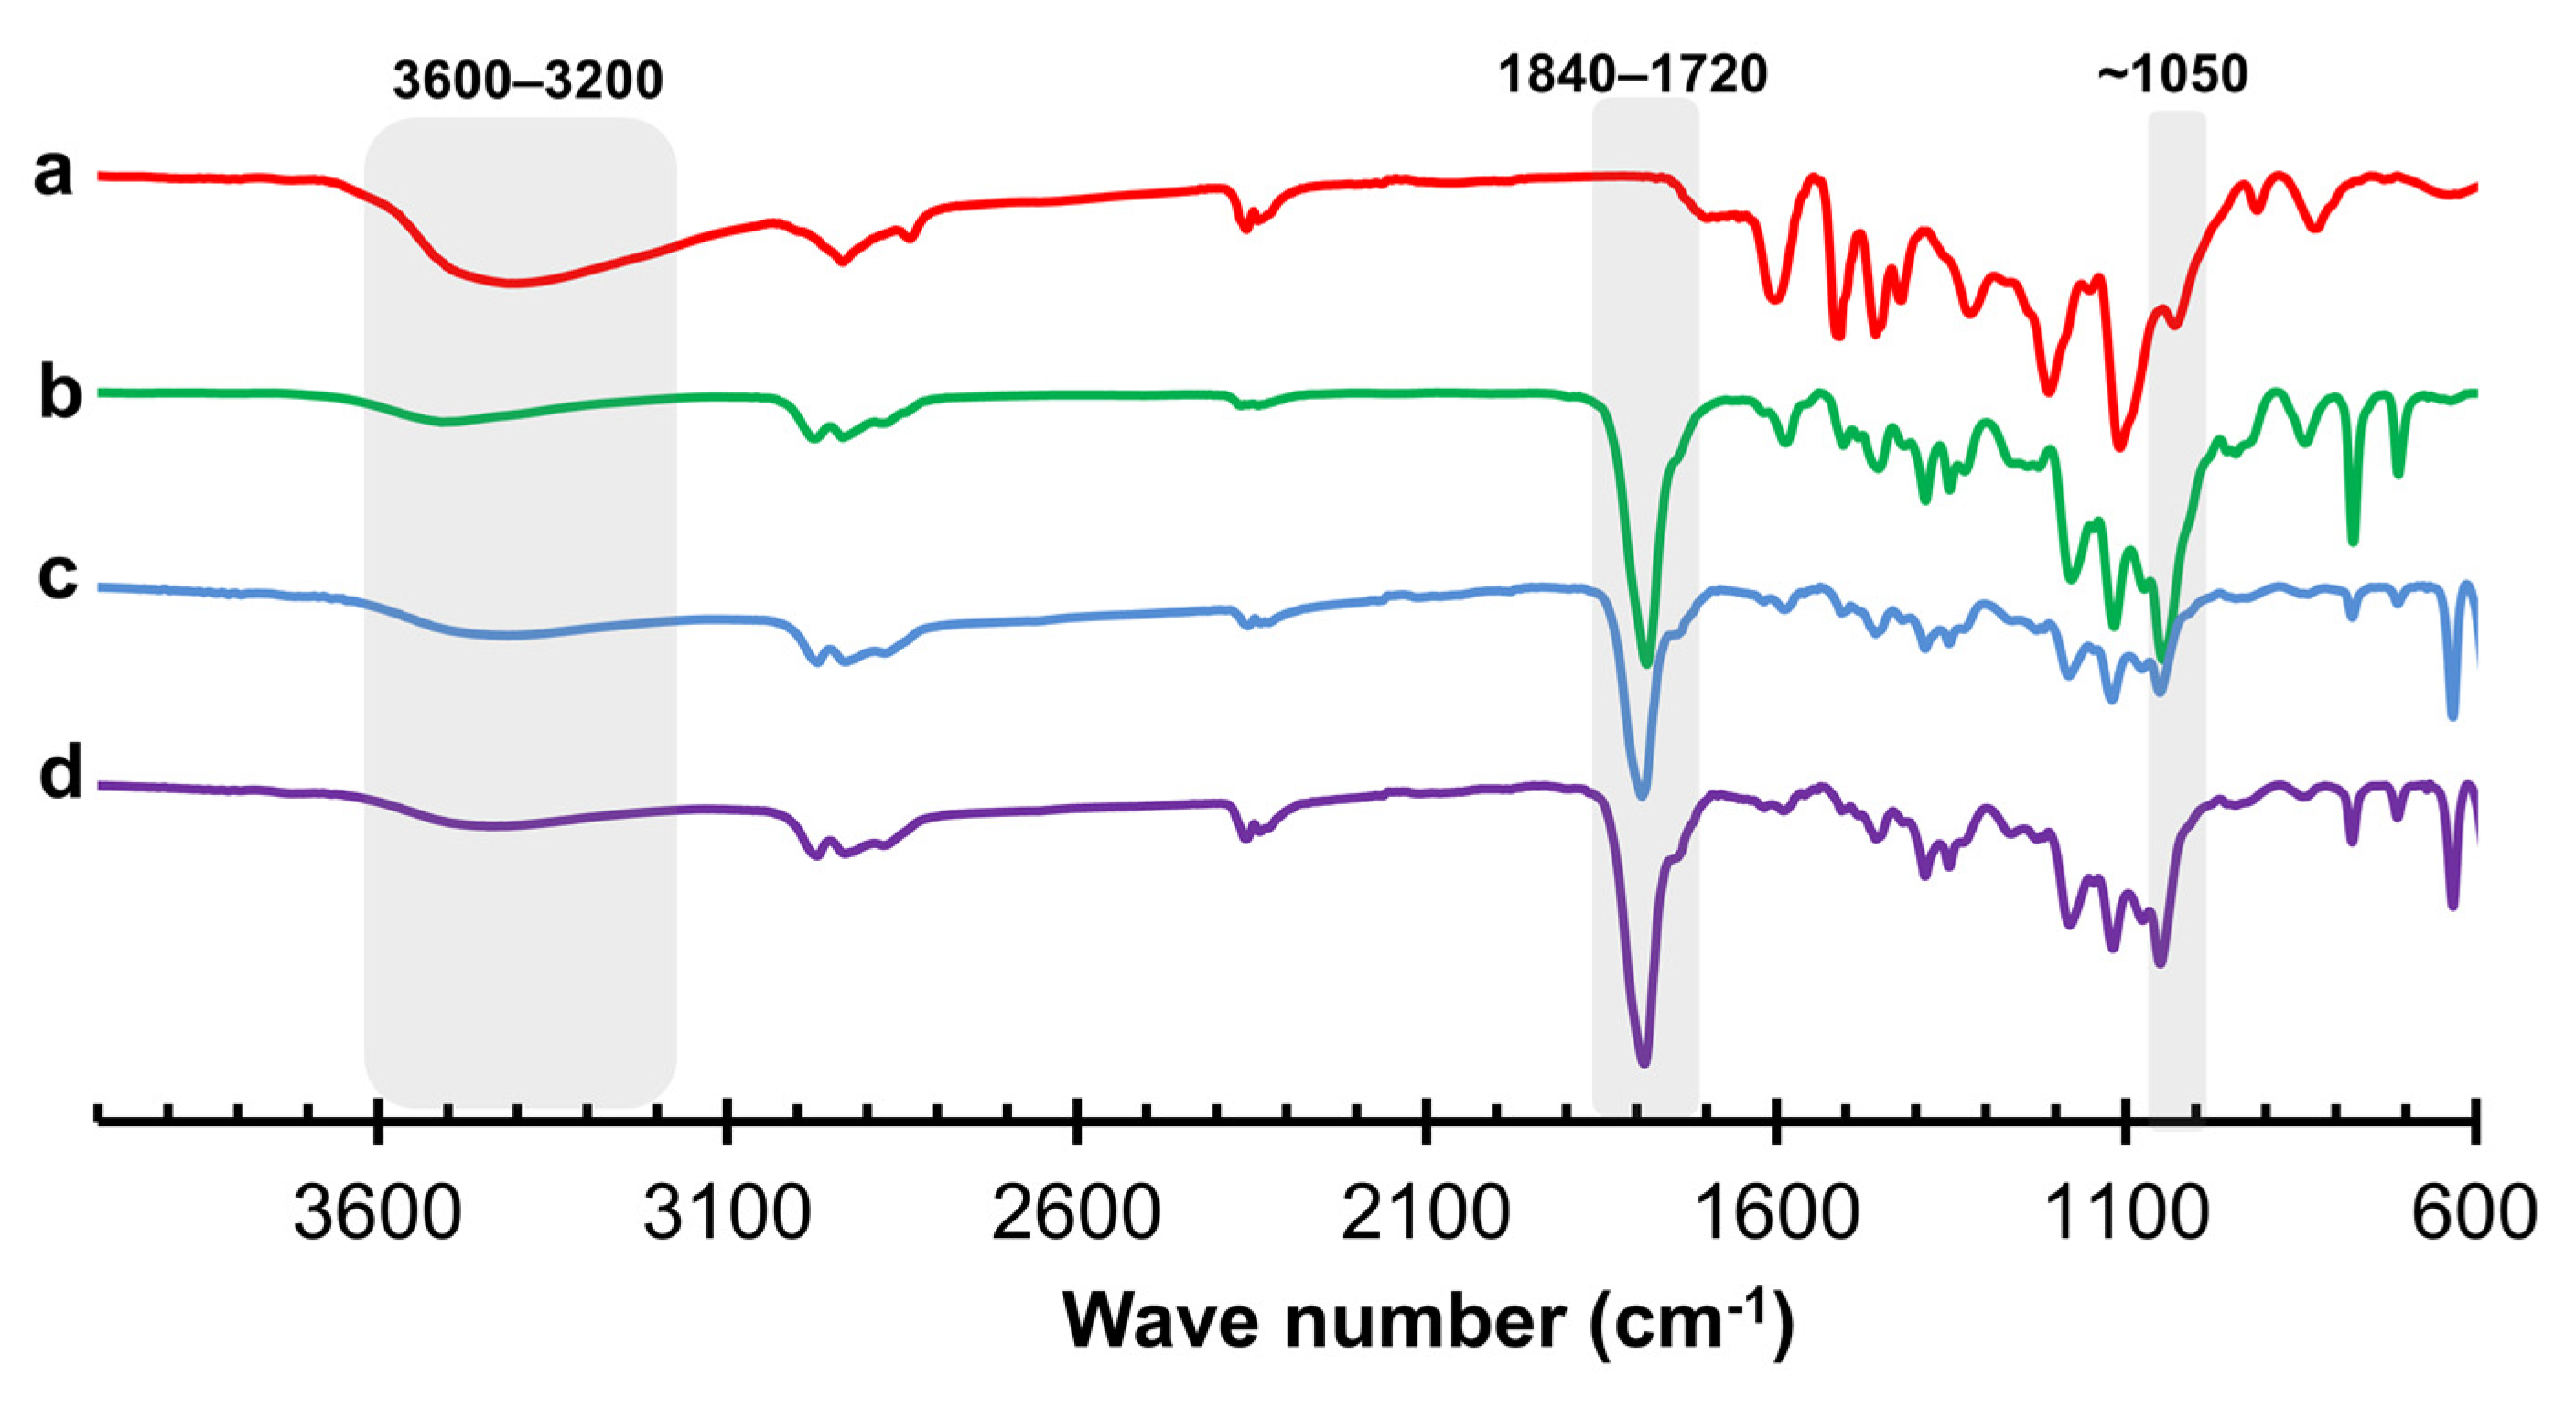
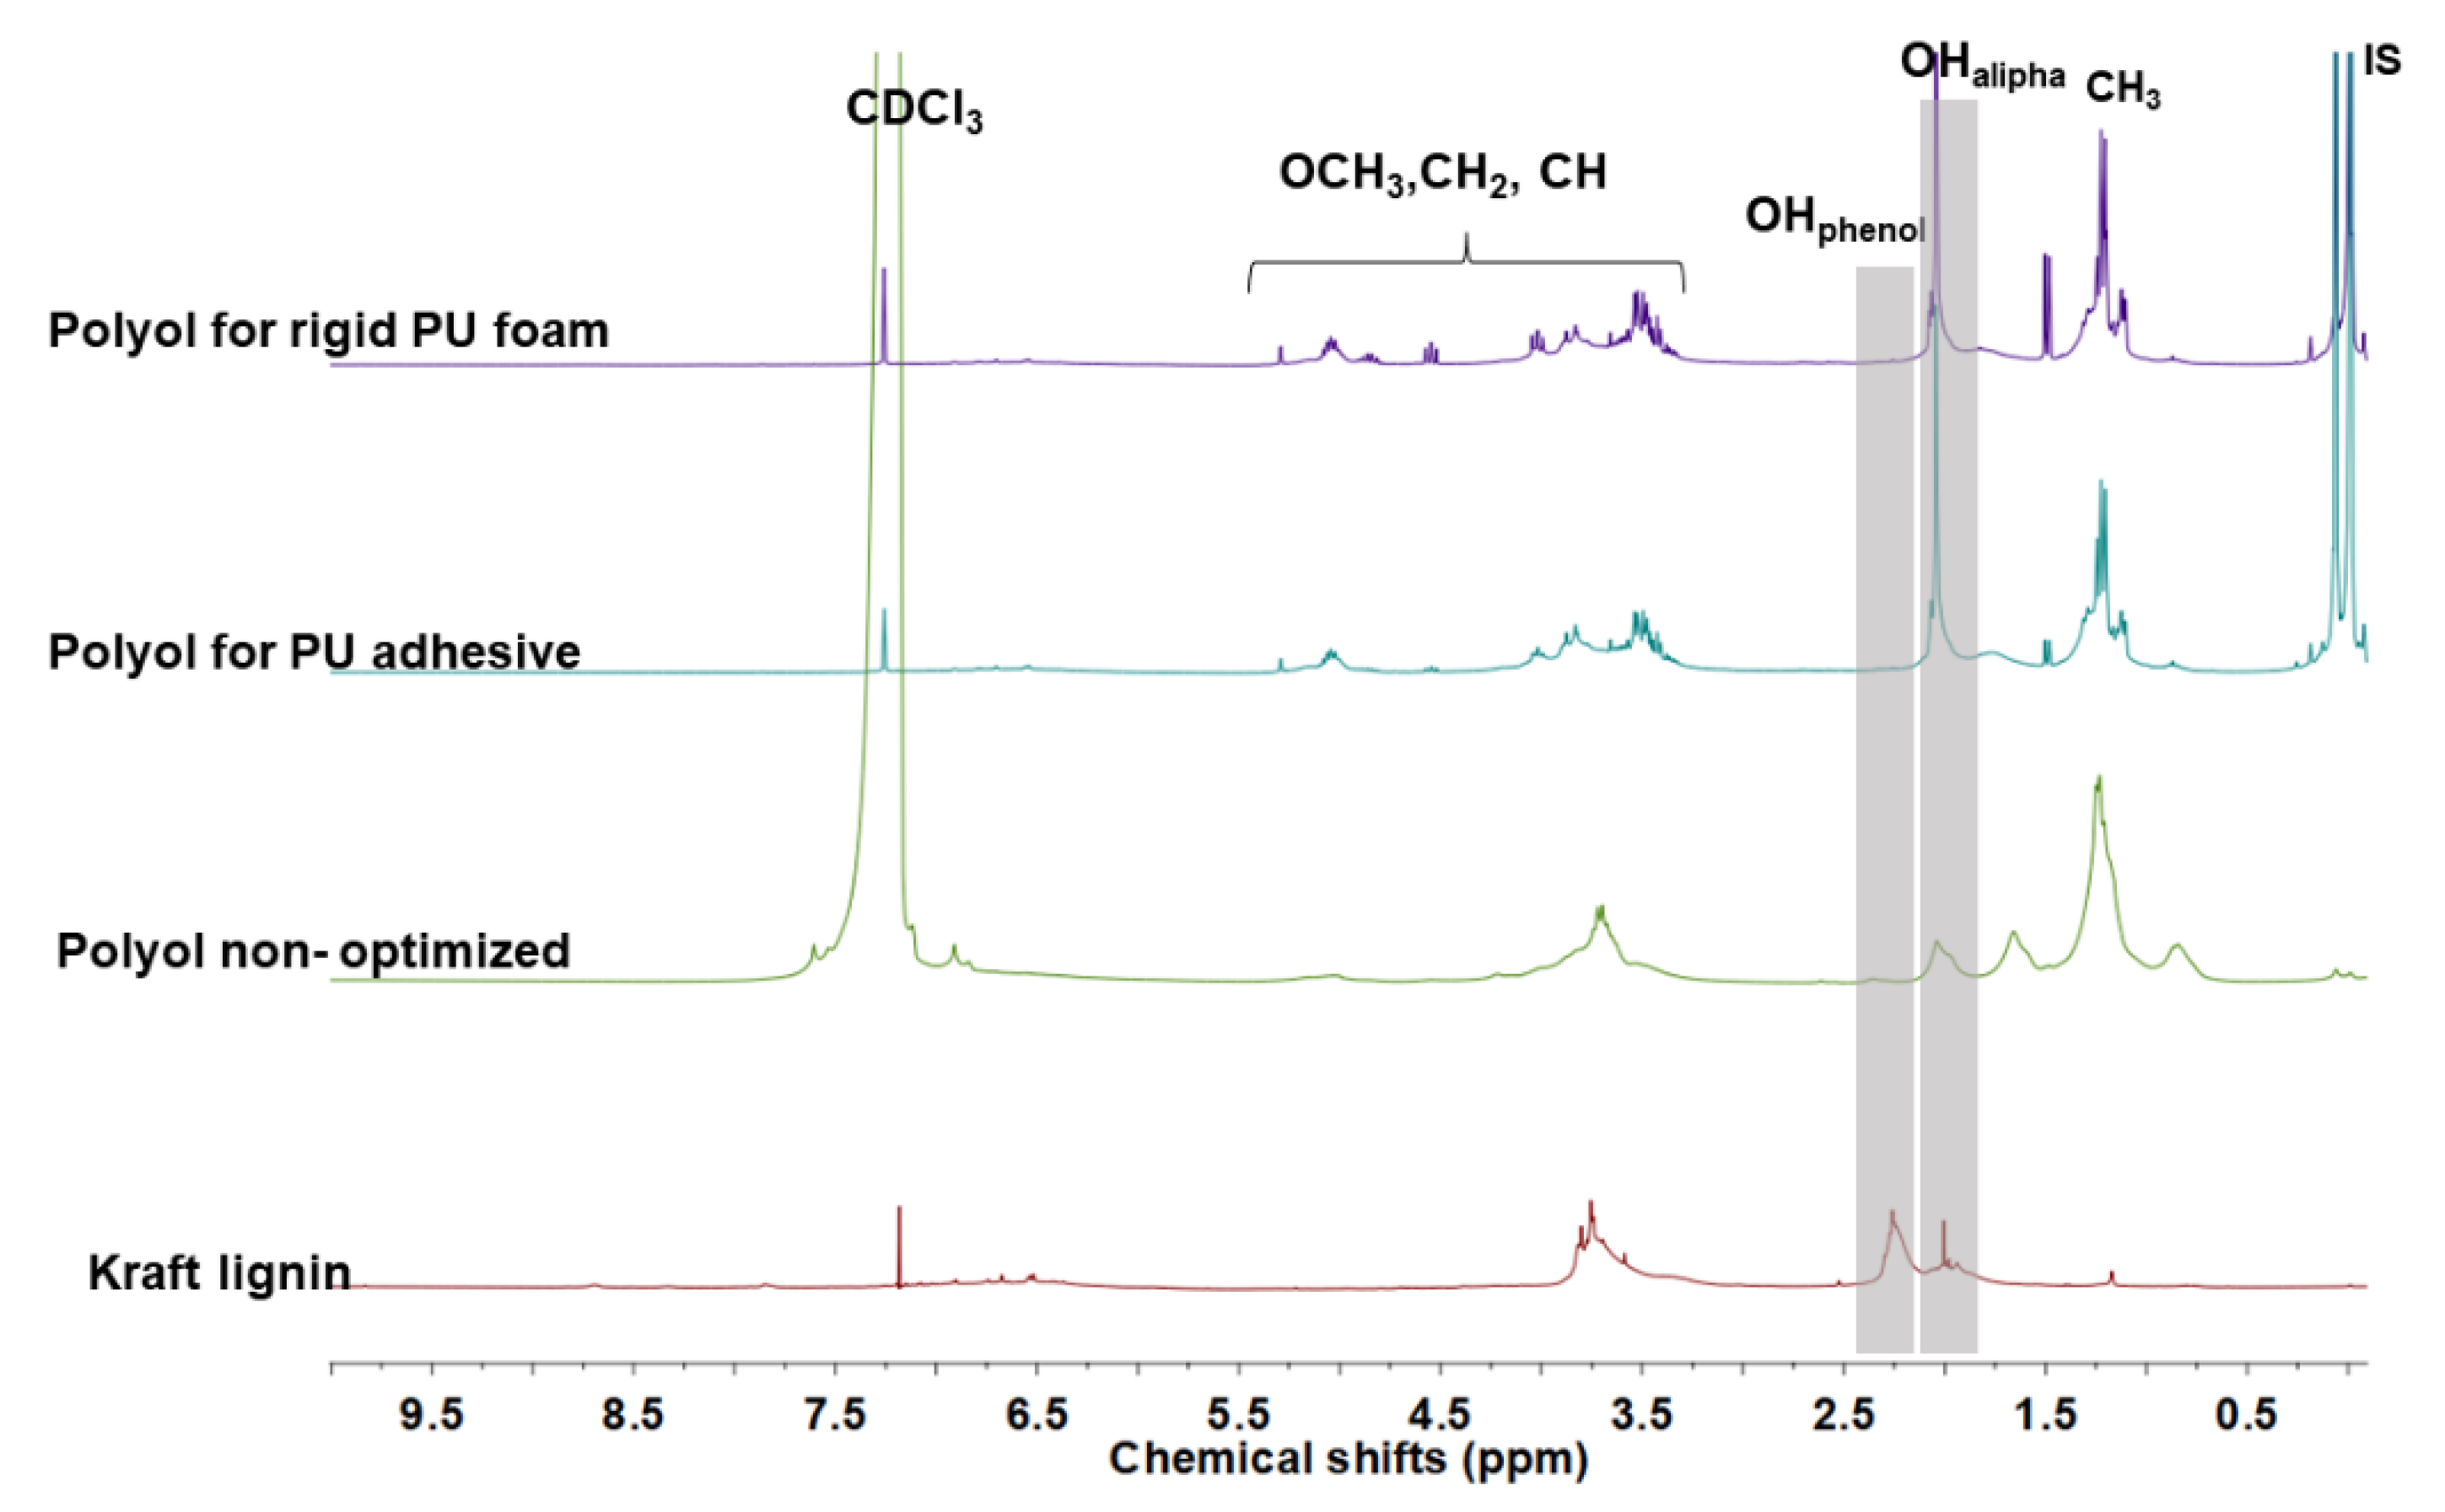
4. Characterization of Lignin-Based Polyols from Optimized Conditions
5. Conclusions
Author Contributions
Funding
Institutional Review Board Statement
Informed Consent Statement
Data Availability Statement
Acknowledgments
Conflicts of Interest
References
- Gómez-Jiménez-Aberasturi, O.; Ochoa-Gómez, J.R. New approaches to producing polyols from biomass. J. Chem. Technol. Biotechnol. 2017, 92, 705–711. [Google Scholar] [CrossRef]
- Gama, N.V.; Ferreira, A.; Barros-Timmons, A. Polyurethane foams: Past, present, and future. Materials 2018, 11, 1841. [Google Scholar] [CrossRef] [PubMed] [Green Version]
- Ionescu, M.; Wan, X.; Petrović, Z.S. Bio-Based, Self-Condensed Polyols. Eur. J. Lipid Sci. Technol. 2020, 122, 2000033. [Google Scholar] [CrossRef]
- Tribot, A.; Amer, G.; Abdou Alio, M.; de Baynast, H.; Delattre, C.; Pons, A.; Mathias, J.-D.; Callois, J.-M.; Vial, C.; Michaud, P.; et al. Wood-lignin: Supply, extraction processes and use as bio-based material. Eur. Polym. J. 2019, 112, 228–240. [Google Scholar] [CrossRef]
- Laurichesse, S.; Avérous, L. Chemical modification of lignins: Towards biobased polymers. Prog. Polym. Sci. 2014, 39, 1266–1290. [Google Scholar] [CrossRef]
- Glasser, W.G.; Hsu, H.H.O.; Reed, D.L.; Forte, R.C.; Wu, L.C.F. Lignin-Derived Polyols, Polyisocyanates, and Polyurethanes. In Urethane Chemistry and Applications; ACS Symposium Series; American Chemical Society: Washington, DC, USA, 1981; pp. 313–321. [Google Scholar]
- Glasser, W.G.; Leitheiser, R.H. Engineering plastics from lignin. Polym. Bull. 1984, 12, 1–5. [Google Scholar] [CrossRef]
- Belgacem, M.N.; Benaboura, A.; Gandini, A. Oxypropylation of Lignins and Preparation of Rigid Polyurethane Foams from the Ensuing Polyols. Macromol. Mater. Eng. 2005, 290, 1009–1016. [Google Scholar] [CrossRef]
- Cateto, C.A.; Barreiro, M.F.; Rodrigues, A.E.; Belgacem, M.N. Optimization study of lignin oxypropylation in view of the preparation of polyurethane rigid foams. Ind. Eng. Chem. Res. 2009, 48, 2583–2589. [Google Scholar] [CrossRef]
- Li, Y.; Ragauskas, A.J. Kraft lignin-based rigid polyurethane foam. J. Wood Chem. Technol. 2012, 32, 210–224. [Google Scholar] [CrossRef]
- Clements, J.H. Reactive applications of cyclic alkylene carbonates. Ind. Eng. Chem. Res. 2003, 42, 663–674. [Google Scholar] [CrossRef]
- Matsuo, J.; Nakano, S.; Sanda, F.; Endo, T. Ring-Opening Polymerization of Cyclic Carbonates by Alcohol–Acid Catalyst. J. Polym. Sci. Part A Polym. Chem. 1998, 36, 2463–2471. [Google Scholar] [CrossRef]
- Kühnel, I.; Podschun, J.; Saake, B.; Lehnen, R. Synthesis of lignin polyols via oxyalkylation with propylene carbonate. Holzforschung 2015, 69, 531–538. [Google Scholar] [CrossRef]
- Kühnel, I.; Saake, B.; Lehnen, R. Oxyalkylation of lignin with propylene carbonate : Influence of reaction parameters on the ensuing bio-based polyols. Ind. Crops Prod. 2017, 101, 75–83. [Google Scholar] [CrossRef]
- Maiorana, A.; Venkata, S.N.M.; Viswanathan, G. Alkoxylated Lignin for Polyurethane Applications. U.S Patent 2019/0144595 A1, 16 May 2019. [Google Scholar]
- Zhang, X.; Kim, Y.; Elsayed, I.; Taylor, M.; Eberhardt, T.L.; Hassan, E.B.; Shmulsky, R. Rigid polyurethane foams containing lignin oxyalkylated with ethylene carbonate and polyethylene glycol. Ind. Crops Prod. 2019, 141, 111797. [Google Scholar] [CrossRef]
- Vieira, F.R.; Barros-timmons, A.; Evtuguin, D.V.; Pinto, P.C.R. Effect of different catalysts on the oxyalkylation of eucalyptus Lignoboost® kraft lignin. Holzforschung 2020, 74, 567–576. [Google Scholar] [CrossRef]
- Ionescu, M. The General Characteristics of Oligo-Polyols. In Chemistry and Technology of Polyols for Polyurethanes; Rapra Technology: Shawbury, UK, 2005; Volume 14, pp. 31–49. ISBN 978-1-84735-035-0. [Google Scholar]
- Alinejad, M.; Henry, C.; Nikafshar, S.; Gondaliya, A.; Bagheri, S.; Chen, N.; Singh, S.K.; Hodge, D.B.; Nejad, M. Lignin-Based Polyurethanes: Opportunities for Bio-Based Foams, Elastomers, Coatings and Adhesives. Polymers 2019, 11, 1202. [Google Scholar] [CrossRef] [Green Version]
- Duval, A.; Avérous, L. Oxyalkylation of Condensed Tannin with Propylene Carbonate as an Alternative to Propylene Oxide. ACS Sustain. Chem. Eng. 2016, 4, 3103–3112. [Google Scholar] [CrossRef]
- Kühnel, I.; Saake, B.; Lehnen, R. Comparison of different cyclic organic carbonates in the oxyalkylation of various types of lignin. React. Funct. Polym. 2017, 120, 83–91. [Google Scholar] [CrossRef]
- Duval, A.; Avérous, L. Cyclic Carbonates as Safe and Versatile Etherifying Reagents for the Functionalization of Lignins and Tannins. ACS Sustain. Chem. Eng. 2017, 5, 7334–7343. [Google Scholar] [CrossRef]
- Zakis, G.F. Funcional Analysis of Lignins and Their Derivatives; Tappi Press: Atlanta, GA, USA, 1992; pp. 20–25. [Google Scholar]
- Aha, J.; Svrjala, S. Evaluation of different methods for determining the entrance pressure drop in capillary rheometry. Appl. Rheol. 2008, 18, 2–6. [Google Scholar] [CrossRef]
- Carreau, P.J.; De Kee, D.; Daroux, M. An analysis of the viscous behaviour of polymeric solutions. Can. J. Chem. Eng. 1979, 57, 135–140. [Google Scholar] [CrossRef]
- Over, L.C.; Meier, M.A.R. Sustainable allylation of organosolv lignin with diallyl carbonate and detailed structural characterization of modified lignin. Green Chem. 2015, 18, 197–207. [Google Scholar] [CrossRef]
- Zhang, X.; Jeremic, D.; Kim, Y.; Street, J.; Shmulsky, R. Effects of surface functionalization of lignin on synthesis and properties of rigid bio-based polyurethanes foams. Polymers 2018, 10, 706. [Google Scholar] [CrossRef] [Green Version]
- Liu, L.; Cho, M.; Sathitsuksanoh, N.; Chowdhury, S.; Renneckar, S. Uniform Chemical Functionality of Technical Lignin Using Ethylene Carbonate for Hydroxyethylation and Subsequent Greener Esterification. ACS Sustain. Chem. Eng. 2018, 6, 12251–12260. [Google Scholar] [CrossRef]
- Montgomery, D.C. Design and Analysis of Experiments, 8th ed.; John Wiley & Sons: Scottsdale, AZ, USA, 2013; pp. 496–500. [Google Scholar]
- Akçay, H.; Anagün, A.S.; Costa, N.R.; Lourenço, J.; Pereira, Z.L. Desirability function approach: A review and performance evaluation in adverse conditions. Chemom. Intell. Lab. Syst. 2013, 18, 234–244. [Google Scholar] [CrossRef]
- Polyether Polyol for Rigid Foams and for CASE (Coatings, Adhesives and Sealants) Applications, Repsol. Available online: https://www.repsol.com/en/products-and-services/chemicals/product-range/polyols/index.cshtml (accessed on 16 June 2021).
- Ferdosian, F.; Pan, Z.; Gao, G.; Zhao, B. Bio-Based Adhesives and Evaluation for Wood Composites Application. Polymers 2017, 9, 70. [Google Scholar] [CrossRef] [PubMed] [Green Version]
- Cheng, E.; Sun, X. Effects of wood-surface roughness, adhesive viscosity and processing pressure on adhesion strength of protein adhesive. J. Adhes. Sci. Technol. 2006, 20, 997–1017. [Google Scholar] [CrossRef]
- Chen, Y.C.; Fu, S.; Zhang, H. Signally improvement of polyurethane adhesive with hydroxy-enriched lignin from bagasse. Colloids Surf. A Phys. Eng. Asp. 2020, 585, 124164. [Google Scholar] [CrossRef]
- Chen, Y.; Zhang, H.; Zhu, Z.; Fu, S. International Journal of Biological Macromolecules High-value utilization of hydroxymethylated lignin in polyurethane adhesives. Int. J. Biol. Macromol. 2020, 152, 775–785. [Google Scholar] [CrossRef]


| Process Variables | Levels | ||
|---|---|---|---|
| 1 | 2 | 3 | |
| Temperature (Temp), °C | 170 | 180 | 200 |
| Time (Time), hours | 1.5 | 2.5 | 3.5 |
| Quantify of PC (PC), eq. molar | 4 | 7 | 10 |
| Responses | |||
| Hydroxyl number (IOH), mg KOH/g | |||
| Viscosity, Pa·s | |||
| Run | Process Variables | Responses | |||||
|---|---|---|---|---|---|---|---|
| Temp, °C | Time, Hour | PC, eq. Molar | Experimental IOH, mg KOH/g (Mean ± * SD) | Predicted IOH, mg KOH/g | Experimental Viscosity at 25 °C, Pa·s (Mean ± * SD) | Predicted Viscosity, Pa·s | |
| 1 | 170 | 1.5 | 4 | 174 ± 3.6 | 163 | 2.5 ± 0.49 | 3.4 |
| 2 | 170 | 1.5 | 7 | 216 ± 8.8 | 154 | 0.55 ± 0.13 | 0.49 |
| 3 | 170 | 1.5 | 10 | 97 ± 8.0 | 102 | 0.25 ± 0.10 | 0.20 |
| 4 | 170 | 2.5 | 4 | 271 ± 19.1 | 256 | 7.4 ± 1.2 | 9.6 |
| 5 | 170 | 2.5 | 7 | 171± 3.6 | 240 | 1.5 ± 0.35 | 1.4 |
| 6 | 170 | 2.5 | 10 | 191 ± 9.3 | 182 | 0.58 ± 0.17 | 0.61 |
| 7 | 170 | 3.5 | 4 | 533 ± 16.5 | 519 | 26.1 ± 5.2 | 22.0 |
| 8 | 170 | 3.5 | 7 | 481 ± 15.3 | 495 | 3.2 ± 0.98 | 3.3 |
| 9 | 170 | 3.5 | 10 | 408 ± 18.9 | 430 | 1.7 ± 0.40 | 1.5 |
| 10 | 180 | 1.5 | 4 | 327 ± 16.6 | 348 | 19.4 ± 5.4 | 15.0 |
| 11 | 180 | 1.5 | 7 | 357 ± 9.4 | 337 | 2.5 ± 0.61 | 1.9 |
| 12 | 180 | 1.5 | 10 | 246 ± 13.1 | 286 | 0.42 ± 0.13 | 0.66 |
| 13 | 180 | 2.5 | 4 | 396± 48.4 | 415 | 41.0 ± 5.3 | 30.6 |
| 14 | 180 | 2.5 | 7 | 392 ± 36.2 | 398 | 3.0 ± 0.46 | 3.9 |
| 15 | 180 | 2.5 | 10 | 314 ± 10.6 | 339 | 1.6 ± 0.41 | 1.5 |
| 16 | 180 | 3.5 | 4 | 667 ± 38.7 | 650 | 49.5 ± 6.0 | 50.3 |
| 17 | 180 | 3.5 | 7 | 652 ± 11.3 | 626 | 6.0 ± 1.9 | 6.6 |
| 18 | 180 | 3.5 | 10 | 610 ± 10.2 | 560 | 2.3 ± 0.43 | 2.6 |
| 19 | 200 | 1.5 | 4 | 386 ± 27.3 | 398 | 45.8 ± 4.8 | 57.4 |
| 20 | 200 | 1.5 | 7 | 393 ± 26.6 | 386 | 4.9 ± 1.4 | 5.3 |
| 21 | 200 | 1.5 | 10 | 314 ± 26.9 | 334 | 1.7 ± 0.22 | 1.4 |
| 22 | 200 | 2.5 | 4 | 443 ± 22.2 | 411 | 67.1 ± 6.4 | 60.8 |
| 23 | 200 | 2.5 | 7 | 329 ± 15.1 | 393 | 8.2 ± 2.2 | 5.8 |
| 24 | 200 | 2.5 | 10 | 461 ± 36.8 | 334 | 1.2 ± 0.36 | 1.6 |
| 25 | 200 | 3.5 | 4 | 611 ± 20.6 | 594 | 51.1 ± 5.4 | 51.8 |
| 26 | 200 | 3.5 | 7 | 557 ± 22.0 | 569 | 3.7 ± 0.53 | 5.1 |
| 27 | 200 | 3.5 | 10 | 429 ± 35.5 | 503 | 2.0 ± 0.44 | 1.5 |
| Source | Responses | |||||
|---|---|---|---|---|---|---|
| IOH | Viscosity | |||||
| DF | SS | MS | DF | SS | MS | |
| Model | 9 | 567,217.54 | 63,024.2 | 9 | 12.13 | 1.34 |
| Error | 17 | 46,945.86 | 2761.5 | 17 | 0.252 | 0.014 |
| Total | 26 | 614,163.41 | - | 26 | 12.38 | - |
| F ratio | 22.82 | 90.72 | ||||
| p value | <0.0001 | <0.0001 | ||||
| R square | 0.923 | 0.979 | ||||
| R-square adjusted | 0.883 | 0.9688 | ||||
| Mean of response | 386.14 | 0.62 | ||||
| Run | Variables | Responses | |||||
|---|---|---|---|---|---|---|---|
| Temp, °C | Time, Hour | PC, eq. Molar | Predicted IOH, mg KOH/g (95% Confidence Interval) | Observed IOH, mg KOH/g (Mean ± * SD) | Predicted Viscosity, Pa·s (95% Interval Confidence) | Observed Viscosity at 25 °C, Pa·s (Mean ± * SD) | |
| 1 | 170 | 2.5 | 10 | 182 (120–242) | 237 ± 13.1 | 0.62 (0.44–0.85) | 0.51 |
| 2 | 180 | 2.0 | 5.13 | 372 (324–420) | 411 ± 12.9 | 9.90 (7.5–12.6) | 7.70 |
| 3 | 200 | 1.5 | 7.0 | 390 (322–451) | 437 ± 29.1 | 5.50 (3.8–7.5) | 5.40 |
| Characteristics | Kraft Lignin * | Polyol Non- Optimized * | Crude Polyol for Rigid PU Foam | Crude Polyol for PU Adhesive |
|---|---|---|---|---|
| Water content, wt % | - | - | 0.16 | 0.39 |
| IOH, mg KOH/g | 311 | 198 | 257 | 225 |
| Viscosity, Pa·s | - | 0.58 | 5.3 | 0.56 |
| Mw, Da | 1415 | 1970 | 1760 | 1700 |
| Polydispersity | 1.09 | 1.11 | 1.09 | 1.08 |
| Oxypropyl units | - | 1.44 | 2.55 | 2.58 |
| DS | - | 0.78 | 0.78 | 0.79 |
Publisher’s Note: MDPI stays neutral with regard to jurisdictional claims in published maps and institutional affiliations. |
© 2022 by the authors. Licensee MDPI, Basel, Switzerland. This article is an open access article distributed under the terms and conditions of the Creative Commons Attribution (CC BY) license (https://creativecommons.org/licenses/by/4.0/).
Share and Cite
Vieira, F.R.; Barros-Timmons, A.; Evtuguin, D.V.; Pinto, P.C.O.R. Oxyalkylation of Lignoboost™ Kraft Lignin with Propylene Carbonate: Design of Experiments towards Synthesis Optimization. Materials 2022, 15, 1925. https://doi.org/10.3390/ma15051925
Vieira FR, Barros-Timmons A, Evtuguin DV, Pinto PCOR. Oxyalkylation of Lignoboost™ Kraft Lignin with Propylene Carbonate: Design of Experiments towards Synthesis Optimization. Materials. 2022; 15(5):1925. https://doi.org/10.3390/ma15051925
Chicago/Turabian StyleVieira, Fernanda Rosa, Ana Barros-Timmons, Dmitry Victorovitch Evtuguin, and Paula C. O. R. Pinto. 2022. "Oxyalkylation of Lignoboost™ Kraft Lignin with Propylene Carbonate: Design of Experiments towards Synthesis Optimization" Materials 15, no. 5: 1925. https://doi.org/10.3390/ma15051925
APA StyleVieira, F. R., Barros-Timmons, A., Evtuguin, D. V., & Pinto, P. C. O. R. (2022). Oxyalkylation of Lignoboost™ Kraft Lignin with Propylene Carbonate: Design of Experiments towards Synthesis Optimization. Materials, 15(5), 1925. https://doi.org/10.3390/ma15051925