
Experimental Study on Static and Dynamic Response of Aluminum Honeycomb Sandwich Structures


Abstract
1. Introduction

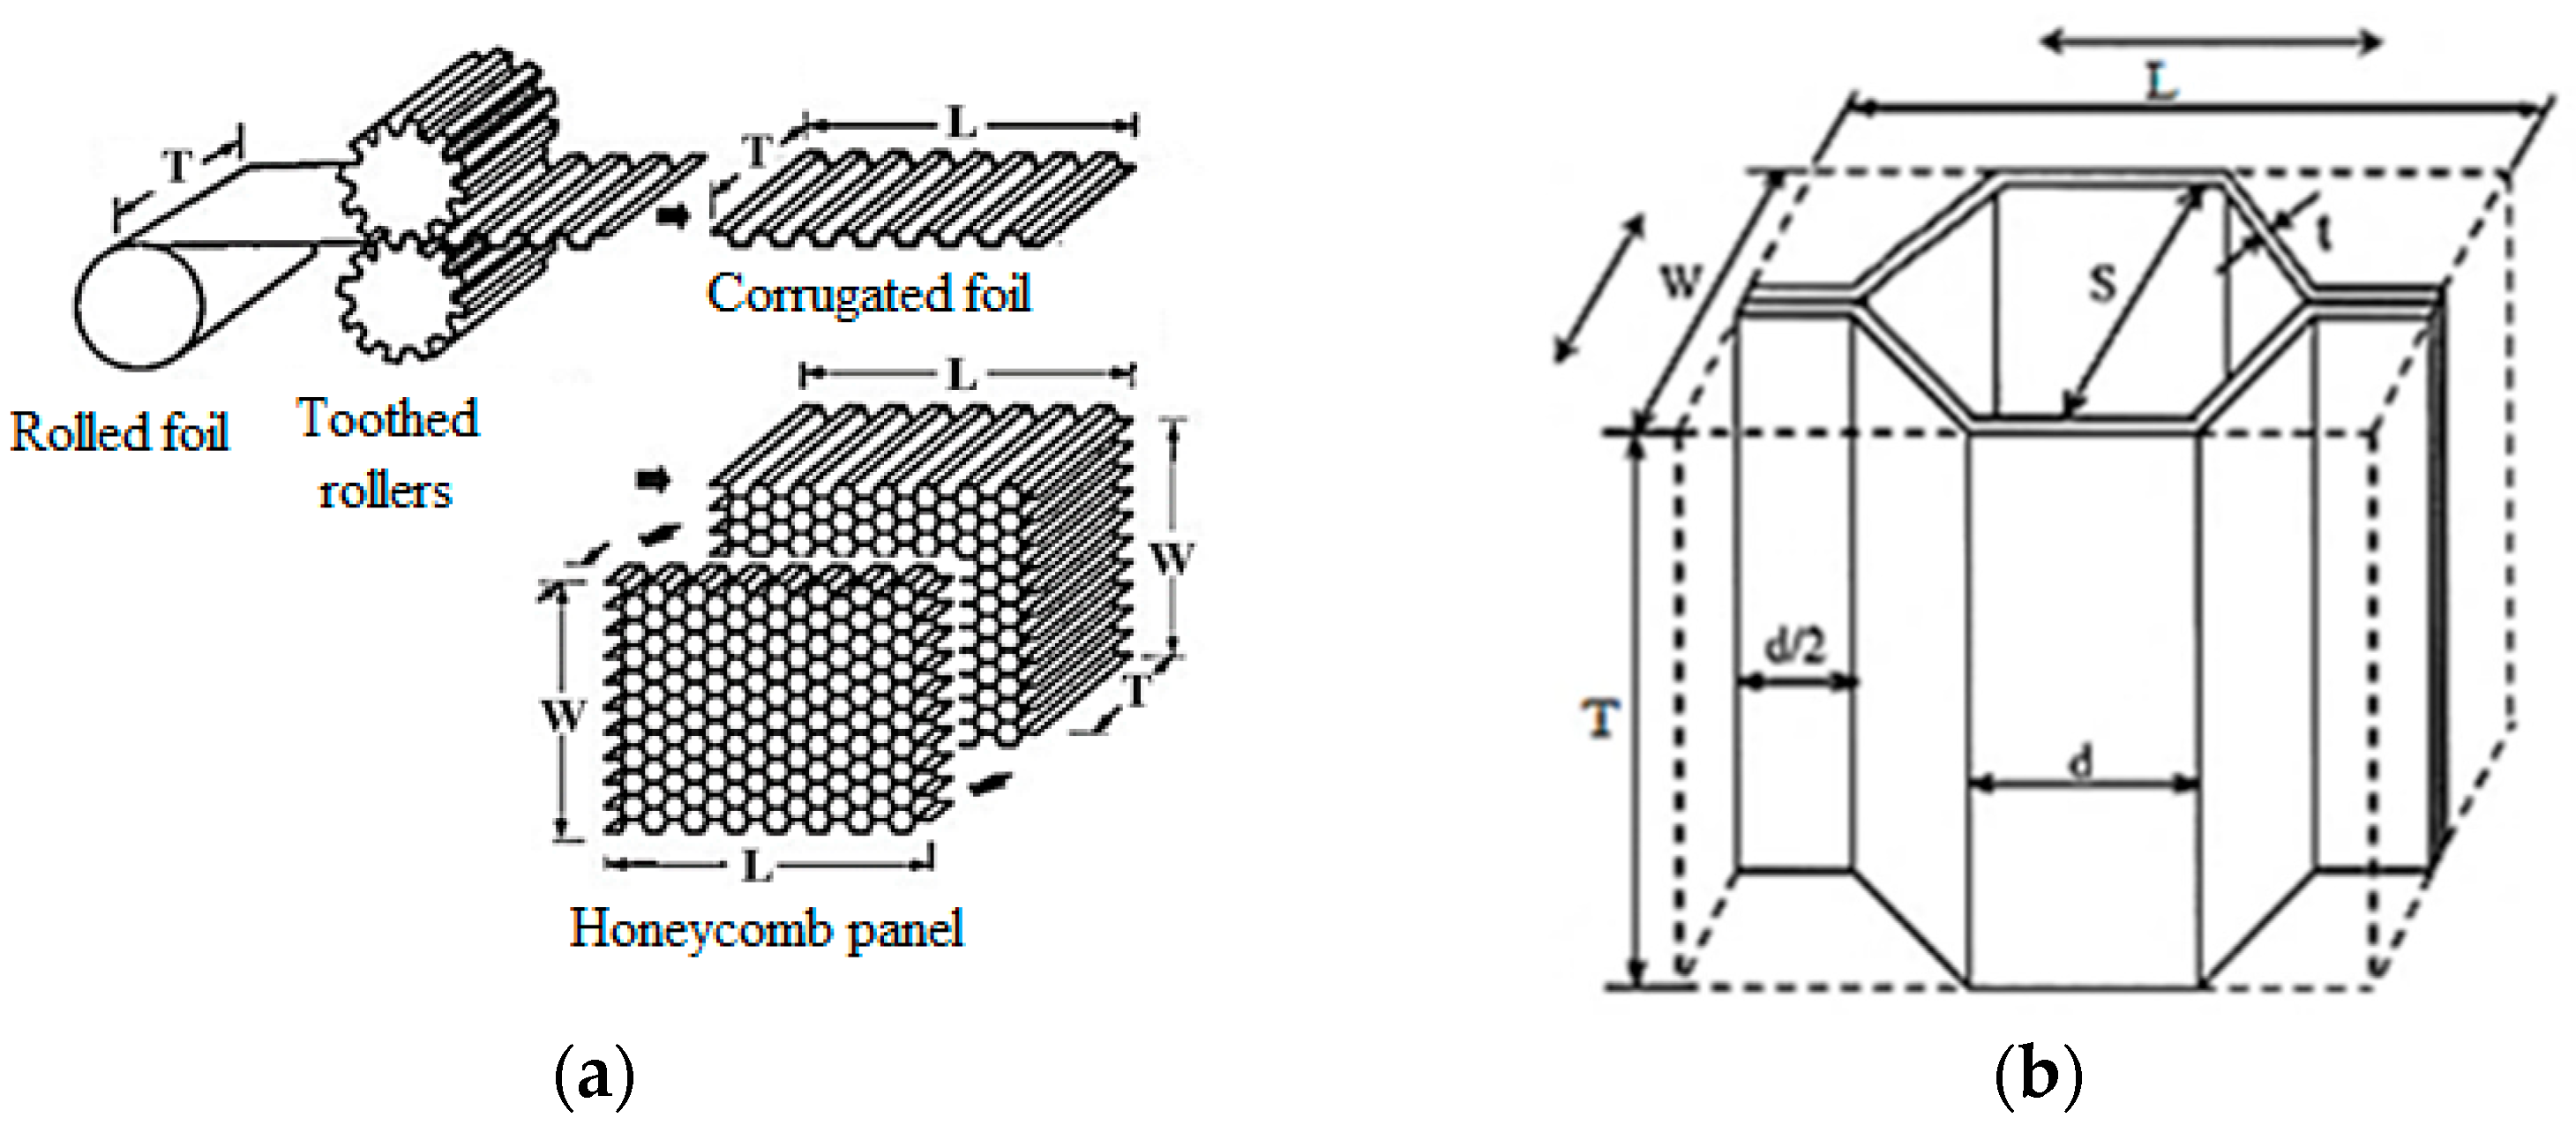
2. Materials
3. Research Methods
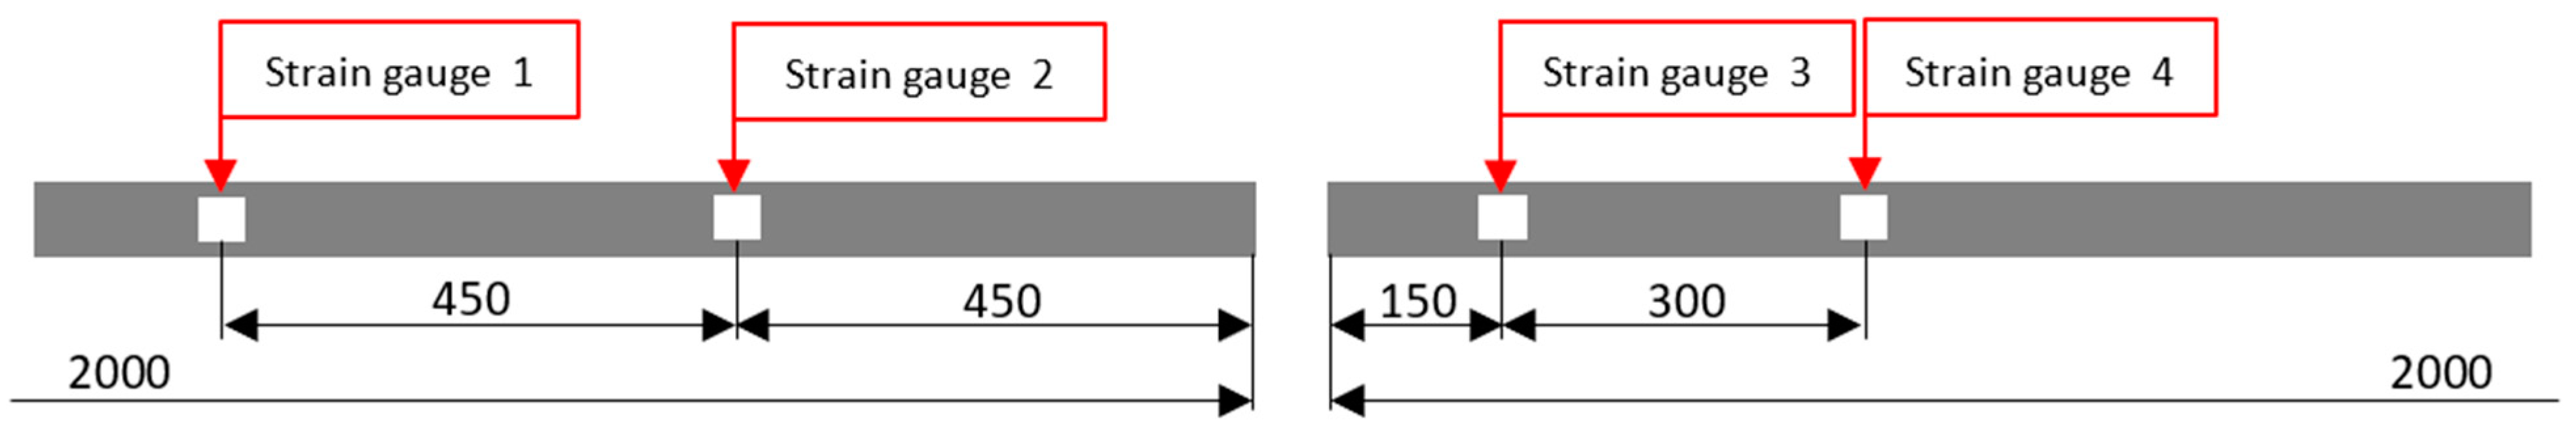
3.1. Quasi-Static Testing
3.2. Dynamic Low Strain Rate Testing
3.3. Dynamic Mid Strain Rate Testing
- Stress:
- Strain:
- Strain rate:
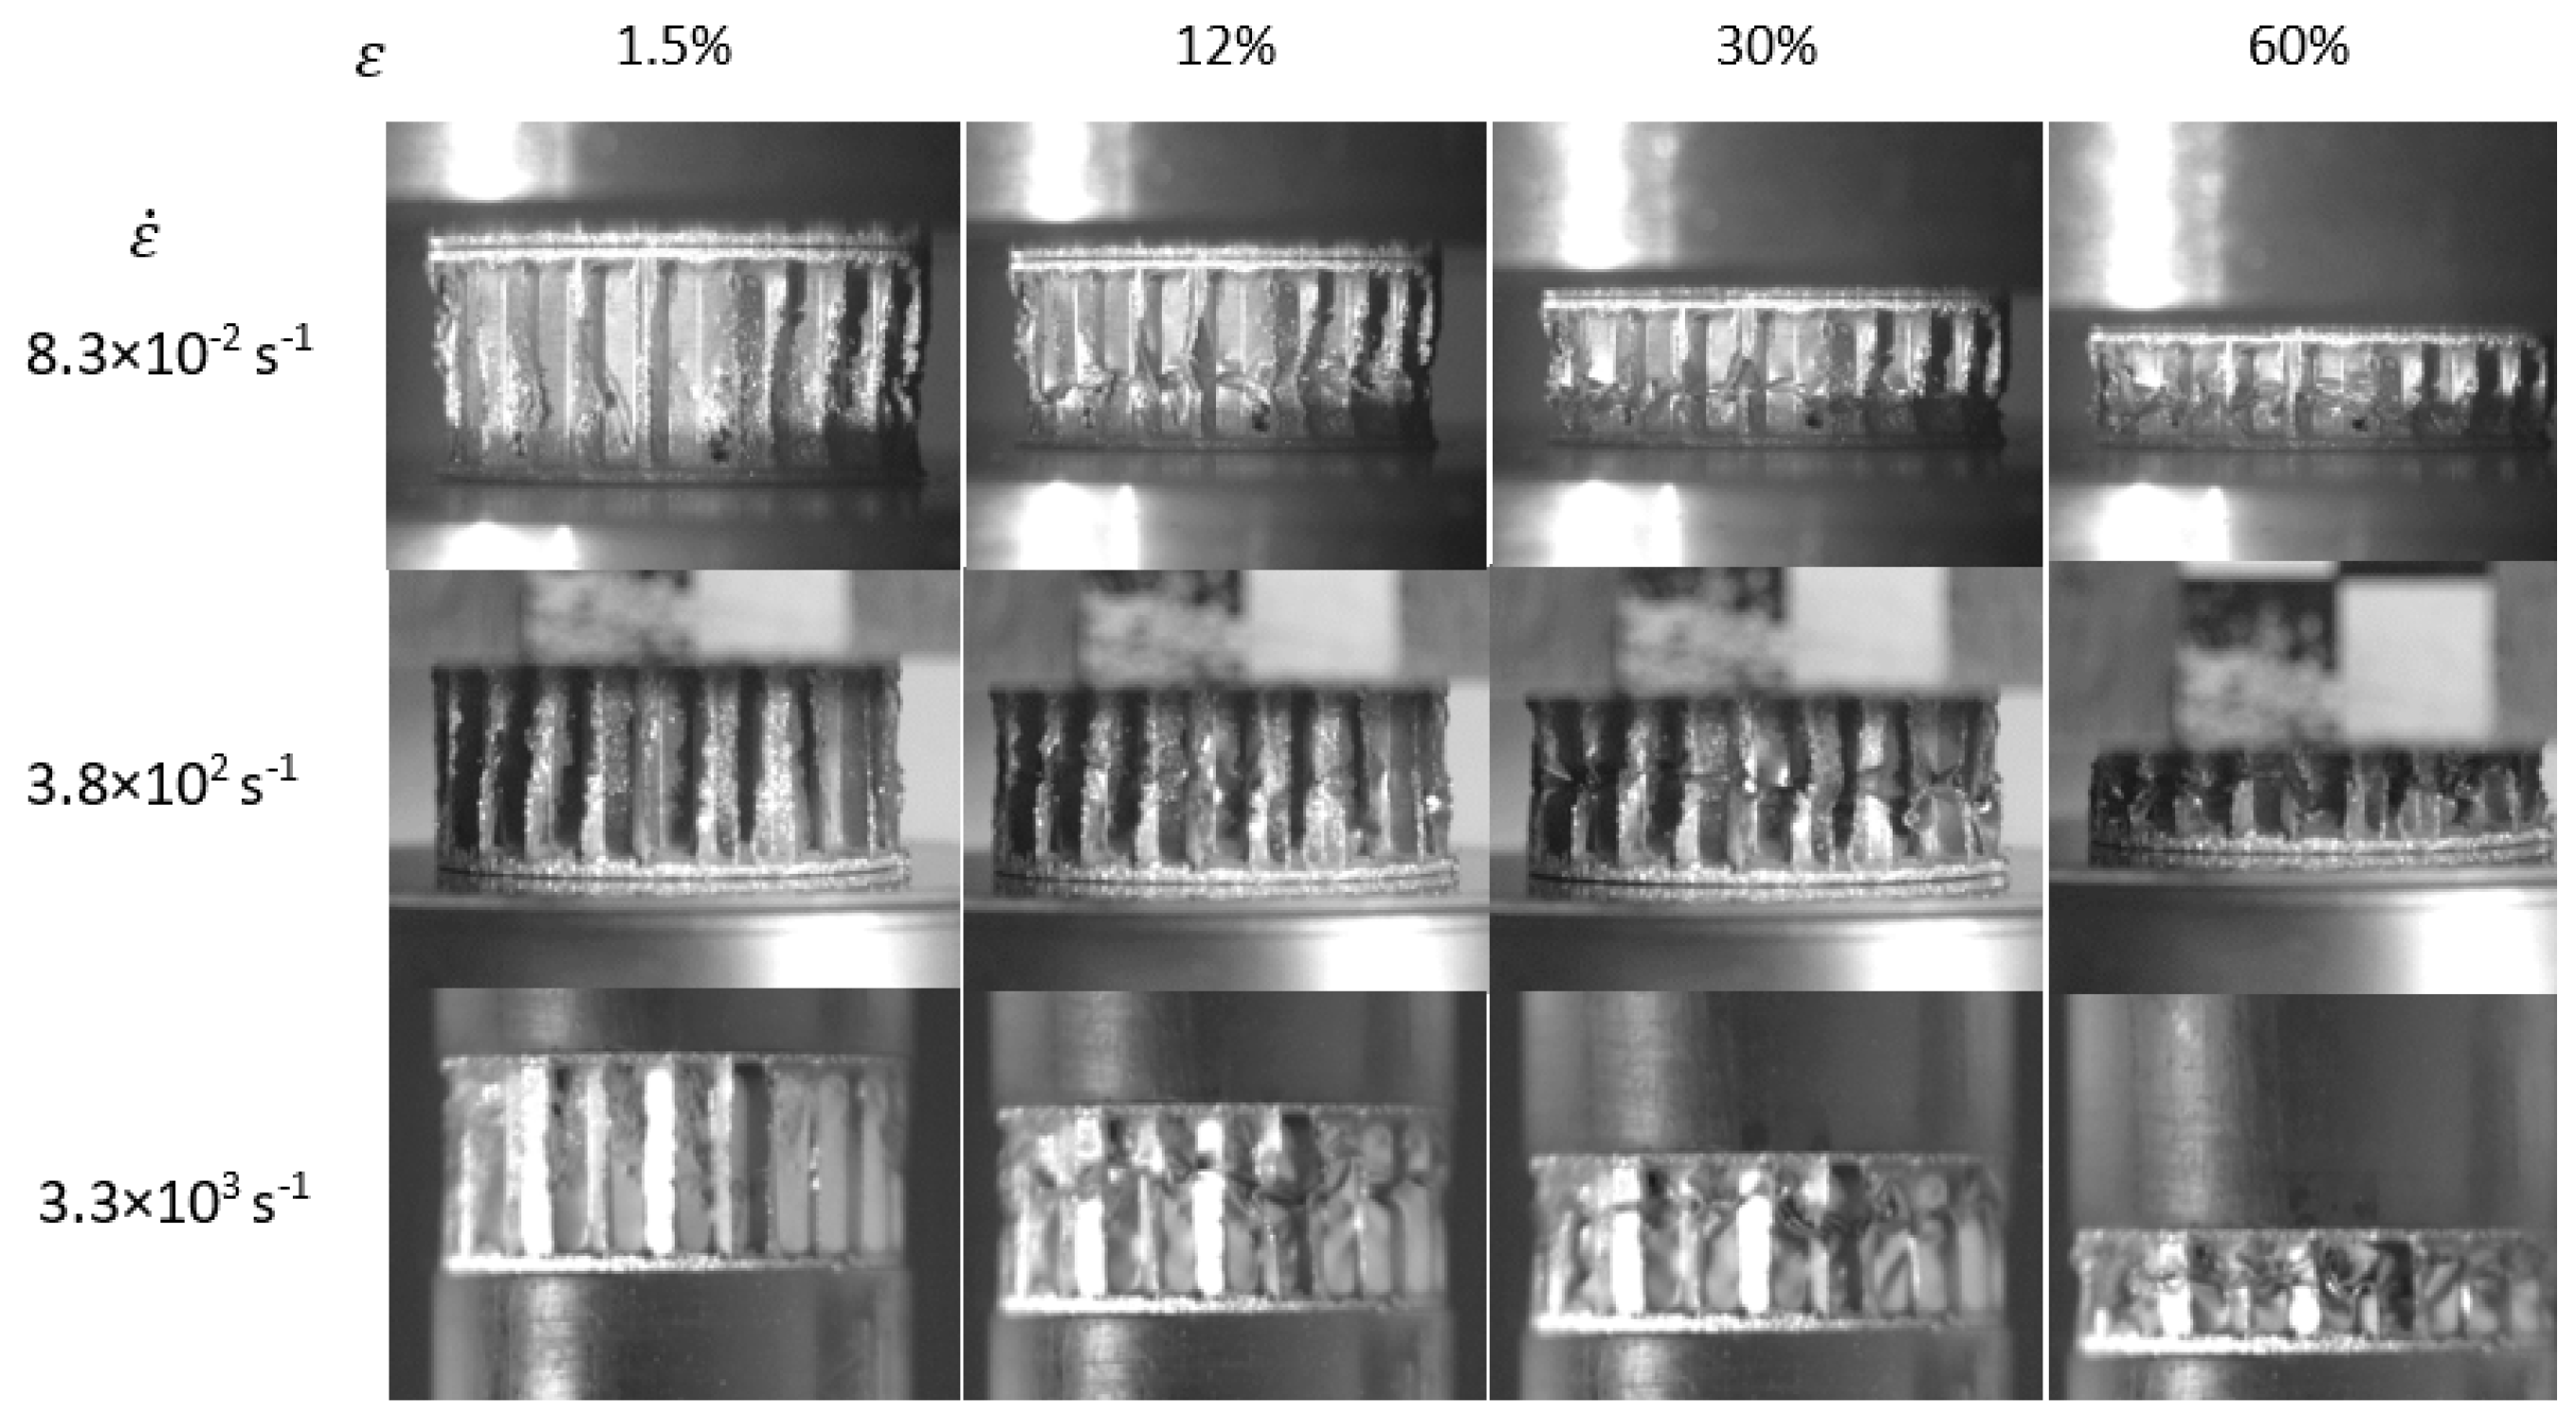
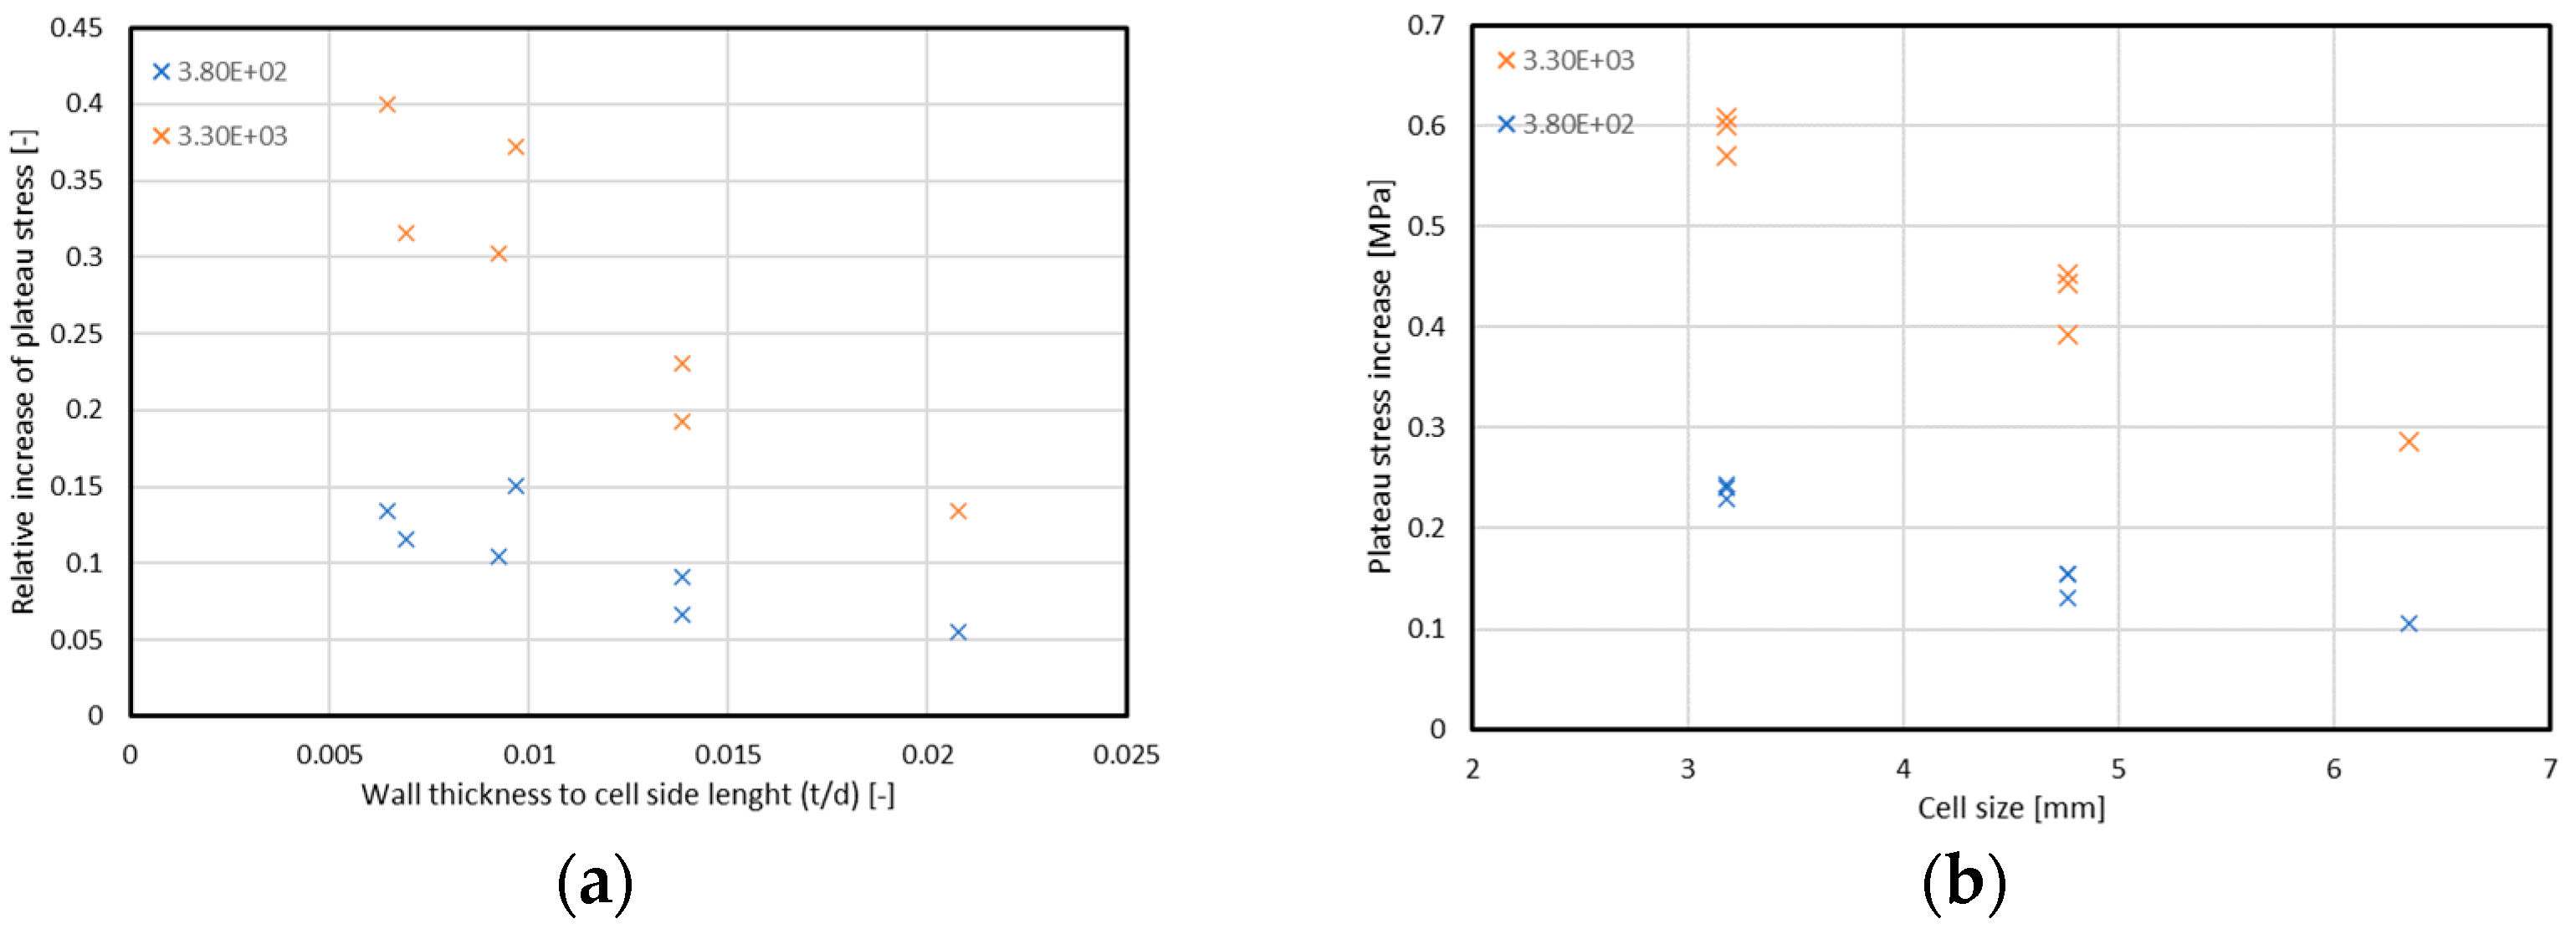
4. Results
5. Discussion
6. Conclusions
Author Contributions
Funding
Institutional Review Board Statement
Informed Consent Statement
Data Availability Statement
Acknowledgments
Conflicts of Interest
References
- Cordesman, A.H.; Loi, C.; Kocharlakota, V. IED Metrics for Iraq: June 2003–September 2010; Center for Strategic & International Studies: Washington, DC, USA, 2010. [Google Scholar]
- Cordesman, A.H.; Allison, M.; Lemieux, J. IED Metrics for Afghanistan: January 2004–September 2010; Center for Strategic & International Studies: Washington, DC, USA, 2010. [Google Scholar]
- Niezgoda, T.; Sławiński, G.; Gieleta, R.; Świerczewski, M. Protection of military vehicles against mine threats and improvised explosive devices. J. KONBiN 2015, 1, 123–134. [Google Scholar] [CrossRef][Green Version]
- Walentynowicz, J. Methods of assessing combat damage of KTO Rosomak. Nowa Tech. Wojsk. 2012, 1, 19–22. [Google Scholar]
- A Decade of Global IED Harm Reviewed. Available online: Aoav.org.uk (accessed on 19 September 2021).
- UK Armed Forces Operational Deaths Post World War II–Tables and Figures. Available online: Assets.publishing.service.gov.uk (accessed on 11 May 2020).
- Afghanistan Statistics: UK Deaths, Casualties, Mission Costs and Refugees. Available online: Commonslibrary.parliament.uk (accessed on 20 October 2021).
- Włodarczyk, E. Introduction to the Mechanics of the Explosion; PWN: Warsaw, Poland, 1994. [Google Scholar]
- Baker, W. Explosions in Air; University of Texas Press: Austin, TX, USA, 1973. [Google Scholar]
- Śliwiński, J. Protection of vehicles against mines. J. KONES Powertrain Transp. 2015, 18, 123–134. [Google Scholar]
- Trajkovski, J.; Perenda, J.; Kunc, R. Blast response of Light Armoured Vehicles (LAVs) with flat and V-hull floor. Thin-Walled Struct. 2018, 131, 238–244. [Google Scholar] [CrossRef]
- Simiński, P. Military Wheeled Vehicles; BEL Studio: Warsaw, Poland, 2015; p. 89. [Google Scholar]
- Miedzińska, D.; Niezgoda, T.; Gieleta, R. Numerical and experimental aluminum foam microstructure testing with the use of computed tomography. Comput. Mater. Sci. 2012, 64, 90–95. [Google Scholar] [CrossRef]
- Barnat, W. Selected Problems of Energy Consumption of New Types of Protective Panels Loaded with an Explosion Wave; Wojskowa Akademia Techniczna: Warsaw, Poland, 2010. [Google Scholar]
- Niezgoda, T.; Ochelski, S.; Barnat, W. Experimental study of the influence of the type of filling of basic composite structures on the energy of destruction. Acta Mech. Et Autom. 2007, 1, 71–76. [Google Scholar]
- Dotts, R. Apollo Experience Report–Spacecraft Heating Environment and Thermal Protection for Launch through the Atmosphere of the Earth; NASA TN D-7085; National Aeronautics and Space Administration: Washington, DC, USA, 1973; p. 5.
- McFarland, R. The Development of Metal Honeycomb Energy-Absorbing Elements; Technical report No. 32-639; Jet Propulsion Laboratory, California Institute Of Technology: Pasadena, CA, USA, 1964. [Google Scholar]
- Xiang, Y.; Yu, T.; Yang, L. Comparative analysis of energy absorption capacity of polygonal tubes, multi-cell tubes and honeycombs by utilizing key performance indicators. Mater. Des. 2016, 89, 689–696. [Google Scholar] [CrossRef]
- Zhang, D.; Lu, G.; Ruan, D. Quasi-static combined compression-shear crushing of honeycombs: An experimental study. Mater. Des. 2019, 167, 107632. [Google Scholar] [CrossRef]
- Wierzbicki, T. Crushing analysis of metal honeycombs. Int. J. Impact Eng. 1983, 1, 157–174. [Google Scholar] [CrossRef]
- Baker, W.E.; Togami, T.C.; Weydert, J.C. Static and dynamic high density properties of high-density metal honeycombs. Int. J. Impact Eng. 1998, 21, 149–163. [Google Scholar] [CrossRef]
- Goldsmith, W.; Sackman, L. An experimental study of energy absorption in impact on sandwich plates. Int. J. Impact Eng. 1992, 12, 241–262. [Google Scholar] [CrossRef]
- Xu, S.; Beynona, J.H.; Ruan, D.; Yu, T.X. Strength enhancement of aluminium honeycombs caused by entrapped air under dynamic out-of-plane compression. Int. J. Impact Eng. 2012, 47, 1–13. [Google Scholar] [CrossRef]
- Military Specification, Core Material, Aluminum, For Sandwich Construction, MIL-C-7438G; Department of Defence: Waschington, DC, USA, 1985.
- ASTM C293; Method of Shear Test in Flatwise Plane of Flat Sandwich Constructions or Sandwich Cores; ASTM: West Conshohocken, PA, USA, 1994.
- ASTM C297; Methods for Tension Test of Flat Sandwich Constructions in Flatwise Plane; ASTM: West Conshohocken, PA, USA, 1994.
- ASTM C364; Method of Test for Edgewise Compressive Properties of Sandwich Cores; ASTM: West Conshohocken, PA, USA, 1994.
- ASTM C365; Method of Test for Flatwise Compressive Properties of Sandwich Cores; ASTM: West Conshohocken, PA, USA, 1994.
- HexWeb® Rigicell™, Corrosion Resistant Aluminum Corrugated Honeycomb, Product Data. Available online: https://satsearch.co/products/hexcel-corporation-hex-web-rigicell-corrosion-resistant-aluminum-corrugated-honeycomb (accessed on 15 January 2022).
- Kee Paik, J.; Thayamballi, A.K.; Sung Kim, G. The strength characteristics of aluminum honeycomb sandwich panels. Thin-Walled Struct. 1999, 35, 205–231. [Google Scholar] [CrossRef]
- Zarei Mahmoudabadi, M.; Sadighi, M. A theoretical and experimental study on metal hexagonal honeycomb crushing under quasi-static and low velocity impact loading. Mater. Sci. Eng. 2011, 528, 4958–4966. [Google Scholar] [CrossRef]
- Ashab, A.; Ruan, D.; Lu, G.; Xu, S.; Wen, C. Experimental investigation of the mechanical behavior of aluminum honeycombs under quasi-static and dynamic indentation. Mater. Des. 2015, 74, 138–149. [Google Scholar] [CrossRef]
- Shanqing, X.; Beynona, J.; Ruana, D.; Lu, G. Experimental study of the out-of-plane dynamic compression of hexagonal honeycombs. Compos. Struct. 2012, 94, 2326–2336. [Google Scholar]
- Hopkinson, B. A method of measuring the pressure produced in the detonation of high, explosives or by the impact of bullets. Philos. Trans. R. Soc. Lond. 1914, 213, 437. [Google Scholar]
- Kolsky, T.E. An investigation of the mechanical properties of materials at very high rates of loading. Proc. Phys. Soc. 1949, 62, 676–700. [Google Scholar] [CrossRef]
- Lindholm, U.S. Some experiments with the split Hopkinson pressure bar. J. Mech. Phys. Solids 1964, 12, 317. [Google Scholar] [CrossRef]
- Bragov, A.M.; Demenko, P.V.; Lomunov, A.K.; Sergeichev, I.V.; Kruszka, L. Investigation of behavior of the materials of different physical nature using the Kolsky method and its modifications. In New Experimental Methods in Material Dynamics and Impact; Nowacki, W.K., Klepaczko, J.R., Eds.; Polish Academy of Sciences: Warsaw, Poland, 2001; p. 337. [Google Scholar]
- Zhang, S.; Chen, W.; Gao, D.; Xiao, L.; Han, L. Experimental Study on Dynamic Compression Mechanical Properties of Aluminum Honeycomb Structures. Appl. Sci. 2020, 10, 1188. [Google Scholar] [CrossRef]
- Zhao, H.; Gary, G. Behaviour characterisations of sheet metals, metallic honeycombs and foams at high and medium strain rates. Key Eng. Mater. Trans Tech Publ. 2019, 177–180, 225–230. [Google Scholar] [CrossRef]
- Hou, B.; Wang, Y.; Sun, T.F.; Liu, J.G.; Zhao, H. On the quasi-static and impact responses of aluminum honeycomb under combined shear-compression. Int. J. Impact Eng. 2019, 131, 190–199. [Google Scholar] [CrossRef]
- Cheng, Z.Q.; Crandall, J.R.; Pilkey, W.D. Wave dispersion and attenuation in viscoelastic split Hopkinson pressure bar. Shock. Vib. 1998, 5, 307–315. [Google Scholar] [CrossRef]
- Daniel, C.T.; Fourney, W.L.; Chang, P. A Polymeric Split Hopkinson Pressure Bar Instrumented with Velocity Gages. Exp. Mech. 2003, 43, 420–427. [Google Scholar]
- Janiszewski, J.; Bużantowicz, W.; Baranowski, P. Correction Procedure of Wave Signals for a Viscoelastic Split Hopkinson Pressure Bar. Probl. Mechatron. Armament Aviat. Saf. Eng. 2016, 7, 17–30. [Google Scholar] [CrossRef]
- Chen, W.; Zhang, B.; Forrestal, M.J. A split Hopkinson bar technique for low-impedance materials. Exp. Mech. 1999, 39, 81–85. [Google Scholar] [CrossRef]
- Kundu, T.; Placko, D. Advanced Ultrasonic Methods for Material and Structure Inspection; John Wiley and Sons: London, UK, 2010; pp. 271–284. [Google Scholar]
- Zhao, H.; Gary, G.; Klepaczko, R.J. On the use of a viscoelastic split Hopkinson pressure bar. Int. J. Impact Eng. 1997, 19, 319–330. [Google Scholar] [CrossRef]
- Yamada, H.; Kami, T.; Mori, R.; Kudo, T.; Okada, M. Strain Rate Dependence of Material Strength in AA5xxx Series Aluminum Alloys and Evaluation of Their Constitutive Equation. Metals 2018, 8, 576. [Google Scholar] [CrossRef]
- Dannemann, K.A.; Lankford, J. High strain rate compression of closed-cell aliminium foams. Mater. Sci. Eng. 2000, 293, 154–157. [Google Scholar] [CrossRef]
- Mukai, T.; Miyoshi, T.; Nakano, S.; Somekawa, H. Compressive response of a closed-cell aluminum foam at high strain rate. Scr. Mater. 2006, 54, 533–537. [Google Scholar] [CrossRef]
- Liu, J.; Saletti, D.; Pattofatto, S.; Zhao, H. Impact testing of polymeric foam using Hopkinson bars and digital image analysis. Polym. Test. 2014, 36, 101–109. [Google Scholar] [CrossRef]


| No. | Series | Cell Size S (mm) | Cell Thickness t (mm) | Height T (mm) |
|---|---|---|---|---|
| 1 | 1/8-5052-.0007 | 3.1750 | 0.01778 | 10 |
| 2 | 1/8-5052-.001 | 3.1750 | 0.02540 | 10 |
| 3 | 1/8-5052-.0015 | 3.1750 | 0.03810 | 10 |
| 4 | 3/16-5052-.0007 | 4.7625 | 0.01778 | 10 |
| 5 | 3/16-5052-.001 | 4.7625 | 0.02540 | 10 |
| 6 | 3/16-5052-.0015 | 4.7625 | 0.03810 | 10 |
| 7 | 1/4-5052-.001 | 6.3500 | 0.02540 | 10 |
| Strain Rate [s−1] | Scope of Research | Research Methods and Equipment |
|---|---|---|
| 10−9–10−8 | Creep, stress relaxation | Creepers Hydraulic testing machines |
| 10−7–10−2 | Quasi-static | Hydraulic, servo-hydraulic, screw strength machines |
| 10−1–10 | Dynamic low strain rate | Hydraulic, pneumatic testing machines Drop hammers, slide hammers Cam machines |
| 102–104 | Dynamic mid strain rate | Split Hopkinson Pressure Bar Taylor test Ring test |
| 105–107 | Dynamic mid high rate | Shock wave testPlate-to-plate test |
| Sample Series | Plateau Stress (MPa) | Elastic Modulus (MPa) | Critical Stress (MPa) | Relative Volume for Fully Dense Material (-) | Elastic Modulus For Fully Dense Material (MPa) |
|---|---|---|---|---|---|
| 1/4-.001 | 0.91 | 245.32 | 1.57 | 0.31 | 36.75 |
| 3/16-.0007 | 0.98 | 157.64 | 1.51 | 0.26 | 41.74 |
| 3/16-.001 | 1.47 | 262.85 | 2.19 | 0.27 | 44.26 |
| 3/16-.0015 | 2.34 | 416.75 | 3.96 | 0.29 | 51.74 |
| 1/8-.0007 | 1.53 | 261.20 | 1.90 | 0.25 | 28.99 |
| 1/8-.001 | 2.64 | 519.82 | 4.24 | 0.26 | 52.22 |
| 1/8-.0015 | 4.47 | 580.00 | 7.03 | 0.30 | 80.05 |
| Sample Series | Strain Rate (1/s) | ||
|---|---|---|---|
| 8.3 × 10⁻² | 3.8 × 10² | 3.3 × 10³ | |
| Plateau Stress (MPa) | |||
| 1/4-.001 | 0.906 | 1.011 | 1.192 |
| 3/16-.0007 | 0.980 | 1.111 | 1.372 |
| 3/16-.001 | 1.469 | 1.623 | 1.913 |
| 3/16-.0015 | 2.344 | 2.499 | 2.796 |
| 1/8-.0007 | 1.531 | 1.761 | 2.101 |
| 1/8-.001 | 2.635 | 2.875 | 3.243 |
| 1/8-.0015 | 4.466 | 4.710 | 5.066 |
Publisher’s Note: MDPI stays neutral with regard to jurisdictional claims in published maps and institutional affiliations. |
© 2022 by the authors. Licensee MDPI, Basel, Switzerland. This article is an open access article distributed under the terms and conditions of the Creative Commons Attribution (CC BY) license (https://creativecommons.org/licenses/by/4.0/).
Share and Cite
Ciepielewski, R.; Gieleta, R.; Miedzińska, D. Experimental Study on Static and Dynamic Response of Aluminum Honeycomb Sandwich Structures. Materials 2022, 15, 1793. https://doi.org/10.3390/ma15051793
Ciepielewski R, Gieleta R, Miedzińska D. Experimental Study on Static and Dynamic Response of Aluminum Honeycomb Sandwich Structures. Materials. 2022; 15(5):1793. https://doi.org/10.3390/ma15051793
Chicago/Turabian StyleCiepielewski, Radosław, Roman Gieleta, and Danuta Miedzińska. 2022. "Experimental Study on Static and Dynamic Response of Aluminum Honeycomb Sandwich Structures" Materials 15, no. 5: 1793. https://doi.org/10.3390/ma15051793
APA StyleCiepielewski, R., Gieleta, R., & Miedzińska, D. (2022). Experimental Study on Static and Dynamic Response of Aluminum Honeycomb Sandwich Structures. Materials, 15(5), 1793. https://doi.org/10.3390/ma15051793