
Ag Surface and Bulk Segregations in Sputtered ZrCuAlNi Metallic Glass Thin Films

 , , , ,
Abstract
:1. Introduction
2. Materials and Methods
3. Results and Discussion
4. Conclusions
Author Contributions
Funding
Institutional Review Board Statement
Informed Consent Statement
Data Availability Statement
Acknowledgments
Conflicts of Interest
References
- Bhat, A.; Budholiya, S.; Raj, S.A.; Sultan, M.T.H.; Hui, D.; Shah, A.U.M.; Safri, S.N.A. Review on nanocomposites based on aerospace applications. Nanotechnol. Rev. 2021, 10, 237–253. [Google Scholar] [CrossRef]
- Calderon Velasco, S.; Cavaleiro, A.; Carvalho, S. Functional properties of ceramic-Ag nanocomposite coatings produced by magnetron sputtering. Prog. Mater. Sci. 2016, 84, 158–191. [Google Scholar] [CrossRef] [Green Version]
- Guo, J.; Zhao, X.; Herisson De Beauvoir, T.; Seo, J.-H.; Berbano, S.S.; Baker, A.L.; Azina, C.; Randall, C.A. Recent Progress in Applications of the Cold Sintering Process for Ceramic-Polymer Composites. Adv. Funct. Mater. 2018, 28, 1801724. [Google Scholar] [CrossRef]
- Ju, H.; Yu, D.; Yu, L.; Ding, N.; Xu, J.; Zhang, X.; Zheng, Y.; Yang, L.; He, X. The influence of Ag contents on the microstructure, mechanical and tribological properties of ZrN-Ag films. Vacuum 2018, 148, 54–61. [Google Scholar] [CrossRef]
- Hong, C.; Huan, Y.; Zhang, P.; Zhang, K.; Dai, P. Effect of silver content on the microstructure, thermal stability and mechanical properties of CrNx/Ag nanocomposite films. Ceram. Int. 2021, 47, 25324–25336. [Google Scholar] [CrossRef]
- Calderón-Jiménez, B.; Johnson, M.E.; Montoro Bustos, A.R.; Murphy, K.E.; Winchester, M.R.; Baudrit, J.R.V. Silver nanoparticles: Technological advances, societal impacts, and metrological challenges. Front. Chem. 2017, 5, 6. [Google Scholar] [CrossRef] [Green Version]
- Deshmukh, S.P.; Patil, S.M.; Mullani, S.B.; Delekar, S.D. Silver nanoparticles as an effective disinfectant: A review. Mater. Sci. Eng. C 2019, 97, 954–965. [Google Scholar] [CrossRef]
- Cavaleiro, D.; Carvalho, S.; Cavaleiro, A.; Fernandes, F. TiSiN(Ag) films deposited by HiPIMS working in DOMS mode: Effect of Ag content on structure, mechanical properties and thermal stability. Appl. Surf. Sci. 2019, 478, 426–434. [Google Scholar] [CrossRef]
- Manninen, N.K.; Galindo, R.E.; Benito, N.; Figueiredo, N.M.; Cavaleiro, A.; Palacio, C.; Carvalho, S. Ag-Ti(C, N)-based coatings for biomedical applications: Influence of silver content on the structural properties. J. Phys. D. Appl. Phys. 2011, 44, 375501. [Google Scholar] [CrossRef]
- Domingues, R.P.; Rodrigues, M.S.; Lopes, C.; Pedrosa, P.; Alves, E.; Barradas, N.P.; Borges, J.; Vaz, F. Thin films composed of metal nanoparticles (Au, Ag, Cu) dispersed in AlN: The influence of composition and thermal annealing on the structure and plasmonic response. Thin Solid Films 2019, 676, 12–25. [Google Scholar] [CrossRef]
- De Los Arcos, T.; Oelhafen, P.; Aebi, U.; Hefti, A.; Düggelin, M.; Mathys, D.; Guggenheim, R. Preparation and characterization of TiN-Ag nanocomposite films. Vacuum 2002, 67, 463–470. [Google Scholar] [CrossRef]
- Folkenant, M.; Nygren, K.; Malinovskis, P.; Palisaitis, J.; Persson, P.O.Å.; Lewin, E.; Jansson, U. Structure and properties of Cr-C/Ag films deposited by magnetron sputtering. Surf. Coat. Technol. 2015, 281, 184–192. [Google Scholar] [CrossRef]
- Manninen, N.K.; Galindo, R.E.; Carvalho, S.; Cavaleiro, A. Silver surface segregation in Ag-DLC nanocomposite coatings. Surf. Coat. Technol. 2015, 267, 90–97. [Google Scholar] [CrossRef]
- Lopes, C.; Fonseca, P.; Matamá, T.; Gomes, A.; Louro, C.; Paiva, S.; Vaz, F. Protective Ag: TiO2 thin films for pressure sensors in orthopedic prosthesis: The importance of composition, structural and morphological features on the biological response of the coatings. J. Mater. Sci. Mater. Med. 2014, 25, 2069–2081. [Google Scholar] [CrossRef] [Green Version]
- Wang, H.; Wang, L.; Wang, X. Structure characterization and antibacterial properties of Ag-DLC films fabricated by dual-targets HiPIMS. Surf. Coat. Technol. 2021, 410, 126967. [Google Scholar] [CrossRef]
- Escobar Galindo, R.; Manninen, N.K.; Palacio, C.; Carvalho, S. Advanced surface characterization of silver nanocluster segregation in Ag-TiCN bioactive coatings by RBS, GDOES, and ARXPS. Anal. Bioanal. Chem. 2013, 405, 6259–6269. [Google Scholar] [CrossRef]
- Aouadi, S.M.; Bohnhoff, A.; Sodergren, M.; Mihut, D.; Rohde, S.L.; Xu, J.; Mishra, S.R. Tribological investigation of zirconium nitride/silver nanocomposite structures. Surf. Coat. Technol. 2006, 201, 418–422. [Google Scholar] [CrossRef]
- Meškinis, S.; Vasiliauskas, A.; Šlapikas, K.; Gudaitis, R.; Andrulevičius, M.; Čiegis, A.; Niaura, G.; Kondrotas, R.; Tamulevičius, S. Bias effects on structure and piezoresistive properties of DLC: AG thin films. Surf. Coat. Technol. 2014, 255, 84–89. [Google Scholar] [CrossRef]
- Cloutier, M.; Turgeon, S.; Busby, Y.; Tatoulian, M.; Pireaux, J.J.; Mantovani, D. Controlled Distribution and Clustering of Silver in Ag-DLC Nanocomposite Coatings Using a Hybrid Plasma Approach. ACS Appl. Mater. Interfaces 2016, 8, 21020–21027. [Google Scholar] [CrossRef]
- Chu, Y.Y.; Lin, Y.S.; Chang, C.M.; Liu, J.K.; Chen, C.H.; Huang, J.C. Promising antimicrobial capability of thin film metallic glasses. Mater. Sci. Eng. C 2014, 36, 221–225. [Google Scholar] [CrossRef]
- Comby-Dassonneville, S.; Venot, T.; Borroto, A.; Longin, E.; Der Loughian, C.; Ter Ovanessian, B.; Leroy, M.A.; Pierson, J.F.; Steyer, P. ZrCuAg Thin-Film Metallic Glasses: Toward Biostatic Durable Advanced Surfaces. ACS Appl. Mater. Interfaces 2021, 13, 17062–17074. [Google Scholar] [CrossRef]
- Rajan, S.T.; Arockiarajan, A. Thin film metallic glasses for bioimplants and surgical tools: A review. J. Alloys Compd. 2021, 876, 159939. [Google Scholar] [CrossRef]
- Guo, Y.N.; Inoue, A.; Han, Y.; Kong, F.L.; Feng, B.; Zhu, S.L.; Ikuhara, Y. Influence of Ag replacement on the formation and heating-induced phase decomposition of Zr65Al7.5Co27.5−xAgx (x = 5 to 20 at.%) glassy alloys. J. Alloys Compd. 2019, 783, 545–554. [Google Scholar] [CrossRef]
- Yang, Y.J.; Cheng, B.Y.; Jin, Z.S.; Gao, H.X.; Ma, M.Z.; Zhang, X.Y. Crystallization kinetics and mechanical properties of Zr56Cu24Al9Ni7−xTi4Agx (x = 0, 1, 3, 5, and 7) metallic glasses. J. Alloys Compd. 2020, 816, 152589. [Google Scholar] [CrossRef]
- Mattern, N.; Han, J.H.; Pradeep, K.G.; Kim, K.C.; Park, E.M.; Kim, D.H.; Yokoyama, Y.; Raabe, D.; Eckert, J. Structure of rapidly quenched (Cu0.5Zr0.5) 100−xAgx alloys (x = 0–40 at.%). J. Alloys Compd. 2014, 607, 285–290. [Google Scholar] [CrossRef]
- Schnabel, V.; Köhler, M.; Evertz, S.; Gamcova, J.; Bednarcik, J.; Music, D.; Raabe, D.; Schneider, J.M. Revealing the relationships between chemistry, topology and stiffness of ultrastrong Co-based metallic glass thin films: A combinatorial approach. Acta Mater. 2016, 107, 213–219. [Google Scholar] [CrossRef]
- Björck, M.; Andersson, G. GenX: An extensible X-ray reflectivity refinement program utilizing differential evolution. J. Appl. Crystallogr. 2007, 40, 1174–1178. [Google Scholar] [CrossRef]
- Moro, M.V.; Holeňák, R.; Zendejas Medina, L.; Jansson, U.; Primetzhofer, D. Accurate high-resolution depth profiling of magnetron sputtered transition metal alloy films containing light species: A multi-method approach. Thin Solid Films 2019, 686, 137416. [Google Scholar] [CrossRef] [Green Version]
- Janson, M.S. CONTES Instruction Manual; Internal Report; Uppsala University: Uppsala, Sweden, 2004. [Google Scholar]
- Mayer, M. SIMNRA, a simulation program for the analysis of NRA, RBS and ERDA. AIP Conf. Proc. 1999, 475, 541–544. [Google Scholar] [CrossRef]
- Bönninghoff, N.; Diyatmika, W.; Chu, J.P.; Mráz, S.; Schneider, J.M.; Lin, C.L.; Eriksson, F.; Greczynski, G. ZrCuAlNi thin film metallic glass grown by high power impulse and direct current magnetron sputtering. Surf. Coat. Technol. 2021, 412, 127029. [Google Scholar] [CrossRef]
- Emmerlich, J.; Mráz, S.; Snyders, R.; Jiang, K.; Schneider, J.M. The physical reason for the apparently low deposition rate during high-power pulsed magnetron sputtering. Vacuum 2008, 82, 867–870. [Google Scholar] [CrossRef]
- Kang, D.H.; Jung, I.H. Critical thermodynamic evaluation and optimization of the Ag-Zr, Cu-Zr and Ag-Cu-Zr systems and its applications to amorphous Cu-Zr-Ag alloys. Intermetallics 2010, 18, 815–833. [Google Scholar] [CrossRef]
- Hu, Y.; Rupert, T.J. Atomistic modeling of interfacial segregation and structural transitions in ternary alloys. J. Mater. Sci. 2019, 54, 3975–3993. [Google Scholar] [CrossRef] [Green Version]
- Saeed, U.; Flandorfer, H.; Ipser, H. Lead-free solders: Enthalpies of mixing of liquid alloys in the Ag-Ni and Ag-Ni-Sn systems. J. Mater. Res. 2006, 21, 1294–1304. [Google Scholar] [CrossRef]
- Adhikari, D.; Singh, B.P.; Jha, I.S. Structural and energetic asymmetry in liquid Ag-Al alloys. Phys. Chem. Liq. 2010, 48, 787–796. [Google Scholar] [CrossRef]
- Agraval, P.; Dreval, L.; Turchanin, M.; Storchak-Fedyuk, A.; Artyukh, L.; Velikanova, T. Enthalpy of mixing of liquid Ni-Ti-Zr alloys at 1873 K. J. Chem. Thermodyn. 2017, 106, 309–316. [Google Scholar] [CrossRef]
- Yadav, S.K.; Lamichhane, S.; Jha, L.N.; Adhikari, N.P.; Adhikari, D. Mixing behaviour of Ni-Al melt at 1873 K. Phys. Chem. Liq. 2016, 54, 370–383. [Google Scholar] [CrossRef]
- Agraval, P.; Turchanin, M.; Dreval, L.; Vodopyanova, A. Mixing enthalpy of liquid Cu-Hf-Ni alloys at 1873 K. J. Therm. Anal. Calorim. 2017, 128, 1753–1763. [Google Scholar] [CrossRef]
- Mulligan, C.P.; Papi, P.A.; Gall, D. Ag transport in CrN-Ag nanocomposite coatings. Thin Solid Films 2012, 520, 6774–6779. [Google Scholar] [CrossRef]
- Hu, J.J.; Muratore, C.; Voevodin, A.A. Silver diffusion and high-temperature lubrication mechanisms of YSZ-Ag-Mo based nanocomposite coatings. Compos. Sci. Technol. 2007, 67, 336–347. [Google Scholar] [CrossRef]
- Incerti, L.; Rota, A.; Ballestrazzi, A.; Gualtieri, E.; Valeri, S. Ag surface diffusion and out-of-bulk segregation in CrN-Ag nano-composite coatings. J. Nanosci. Nanotechnol. 2011, 11, 9260–9266. [Google Scholar] [CrossRef]
- Oh, J.C.; Ohkubo, T.; Kim, Y.C.; Fleury, E.; Hono, K. Phase separation in Cu43Zr43Al7Ag 7 bulk metallic glass. Scr. Mater. 2005, 53, 165–169. [Google Scholar] [CrossRef]
- Gammer, C.; Escher, B.; Ebner, C.; Minor, A.M.; Karnthaler, H.P.; Eckert, J.; Pauly, S.; Rentenberger, C. Influence of the Ag concentration on the medium-range order in a CuZrAlAg bulk metallic glass. Sci. Rep. 2017, 7, 44903. [Google Scholar] [CrossRef] [Green Version]
- Rajan, S.T.; Nanda Kumar, A.K.; Subramanian, B. Nanocrystallization in magnetron sputtered Zr-Cu-Al-Ag thin film metallic glasses. CrystEngComm 2014, 16, 2835–2844. [Google Scholar] [CrossRef]
- Stelzer, B.; Chen, X.; Bliem, P.; Hans, M.; Völker, B.; Sahu, R.; Scheu, C.; Primetzhofer, D.; Schneider, J.M. Remote Tracking of Phase Changes in Cr2AlC Thin Films by In-situ Resistivity Measurements. Sci. Rep. 2019, 9, 8266. [Google Scholar] [CrossRef] [PubMed] [Green Version]
- Stelzer, B.; Momma, M.; Schneider, J.M. Autonomously Self-Reporting Hard Coatings: Tracking the Temporal Oxidation Behavior of TiN by In Situ Sheet Resistance Measurements. Adv. Funct. Mater. 2020, 30, 2000146. [Google Scholar] [CrossRef]
- Azina, C.; Mráz, S.; Greczynski, G.; Hans, M.; Primetzhofer, D.; Schneider, J.M.; Eklund, P. Oxidation behaviour of V2AlC MAX phase coatings. J. Eur. Ceram. Soc. 2020, 40, 4436–4444. [Google Scholar] [CrossRef]


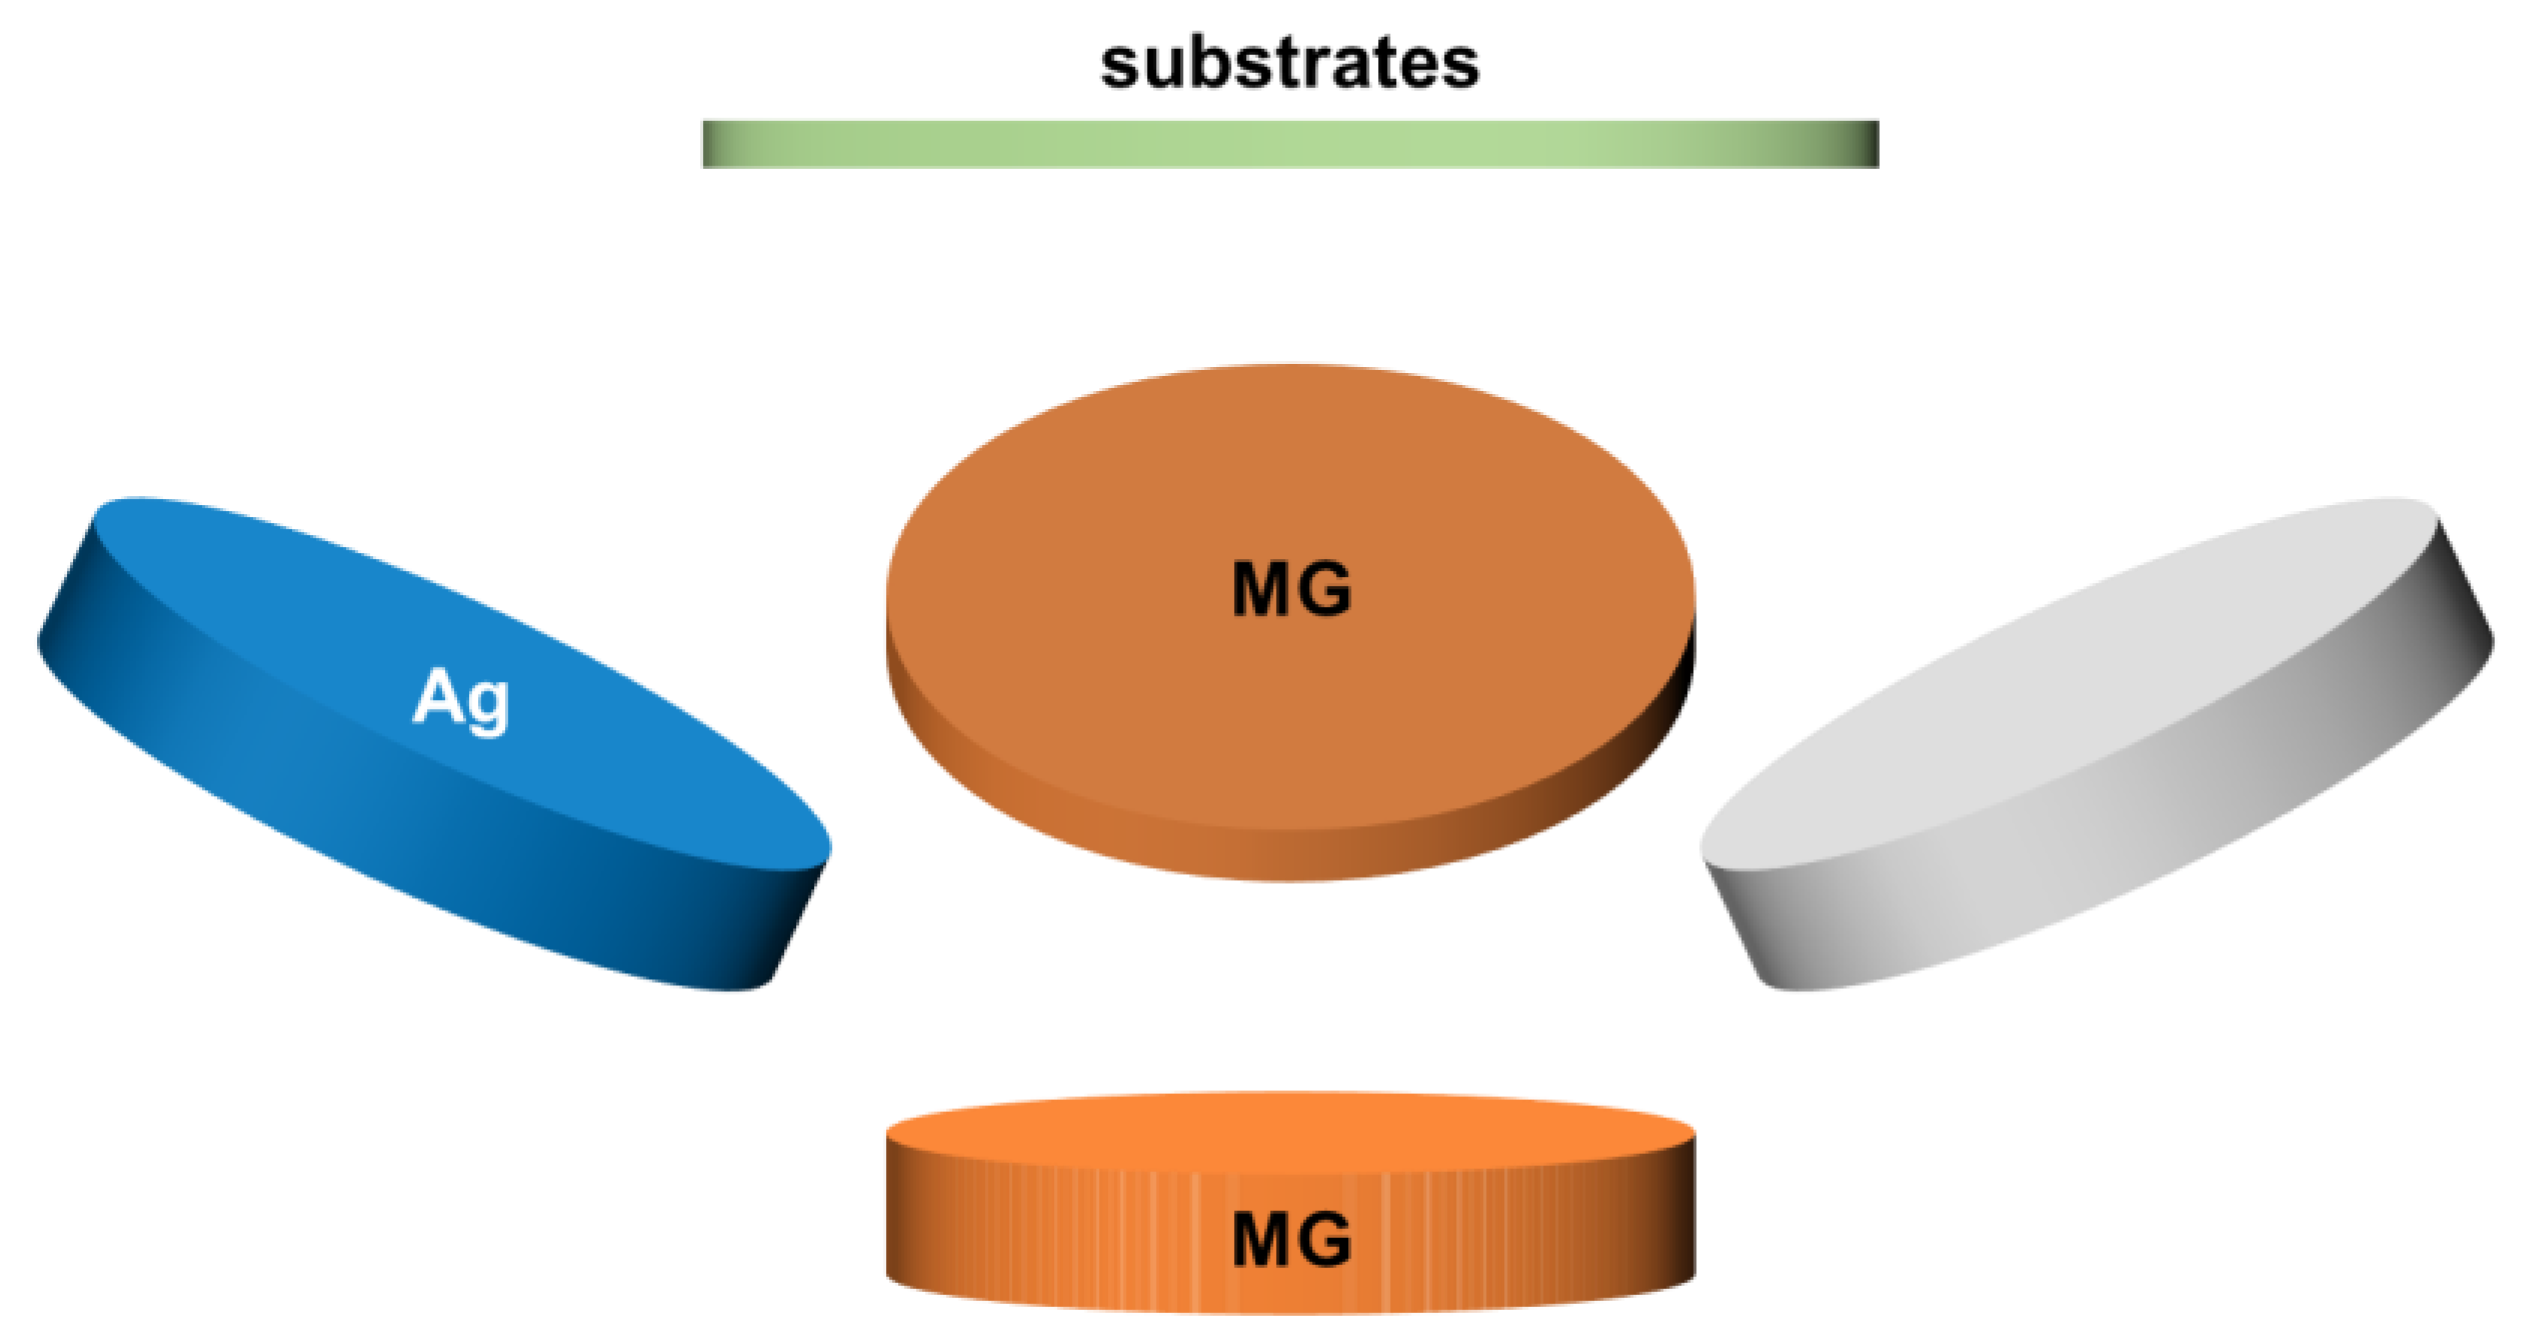
| Deposition Parameters | Zr60Cu25Al10Ni5 | Ag |
|---|---|---|
| Sputtering mode | DCMS * | HPPMS ** |
| Target power (W) | 22–100/target | 40 |
| Duty cycle (%) | 0.25 | |
| ton/toff | 80/31,920 | |
| Peak current density (A/cm2) | 0.18–0.35 | |
| Substrate temperature (°C) | 60, 200, 400 | |
| Substrate bias potential (V) | Floating 1, −80 | |
| Sample | Zr (at.%) | Cu (at.%) | Al (at.%) | Ni (at.%) | Ag (at.%) | O (at.%) |
|---|---|---|---|---|---|---|
| 0 at.%, floating, 60 °C | 52.4 | 25.4 | 11.3 | 7.1 | - | 3.8 |
| 7.5 at.%, floating, 60 °C | 50.1 | 23.1 | 10.1 | 6.4 | 7.7 | 2.6 |
| 15 at.%, floating, 60 °C | 45.9 | 20.7 | 9.0 | 5.8 | 15.1 | 3.5 |
| 30 at.%, floating, 60 °C | 38.0 | 15.4 | 6.6 | 4.0 | 27.5 | 8.5 |
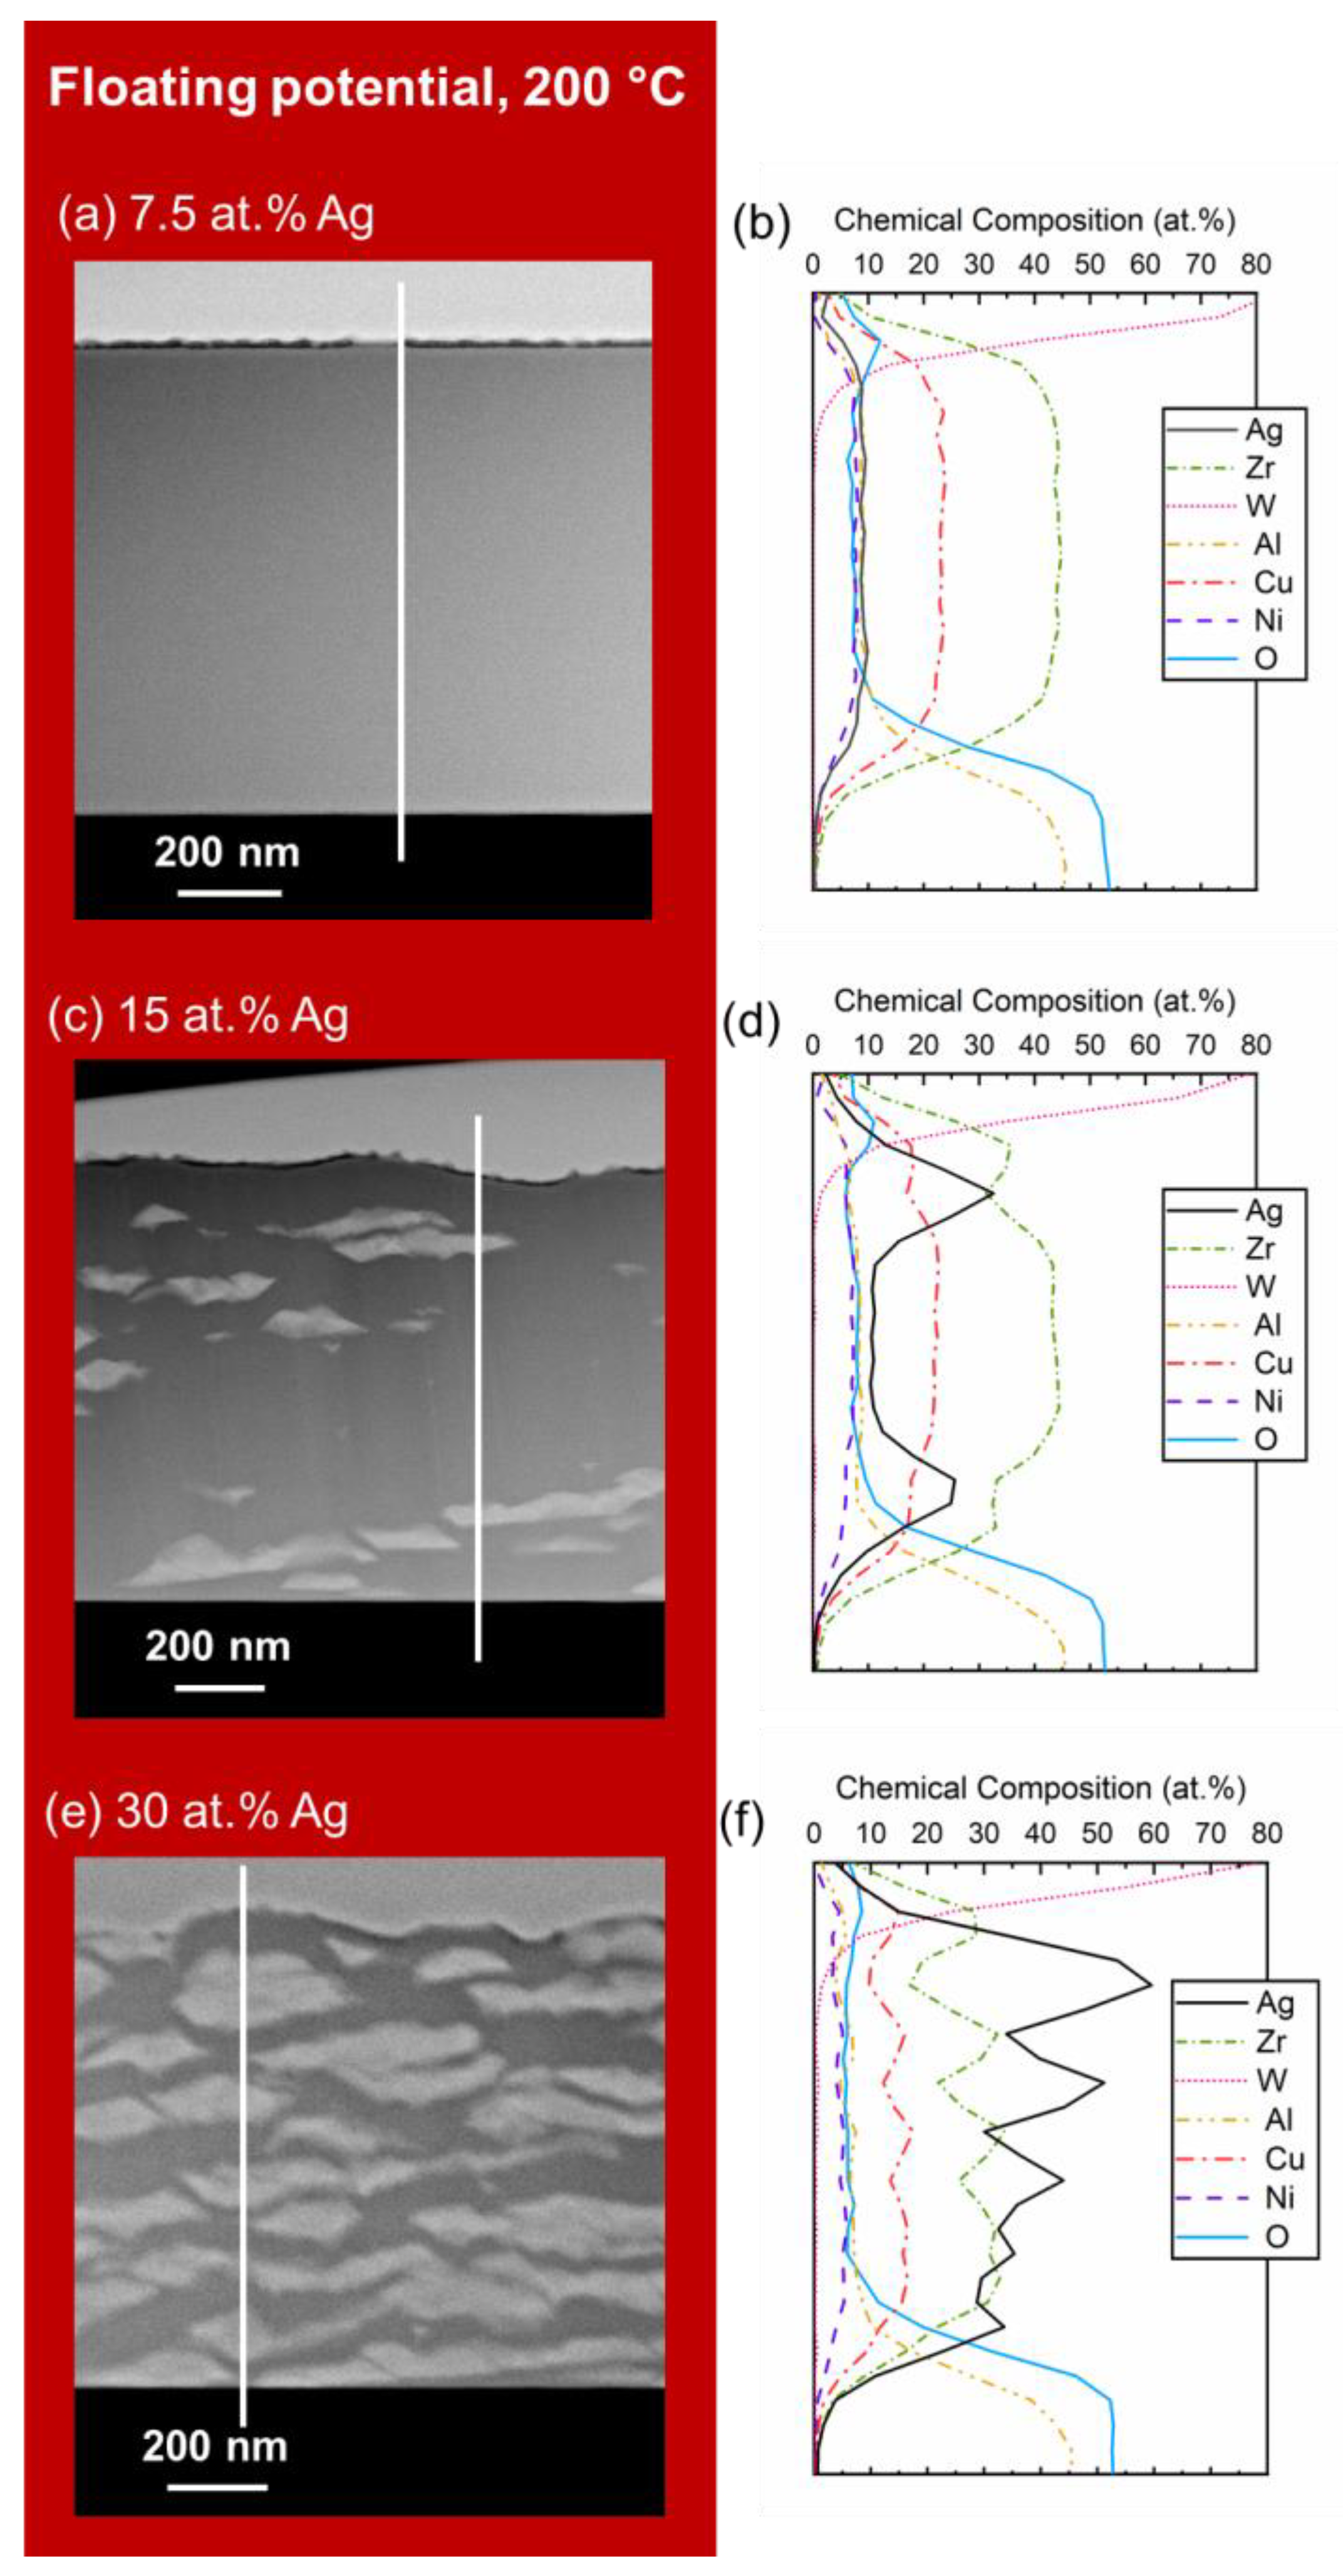
| 0 at.%, floating, 200 °C | 53.8 | 24.8 | 11.0 | 6.8 | - | 3.6 |
| 7.5 at.%, floating, 200 °C | 49.6 | 23.0 | 9.5 | 5.9 | 8.0 | 4.0 |
| 15 at.%, floating, 200 °C | 46.2 | 20.0 | 8.4 | 5.1 | 15.6 | 4.7 |
| 30 at.%, floating, 200 °C | 36.9 | 15.3 | 6.6 | 4.0 | 32.6 | 4.6 |
| 0 at.%, −80 V, 60 °C | 55.1 | 25.0 | 10.1 | 6.8 | - | 3.0 |
| 7.5 at.%, −80 V, 60 °C | 50.6 | 22.5 | 8.6 | 5.9 | 8.4 | 4.0 |
| 15 at.%, −80 V, 60 °C | 46.5 | 19.8 | 7.4 | 4.3 | 16.1 | 4.9 |
| 30 at.%, −80 V, 60 °C | 37.1 | 14.8 | 6.1 | 3.7 | 32.1 | 6.2 |
| 0 at.%, −80 V, 200 °C | 53.7 | 24.8 | 11.1 | 6.6 | - | 3.8 |
| 7.5 at.%, −80 V, 200 °C | 52.2 | 22.9 | 8.9 | 6.1 | 5.7 | 4.2 |
| 15 at.%, −80 V, 200 °C | 46.7 | 19.6 | 7.5 | 5.2 | 16.9 | 4.1 |
| 30 at.%, −80 V, 200 °C | 38.7 | 15.8 | 6.8 | 4.1 | 29.6 | 5.0 |
| Metal | Zr | Cu | Al | Ni | Ag |
|---|---|---|---|---|---|
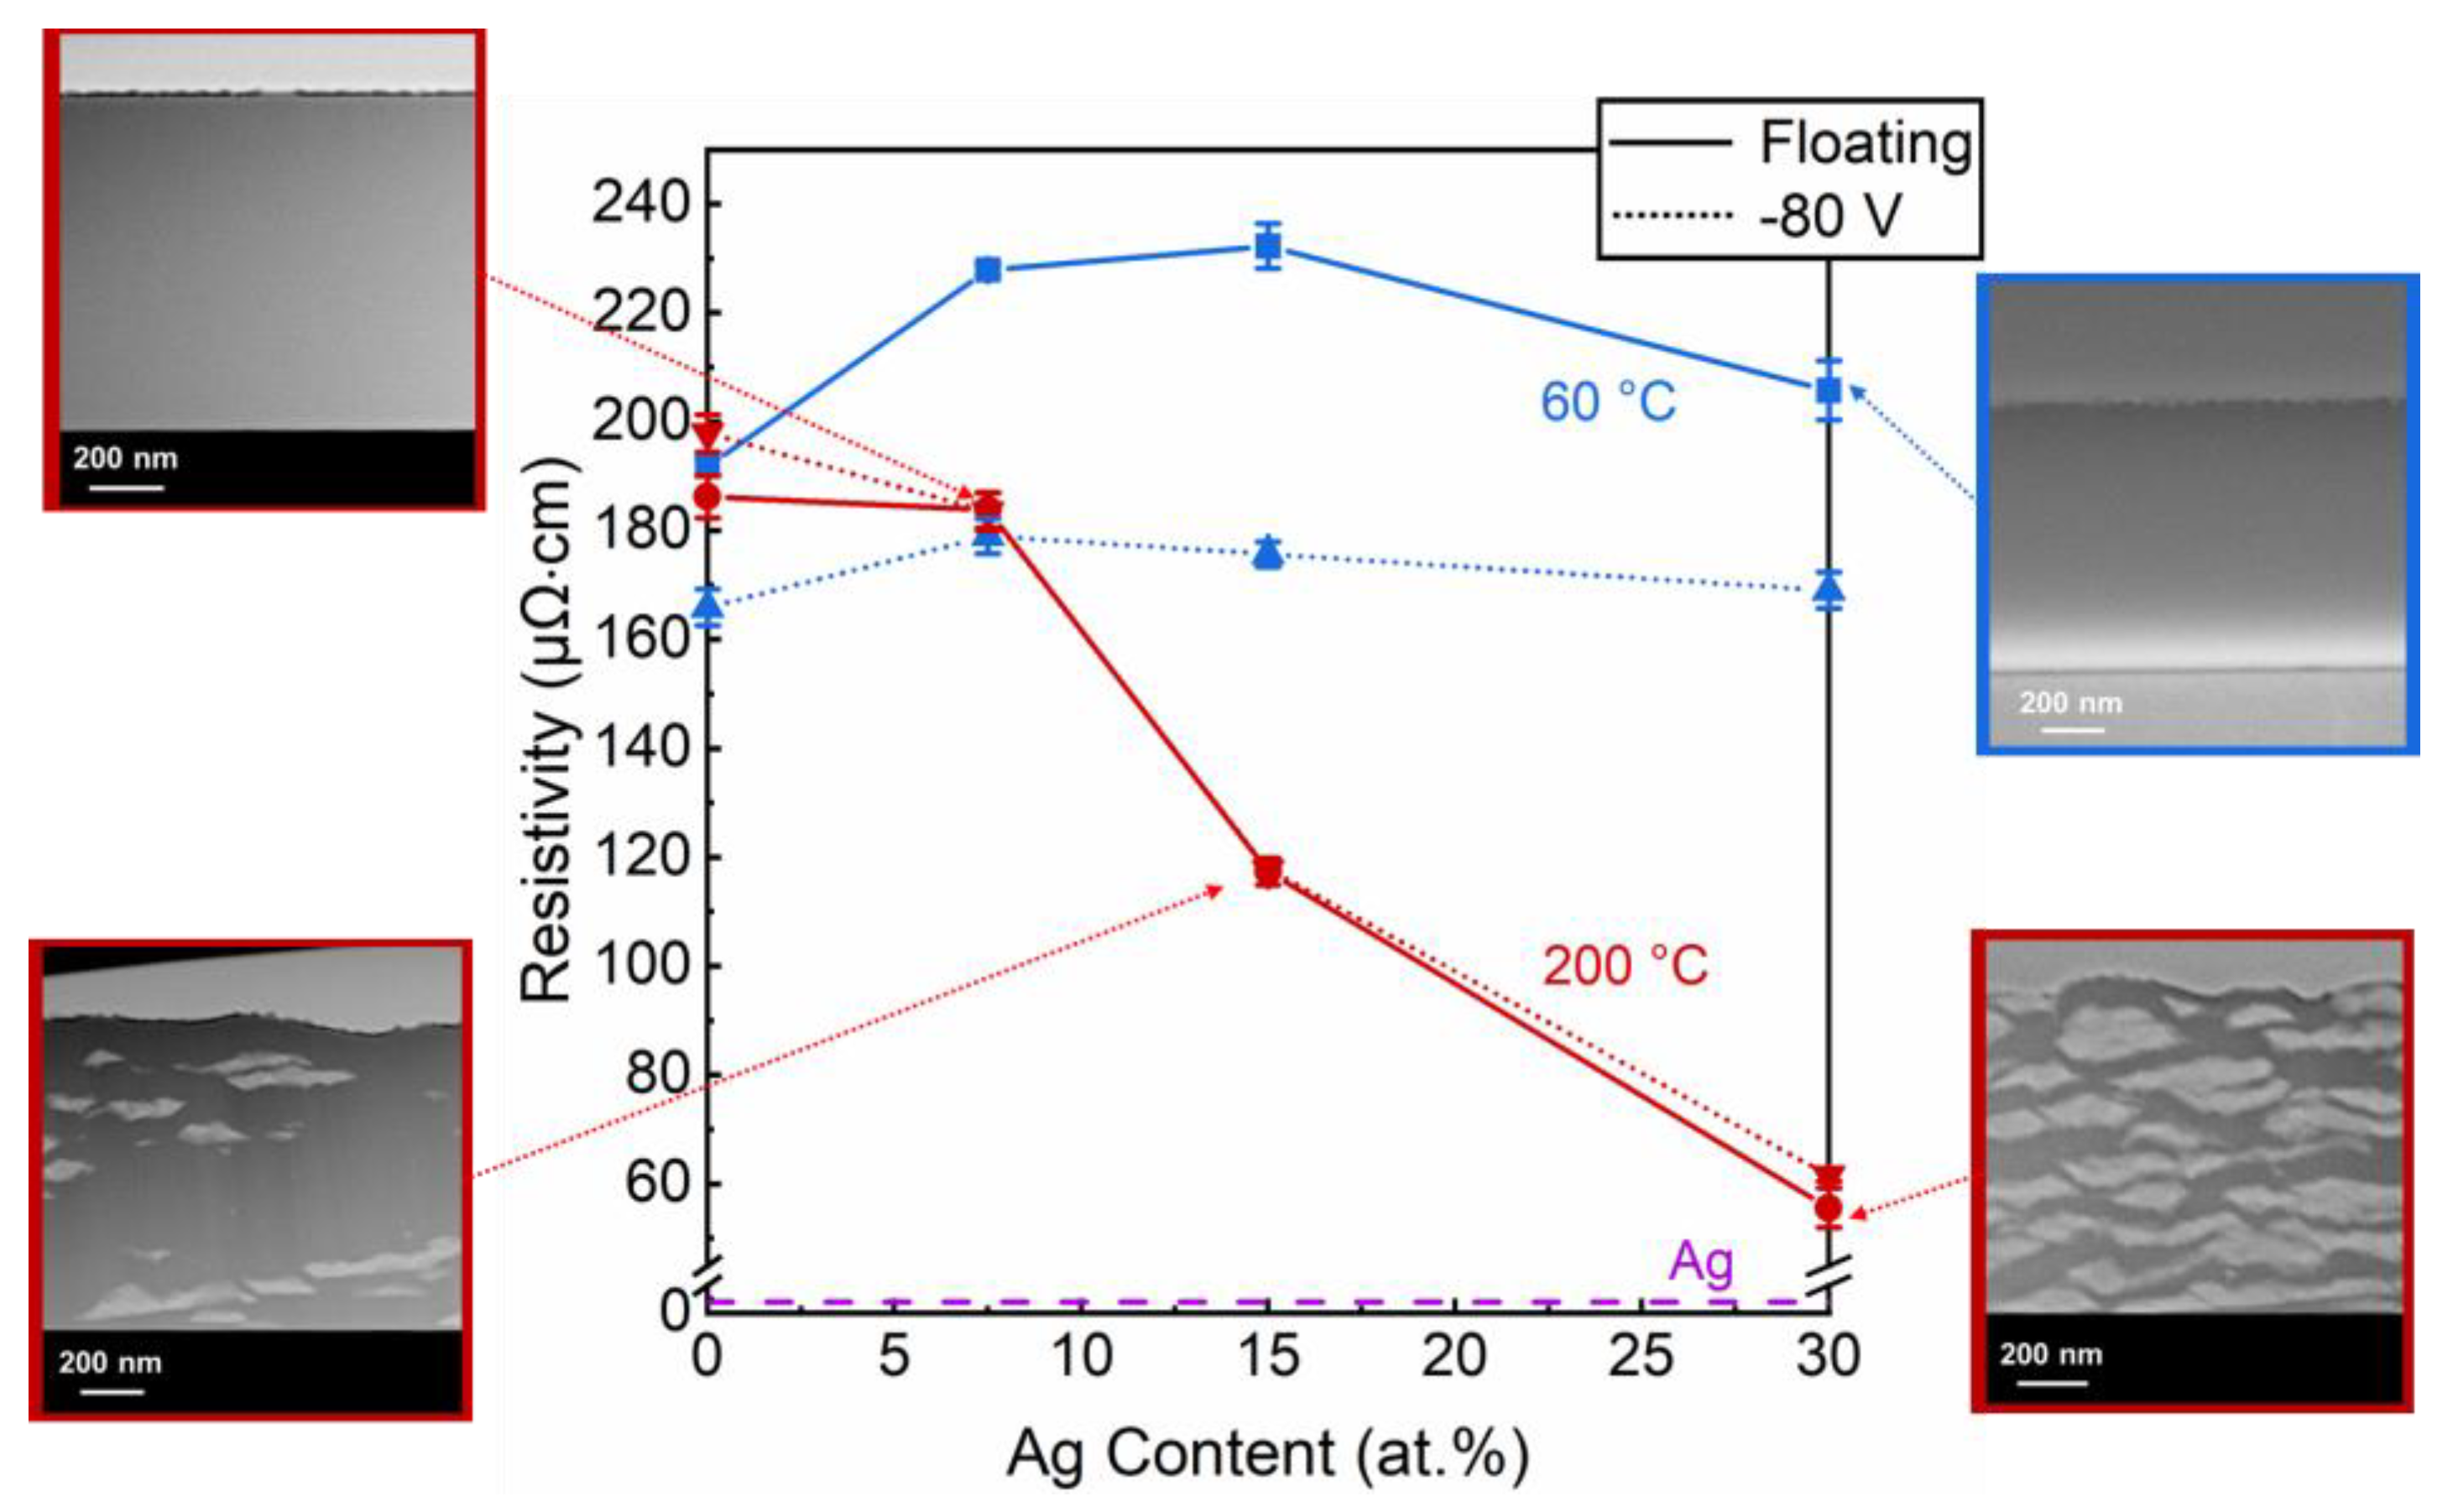
| Electrical resistivity (μΩ·cm) | 42 | 1.7 | 2.6 | 7 | 1.6 |
Publisher’s Note: MDPI stays neutral with regard to jurisdictional claims in published maps and institutional affiliations. |
© 2022 by the authors. Licensee MDPI, Basel, Switzerland. This article is an open access article distributed under the terms and conditions of the Creative Commons Attribution (CC BY) license (https://creativecommons.org/licenses/by/4.0/).
Share and Cite
Steinhoff, M.K.; Holzapfel, D.M.; Karimi Aghda, S.; Neuß, D.; Pöllmann, P.J.; Hans, M.; Primetzhofer, D.; Schneider, J.M.; Azina, C. Ag Surface and Bulk Segregations in Sputtered ZrCuAlNi Metallic Glass Thin Films. Materials 2022, 15, 1635. https://doi.org/10.3390/ma15051635
Steinhoff MK, Holzapfel DM, Karimi Aghda S, Neuß D, Pöllmann PJ, Hans M, Primetzhofer D, Schneider JM, Azina C. Ag Surface and Bulk Segregations in Sputtered ZrCuAlNi Metallic Glass Thin Films. Materials. 2022; 15(5):1635. https://doi.org/10.3390/ma15051635
Chicago/Turabian StyleSteinhoff, Michael K., Damian M. Holzapfel, Soheil Karimi Aghda, Deborah Neuß, Peter J. Pöllmann, Marcus Hans, Daniel Primetzhofer, Jochen M. Schneider, and Clio Azina. 2022. "Ag Surface and Bulk Segregations in Sputtered ZrCuAlNi Metallic Glass Thin Films" Materials 15, no. 5: 1635. https://doi.org/10.3390/ma15051635
APA StyleSteinhoff, M. K., Holzapfel, D. M., Karimi Aghda, S., Neuß, D., Pöllmann, P. J., Hans, M., Primetzhofer, D., Schneider, J. M., & Azina, C. (2022). Ag Surface and Bulk Segregations in Sputtered ZrCuAlNi Metallic Glass Thin Films. Materials, 15(5), 1635. https://doi.org/10.3390/ma15051635