Article

Synthesis and Characterization of High-Purity Mesoporous Alumina with Excellent Adsorption Capacity for Congo Red

1
Department of Materials Science and Engineering, Guilin University of Technology, Guilin 541000, China
2
Collaborative Innovation Center for Exploration of Nonferrous Metal Deposits and Efficient Utilization of Resources, Guilin University of Technology, Guilin 541000, China
3
Key Laboratory of New Processing Technology for Nonferrous Metals and Materials, Ministry of Education, Guilin University of Technology, Guilin 541000, China
*
Author to whom correspondence should be addressed.
Materials 2022, 15(3), 970; https://doi.org/10.3390/ma15030970
Submission received: 23 December 2021 / Revised: 18 January 2022 / Accepted: 21 January 2022 / Published: 27 January 2022
(This article belongs to the Topic Metallurgical and Materials Engineering)

Abstract

:
We explore a more concise process for the preparation of high-purity alumina and to address the problem of some conventional micro- and nano-adsorbents having difficulty in exposing their adsorption sites to target pollutants in solution due to the heavy aggregation of the adsorbent, which confers poor adsorption properties. The methods of using gamma-phase high-purity mesoporous alumina (HPMA), with its excellent adsorption properties and high adsorption rates of Congo Red, and of using lower-cost industrial aluminum hydroxide by direct aging and ammonium salt substitution were successfully employed. The results showed that the purity of HPMA was as high as 99.9661% and the total removal rate of impurities was 98.87%, a consequence of achieving a large specific surface area of 312.43 m2 g−1, a pore volume of 0.55 cm3 g−1, and an average pore diameter of 3.8 nm. The adsorption process was carried out at 25 °C, the concentration of Congo Red (CR) dye was fixed at 250 mg L−1 and the amount of adsorbent used was 100 mg. The HPMA sample exhibited an extremely fast adsorption rate in the first 10 min, with adsorption amounts up to 476.34 mg g−1 and adsorption efficiencies of 96.27%. The adsorption equilibrium was reached in about 60 min, at which time the adsorbed amount was 492.19 mg g−1 and the dye removal rate was as high as 98.44%. One-hundred milligrams of adsorbent were weighed and dispersed in 200-mL CR solutions with mass concentrations ranging from 50–1750 mg L−1 to study the adsorption isotherms. This revealed that the saturation adsorption capacity of the produced HPMA was 1984.64 mg g−1. Furthermore, the process of adsorbing Congo Red in the synthesized product was consistent with a pseudo-second order model and the Langmiur model. It is expected that this method of producing HPMA will provide a productive, easy and efficient means of treating toxic dyes in industrial wastewater.

1. Introduction

High-purity alumina (HPA), one of the cutting-edge materials of the 21st century, is widely used in modern industrial products for its excellent physical and chemical properties, for instance, high strength wear and corrosion-resistant candle materials, special gas additives, advanced ceramic materials, catalysts and their carriers, biomedical, protective materials, single crystal materials, laser crystals and many other fields [1,2,3,4,5,6,7,8,9,10,11]. Impurity elements are mostly present in alumina in the form of oxides, such as sodium oxide, iron oxide, silicon dioxide, etc., and diverse miscellaneous impurities have different effects on its performance, thus limiting the widespread use of alumina. HPA is classified into the 3N (99.9%), 4N (99.99%) and 5N (99.999%) grades, according to the mass purity of the alumina. HPA price and volume demand both depend on its purity [12], as shown in Table 1. Therefore, the study of the preparation process of high-purity alumina has very broad prospects, far-reaching significance and economic impact.
With the progress in and development of science and technology, there have been a series of preparation methods for HPA materials, including organic aluminum alcohol hydrolysis, ammonium aluminum sulfate pyrolysis, ammonium aluminum carbonate pyrolysis, the modified Bayer method and the roasting method, etc. [13,14,15,16,17,18,19,20].
The method of alcohol–aluminum hydrolysis has often been employed in China. In detail, in the presence of a catalyst, metallic aluminum and organic alcohol are mixed and reacted to obtain an alcohol–aluminum solution, which is followed by hydrolysis and high-temperature roasting of the intermediates to synthesize HPA products. The advantage of this method is the high purity and small particle size of the prepared alumina products, whereas, its high production cost and its being a complicated and uncontrollable process limit its economic efficiency.
The pyrolysis of ammonium aluminum sulfate is a traditional preparation method that has been studied by researchers both in China and globally that focuses on controlling the synthesis conditions to obtain pure ammonium aluminum sulfate, or on crystallizing the resulting ammonium aluminum sulfate several times for purification purposes. The process is cheap and is easily obtains the required raw materials, while the parent alcohol can be recycled, reducing the burden of waste liquid disposal. However, the product may not be calcined sufficiently, resulting in significant sulfate content and unsatisfactory purity, and the ammonia and sulfur trioxide produced pollute the environment, which is not conducive to the realization of environmental friendliness.
The ammonium aluminum carbonate pyrolysis method improves the above technology of the pyrolysis of ammonium aluminum sulfate and overcomes the disadvantages of the production process of ammonium aluminum sulfate, which pollute the environment; however, this method increases the burden of (NH4)SO4 waste liquid disposal, which is also pollutes the environment.
Congo Red (CR), a water-soluble acidic anionic azo pigment, is commonly used in the textile industry because of its strong adsorption to cellulose; thus, the discharge of wastewater in the textile industry contains Congo Red components. It can affect aquatic organisms and the food chain, even if the CR concentration in water is very low [21], such as by increasing chemical oxygen demand (COD) at the water surface and interfering with sunlight penetration through the water surface, reducing photosynthetic activity [22]. In addition, it can seriously affect kidney function, the reproductive system, liver function, the brain and central nervous system and eventually cause allergic reactions [23] to water quality or even cancer. Given China’s emphasis on environmental protection and the gradual increase in national awareness of environmental protection, a large number of technical means of eliminating the impact of pigments on people’s lives and the environment have been widely studied—for instance, turbidity point extraction [24,25,26,27], precipitation [28,29,30,31,32], membrane filtration [33,34], adsorption [35,36,37,38] and photocatalytic degradation [39,40,41,42]. Among them, adsorption has become the main treatment method for textile industry wastewater, with many advantages, such as low material price, little required equipment, a simple treatment process and superior treatment effects; thus, it is widely used. The key to this technology is the choice of adsorbent, such as activated carbon, which is of interest because it requires only a simple design, is easy to handle, and is sensitive to toxic substances, but its high cost has prevented its widespread use as an adsorbent in developing countries. Thus, low-cost natural materials, industrial wastes, and agricultural by-products have attracted the interest of researchers as alternatives to those high-cost adsorbents, such as rubber peels [43], sawdust [44], rice husks [45], and lignocellulose [46]. High purity mesoporous alumina (HPMA) with its large specific surface, suitable pore structure, excellent physical properties, chemical stability and activity has been extensively employed in the area of Congo Red adsorption. In combination with the structural characteristics of HPMA itself, the following aspects are considered to improve its adsorption performance: increasing the specific surface area of HPMA [23]; controlling the structural properties of alumina texture, i.e., the pore structure of alumina [47,48]; spherification of alumina powder morphology to improve its water permeability [49]; and the use of composites of other functional active materials to improve its adsorption activity [50,51]. The focus of this study is the synthesis of HPMA with excellent adsorption properties and high adsorption rates of Congo Red using lower-cost industrial aluminum hydroxide by direct ageing and the ammonium salt substitution method to increase the pore structure and specific surface area of the material, thus enhancing the surface energy and surface bonding energy, which can be easily stabilized by bonding with other atoms and enhance the chemical activity of HPMA. The greater chemical activity induces corresponding changes in atomic transport and conformation on the surface of the alumina nanoparticles, leading to changes in the electron spin conformation and electronic energy spectrum on the surface of the HPMA material particles, which contributes to the improved adsorption performance of HPMA. Moreover, the influence on purity, crystalline structure, porosity, morphology and the Congo Red dye adsorption properties of certain key preparation parameters are also investigated.

2. Experimental Procedures

2.1. Materials

Industrial Al(OH)3 was offered by an aluminum company in Guangxi, China, the main composition of which is shown in Table 2. The other analytically pure reagents used, hydrochloric acid, ammonium oxalate, ammonium acetate and ammonium carbonate, were all purchased from Xi-long Chemical Co., Shantou, China, and were used without any pretreatment.

2.2. Preparation of Mesoporous Alumina Materials

A mass of 219.4 g of NaOH was dissolved in 500 mL of ultra-pure water to obtain a highly-concentrated sodium hydroxide solution, 281.4 g of industrial Al(OH)3 was slowly added into the NaOH solution with magnetic stirring under hydrothermal conditions at 95 °C until all solids dissolved, and then it was filtered and diluted to obtain a range of sodium aluminate solutions with diverse initial concentrations of 30 g L−1, 60 g L−1, 90 g L−1 and 120 g L−1. The pH value of the NaAl(OH)4 solution was adjusted to 10 by slowly dropping in a dilute hydrochloric acid solution. The NaAl(OH)4 solution was aged at appropriate temperature (30 °C, 60 °C, 90 °C and 120 °C) for a period of time (1 h, 1.5 h, 2 h, 2.5 h, 3 h, 3.5 h and 4 h), and washed to neutral after centrifugation. The ammonium-rich γ-AlO(OH) was obtained by adding excess ammonium solution ((NH4)2CO3, CH3COONH4 and (NH4)2C2O4) for ammonium substitution reaction. The colloidal product was dried in a blast-drying oven at 150 °C for more than 2 h, and then roasted under a constant temperature (500 °C, 700 °C, 900 °C and 1100 °C) for 4 h with temperature rising at a rate of 10 °C min−1 to obtain the product, high purity mesoporous γ-Al2O3.

2.3. Characterization of Alumina Materials

The impurity content of alumina (iron, alumina, and silicon) was measured by X-ray fluorescence spectrum analysis (XRF, XRF-1800, Shimadzu Japan Ltd., Shanghai, China) to obtain the individual impurities removal rates from alumina products, and was calculated with the following formula:
R = (M0Mt)/M0
  • M0: the individual impurities mass ratio of industrial Al(OH)3 shown in Table 1.
  • Mt: the individual impurity’s mass ratio of alumina product.
  • R: the individual impurity’s removal rate.
The morphology of the material was studied using a scanning electron microscope (SEM, S-4800, Hitachi Works, Ltd., Tokyo, Japan) worked at 5.0 KV and transmission electron microscopy (TEM, JEM-2100F, JEOL, Beijing, China). Structural phase analysis was carried out by X-ray diffraction (XRD) using CuKα radiation. The equipment was X’Pert PRO (PANalytical B.V., Almelo, The Netherlands), and the continuous mode was used to collect 2θ data from 10° to 80° with an 8° min−1 sampling pitch. The thermal stability of the adsorbent was determined using a Q500 thermogravimetric analyzer from TA company. The temperature range was 35–800 °C with a nitrogen (N2) atmosphere and the rate of increase was 10 °C min−1. The specific surface area, pore volume and pore size distribution of the sorbent were determined by liquid nitrogen adsorption using the surface area and pore porosimetry analyzer NoVA 1200e (Quantachrome Instruments, Shanghai, China) calculated using the Brunauer–Emmett–Teller (BET) and Barret–Joyner–Hallender (BJH) methods, respectively. The zeta (ζ) potential of the adsorbents was measured using a nanoparticle size and zeta point analyzer (Nani-ZS, Malvern, UK) at a pH value of 7.

2.4. Adsorption Experiments on HPMA Materials

The adsorption property of HPMA powder and its kinetic study were conducted. Two-hundred milliliters of Congo Red aqueous solution (mass concentration of 250 mg L−1) was added in a conical flask, adjusted to the pH value of 4 through 0.1M hydrochloric acid and 100 mg of the as-prepared HPMA material. The conical flask was then placed in a thermostatic water bath (DF-101S, Gongyi, China) with a controlled stirring speed of 145 rpm and a temperature of 25 °C. The solution was removed at pre-determined time intervals and the concentration of Congo Red in the removed solution was measured using Shimadzu UV-9000S spectrophotometer. The solution was then returned. The amount of sorption qt at different times was calculated using the following equation.
qt = (C0Ct) V/m
  • C0: the initial concentration of Congo Red (mg L−1)
  • Ct: the mass content of Congo Red for the corresponding time (mg L−1)
  • V: the volume of solution (L)
  • m: mass of HPMA materials (g)
  • qt: mass of adsorbent adsorbed per unit mass of adsorbent at time t
To study the adsorption isotherms, 100 mg of adsorbent was weighed and dispersed in 200-mL CR solutions with mass concentrations of 50–1750 mg L−1. These solutions were stirred for 24 h until adsorption equilibrium, and 4 mL of the supernatant after centrifugation was analyzed by UV-Vis spectrometer (UV-9000S, Shimadzu, Shanghai, China). The maximum adsorbed mass qm for CR after equilibrium was calculated by the following equation.
qm = (C0Ce) V/m
  • C0: the initial concentration of Congo Red (mg L−1)
  • Ce: the mass content of Congo Red at adsorption equilibrium (mg L−1)
  • V: the volume of solution (L)
  • m: mass of HPMA materials (g)
  • qm: the maximum adsorbed mass

3. Results and Discussion

3.1. Effects of Various Factors on the Mesoporous Alumina Product

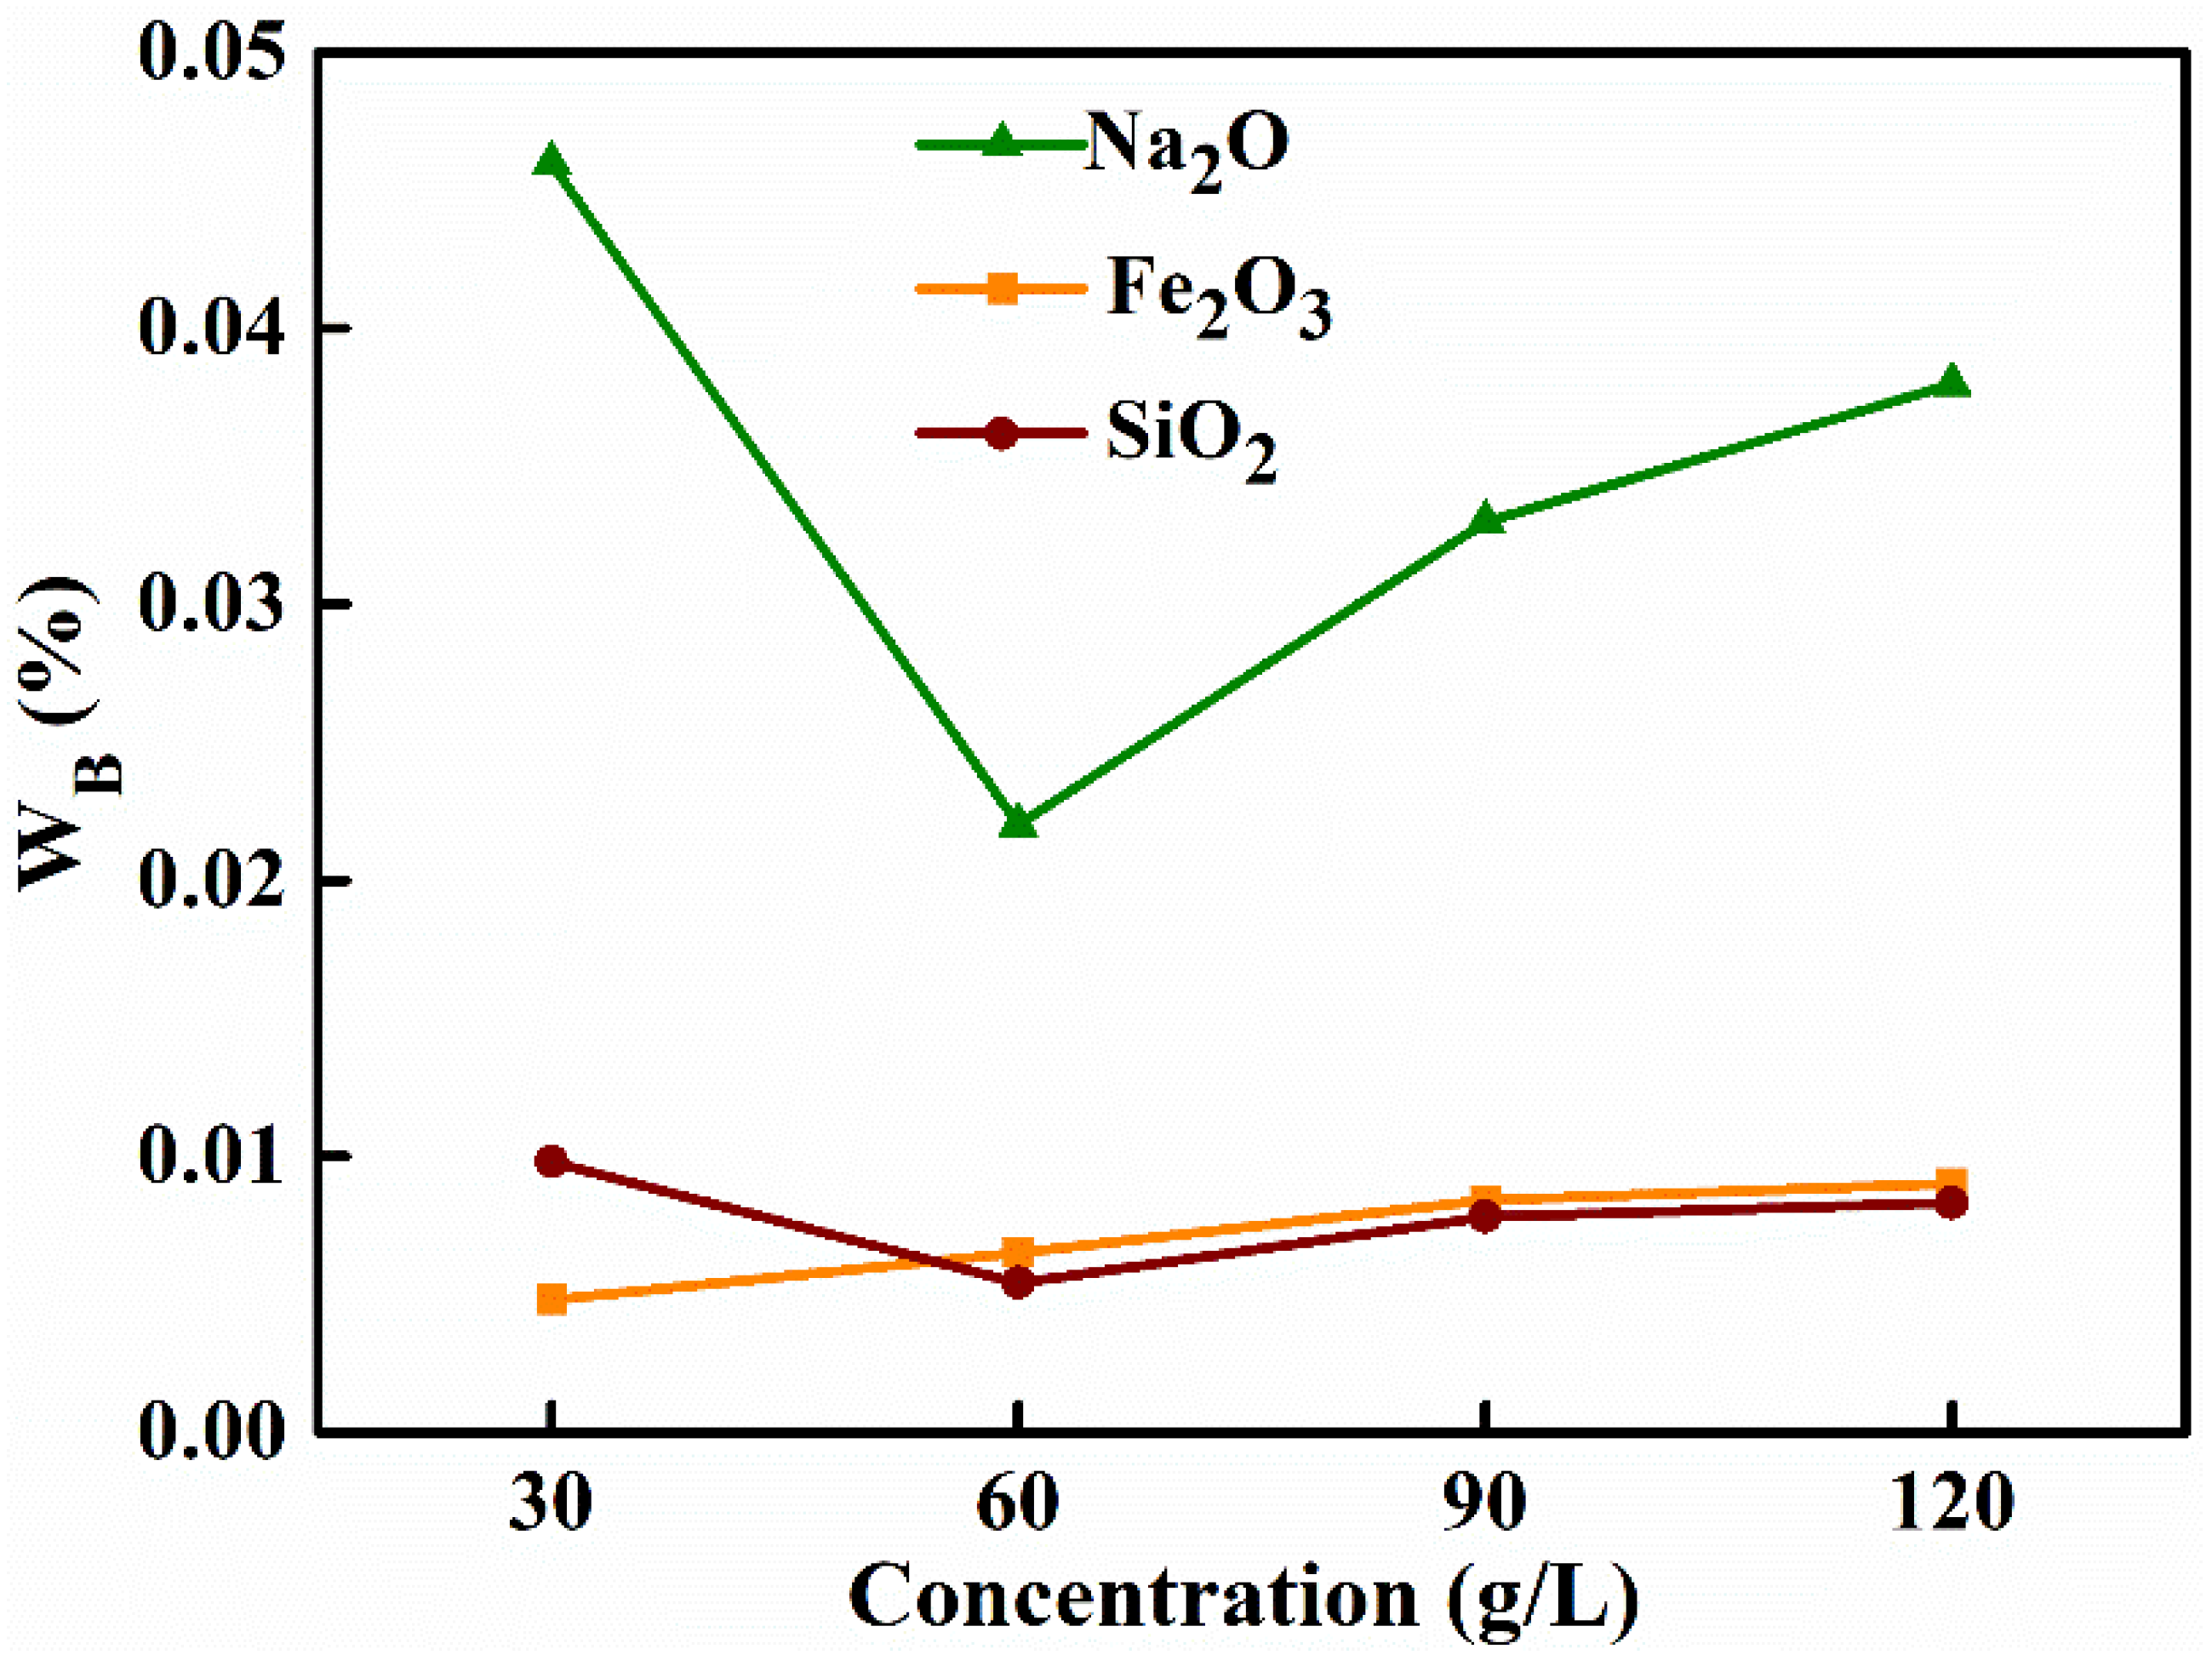
3.1.1. Initial Concentration of NaAl(OH)4 Solution

The initial concentration of NaAl(OH)4 solution is a key parameter to the preparation of high-purity MA material. Therefore, a series of alumina materials were prepared with the ageing temperature of 60 °C, ageing time of 2 h, and the roasting temperature of 500 °C. The mass concentration of the (NH4)2CO3 solution was 75 g L−1 and for the NaAl(OH)4 solutions, with different mass concentrations, were 30 g L−1, 60 g L−1, 90 g L−1 and 120 g L−1. The solutions were prepared to study the effect of the initial mass concentration on the impurities contents of the products. As shown in Figure 1 and Table 3, with the increase of the initial concentration of NaAl(OH)4 from 30 g L−1 to 120 g L−1, the iron oxide content gradually increased from 0.0048% to 0.009%, the silica content initially decreased from 0.0098% to 0.0054% and then increased to 0.0083%; the sodium oxide content similarly firstly decreased from 0.046% to 0.022% and then increased to 0.038%. The overall impurity removal rate, on the other hand, increased from 97.97% to 98.86% and then decreased to 98.15% and the purity of alumina rises from 99.9393% to 99.9661% and then falls to 99.9447%.
Al(OH)3 + NaOH = NaAl(OH)4;
Fe2O3 + 2NaOH + 3H2O = 2NaFe(OH)4;
SiO2 + 2NaOH = Na2SiO3 + H2O;
2NaAl(OH)4 + 1.7Na2SiO3 = Na2O Al2O3·1.7SiO2·nH2O↓ + 3.4NaOH + 3H2O
From the above reaction equation, it can be seen that the SiO2 impurities present in the raw material reacted with NaOH to form NaSiO3, and NaSiO3 further reacted with NaAl(OH)4 to form precipitates, which facilitated the removal of SiO2. On the other hand, iron oxide reacted with sodium aluminate to form soluble NaFe(OH)4, which increased the amount of iron oxide impurities in the MA. Meanwhile, as the initial concentration gradually increased, the concentration of sodium ions rose and the viscosity of the solution increased, so that the content of each impurity in the product showed an increasing trend after the concentration exceeded 60 g L−1.

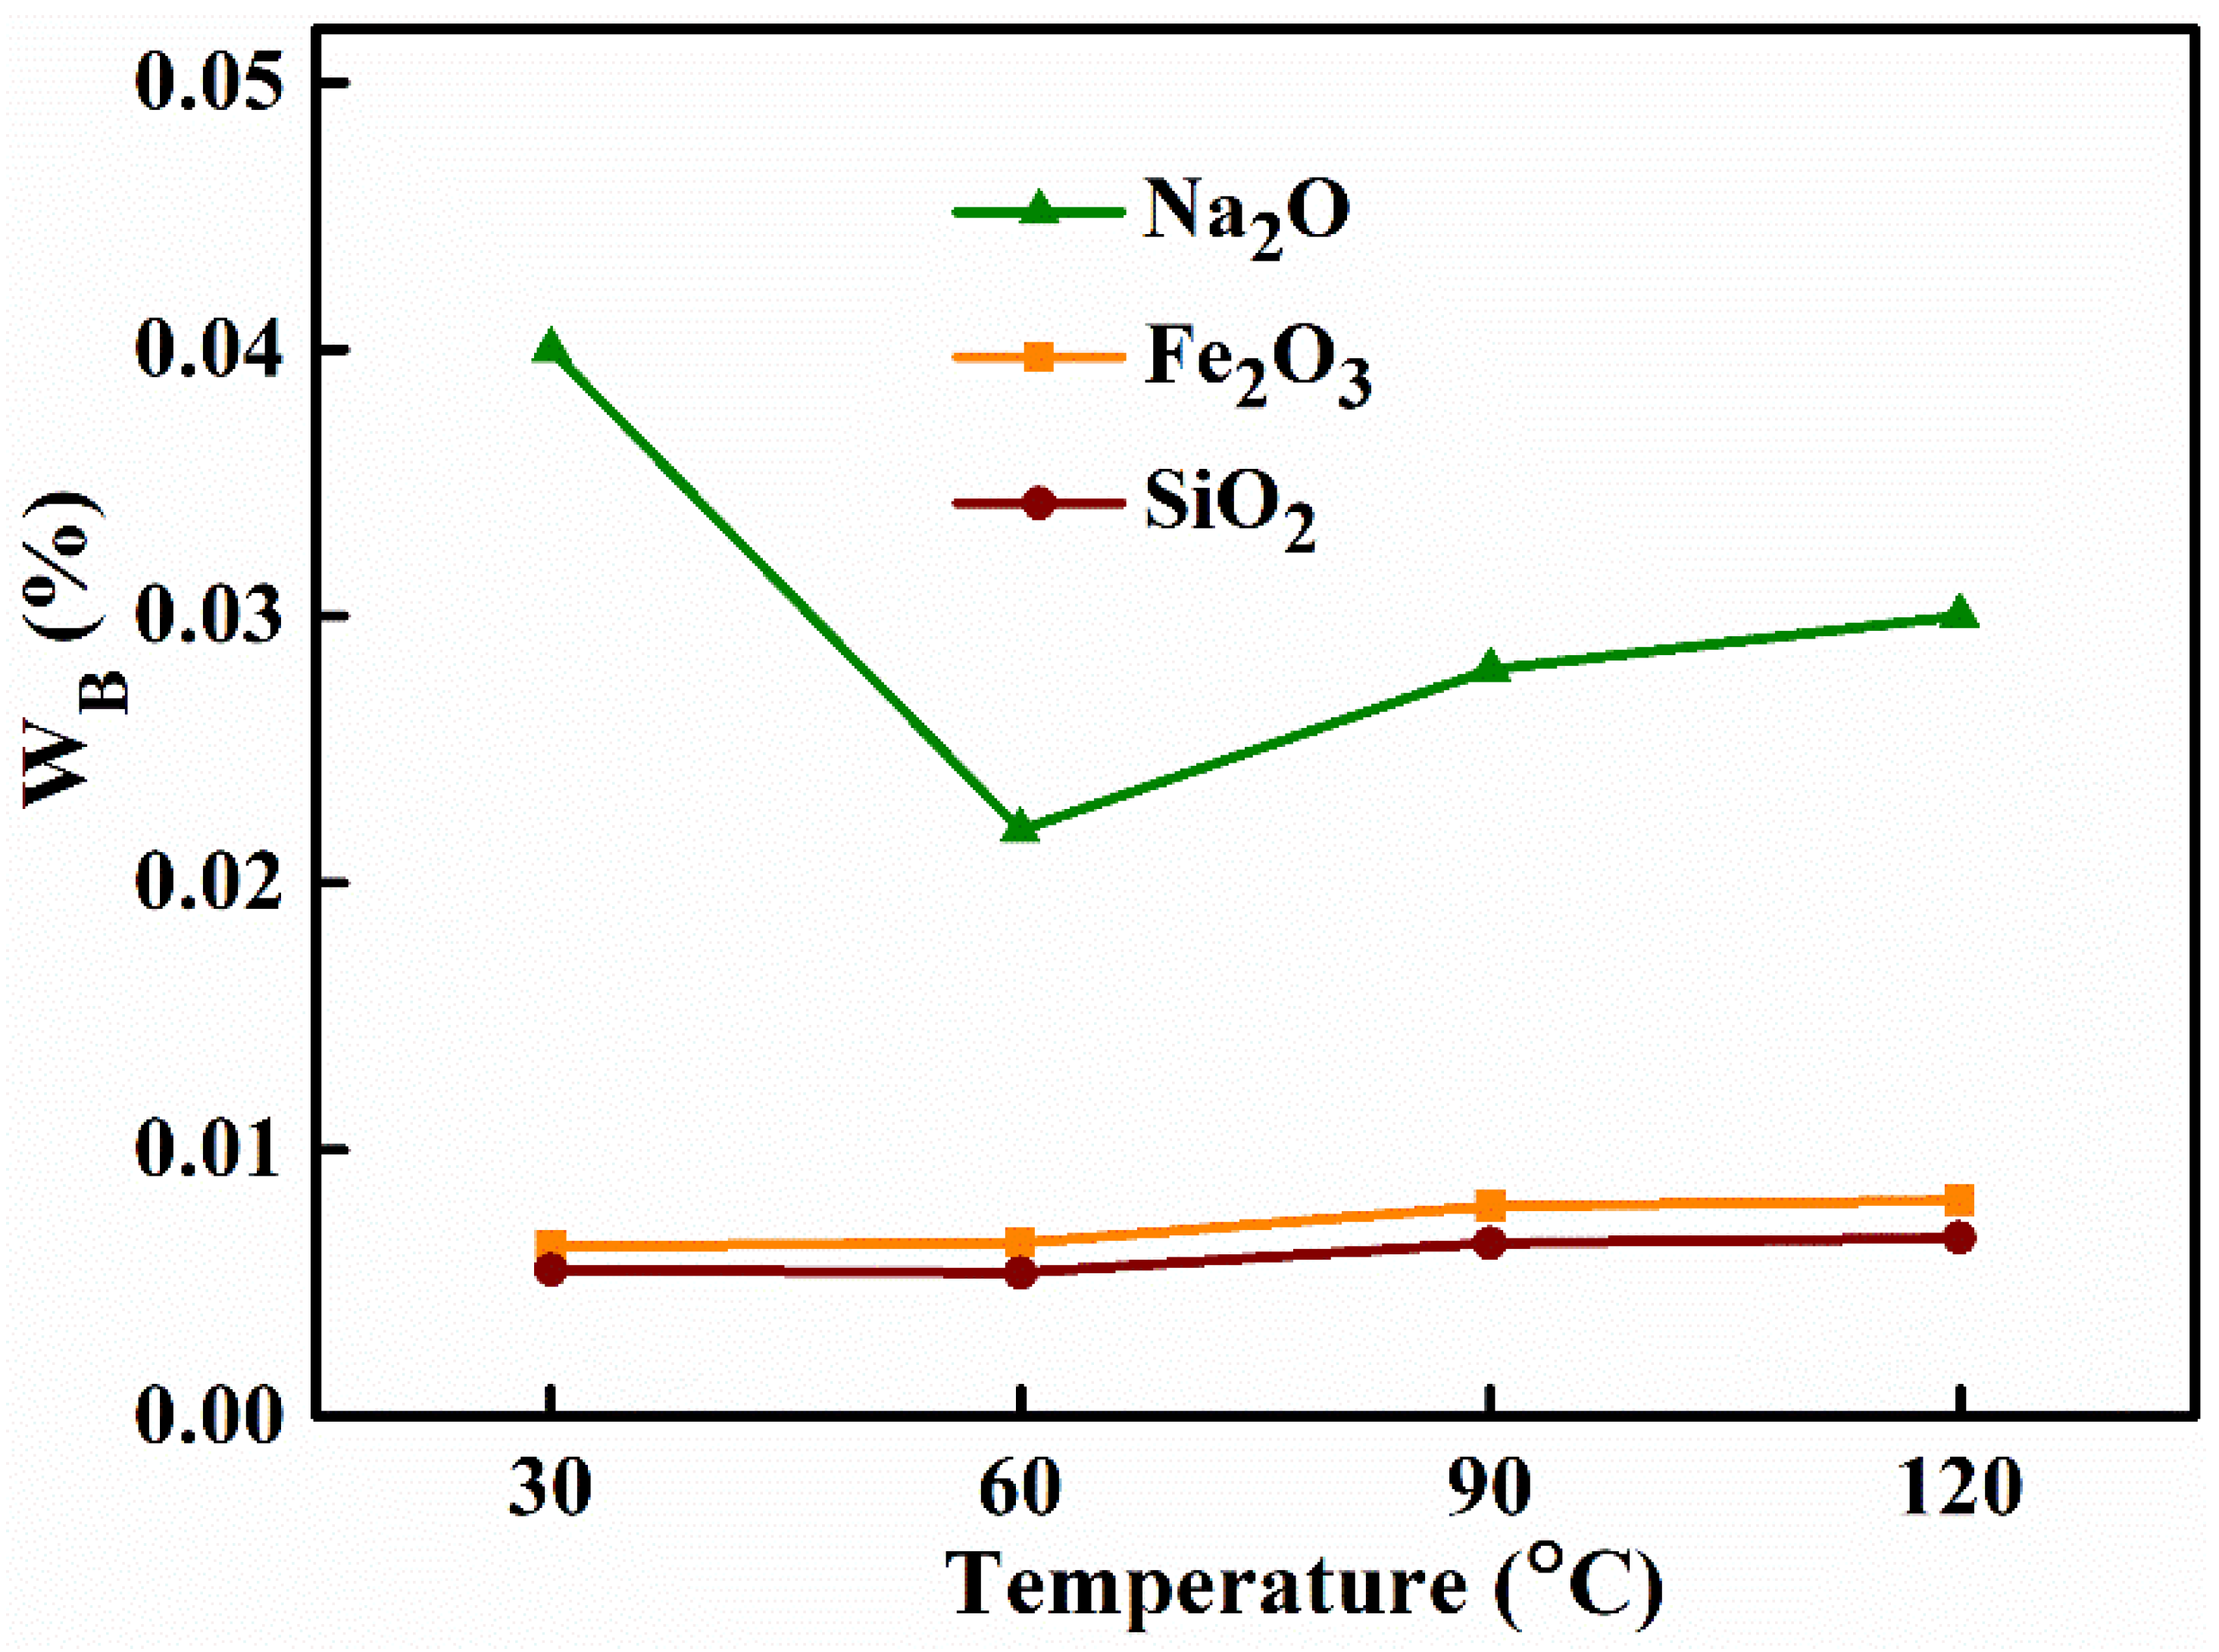
3.1.2. Aging Temperature
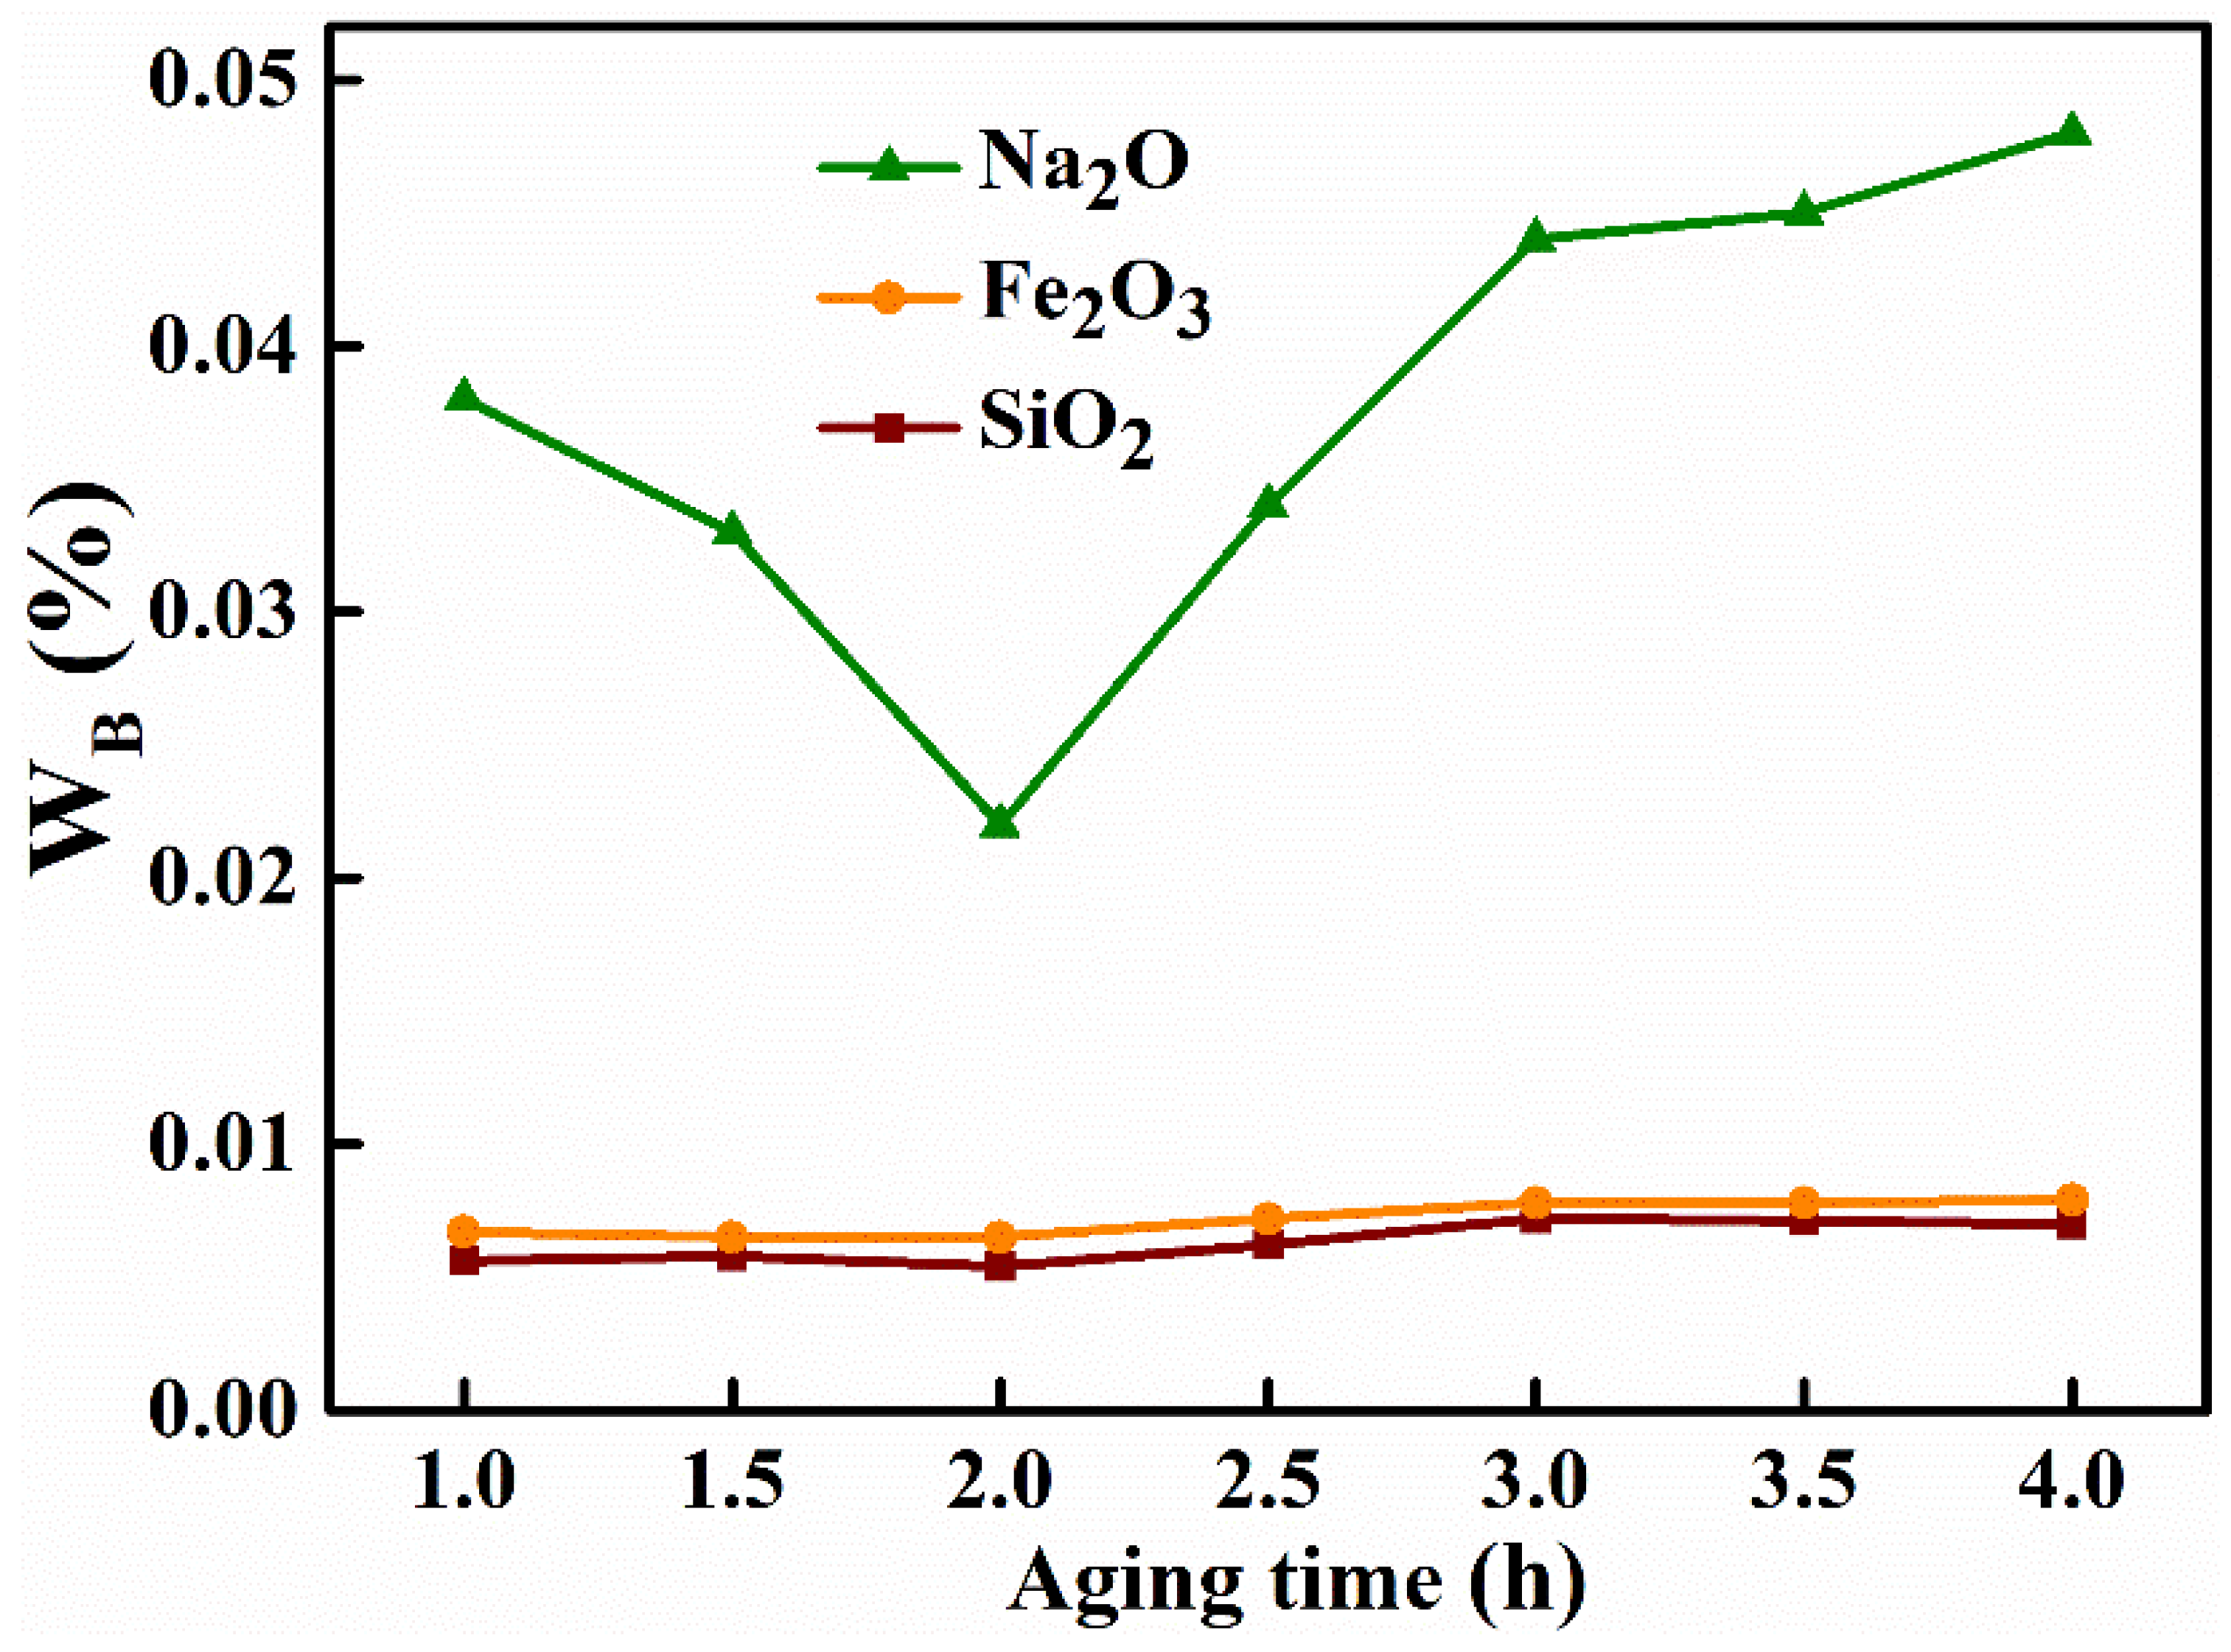
As with other process parameters, aging temperature had a definite effect on the purity of the final product. A series of alumina materials were prepared with a NaAl(OH)4 solution concentration of 60 g L−1, an ageing time of 2 h, the roasting temperature of 500 °C, the mass concentration of the (NH4)2CO3 solution of 75 g L−1 and the ageing temperatures 30 °C, 60 °C, 90 °C and 120 °C. The results of the effect of different aging temperature on the impurity content in the product alumina are shown in Table 4 and Figure 2. It can be seen that with the increase of aging temperature from 30 °C to 60 °C, there was no significant change in the mass fractions of iron oxide or silica, while the content of sodium oxide decreased significantly (from 0.04% to 0.022%). When the temperature exceeded 60 °C, the mass ratio of all impurities increased, from 0.0065% to 0.0081% for Fe2O3, from 0.0054% to 0.0067% for silica, and to 0.030% for Na2O. The total removal of impurities was first increased, from 98.26% to 98.86%, and then decreased to 98.53%, and the purity of alumina rose from 99.9481% to 99.9661% and then fell to 99.9552%. Excessive increases in ageing temperature, therefore, not only result in a loss of energy but also reduce the purity of the alumina. The reason for this change is that when the temperature was too low (less than 60 °C), the viscosity of the slurry was too large for the removal of impurities and the final precipitation produced resulted in an increase in the amount of sodium impurities contained in the material. When the temperature was raised to 60 °C, the solution had a more suitable viscosity, there were more nuclei, the Al(OH)3 particles formed were smaller, the crystals had less effect on the impurities, and fewer impurities remained and were adsorbed. However, as the temperature gradually rose, the crystals formed were too large, the force between the crystals was enhanced, the viscosity of the solution was greater at this time, and the adhesion effect on the impurities was greater. So, after the temperature exceeds 60 °C, the content of all the impurities increased, and the effect of impurity removal gradually became worse.

3.1.3. Aging Time

Ageing time is also an important parameter in the synthesis and preparation process, so a careful study of ageing time is of general importance. A collection of alumina materials were synthesized with a NaAl(OH)4 solution concentration of 60 g L−1, ageing temperature of 60 °C, roasting temperature of 500 °C, a mass concentration of the (NH4)2CO3 solution of 75 g L−1 and the ageing times 1 h, 1.5 h, 2 h, 2.5 h, 3 h, 3.5 h, 4 h. The effects of ageing time on the purity and impurity removal rate of the material are shown in Figure 3 and Table 5, respectively. When the time was extended from 1 h to 2 h, there was no significant change in the content of iron oxide and silica, while the content of sodium oxide decreased significantly (from 0.038% to 0.022%). When the time exceeded 2 h (2.5–4.0 h), the content of all impurities increased, from 0.0065% to 0.0079% for Fe2O3, from 0.0054% to 0.0071%, for silica and to 0.048% for sodium oxide. The total removal of impurities first increased from 98.31% to 98.86% and then decreased to 97.90%, and the purity of the alumina rose from 99.9497% to 99.9661% and then fell to 99.9371%, which indicated that the aging time had a greater impact on the impurity removal effect. When the aging temperature was low, the solution concentration viscosity was larger and the adsorption force of aluminum hydroxide crystals on impurities was larger, lowering the impurity removal rate, so extending the aging time is conducive to the removal of impurities. When the time was extended to more than 2 h, the crystals slowly grew and agglomerated, and the inter-crystalline and crystal forces increased, which is not conducive to the removal of impurities. Thus, when the ageing time is 2 h, the impurity Na2O content in the product alumina was lowest.

3.1.4. Type of Ammonium Salt

To investigate the effect of ammonium salt type on the alumina powder quality, three alumina materials were prepared with a NaAl(OH)4 solution concentration of 60 g L−1, an ageing temperature of 60 °C, an ageing time of 2 h, a roasting temperature of 500 °C, the mass concentrations of the ammonium oxalate, ammonium acetate and ammonium carbonate solutions of 75 g L−1. The nitrogen adsorption–desorption isotherms and pore-size distribution plots of alumina materials washed with diverse ammonium salt solutions are shown in Figure 4; it shows that all the alumina particles showed the classical shape of a Type IV isotherm curve with an H1-type hysteresis loop, and all samples are known to be mesoporous materials, according to the IUPAC classification [52]. The effects of ammonium oxalate, ammonium acetate and ammonium carbonate on the impurity mass fraction and specific surface area of the product alumina are shown in Table 6; it shows that the type of ammonium salt had no obvious effect on the Fe2O3 and SiO2 mass ratio in the alumina product, but the type of ammonium salt had a large effect on the content and porosities of sodium impurities in the product. The sodium content of the alumina material prepared using ammonium carbonate as a sodium removal agent was only 0.022%, with a specific surface area of 312.43 m2 g−1 and a pore volume of 0.43 cm3 g−1, whereas, the sodium impurity content using ammonium acetate and ammonium oxalate was as high as 0.054% and 0.050% respectively, with specific surface areas of 276.85 m2 g−1 and 252.20 m2 g−1, respectively, with pore volumes of 0.32 cm3 g−1 and 0.33 cm3 g−1, also respectively. This is due to the fact that ammonium carbonate can release more NH4+ in the hydrolysis process, and NH4+ can replace sodium ions in the reaction process and be absorbed by γ-AlO(OH) [53,54]. After roasting to until the release of ammonia, it makes the solution more effective in removing sodium ions and achieves the best sodium removal. Gas release increased the specific surface area of the product and its porosity. On balance, the choice of ammonium carbonate washing is more appropriate.

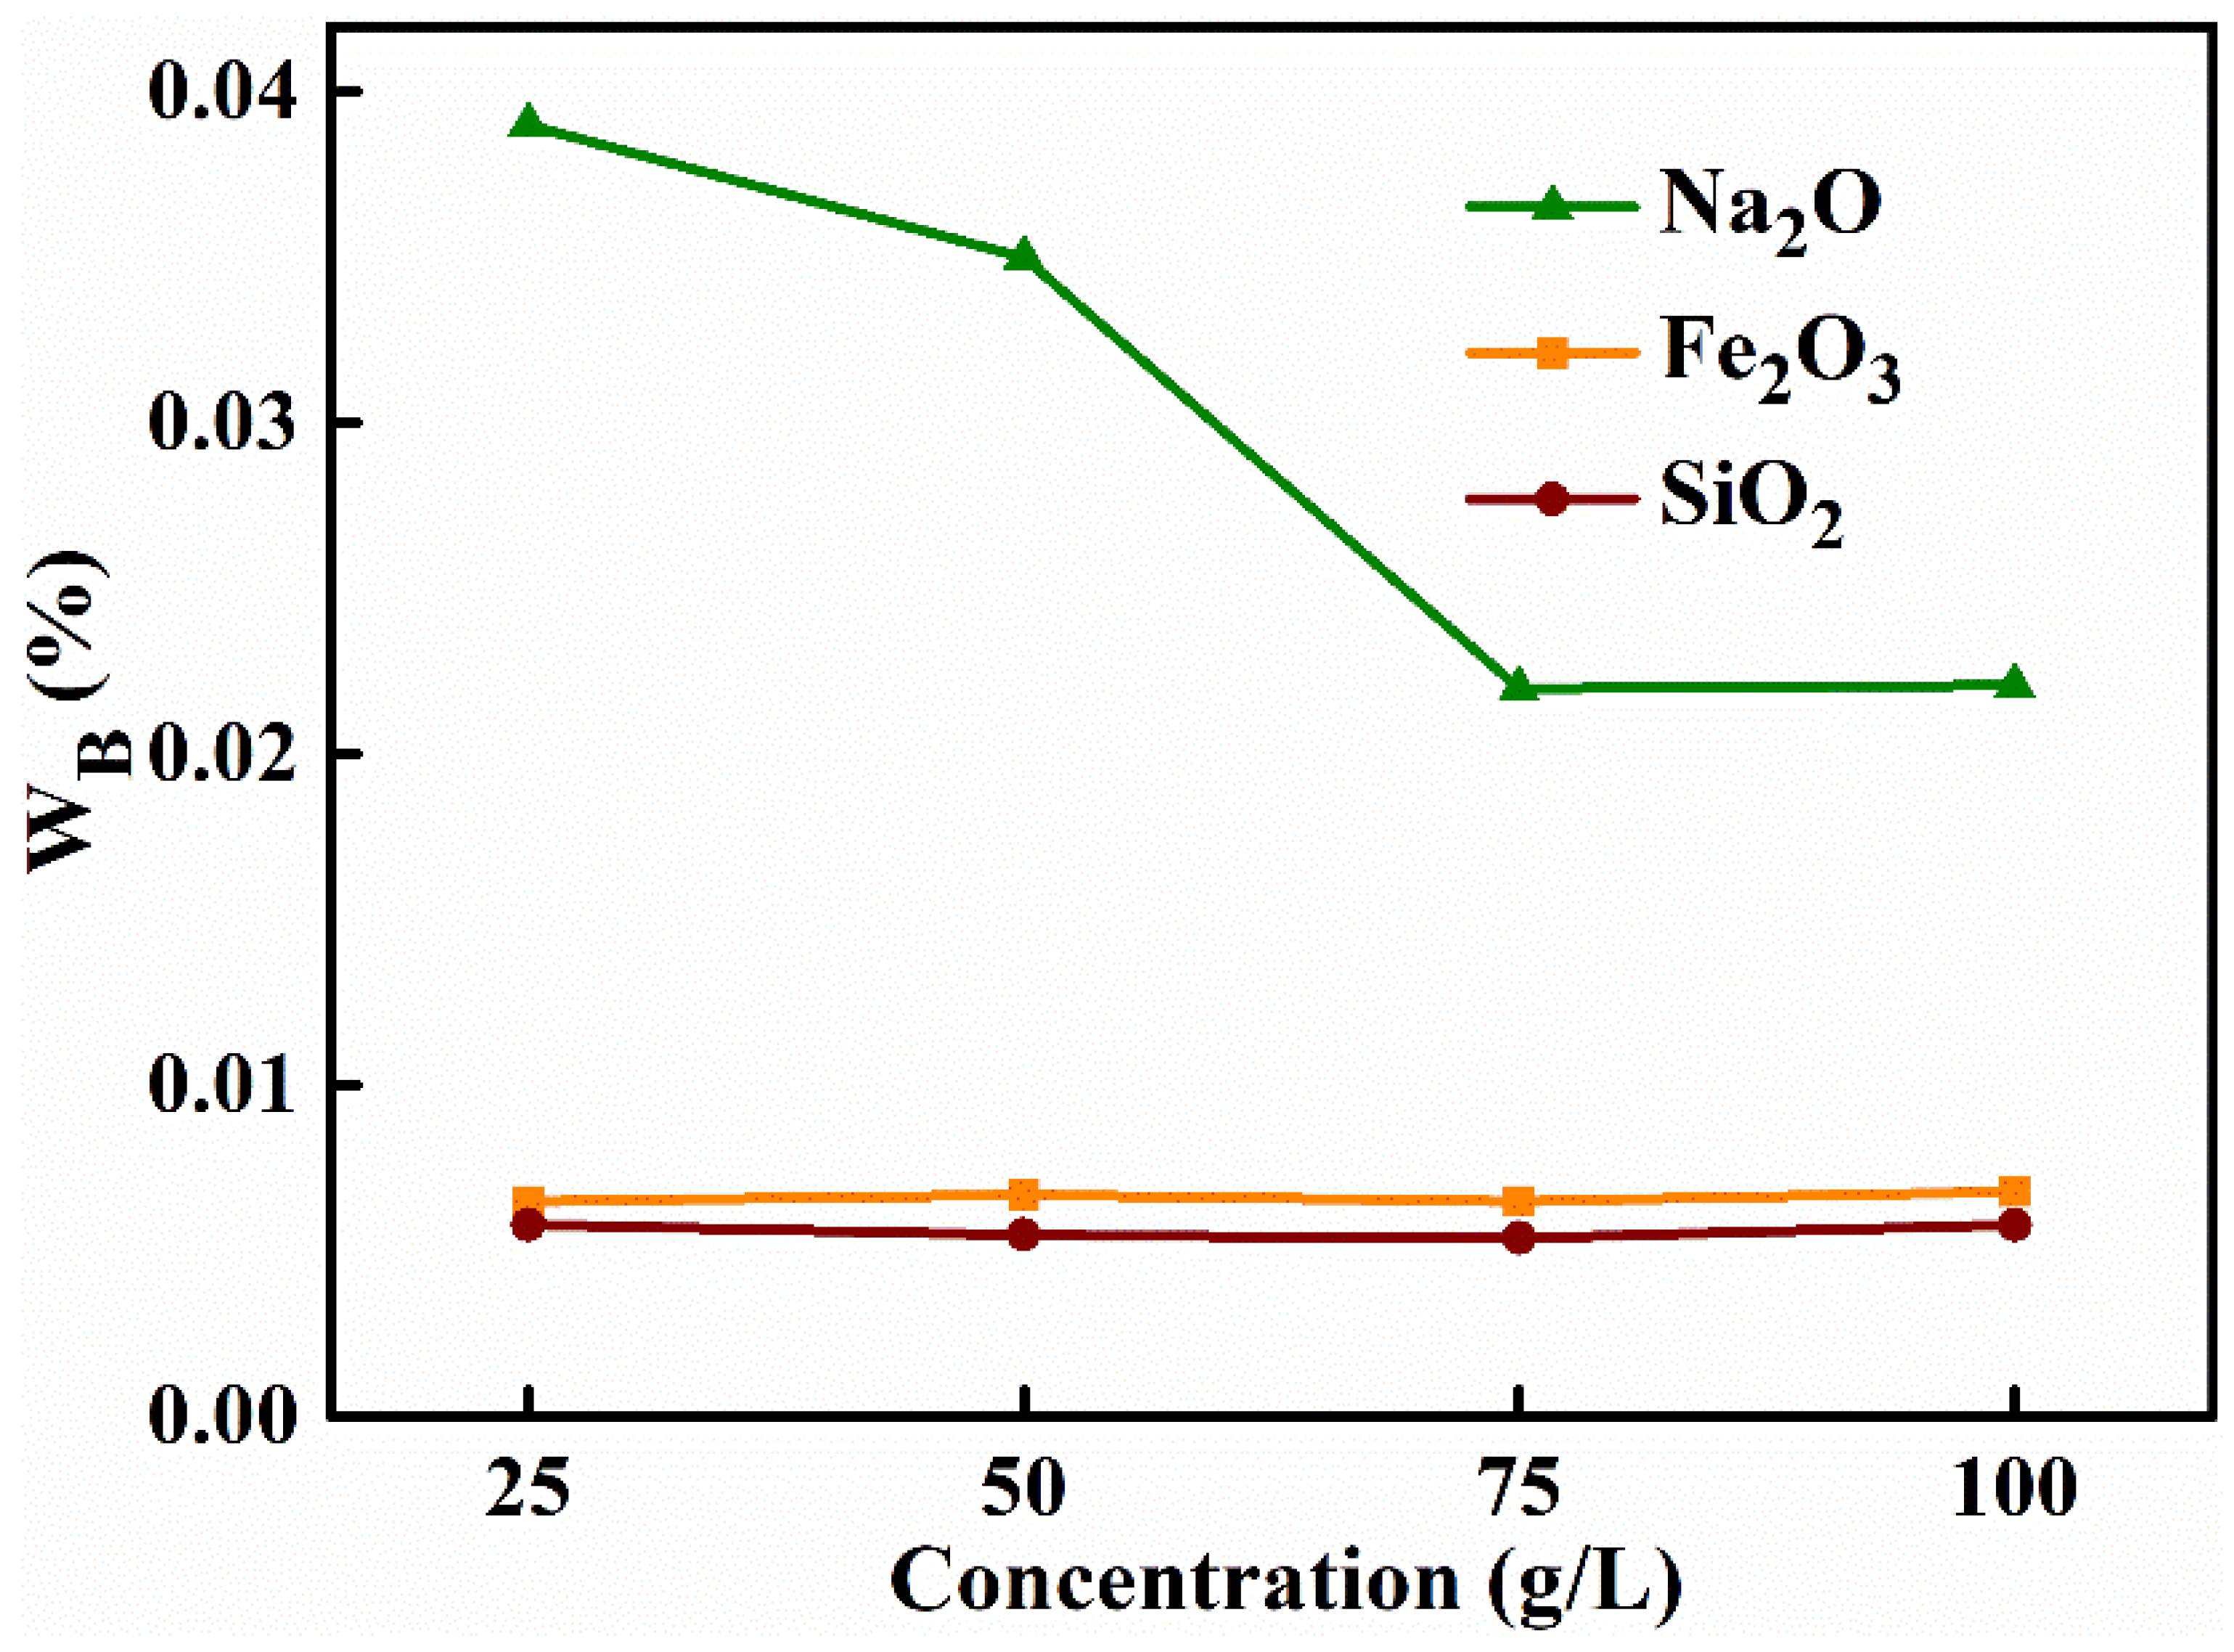
3.1.5. Mass Concentration of (NH4)2CO3 Solution

From the previous description, it is clear that ammonium carbonate had a good contribution to the purity and porosity of the material, so it is important to investigate the effect of different ammonium carbonate mass concentrations on the purity and porosity of the product. A collection of alumina materials was synthesized with a NaAl(OH)4 solution concentration of 60 g L−1, an ageing temperature of 60 °C, an ageing time of 2 h, a roasting temperature of 500 °C and the mass concentrations of the (NH4)2CO3 solutions of 25 g L−1, 50 g L−1, 75 g L−1, 100 g L−1. As shown in Table 7 and Figure 5, with the increase of the mass concentration of ammonium carbonate from 25 g L−1 to 75 g L−1, the sodium oxide content decreased significantly (from 0.039% to 0.022%), the sodium oxide removal rate increased (from 93.28% to 96.21%) and the purity of alumina rose from 99.9478% to 99.9661% and then fell to 99.9653%. When the mass concentration was increased to 100 g L−1, the sodium oxide content and removal rate remained essentially unchanged. Changing the mass concentration of ammonium carbonate did not affect the impurity contents of iron oxide or silica, nor their removal rates. At low concentrations, as the concentration increased (from 25 g L−1 to 75 g L−1), there was a gradual increase in the number of ammonium ions hydrolyzed from the solution, and, therefore, more sodium impurities were replaced by ammonium ions, which improved the purity of the material and also increased the specific surface area of the material. However, as the concentration became too high, the number of sodium impurities that could be replaced became a certain amount, so continuing to increase the concentration of ammonium carbonate later has no effect on the quality of the product. In summary, the HPMA powder synthesized by washing with 75 g L−1 ammonium carbonate solution had the highest purity and the largest specific surface area in terms of cost savings.

3.1.6. Roasting Temperature

To investigate the effect of firing temperature on the structure and properties of the products, four parts of NaAl(OH)4 solution were prepared, hydrochloric acid solution was added. The solution was aged at 60 °C for 2 h and filtered, washed with ammonium carbonate solution (mass concentration of 75 g L−1), dried and roasted at 500 °C, 700 °C, 900 °C and 1100 °C to obtain the product alumina. It can be seen from the XRD patterns (Figure 6) that the product is γ-Al2O3 with no significant change in the crystalline phase when roasted at 500–700 °C; this partly occurs in the product-phase transformation from γ-Al2O3 to the θ-Al2O3 crystalline phase when roasted at 900 °C, and to the θ-Al2O3 crystalline phase, which has a small specific surface area (JCPDF Card: No. 11-0517) and is completely formed at 1100 °C. θ-Al2O3 is the most stable tripartite crystalline system among all alumina phases; it has a low specific surface area and weak chemical activity, so it is not suitable for the preparation of adsorbents or catalysts. Therefore, it is not suitable for the preparation of adsorbents or catalysts.
The nitrogen adsorption–desorption isotherms and the pore size distribution plots of alumina materials calcined for 4 h at various temperatures are shown in Figure 6b,c. The alumina particles roasted at various temperatures show the classical shape of a Type IV isotherm curve with an H1-type hysteresis loop, and all samples are known to be mesoporous materials according to the IUPAC classification [52]. It can be revealed from Table 8 that an increase in calcination temperature from 500 °C to 1100 °C caused the pore size of the alumina material to increase and the number of pores to decrease. This is because under high temperature conditions, the entire pore structure on the surface of the material collapses and agglomerates, as shown in TEM images (Figure 7), resulting in a dramatic reduction in specific surface area and total pore volume (the specific surface area was reduced from 312.43 m2 g−1 to 88.52 m2 g−1, pore volume 0.48 cm3 g−1 to 0.08 cm3 g−1.) Thus, the HPMA material prepared by roasting at 500 °C had the largest specific surface area and pore volume, with more active chemistry sites for catalysts and adsorbents.

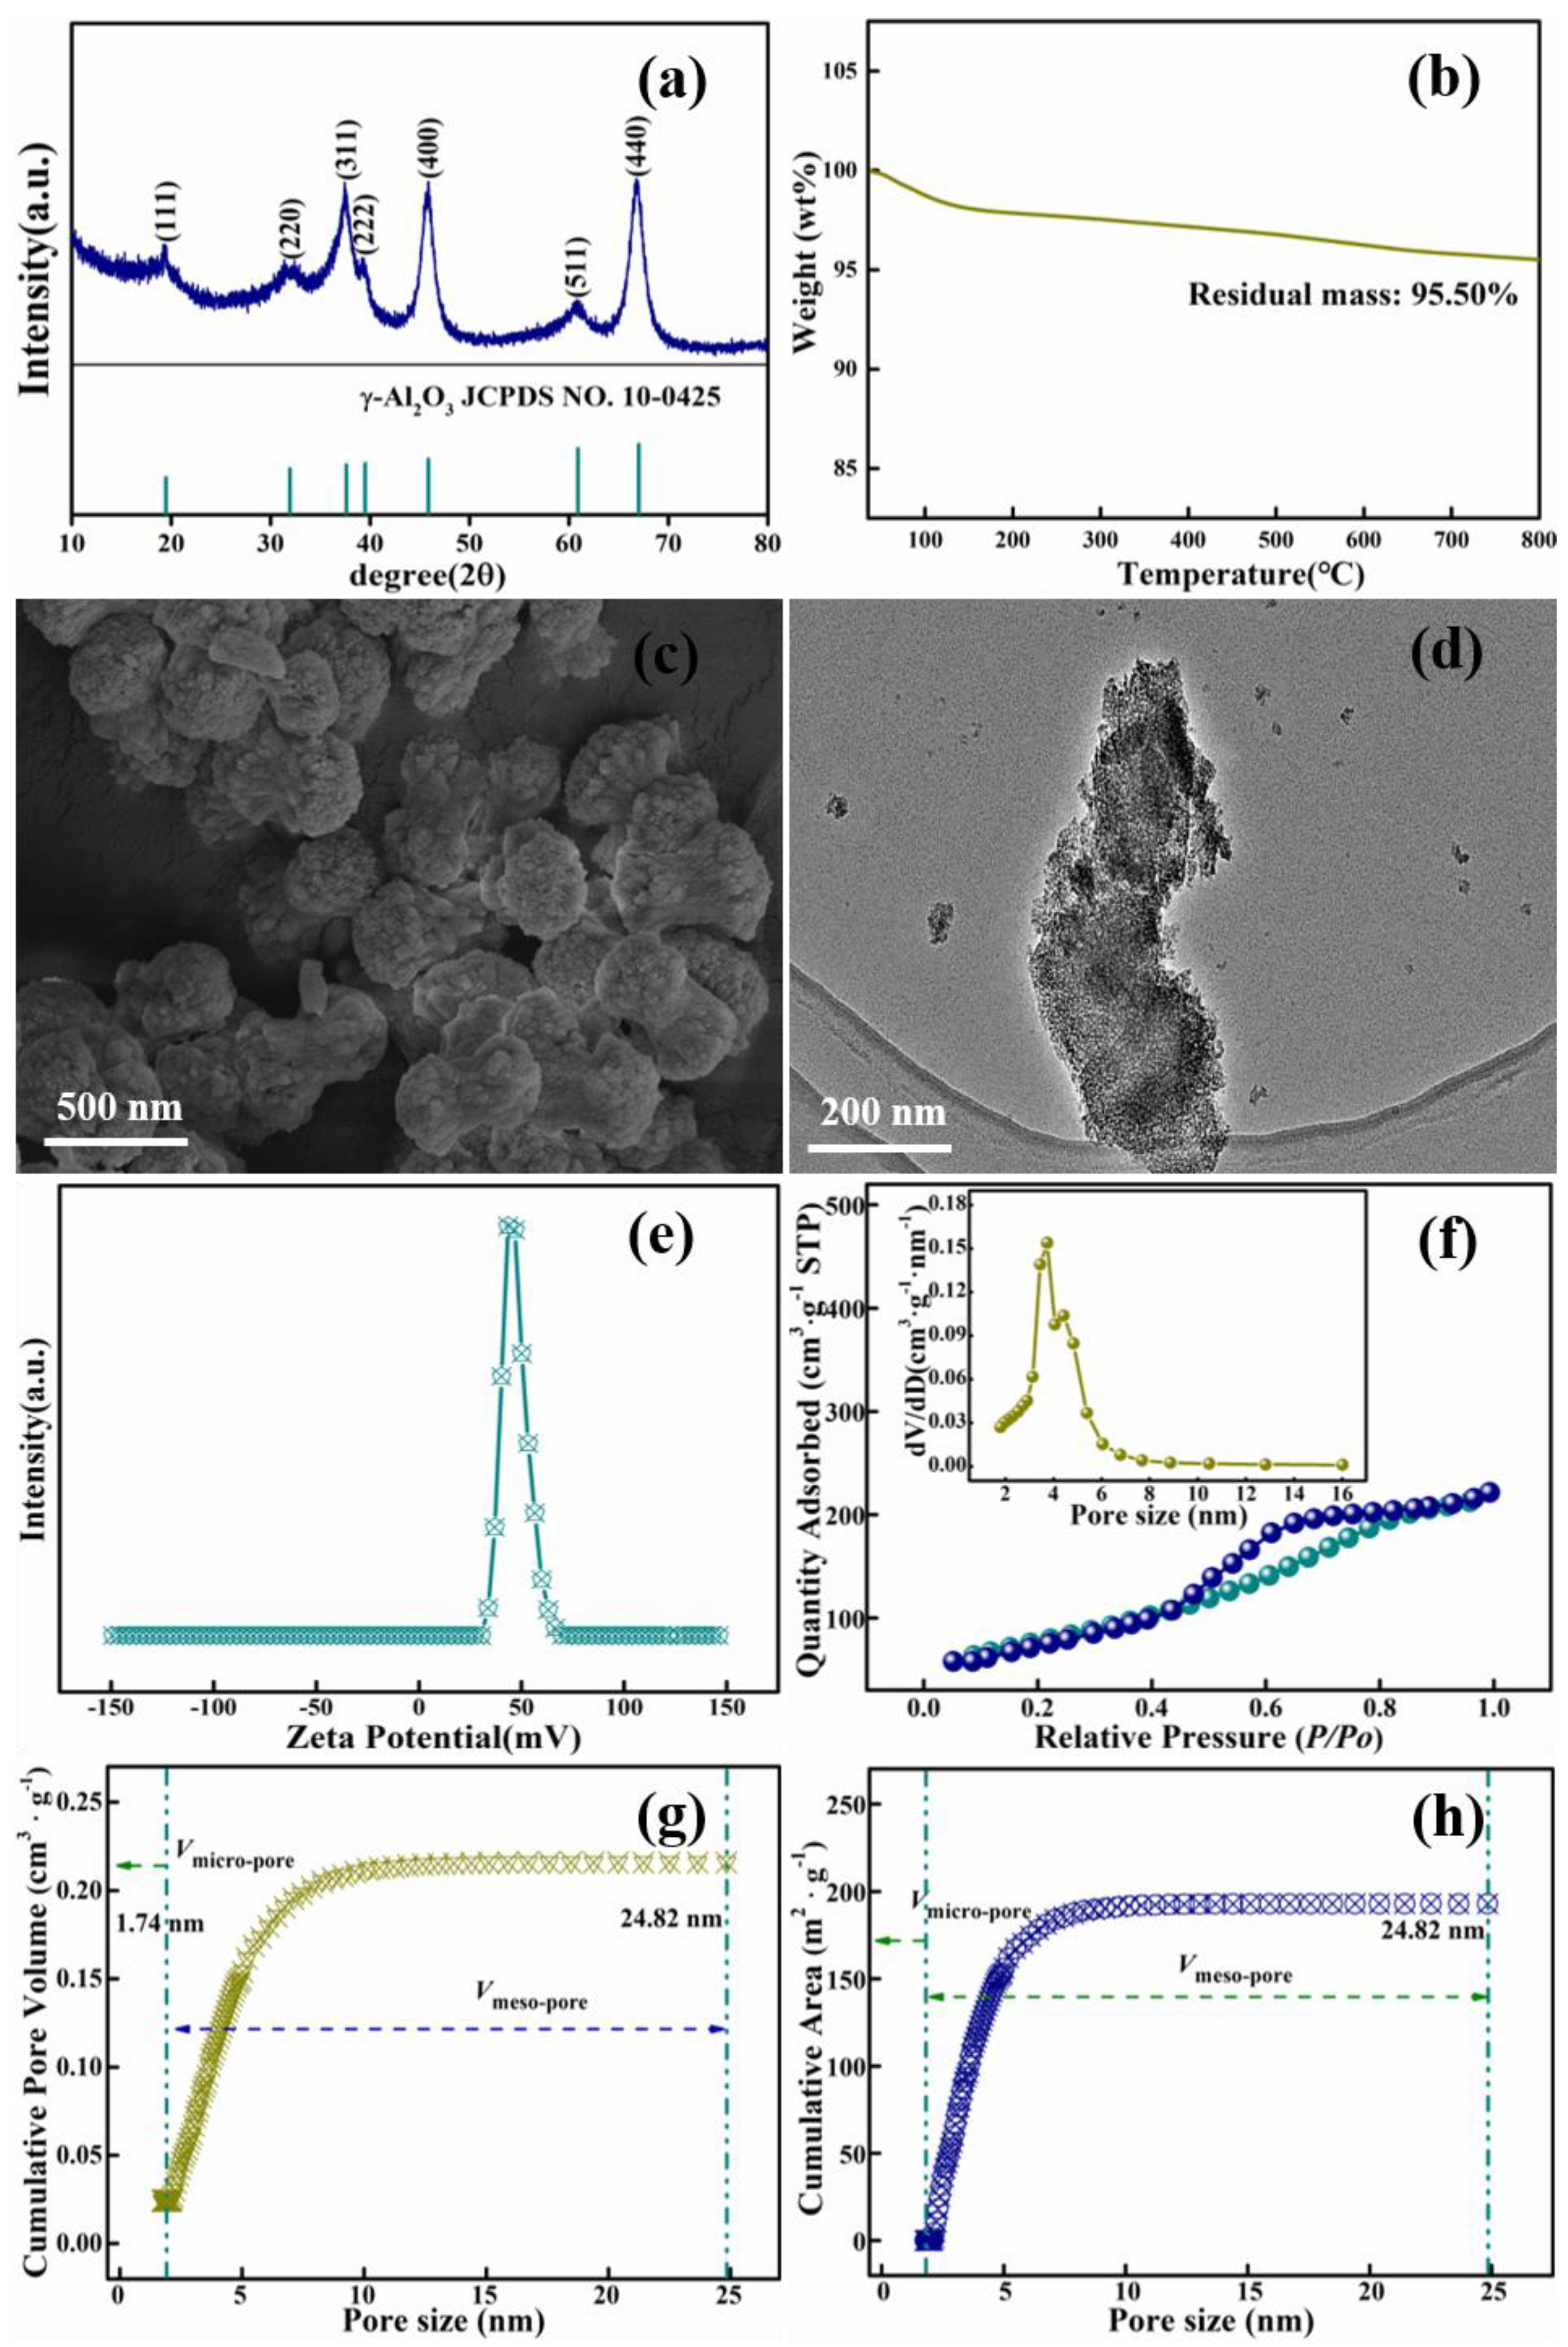
3.2. Characteristics of High Purity Mesoporous Alumina

Gamma-phase high-purity mesoporous alumina (HPMA) materials with high specific surface areas were successfully prepared by the direct ageing and ammonium salt replacement methods. As the sodium hydroxide solution dissolved the industrial aluminum hydroxide, the Si and Fe impurities could be effectively removed by dissolving the industrial aluminum hydroxide with sodium hydroxide which has been described in Section 3.1.1. The solution equilibrium was disrupted by the direct ageing of dilute hydrochloric acid drops into the reaction system. γ-AlO(OH) crystals are rapidly generated with fine crystal particles, resulting in weak intermolecular forces; therefore, the adsorption of impurities was weak, while the fine particles facilitated an increase in the specific surface area of the material. Finally, by adding an excess of ammonium salt solution, the dissociated NH4+ could replace the sodium ions during the reaction to produce Na2CO3 [55]. NH4+ can be absorbed by γ-AlO(OH) [53,54], which plays a significant desaturation role, and ammonium ions on the surface of γ-AlO(OH) were released in the form of ammonia molecules during calcination, increasing the porosity of the material and thus improving the specific surface area. The main chemical reactions in the preparation process are as follows:
Al(OH)3 + NaOH→NaAl(OH)4;
Fe2O3 + 2NaOH + 3H2O→2NaFe(OH)4;
SiO2 + 2NaOH→Na2SiO3 + H2O;
2NaAl(OH)4 + 1.7Na2SiO3→Na2O·Al2O3·1.7SiO2·nH2O↓ + 3.4NaOH + 3H2O;
NaAl(OH)4 + HCl→Al(OH)4 + NaCl + H+;
NaAlO2→NaOH + Al(OH)4;
NaOH + (NH4)2CO3→Na2CO3 + NH3·H2O;
(NH4)2CO3→2NH4+ +CO32−;
Al(OH)4→γ-AlO(OH)·nH2O + (1 − n)H2O;
2γ-AlO(OH)·nH2O→γ-Al2O3 + 2(1 − n)H2O;
The impurity mass ratios, excellent removal rates and surface physical properties of the HPMA materials synthesized under optimum conditions with initial NaAl(OH)4 solution concentration of 60 g L−1, ageing temperature of 60 °C, ageing time of 2 h, roasting temperature of 500 °C and the mass concentration of the (NH4)2CO3 solution of 75 g L−1 are shown in Table 9 revealing that the mass fractions of residual Fe2O3, SiO2 and Na2O in the alumina products were 0.0065%, 0.0054% and 0.022% respectively, with removal rates of 99.44%, 99.57% and 96.21% respectively, which showed that the purity of the product was as great as 99.9661% and the total removal rate of impurities was 98.87%. Moreover, the specific surface area, pore volume and pore size of the material were 312.43 m2 g−1, 0.48 cm3 g−1 and 3.80 nm, respectively, indicating that the material prepared was HPMA with high purity and porosity, which can be widely used in the preparation of adsorbents.
XRD patterns (Figure 8a) showed that the diffraction peaks at 2θ = 19.439°, 31.951°, 37.648°, 39.398°, 45.854°, 60.878° and 67.029° correspond to the (111), (220), (311), (222), (400), (511) and (440) crystals of γ-Al2O3 (JCPDS card NO. 10-0425), respectively. There was not any other significant diffraction peak, indicating that this alumina with a cubic structure had the absolute high purity [56]. All diffraction peaks exhibited a high degree of broadness for their fine natures, and less degeneracy in the crystal. According to the Debye–Scherrer equation [57], D = k λ/β cosθ, where k is a constant, θ is the diffraction angle, λ is the X-ray wavelength and β is the full width at half maximum (FWHM), the principal grain sizes of γ-Al2O3 calculated from the full width at half maximum of the isolated (311), (400) and (440) diffraction peaks are 14.3 nm, 12.8 nm and 16.7 nm, respectively.
Figure 8b shows the TGA diagram of the adsorbent HPMA material. As can be seen from the graph, there was no distinctive weight loss with the temperature rising from room temperature to 800 °C, proving that the mesoporous material produced has good thermal stability, which can be applied in the adsorption of Congo Red.
It can be seen from the SEM picture (Figure 8c) and TEM image (Figure 8d) that the product alumina was porous, small particles with clear individual particles, less agglomeration and many fine pore channels on the surface of the product, which increased the specific surface area of the material, enhancing the surface energy and surface bonding energy, which can be easily stabilized by bonding with other atoms, thus increasing the chemical activity of HPMA. The greater chemical activity induced corresponding changes in atomic transport and conformation on the surface of the alumina nanoparticles, leading to changes in the electron spin conformation and electronic energy spectrum on the surface of the HPMA material particles, features that contribute to the improved adsorption performance of HPMA. The size of the crystals was essentially in the range of 200 nm to 500 nm. Zeta potential is an important parameter in measuring the strength of mutual repulsion or attraction between particles; as the absolute value of the zeta potential rises, the degree of dispersion is much greater than the degree of aggregation, making the molecular surface attraction greater than the repulsion. The zeta potential plots of the as-synthesized HMPA nano-materials are shown in Figure 8e, showing that the zeta potential value of the HPMA particles was 46 ± 3 mV, with potential values in the range of 40–60 mV, revealing that the adsorbent had a positive charge on its surface with outstanding surface stability [58] and excellent adsorption property for CR.
Nitrogen adsorption–desorption isotherms are shown in Figure 8f; according to the IPUAC classification [52], the HPMA powder shows a typical type IV isotherm curve shape with an H1-type hysteresis loop, which is due to the slight sintering of mesoporous γ-Al2O3 at this calcination temperature. The pore size distribution curve, cumulative pore volume plot and cumulative surface area curves of the mesoporous γ-Al2O3 material obtained by the BJH model are shown in the inset of Figure 8f–h, respectively. As can be seen from the pore size distribution plots, the pore size of the material was mainly distributed in the range of 2–16 nm, while the cumulative pore volume curves and cumulative surface area curves of the material were in the range of 2–24.82 nm. Mesoporous materials are defined as pore sizes in the range of 2–50 nm porous material [59], therefore, the product was a porous, highly dispersed solid material with a large specific surface area and high activity, which confer good catalytic and adsorption properties [1,2,3,4,5].

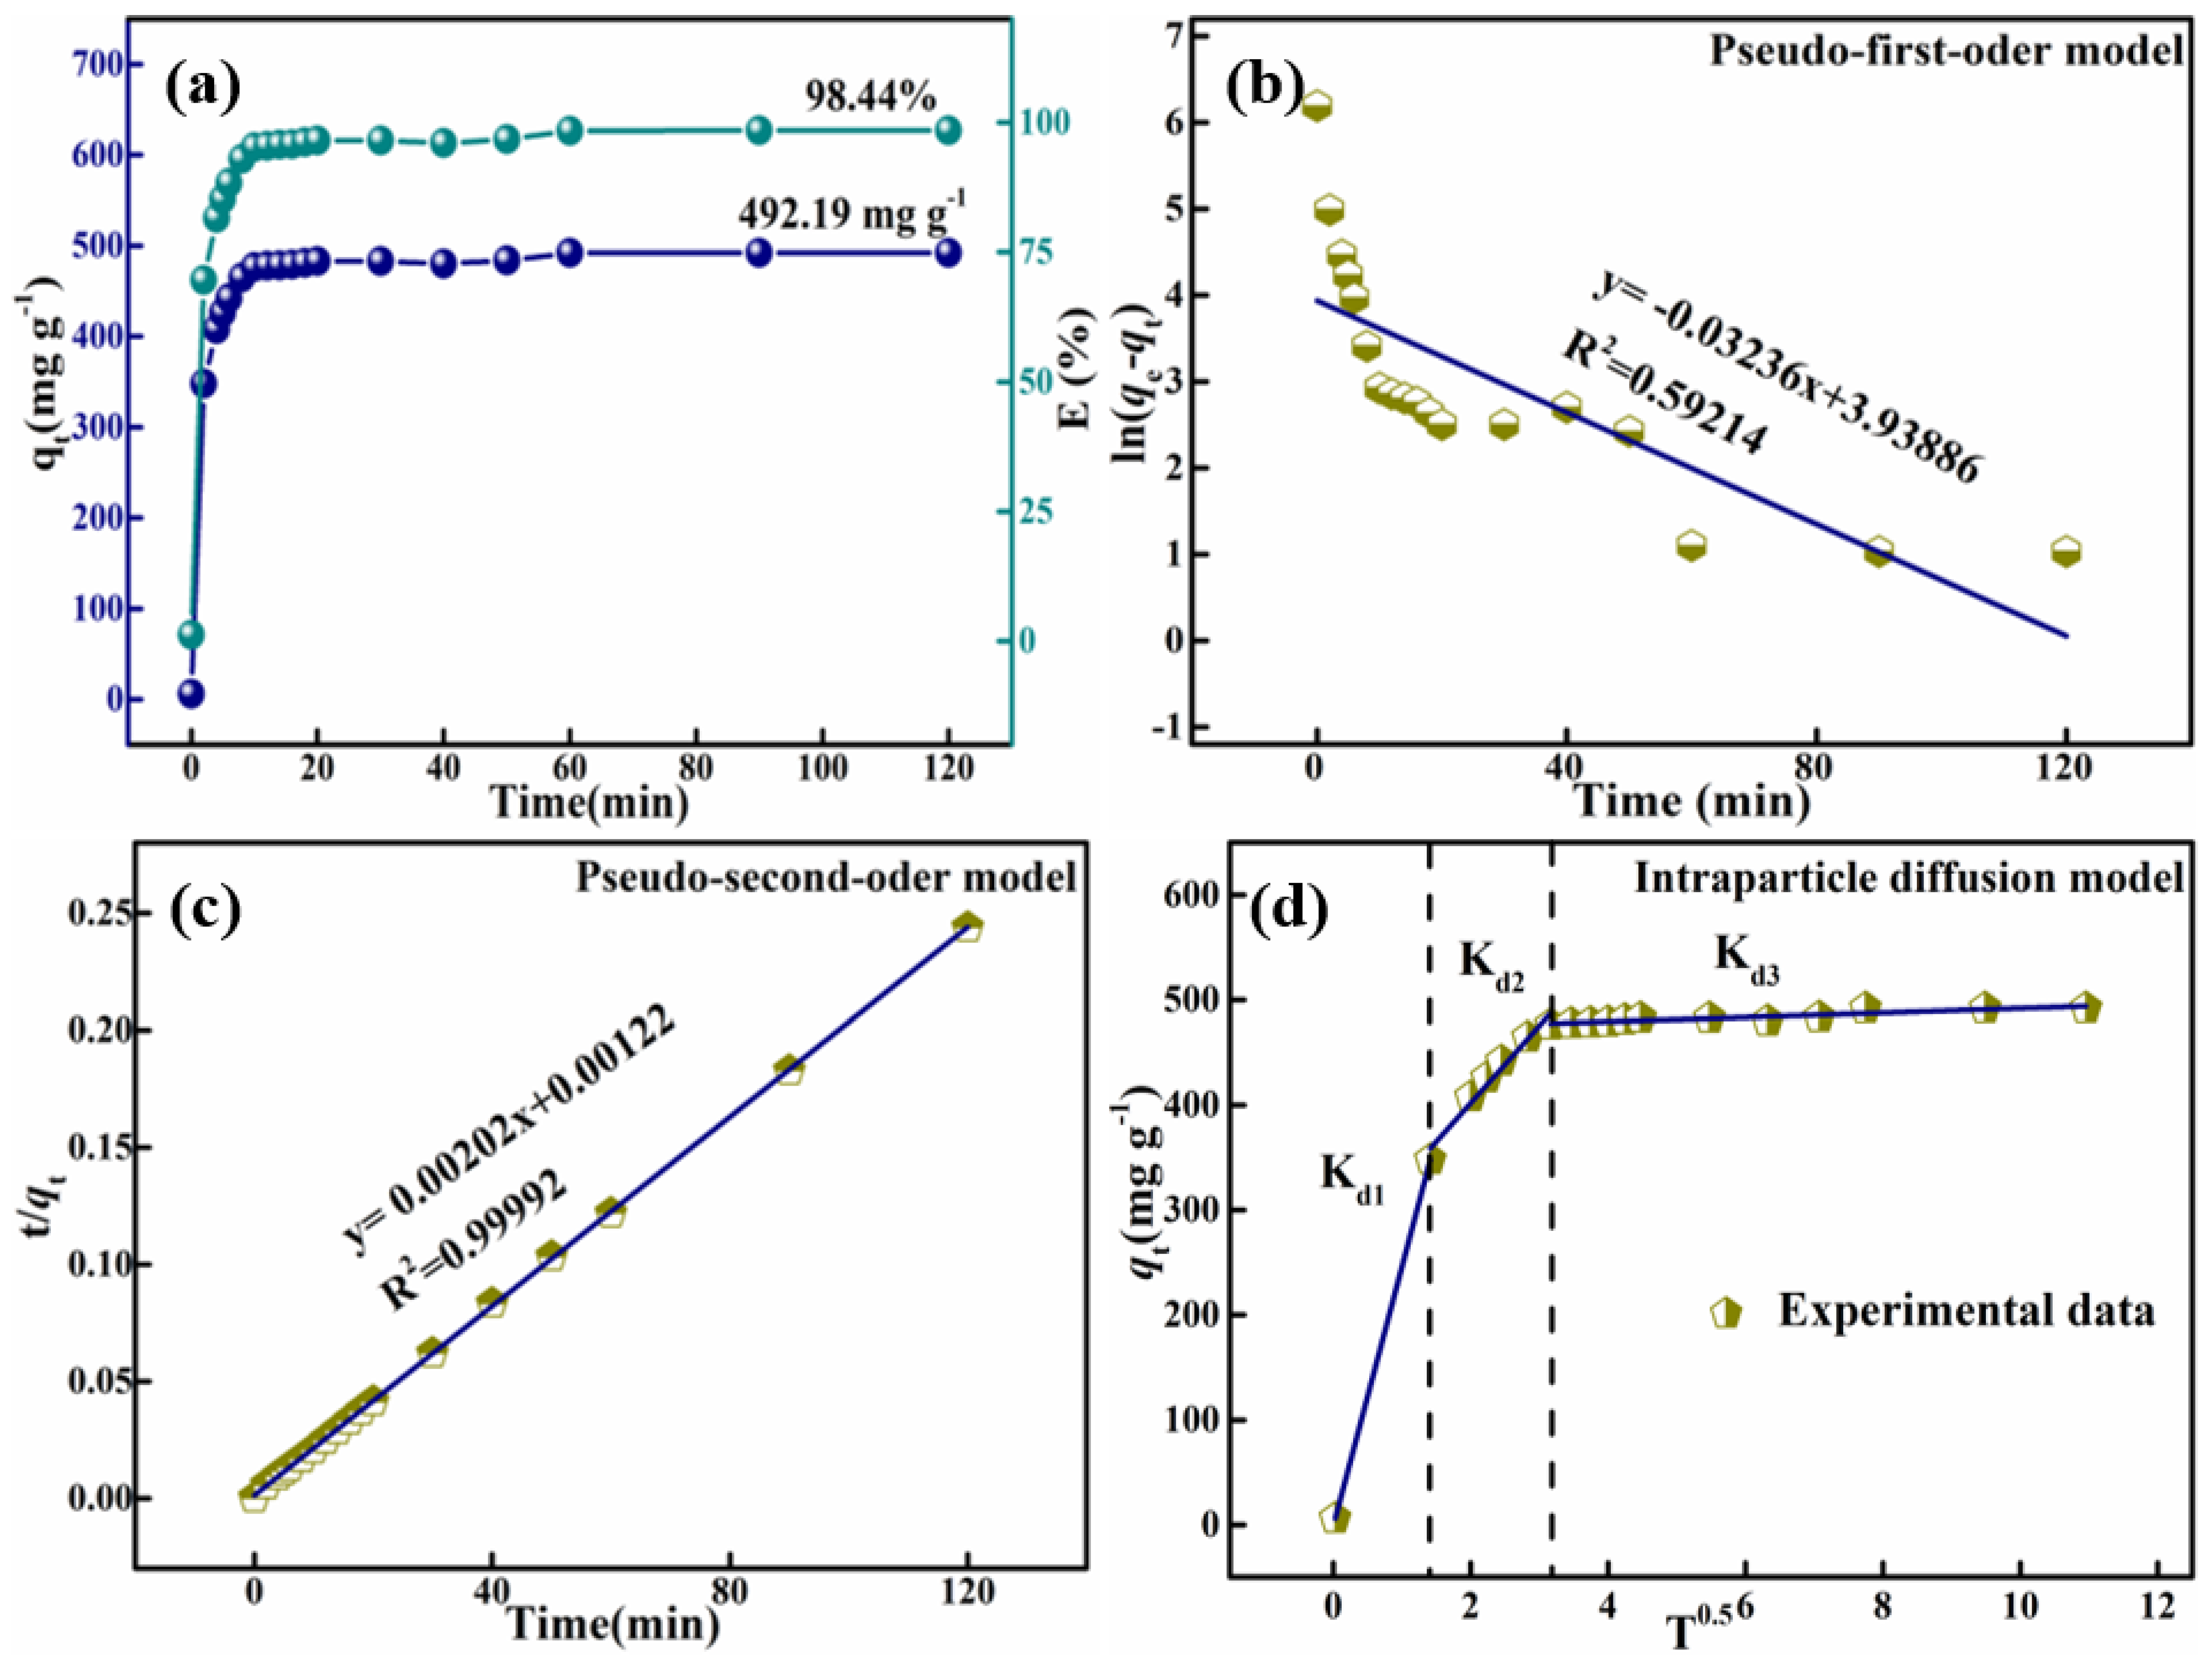
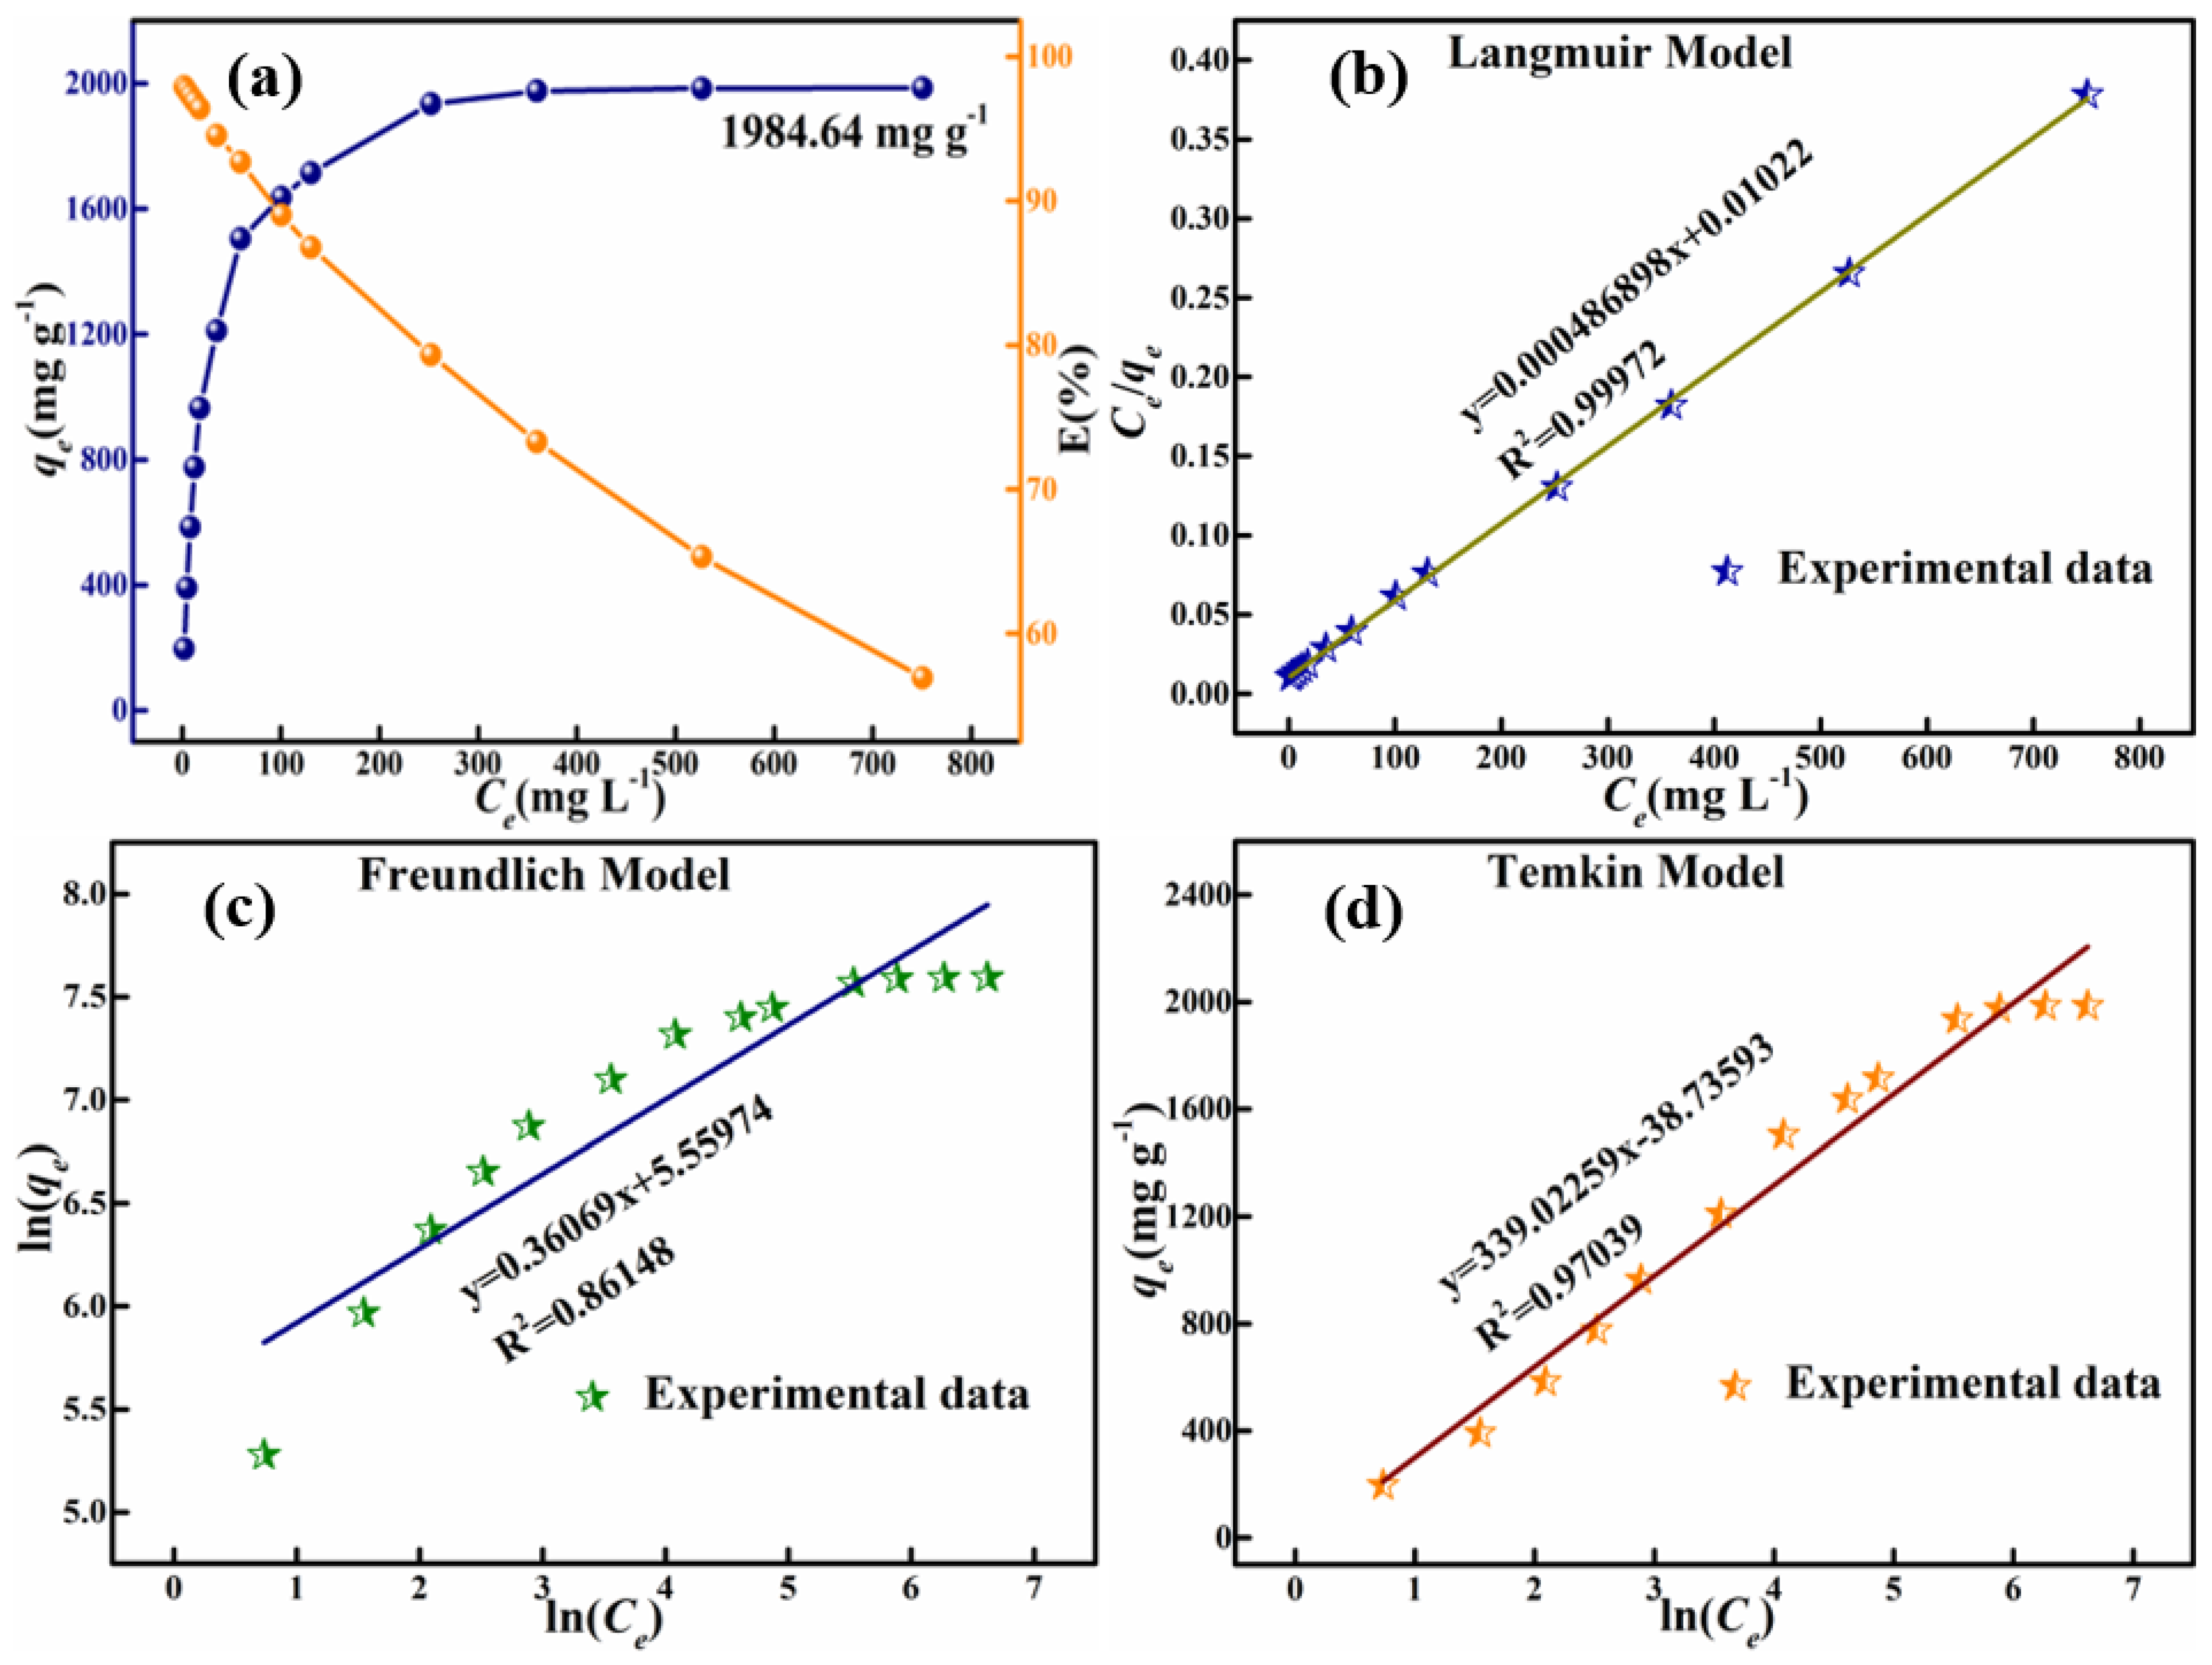
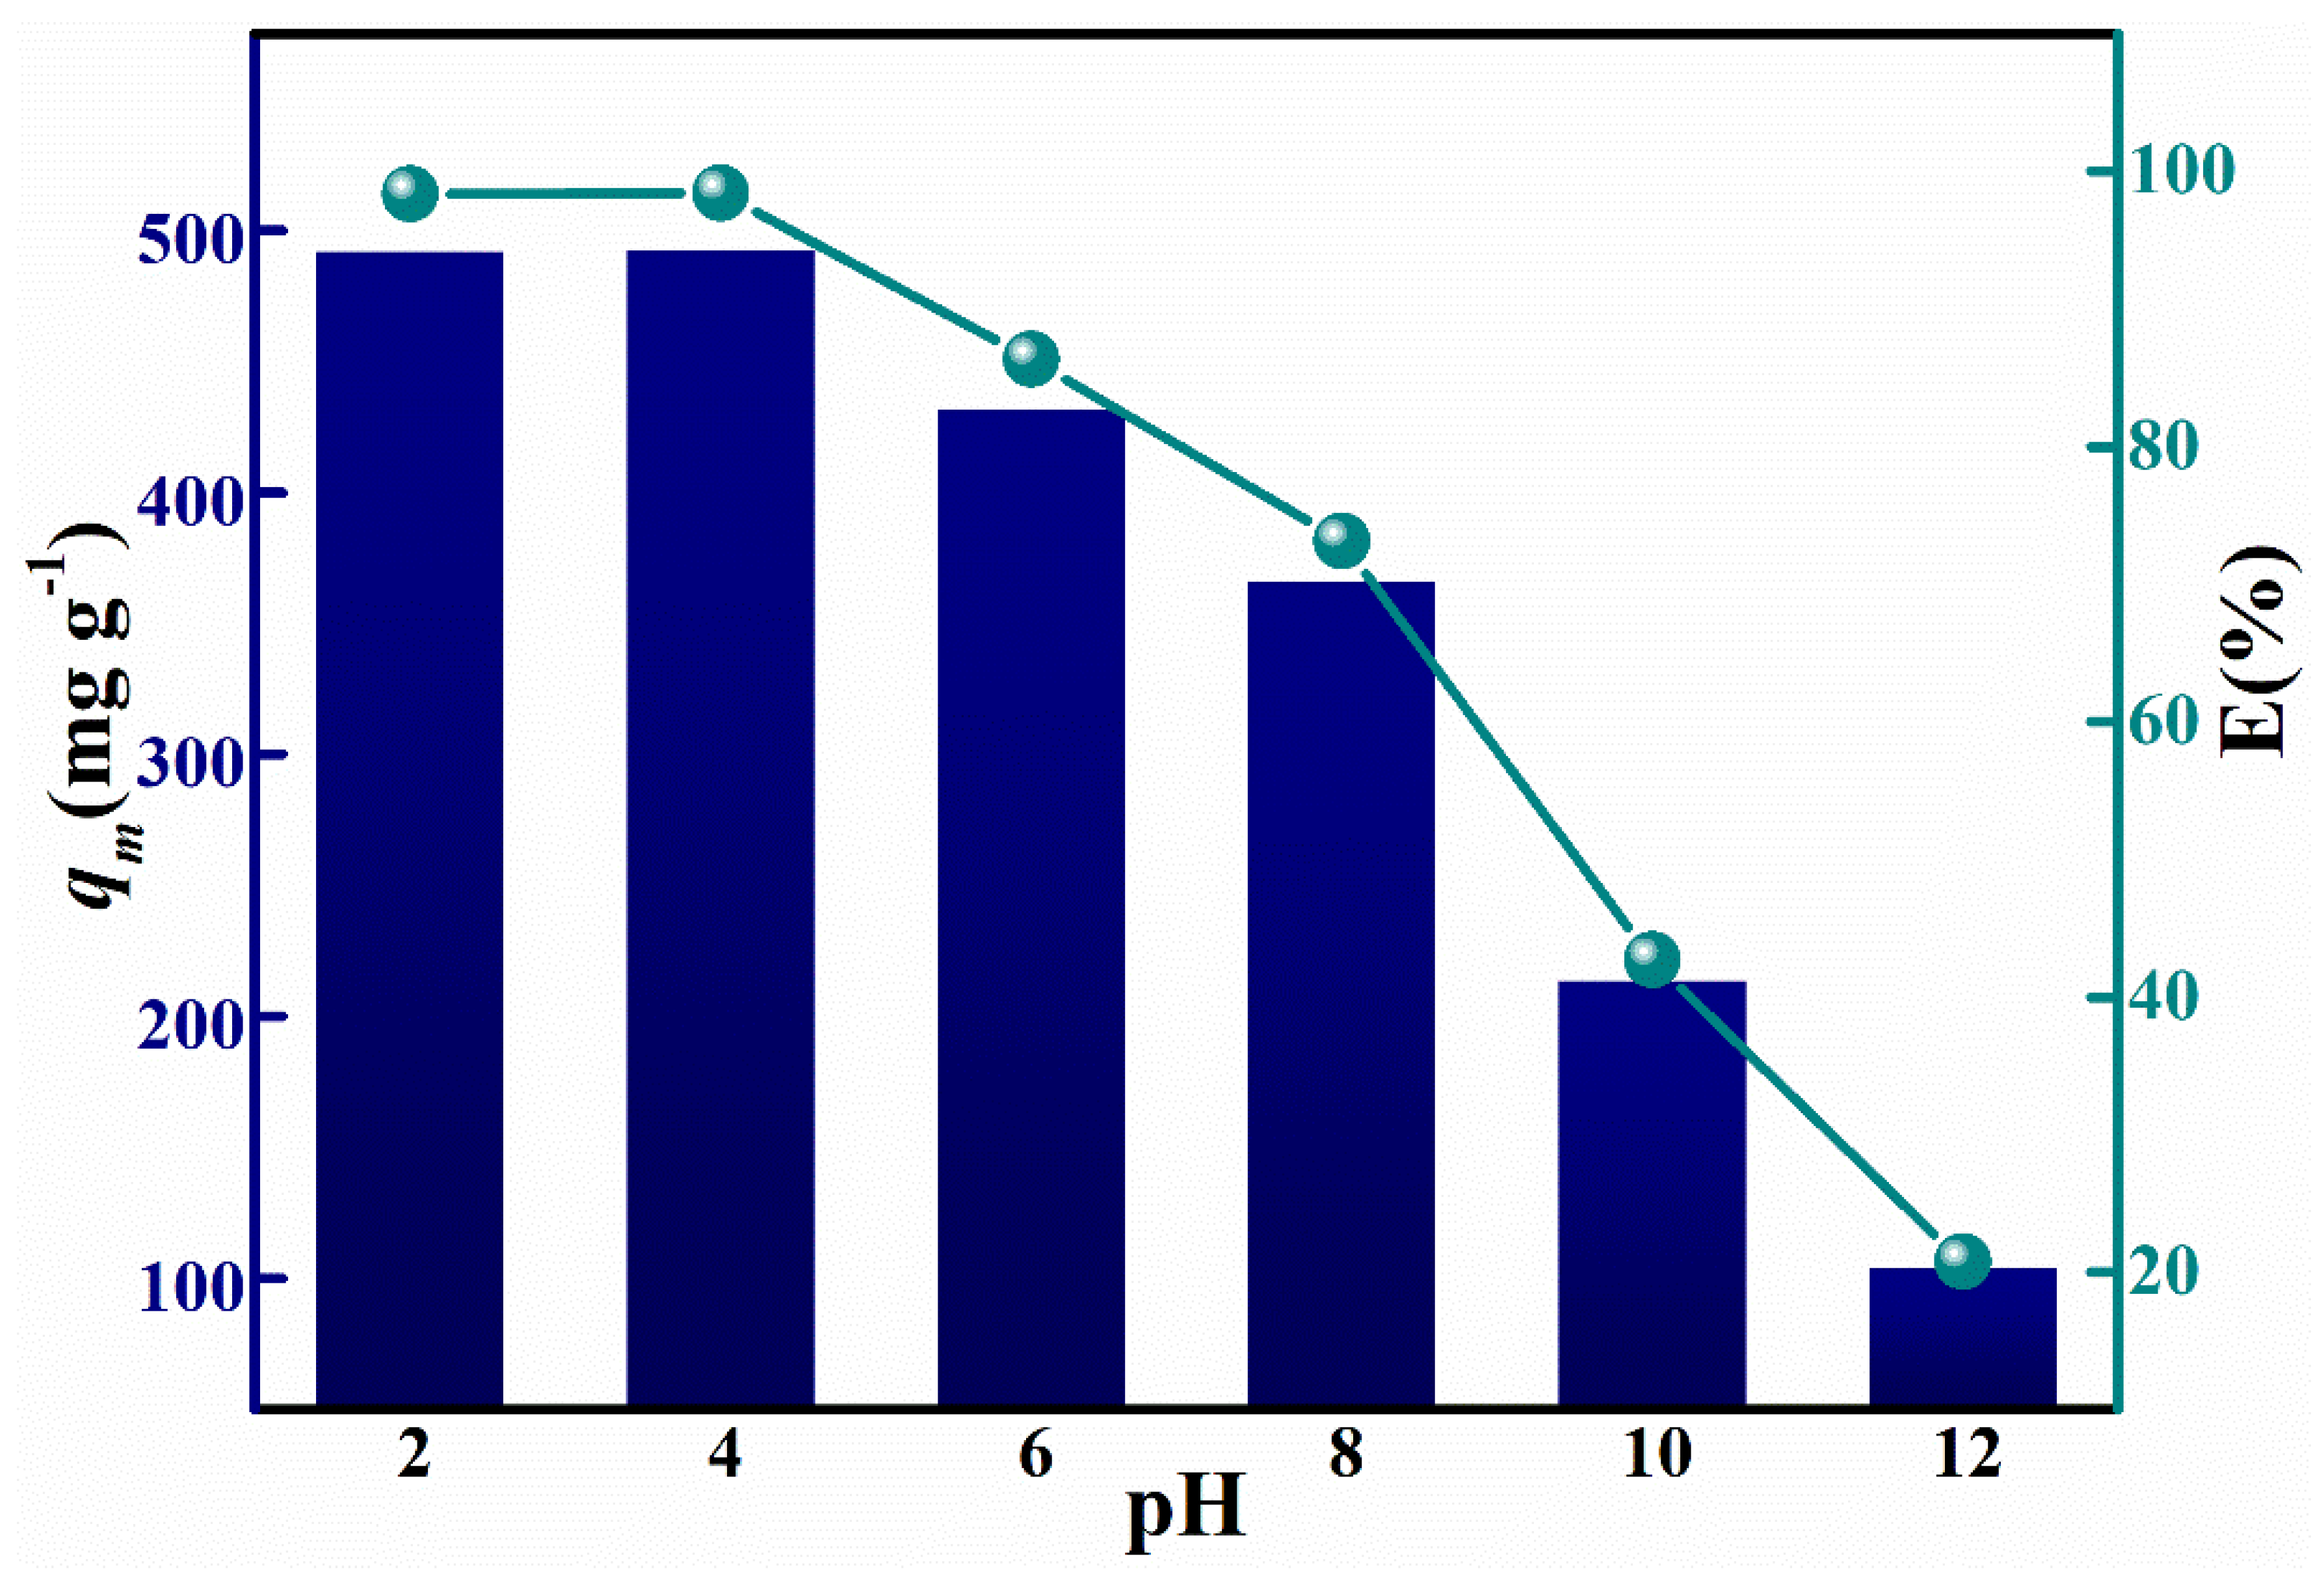
3.3. HPMA Materials Adsorption of Congo Red Analysis

Adsorption kinetics studies play a critical role in adsorption studies, as they can predict very accurately the rate at which pollutants are removed during the adsorption process. Additionally, adsorption kinetic studies can also provide quite pragmatic data when speculating on adsorption mechanisms. The kinetic curve for the adsorption of Congo Red dye in the HPMA sample is shown in Figure 9a. The adsorption process was carried out at 25 °C, the concentration of Congo Red dye was fixed at 250 mg L−1 and the amount of adsorbent was 100 mg. It shows that at the beginning of the process (from 0–10 min), adsorption proceeded very rapidly, but after saturation of the active centers from the adsorbent surface, adsorption remained unchanged. This is due to the fact that the remained vacant sites were difficult to occupy, due to repulsive forces between the dye adsorbed on the surface of HPMA and the solution phase [60,61]. The adsorption equilibrium was reached in about 60 min, the adsorption amount was 492.19 mg g−1 at that time, and the dye removal rate was as high as 98.44%. As discussed in the nitrogen adsorption–desorption analysis, a desodium agent can enahnce the pore structure of the material to increase the specific surface area of the material, and thus enhance its chemistry activity, increasing adsorption capacity. The adsorption kinetic data are in good agreement with this speculation. It is suggested that this HPMA material has excellent adsorption performance for CR and the adsorption rate is very fast, thus, it is suitable for wide use in the adsorption of CR in organic dyes.
Having analyzed the kinetic characteristics of the adsorbent HPMA for Congo Red dye, it is possible, in practice, to design the Congo Red adsorption process in solution. Typically, the frequently used kinetic models are as follows:
Pseudo-first-order model:
ln(qeqt) = lnqe − K1t
Pseudo-second-order model:
t/qt = 1/K2q2e + t/qe
in which qe and qt (mg g−1) are, respectively, the adsorption capacities at equilibrium and at any time t (min).
The kinetic behavior of Congo Red adsorption on the synthesized HPMA was investigated using pseudo-first-order and pseudo-second-order kinetic models. The obtained kinetic parameters for adsorption are listed in Table 10 and these fitted curves are shown in the Figure 9b,c. Apparently, when using the pseudo-first-order kinetic model, the experimental value (qe) was much higher than the calculated value, probably due to the fact that the correlation coefficient, R2, was as low as 0.59214. Contrarily, the pseudo-second-order kinetic model was used to obtain the calculated value of 495.05, close to the experimental value of 495, and the correlation coefficient R2 was as high as 0.99992, indicating that the adsorption process of Congo Red on synthetic HPMA materials is very consistent with the pseudo-second-order kinetic model.
In order to further investigate the internal particle diffusion, the experimental data were fitted with the internal particle diffusion model proposed by Weber and Morris [62]. For adsorbents, the distribution of the adsorbed amount with respect to time t0.5 is more regular than the distribution with respect to contact time t. This model was obtained by fitting the following equation.
qt = Kdi t0.5 + Ci
where Kdi is the rate constant for stage i, calculated from the slope of the curve of qt with respect to t0.5. Ci is the intercept of stage i; the larger the intercept, the more pronounced the boundary layer effect will be. For the internal particle diffusion model, qt should be linear with respect to t0.5, and if the curve passes through the origin point, the velocity-limiting process only depends on the internal particle diffusion rate. A linear fit of the internal particle diffusion model for the adsorption of Congo Red was shown in Figure 9d, where it can be seen that the whole adsorption process can be divided into three steps. From this model, transient adsorption, which can also be referred to as external adsorption, occurs in the solution during the first 2 min when the rate of adsorption is high due to the high initial concentration of Congo Red. The rate of adsorption then decreases significantly during the second phase, which is known as the progressive or slow adsorption phase, and it is the stage wherein the rate of adsorption is limited. The last one is the final equilibrium stage, wherein the CR concentration is at its lowest and therefore the internal particle diffusion rate is at its slowest. The phenomenon Kd1 < Kd2 < Kd3 was shown in Table 11.
The adsorption isotherm is a mathematical model used to describe the adsorbed species distribution on the adsorbent surface of the adsorbent [63,64]. The nonlinear isotherm models proposed by Langmuir [65], Freundlich [66] and Temkin [67] were used to investigate the adsorption mechanism. These models were chosen to understand whether adsorption occurs in monolayers (Langmuir), multilayers (Freundlich) or by diffusion (Temkin).
Langmuir model:
qe = qm KL Ce/(1 + KL Ce)
where Ce (mg/L) is the equilibrium concentration of solute, qe (mg/g) is the equilibrium adsorption capacity of the adsorbent, qm (mg/g) is the saturated adsorption amount of the adsorbent and KL (L/mg) is the Langmuir adsorption constant.
Freundlich model:
lnqe = lnKF + (1/n) lnCe
where KF (L mg−1) and n are Freundlich isotherm constants, which refer to the capacity and intensity of the adsorption.
Temkin model:
qe = RT lnKT/b + RT lnCe/b
where KT (L mg−1) and b are Temkin isotherm constants, R (J/(mol K)) is the ideal gas constant, T (K) is the adsorption temperature.
To study the adsorption isotherms, 100 mg of adsorbent was weighed and dispersed in 200-mL CR solutions with mass concentrations ranging from 50–1750 mg L−1. The relation between the adsorption capacities, removal efficiency of the adsorbents and the initial concentrations of CR was given by the adsorption isotherm in Figure 10. It could be observed that the adsorption capacities of the high-porosity HPMA nanoparticles increased with increase in the initial CR mass concentration and then remained at 1984.64 mg g−1, while its removal efficiency decreased. The linear plots of the Langmuir model, Freundlich model and Temkin model of the adsorption of CR are given in Figure 10b–d and the adsorption isotherms parameters for adsorption of CR on the HPMA powder are shown in Table 12. It shows that the value of R2 of the Langmuir model for the prepared high-porosity HPMA material is 0.99972, while the R2 values of Freundlich model and Temkin model for this material were 0.86148 and 0.97039, respectively. Therefore, the adsorptions of the prepared high porosity HPMA material followed the Langmuir isotherm model closely. which indicates that the adsorption between the sample and Congo Red was a physical adsorption of a single molecular layer on its surface and that no chemical reaction took place [5]. Furthermore, the linearization fitted with the Langmuir isotherm model of the equations for the prepared material was y = 0.000486898x + 0.01022, and the qm value for the adsorption of CR by the prepared high porosity HPMA material calculated with Langmuir isotherm model was 2053.818 mg g−1, which was a little higher than the experiment data of 1984.64 mg g−1.
To investigate the effect of different pH on the saturation adsorption capacity, adsorption was carried out in solutions of pH 2, 4, 6, 8, 10 and 12 (Congo Red mass concentration of 250 mg L, adsorbent mass of 100 mg, temperature of 25 °C). The variation of adsorption and removal rates of Congo Red, with pH values of the solution increasing from 2 to 12, are shown in Figure 11. It can be seen that the equilibrium adsorption capacities of the as-synthesized HPMA nanoparticle ranged from 491.86 mg g−1 to 492.19 mg g−1 at pH values from 2 to 4. The saturation adsorption of Congo Red gradually decreased from 492.19 mg g−1 (pH value of 4) to 103.67 mg g−1 (pH value of 12) as the pH of the solution exceeded 4 (from pH value of 6 to of 12), and removal efficiency reduced from 98.44% (pH value of 4) to 20.73% (pH value of 12). The pH effects on adsorption capacity for Congo Red could be explained by the charge attraction; in the acid solution, the pyridines rings on the HPMA surface were promoted and attracted anionic dye, Congo Red. As the hydroxide ions in the solution increased with increasing pH, and as Congo Red ions and hydroxide ions carry the same electrical charge, the hydroxide ions also occupied adsorption sites on the surface of the material, which increased the competition between the hydroxide ions and the Congo Red ions [28,37,38,42], therefore, the adsorption capacity of Congo Red on the high-porosity HPMA material in the acid solution Was better than that in the base solution.
In order to evaluate the adsorption capacity of the HPMA adsorbents for the removal of CR dyes, and its adsorption maxima for Congo Red were compared with other as-reported metal hydroxides. Moreover, the comparison of the maximum monolayer adsorption (qm) for CR removal by various series of adsorbents is shown in Table 13, Further observation indicates that the maximum adsorption capacity of the as-prepared high-porosity HPMA nanoparticles for CR was significantly higher than that of the majority of reported materials. For instance, the adsorption capacity of the magnetic core-manganese oxide shell for CR was just 43.00 mg g−1, while the adsorption capacity of the as-synthesized alumina powder, with a high-porosity structure, for CR was 1984.64 mg g−1, about 46.15 times higher than that of the magnetic core-manganese oxide shell. The high adsorption capacity is due to the higher specific area and novel high-porosity nanostructures. It indicates that the HPMA material prepared in this study has excellent adsorption properties for Congo Red, and, thus, has the potential for wide application in the treatment of industrial dyes containing Congo Red.

4. Conclusions

In summary, we have synthesized HPMA with a porous structure using non-toxic, cheap sodium hydroxide and industrial aluminum hydroxide by a simple direct ageing method and ammonium salt substitution. The results show that HPMA materials have excellent thermal stability at the purity of 99.9661% and total impurities removal rates of 98.87%, and shows the advantages of both their microstructures and nanostructures, which avoid the aggregation of HPMA nanoparticles and maintain high specific surface areas, a high value of pore volume and ideal pore size distribution, enhancing the surface energy and surface bonding energy, which can be easily stabilized by bonding with other atoms to enhance the chemical activity of HPMA. The greater chemical activity induces corresponding changes in atomic transport and conformation on the surface of the alumina nanoparticles, leading to changes in the electron spin conformation and electronic energy spectrum on the surface of the HPMA material particles, contributing to the improved adsorption performance of HPMA. Moreover, the adsorption mechanism of CR in solution is electrostatic adsorption and the zeta potential of HPMA is 46 ± 3 mV, with potential values between 40–60 mV, indicating that the adsorbent has a positive surface charge and outstanding surface stability, conferring good adsorption performance the HPMA particle for CR. The maximum capacities of the HPMA nanostructures with high porosity for CR have been determined to be 1984.64 mg g−1, demonstrating its promising potential in environmental remediation. The underlying adsorption kinetics follow the pseudo-second-order model, and the adsorption isotherms follow the Langmuir model. The synthesis method is simple, versatile and controllable, which makes it possible to easily achieve efficient HPMA production at the gram level for the treatment of toxic dyes in wastewater. Owing to their highly porous structures, special surface properties and high surface areas, HPMA nanoparticles are potentially applicable in water purification.

Author Contributions

Z.L. and D.W. contributed equally to this work. Conceptualization, Z.L. and Y.L. (Yibing Li); methodology, Z.L. and D.W.; software, Z.L.; validation, D.W., J.C., C.W., Y.L. (Yuping Li) and F.L.; formal analysis, Z.L.; investigation, Z.L.; resources, Y.L. (Yibing Li); data curation, Z.L.; writing-original draft preparation, Z.L. and D.W.; writing-review and editing, J.S.; visualization, Y.L. (Yibing Li); supervision, Y.L. (Yibing Li); project administration, Y.L. (Yibing Li). All authors have read and agreed to the published version of the manuscript.

Funding

This research received no external funding.

Institutional Review Board Statement

Not applicable.

Informed Consent Statement

Not applicable.

Data Availability Statement

The data used to support the findings of this study are available from the corresponding author upon request.

Acknowledgments

The authors are grateful for the Key Laboratory of New Processing Technology for Nonferrous Metals and Materials, Ministry of Education, Guilin University of Technology.

Conflicts of Interest

The authors declare no conflict of interest.

References

  1. Jones, M.; Hutchings, G.J.; Willock, D.J.; Scott, J.; Taylor, S.H. Zinc promoted alumina catalysts for the fluorination of chlor-ofluorocarbons. J. Catal. 2018, 364, 102–111. [Google Scholar] [CrossRef]
  2. Wang, F.; Chen, P.; Li, X.; Zhu, B.Q. Effect of micro-spinel powders addition on the microstructure and properties of alumina refractory castables. Ceram. Int. 2019, 45, 2989–2999. [Google Scholar] [CrossRef]
  3. Zhang, D.; Zhou, S.; Liu, Y.; Fan, X.; Zhang, M.L.; Zhai, J.; Jiang, L. Self-Assembled porphyrin nanofiber membrane-decorated alumina channels for enhanced photoelectric response. ACS Nano 2018, 12, 11169–11177. [Google Scholar] [CrossRef] [PubMed]
  4. Zheng, Y.; Zhang, K.; Liu, T.T.; Liao, W.H.; Zhang, C.D.; Shao, H. Cracks of alumina ceramics by selective laser melting. Ceram. Int. 2019, 45, 175–184. [Google Scholar] [CrossRef]
  5. Kumari, U.; Behera, S.K.; Meikap, B.C. A novel acid modified alumina adsorbent with enhanced defluoridation property: Kinetics, isotherm study and applicability on industrial wastewater. J. Hazard. Mater. 2019, 365, 868–882. [Google Scholar] [CrossRef]
  6. Nguyen, T.D.; Tang, D.; D’Acierno, F.; Michal, C.A.; MacLachlan, M.J. Biotemplated light weight γ-Alumina aerogels. Chem. Mater. 2018, 30, 1602–1609. [Google Scholar] [CrossRef]
  7. Chen, X.; Zheng, X.; Lin, W.; Michal, C.A.; MacLachlan, M.J. Adsorption property and catalytic performance over ordered mesoporous phosphorus-doped Pd-alumina catalysts. Powder Technol. 2018, 338, 869–877. [Google Scholar] [CrossRef]
  8. Busca, G. The surface of transitional aluminas: A critical review. Catal. Today 2014, 226, 2–13. [Google Scholar] [CrossRef]
  9. Maruoka, H.; Tomita, A.; Zheng, L.; Kimura, T. Mesopore connectivity improving aerosol-assisted synthesis of mesoporous alumina powders with high surface area. Langmuir 2018, 34, 13781–13787. [Google Scholar] [CrossRef]
  10. Liu, S.; Liang, X.; Zhang, J.; Chen, B. Temperature sensitive synthesis of γ-Al2O3 support with different morphologies for CoMo/γ-Al2O3 catalysts for hydrodesulfurization of thiophene and 4,6-dimethyldibenzothiophene. Catal. Sci. Technol. 2017, 7, 466–480. [Google Scholar] [CrossRef]
  11. Wang, X.H.; Ni, H.H.; Cao, Y.; Li, G.; Gao, H.; Yang, J.L. The Reaction Kinetics of Aluminum and Isopropanol. Appl. Mech. Mater. 2012, 164, 21–25. [Google Scholar] [CrossRef]
  12. Smith, P.; Power, G. High purity alumina-current and future production. Miner. Processing Extr. Metall. Rev. 2021. [Google Scholar] [CrossRef]
  13. Lee, G.; Chen, C.; Yang, S.T.; Ahn, W.S. Enhanced adsorptive removal of fluoride using mesoporous alumina. Microporous Mesoporous Mater. 2010, 127, 152–156. [Google Scholar] [CrossRef]
  14. Nalivaiko, A.Y.; Ozherelkov, D.Y.; Pak, V.I.; Kirov, S.S.; Arnautov, A.N.; Gromov, A.A. Preparation of aluminum hydroxide during the synthesis of high purity alumina via aluminum anodic oxidation. Metall. Mater. Trans. B-Prcocess Metall. Mater. Processing Sci. 2020, 51, 1154–1161. [Google Scholar] [CrossRef]
  15. Kim, S.W.; Jung, Y.M. Nanocrystalline particle coatings on a-alumina powders by a carbonate precipitation and thermal-assisted combustion route. J. Nanosci. Nanotechnol. 2007, 11, 3906–3909. [Google Scholar] [CrossRef] [PubMed]
  16. Yong-Taeg, O.; Kim, S.W.; Shin, D.C. Fabrication and synthesis of alpha-alumina nanopowders by thermal decomposition of ammonium aluminum carbonate hydroxide (AACH). Colloids Surf. A Physicochem. Eng. Asp. 2008, 313, 415–418. [Google Scholar]
  17. Ambaryan, G.N.; Vlaskin, M.S.; Buryakovskaya, O.A.; Kislenko, S.; Zhuk, A.; Shkolnikov, E.; Arnautov, A.; Zmanovsky, S.; Osipenkova, A.; Tarasov, V.; et al. Advanced manufacturing process of ultrahigh-purity α-Al2O3. Sustain. Mater. Technol. 2018, 17, e00065. [Google Scholar] [CrossRef]
  18. Bae, H.C.; Lee, S.J. Study on the fabrication processing of high-purity, high-density alumina green body prepared by a hydrothermal method. J. Ceram. Processing Res. 2015, 16, 319–323. [Google Scholar]
  19. Suchanek, W.L. Hydrothermal Synthesis of Alpha Alumina (alpha-Al2O3) Powders: Study of the Processing Variables and Growth Mechanisms. J. Am. Ceram. Soc. 2010, 93, 399–412. [Google Scholar] [CrossRef]
  20. Popp, U.; Herbig, R.; Michel, G.; Muller, E.; Oeatreich, C. Properties of nanocrystalline ceramic powders prepared by laser evaporation and recondensation. J. Eur. Ceram. Soc. 1998, 18, 1153–1160. [Google Scholar] [CrossRef]
  21. Gautam, R.; Mudhoo, A.; Chattopadhyaya, M. Kinetic, equilibrium, thermodynamic tudies and spectroscopic analysis of Alizarin Red S removal by adsorption onto ustard husk. J. Environ. Chem. Eng. 2013, 1, 1283–1291. [Google Scholar] [CrossRef]
  22. Roosta, M.; Ghaedi, M.; Daneshfar, A.; Sahraei, R. Experimental design-based response surface methodology optimization of ultrasonic assisted adsorption of safaranin O by tin sulfide nanoparticle loaded on activated carbon. Spectrochim. Acta 2014, 122, 223–231. [Google Scholar] [CrossRef] [PubMed]
  23. Chatterjee, S.; Lee, M.; Woo, S. Adsorption of congo red by chitosan hydrogel beads impregnated with carbon nanotubes. Bioresour. Technol. 2010, 101, 1800–1806. [Google Scholar] [CrossRef] [PubMed]
  24. Soylak, M.; Yilmaz, E.; Ghaedi, M.; Montazerozohori, M. Cloud point extraction and flame atomic absorption spectrometry determination of lead (II) in environmental and food samples. J. AOAC Int. 2012, 95, 1797–1802. [Google Scholar] [CrossRef]
  25. Espergham, O.; Ghaedi, M.; Niknam, K.; Kokhdan, S.N. A cloud point extraction methodology for the determination of trace amounts of copper, cobalt, zinc and manganese by flame atomic absorption spectrometry using a new imidazole derivative. Fresenius Environ. Bullet. 2011, 20, 2350–2356. [Google Scholar]
  26. Ghaedi, M.; Niknam, K.; Niknam, E.; Soylak, M. Application of cloud point extraction for copper, nickel, zinc and iron ions in environmental samples. J. Chin. Chem. Soc. 2013, 56, 981–986. [Google Scholar] [CrossRef]
  27. Ghaedi, M.; Shokrollahi, A.; Niknam, K.; Niknam, E.; Najibi, A.; Soylak, M. Cloud point extraction and flame atomic absorption spectrometric determination of cadmium (II), lead (II), palladium (II) and silver(I) in environmental samples. J. Hazard. Mater. 2009, 168, 1022–1027. [Google Scholar] [CrossRef]
  28. Chafi, M.; Gourich, B.; Essadki, A.; Vial, L.; Fabregat, A. Comparison of electrocoagulation using iron and aluminium electrodes with chemical coagulation for the removal of a highly soluble acid dye. Desalination 2011, 281, 285–292. [Google Scholar] [CrossRef]
  29. Vijayaraghavan, G.; Shanthakumar, S. Performance study on algal alginate as natural coagulant for the removal of Congo red dye. Desal. Water Treat. 2016, 57, 6384–6392. [Google Scholar] [CrossRef]
  30. Munagapati, V.; Kim, D. Equilibrium isotherms, kinetics, and thermodynamics studies for Congo Red adsorption using calcium alginate beads impregnated with nano-goethite. Ecotox. Environ. Saf. 2017, 141, 226–234. [Google Scholar] [CrossRef]
  31. Omran, A.; Baiee, M.; Juda, S. Removal of Congo red dye from aqueous solution using a new adsorbent surface developed from aquatic plant (Phragmites australis). Int. J. ChemTech Res. 2016, 9, 334–342. [Google Scholar]
  32. Satheesh, R.; Vignesh, K.; Rajarajan, M.; Suganthi, A.; Sreekantan, S.; Knag, M.; Kwak, B.S. Removal of Congo red from water using quercetin modified α-Fe2O3 nanoparticles as effective nanoadsorbent. Mater. Chem. Phys. 2016, 180, 53–65. [Google Scholar] [CrossRef]
  33. Solísabbba, M. Microbial decolouration of azo dyes: A review. Process Biochem. 2012, 47, 1723–1748. [Google Scholar]
  34. Liu, M.; Chen, Q.; Lu, K.; Huang, W.; Lu, Z.; Zhou, C.; Yu, S.; Gao, C. High efficient removal of dyes from aqueous solution through nanofiltration using diethanolamine-modified polyamide thin-film composite membrane. Sep. Pur. Technol. 2017, 173, 135–143. [Google Scholar] [CrossRef]
  35. Zhou, J.; Tang, C.; Cheng, B.; Yu, J.; Jaroniec, M. Rattle-type carbon-alumina core-shell spheres: Synthesis and application for adsorption of organic dyes. ACS Appl. Mater. Inter. 2012, 4, 2174–2179. [Google Scholar] [CrossRef]
  36. Roy, T.; Mondal, N. Biosorption of Congo Red from aqueous solution onto burned root of Eichhornia crassipes biomass. Appl. Water Sci. 2017, 7, 1841–1854. [Google Scholar] [CrossRef] [Green Version]
  37. Carmen, A.; Ghinea, C.; Alves, M.; Gavrilescu, M. Removal of Erythrosine B dye from water effluents using crop waste pumpkin seed hulls as adsorbent. Desal. Water Treat. 2016, 57, 22585–22608. [Google Scholar] [CrossRef] [Green Version]
  38. Fang, B.; Bao, Z.; Lu, L.; Zhao, L.; Wang, H. Preparation of a hierarchical flower-like γ-Al2O3@C composite exhibiting enhanced adsorption performance for congo red by high temperature transformation of γ-AlOOH@ C precursors. RSC Adv. 2016, 6, 61–64. [Google Scholar] [CrossRef]
  39. Liu, S.; Cai, Y.; Cai, X.; Li, H.; Zhang, F.; Mu, Q.; Wang, Y.; Wang, D. Catalytic photodegradation of Congo red in aqueous solution by Ln(OH)3, (Ln = Nd, Sm, Eu, Gd, Tb, and Dy) nanorods. Appl. Catal. A 2013, 453, 45–53. [Google Scholar] [CrossRef]
  40. Ong, C.; Mohammad, A.; Rohani, R.; Ba-Abbad, M.M. Solar photocatalytic degradation of hazardous Congo red using low-temperature synthesis of zinc oxide nanoparticles. Process Saf. Environ. 2016, 104, 549–557. [Google Scholar] [CrossRef]
  41. Thomas, M.; Naikoo, G.; Sheikh, M.; Bano, M.; Khan, F. Effective photocatalytic degradation of Congo red dye using alginate/carboxymethyl cellulose/TiO2 nanocomposite hydrogel under direct sunlight irradiation. J. Photochem. Photobio. A 2016, 327, 33–43. [Google Scholar] [CrossRef]
  42. Tanwar, R.; Kumar, S.; Mandal, U. Photocatalytic activity of PANI/Fe0 doped BiOCl under visible light-degradation of Congo red dye. J. Photochem. Photobio. A 2017, 333, 105–116. [Google Scholar] [CrossRef]
  43. Rengaraj, S.; Moona, S.; Sivabalan, R.; Arabindoo, B.; Murugesan, V. Removal of phenol from aqueous solution and resin manufacturing industry wastewater using an agricultural waste: Rubber seed coat. J. Hazard. Mater. 2002, 89, 185–196. [Google Scholar] [CrossRef]
  44. Malik, P. Dye removal from wastewater using activated carbon developed from sawdust: Adsorption equilibrium and kinetics. J. Hazard. Mater. 2004, 113, 81–88. [Google Scholar] [CrossRef] [PubMed]
  45. Guo, Y.; Zhao, J.; Zhang, H.; Yang, S.; Qi, J.; Wang, Z.; Xu, H. Use of rice husk-based porous carbon for adsorption of rhodamine B from aqueous solutions. Dye. Pigm. 2005, 66, 123–128. [Google Scholar] [CrossRef]
  46. Rehman, M.; Kim, I.; Han, J. Adsorption of methylene blue dye from aqueous solution by sugar extracted spent rice biomass. Carbohyd. Polym. 2012, 90, 1314–1322. [Google Scholar] [CrossRef]
  47. Dubey, S.; Singh, A.; Nim, B.; Singh, I.B. Optimization of molar concentration of AlCl3 salt in the sol-gel synthesis of nanoparticles of gamma alumina and their application in the removal of fluoride of water. J. CFCSol-Gel Sci. Techn. 2017, 82, 468–477. [Google Scholar] [CrossRef]
  48. Xu, N.; Liu, Z.; Dong, Y.; Hong, T.; Dang, L.; Li, W. Controllable synthesis of mesoporous alumina with large surface area for high and fast fluoride removal. Ceram. Int. 2016, 42, 15253–15260. [Google Scholar] [CrossRef]
  49. Zhu, W.; He, D.; Han, C.; He, S.; Liao, M.; Shan, X.; Luo, Y. Optimization of As (V) removal from contaminated water with mesoporous alumina: Effects of pH, contact time, concentration and temperature. J. Environ. Eng. 2017, 143, 9. [Google Scholar] [CrossRef]
  50. Lanas, S.; Valiente, M.; Aneggi, E.; Trovarelli, A.; Tolazzi, M.; Melchior, A. Efficient fluoride adsorption by mesoporous hierarchical alumina microspheres. RSC Adv. 2016, 6, 42288–42296. [Google Scholar] [CrossRef]
  51. Xu, N.; Liu, Z.; Bian, S.; Dong, Y.; Li, W. Preparation of MnO2–Al2O3 adsorbent with large specific surface area for fluoride removal. Particuology 2016, 27, 66–71. [Google Scholar] [CrossRef]
  52. Padmaja, P.; Pillai, P.K.; Warrier, K.G.K.; Padmanabhan, M. Adsorption isotherm and pore characteristics of nano alumina derived from sol-gel boehmite. J. Porous Mater. 2004, 11, 147–155. [Google Scholar] [CrossRef]
  53. Wu, Y.S.; Ma, J.; Hu, F.; Li, M.C. Synthesis and Characterization of Mesoporous Alumina via a Reverse Precipitation Method. J. Mater. Sci. Technol. 2012, 28, 572–576. [Google Scholar] [CrossRef]
  54. Jian-hong, Y.; You-yi, S.; Jian-feng, G.; Chun-yan, X. Synthesis of crystalline γ-Al2O3 with high purity. Trans. Nonferrous Met. Soc. China 2009, 19, 1237–1242. [Google Scholar]
  55. Zaitan, H.; Bianchi, D.; Achak, O.; Chafik, T.A. comparative study of the adsorption and desorption of o-xylene onto bentonite clay and alumina. J. Hazard. Mater. 2008, 153, 852–859. [Google Scholar] [CrossRef]
  56. Cai, W.Q.; Li, H.Q.; Zhang, Y. Azeotropic distillation-assisted preparation of macro-mesostructured γ-Al2O3 nanofibres of crumpled sheet-like morphology. Mater. Chem. Phys. 2006, 96, 136–139. [Google Scholar] [CrossRef]
  57. Chanda, S.C.; Manna, A.; Vijavan, V.; Nayak, P.; Ashok, M.; Acharya, H.N. PIXE & XRD analysis of nanocrystals of Fe, Ni and Fe2O3. Mater. Lett. 2007, 61, 5059–5062. [Google Scholar]
  58. Li, D.; Schubert, B.; Norman, J.W. Characterization of gationic polyelectrolytes adsorption to an anionic emulsion via zeta-potential and microcalorimetry. J. Surfactants Deterg. 2014, 4, 655–667. [Google Scholar] [CrossRef]
  59. Alyassin, Y.; Sayed, E.G.; Mehta, P.; Ruparelia, K.; Arshad, M.S.; Rasekh, M.; Shepherd, J.; Kucuk, L.; Wilson, P.B.; Singh, N. Application of mesoporous silica nanoparticles as drug delivery carriers for chemotherapeutic agents. Drug Discov. Today 2020, 25, 1513–1520. [Google Scholar] [CrossRef]
  60. Nicola, R.; Muntean, S.G.; Nistor, M.A.; Putz, A.M.; Almasy, L.; Sacarescu, L. Highly efficient and fast removal of colored pollutants from single and binary systems, using magnetic mesoporous silica. Chemosphere 2020, 261, 127737. [Google Scholar] [CrossRef]
  61. Zhang, Y.; Bai, L.; Zhou, W.; Lu, R.; Gao, H.; Zhang, S. Superior adsorption capacity of Fe3O4@nSiO2@mSiO2 core-shell microspheres for removal of Congo red from aqueous solution. J. Mol. Liq. 2016, 219, 88–94. [Google Scholar] [CrossRef]
  62. Weber, W.; Morris, J. Kinetics of adsorption on carbon from solution. J. Sanit. Eng. Div. 1963, 89, 31–60. [Google Scholar] [CrossRef]
  63. Pal, S.; Patra, A.; Ghorai, S.; Sarkar, A.; Mahato, V.; Sarkar, S.; Singh, R. Efficient and rapid adsorption characteristics of templating modified guar gum and silica nanocomposite toward removal of toxic reactive blue and Congo red dyes. Bioresour. Technol. 2015, 191, 291–299. [Google Scholar] [CrossRef] [PubMed]
  64. Kumar, P.S.; Kirthika, K. Equilibrium and kinetic study of adsorption of nickel from aqueous solution onto Bael tree leaf powder. J. Eng. Sci. Technol. 2009, 4, 351–363. [Google Scholar]
  65. Assche, T.R.; Baron, G.V.; Denayer, J.F. An explicit multicomponent adsorption isotherm model: Accounting for the size-effect for components with Langmuir adsorption behavior. Adsorption 2018, 24, 517–530. [Google Scholar] [CrossRef]
  66. Darvishi, R.; Soltani, C.; Hassani, A.; Karaca, S.; Khataee, A. Preparation of cetyltrimethylammonium bromide modified montmorillonite nanomaterial for adsorption of a textile dye. J. Taiwan Inst. Chem. Eng. 2014, 45, 2565–2577. [Google Scholar]
  67. Samad, A.; Din, M.I.; Ahmed, M.; Ahmad, S. Synthesis of zinc oxide nanoparticles reinforced clay and their applications for removal of Pb (Ⅱ) ions from aqueous media. Chin. J. Chem. Eng. 2021, 32, 454–461. [Google Scholar] [CrossRef]
  68. Hao, T.; Yang, C.; Rao, X.; Wang, J.; Niu, C.; Su, X. Facile additive-free synthesis of iron oxide nanoparticles for efficient adsorptive removal of Congo red and Cr(Ⅵ). Appl. Surf. Sci. 2014, 292, 174–180. [Google Scholar] [CrossRef]
  69. Zhang, Y.; Ye, Y.; Zhou, X.; Liu, Z.; Zhu, G.; Li, D.; Li, X. Monodispersed hollow aluminosilica microsphere@hierarchical γ-AlOOH deposited with or without Fe(OH)3 nanoparticles for efficient adsorption of organic pollutants. J. Mater. Chem. A 2016, 4, 838–846. [Google Scholar] [CrossRef]
  70. Zeng, B.; Yang, L.; Zheng, W.; Zhu, J.; Ma, X.; Liu, X.; Yuan, C.; Xu, Y.; Dai, L. Analysis of the formation process and performance of magnetic Fe3O4@Poly(4-vinylpyridine) absorbent prepared by in-situ synthesis. J. Mater. Sci. Technol. 2018, 34, 999–1007. [Google Scholar] [CrossRef]
  71. Cai, W.; Yu, J.; Jaroniec, M. Template-free synthesis of hierarchical spindle-like γ-Al2O3 materials and their adsorption affinity towards organic and inorganic pollutants in water. J. Mater. Chem. 2010, 20, 4587–4594. [Google Scholar] [CrossRef]
  72. Zhang, E.L.; Sun, X.J.; Liu, X.T.; Wang, Q.D. Morphology controlled synthesis of α-FeOOH crystals and their shape-dependent adsorption for decontamination of Congo red dye. Mater. Res. Innov. 2015, 19, 385–391. [Google Scholar] [CrossRef]
  73. Cai, W.; Hu, Y.; Chen, J.; Zhang, G.; Xia, T. Synthesis of nanorod-like mesoporous γ-Al2O3 with enhanced affinity towards Congo red removal: Effects of anions and structure-directing agents. Crystengcomm 2012, 14, 972–977. [Google Scholar] [CrossRef]
  74. Zhai, Y.; Zhai, J.; Zhou, M.; Dong, S. Ordered magnetic core-manganese oxide shell nanostructures and their application in water treatment. J. Mater. Chem. 2009, 19, 7030–7035. [Google Scholar] [CrossRef]
Figure 1. Effect of initial concentration of NaAl(OH)4 solution on the mass ratio of MA.
Materials 15 00970 g001
Figure 2. Effect of aging temperature on the impurity mass ratio in the product alumina.
Materials 15 00970 g002
Figure 3. Effect of aging time on the impurity mass fraction in the product alumina.
Materials 15 00970 g003
Figure 4. Nitrogen adsorption and desorption isotherms (a): (NH4)2CO3, (b): CH3COONH4, (c): (NH4)2C2O4; pore size distribution curves of different ammonium salts used in the products (d): (NH4)2CO3, (e): CH3COONH4, (f): (NH4)2C2O4.
Materials 15 00970 g004
Figure 5. Effect of the mass concentration of ammonium carbonate solution on the mass fraction of the product alumina.
Materials 15 00970 g005
Figure 6. XRD patterns; (a) nitrogen adsorption-desorption isotherms; (b) pore-size distribution curves (c) of HPMA products obtained at different roasting temperatures: (a) 500 °C; (b) 700 °C; (c) 900 °C.
Materials 15 00970 g006
Figure 7. TEM images of HPMA materials obtained at different roasting temperatures: (a) 500 °C; (b) 700 °C; (c) 900 °C; (d) 1100 °C.
Materials 15 00970 g007
Figure 8. XRD pattern (a); TGA diagram (b); SEM image (c); TEM picture (d); Zeta potential plots (e); Nitrogen adsorption–desorption isotherms (f); cumulative pore volume (g); and cumulative area (h) through BJH kernels of mesoporous HPA material synthesized under optimal conditions. The inset of (f) shows the pore-size distribution curves in the BJH model.
Materials 15 00970 g008
Figure 9. Variation in adsorption capacity with adsorption time for CR (a); pseudo-first order kinetics (b); pseudo-second order kinetics (c); intra-particle diffusion kinetics (d) for adsorption of CR on samples HPMA (T = 25 °C, adsorbent mass = 100 mg, CR concentration = 250 mg L−1, and pH = 4).
Materials 15 00970 g009
Figure 10. (a) Adsorption isotherms and percentage removal of CR as a function of the initial concentration; plots fitted with (b) Langmuir Model, (c) Freundlich Model and (d) Temkin Model for adsorption of CR on samples HPMA (T = 25 °C, adsorbent mass = 100 mg and pH = 4).
Materials 15 00970 g010
Figure 11. pH effect on the equilibrium adsorption capacity and removal efficiencies of CR in HPMA samples.
Materials 15 00970 g011
Table 1. Approximate market price for HPA by product purity. Ranges are estimated from various sources.
HPA Purity (by Weight)3N (99.9%)4N (99.99%)5N (99.999%)
approx. market price range (US$/tonne)$5000–$15,000$15,000–$30,000$30,000–$50,000
Table 2. Components of industrial aluminum hydroxide.
Component Content (wB/%)
SiO2Fe2O3Na2OAl(OH)3
1.251.160.5897.01
Table 3. Influence of initial NaAl(OH)4 solution concentration on impurity removal efficiency and alumina purity.
Concentration
(g L−1)
Removal Efficiency (%)Alumina Purity
(%)
Fe2O3SiO2Na2OTotal Removal Rate
3099.5899.2192.0697.9799.9393
6099.4499.5796.2198.8699.9661
9099.2899.3794.3198.3699.9509
12099.2299.3393.4598.1599.9447
Table 4. Influence of aging temperature on impurity removal efficiency and alumina purity.
Aging Temperature (°C)Removal Efficiency (%)Alumina Purity
(%)
Fe2O3SiO2Na2OTotal Removal Rate
3099.4599.5693.1098.2699.9481
6099.4499.5796.2198.8699.9661
9099.3299.4895.1798.5899.9576
12099.3099.5294.8398.5399.9552
Table 5. Effect of aging time on impurity removal efficiency and alumina purity.
Aging Time
(h)
Removal Efficiency (%)Alumina Purity
(%)
Fe2O3SiO2Na2OTotal Removal Rate
199.4299.5593.4598.3199.9497
1.599.4499.5494.3198.4899.9547
299.4499.5796.2198.8699.9661
2.599.3799.5094.1498.4199.9526
399.3299.4292.4198.0399.9410
3.599.3299.4392.2497.9999.9401
499.3299.4491.7297.8999.9371
Table 6. Effect of ammonium salt type on the impurity mass, alumina purity and porosity the product alumina.
Desodium AgentContent (wB/%)Specific Surface Area (m2 g−1)Pore Volume
(cm3 g1)
Pore Size
(nm)
Fe2O3SiO2Na2OAl2O3
(NH4)2CO30.00650.00540.02299.9661312.430.433.80
CH3COONH40.00630.00570.05499.9340276.850.323.86
(NH4)2C2O40.00660.00540.05099.9380252.200.334.15
Table 7. Effect of mass concentration of ammonium carbonate solution on impurity removal efficiency, specific surface area and alumina purity.
Concentration (g L−1)Removal Efficiency (%)Alumina Purity
(%)
Specific Surface Are (m2 g−1)
Fe2O3SiO2Na2OTotal Removal Rate
2599.4499.5493.2898.2899.9478205.86
5099.4299.5693.9798.4299.9528276.54
7599.4499.5796.2198.8799.9661312.43
10099.4199.5496.2198.8499.9653311.59
Table 8. Effect of roasting temperature on the specific surface area and pore volume.
TemperatureSpecific Surface Area (m2 g−1)Pore Volume (cm3 g−1)Pore Diameter (nm)
500 °C312.430.483.80
700 °C199.350.365.36
900 °C144.340.198.66
1100 °C88.520.0810.03
Table 9. Impurity mass fraction in the product mesoporous alumina and its porosity.
ImpuritiesFe2O3SiO2Na2OTotal
Values
Specific Surface Area (m2 g−1)Pore Volume
(cm3 g−1)
Pore Size
(nm)
Content (wB/%)0.00650.00540.0220.0339
Remove rate (%)99.4499.5796.2198.87312.430.483.80
Table 10. Kinetic parameters for adsorption of CR on the HPMA powder.
qe-exp (mg g−1)495
pseudo-first-oder modelqe-cal (mg g−1)K1 (min−1)R2
51.360.032360.59214
pseudo-second-oder modelqe-cal (mg g−1)K2 (min−1)R2
495.050.003344590.99992
K1 is the kinetic parameter fitted by the 1st-order model. K2 is the kinetic parameter fitted by 2nd-order model.
Table 11. Intra-particle diffusion model constants and correlation coefficients for adsorption of CR.
Kd1 (min−1)C1R12
247.343−1.821671
Kd2 (min−1)C2R22
73.47937254.924490.95626
Kd3 (min−1)C3R32
2.11518470.822880.82684
Kdi is the value of slope fitted by I-D model; Ci is the corresponding intercept value.
Table 12. Adsorption isotherms parameters for adsorption of CR on the HPMA powder.
Langmuir modelqm (mg g−1)KLR2
2053.8180.04760.99972
Freundlich modelKF (mg1−(1/n) L1/ng−1)nR2
259.7552.8820.86148
Temkin modelKT (L mg−1)bR2
1.0217.18530.97039
Table 13. Comparison of the maximum monolayer adsorption (qm) of different adsorbents for the removal of CR.
Adsorbentsqm(mg g−1)References
CR
HPMA nanopowder1984.64This study
a-Fe2O3 nanoparticles and nanowhiskers254.00[68]
HAM@ γ-AlOOH/Fe(OH)3252.53[69]
Fe3O4@P4-VP nanospheres151.50[70]
spindle-like γ-Al2O3176.70[71]
α-FeOOH nanorods104.2[72]
nanorod-like mesoporous γ-Al2O383.80[73]
magnetic core-manganes oxide shell43.00[74]
Fe2O3@mSiO272.22[65]
Publisher’s Note: MDPI stays neutral with regard to jurisdictional claims in published maps and institutional affiliations.

