
Durability of Nano-Reinforced Recycled Aggregate Concrete under Load and Chloride Ingress
Abstract
:1. Introduction
2. Materials and Methods
2.1. Materials
2.2. Preparation of Nano Reinforced Recycled Aggregate
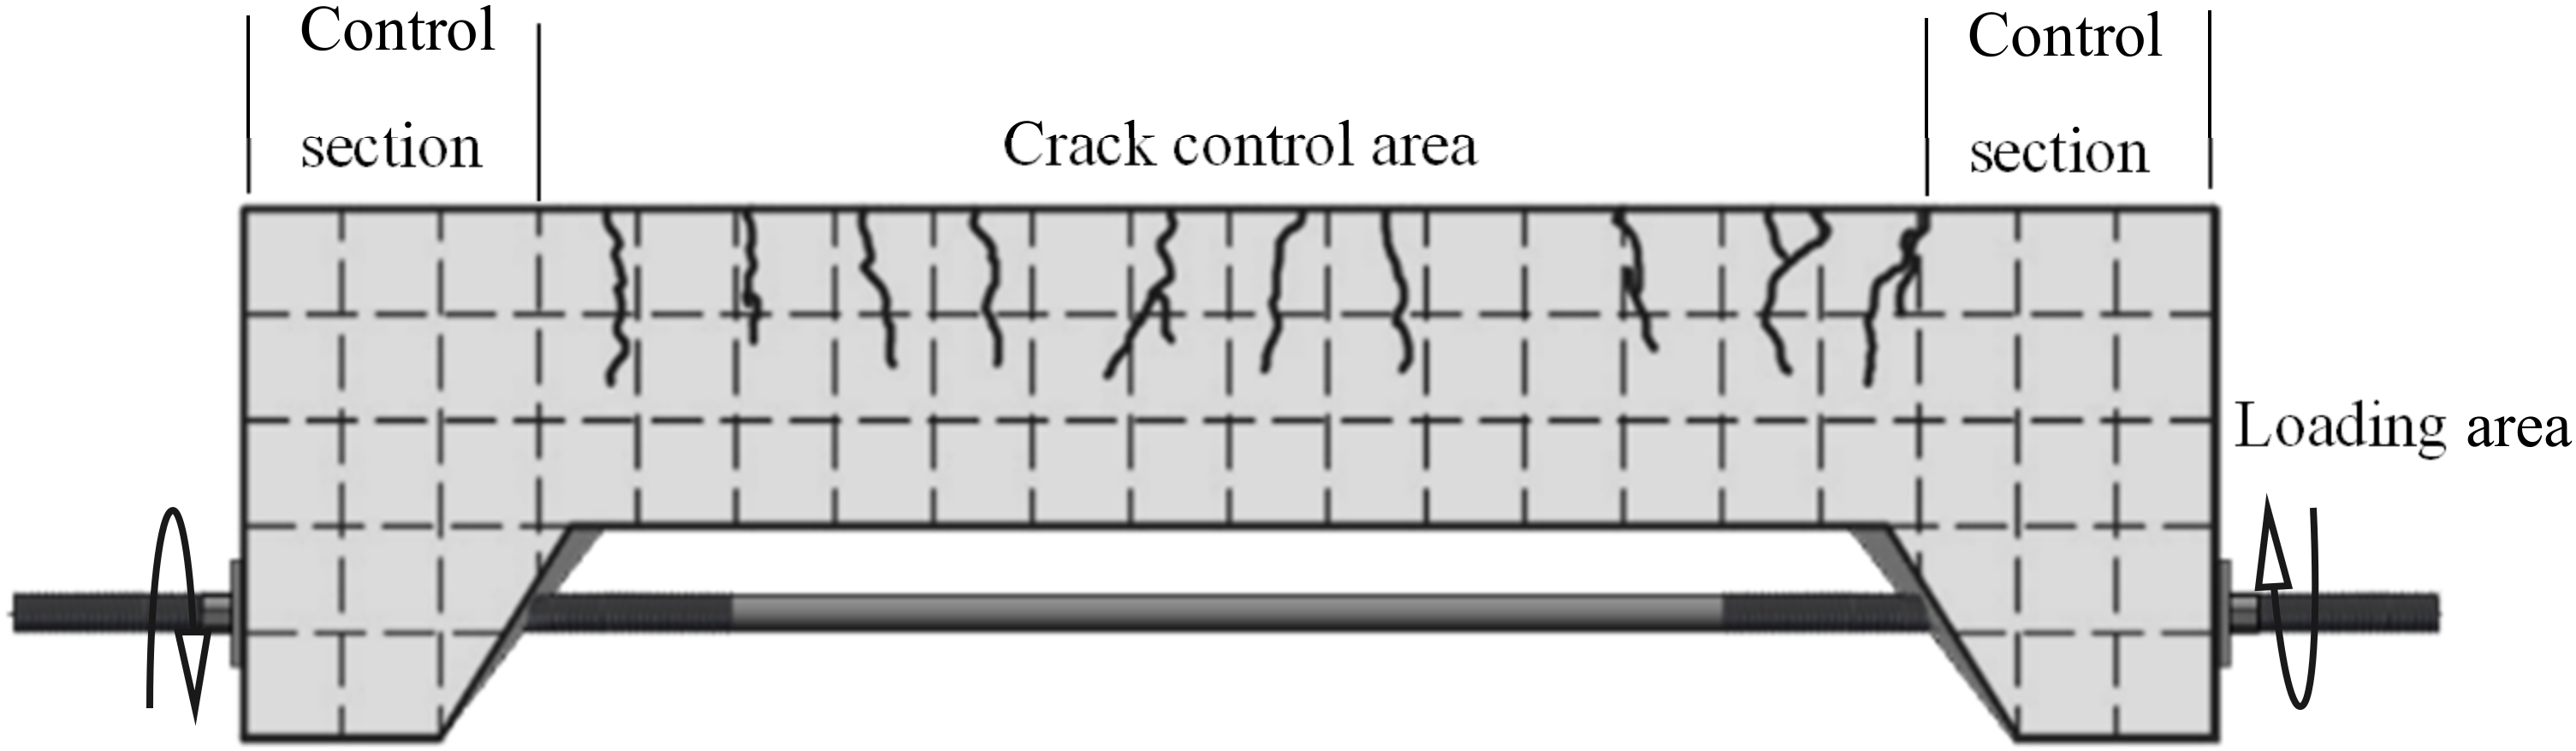
2.3. Self-Anchored Crack
- The maximum crack width can be effectively controlled to reach the intended value through the stepped loading method using a stress wrench.
- With an increase in the maximum crack width, although the total number of cracks increased, the average spacing value showed a downward trend.
- The average spacing of cracks was approximately proportional to the replacement ratio of recycled aggregate.
2.4. Chloride Drying-Wetting Cycle
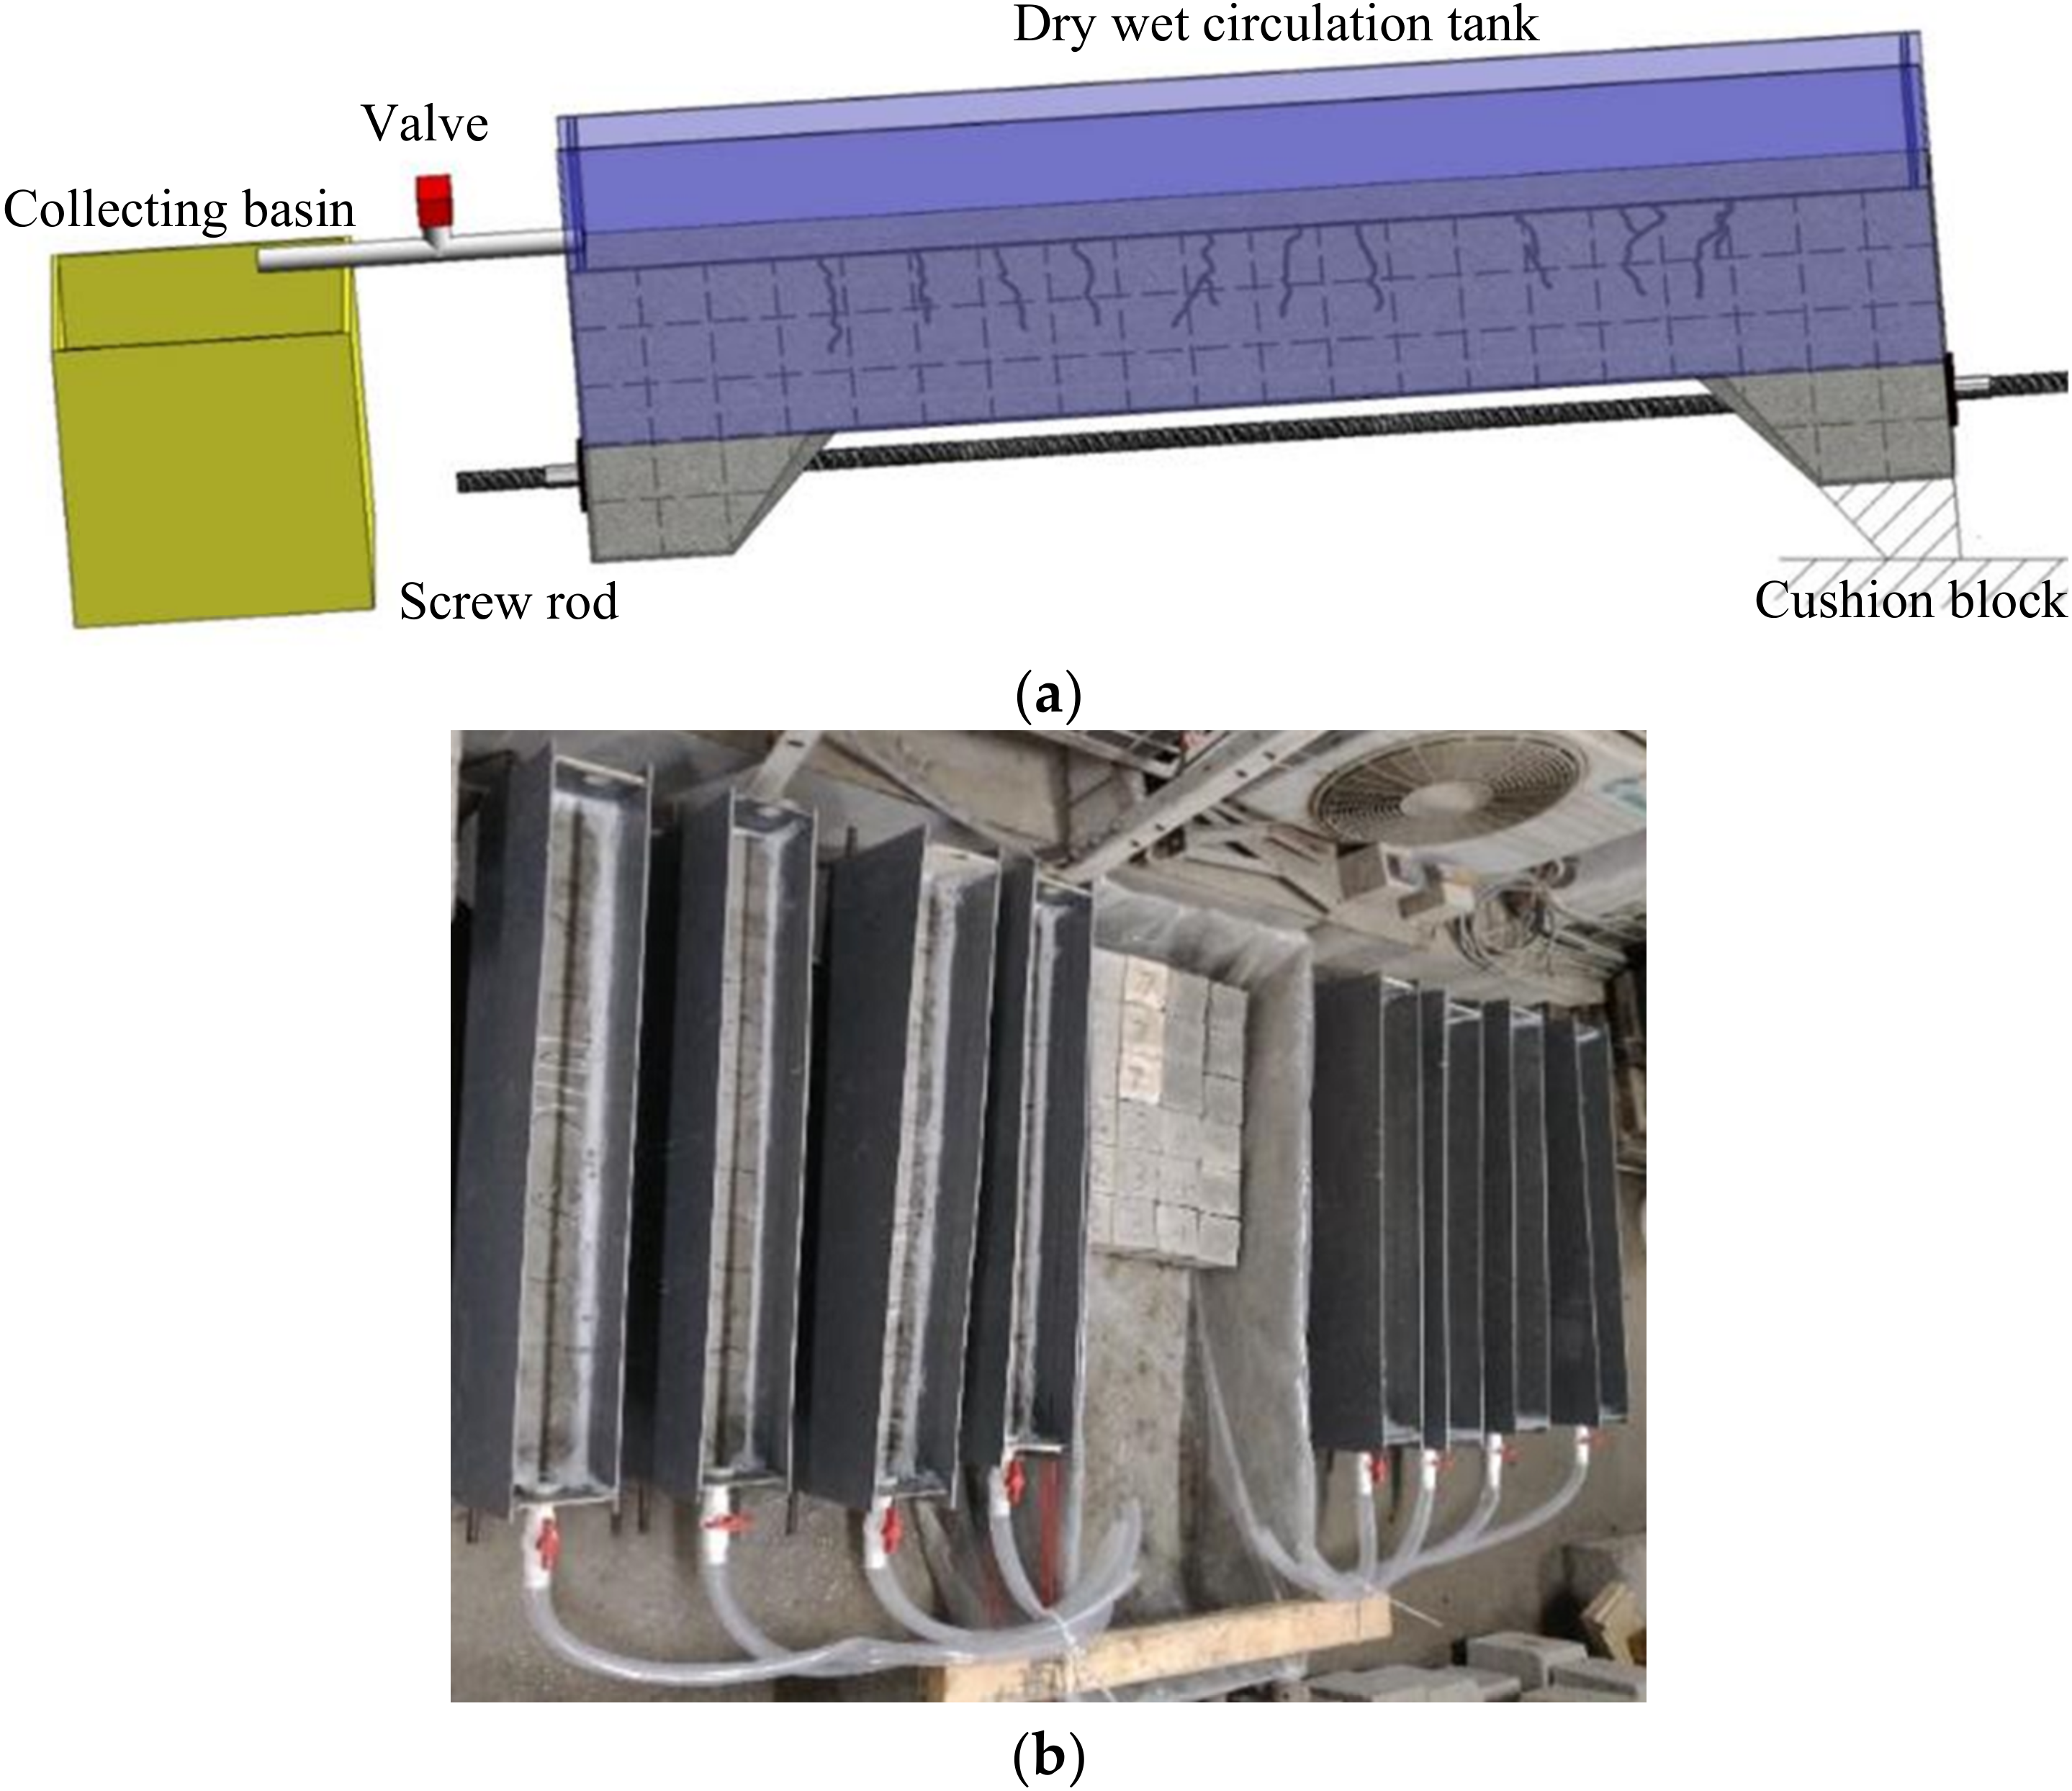
- The corrosion tank, independently installed on the beam, was arranged along the general length of the member and used a PVC plate with high corrosion resistance as raw material. An epoxy resin sealant was coated on each of the lateral sides of the beams.
- In order to facilitate the drying-wetting cycles, a valve was installed at the bottom of one side of the corrosion tank, and a cushion block was placed on the other side of the beam. In this way, the collecting basin could be filled with chloride solution when the valve was opened.

2.5. Chloride Ion Content Detection
3. Results
3.1. Self-Healing of Transverse Cracks
3.1.1. Morphology of Transverse Cracks
- After 300 days of drying-wetting cycles, although the crack width slightly decreased, the loaded test beam maintained a cracking state. After unloading, the width of the crack decreased sharply, indicating that the self-anchoring method of the specimen had provided an effective continuous load to maintain the crack width.
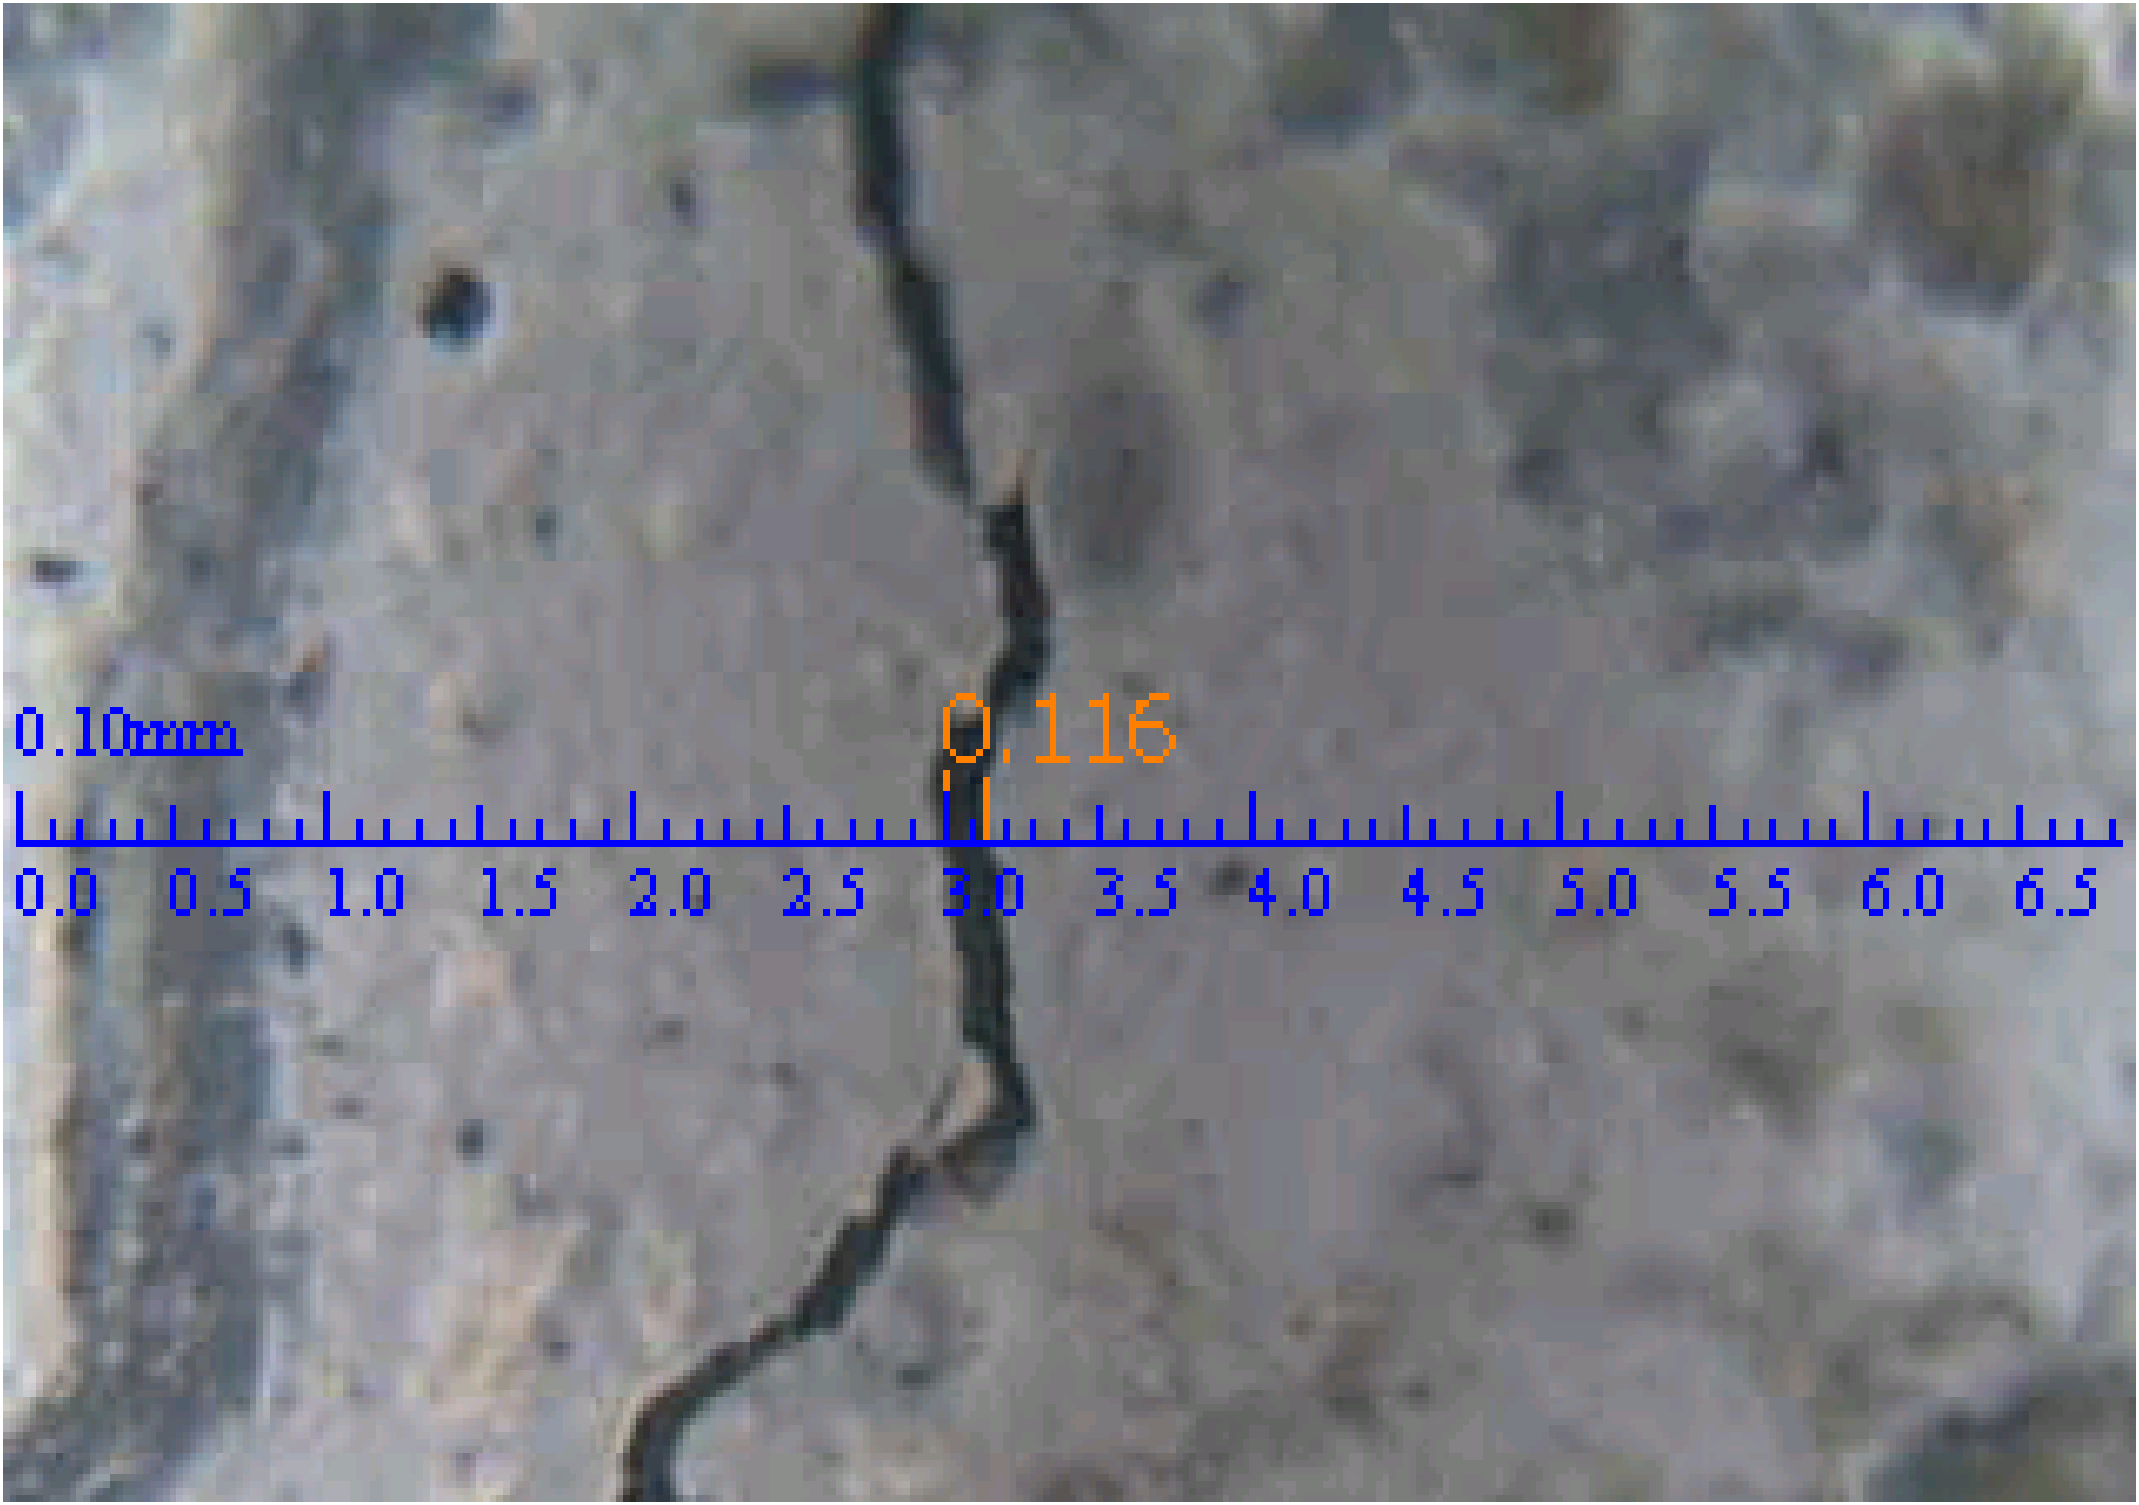
- When w (crack width) ≤ 0.075 mm, 7.6% of the cracks were completely healed; this was probably because the self-healing substances, such as the CaCO3 produced by the hydration of unreacted cement particles, were filling in and healing the cracks. In addition, nano-silica particles could fall off the aggregate surface, filling the internal pores of the concrete and generating a C-S-H gel due to a pozzolanic reaction, which further filled in the cracks and promoted the self-healing effect [26,27]. An example of the crack healing is shown in Figure 8a.
- When 0.075 mm < w < 0.158 mm, the width of the crack was reduced to varying degrees after the drying-wetting cycles. On the one hand, this may have been due to the self-repairing effect of the concrete material itself, which reduced the width, as shown in Figure 8b. On the other hand, it may have been caused by the decrease of stress in the threaded rod over time, i.e., the creep effect which further weakened the anchoring load.
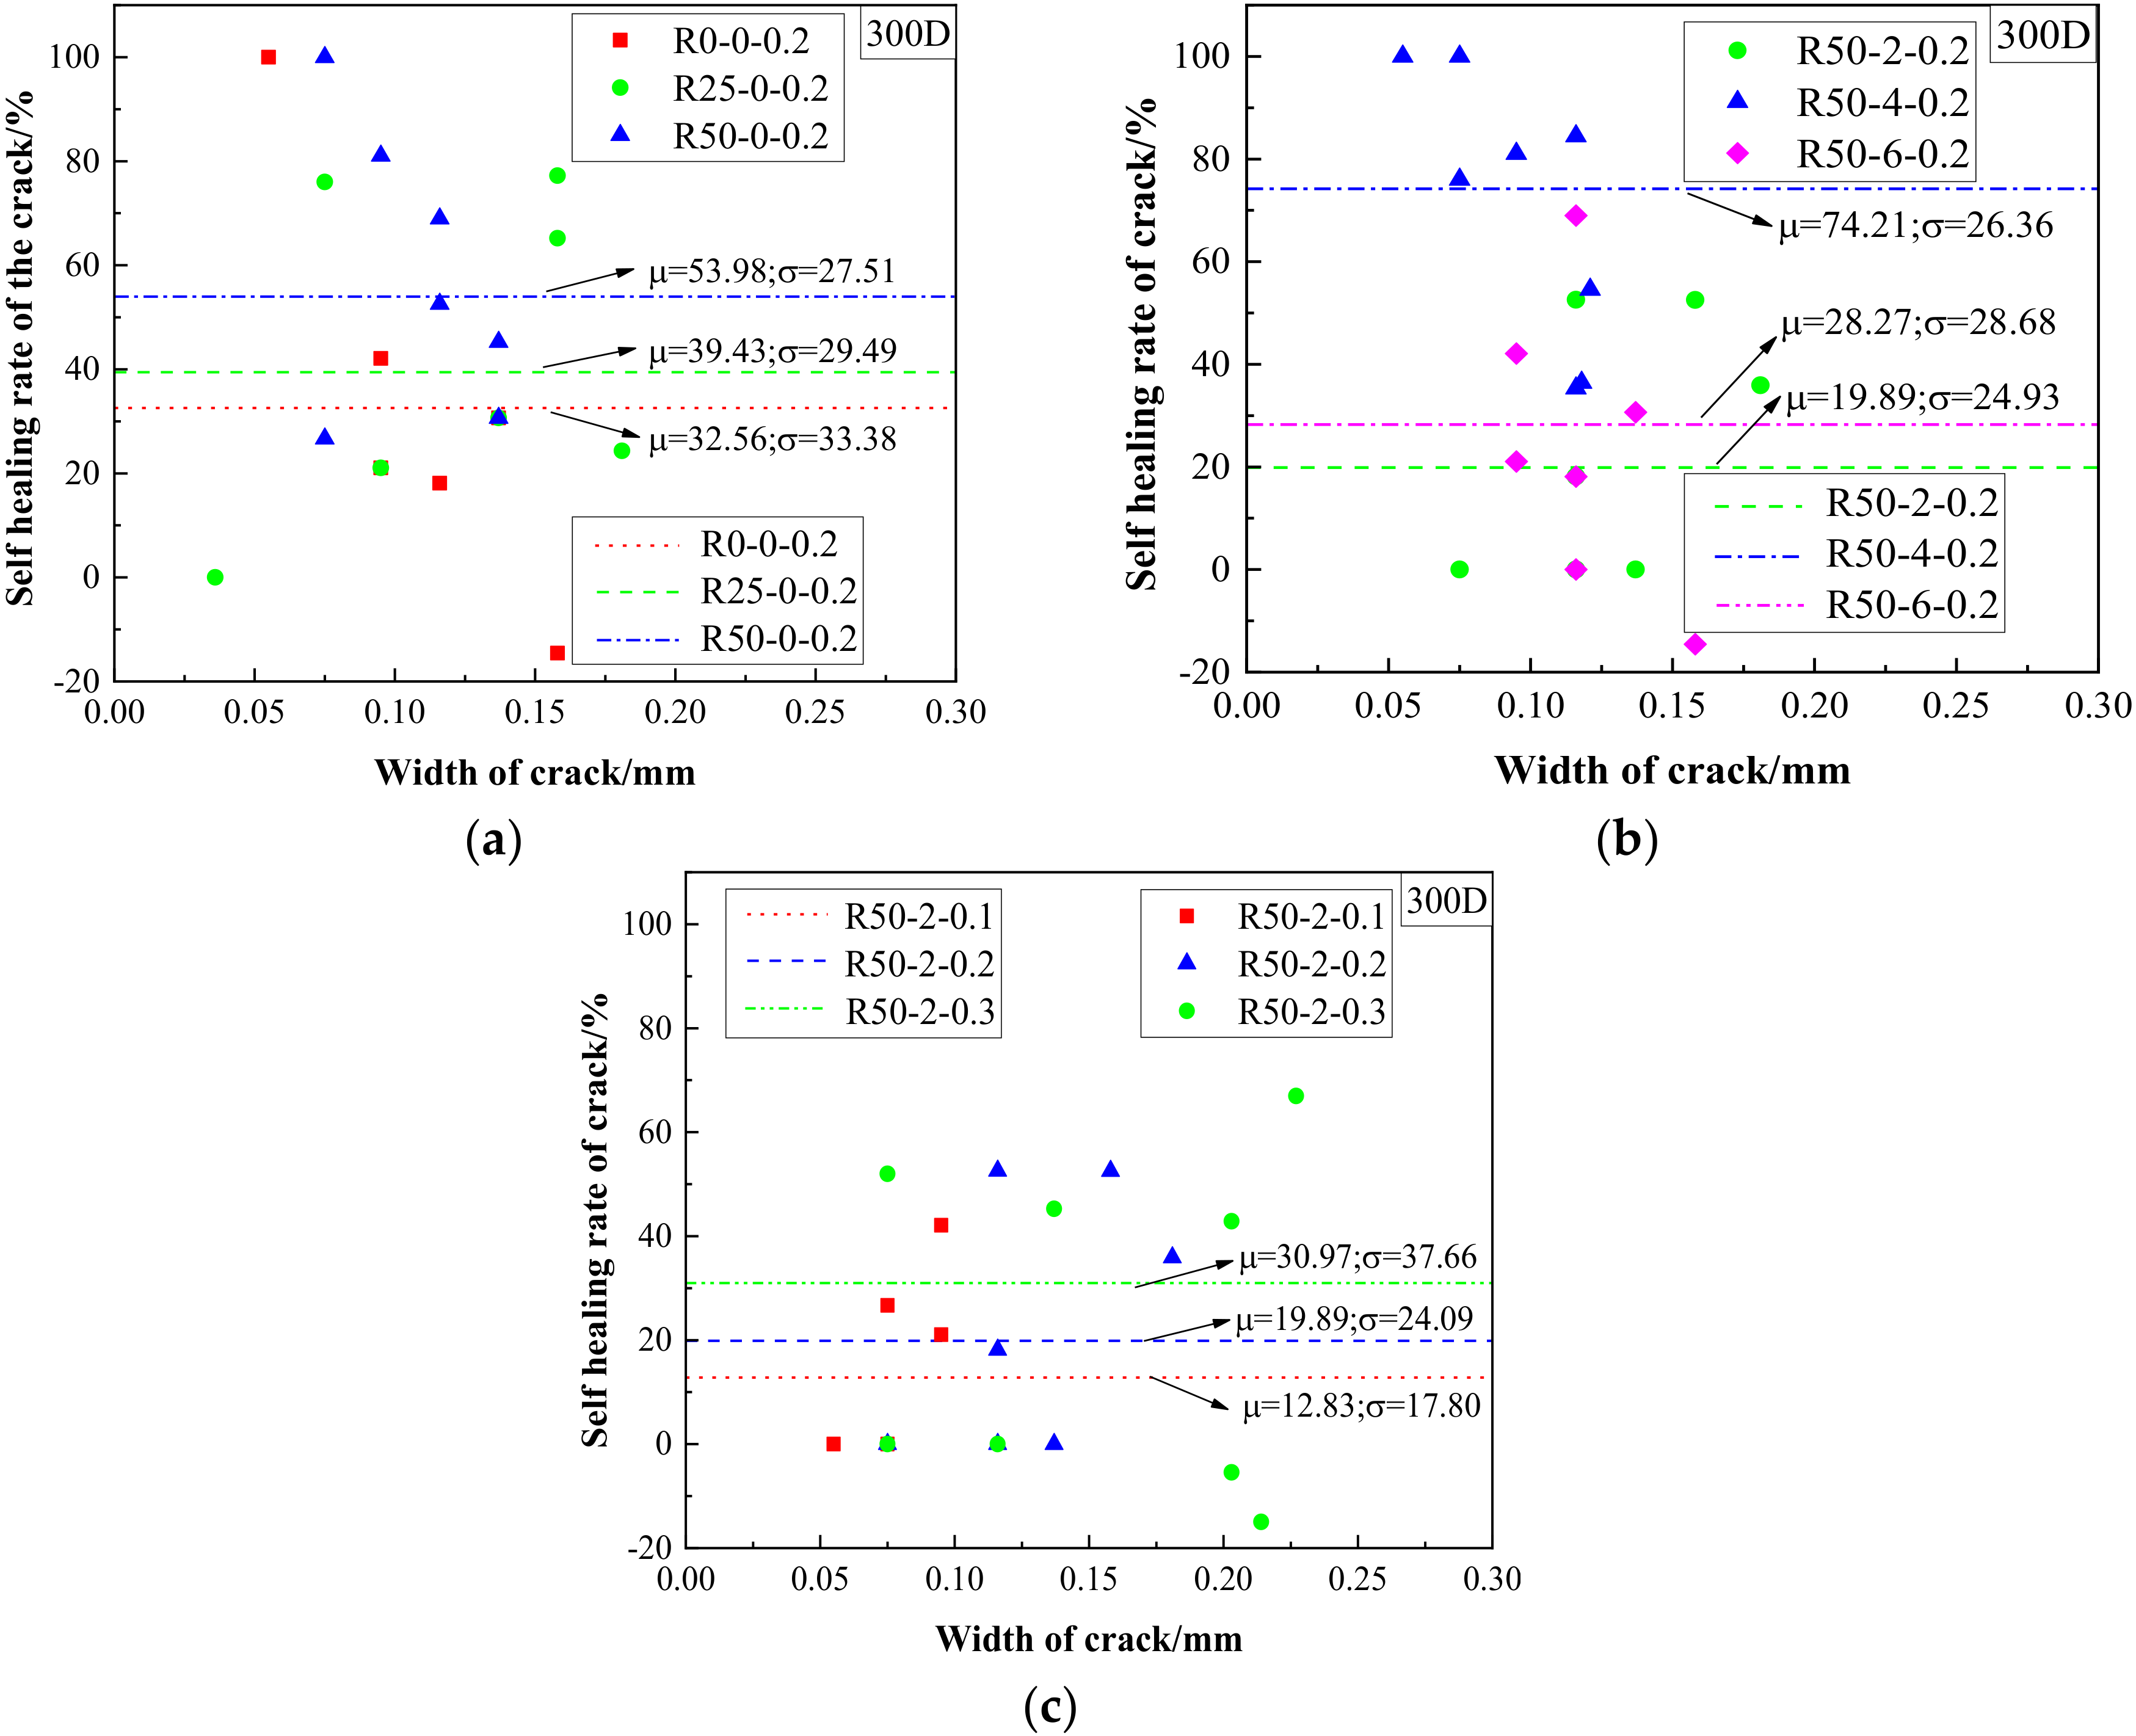
3.1.2. Self-Healing Rate of Transverse Cracks
- As shown in Figure 9a, with an increase in the replacement rate of recycled aggregate, the self-healing rate of cracks gradually improved, and the standard deviation was reduced, indicating that the addition of recycled aggregate is beneficial to the self-healing ability of concrete.
- As shown in Figure 9b, with an increase in the nano-silica content, the self-healing of cracks first increased and then decreased, reaching a maximum when the content of nano-silica was 0.4% [26,27,28]. In addition, the nano-silica soaking method was proven to effectively heal defects in the recycled aggregate and to compensate for the strength loss of the aggregate, mainly because the nano-silica particles react with the calcium hydroxide hydration product to form C-S-H gels on the aggregate surface [15,29]. The formation of C-S-H gel can be effectively promoted by using the proper amount of nano-silica to fill the pores of concrete [30].
- As shown in Figure 9c, as the controlled crack width increased, the self-healing ability improved gradually. This may have been due to the fact that sufficient water was provided to the interior of the concrete through larger cracks, which promoted later hydration reactions in the cement, thereby helping to promote the generation of hydration products and filling the cracks to improve the self-healing rate.
3.2. Distribution of Chloride Ions
3.2.1. Distribution of Chloride Ions in Cracks
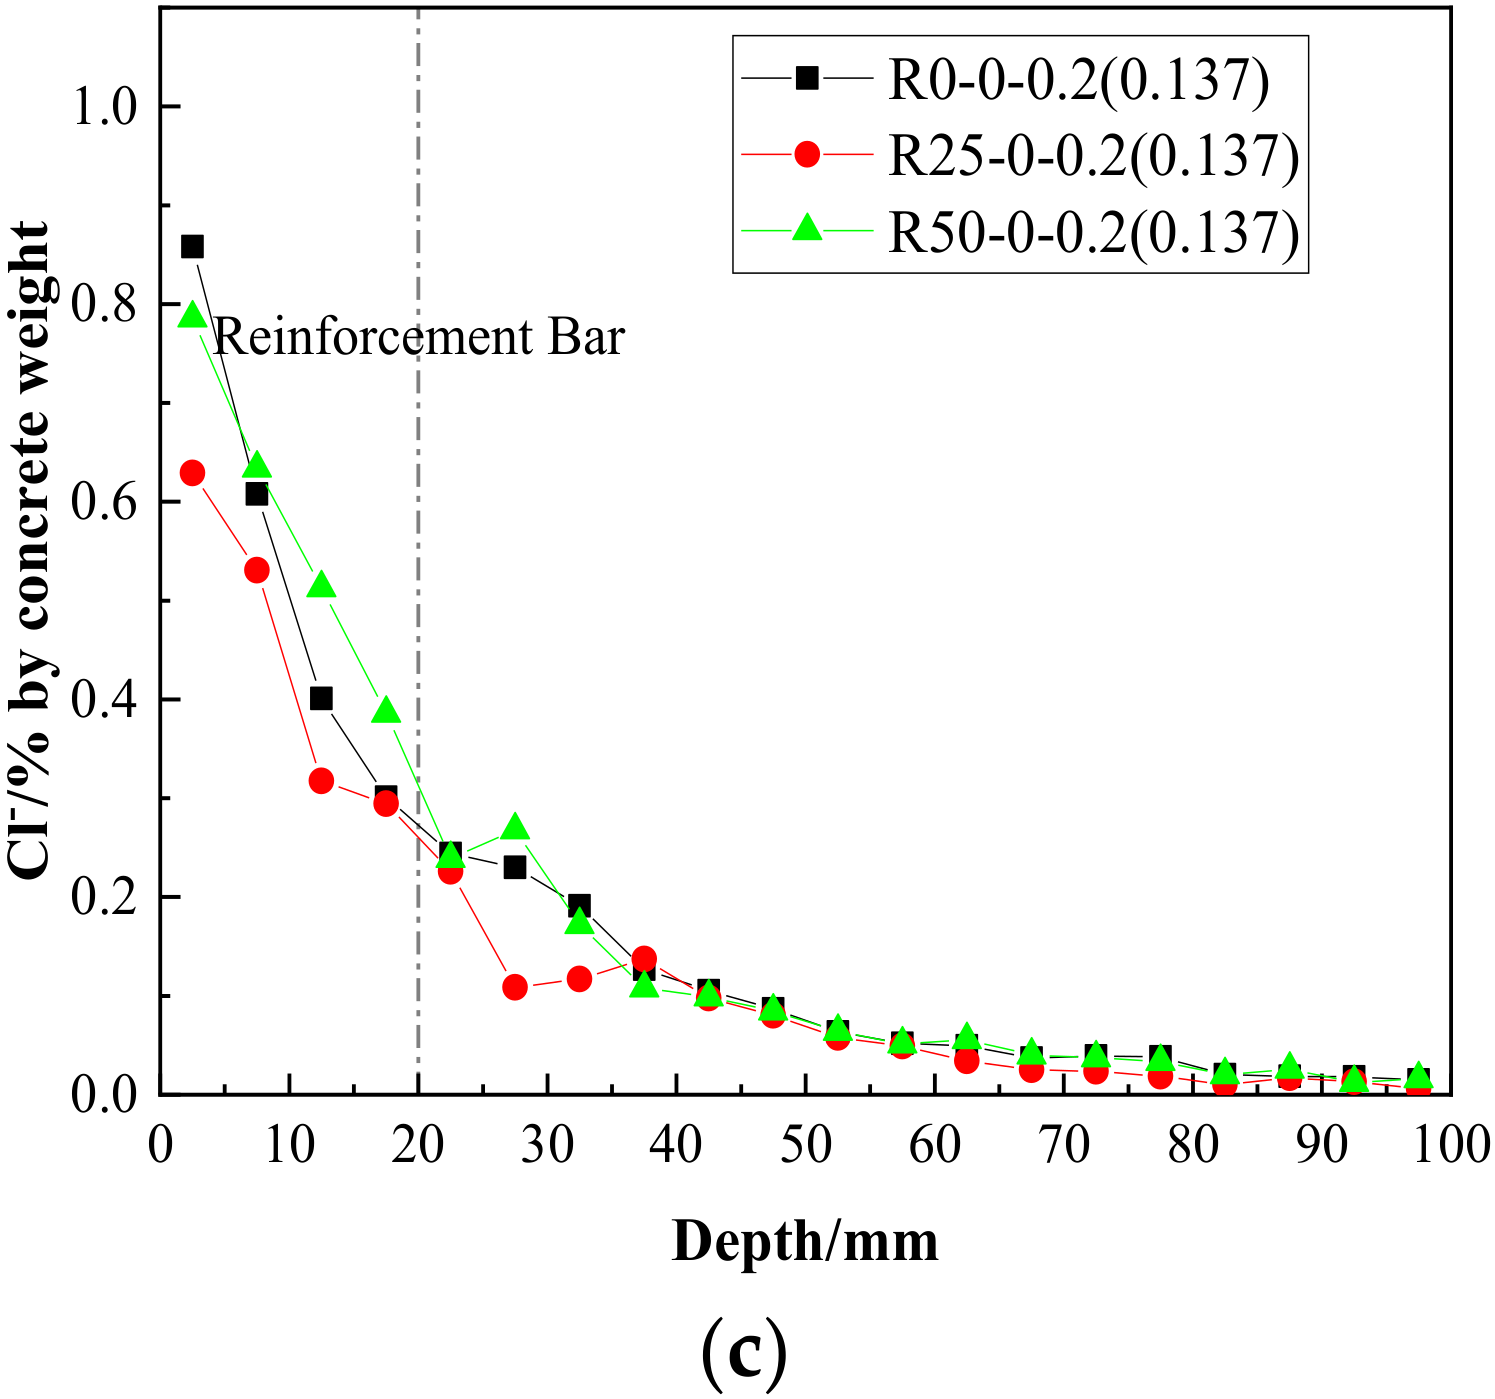
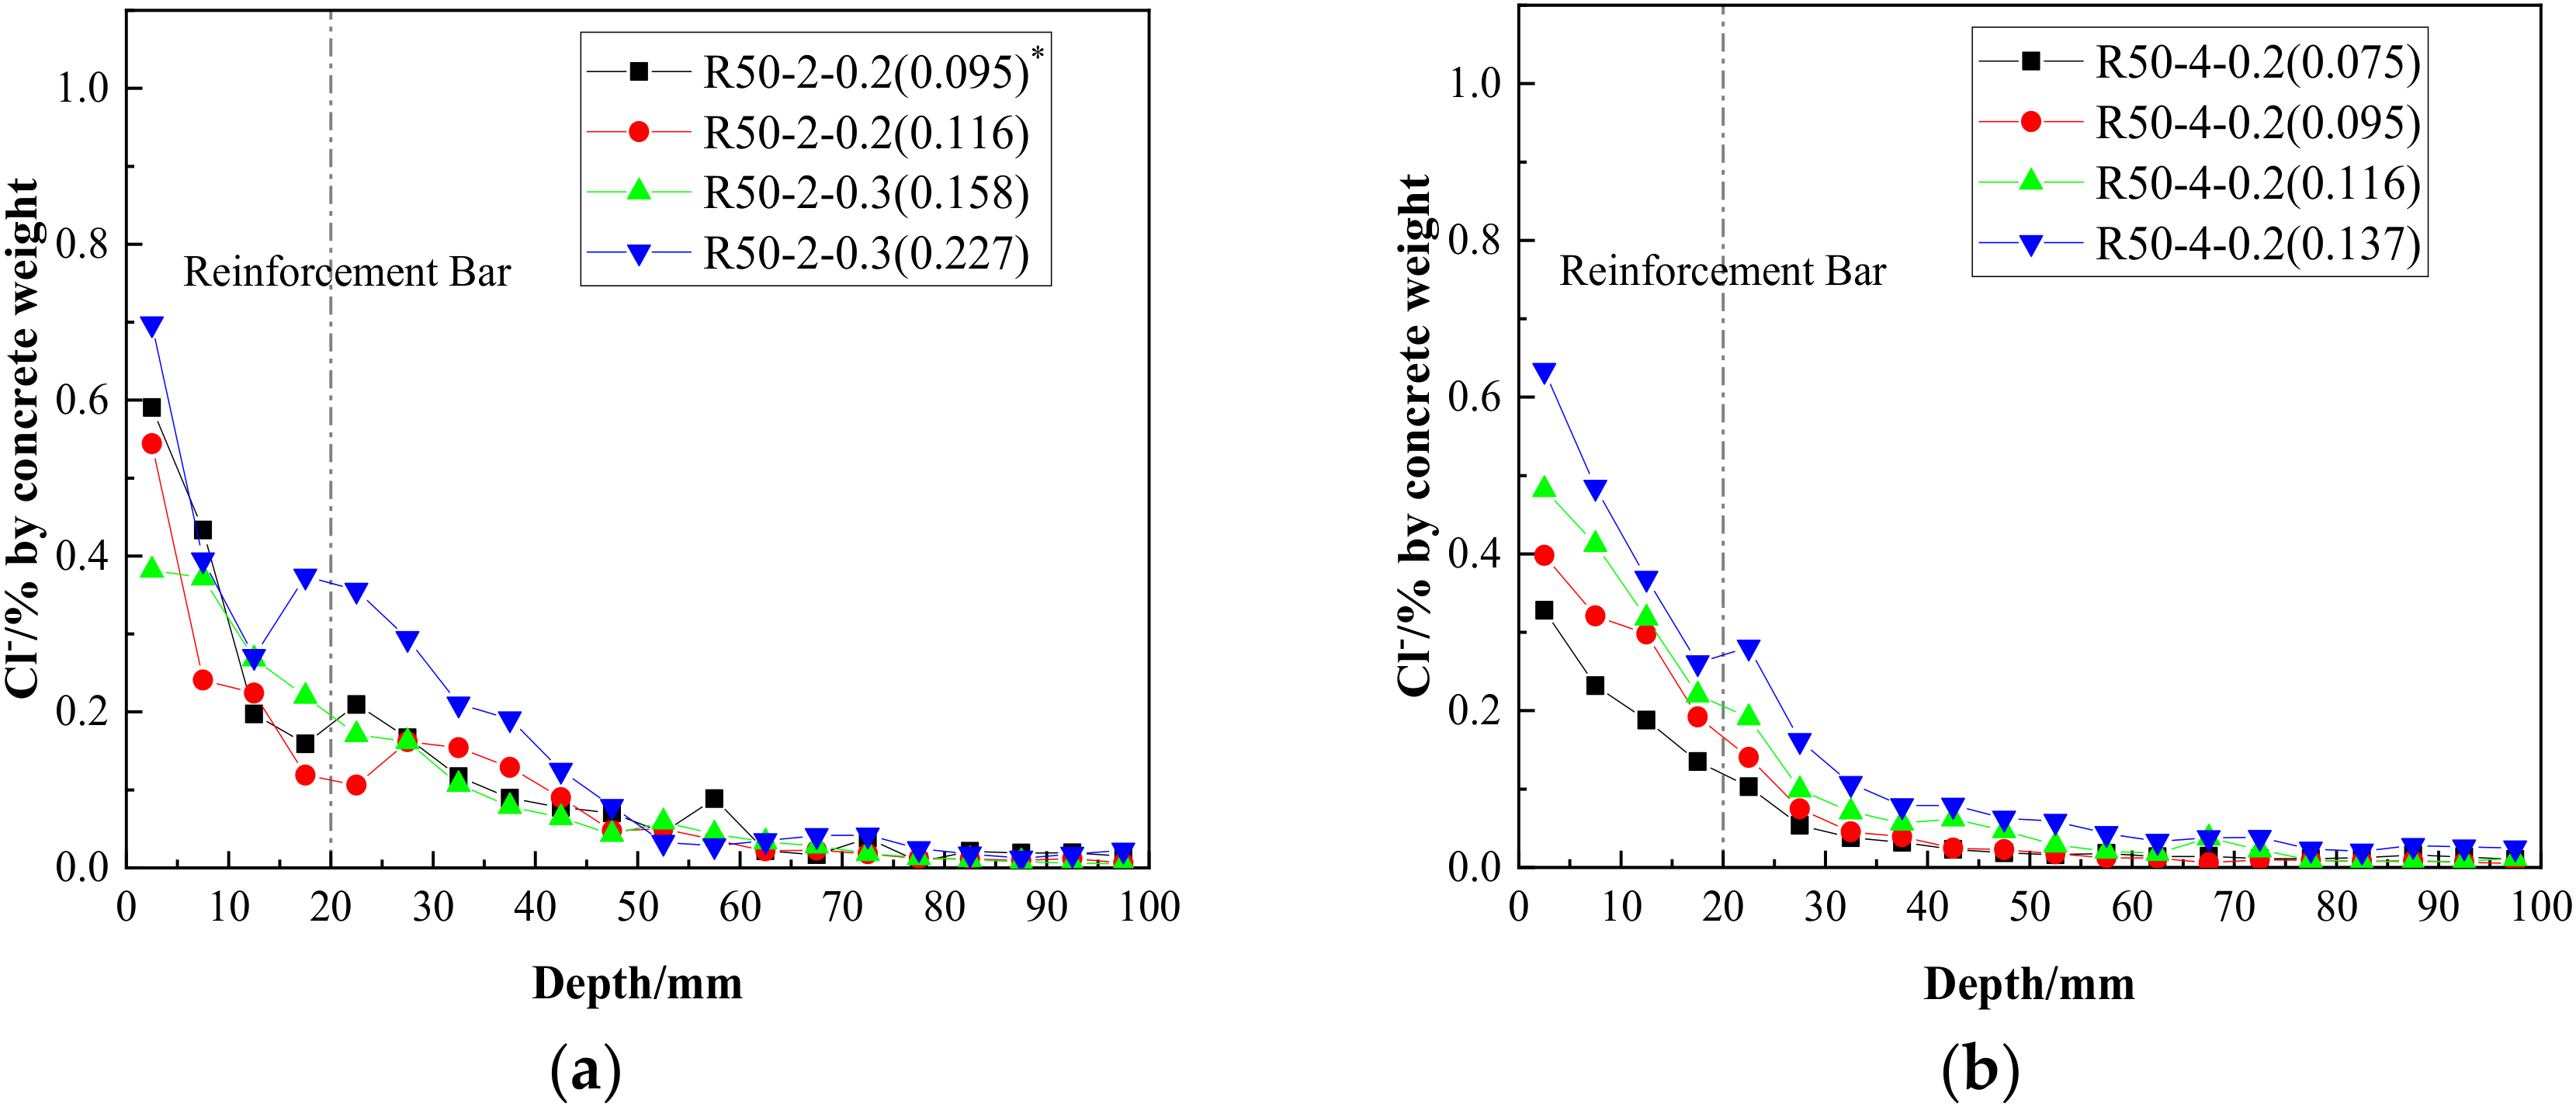
- The chloride ion content showed a wave-decreasing trend according to depth [31], which may have been due to the fact that larger aggregate particles are encountered at certain depths; the concentrations of chloride ions in coarse aggregate were far lower than in the cement mortar.
- As shown in Figure 10a, at the position of longitudinal reinforcement, the chloride ion concentration of the natural aggregate concrete in a crack of 0.075 mm was 0.14%. A lot of research [32,33] has shown that the critical concentration for reinforcement depassivation is 0.1–0.6% in cementitious materials. Since cementitious material made up 15.07% of the concrete mass, the critical concentration was about 0.015–0.09%, which indicated that the reinforcement had been activated.
- For beams with recycled aggregate replacement ratios of 25% and 50%, the concentrations of free chloride ions at the longitudinal reinforcements were 1.5 and 1.2 times those in beams with natural aggregates (crack width: 0.075 mm; see Figure 10a), which infers that the existence of recycled aggregate increases the concentration of free chloride ions at cracks. However, as shown in Figure 10c, with the increase of crack width, the chloride ion concentration in the concrete with a 25% replacement ratio was gradually exceeded by that of concrete with a 50% ratio; this was probably because that the crack had a greater impact on the chloride ion corrosion resistance in the RAC with a higher replacement rate.
- From a comparison of Figure 10a–c, it can be seen that the distribution trend of chloride ions at the three groups with different crack widths was almost the same. However, with an increase in crack widths, the total free chloride ion concentrations increased.

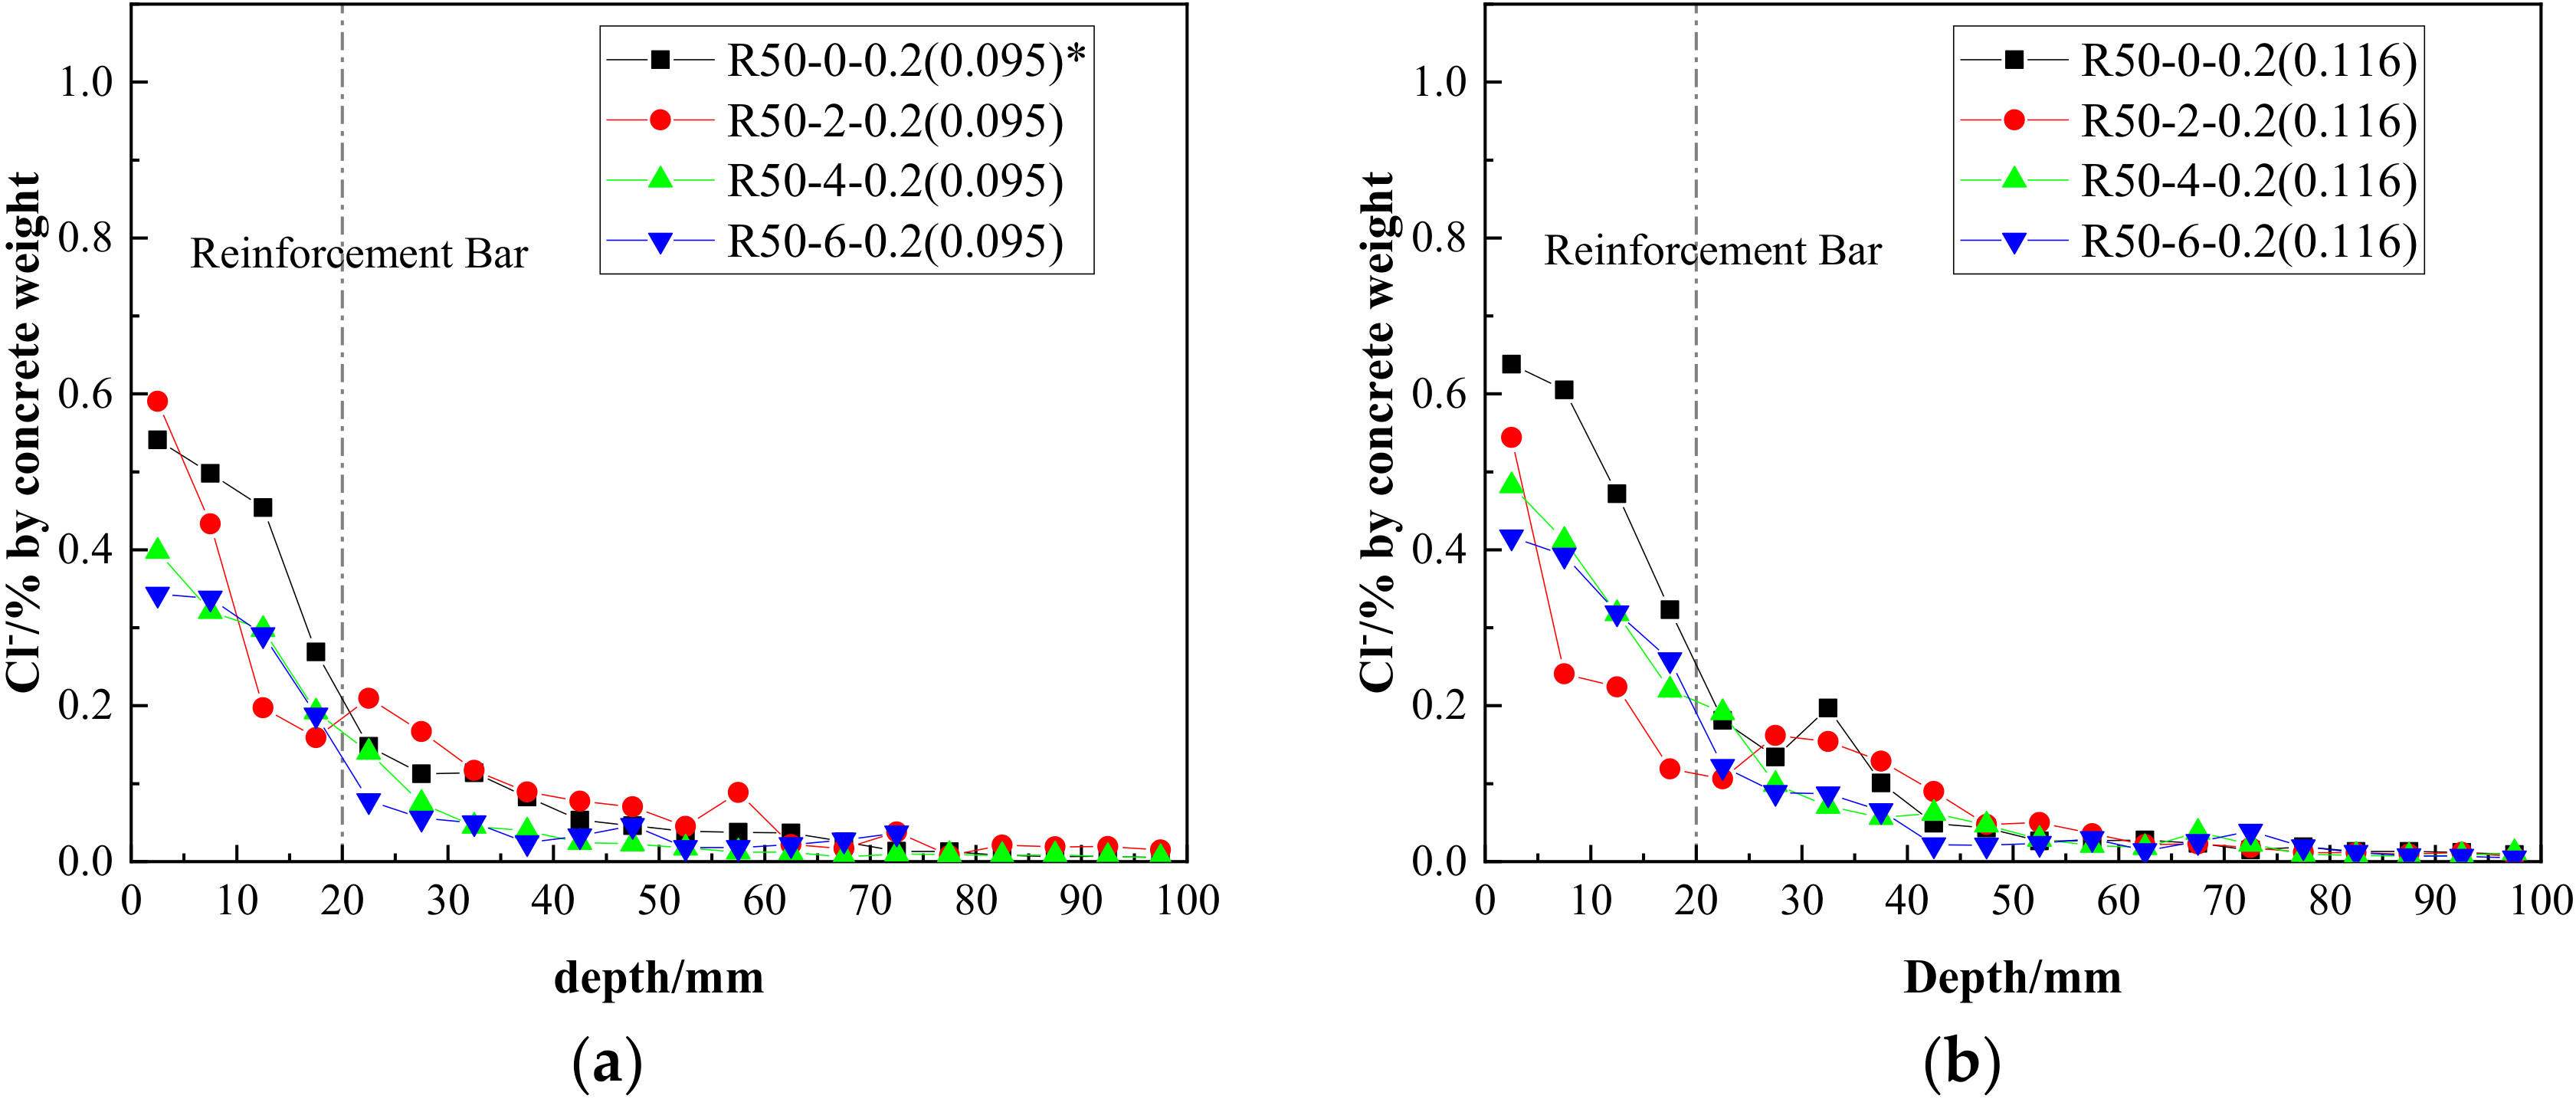
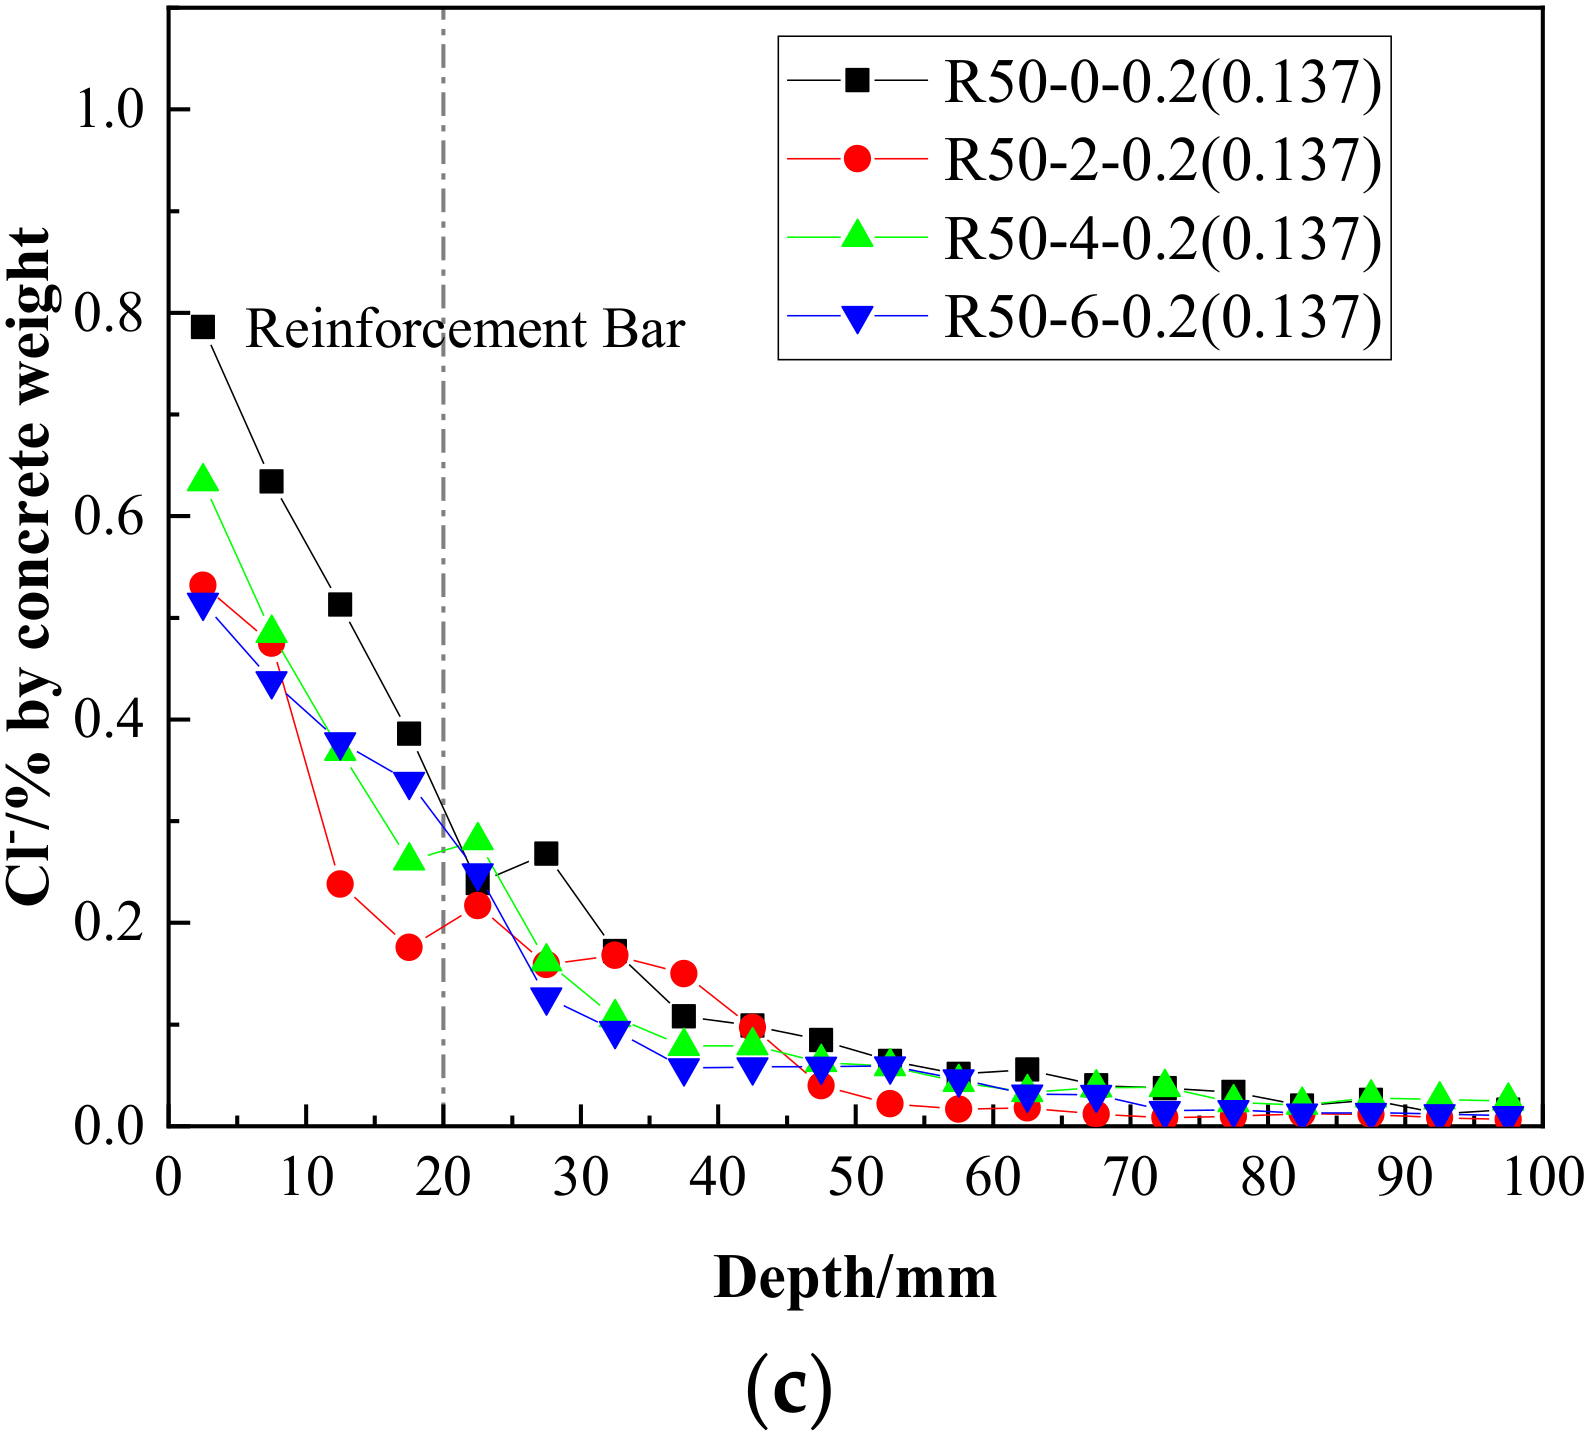
- Notwithstanding a small amount of fluctuating data, by adding nano-silica, the chloride ion concentrations at the reinforcement bar position decreased at different crack widths, confirming the effectiveness of nano-silica at resisting chloride diffusion.
- The trend of wave-decreasing along the depth was not changed by the addition of nano-silica at the crack of the RAC beams.
- From a comprehensive comparison of Figure 11a–c, it may be seen that the concentration of free chloride ions at cracks could be effectively reduced by nano-silica modification. When the crack width was 0.095 mm and the concentration of nano-silica reached 0.6%, the reduction effect was the most obvious.
- Comparing Figure 11a–c, it can be seen that the optimal content of nano-silica changed with different crack widths; however, this needs to be further studied considering the width, type and curvature of the cracks.

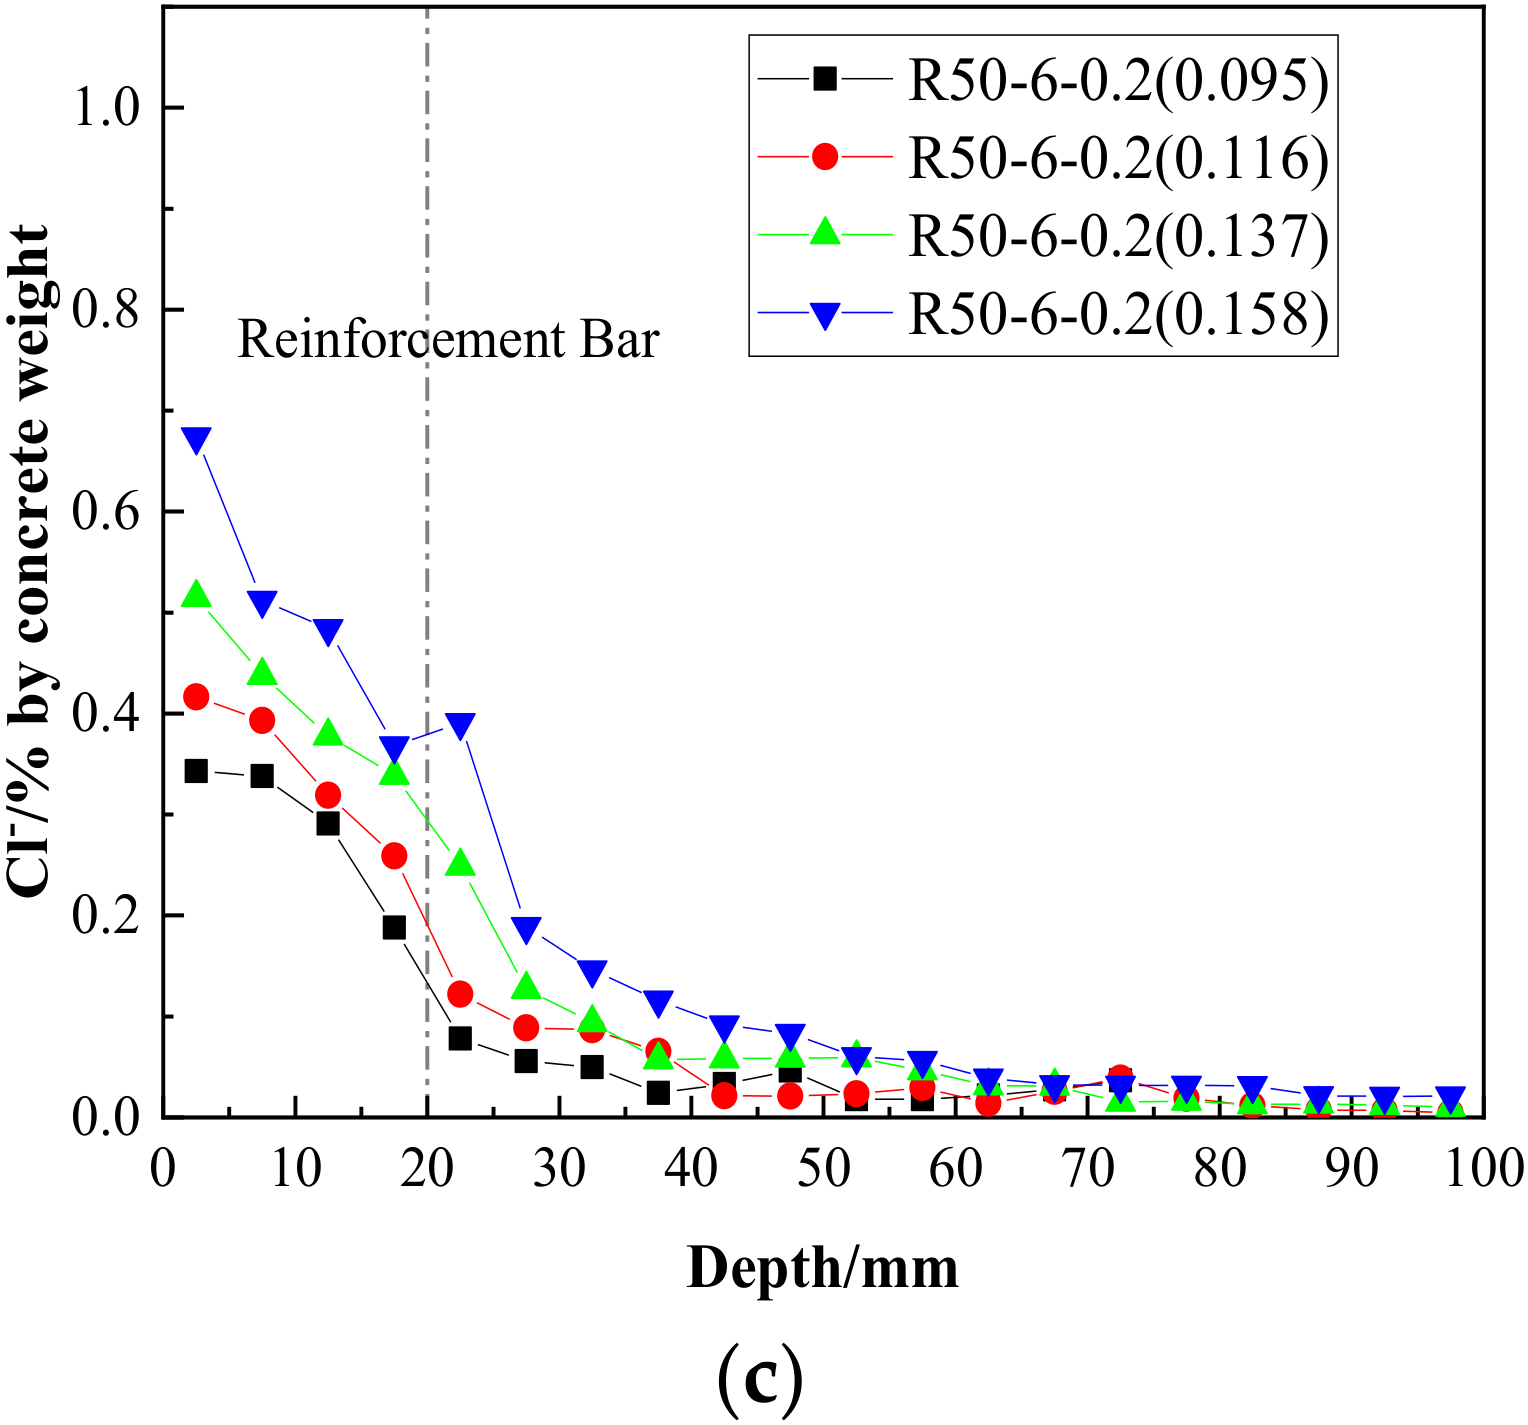
- With an increase of crack width, the concentrations of free chloride ions in the nano-reinforced RAC beam increased gradually; this phenomenon was more clearly observed with increased content of nano-silica.
- There was no obvious regularity regarding the concentration of chloride ions in the range of 5 mm with different cracks as the transportation of chloride ions on the concrete surface was affected by convection, diffusion, surface adsorption and capillarity. Since these mechanisms are relatively complex, the equivalent chloride diffusion coefficients within 5 mm were not considered in this study.
- By comparing Figure 12a–c, it can be found that the concentrations of free chloride ions at the reinforcement position increased sharply with an increase of crack width. Among them, in the RC beam with a nano-silica content of 0.2%, when the crack width was 0.227 mm, the concentration of free chloride ions was about double that of a crack width of 0.095 mm.

3.2.2. Distribution of Chloride Ion Concentration near Cracks
- The concentrations of chloride ions at cracks were significantly higher than those near the cracks. This was mainly because the permeability of the concrete had been improved due to the presence of cracks. In addition, near larger cracks (i.e., width more than 0.1 mm), chloride ions presented a trend of two-dimensional diffusion [34] i.e., diffusion along the depth of concrete and lateral diffusion near the crack.
- The concentrations of chloride ions showed a wavy declining trend along the depth direction. With an increase of crack width, the fluctuation of chloride ion concentrations also increased, which was similar to the micro simulated results [35] of chloride ion diffusion in RAC based on a random distribution of aggregate.

3.2.3. Distribution of Relative Chloride Ion Concentrations on Longitudinal Reinforcements
- The relative concentrations of chloride ions at cracks were greater than 1.0 under the action of drying-wetting cycle, which showed that the diffusion rate of chloride ions could be effectively accelerated by the test method described in this paper. Additionally, the relative concentrations of chloride ions increased steadily with the increase of crack width.
- The relationship between the concentration of relative chloride ions and the replacement rate of recycled aggregate was limited by the crack width (w): when w ≤ 0.1 mm, it increased first and then decreased with an increase in the replacement rate of recycled aggregate; the maximum value was reached when the replacement rate reached 25%. When 0.1 mm < w ≤ 0.135 mm, with the increase of replacement rate, it first increased, then decreased, and finally, increased again, with the optimal replacement rate being about 35%. When w > 0.135 mm, the effect of aggregate replacement rate was almost negligible.
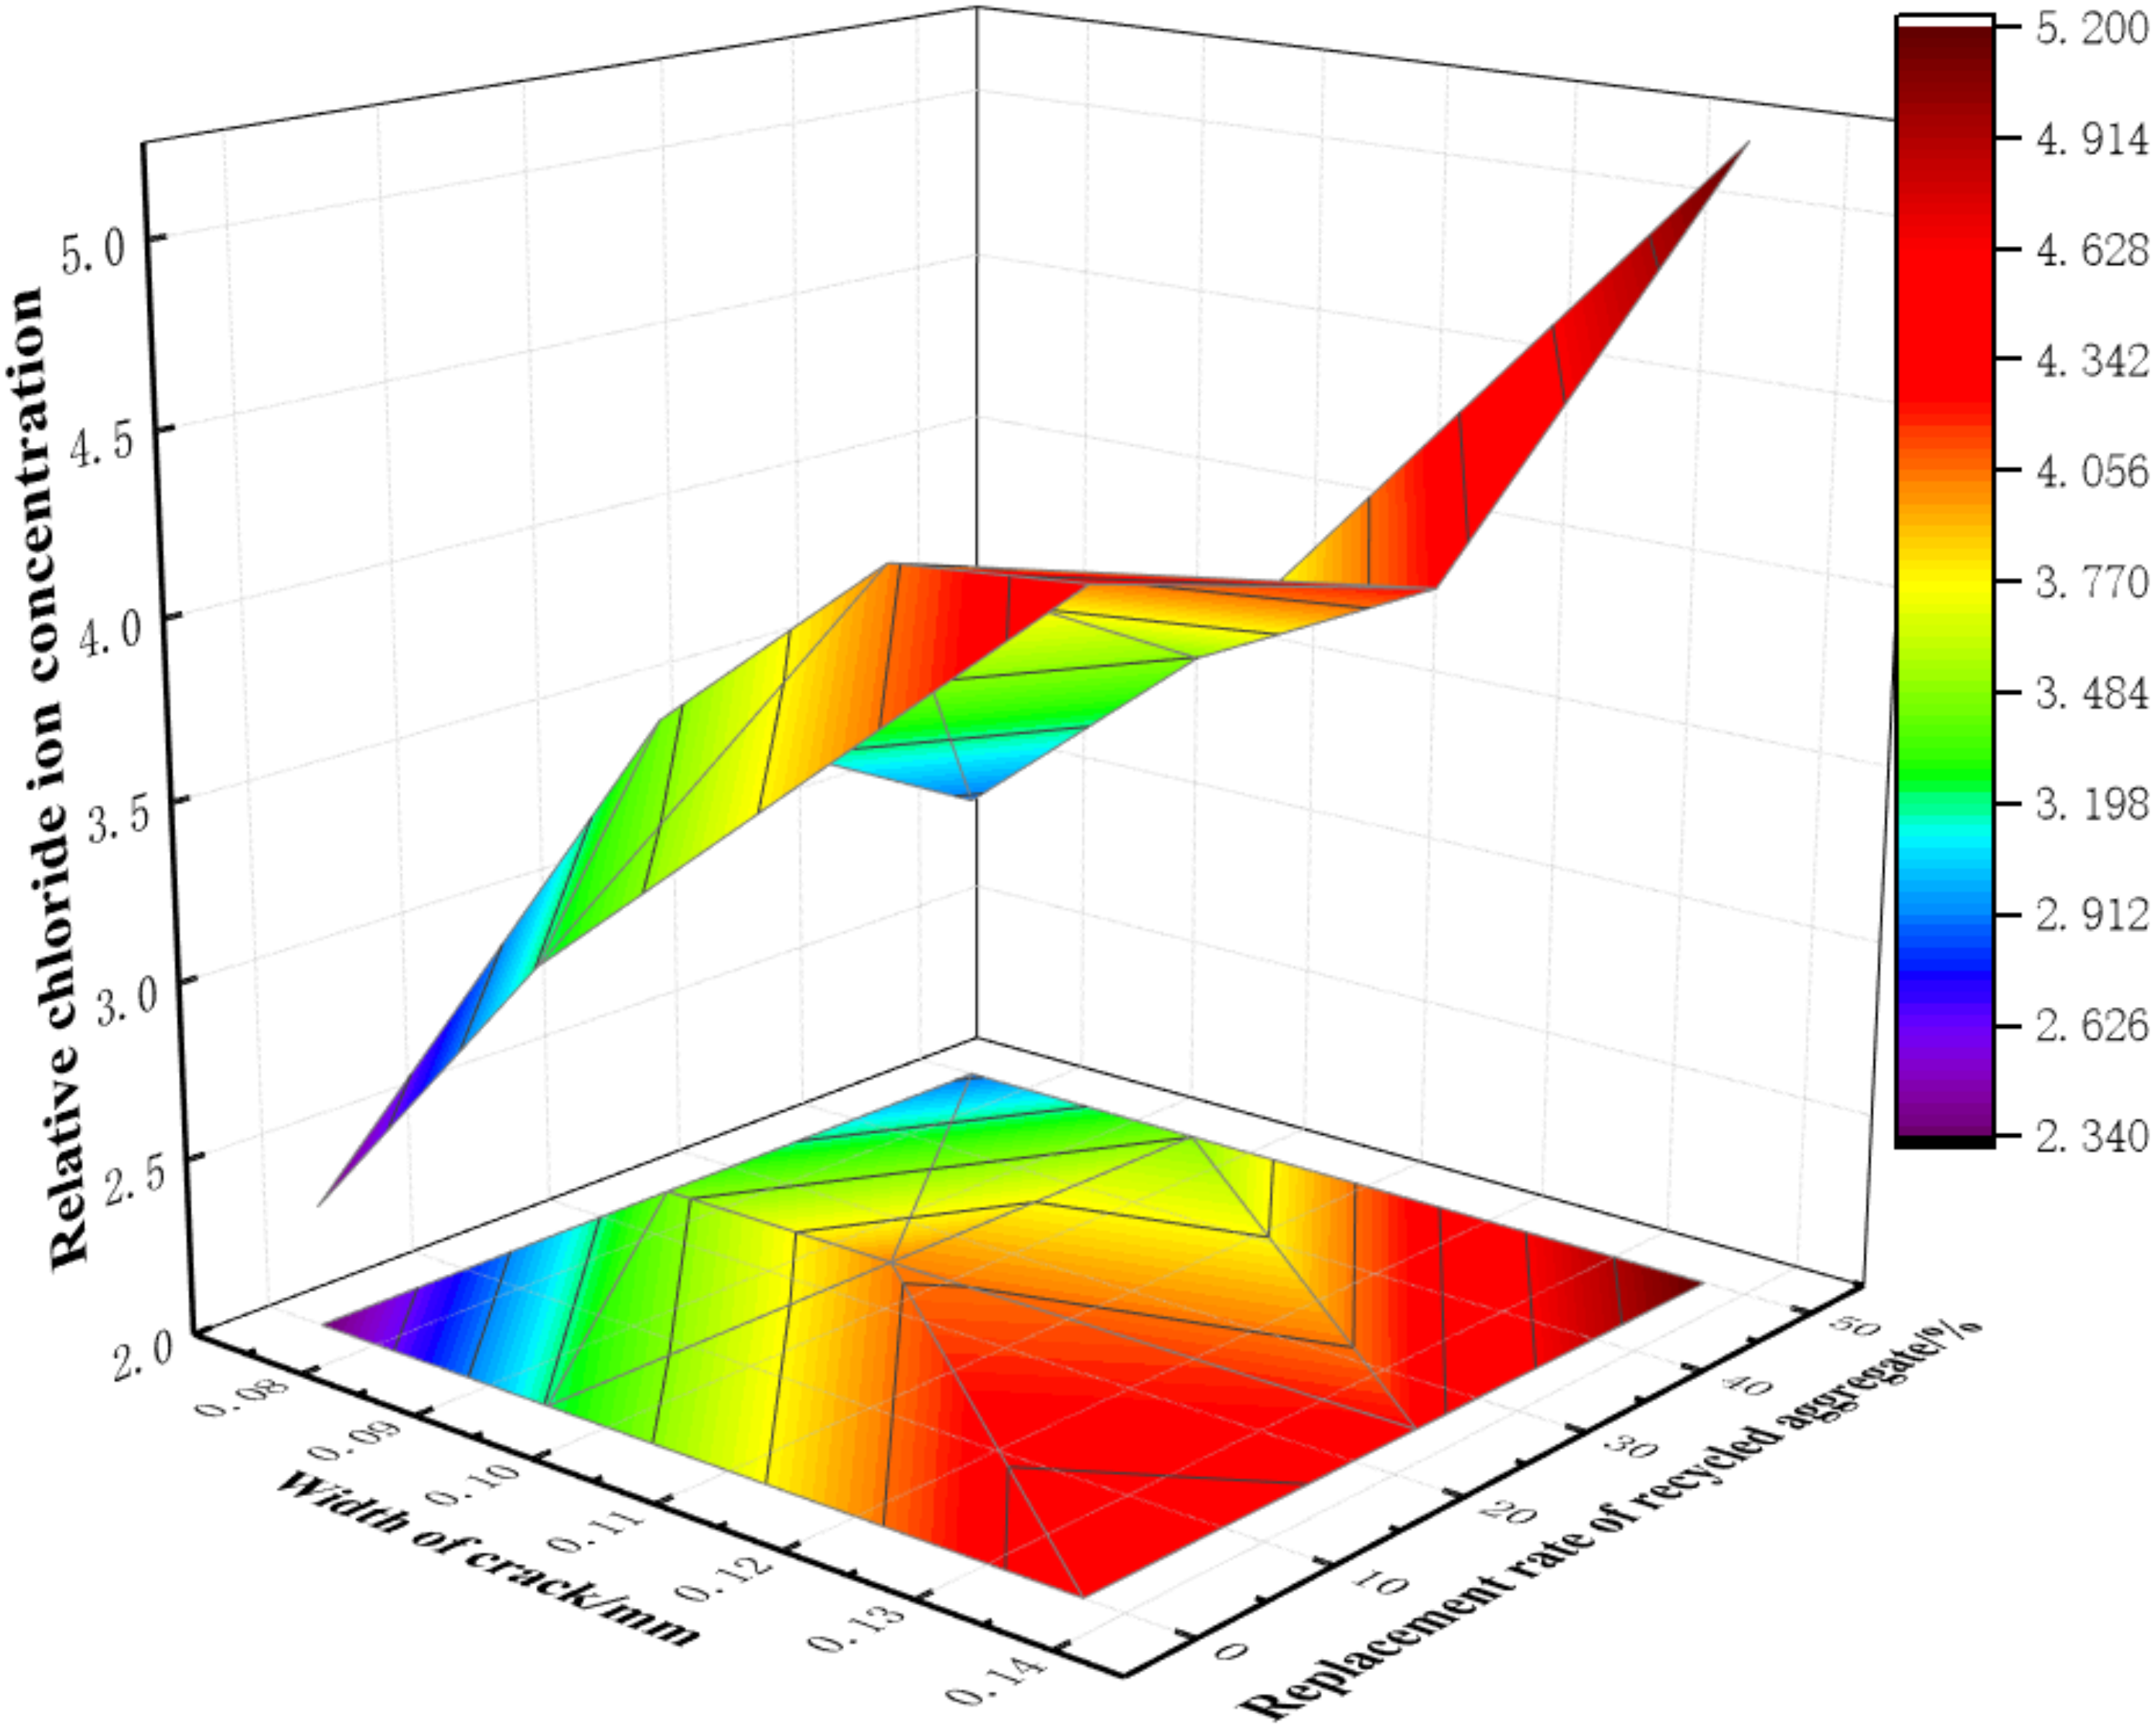
- The width (w) of the cracks was a key factor affecting the concentrations of chloride ions.
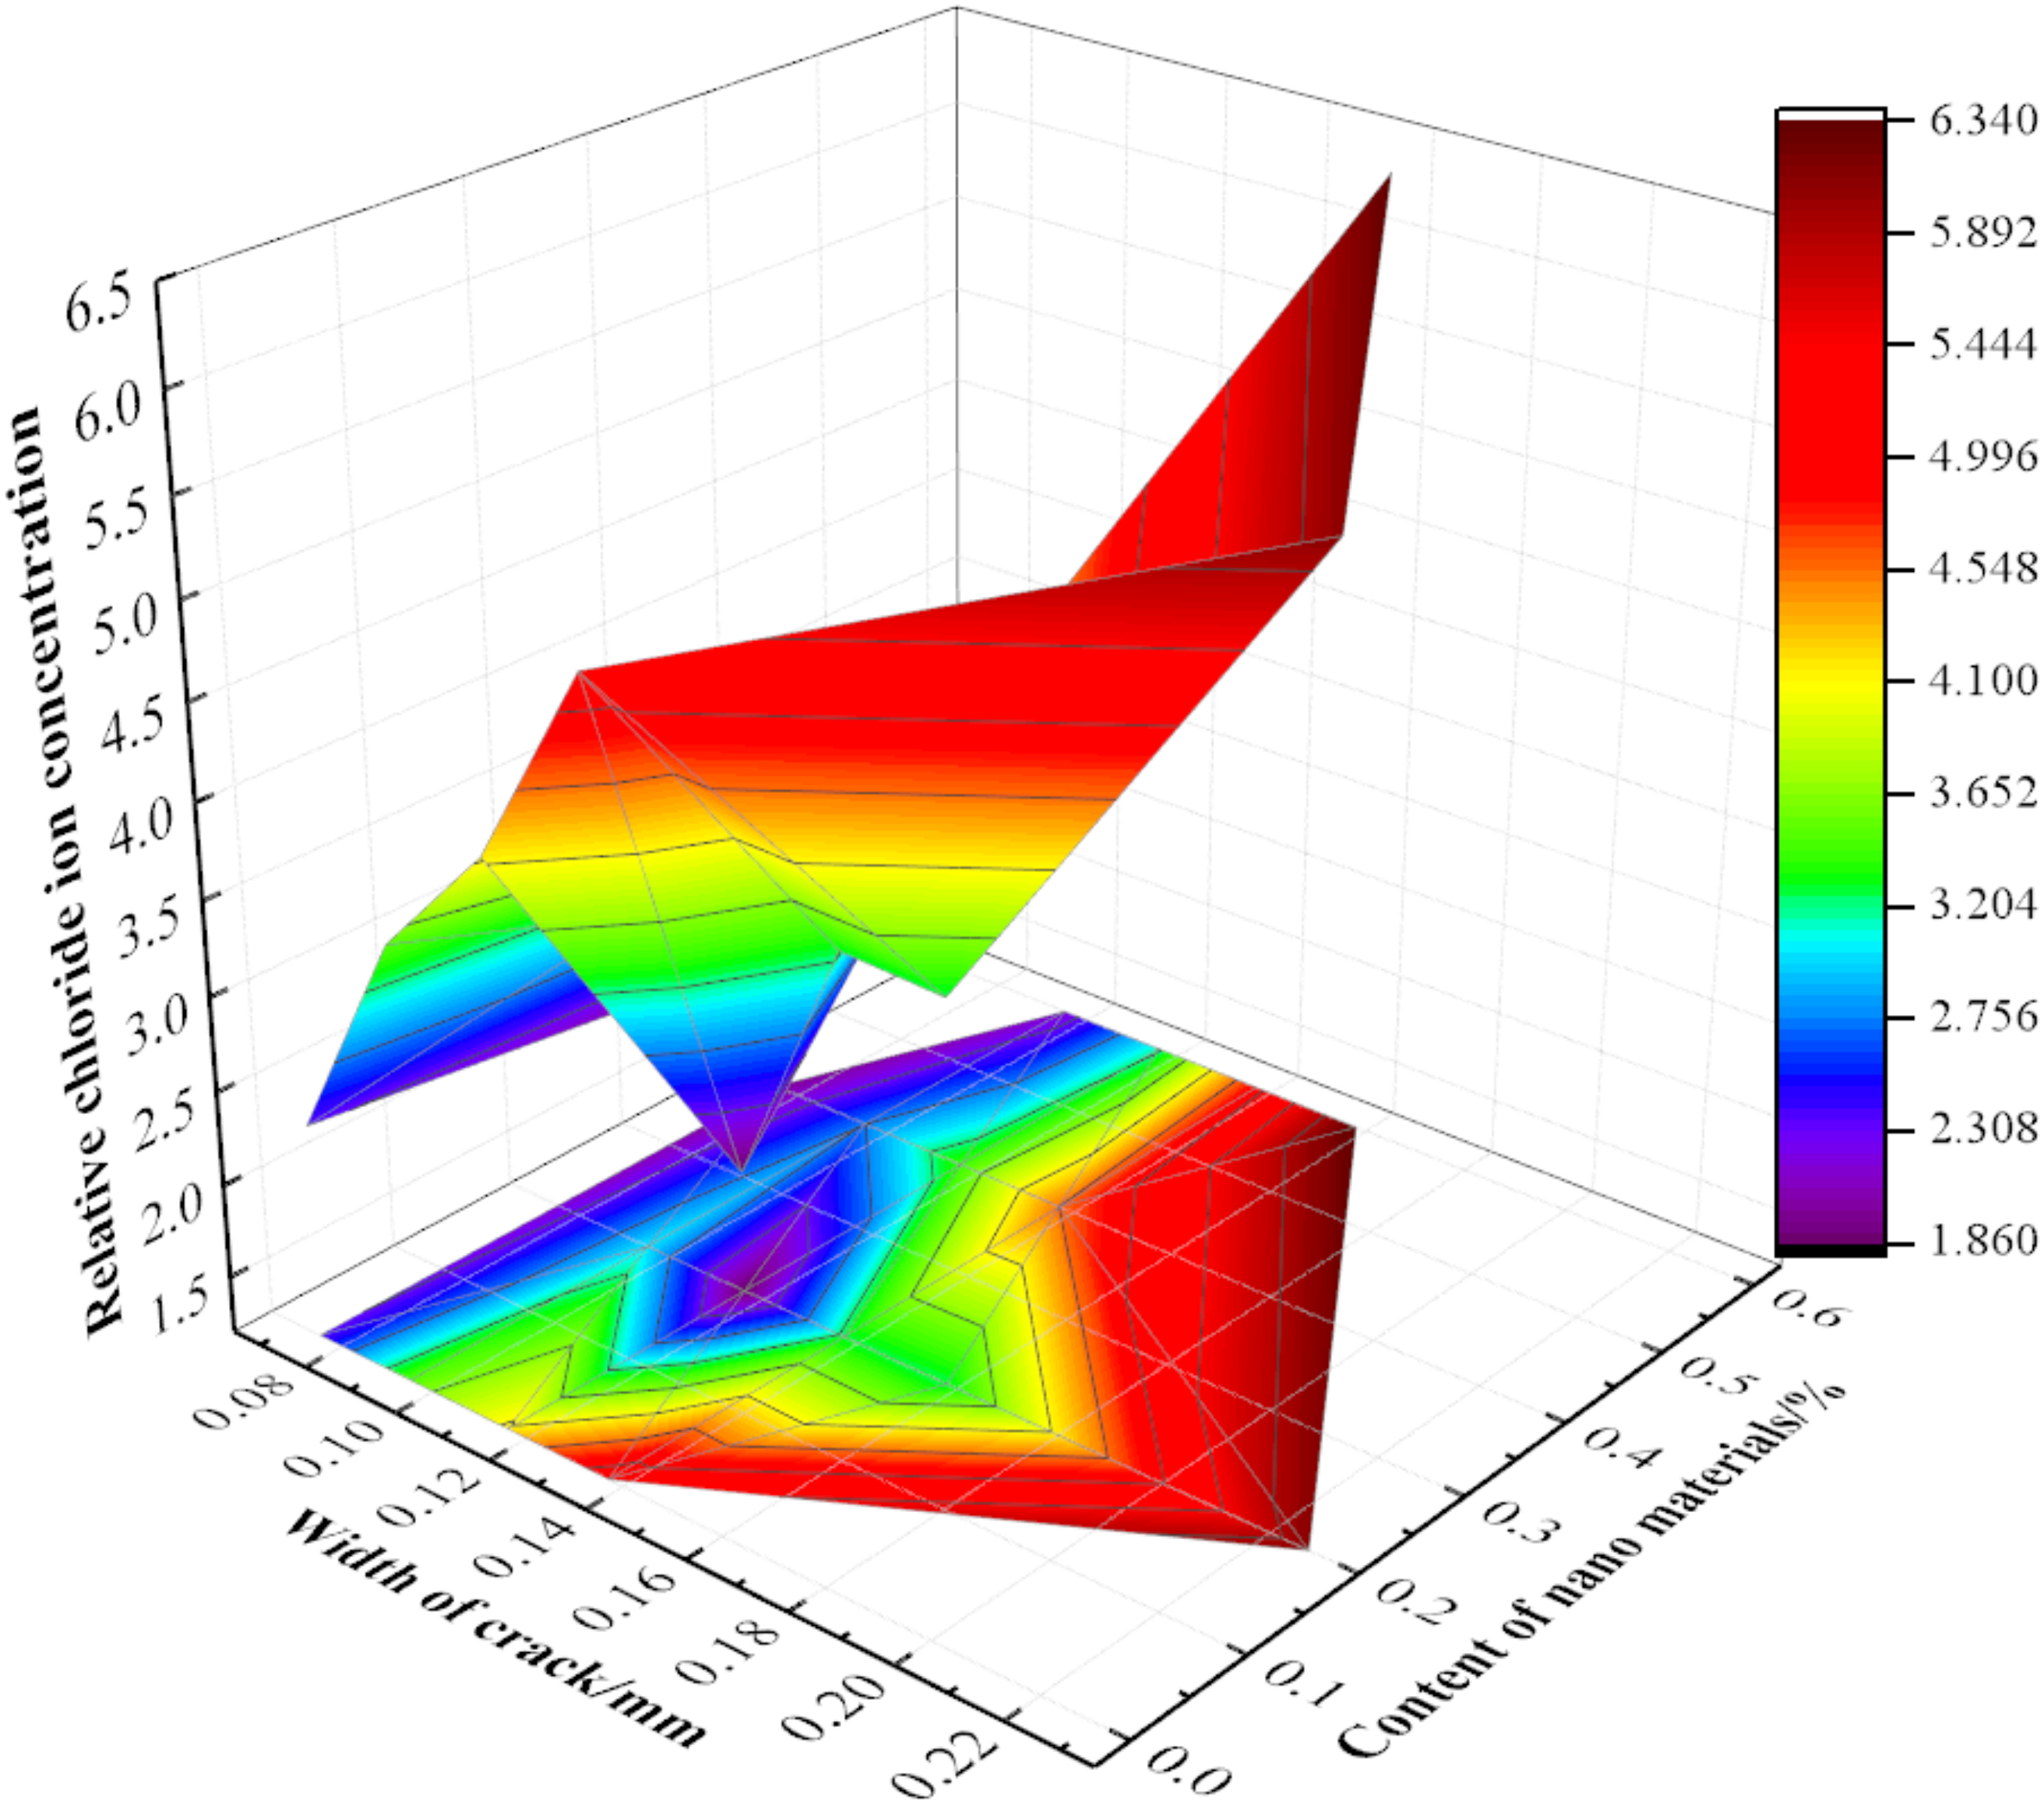
- Although the concentration of relative chloride ions could be reduced by nano modifications, it is still restricted by crack width: when w ≥ 0.185 mm, the concentration of relative chloride ions was almost unaffected by the nano-silica content. When 0.14 mm ≤ w < 0.185 mm, the concentration of relative chloride ions first decreased and then increased with an increase of nano-silica content. When the content of nano-silica was 0.2%, the concentration of chloride ions at cracks in the modified recycled concrete reached the lowest value. When 0.1 mm ≤ w < 0.14 mm, the relative chloride concentrations first decreased, then increased, and finally, decreased again according to the nano-silica content. The optimal content of nano-silica was found to be in the range of 0.15–0.3%, although the higher contents need further experimental research. When 0 ≤ w < 0.1 mm, the concentration of relative chloride ions increased with an increase of nano-silica content.
- When cracks appeared in the RAC, the relative chloride concentrations could be effectively reduced by controlling the crack width w ≤ 0.12 mm and adding about 0.2% nano-silica modified recycled aggregate. As such, further the economic benefits could be obtained.
3.3. Calculation and Analysis of Relative Apparent Chloride Diffusion Coefficient
- The value of the sudden change points in chloride ion concentrations had to be discarded in the regression analysis.
- Because the extracting depth of the powder was large and the data were sufficient, the missing data could simply be ignored.
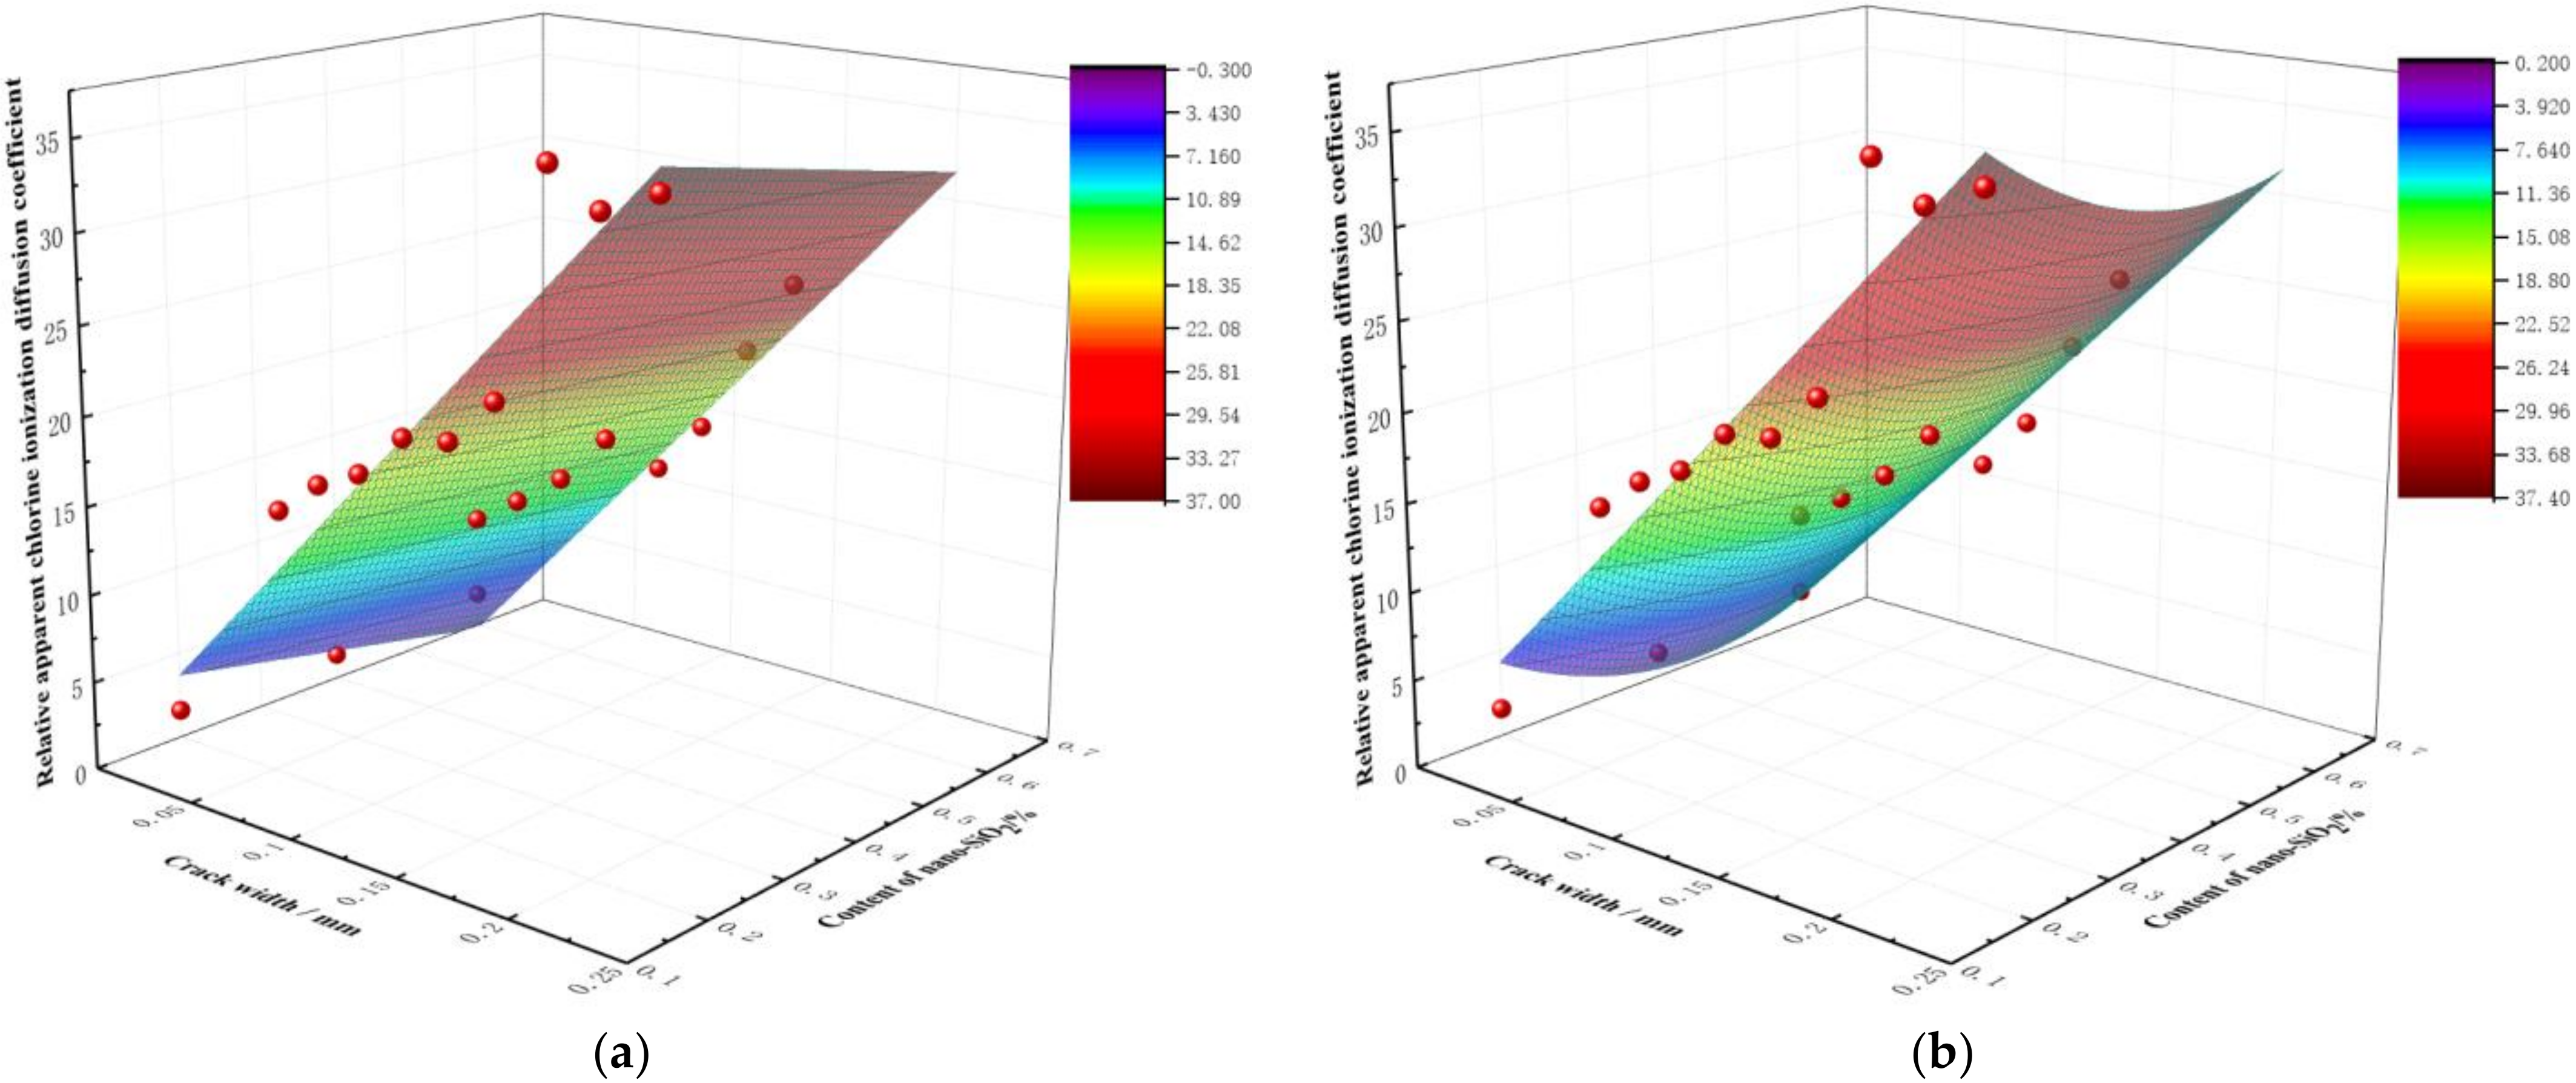
- As the replacement rate of recycled aggregates and the amount of nano-silica changed, the fitting parameters needed to be adjusted appropriately.
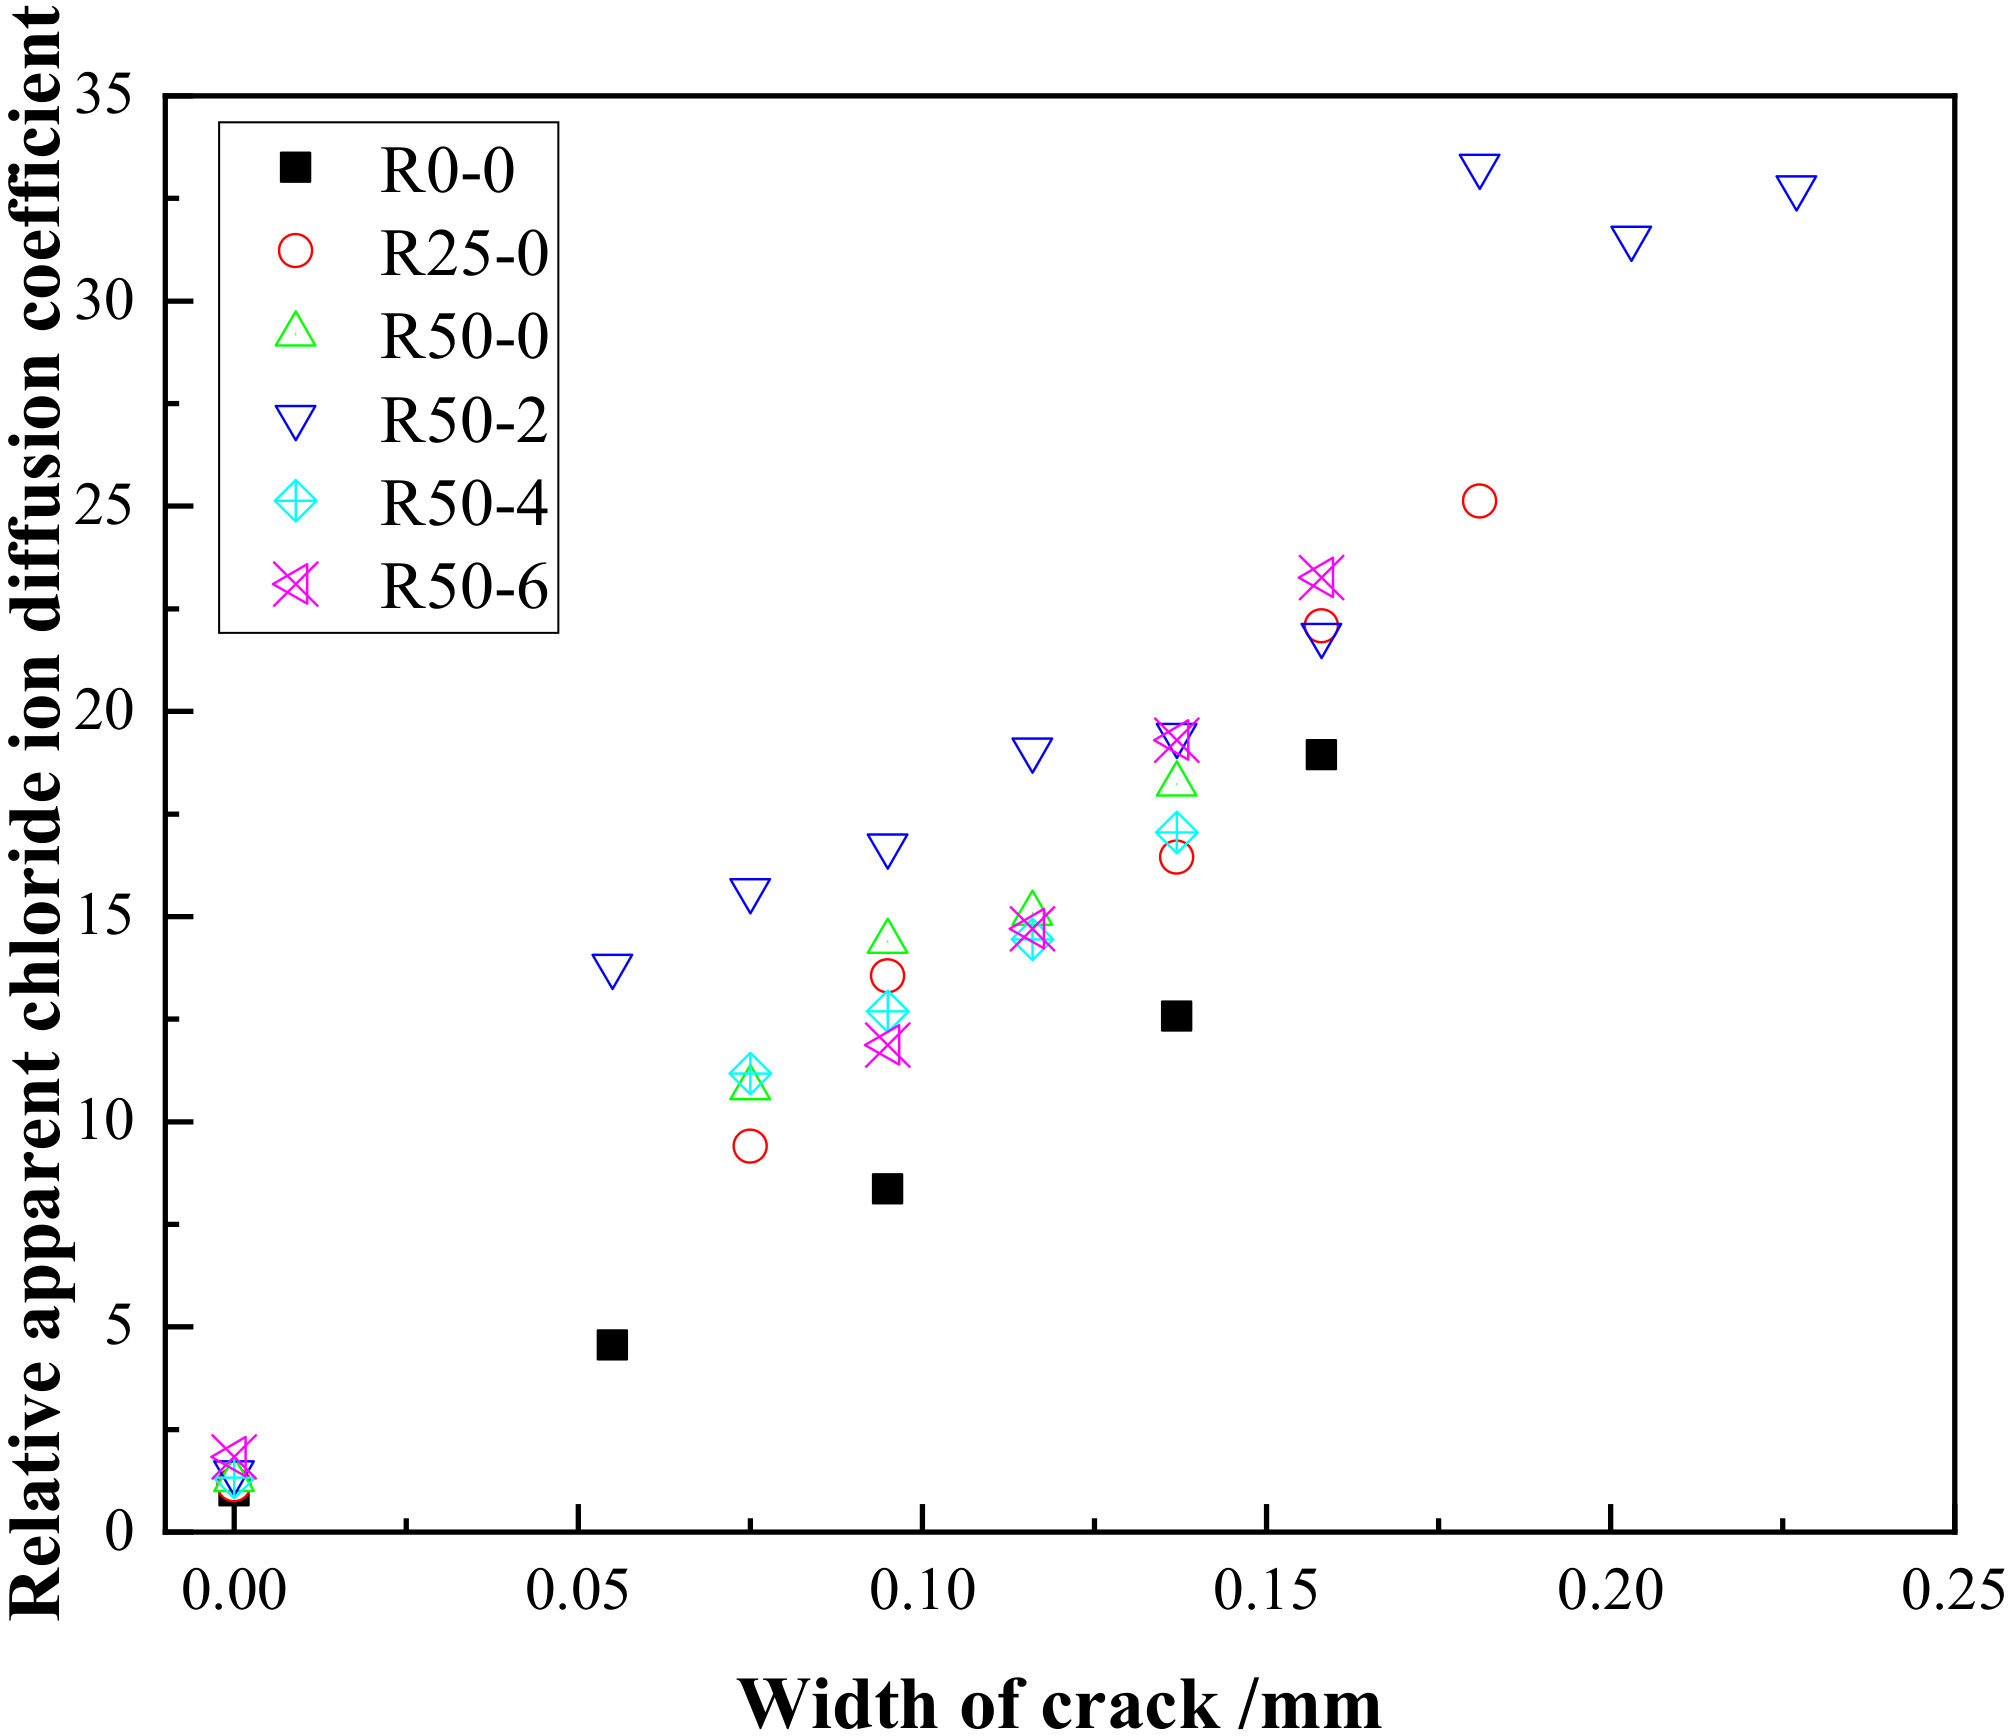
- The relative apparent chloride diffusion coefficients of natural aggregate concrete showed an upward trend with the increase in crack width [38].
- When the crack width was greater than 0.15 mm, there was a sudden change in the relative apparent chloride diffusion coefficient. The reason for this phenomenon needs to be further analyzed, in combination with the chloride ion diffusion mechanism at the crack.
3.4. Sampling Results of Corroded Reinforcement
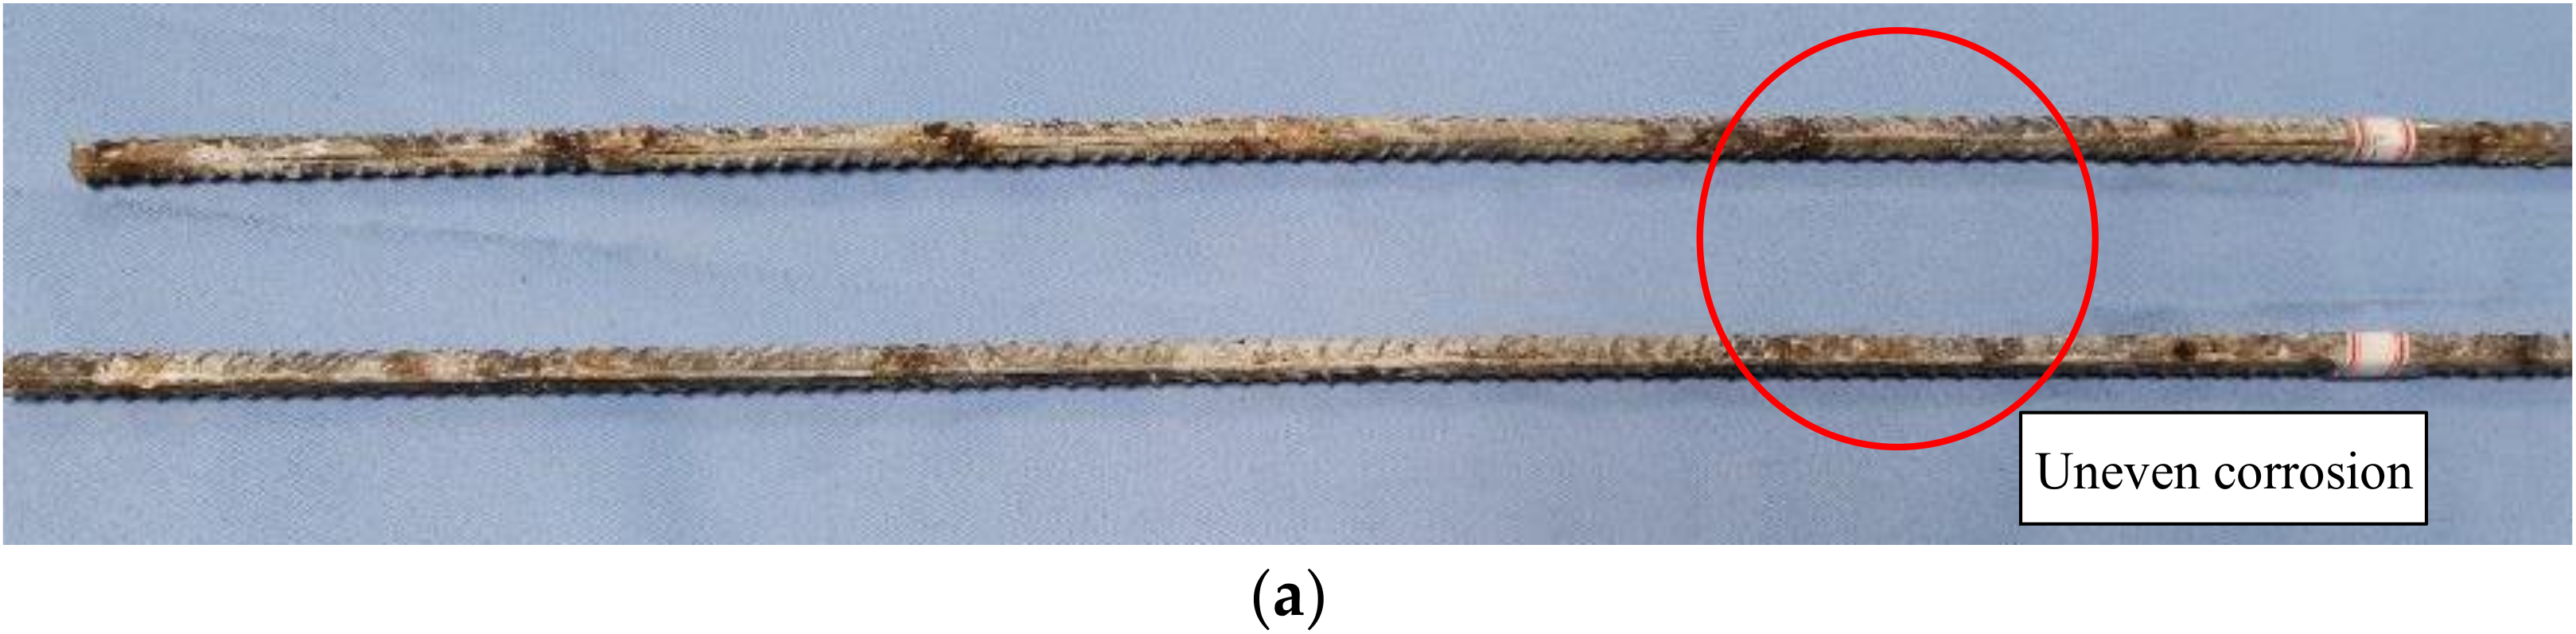
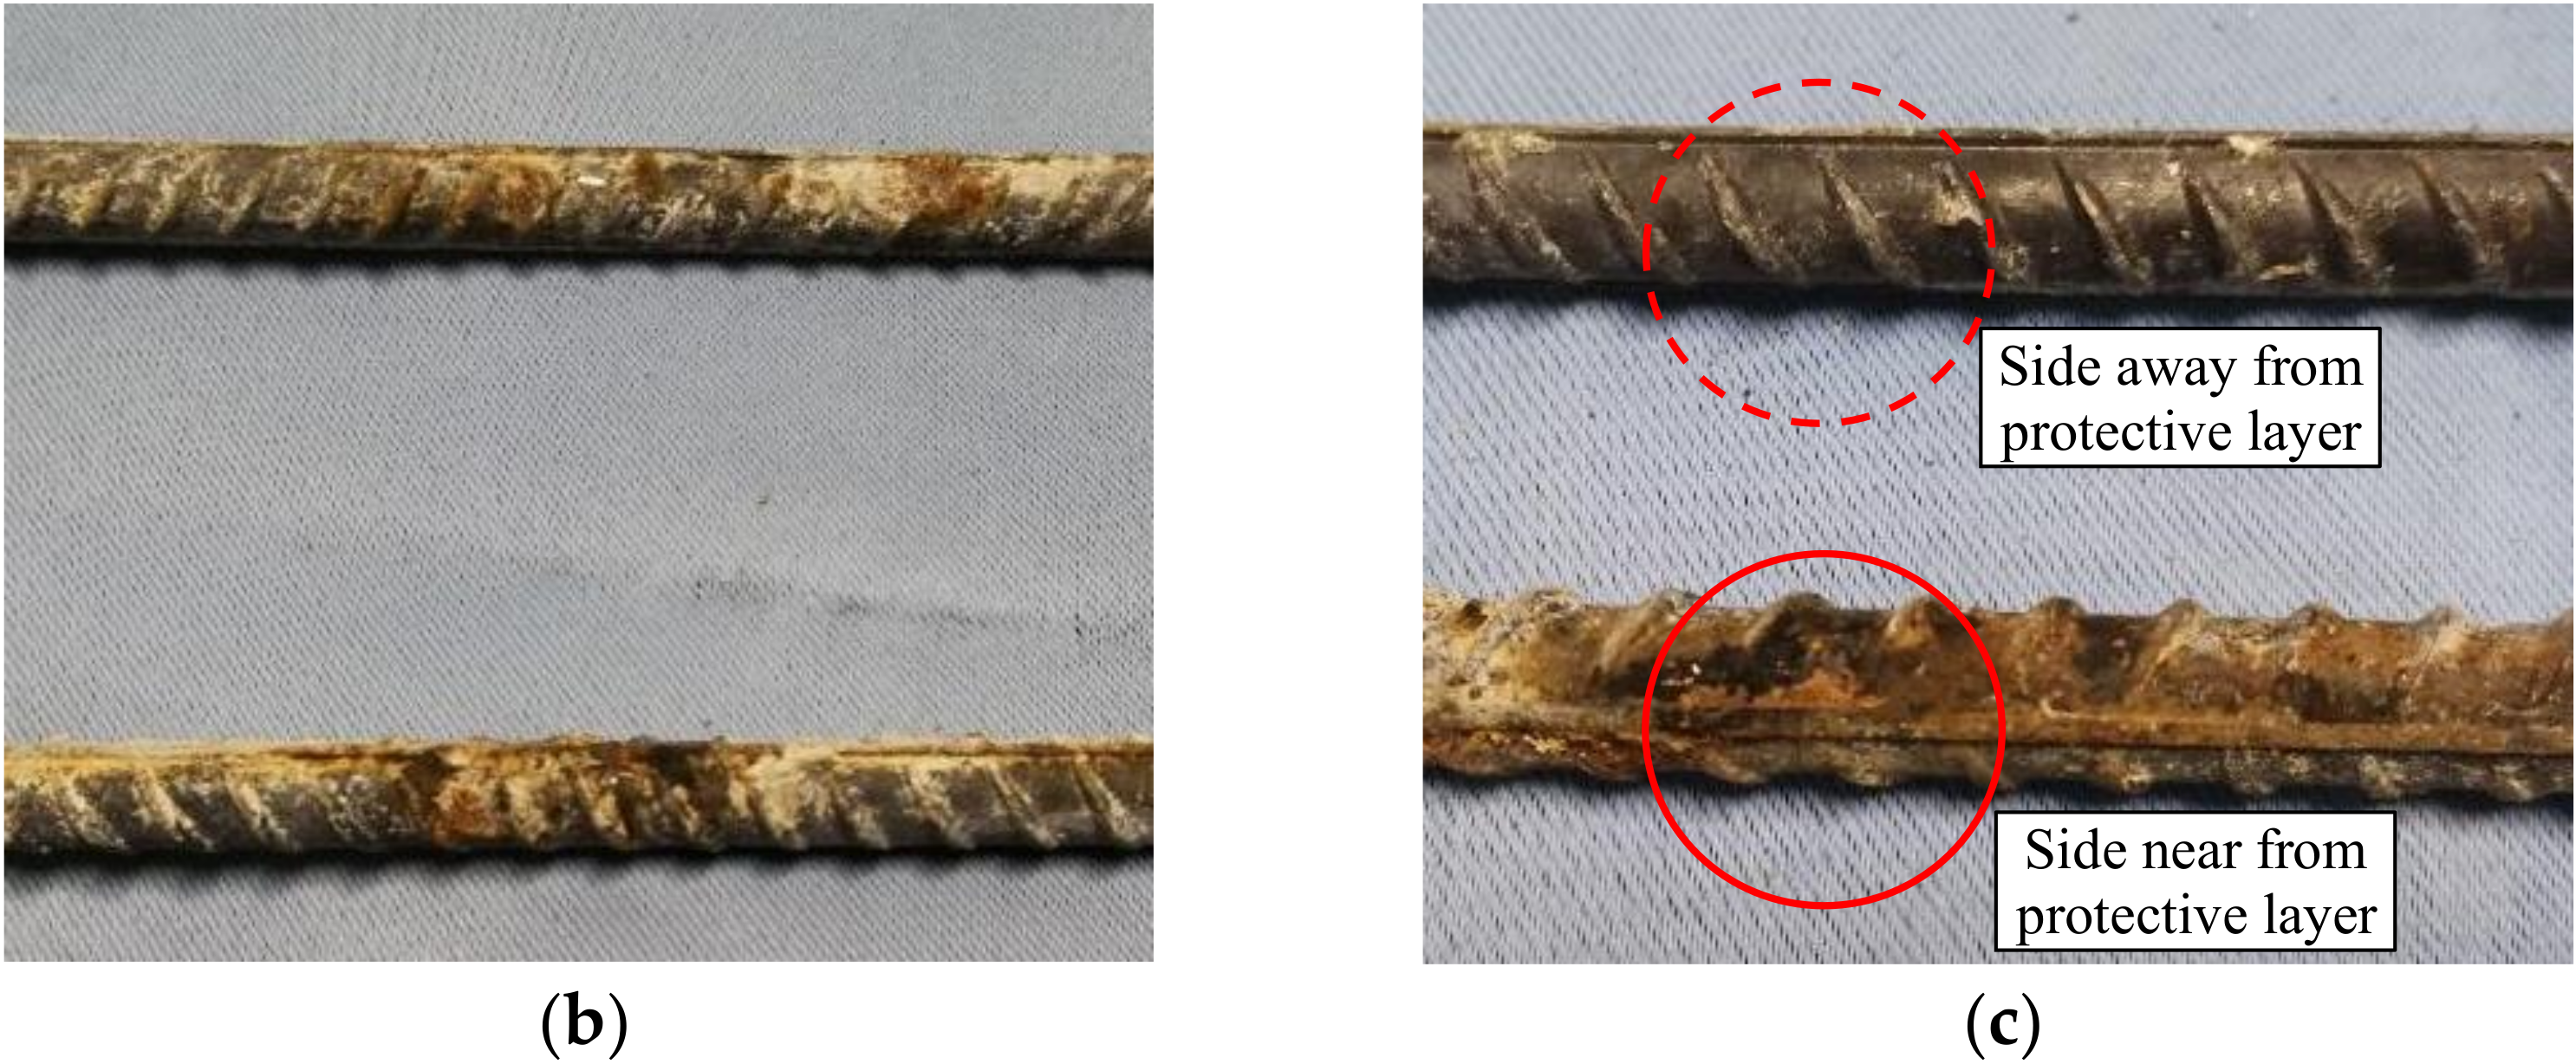
- In the longitudinal direction, obvious uneven corrosion occurred, as shown in Figure 18a. The main reasons for this were the influence of transverse cracks, the increased concentration of chloride ions at the cracks and the presence of water.
- The corrosion product on the side close to the concrete cover was obviously more abundant than that on the side away from the cover, indicating that uneven corrosion had occurred in the diametrical dimension of the reinforcement, as shown in Figure 18c.
4. Conclusions
- An effective sustained load can be provided by way of single beam self-anchoring, as used in this paper. The cracking state of a beam under external load can also be simulated. The test equipment described in this paper simplifies the resources needed for the drying-wetting cycle to a certain extent.
- In the long-term performance test, the phenomenon of self-healing was observed in the cracks. With an increase of nano-silica content, the self-healing rates of the cracks showed a tendency to first increase and then decrease. When the nano-silica content was 0.4%, the self-healing rate was optimal.
- Under the drying-wetting cycle, the variation trend of chloride ion concentration showed a wavy decline along with increasing depth; there was no obvious peak effect. The cycle ratio of drying-wetting and the effect of age on corrosion should be considered in future studies.
- When cracks appear in recycled concrete, the relative chloride ion concentration can be effectively reduced by keeping the crack width below 0.12 mm and adding about 0.2% nano-silica modified material.
- The Matlab software was used to carry out multiple regression analyses via the power function model, and to determine the functional relationships among the relative apparent chloride diffusion coefficient, the three variables of crack width (w), recycled aggregate replacement rate (r) and the content of nano-silica (f). For the multiple variable model, further fitting analyses with multiple basic functions are needed.
Author Contributions
Funding
Institutional Review Board Statement
Informed Consent Statement
Conflicts of Interest
References
- Limbachiya, M.C.; Leelawat, T.; Dhir, R.K. Use of recycled concrete aggregate in high-strength concrete. Mater. Struct. 2000, 33, 574–580. [Google Scholar] [CrossRef]
- Piccinali, A.; Diotti, A.; Plizzari, G.; Sorlini, S. Impact of Recycled Aggregate on the Mechanical and Environmental Properties of Concrete: A Review. Materials 2022, 15, 1818. [Google Scholar] [CrossRef] [PubMed]
- Chen, K.Y.; Wang, J.Y.; Yu, B.; Wu, H.Y.; Zhang, J.R. Critical evaluation of construction and demolition waste and associated environmental impacts: A scientometric analysis. J. Clean. Prod. 2021, 287, 125071. [Google Scholar] [CrossRef]
- Ahmed, H.; Tiznobaik, M.; Huda, S.B.; Islam, M.S.; Alam, M.S. Recycled aggregate concrete from large-scale production to sustainable field application. Constr. Build. Mater. 2020, 262, 119979. [Google Scholar] [CrossRef]
- Ataria, R.B.; Wang, Y.C. Mechanical Properties and Durability Performance of Recycled Aggregate Concrete Containing Crumb Rubber. Materials 2022, 15, 1776. [Google Scholar] [CrossRef]
- Peng, L.G.; Zhao, Y.X.; Zhang, H.R. Flexural behavior and durability properties of recycled aggregate concrete (RAC) beams subjected to long-term loading and chloride attacks. Constr. Build. Mater. 2021, 277, 122277. [Google Scholar] [CrossRef]
- Wang, R.J.; Yu, N.N.; Yang, L. Methods for improving the microstructure of recycled concrete aggregate: A review. Constr. Build. Mater. 2020, 242, 118164. [Google Scholar] [CrossRef]
- De Juan, M.S.; Gutierrez, P.A. Study on the influence of attached mortar content on the properties of recycled concrete aggregate. Constr. Build. Mater. 2008, 23, 872–877. [Google Scholar] [CrossRef]
- Ali, B.; Raza, S.S.; Kurda, R.; Alyousef, R. Synergistic effects of fly ash and hooked steel fibers on strength and durability properties of high strength recycled aggregate concrete. Resour. Conserv. Recycl. 2021, 168, 105444. [Google Scholar] [CrossRef]
- Fang, X.L.; Zhan, B.J.; Poon, C.S. Enhancement of recycled aggregates and concrete by combined treatment of spraying Ca2+ rich wastewater and flow-through carbonation. Constr. Build. Mater. 2021, 277, 122202. [Google Scholar] [CrossRef]
- Ali, B.; Gulzar, M.A.; Raza, A. Effect of sulfate activation of fly ash on mechanical and durability properties of recycled aggregate concrete. Constr. Build. Mater. 2021, 277, 122329. [Google Scholar] [CrossRef]
- Nuaklong, P.; Wongsa, A.; Boonserm, K.; Ngohpok, C.; Jongvivatsakul, P.; Sata, V.; Sukontasukkul, P.; Chindaprasirt, P. Enhancement of mechanical properties of fly ash geopolymer containing fine recycled concrete aggregate with micro carbon fiber. J. Build. Eng. 2021, 41, 102403. [Google Scholar] [CrossRef]
- Dilbas, H.; Cakir, O. Physical and Mechanical Properties of Treated Recycled Aggregate Concretes: Combination of Mechanical Treatment and Silica Fume. J. Mater. Civ. Eng. 2021, 33, 04021096. [Google Scholar] [CrossRef]
- Li, L.; Xuan, D.X.; Sojobi, A.O.; Liu, S.H.; Chu, S.H.; Poon, C.S. Development of nano-silica treatment methods to enhance recycled aggregate concrete. Cem. Concr. Compos. 2021, 118, 103963. [Google Scholar] [CrossRef]
- Xiao, J.Z.; Li, B.; Zhang, K.J.; Su, Y.W.; Pan, Y.B. Dynamic Mechanical Properties of Nano-Silica Modified Recycled Aggregate Concrete under Uniaxial Compression. J. Tongji Univ. Nat. Sci. 2021, 49, 30–39. [Google Scholar]
- Zheng, Y.X.; Zhang, Y.H.; Zhang, P. Methods for improving the durability of recycled aggregate concrete: A review. J. Mater. Res. Technol. 2021, 15, 6367–6386. [Google Scholar] [CrossRef]
- Ying, J.W.; Han, Z.W.; Shen, L.M.; Li, W.G. Influence of Parent Concrete Properties on Compressive Strength and Chloride Diffusion Coefficient of Concrete with Strengthened Recycled Aggregates. Materials 2020, 13, 4631. [Google Scholar] [CrossRef]
- Wang, S.L.; Zhu, B.L. Influence of Nano-SiO2 on the Mechanical Properties of Recycled Aggregate Concrete with and without Polyvinyl Alcohol (PVA) Fiber. Materials 2021, 14, 1446. [Google Scholar] [CrossRef]
- GB175-2007; National Standard of the People’s Republic of China. Common Portland Cement. Standards Press of China: Beijing, China, 2007.
- GB/T 25177-2010; National Standard of the People’s Republic of China. Recycled Coarse Aggregate for Concrete. Standards Press of China: Beijing, China, 2010.
- GB/T 50081-2019; National Standard of the People’s Republic of China. Standard for Test Methods of Concrete Physical and Mechanical Properties. China Architecture and Building Press: Beijing, China, 2019.
- GB/T 1499.1-2017; National Standard of the People’s Republic of China. Steel for Reinforcement of Concrete-Part1: Hot Rolled Plain Bars. Standards Press of China: Beijing, China, 2017.
- GB/T 1499.2-2018; National Standard of the People’s Republic of China. Steel for the Reinforcement of Concrete-Part2: Hot Rolled Ribbed Bars. Standards Press of China: Beijing, China, 2018.
- GB50010-2010; National Standard of the People’s Republic of China. Code for Design of Concrete Structures. China Architecture and Building Press: Beijing, China, 2010.
- Li, P.Z.; Xie, H.C. RCT- Rapid Chloride Ion Detection Method and Its Application. Concrete 2000, 12, 46–48. [Google Scholar]
- Stefanidou, M.; Tsardaka, E.C.; Karozou, A. The Influence of Curing Regimes in Self-Healing of Nano-Modified Cement Pastes. Materials 2020, 13, 5301. [Google Scholar] [CrossRef]
- Xu, J.; Wang, X.Z. Effect of Nano-Silica Modification on Interfacial Transition Zone in Concrete and Its Multiscale Modelling. J. Chin. Ceram. Soc. 2018, 46, 1053–1058. [Google Scholar]
- Han, B. Long-Term Mechnical, Self-Healing and Impact Performances of Concrete with Nanofillers. Master’s Thesis, Dalian University of Technology, Dalian, China, 2010. [Google Scholar]
- Chen, X.F.; Jiao, C.J. Microstructure and physical properties of concrete containing recycled aggregates pre-treated by a nano-silica soaking method. J. Build. Eng. 2022, 51, 104363. [Google Scholar] [CrossRef]
- Li, L.; Xuan, D.X.; Chu, S.H.; Lu, J.X.; Poon, C.S. Efficiency and mechanism of nano-silica pre-spraying treatment in performance enhancement of recycled aggregate concrete. Constr. Build. Mater. 2021, 301, 124093. [Google Scholar] [CrossRef]
- Xiao, J.Z.; Lu, D.; Ma, Z.M. Mesoscopic numerical simulation on chloride diffusion in concrete with random distributed recycled coarse aggregate. J. Southeast Univ. Nat. Sci. Ed. 2014, 44, 1240–1245. [Google Scholar]
- Lu, C.H. Flexural and Durability Performance of RC Members with Transverse Cracks. Ph.D. Thesis, Zhejiang University, Hangzhou, China, 2011. [Google Scholar]
- CCES 01-2004; Guide to Durability Design and Construction of Concrete Structures. China Civil Engineering Society: Beijing, China, 2004.
- Yan, Y.D. Transportation of Chloride Ions in Damaged and Cracked Concrete and Its Action. Ph.D. Thesis, Zhejiang University, Hangzhou, China, 2011. [Google Scholar]
- Du, X.L.; Jin, L.; Ma, G.W. A meso-scale numerical method for the simulation of chloride diffusivity in concrete. Finite Elem. Anal. Des. 2014, 85, 87–100. [Google Scholar] [CrossRef]
- Ying, J.W.; Xiao, J.Z. Meso-level Simulation of Chloride Nonlinear Diffusion in Modeled Recycled Aggregate Concrete. J. Build. Mater. 2013, 16, 863–868. [Google Scholar]
- Villagrán-Zaccardi, Y.A.; Zega, C.J.; Di Maio, A.A. Chloride Penetration and Binding in Recycled Concrete. J. Mater. Civ. Eng. 2008, 20, 449–455. [Google Scholar] [CrossRef]
- Cui, Z.W. Research on Erosion and Flexural Behavior Deterioration of Cracked RC under Chloride Drying and Wetting Cycles. Master’s Thesis, Jiangsu University, Zhenjiang, China, 2013. [Google Scholar]
- Bao, J.W.; Li, S.G.; Zhang, P.; Ding, X.Y.; Xue, S.B.; Cui, Y.F.; Zhao, T.J. Influence of the incorporation of recycled coarse aggregate on water absorption and chloride penetration into concrete. Constr. Build. Mater. 2020, 239, 117845. [Google Scholar] [CrossRef]
- Dimitriou, G.; Savva, P.; Petrou, M.F. Enhancing mechanical and durability properties of recycled aggregate concrete. Constr. Build. Mater. 2018, 158, 228–235. [Google Scholar] [CrossRef]


| Loss on Ignition (%) | CaO (%) | SiO2 (%) | Al2O3 (%) | MgO (%) | Fe2O3 (%) | SO3 (%) | Setting Time (min) | Specific Surface Area (m2/kg) | |
|---|---|---|---|---|---|---|---|---|---|
| Initial | Final | ||||||||
| 1.8 | 65.8 | 21.6 | 5.46 | 1.2 | 3.05 | 1.6 | 140 | 260 | 345 |
| Type of Aggregate | Bulk Density (kg·m−3) | Apparent Density (kg·m−3) | Water Absorption (%) |
|---|---|---|---|
| Natural aggregate | 1433 | 2683 | 1.4 |
| Recycled aggregate | 1238 | 2562 | 7.2 |
| Property | Value |
|---|---|
| Color | White |
| Purity (%) | 99.8 |
| Specific surface area (m2/g) | 640 ± 60 |
| Particle size (nm) | 15 ± 5 |
| pH value | 6~8 |
| No. | Consumption of Unit Volume (kg/m3) | Compressive Strength (MPa) | ||||||||
|---|---|---|---|---|---|---|---|---|---|---|
| Cement | Sand | Water | Natural Aggregate | Ordinary Recycled Aggregate | Nano Reinforced Recycled Aggregate (SiO2/%) * | |||||
| 0 | 0.2 | 0.4 | 0.6 | |||||||
| R0-0 | 361 | 608 | 195 | 1235 | 0 | 0 | 0 | 0 | 0 | 55.2 |
| R25-0 | 361 | 608 | 195 | 923.2 | 308.8 | 0 | 0 | 0 | 0 | 54.9 |
| R50-0 | 361 | 608 | 195 | 617.5 | 0 | 617.5 | 0 | 0 | 0 | 56.1 |
| R50-2 | 361 | 608 | 195 | 617.5 | 0 | 0 | 617.5 | 0 | 0 | 56.6 |
| R50-4 | 361 | 608 | 195 | 617.5 | 0 | 0 | 0 | 617.5 | 0 | 59.8 |
| R50-6 | 361 | 608 | 195 | 617.5 | 0 | 0 | 0 | 0 | 617.5 | 58.2 |
| No. | Control Width | Actual Maximum Width | Actual Minimum Width | Average Width | Minimum Spacing | Maximum Spacing | Average Spacing | Total Crack Number |
|---|---|---|---|---|---|---|---|---|
| R0-0-0.2 * | 0.2 | 0.158 | 0.055 | 0.093 | 32 | 122 | 81.8 | 8 |
| R25-0-0.2 | 0.2 | 0.181 | 0.036 | 0.097 | 50 | 138 | 90.0 | 8 |
| R50-0-0.2 | 0.2 | 0.137 | 0.075 | 0.099 | 49 | 118 | 78.9 | 8 |
| R50-2-0.1 | 0.1 | 0.095 | 0.055 | 0.091 | 79 | 123 | 100.7 | 7 |
| R50-2-0.2 | 0.2 | 0.181 | 0.075 | 0.130 | 52 | 133 | 92.3 | 8 |
| R50-2-0.3 | 0.3 | 0.227 | 0.075 | 0.159 | 67 | 103 | 75.6 | 9 |
| R50-4-0.2 | 0.2 | 0.158 | 0.055 | 0.092 | 49 | 118 | 74.8 | 9 |
| R50-6-0.2 | 0.2 | 0.158 | 0.095 | 0.121 | 65 | 98 | 82.9 | 8 |
| Independent Variable | Type of Function | Highest Power | Function Model | R2 |
|---|---|---|---|---|
| w, r | Power function | First power | 0.956 | |
| Second power | 0.966 | |||
| Third power | 0.976 | |||
| w, f | Power function | First power | 0.941 | |
| Second power | 0.937 | |||
| Third power | 0.930 | |||
| Exponential function * | - | 0.919 |
Publisher’s Note: MDPI stays neutral with regard to jurisdictional claims in published maps and institutional affiliations. |
© 2022 by the authors. Licensee MDPI, Basel, Switzerland. This article is an open access article distributed under the terms and conditions of the Creative Commons Attribution (CC BY) license (https://creativecommons.org/licenses/by/4.0/).
Share and Cite
Yan, Y.; Si, Y.; Zheng, Y.; Wang, X. Durability of Nano-Reinforced Recycled Aggregate Concrete under Load and Chloride Ingress. Materials 2022, 15, 6194. https://doi.org/10.3390/ma15186194
Yan Y, Si Y, Zheng Y, Wang X. Durability of Nano-Reinforced Recycled Aggregate Concrete under Load and Chloride Ingress. Materials. 2022; 15(18):6194. https://doi.org/10.3390/ma15186194
Chicago/Turabian StyleYan, Yongdong, Youdong Si, Yulong Zheng, and Xin Wang. 2022. "Durability of Nano-Reinforced Recycled Aggregate Concrete under Load and Chloride Ingress" Materials 15, no. 18: 6194. https://doi.org/10.3390/ma15186194
APA StyleYan, Y., Si, Y., Zheng, Y., & Wang, X. (2022). Durability of Nano-Reinforced Recycled Aggregate Concrete under Load and Chloride Ingress. Materials, 15(18), 6194. https://doi.org/10.3390/ma15186194