
Green Synthesis and Investigation of Surface Effects of α-Fe2O3@TiO2 Nanocomposites by Impedance Spectroscopy

 , , , ,
  ,
,
Abstract
:
1. Introduction
2. Materials and Methods
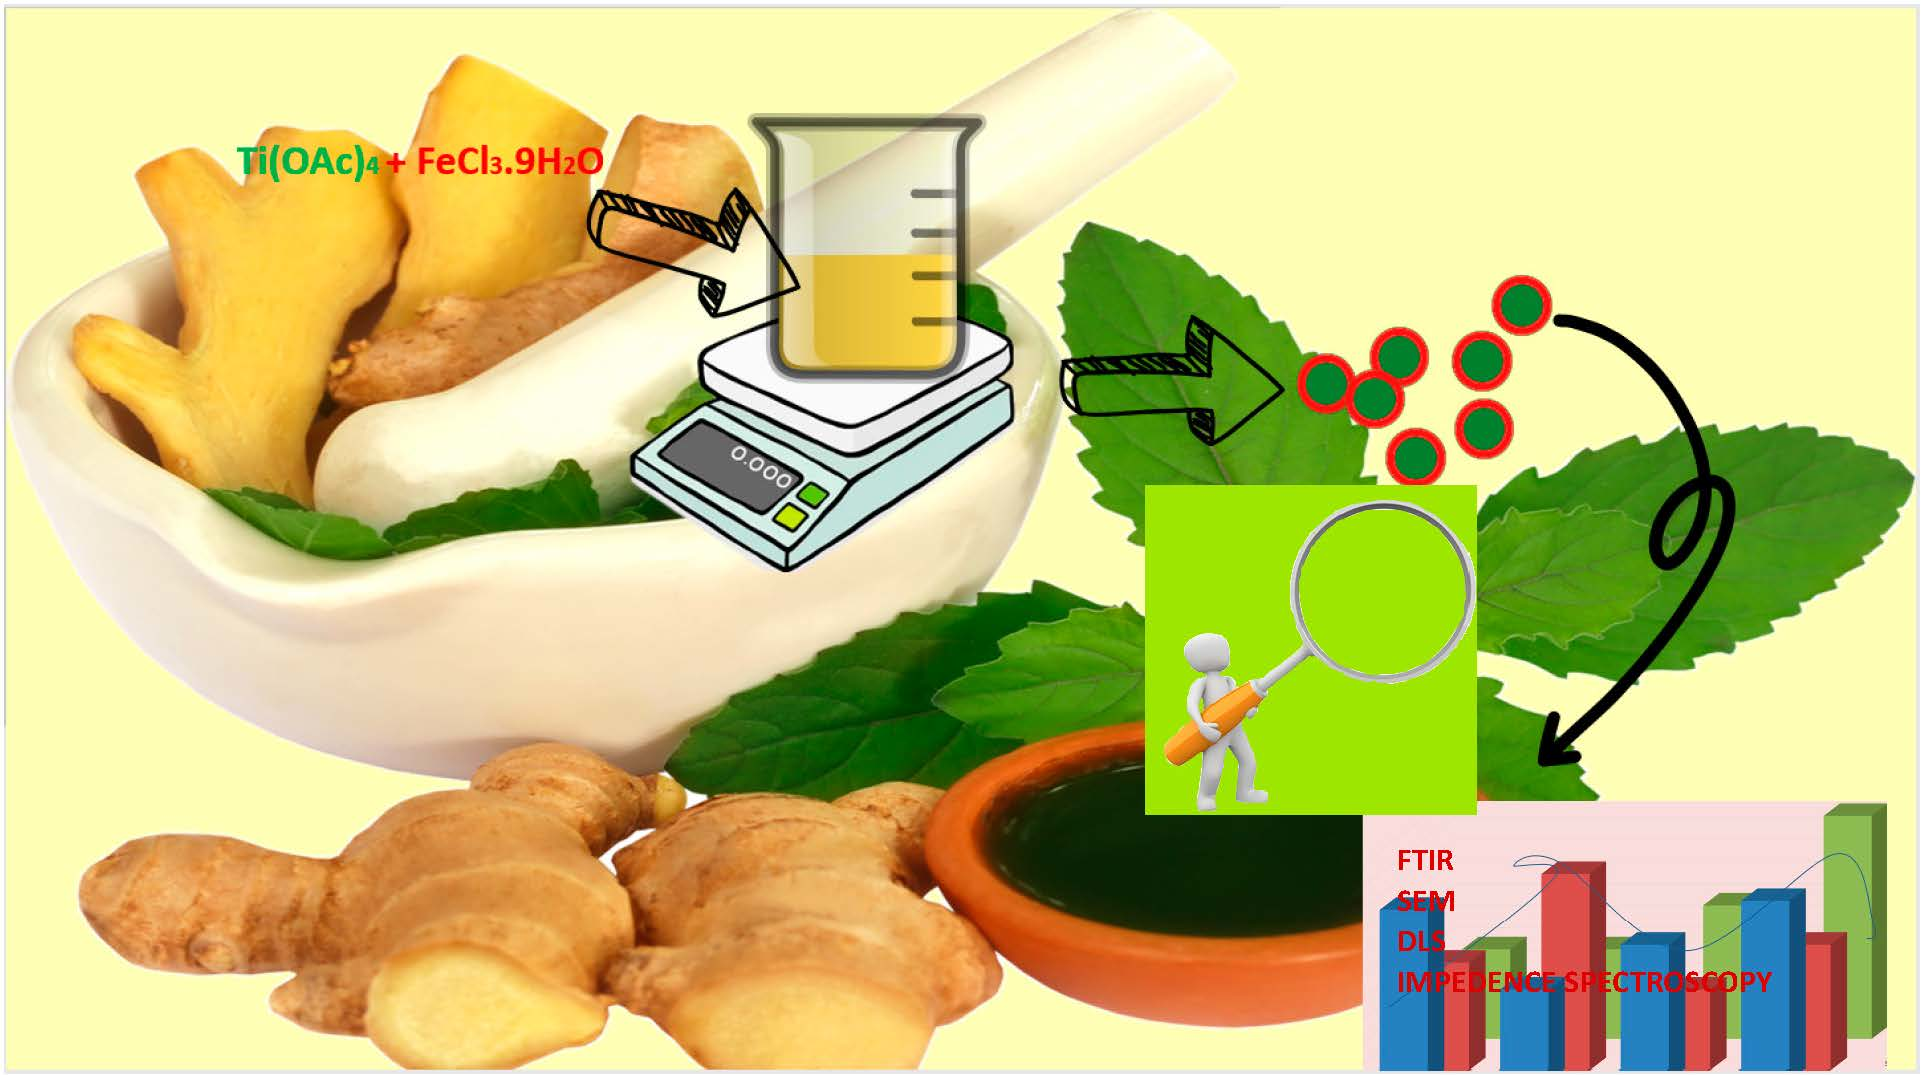
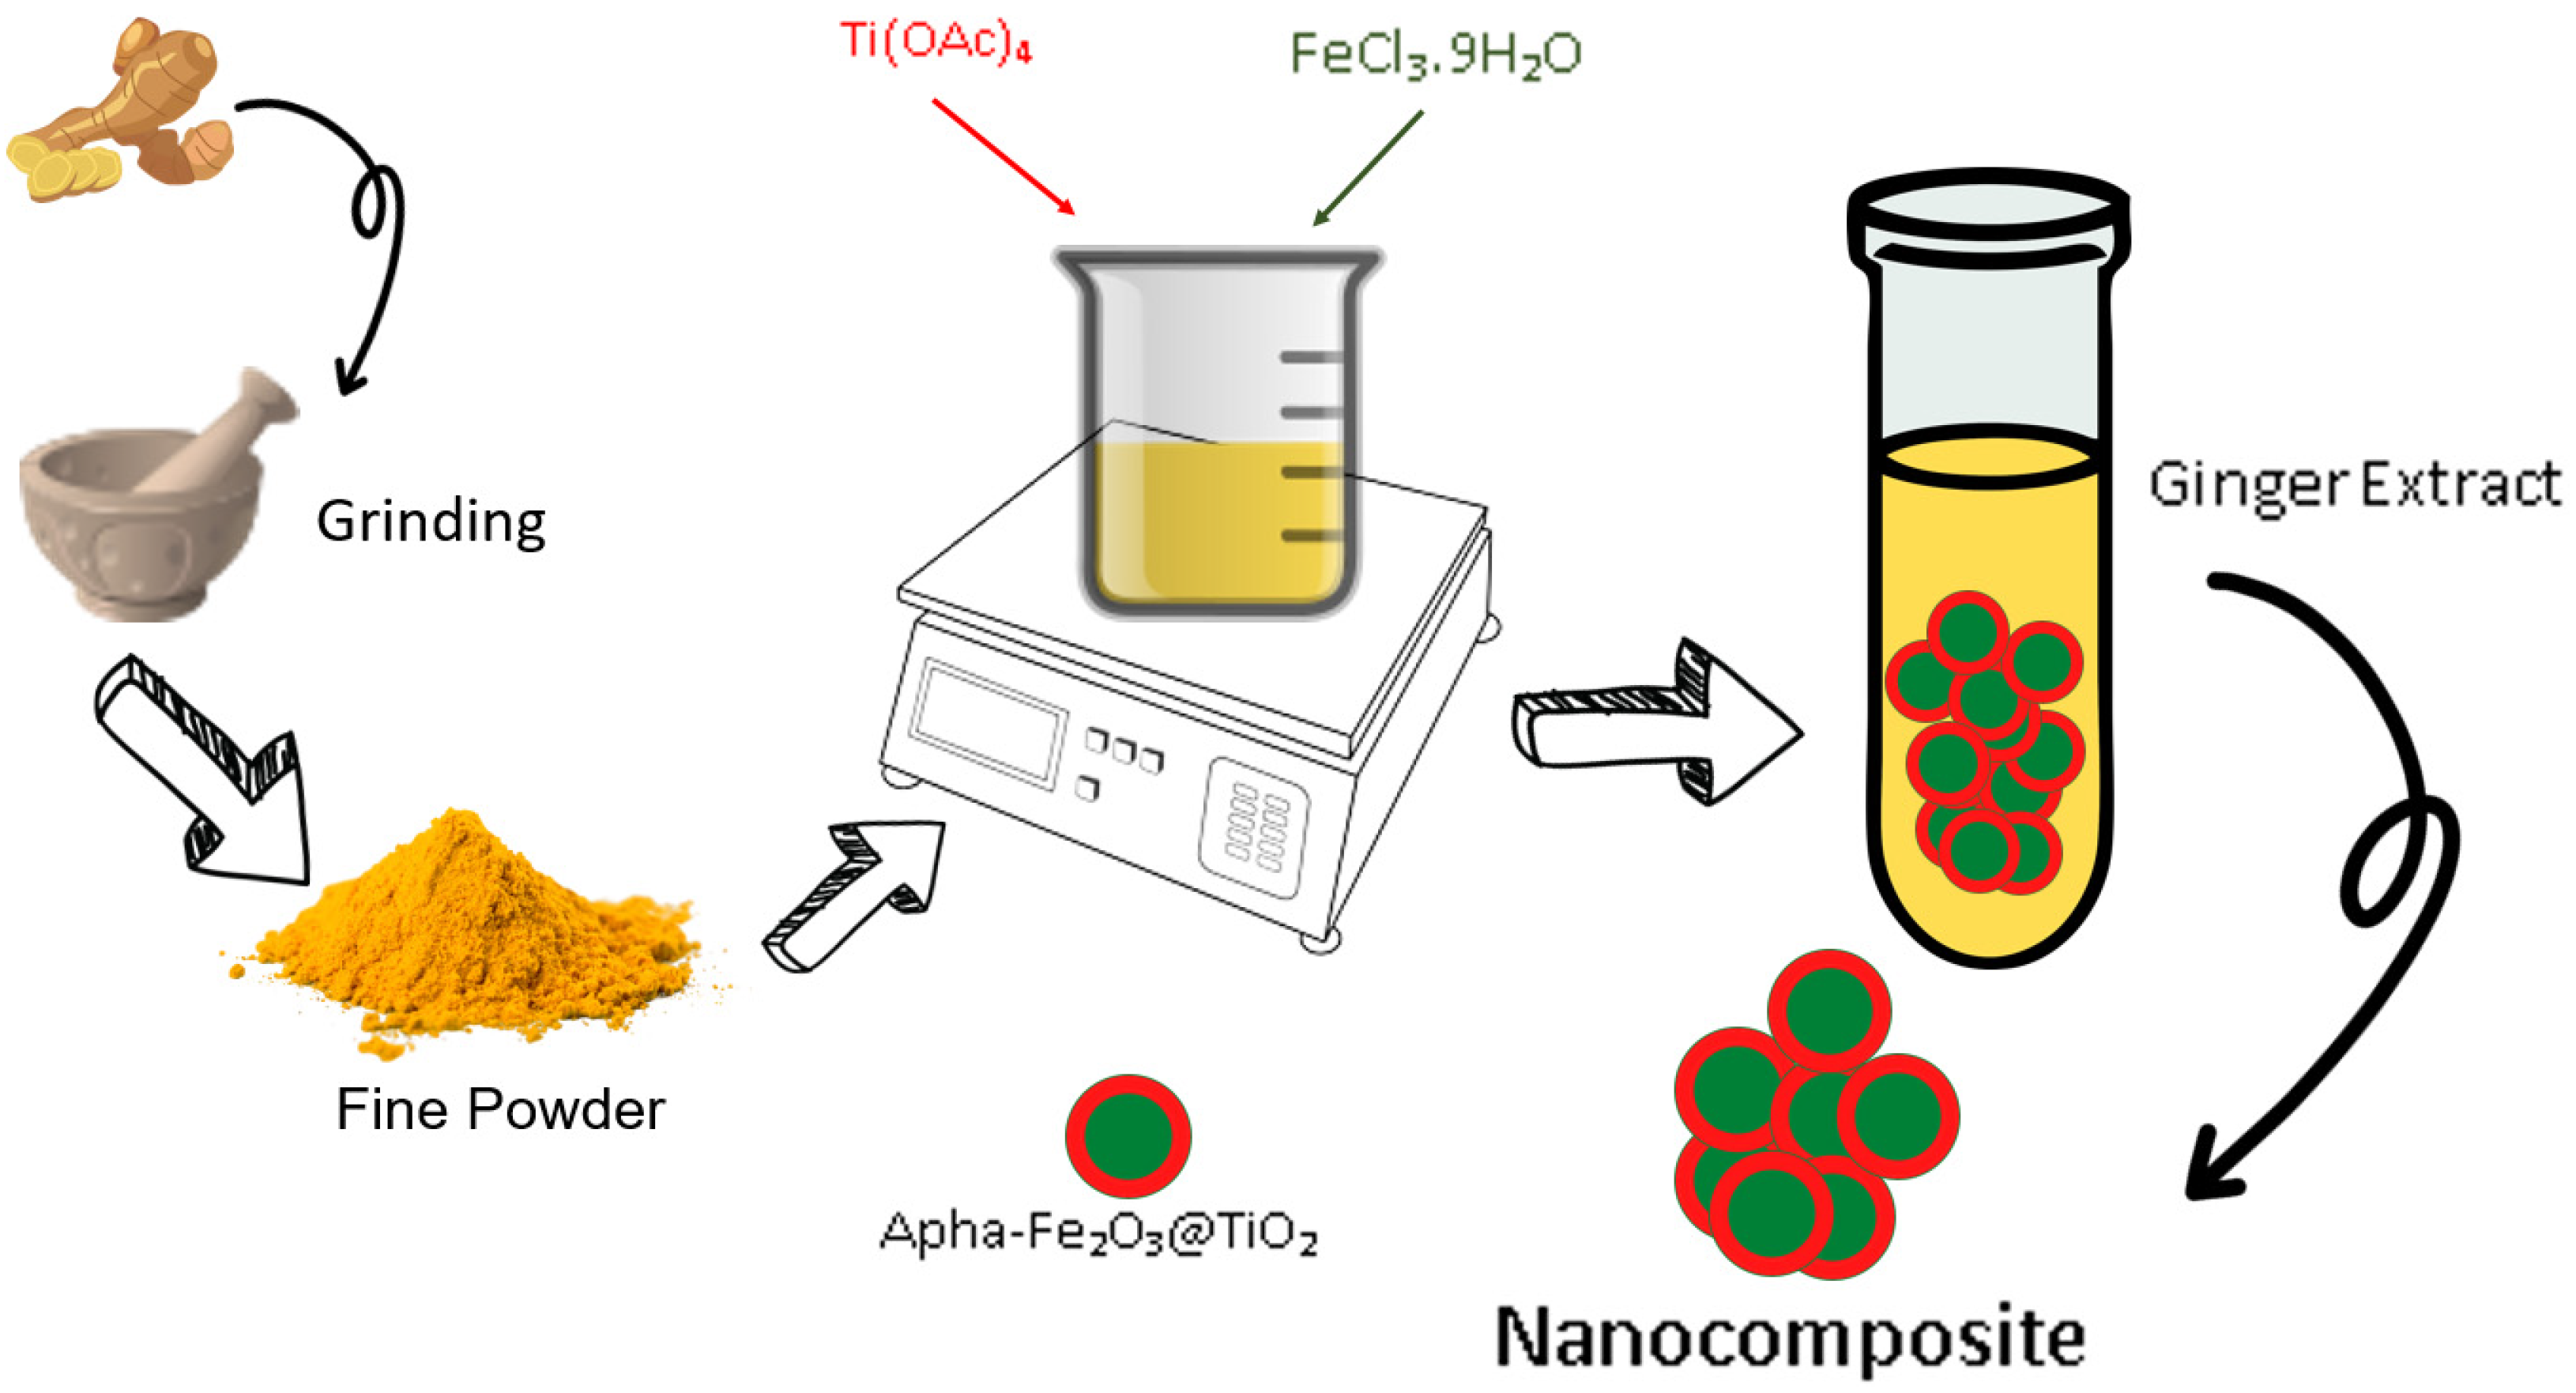
2.1. Preparation of Extracts
2.2. Synthesis of Ferrite Composite
3. Characterization of Prepared Compounds
4. Results
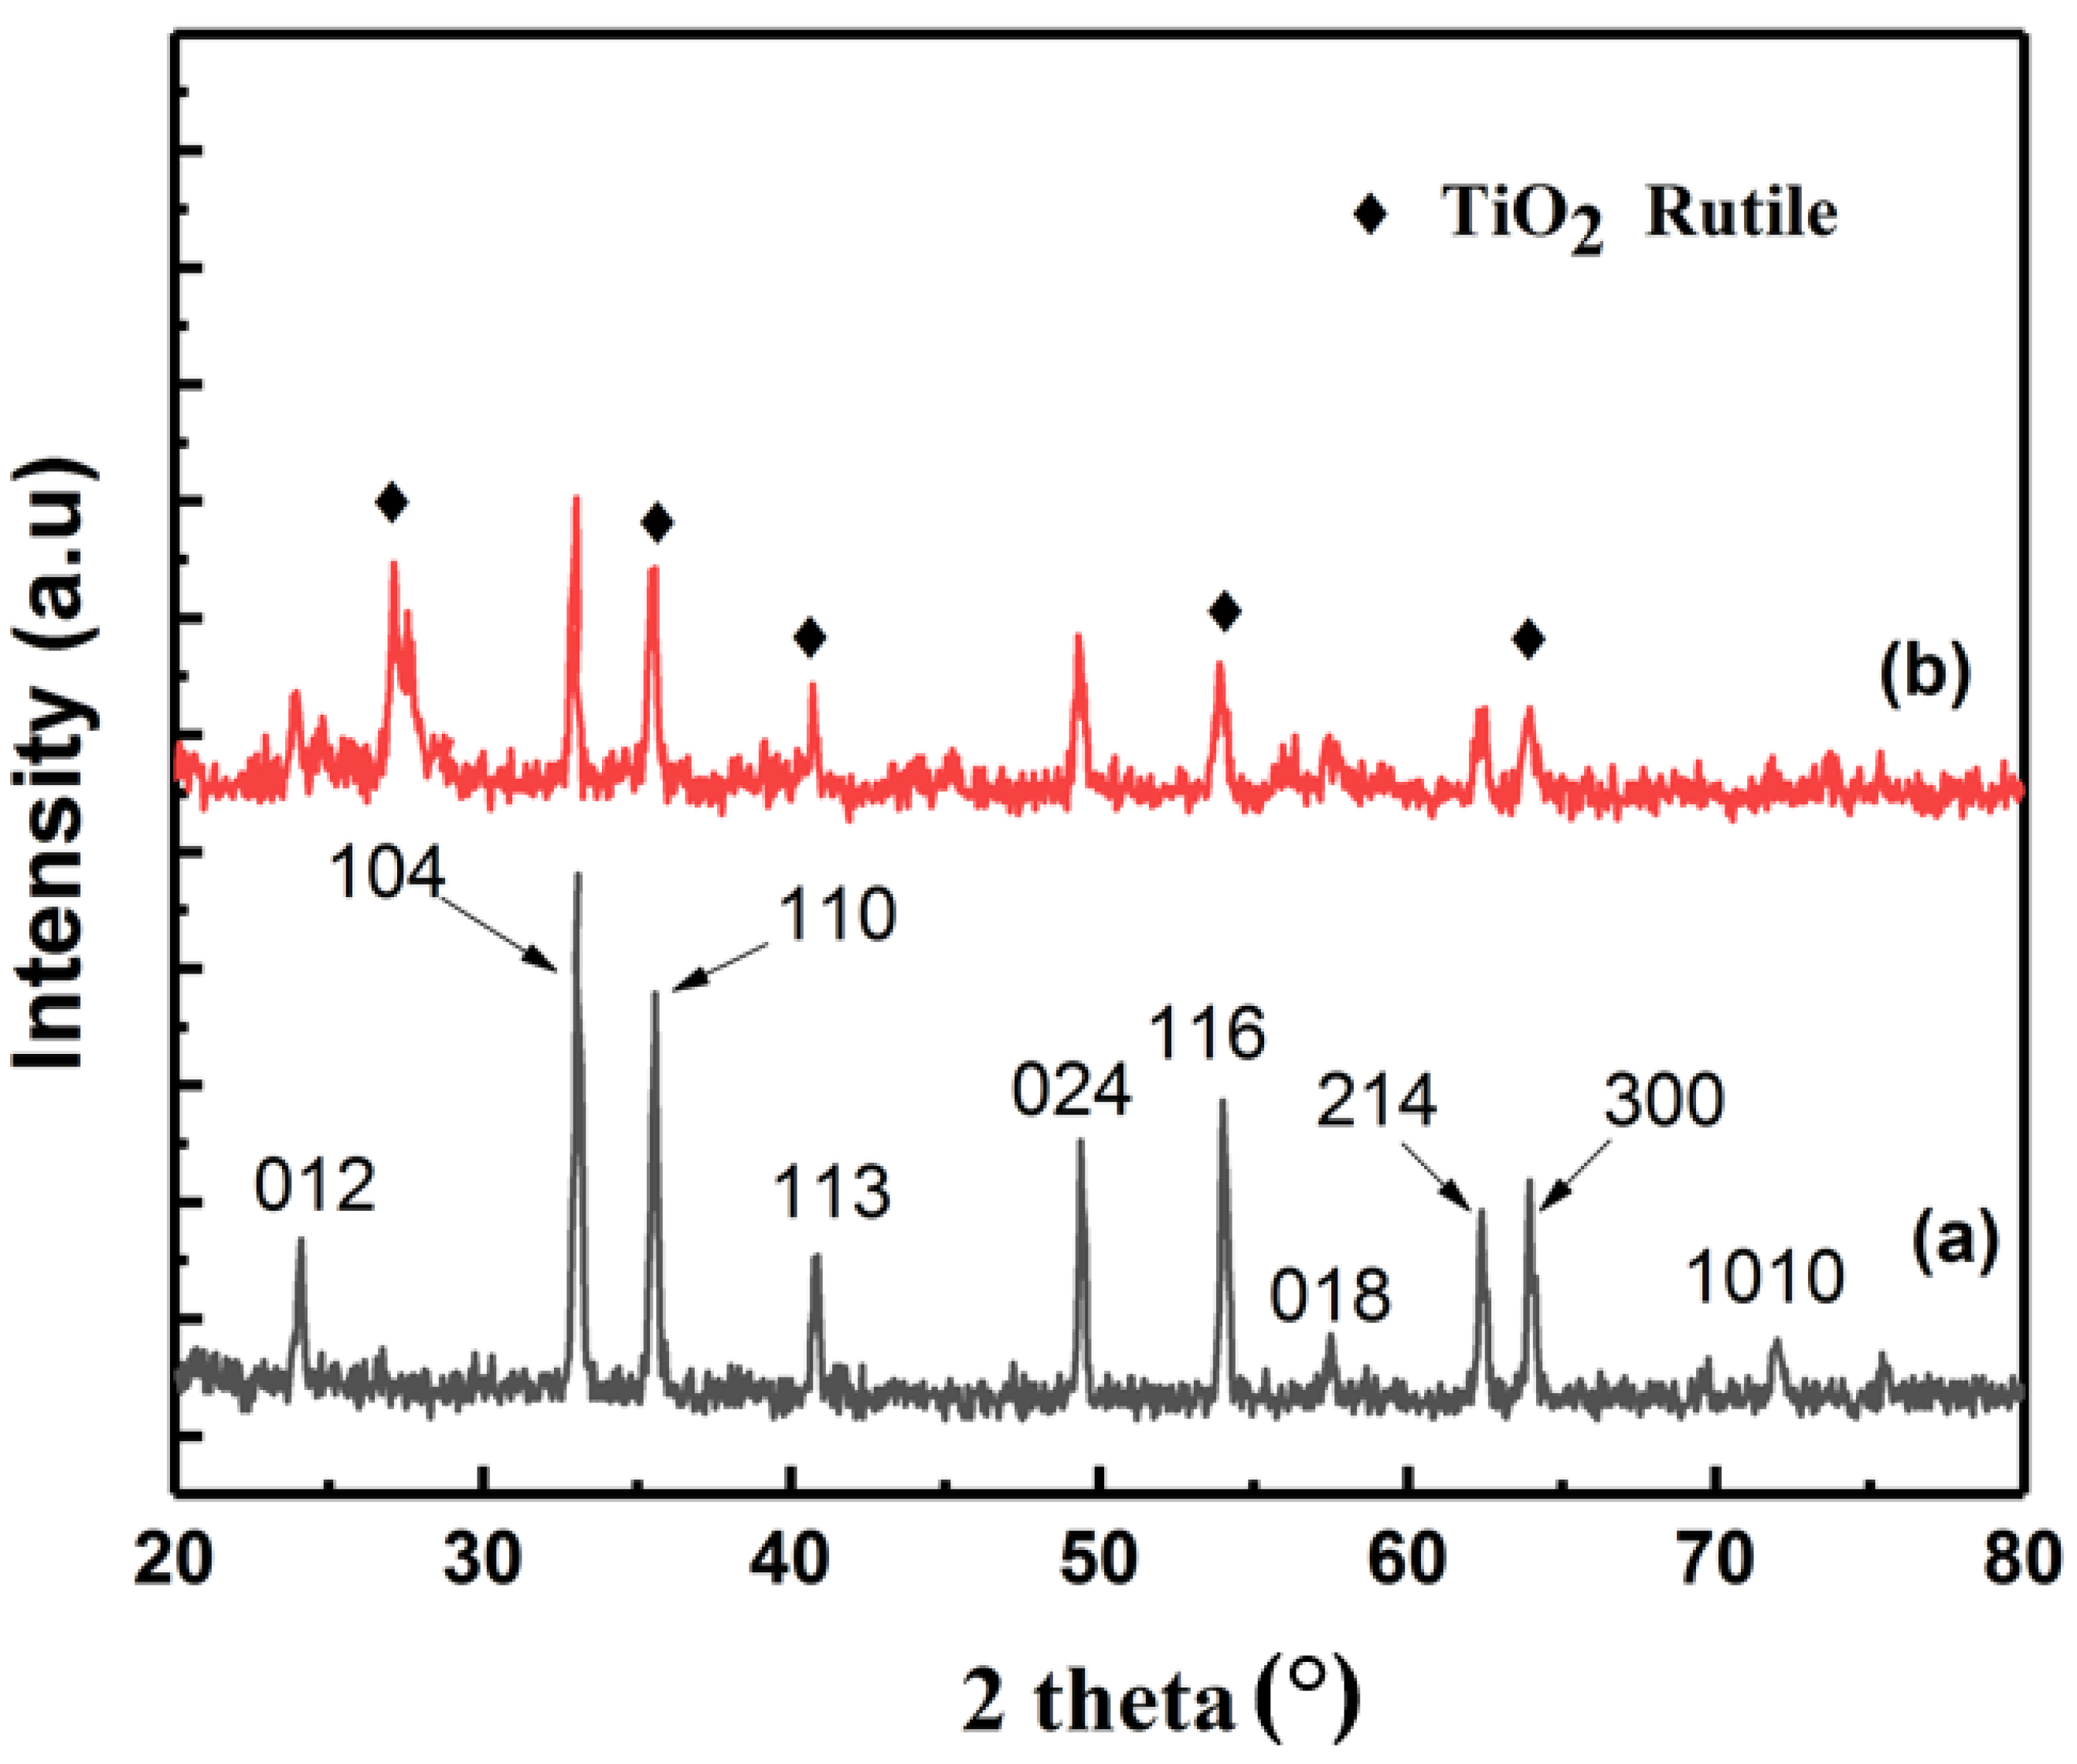
4.1. XRD
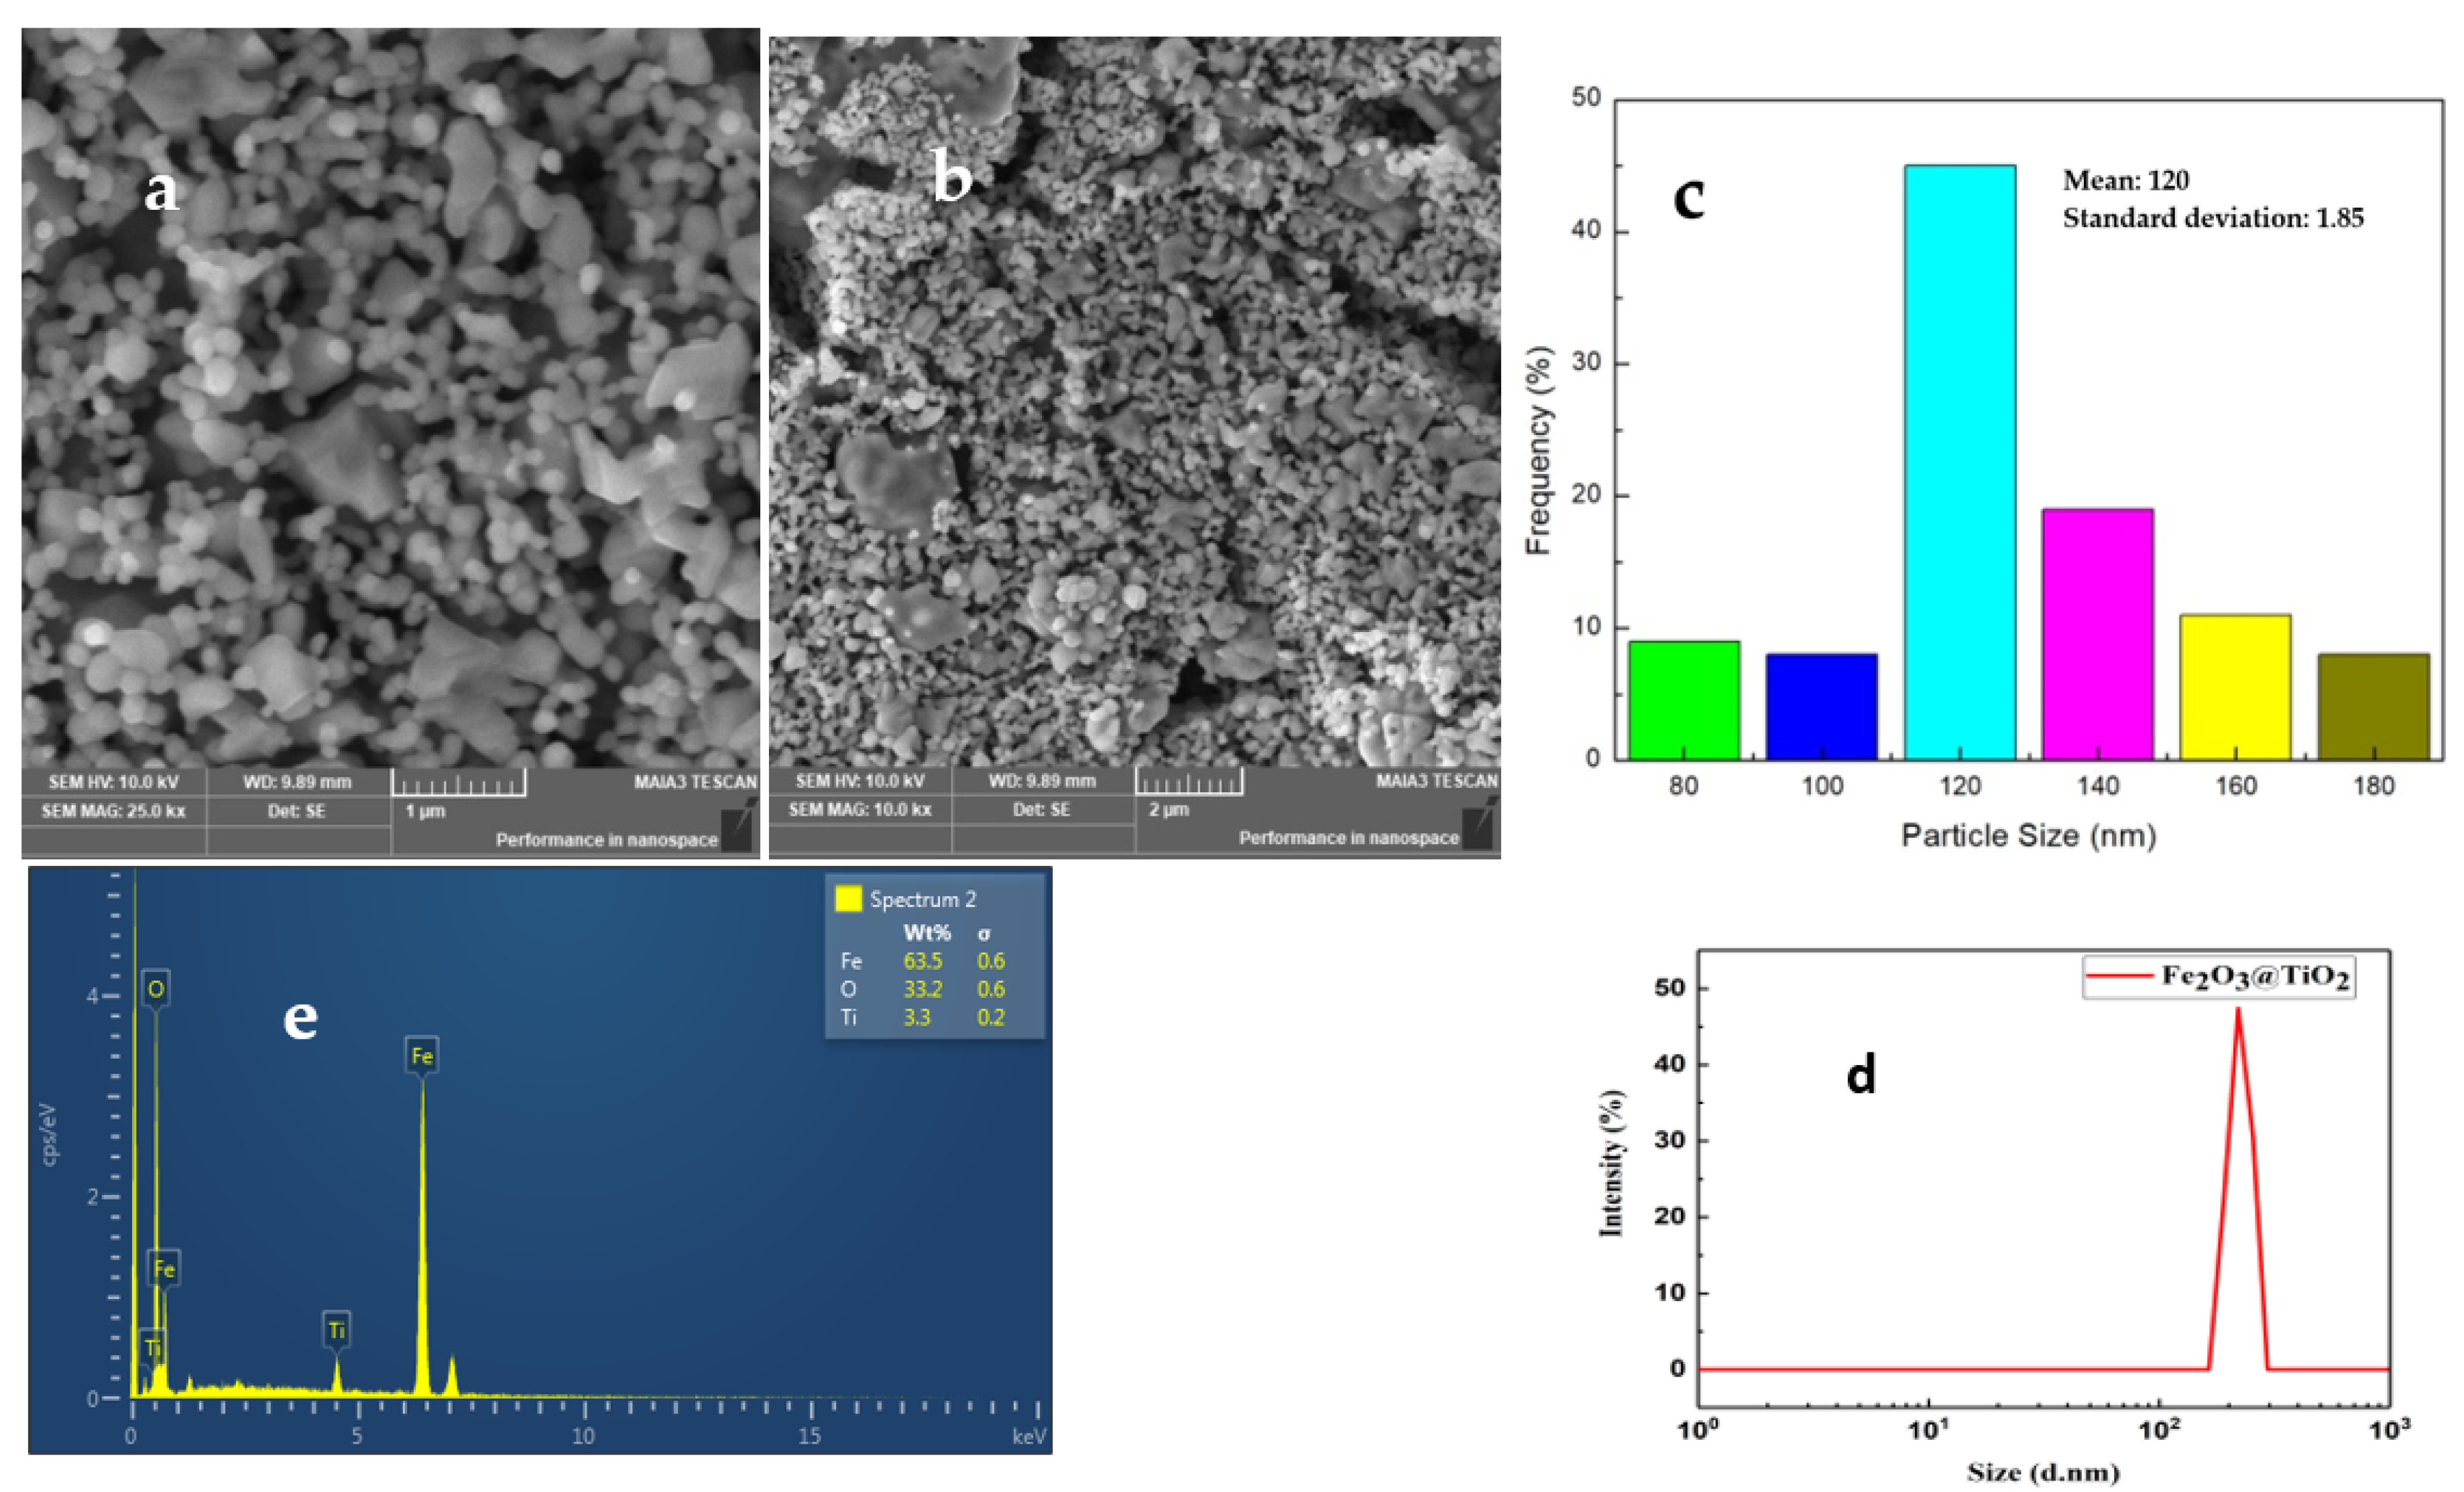
4.2. SEM
4.3. DLS
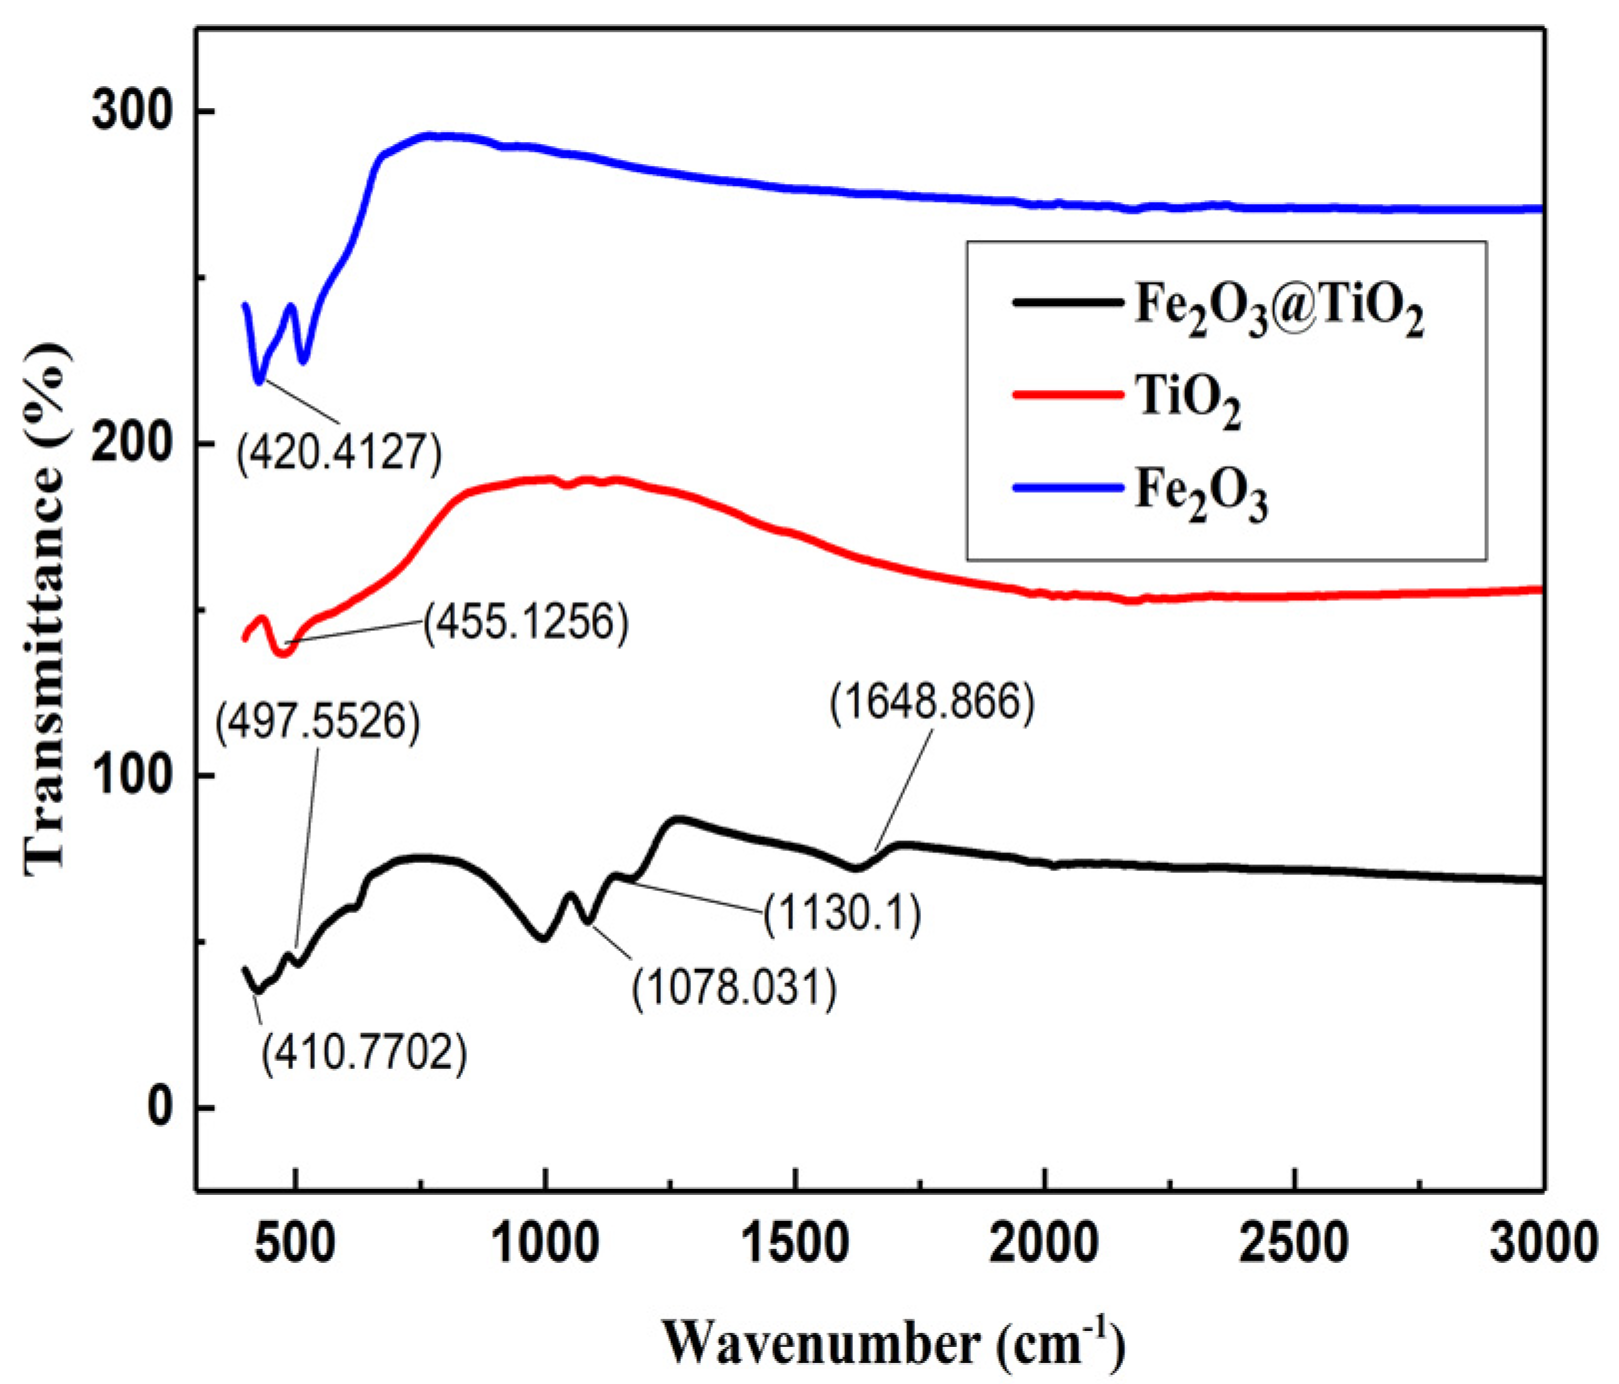
4.4. FTIR
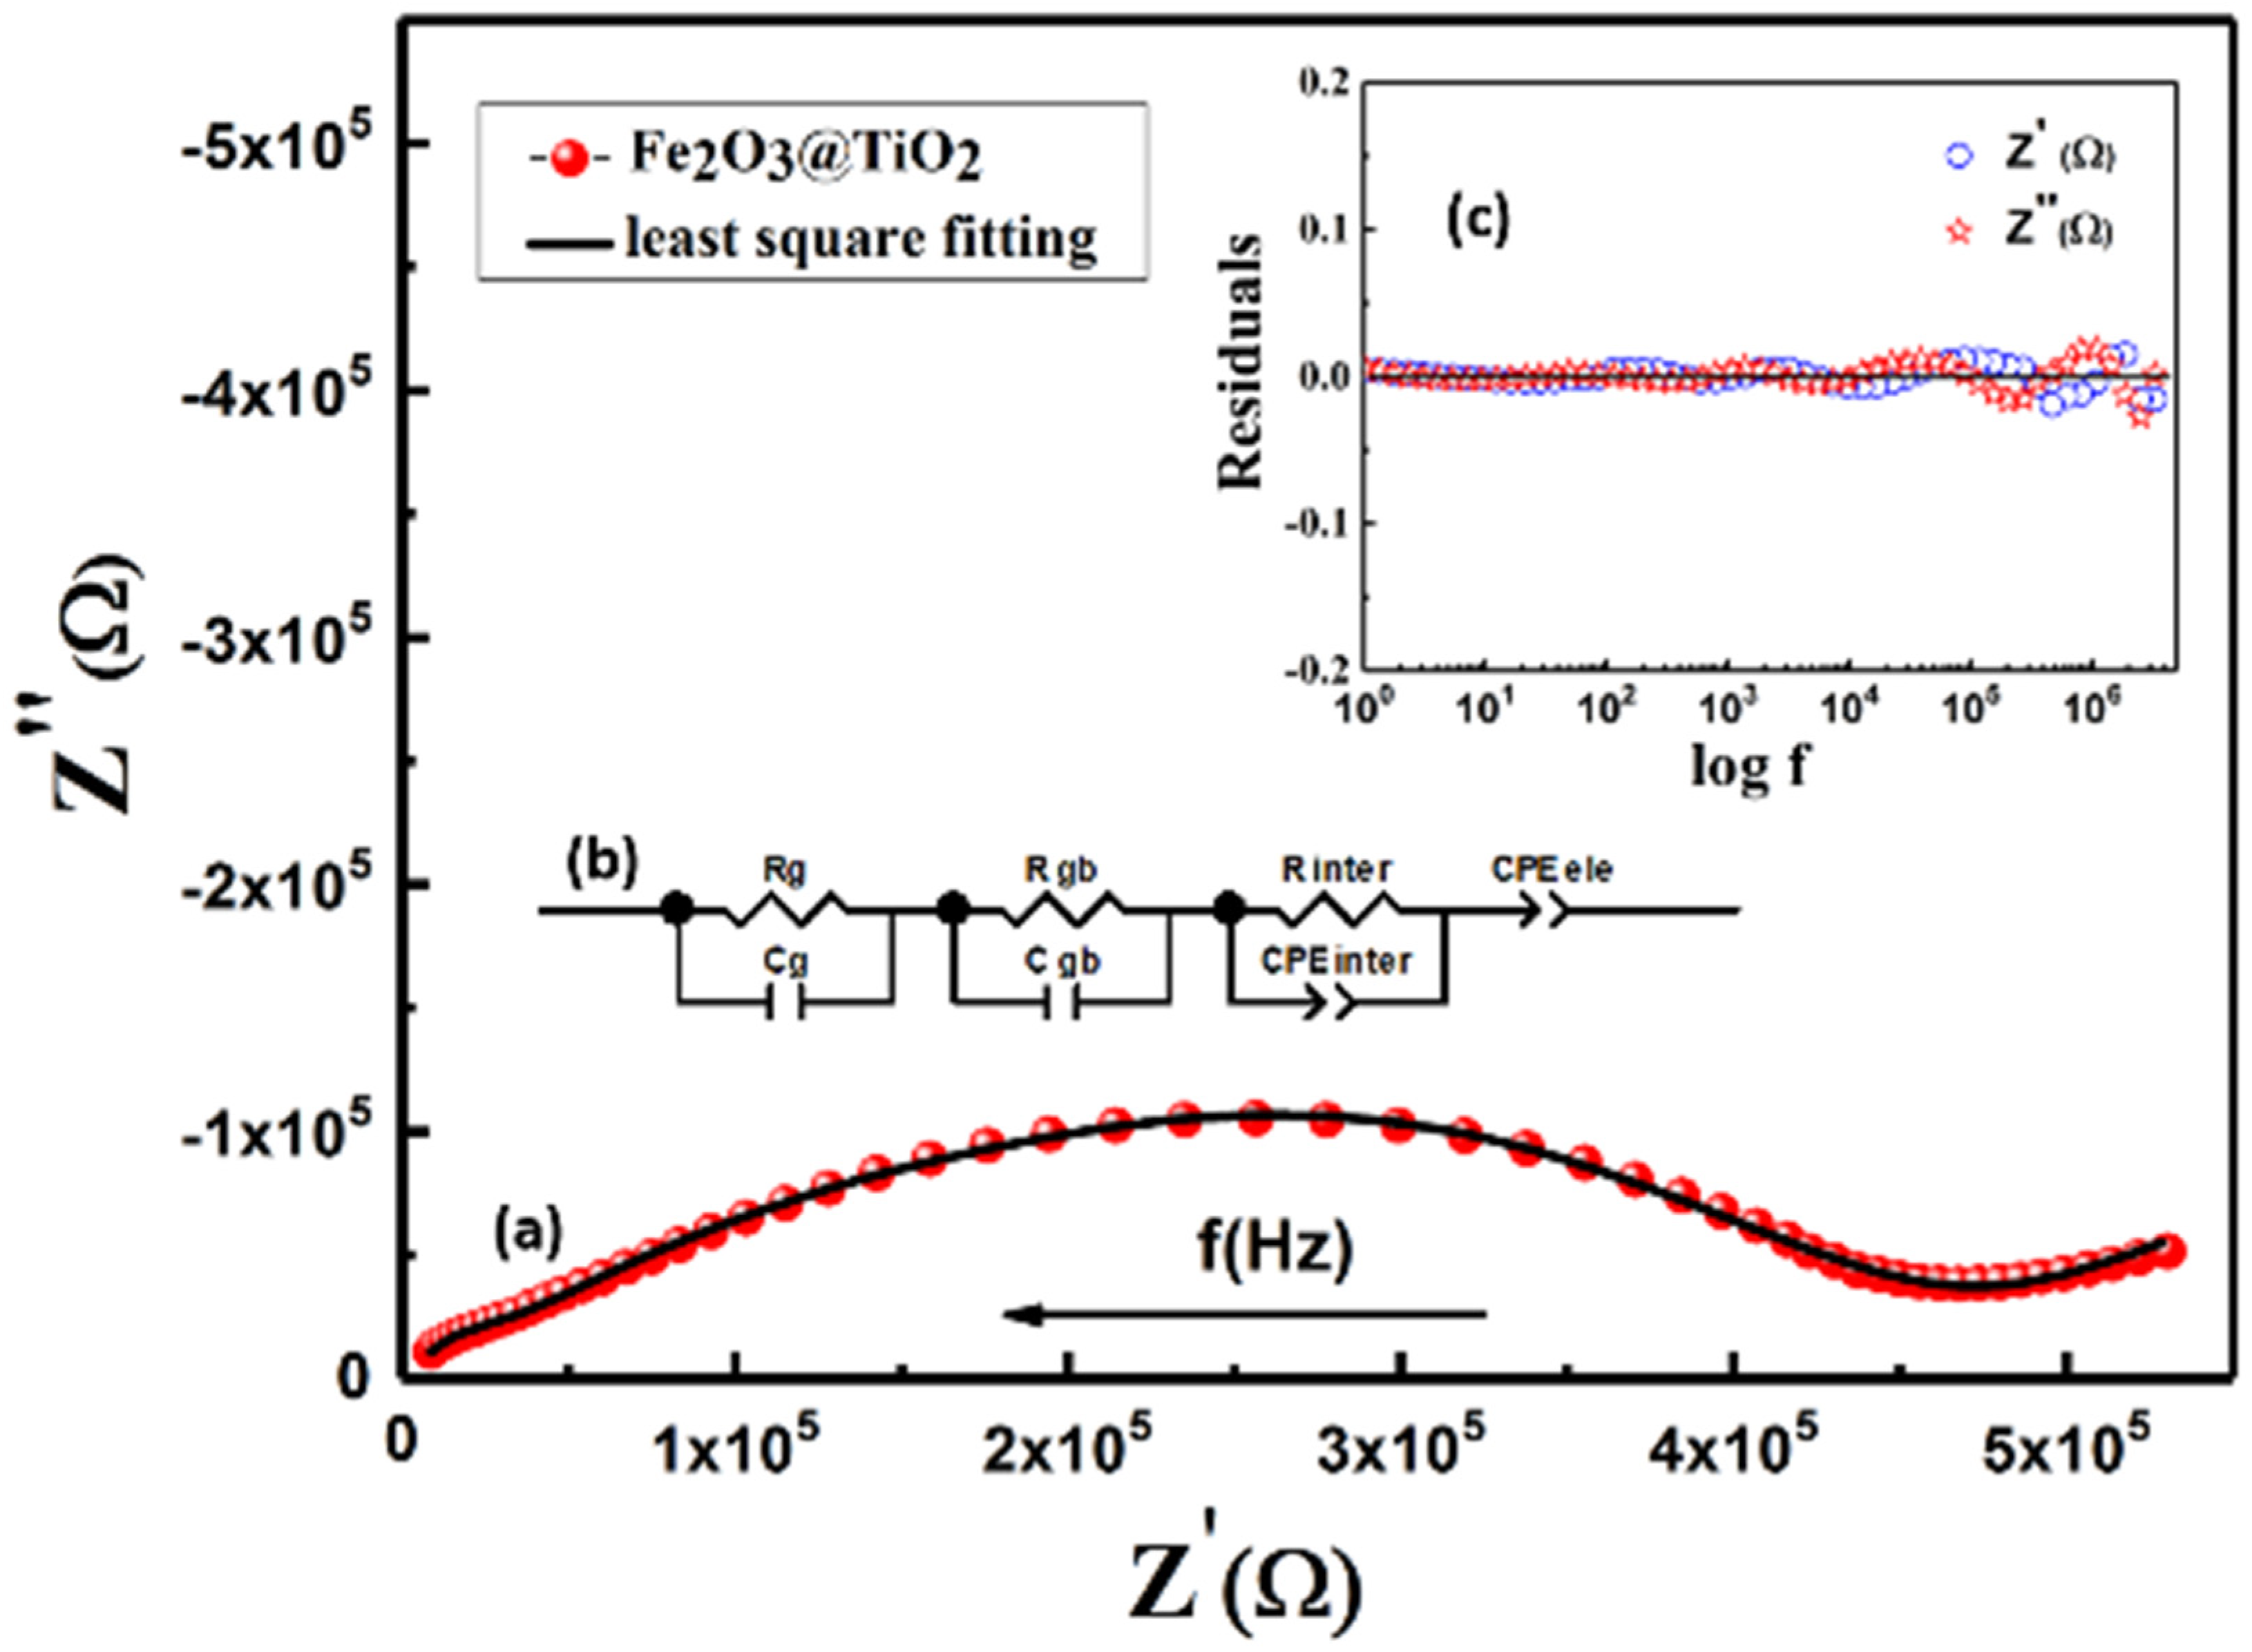
4.5. Impedance Spectroscopy
5. Conclusions
Author Contributions
Funding
Institutional Review Board Statement
Informed Consent Statement
Data Availability Statement
Acknowledgments
Conflicts of Interest
References
- Padmanabhan, N.T.; Thomas, N.; Louis, J.; Methew, D.T.; Ganguly, P.; Pillai, S.C. Graphene coupled TiO2 Photocatalysts for environmental applications: A review. Chemosphere 2021, 271, 129506. [Google Scholar] [CrossRef] [PubMed]
- Serga, V.; Burve, R.; Krumina, A.; Romanova, M.; Kotomin, E.A.; Popov, A.I. Extraction–Pyrolytic Method for TiO2 Polymorphs Production. Crystals 2021, 11, 431. [Google Scholar] [CrossRef]
- Verchere, A.; Cottrino, S.; Fantozzi, G.; Mishra, S.; Gaudisson, T.; Blanchard, N.; Pailhes, S.; Daniele, S.; Floch, S.L. Effect of High Pressure Spark Plasma Sintering on the Densification of a Nb-Doped TiO2 Nanopowder. Ceramics 2020, 3, 507–520. [Google Scholar] [CrossRef]
- Kang, X.; Liu, S.; Dai, Z.; He, Y.; Song, X.; Tan, Z. Titanium Dioxide: From Engineering to Applications. Catalysts 2019, 9, 191. [Google Scholar] [CrossRef] [Green Version]
- Zhou, Z.; Yin, H.; Zhao, Y.; Zhang, J.; Li, Y.; Yuan, J.; Tang, J.; Wang, F. Synthesis of Magnetic α-Fe2O3/Rutile TiO2 Hollow Spheres for Visible-Light Photocatalytic Activity. Catalysts 2021, 11, 396. [Google Scholar] [CrossRef]
- Liu, J.; Xu, J.; Liu, Z.; Liu, X.; Che, R. Hierarchical magnetic core-shell nanostructures for microwave absorption: Synthesis, microstructure and property studies. Sci. China Chem. 2014, 57, 3–12. [Google Scholar] [CrossRef]
- Khan, H.; Swati, I. Fe3+-doped Anatase TiO2 with d-d Transition, Oxygen Vacancies and Ti3+ Centers: Synthesis, Characterization, UV-vis Photocatalytic and Mechanistic Studies. Ind. Eng. Chem. Res. 2016, 55, 6619–6633. [Google Scholar] [CrossRef]
- Wang, Y.; Jie, W.; Yang, C.; Wei, X.; Hao, J. Colossal Permittivity Materials as Superior Dielectrics for Diverse Applications. Adv. Funct. Mater. 2019, 29, 1808118. [Google Scholar] [CrossRef]
- Afqir, M.; Tachafine, A.; Fasquelle, D.; Elaatmani, M.; Carru, J.-C.; Zegzouti, A.; El Hammioui, M. Effect of the synthesis route on the structural and dielectric properties of SrBi1.8Y0.2Nb2O9 ceramics. Int. J. Miner. Metall. Mater. 2018, 25, 1304–1312. [Google Scholar] [CrossRef]
- Moniz, S.J.A.; Shevlin, S.A.; An, X.; Guo, Z.-X.; Tang, J. Fe2O3–TiO2 Nanocomposites for Enhanced Charge Separation and Photocatalytic Activity. Chem.-Eur. J. 2014, 20, 15571–15579. [Google Scholar] [CrossRef]
- Forster, M.; Potter, R.J.; Ling, Y.; Yang, Y.; Klug, D.R.; Li, Y.; Cowan, A.J. Oxygen Deficient α-Fe2O3 Photoelectrodes: A Balance Between Enhanced Electrical Properties and Trap-Mediated Losses. Chem. Sci. 2015, 6, 4009–4016. [Google Scholar] [CrossRef] [PubMed] [Green Version]
- Wang, J.; Gao, Z.; Li, Z.; Wang, B.; Yan, Y.; Liu, Q.; Mann, T.; Zhang, M.; Jiang, Z. Green synthesis of graphene nanosheets/ZnO composites and electrochemical properties. J. Solid State Chem. 2011, 184, 1421–1427. [Google Scholar] [CrossRef]
- Mindru, I.; Gingasu, D.; Culita, D.C.; Marinescu, G.; Patron, L. Magnetic ferrites: Design and synthesis. In Dekker Encyclopedia of Nanoscience and Nanotechnology; CRC Press: Boca Raton, FL, USA, 2014; Volume 7, pp. 2176–2189. [Google Scholar]
- Philip, D. Green synthesis of gold and silver nanoparticles using Hibiscus rosa sinensis. Phys. E Low-Dimens. Syst. Nanostruct. 2010, 42, 1417–1424. [Google Scholar] [CrossRef]
- Manikandan, A.; Sridhar, R.; Antony, S.A.; Ramakrishna, S. A simple aloe vera plant-extracted microwave and conventional combustion synthesis: Morphological, optical, magnetic and catalytic properties of CoFe2O4 nanostructures. J. Mol. Struct. 2014, 1076, 188–200. [Google Scholar] [CrossRef]
- Phumying, S.; Labuayai, S.; Swatsitang, E.; Amornkitbamrung, V.; Maensiri, S. Nanocrystalline spinel ferrite (MFe2O4, M = Ni, Co, Mn, Mg, Zn) powders prepared by a simple aloe vera plant-extracted solution hydrothermal route. Mater. Res. Bull. 2013, 48, 2060–2065. [Google Scholar] [CrossRef]
- Varma, R.S. Greener approach to nanomaterials and their sustainable applications. Curr. Opin. Chem. Eng. 2012, 1, 123–128. [Google Scholar] [CrossRef]
- Mohammadzadeh, V.; Barani, M.; Amiri, M.S.; Yazdi, M.E.T.; Hassanisaadi, M.; Rahdar, A.; Varma, R.S. Applications of plant based nanoparticles in nanomedicine: A revew. Sustain. Chem. Pharm. 2022, 25, 100606. [Google Scholar] [CrossRef]
- Yang, N.; Li, F.; Jian, T.; Liu, C.; Sun, H.; Wang, L.; Xu, H. Biogenic synthesis of silver nanoparticles using ginger (Zingiber officinale) extract and their antibacterial properties against aquatic pathogens. Acta Oceanol. Sin. 2017, 36, 95. [Google Scholar] [CrossRef]
- Mohammadinejad, R.; Karimi, S.; Iravani, S.; Vaerma, R.S. Plant derived nanostructures: Types and applications. Green Chem. 2016, 18, 20–52. [Google Scholar] [CrossRef]
- Reda, M.; Ashames, A.; Edis, Z.; Bloukh, S.; Bhandare, R.; Abu Sara, H. Green Synthesis of Potent Antimicrobial Silver Nanoparticles Using Different Plant Extracts and Their Mixtures. Processes 2019, 7, 510. [Google Scholar] [CrossRef] [Green Version]
- Das, K.; Bandyopadhyay, T.K. Effect of form of carbon on the microstructure of in situ synthesized TiC-reinforced iron-based composite. Mater. Lett. 2004, 58, 1877–1880. [Google Scholar] [CrossRef]
- Alias, R. The Effects of Sintering Temperature Variations on Microstructure Changes of LTCC Substrate. In Sintering of Ceramics–New Emerging Techniques; BoD–Books on Demand: Norderstedt, Germany, 2012. [Google Scholar]
- Saikumari, N.; Dev, S.M.; Dev, S.A. Effect of calcination temperature on the properties and applications of bio extract mediated titania nano particles. Sci. Rep. 2021, 11, 1734. [Google Scholar] [CrossRef] [PubMed]
- Carvalho, O.Q.; Adiga, P.; Murthy, S.K.; Fulton, J.L.; Gutiérrez, O.Y.; Stoerzinger, K.A. Understanding the Role of Surface Heterogeneities in Electrosynthesis Reactions. iScience 2020, 23, 101814. [Google Scholar] [CrossRef] [PubMed]
- Abouzari, M.S.; Berkemeier, F.; Schmitz, G.; Wilmer, D. On the physical interpretation of constant phase elements. Solid State Ion. 2009, 180, 922–927. [Google Scholar] [CrossRef]
- Djuric, Z.Z.; Aleksic, O.S.; Nikolic, M.V.; Labus, N.; Radovanovic, M.; Lukovic, M.D. Structural and electrical properties of sintered Fe2O3/TiO2 nanopowder mixtures. Ceram. Int. 2014, 40, 15131–15141. [Google Scholar] [CrossRef]
- Li, L.; Yan, J.; Wang, T.; Zhao, Z.-J.; Zhang, J.; Gong, J.; Guan, N. Sub-10 nm rutile titanium dioxide nanoparticles for efficient visible-light-driven photocatalytic hydrogen production. Nat. Commun. 2015, 6, 5881. [Google Scholar] [CrossRef] [Green Version]
- Zhang, H.; Wang, Y.; Wang, H.; Huo, D. Room-temperature magnetoresistive and magnetocaloric effect in La1−xBaxMnO3 compounds: Role of Griffiths phase with ferromagnetic metal cluster above Curie temperature. J. Appl. Phys. 2022, 131, 043901. [Google Scholar] [CrossRef]
- Singh, J.; Sharma, S.; Basu, S. Synthesis of Fe2O3/TiO2 monoliths for the enhanced degradation of industrial dye and pesticide via photo-Fenton catalysis. J. Photochem. Photobiol. A Chem. 2019, 376, 32–42. [Google Scholar] [CrossRef]
- Kumar, M.R.; Abebe, B.; Nagaswarupa, H.P.; Murthy, H.C.; Ravikumar, C.R.; Sabir, F.K. Enhanced photocatalytic and electrochemical performance of TiO2-Fe2O3 nanocomposite: Its applications in dye decolorization and as supercapacitors. Sci. Rep. 2020, 10, 1249. [Google Scholar] [CrossRef] [Green Version]
- Freund, H.J.; Roberts, M.W. Surface chemistry of carbon dioxide. Surf. Sci. Rep. 1996, 25, 225–273. [Google Scholar] [CrossRef] [Green Version]
- Chiorino, A.; Manzoli, M.; Menegazzo, F.; Signoretto, M.; Vindigni, F.; Pinna, F.; Boccuzzi, F. New insight on the nature of catalytically active gold sites: Quantitative CO chemisorption data and analysis of FTIR spectra of adsorbed CO and of isotopic mixtures. J. Catal. 2009, 262, 169–176. [Google Scholar] [CrossRef]
- Macdonald, J. Impedance Spectroscopy: Emphasizing Solid Materials and Systems. Appl. Opt. 1989, 28, 1083. [Google Scholar]
- Barsukov, Y.; Macdonald, J. Impedance Spectroscopy: Theory, Experiment, and Applications; John Wiley &Sons, Inc.: Hoboken, NJ, USA, 2005. [Google Scholar]
- Muccillo, R. Impedance spectroscopy analysis of zirconia:8 mol% yttria solid electrolytes with graphite pore former. J. Mater. Res. 2009, 24, 1780–1784. [Google Scholar] [CrossRef]
- Akiya, M.; Nakamura, H. Low ohmic contact to silicon with a magnesium/aluminum layered metallization. J. Appl. Phys. 1986, 69, 1596. [Google Scholar] [CrossRef]
- Irvine, J.T.S.; Sinclair, D.C.; West, A.R. Electroceramics: Characterization by Impedance Spectroscopy. Adv. Mater. 1990, 2, 132–138. [Google Scholar] [CrossRef]
- Jaiswal, N.; Kumar, D.; Upadhyay, S.; Parkash, O. High electrical conductivity of nanocomposites based on Ce0.82Sm0.16Sr0.02O1.90 and (Li/Na)2CO3 for low temperature solid oxide fuel cells. Ceram. Int. 2016, 42, 9004–9010. [Google Scholar] [CrossRef]
- Upadhyay, S.; Kumar, D.; Parkash, O.M. Effect of composition on dielectric and electrical properties of the Sr1−xLaxTi1−xCoxO3 system. Bull. Mater. Sci. 1996, 19, 513–525. [Google Scholar] [CrossRef]
- Idrees, M.; Nadeem, M.; Atif, M.; Siddique, M.; Mehmood, M.; Hassan, M. Origin of colossal dielectric response in LaFeO3. Acta Mater. 2011, 59, 1339–1342. [Google Scholar] [CrossRef]
- Liu, J.; Duan, C.G.; Yin, W.G.; Mei, W.N.; Smith, R.W.; Hardy, J.R. Large dielectric constant and Maxwell-Wagner relaxation in Bi2/3Cu3Ti4O12. Phys. Rev. B 2004, 70, 144106. [Google Scholar] [CrossRef]
- Prasad, N.V.; Srinivas, K.; Kumar, G.S.; James, A.R. Impedance Measurements on TiO2–Fe2O3 Thin Films. Appl. Phys. A-Mater. Sci. Process. 2001, 72, 341–345. [Google Scholar] [CrossRef]
- Vendrell, X.; West, A. Electrical Properties of Yttria-Stabilized Zirconia, YSZ Single Crystal: Local AC and Long Range DC Conduction. J. Electrochem. Soc. 2018, 165, F966–F975. [Google Scholar] [CrossRef]


| Element | Weight % | Atomic % | σ |
|---|---|---|---|
| Fe | 63.5 | 33.33 | 0.6 |
| O | 33.2 | 63.64 | 0.6 |
| Ti | 3.3 | 3.03 | 0.2 |
| Total | 100% | 100% |
| Fitting Parameters | Fe2O3@TiO2 |
|---|---|
| Rg (Ω) | 1.1 × 10⁴ |
| Rgb (Ω) | 4.03 × 10⁵ |
| Rsurface (Ω) | 4.02 × 10⁴ |
| Cg (F) | 14.5 × 10⁻¹² |
| Cgb (F) | 1.45 × 10⁻¹⁰ |
| Csurface (F) | 2.95 × 10⁻⁹ |
| Ce (F) | 4.8 × 10⁻⁶ |
| nsurface | 0.50923 |
| ne | 0.36214 |
Publisher’s Note: MDPI stays neutral with regard to jurisdictional claims in published maps and institutional affiliations. |
© 2022 by the authors. Licensee MDPI, Basel, Switzerland. This article is an open access article distributed under the terms and conditions of the Creative Commons Attribution (CC BY) license (https://creativecommons.org/licenses/by/4.0/).
Share and Cite
Sultan, H.; Sultan, A.; Orfali, R.; Perveen, S.; Ali, T.; Ullah, S.; Anas, H.M.; Ghaffar, S.; Al-Taweel, A.; Waqas, M.; et al. Green Synthesis and Investigation of Surface Effects of α-Fe2O3@TiO2 Nanocomposites by Impedance Spectroscopy. Materials 2022, 15, 5768. https://doi.org/10.3390/ma15165768
Sultan H, Sultan A, Orfali R, Perveen S, Ali T, Ullah S, Anas HM, Ghaffar S, Al-Taweel A, Waqas M, et al. Green Synthesis and Investigation of Surface Effects of α-Fe2O3@TiO2 Nanocomposites by Impedance Spectroscopy. Materials. 2022; 15(16):5768. https://doi.org/10.3390/ma15165768
Chicago/Turabian StyleSultan, Hira, Aeysha Sultan, Raha Orfali, Shagufta Perveen, Tahir Ali, Sana Ullah, Haji Muhammad Anas, Safina Ghaffar, Areej Al-Taweel, Muhammad Waqas, and et al. 2022. "Green Synthesis and Investigation of Surface Effects of α-Fe2O3@TiO2 Nanocomposites by Impedance Spectroscopy" Materials 15, no. 16: 5768. https://doi.org/10.3390/ma15165768
APA StyleSultan, H., Sultan, A., Orfali, R., Perveen, S., Ali, T., Ullah, S., Anas, H. M., Ghaffar, S., Al-Taweel, A., Waqas, M., Shahzad, W., Kareem, A., Liaqat, A., Ashraf, Z., Shahid, A., & Rauf, A. (2022). Green Synthesis and Investigation of Surface Effects of α-Fe2O3@TiO2 Nanocomposites by Impedance Spectroscopy. Materials, 15(16), 5768. https://doi.org/10.3390/ma15165768