
Description of Dynamic Recrystallization Behaviors and Grain Evolution Mechanisms during the Hot Forming Process for SAE 5137H Steel


Abstract
:1. Introduction
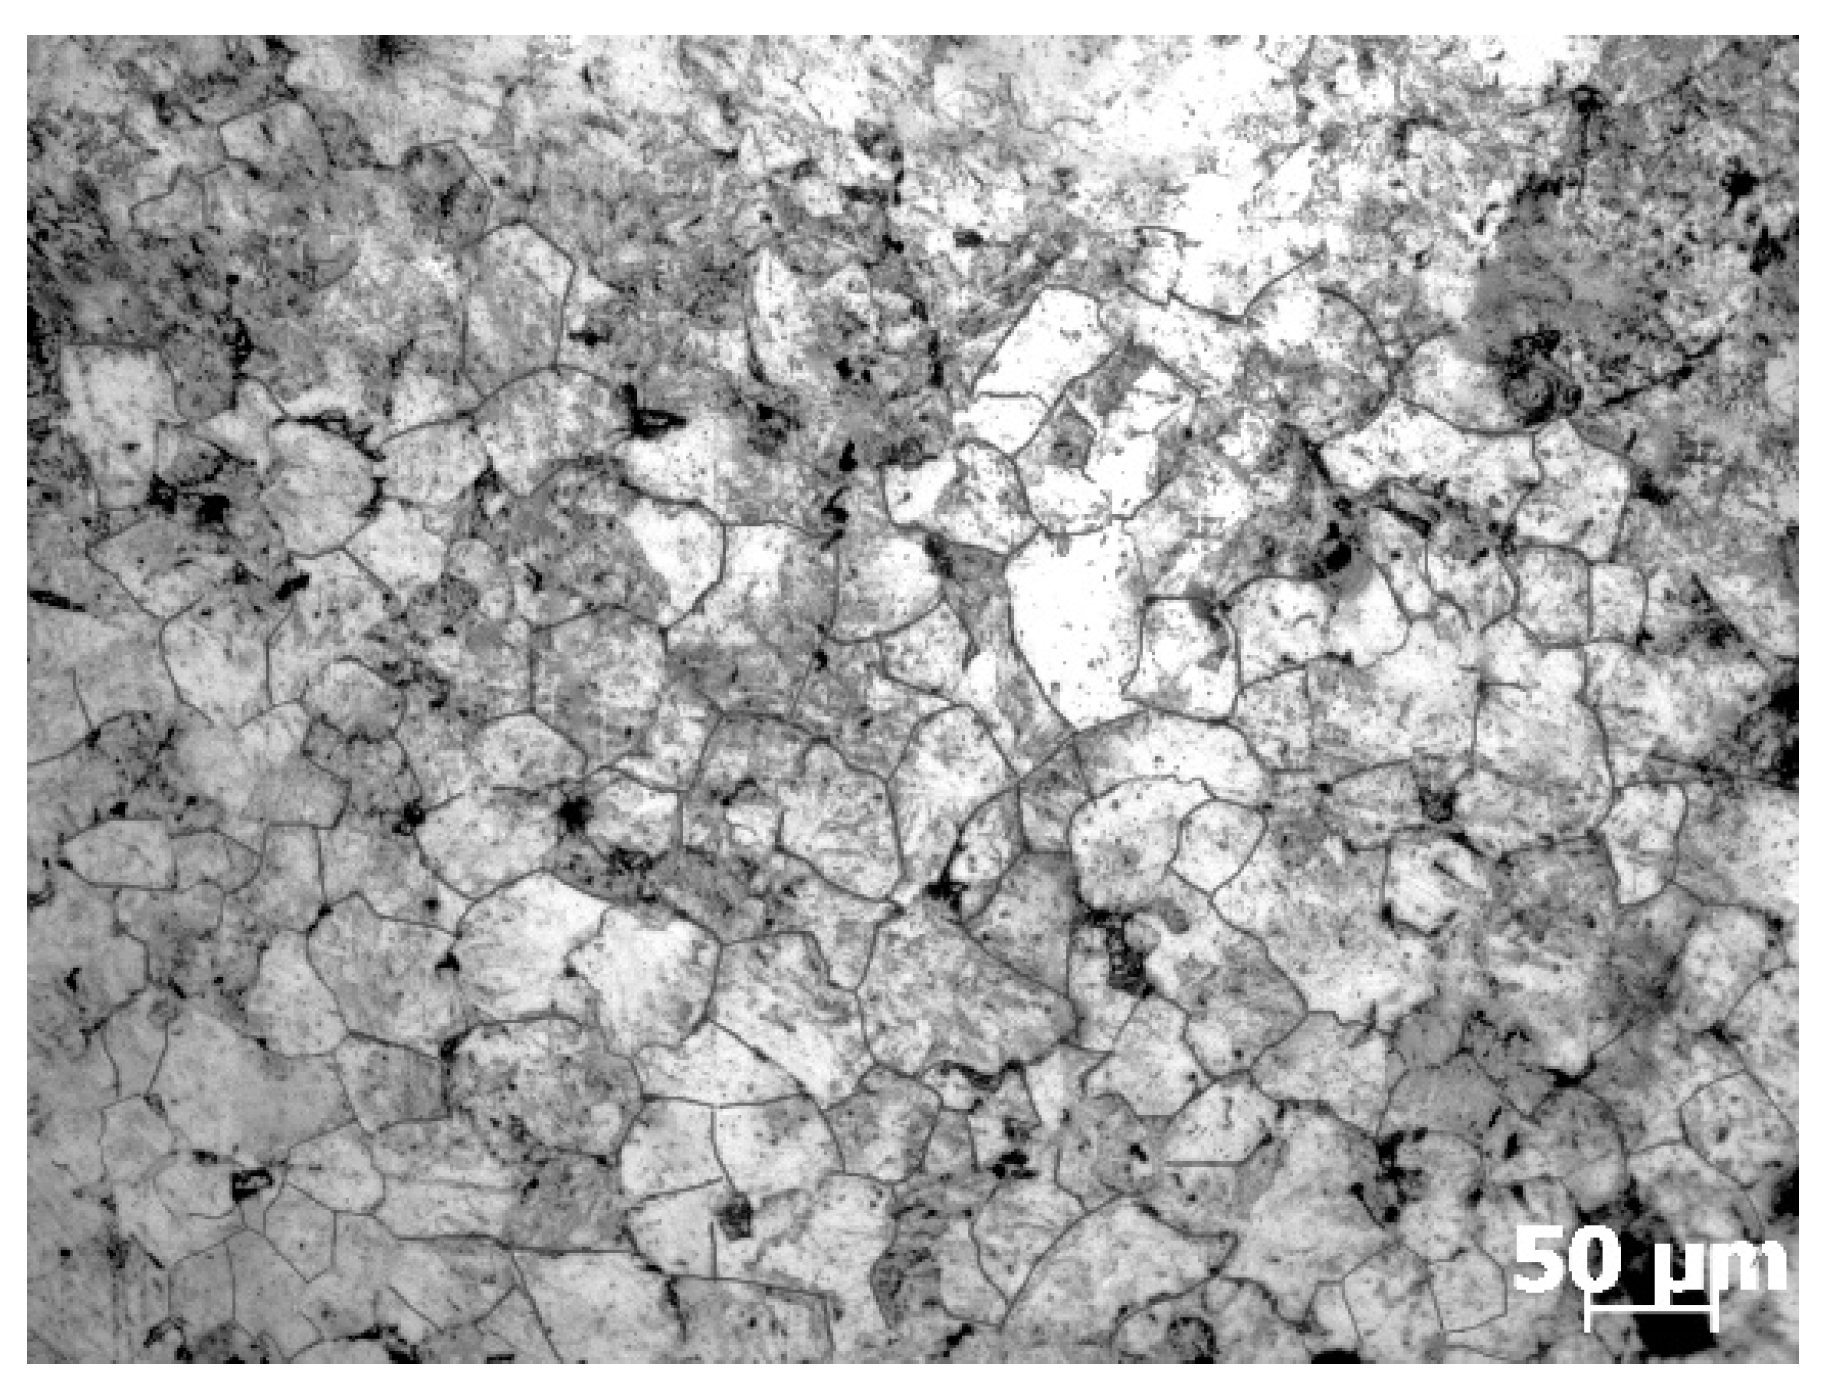
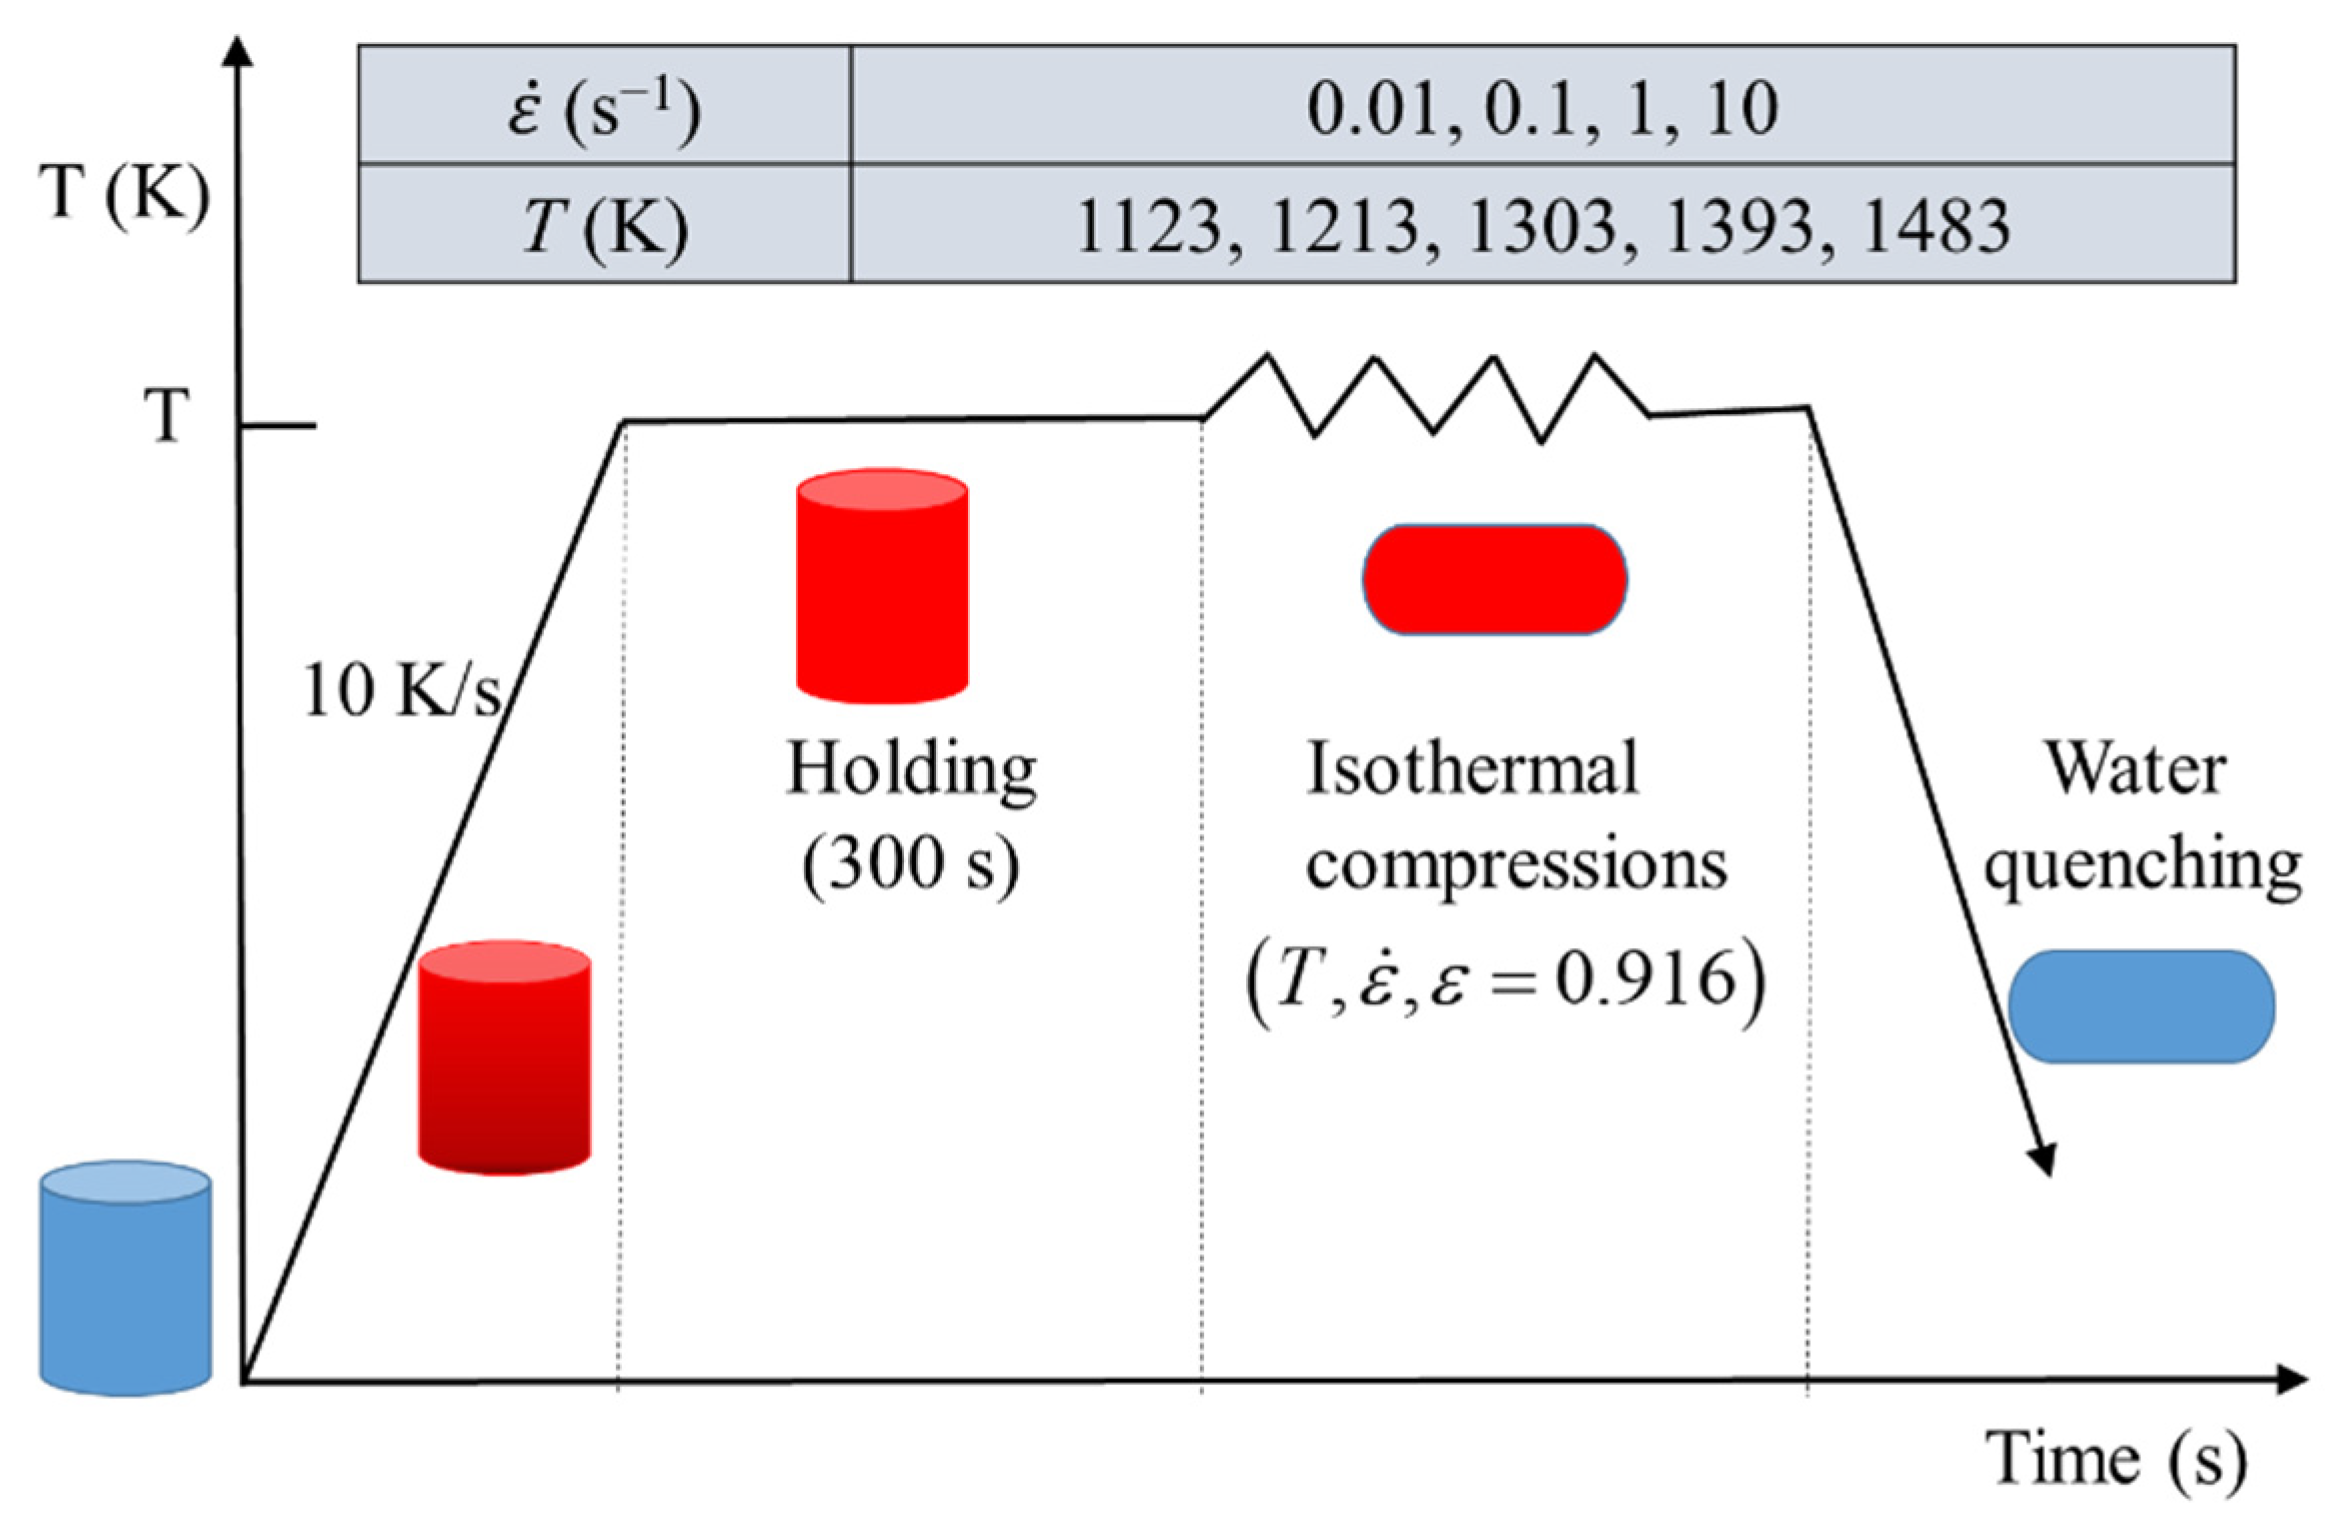
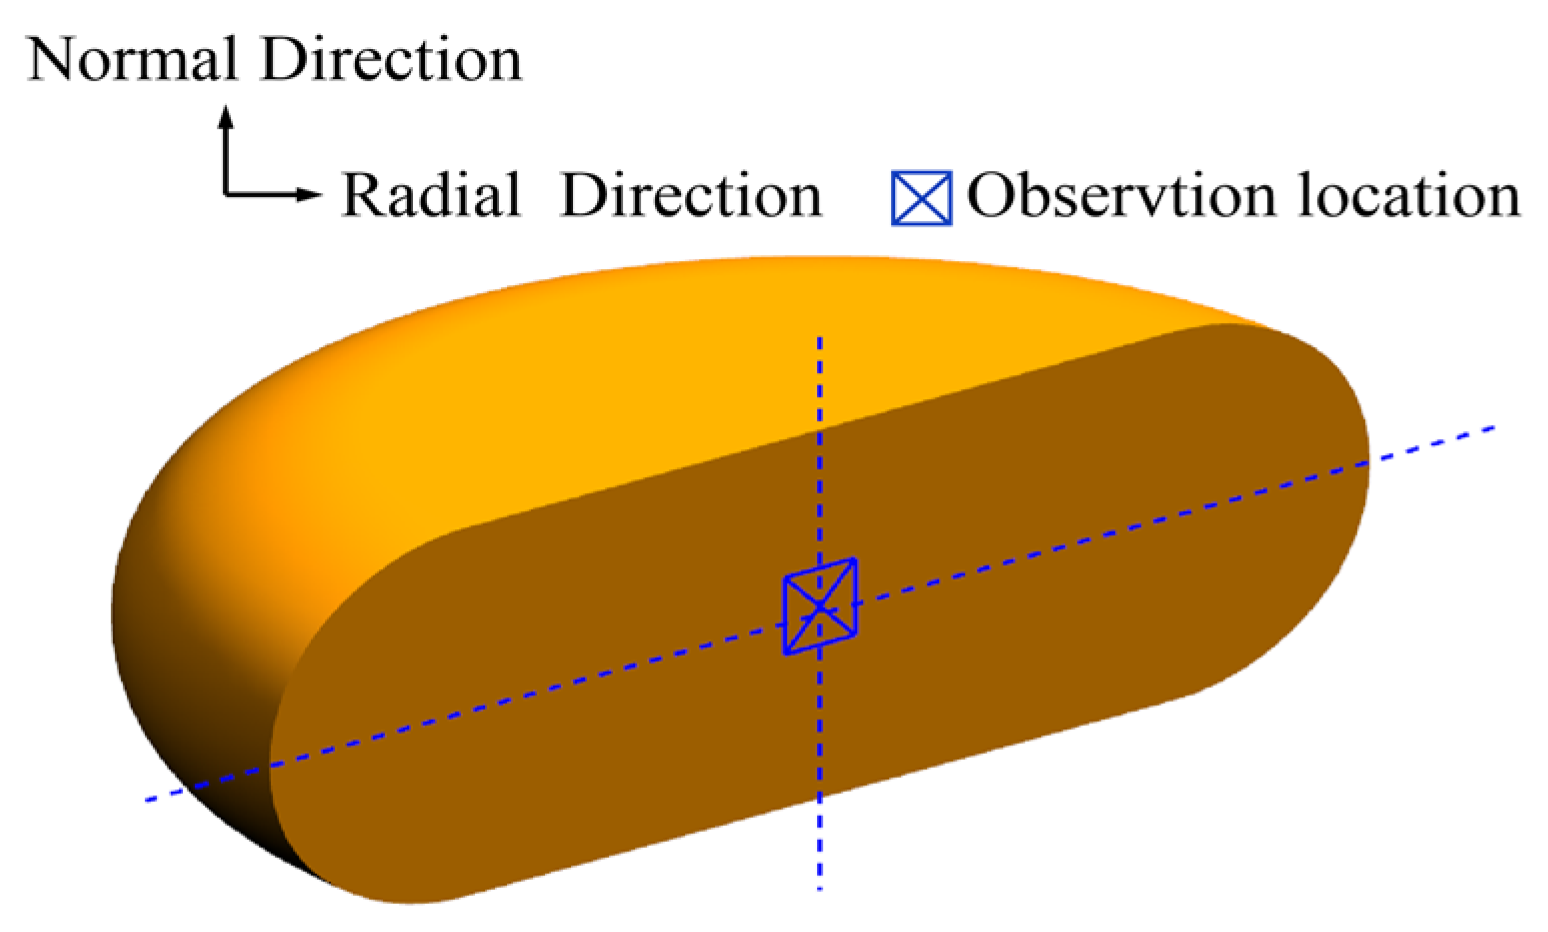
2. Experiment Procedure
3. Description of DRX Behaviors and Kinetics
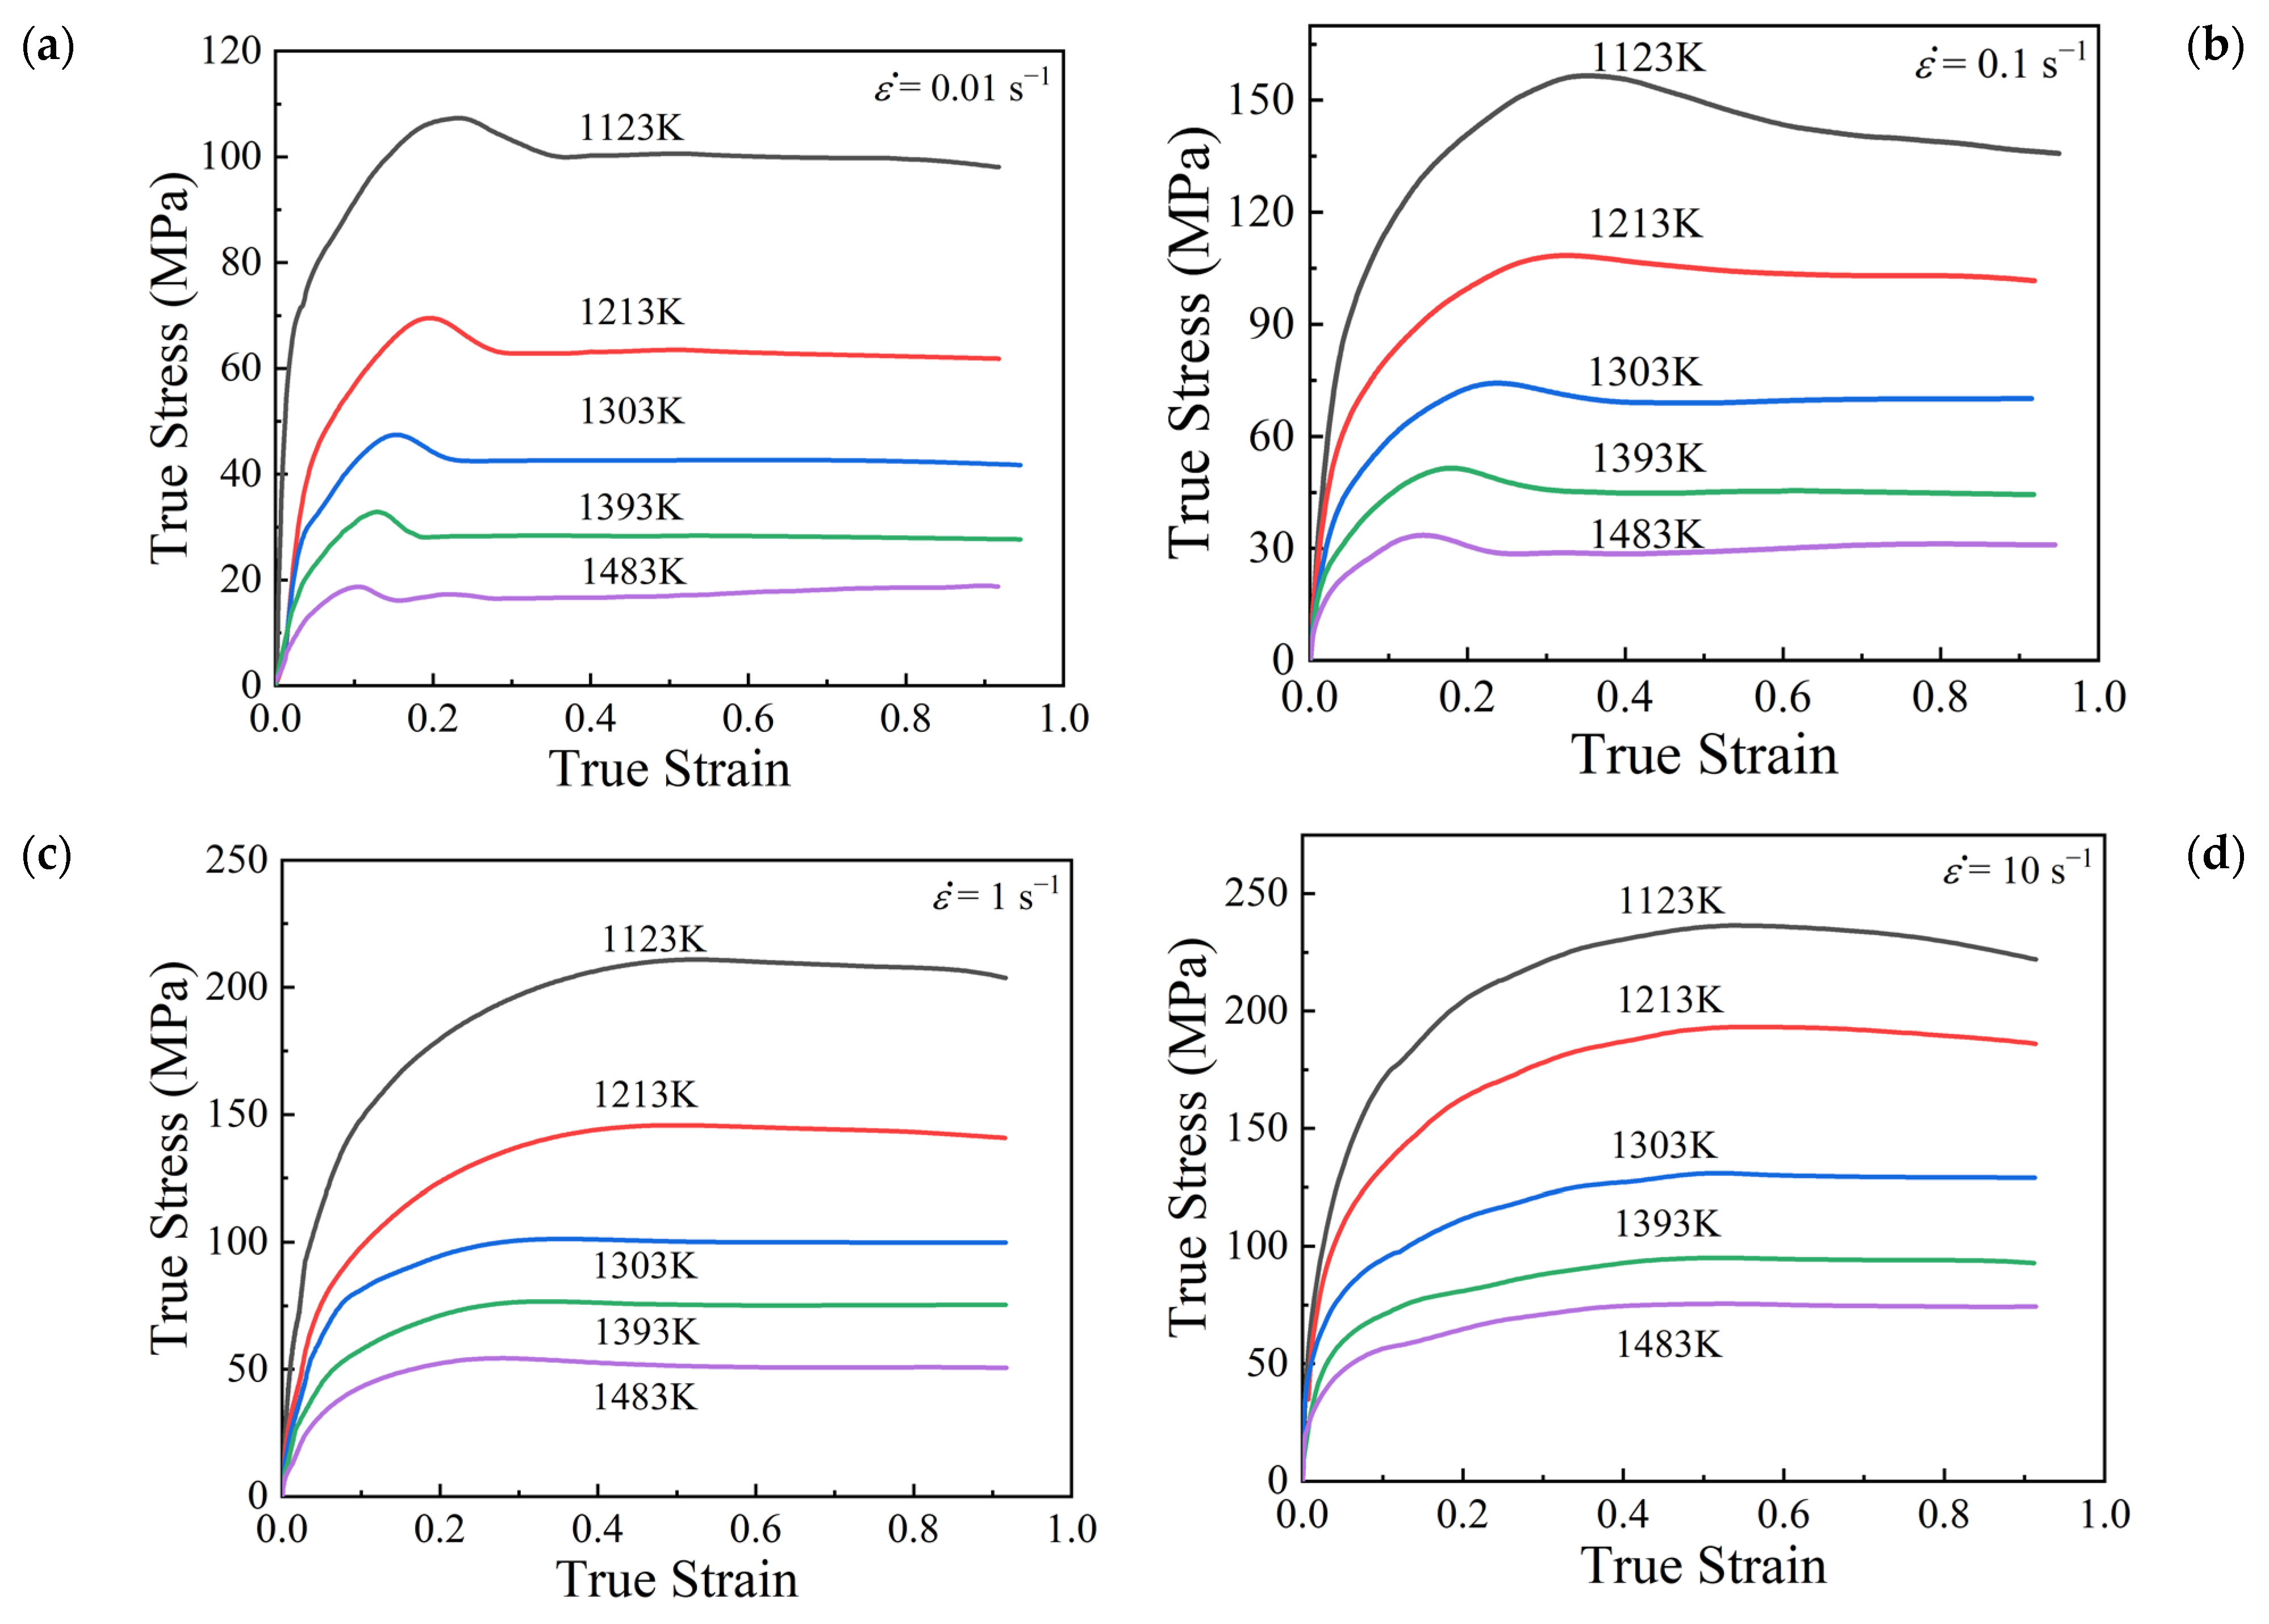
3.1. DRX Characteristics in Stress–Strain Curves
3.2. Modeling of DRX Kinetics
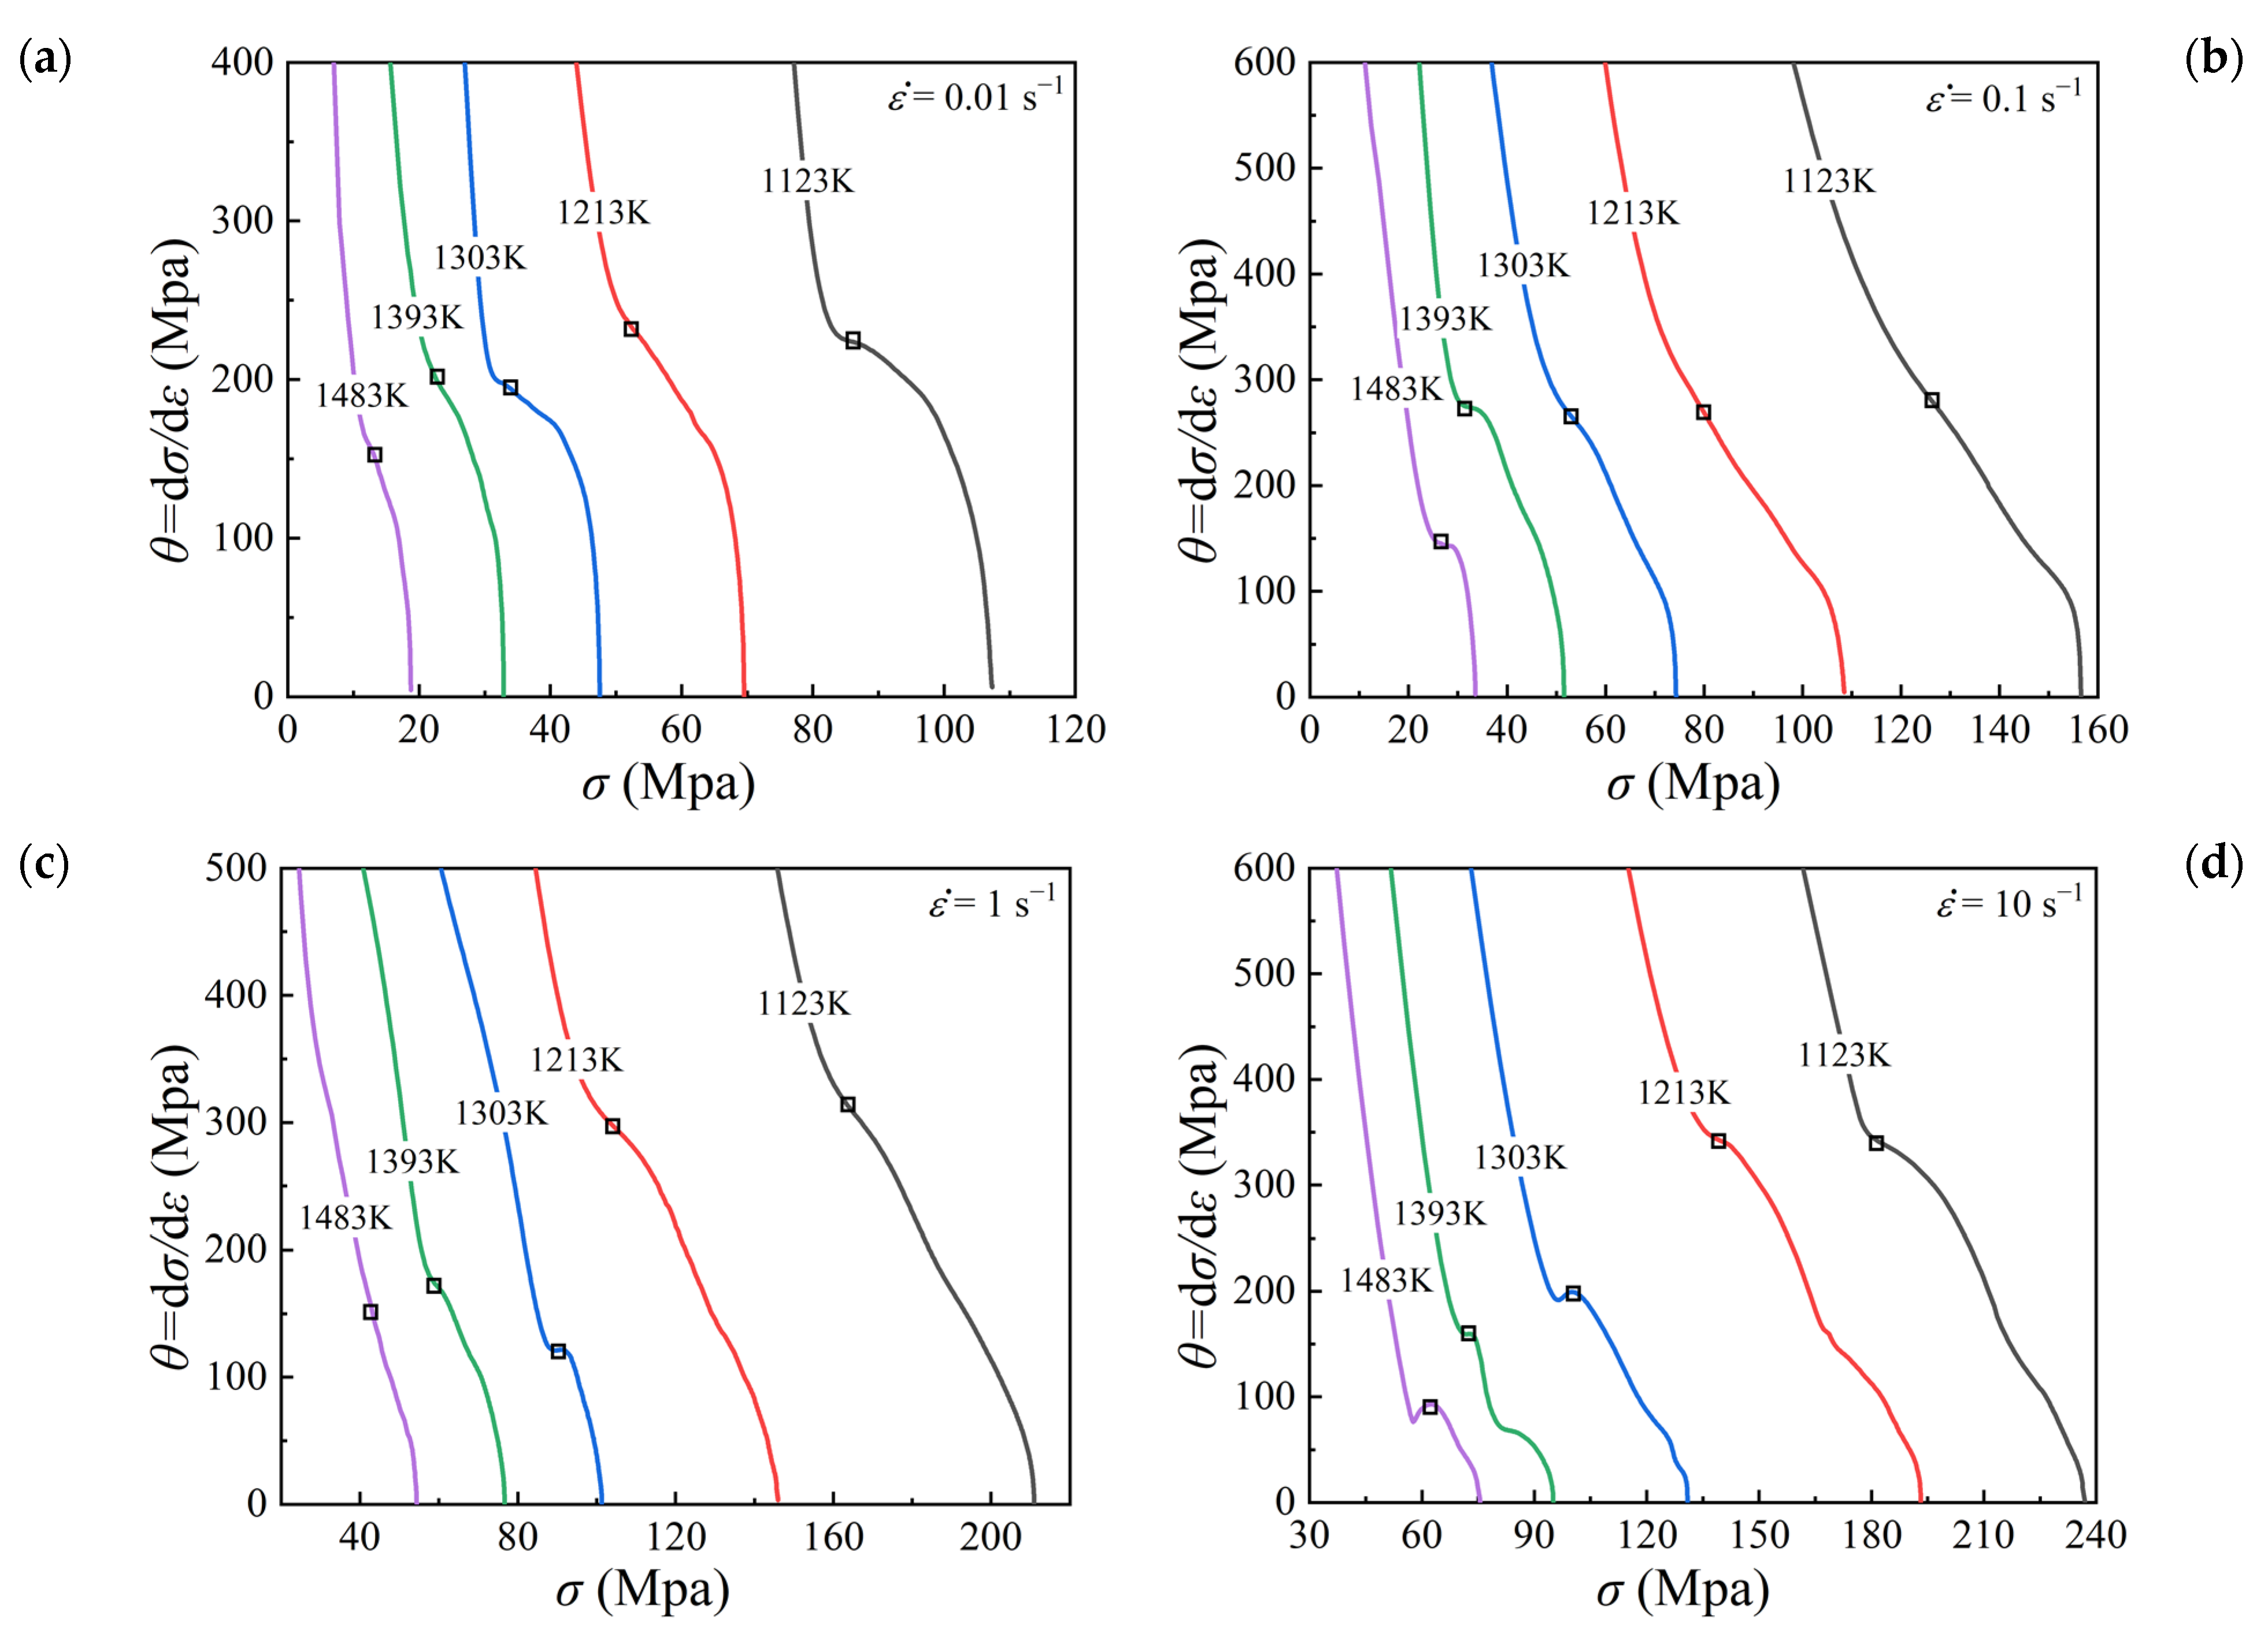
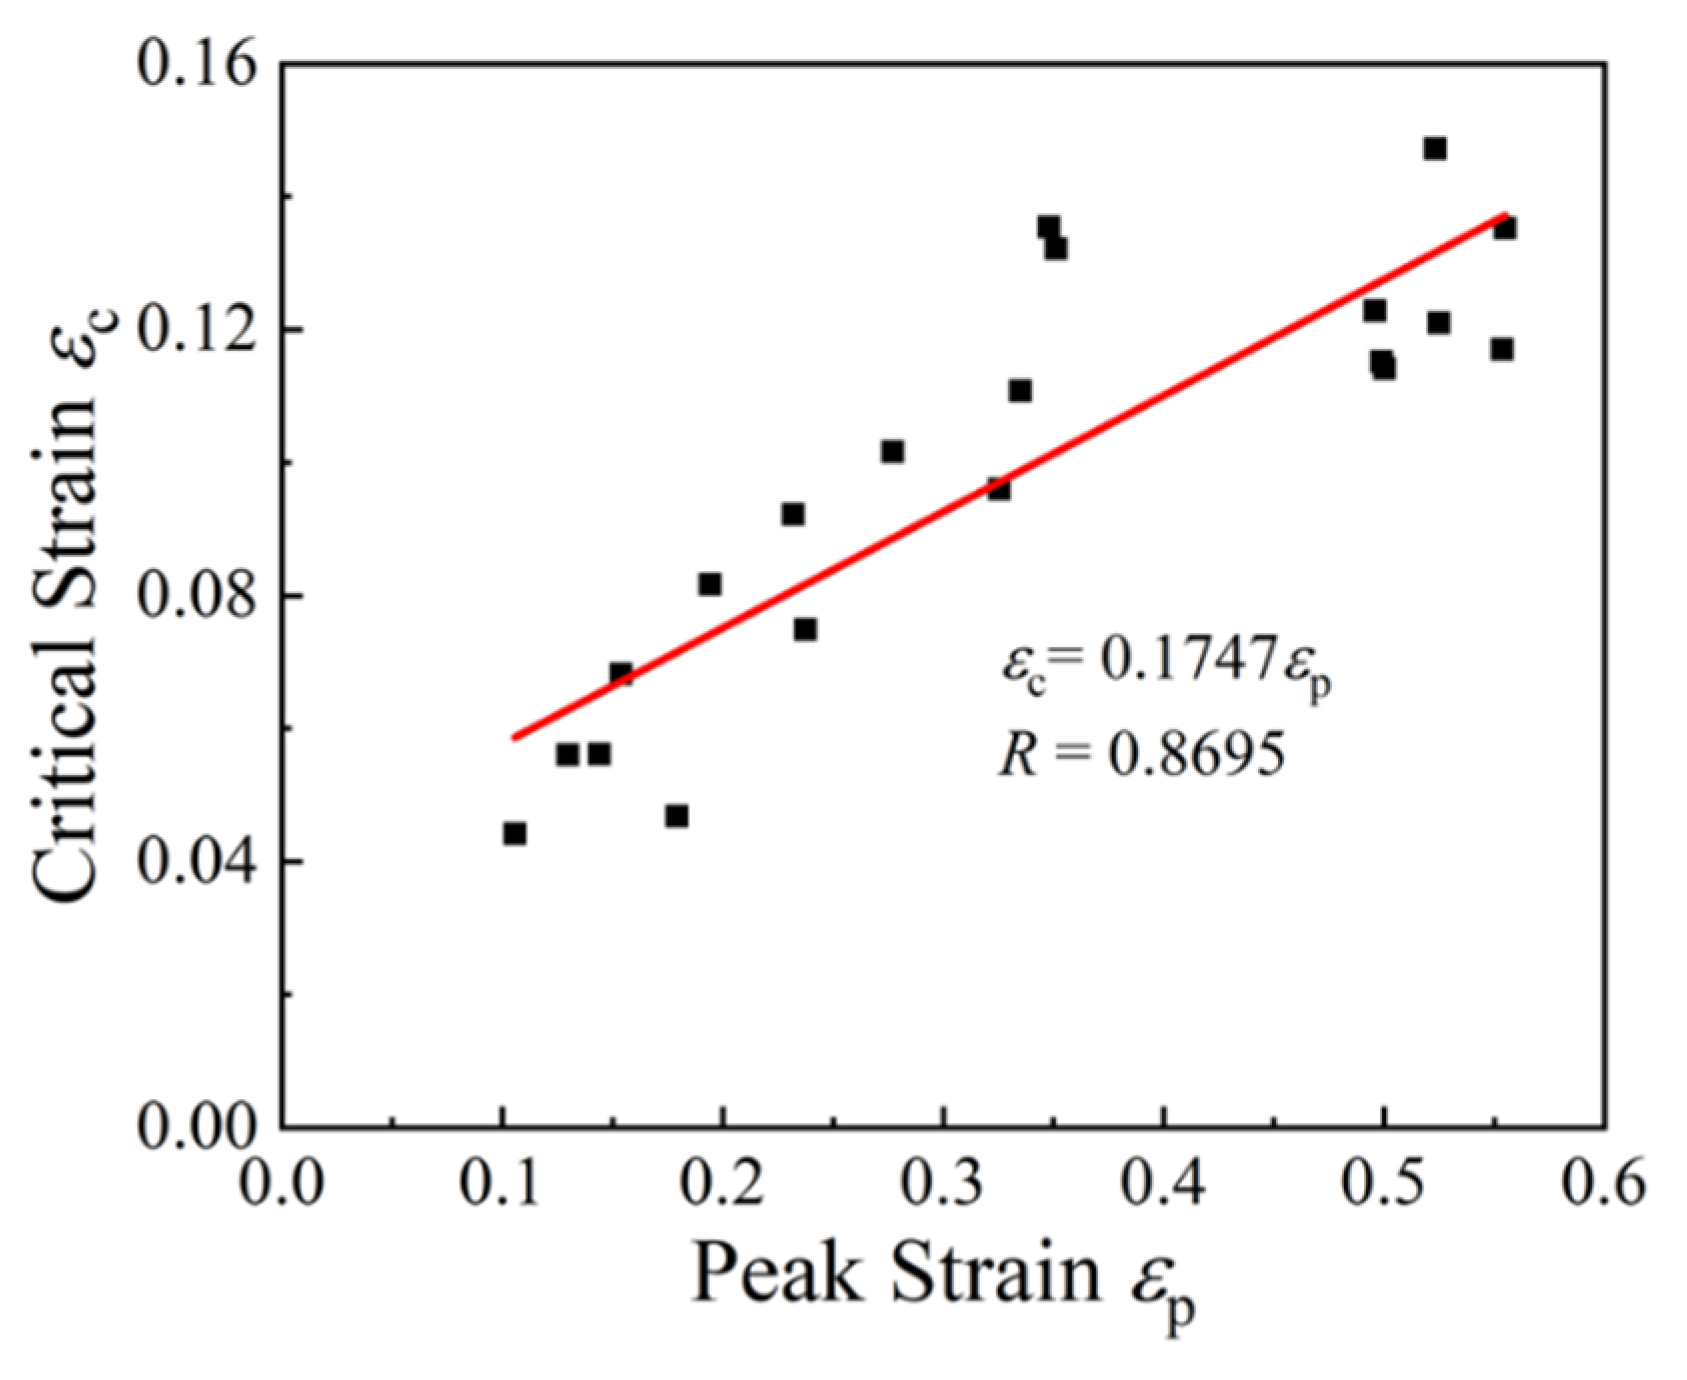
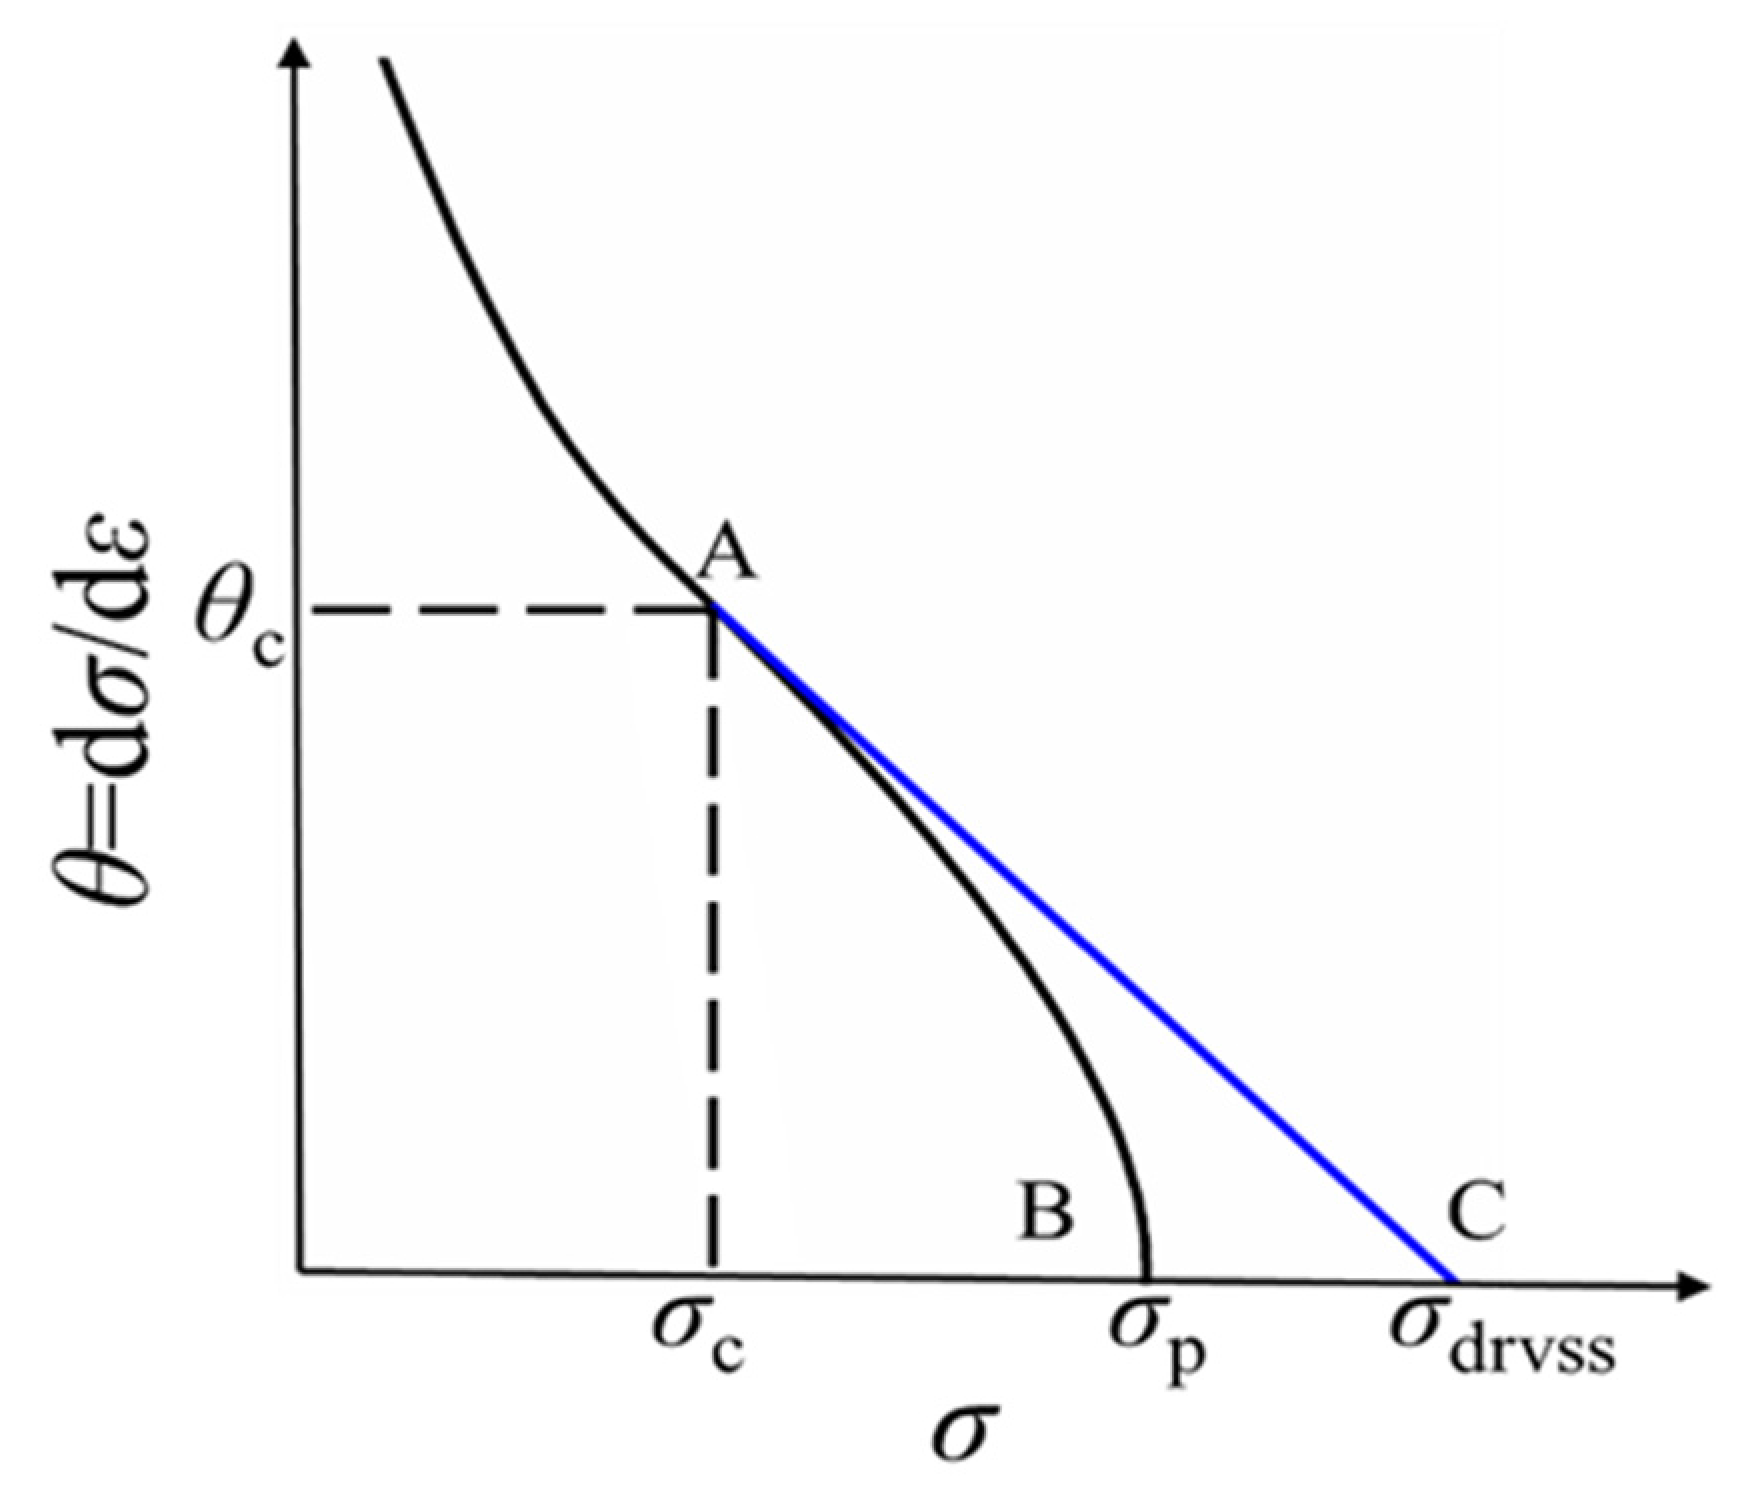
3.2.1. Initiation of DRX
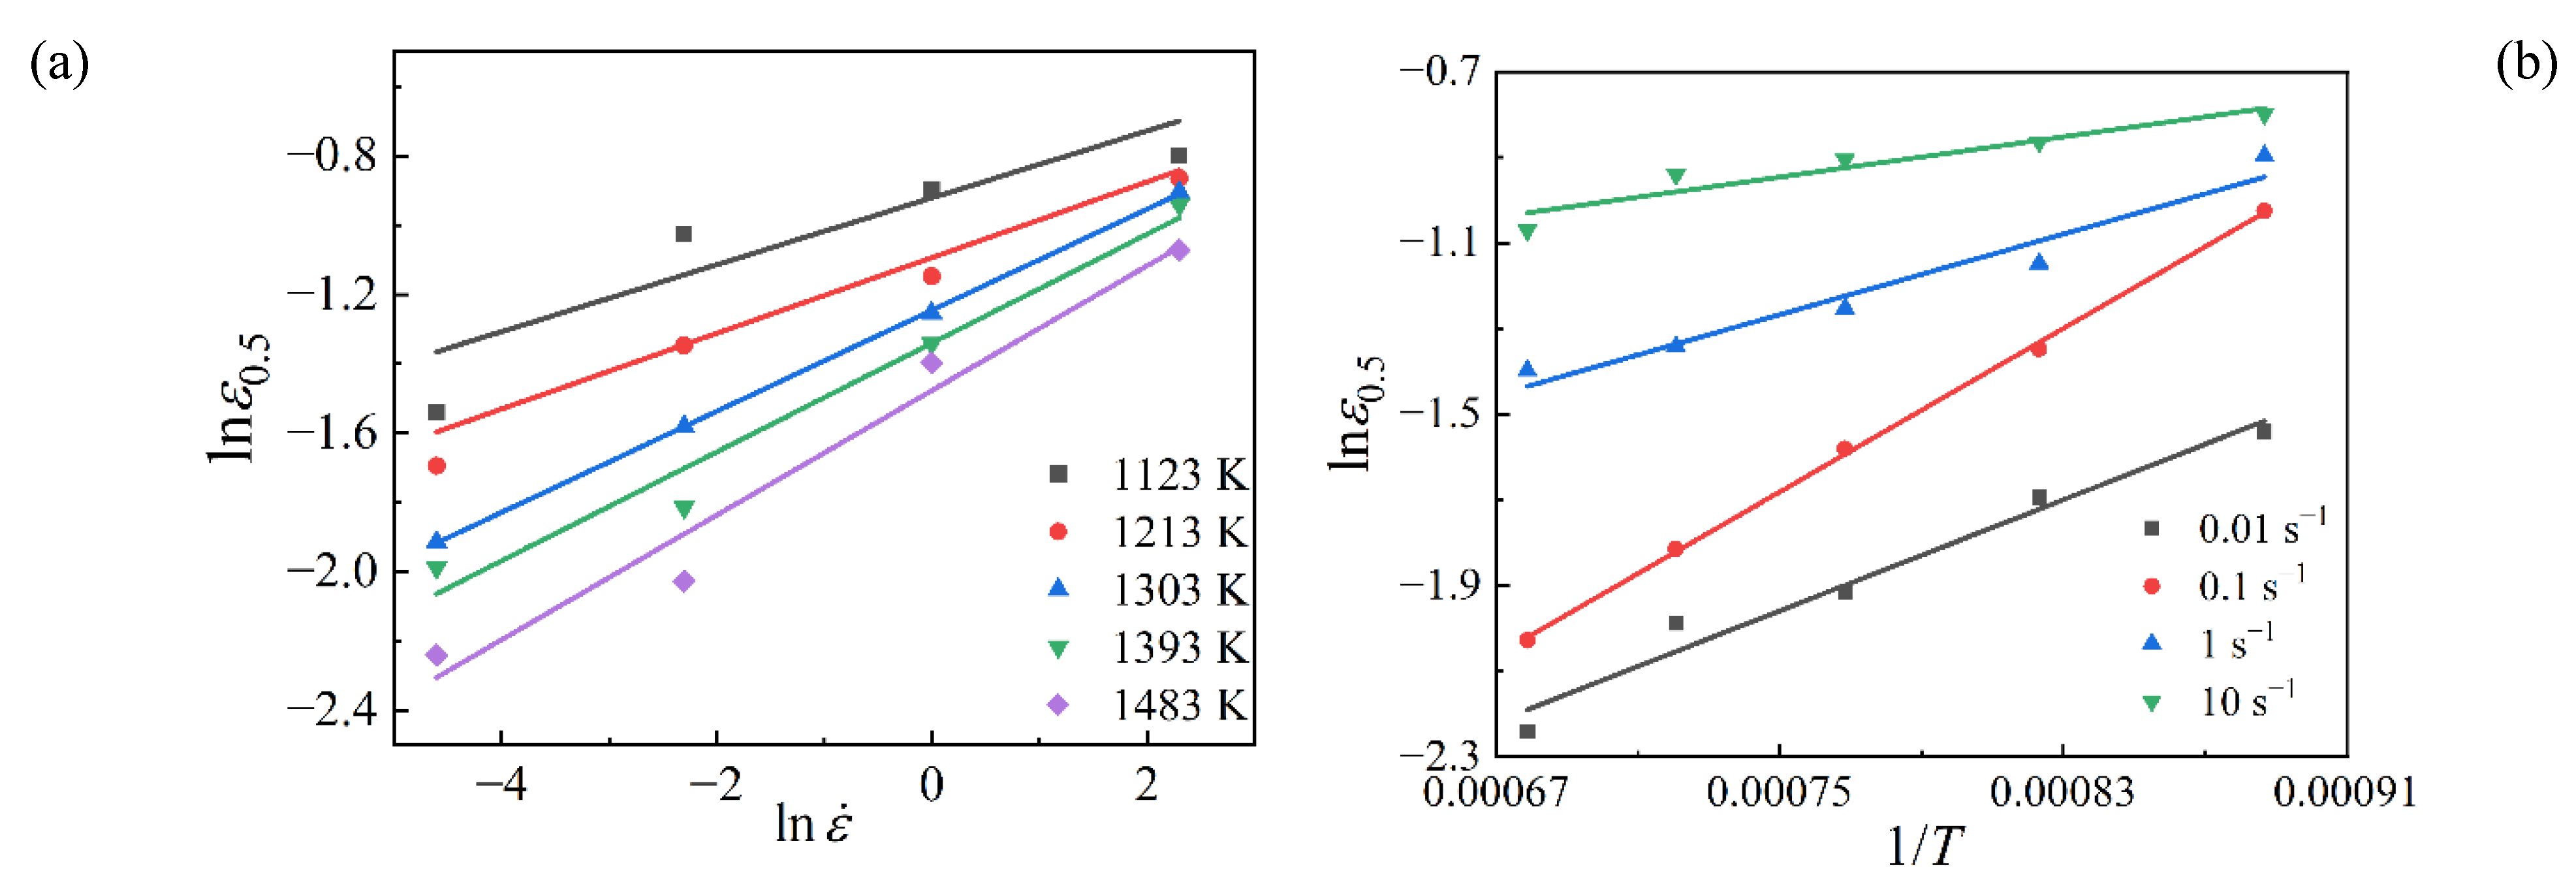
3.2.2. The Kinetics of DRX
3.2.3. The Grain Size Model of DRX
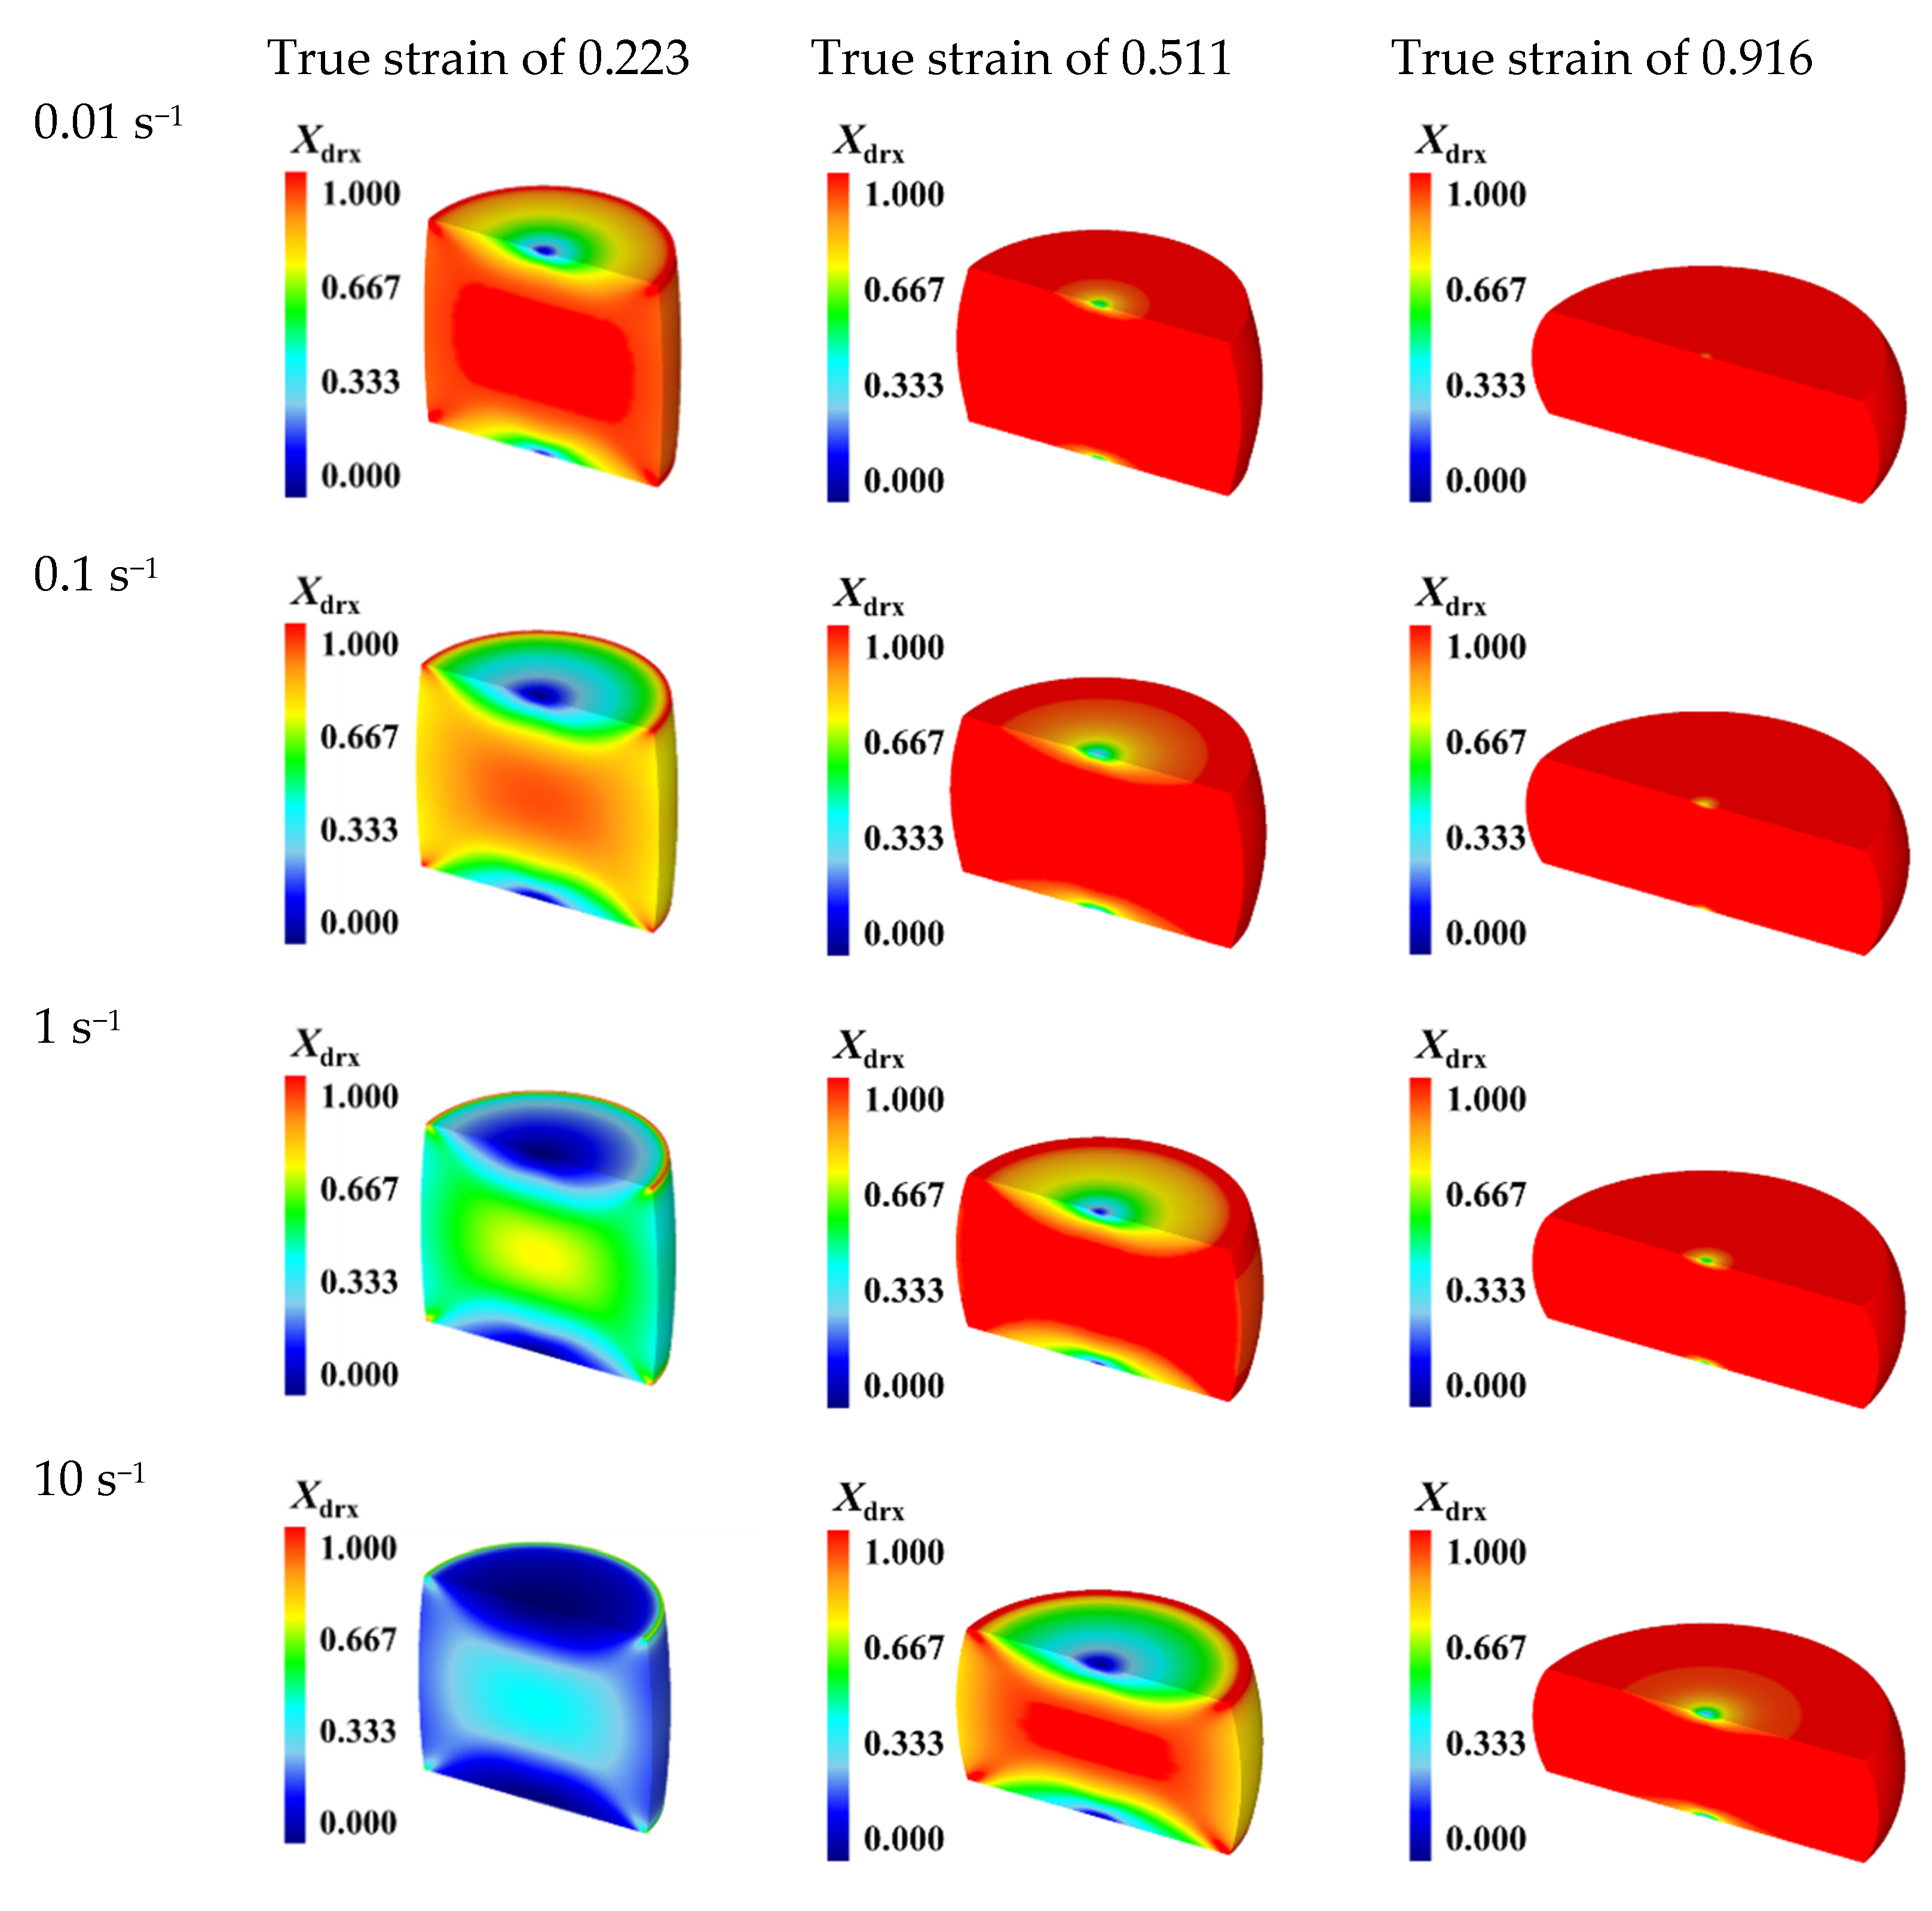
3.3. Description of DRX Behaviors
4. Description of Grain Evolution Mechanisms Involving DRX
4.1. Meso-Scale Modeling of Grain Evolution Mechanisms Involving DRX
4.1.1. Modeling on Dislocation Evolution
4.1.2. Grain Nucleation and Growth Models
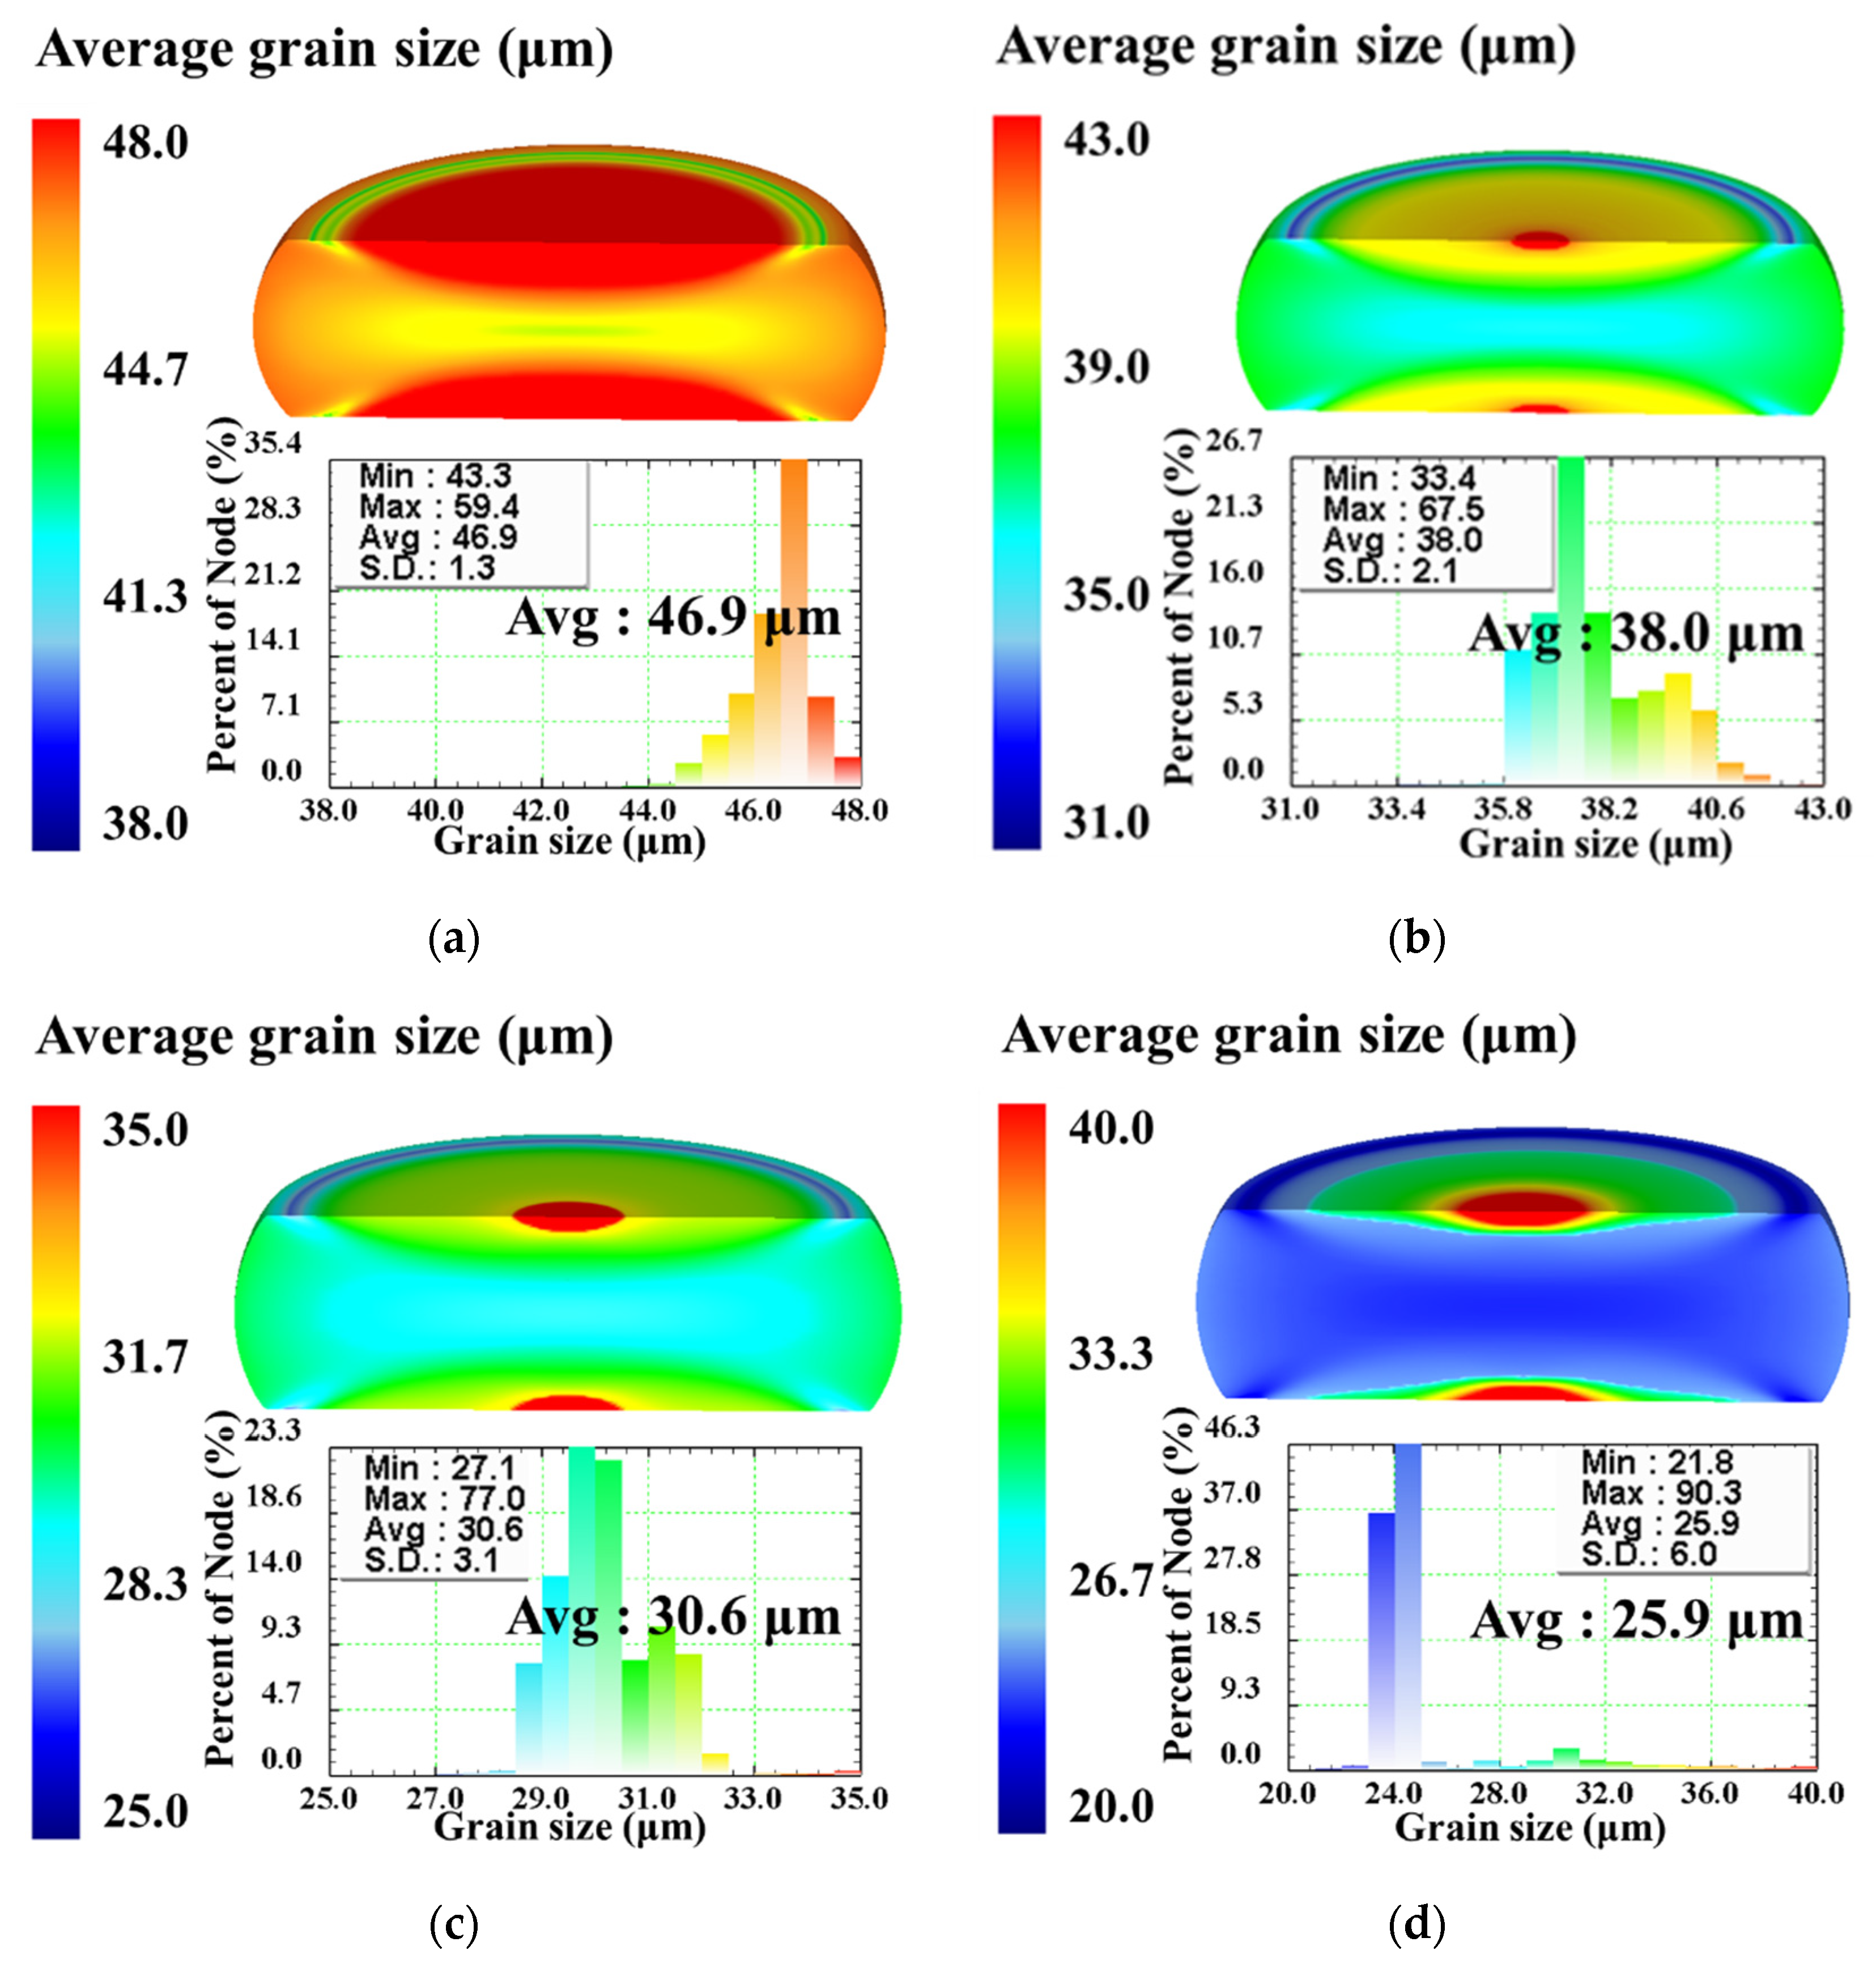
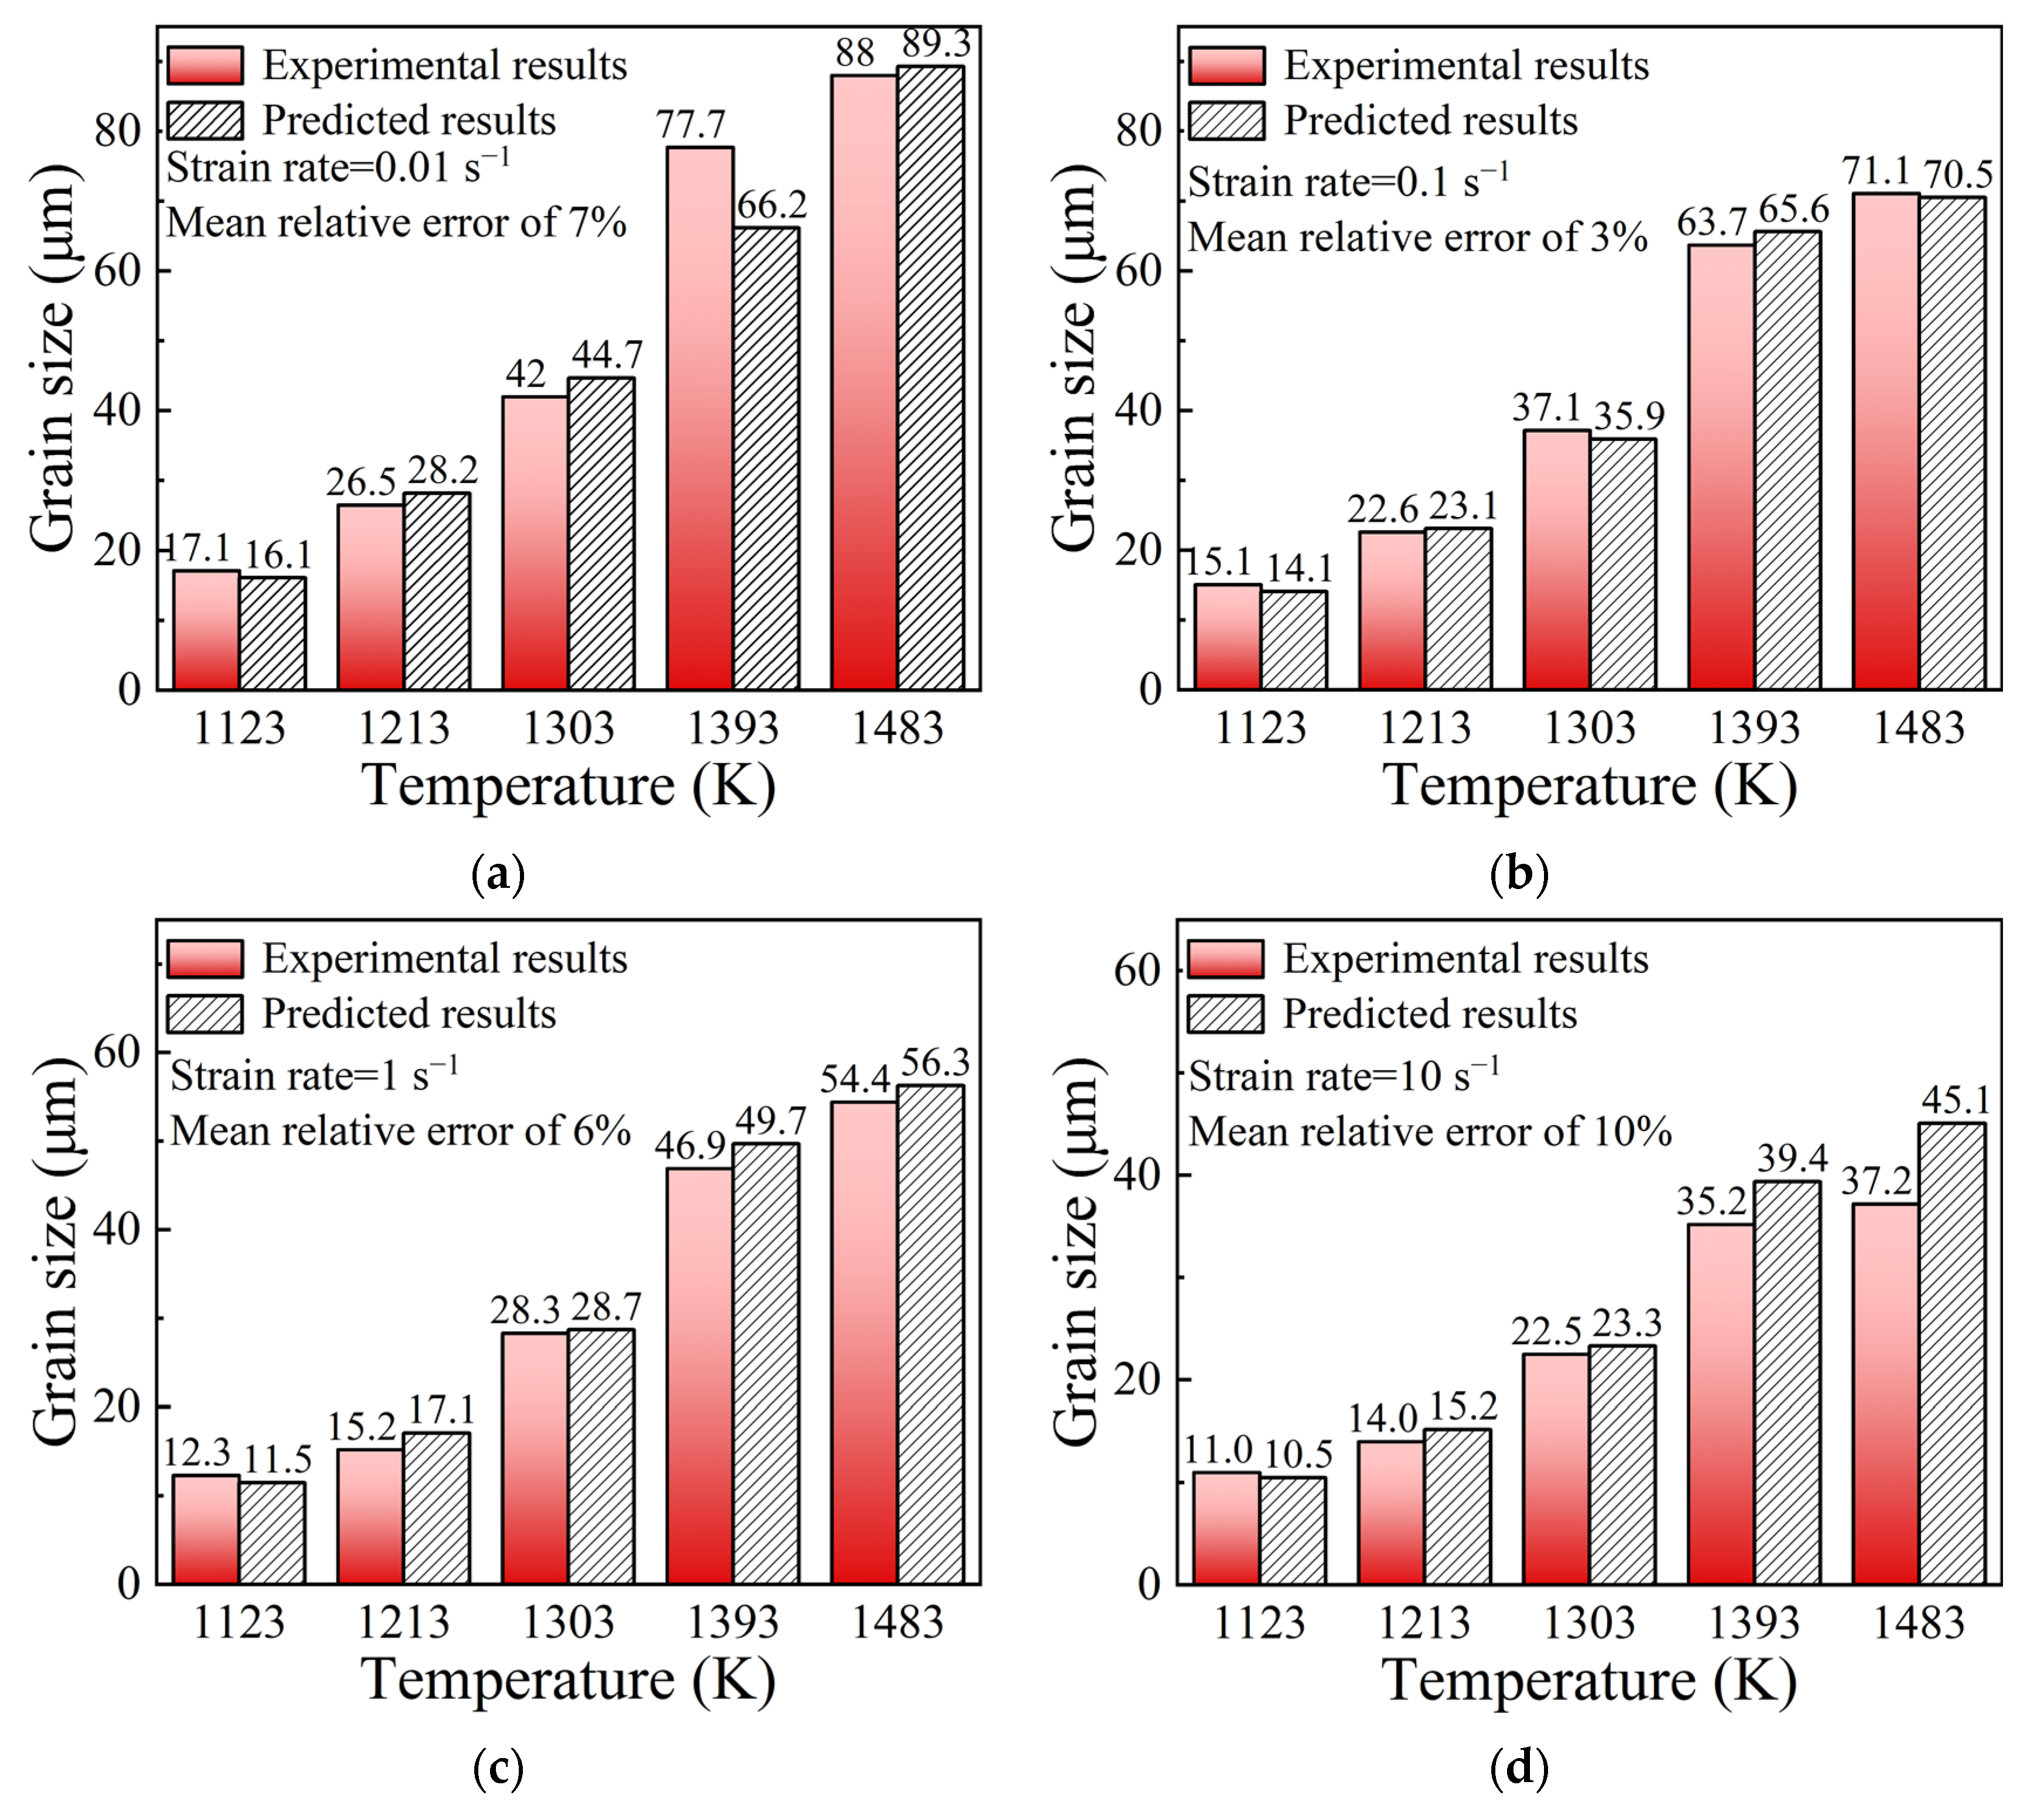
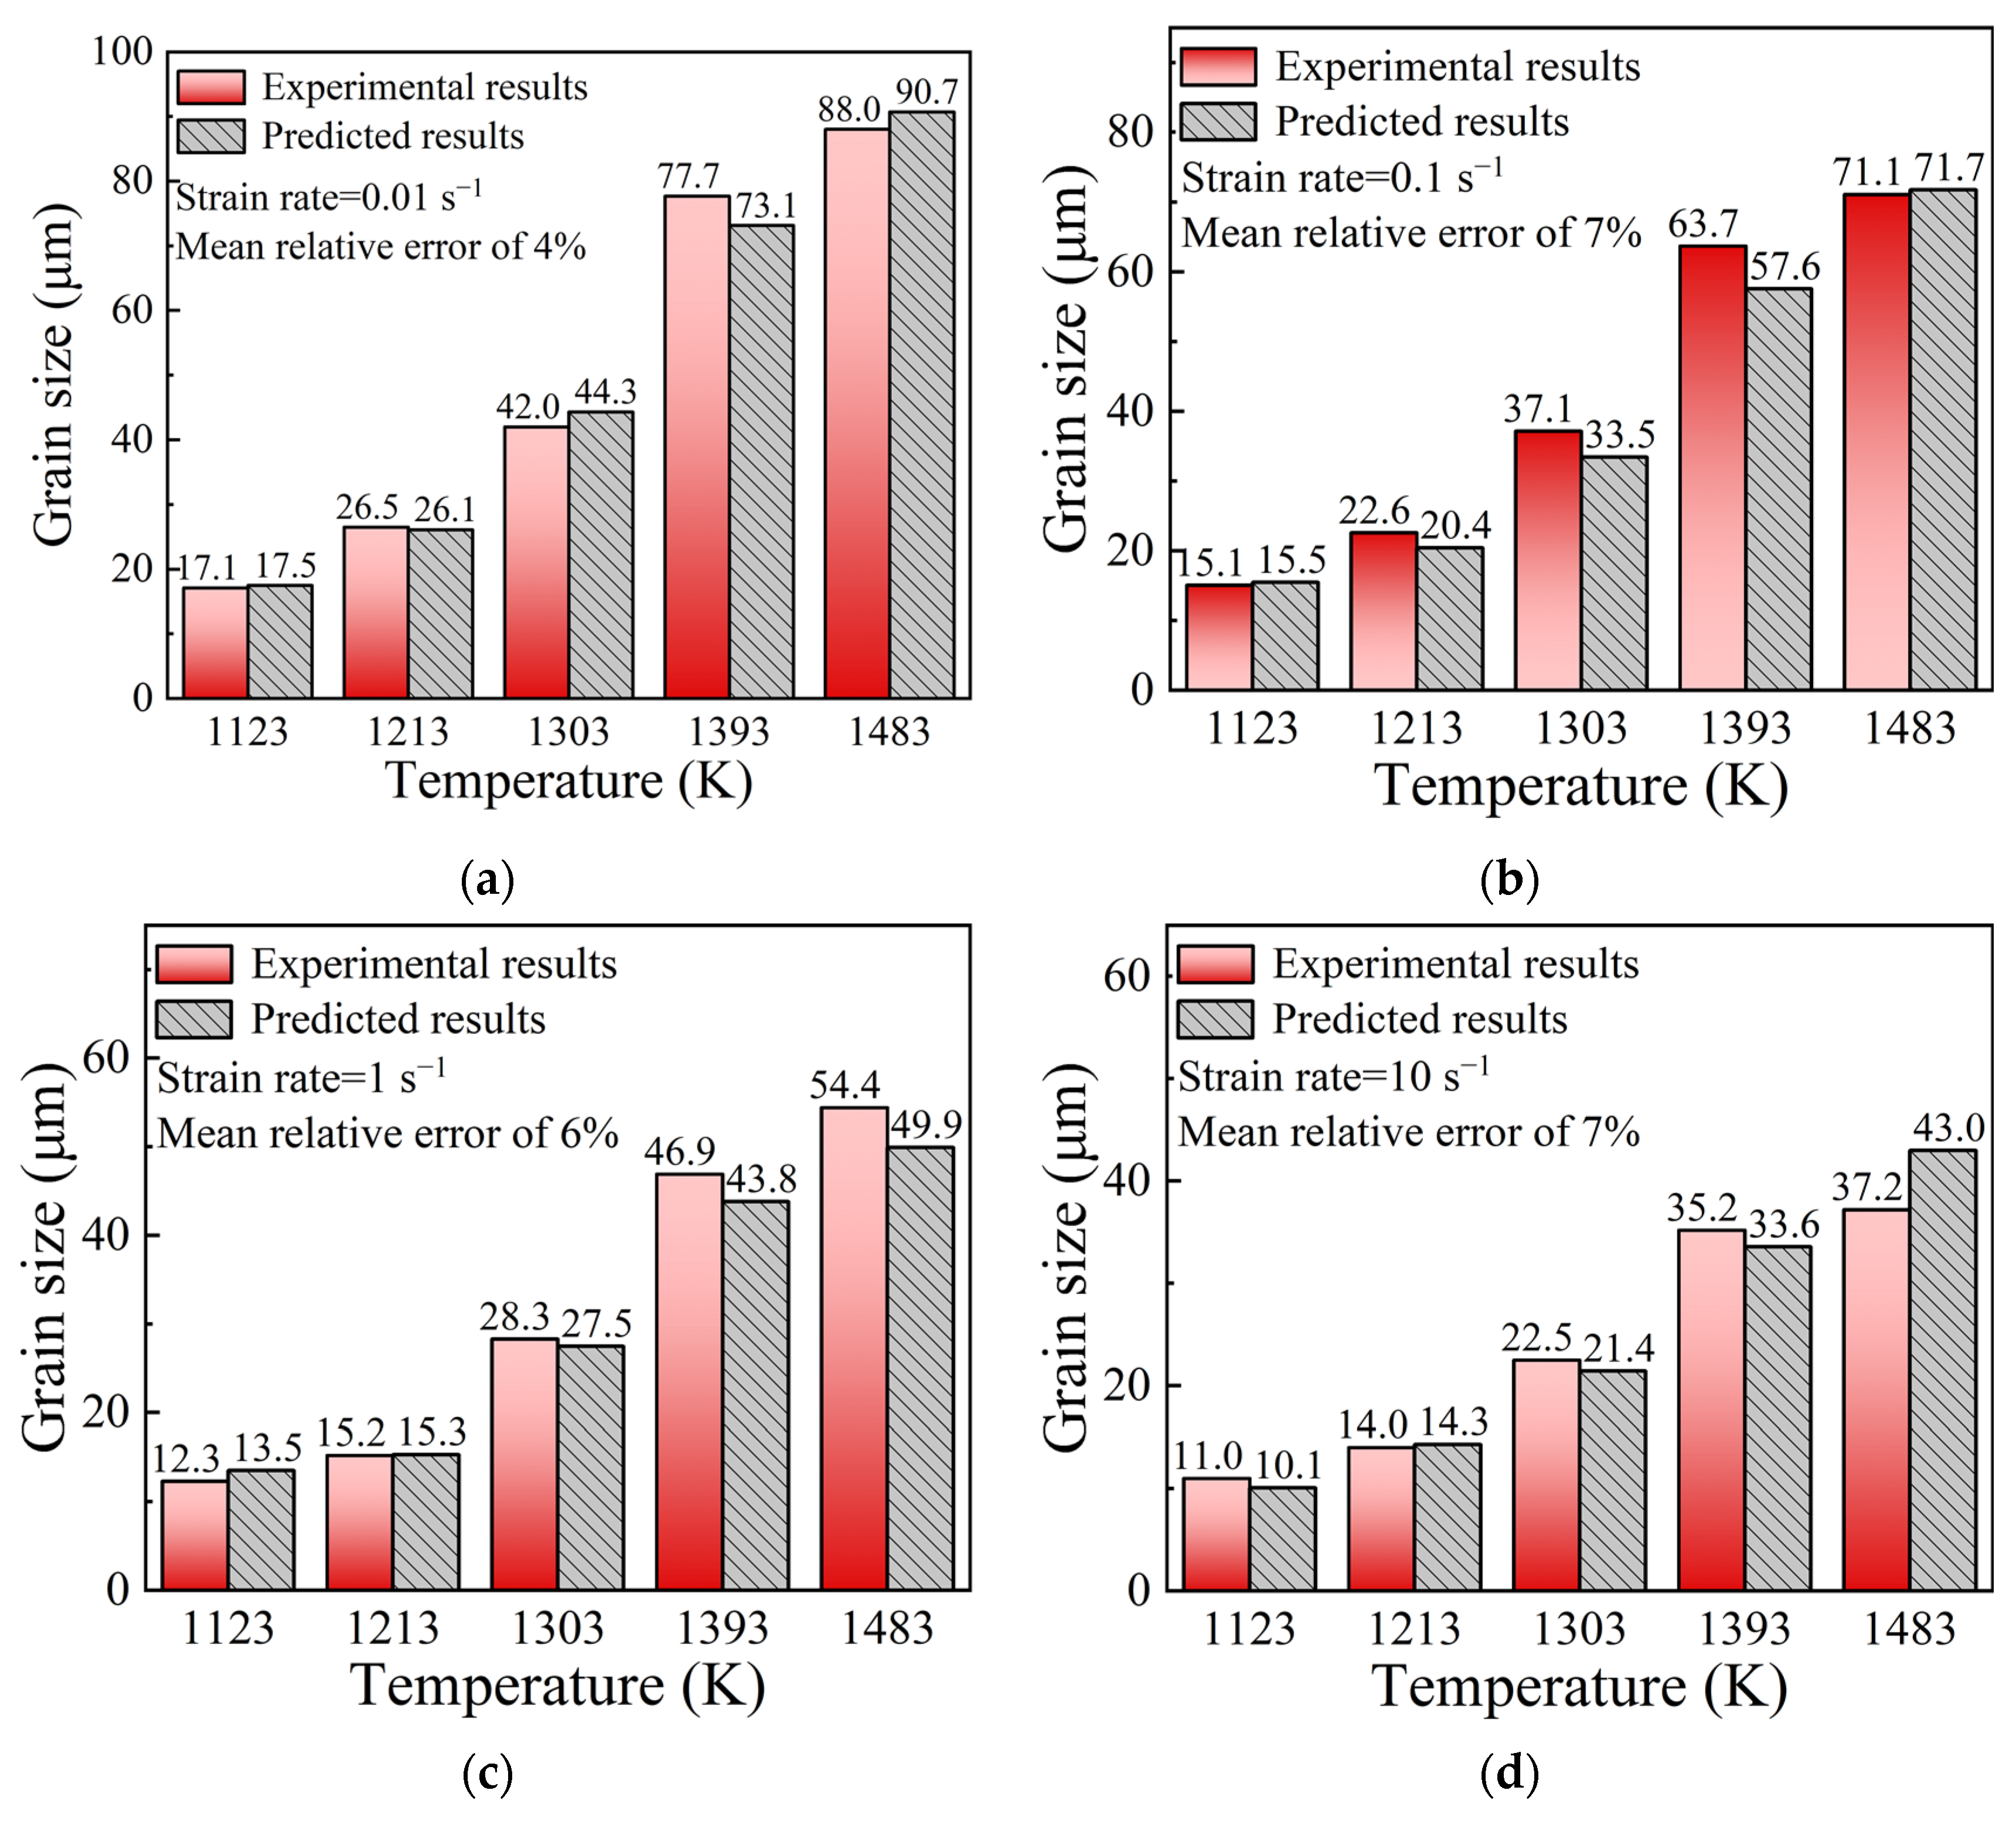
4.2. Description of Grain Evolution Mechanisms in the Hot Deformation Process
5. Conclusions
Author Contributions
Funding
Institutional Review Board Statement
Informed Consent Statement
Data Availability Statement
Conflicts of Interest
References
- Kattire, P.; Bhawar, V.; Thakare, S.; Patil, S.; Mane, S.; Singh, R. Experimental Characterization of Electron Beam Welded SAE 5137H Thick Steel Plate. IOP Conf. Ser. Mater. Sci. Eng. 2017, 229, 012028. [Google Scholar] [CrossRef]
- Valmik, B.; Prakash, K.; Sandeep, T.; Santosh, M.; Sachin, P.; Vinayak, P.; Rkp, S. Effect of post weld heat treatments (PWHTs) on Electron beam welded SAE 5137 steel. In Proceedings of the 29th ASM Heat Treating Society Conference, Columbus, OH, USA, 24–26 October 2017; pp. 24–26. [Google Scholar]
- Chen, M.-S.; Lin, Y.C.; Ma, X.-S. The kinetics of dynamic recrystallization of 42CrMo steel. Mater. Sci. Eng. A 2012, 556, 260–266. [Google Scholar] [CrossRef]
- Sakai, T.; Belyakov, A.; Kaibyshev, R.; Miura, H.; Jonas, J.J. Dynamic and post-dynamic recrystallization under hot, cold and severe plastic deformation conditions. Prog. Mater. Sci. 2014, 60, 130–207. [Google Scholar] [CrossRef]
- Quan, G.-Z.; Luo, G.-C.; Liang, J.-T.; Wu, D.-S.; Mao, A.; Liu, Q. Modelling for the dynamic recrystallization evolution of Ti–6Al–4V alloy in two-phase temperature range and a wide strain rate range. Comput. Mater. Sci. 2015, 97, 136–147. [Google Scholar] [CrossRef]
- Ravi Kumar, N.V.; Blandin, J.J.; Desrayaud, C.; Montheillet, F.; Suéry, M. Grain refinement in AZ91 magnesium alloy during thermomechanical processing. Mater. Sci. Eng. A 2003, 359, 150–157. [Google Scholar] [CrossRef]
- Aliakbari, S.S.; Ebrahimi, G.R.; Kiani Rashid, A.R. Hot deformation behavior and dynamic recrystallization kinetics of AZ61 and AZ61 + Sr magnesium alloys. J. Magnes. Alloy. 2016, 4, 104–114. [Google Scholar] [CrossRef]
- Sun, Z.; Yang, H.; Tang, Z. Microstructural evolution model of TA15 titanium alloy based on BP neural network method and application in isothermal deformation. Comput. Mater. Sci. 2010, 50, 308–318. [Google Scholar] [CrossRef]
- Quan, G.-Z.; Li, Y.-L.; Zhang, L.; Wang, X. Evolution of grain refinement degree induced by dynamic recrystallization for Nimonic 80A during hot compression process and its FEM analysis. Vacuum 2017, 139, 51–63. [Google Scholar] [CrossRef]
- Quan, G.-Z.; Ma, Y.-Y.; Zhang, Y.-Q.; Zhang, P.; Wang, W.-Y. Separation of dynamic recrystallization parameter domains from a chaotic system for Ti–6Al–4V alloy and its application in parameter loading path design. Mater. Sci. Eng. A 2020, 772, 138745. [Google Scholar] [CrossRef]
- Lin, Y.-C.; Chen, M.-S. Numerical simulation and experimental verification of microstructure evolution in a three-dimensional hot upsetting process. J. Mater. Process. Technol. 2009, 209, 4578–4583. [Google Scholar] [CrossRef]
- Li, X.; Duan, L.; Li, J.; Wu, X. Experimental study and numerical simulation of dynamic recrystallization behavior of a micro-alloyed plastic mold steel. Mater. Des. 2015, 66, 309–320. [Google Scholar] [CrossRef]
- Wan, Z.; Sun, Y.; Hu, L.; Yu, H. Experimental study and numerical simulation of dynamic recrystallization behavior of TiAl-based alloy. Mater. Des. 2017, 122, 11–20. [Google Scholar] [CrossRef]
- Goetz, R.L.; Seetharaman, V. Modeling Dynamic Recrystallization Using Cellular Automata. Scr. Mater. 1998, 38, 405–413. [Google Scholar] [CrossRef]
- Liu, Y.-X.; Lin, Y.C.; Li, H.-B.; Wen, D.-X.; Chen, X.-M.; Chen, M.-S. Study of dynamic recrystallization in a Ni-based superalloy by experiments and cellular automaton model. Mater. Sci. Eng. A 2015, 626, 432–440. [Google Scholar] [CrossRef]
- Liu, Y.-X.; Lin, Y.C.; Zhou, Y. 2D cellular automaton simulation of hot deformation behavior in a Ni-based superalloy under varying thermal-mechanical conditions. Mater. Sci. Eng. A 2017, 691, 88–99. [Google Scholar] [CrossRef]
- Chen, M.-S.; Yuan, W.-Q.; Lin, Y.C.; Li, H.-B.; Zou, Z.-H. Modeling and simulation of dynamic recrystallization behavior for 42CrMo steel by an extended cellular automaton method. Vacuum 2017, 146, 142–151. [Google Scholar] [CrossRef]
- Ding, R.; Guo, Z.X. Coupled quantitative simulation of microstructural evolution and plastic flow during dynamic recrystallization. Acta Mater. 2001, 49, 3163–3175. [Google Scholar] [CrossRef]
- Li, H.; Sun, X.; Yang, H. A three-dimensional cellular automata-crystal plasticity finite element model for predicting the multiscale interaction among heterogeneous deformation, DRX microstructural evolution and mechanical responses in titanium alloys. Int. J. Plast. 2016, 87, 154–180. [Google Scholar] [CrossRef]
- Lin, Y.C.; Chen, M.-S.; Zhong, J. Effect of temperature and strain rate on the compressive deformation behavior of 42CrMo steel. J. Mater. Process. Technol. 2008, 205, 308–315. [Google Scholar] [CrossRef]
- Quan, G.-Z.; Zhao, L.; Chen, T.; Wang, Y.; Mao, Y.-P.; Lv, W.-Q.; Zhou, J. Identification for the optimal working parameters of as-extruded 42CrMo high-strength steel from a large range of strain, strain rate and temperature. Mater. Sci. Eng. A 2012, 538, 364–373. [Google Scholar] [CrossRef]
- Roberts, W.; Ahlblom, B. A nucleation criterion for dynamic recrystallization during hot working. Acta Mater. 1978, 26, 801–813. [Google Scholar] [CrossRef]
- Poliak, E.I.; Jonas, J.J. A one-parameter approach to determining the critical conditions for the initiation of dynamic recrystallization. Acta Mater. 1996, 44, 127–136. [Google Scholar] [CrossRef]
- Jonas, J.; Poliak, E. The Critical Strain for Dynamic Recrystallization in Rolling Mills. Mater. Sci. Forum 2003, 426, 57–66. [Google Scholar] [CrossRef]
- Lin, Y.C.; Chen, M.-S.; Zhong, J. Effects of deformation temperatures on stress/strain distribution and microstructural evolution of deformed 42CrMo steel. Mater. Des. 2009, 30, 908–913. [Google Scholar] [CrossRef]
- Medina, S.F.; Hernandez, C.A. Modelling of the dynamic recrystallization of austenite in low alloy and microalloyed steels. Acta Mater. 1996, 44, 165–171. [Google Scholar] [CrossRef]
- Ji, G.; Li, F.; Li, Q.; Li, H.; Li, Z. Research on the dynamic recrystallization kinetics of Aermet100 steel. Mater. Sci. Eng. A 2010, 527, 2350–2355. [Google Scholar] [CrossRef]
- Quan, G.-Z.; Pan, J.; Zhang, Z.-H. Phase transformation and recrystallization kinetics in space–time domain during isothermal compressions for Ti–6Al–4V analyzed by multi-field and multi-scale coupling FEM. Mater. Des. 2016, 94, 523–535. [Google Scholar] [CrossRef]
- Quan, G.-Z.; Zhang, K.-K.; An, C.; Qiu, H.-M.; Xia, Y.-F. Analysis of dynamic recrystallization behaviors in resistance heating compressions of heat-resistant alloy by multi-field and multi-scale coupling method. Comput. Mater. Sci. 2018, 149, 73–83. [Google Scholar] [CrossRef]
- Mecking, H.; Kocks, U.F. Kinetics of flow and strain-hardening. Acta Mater. 1981, 29, 1865–1875. [Google Scholar] [CrossRef]
- Laasraoui, A.; Jonas, J.J. Prediction of steel flow stresses at high temperatures and strain rates. Metall. Trans. A 1991, 22, 1545–1558. [Google Scholar] [CrossRef]
- Jonas, J.J.; Quelennec, X.; Jiang, L.; Martin, É. The Avrami kinetics of dynamic recrystallization. Acta Mater. 2009, 57, 2748–2756. [Google Scholar] [CrossRef]
- Reyes, L.A.; Páramo, P.; Salas Zamarripa, A.; De La Garza, M.; Guerrero Mata, M.P. Grain size modeling of a Ni-base superalloy using cellular automata algorithm. Mater. Des. 2015, 83, 301–307. [Google Scholar] [CrossRef]
- Hallberg, H.; Wallin, M.; Ristinmaa, M. Modeling of continuous dynamic recrystallization in commercial-purity aluminum. Mater. Sci. Eng. A 2010, 527, 1126–1134. [Google Scholar] [CrossRef]
- Liu, L.; Wu, Y.-X.; Abdulrahaman, S.A. A novel simulation of continuous dynamic recrystallization process for 2219 aluminium alloy using cellular automata technique. Mater. Sci. Eng. A 2021, 815, 141256. [Google Scholar] [CrossRef]
- Lin, Y.C.; Chen, M.-S.; Zhong, J. Numerical simulation for stress/strain distribution and microstructural evolution in 42CrMo steel during hot upsetting process. Comput. Mater. Sci. 2008, 43, 1117–1122. [Google Scholar] [CrossRef]


| Element | C | Mn | Si | S | P | Cr | Mo | Ni |
|---|---|---|---|---|---|---|---|---|
| Content | 0.38 | 1.19 | 0.28 | 0.025 | 0.015 | 1.23 | 0.042 | 0.11 |
| Temperature (K) | Strain Rate (s−1) | |||||||
|---|---|---|---|---|---|---|---|---|
| 0.01 | 0.1 | 1 | 10 | |||||
| 1123 | 0.0921 | 0.2320 | 0.1321 | 0.3512 | 0.1472 | 0.5233 | 0.1353 | 0.5548 |
| 1213 | 0.0817 | 0.1943 | 0.0960 | 0.3256 | 0.1228 | 0.4958 | 0.1170 | 0.5535 |
| 1303 | 0.0682 | 0.1539 | 0.0749 | 0.2376 | 0.1354 | 0.3479 | 0.1209 | 0.5249 |
| 1393 | 0.0560 | 0.1298 | 0.0468 | 0.1793 | 0.1108 | 0.3353 | 0.1141 | 0.5004 |
| 1483 | 0.0442 | 0.1057 | 0.0561 | 0.1439 | 0.1016 | 0.2772 | 0.1152 | 0.4988 |
| Temperature (K) | Strain Rate (s−1) | |||
|---|---|---|---|---|
| 0.01 | 0.1 | 1 | 10 | |
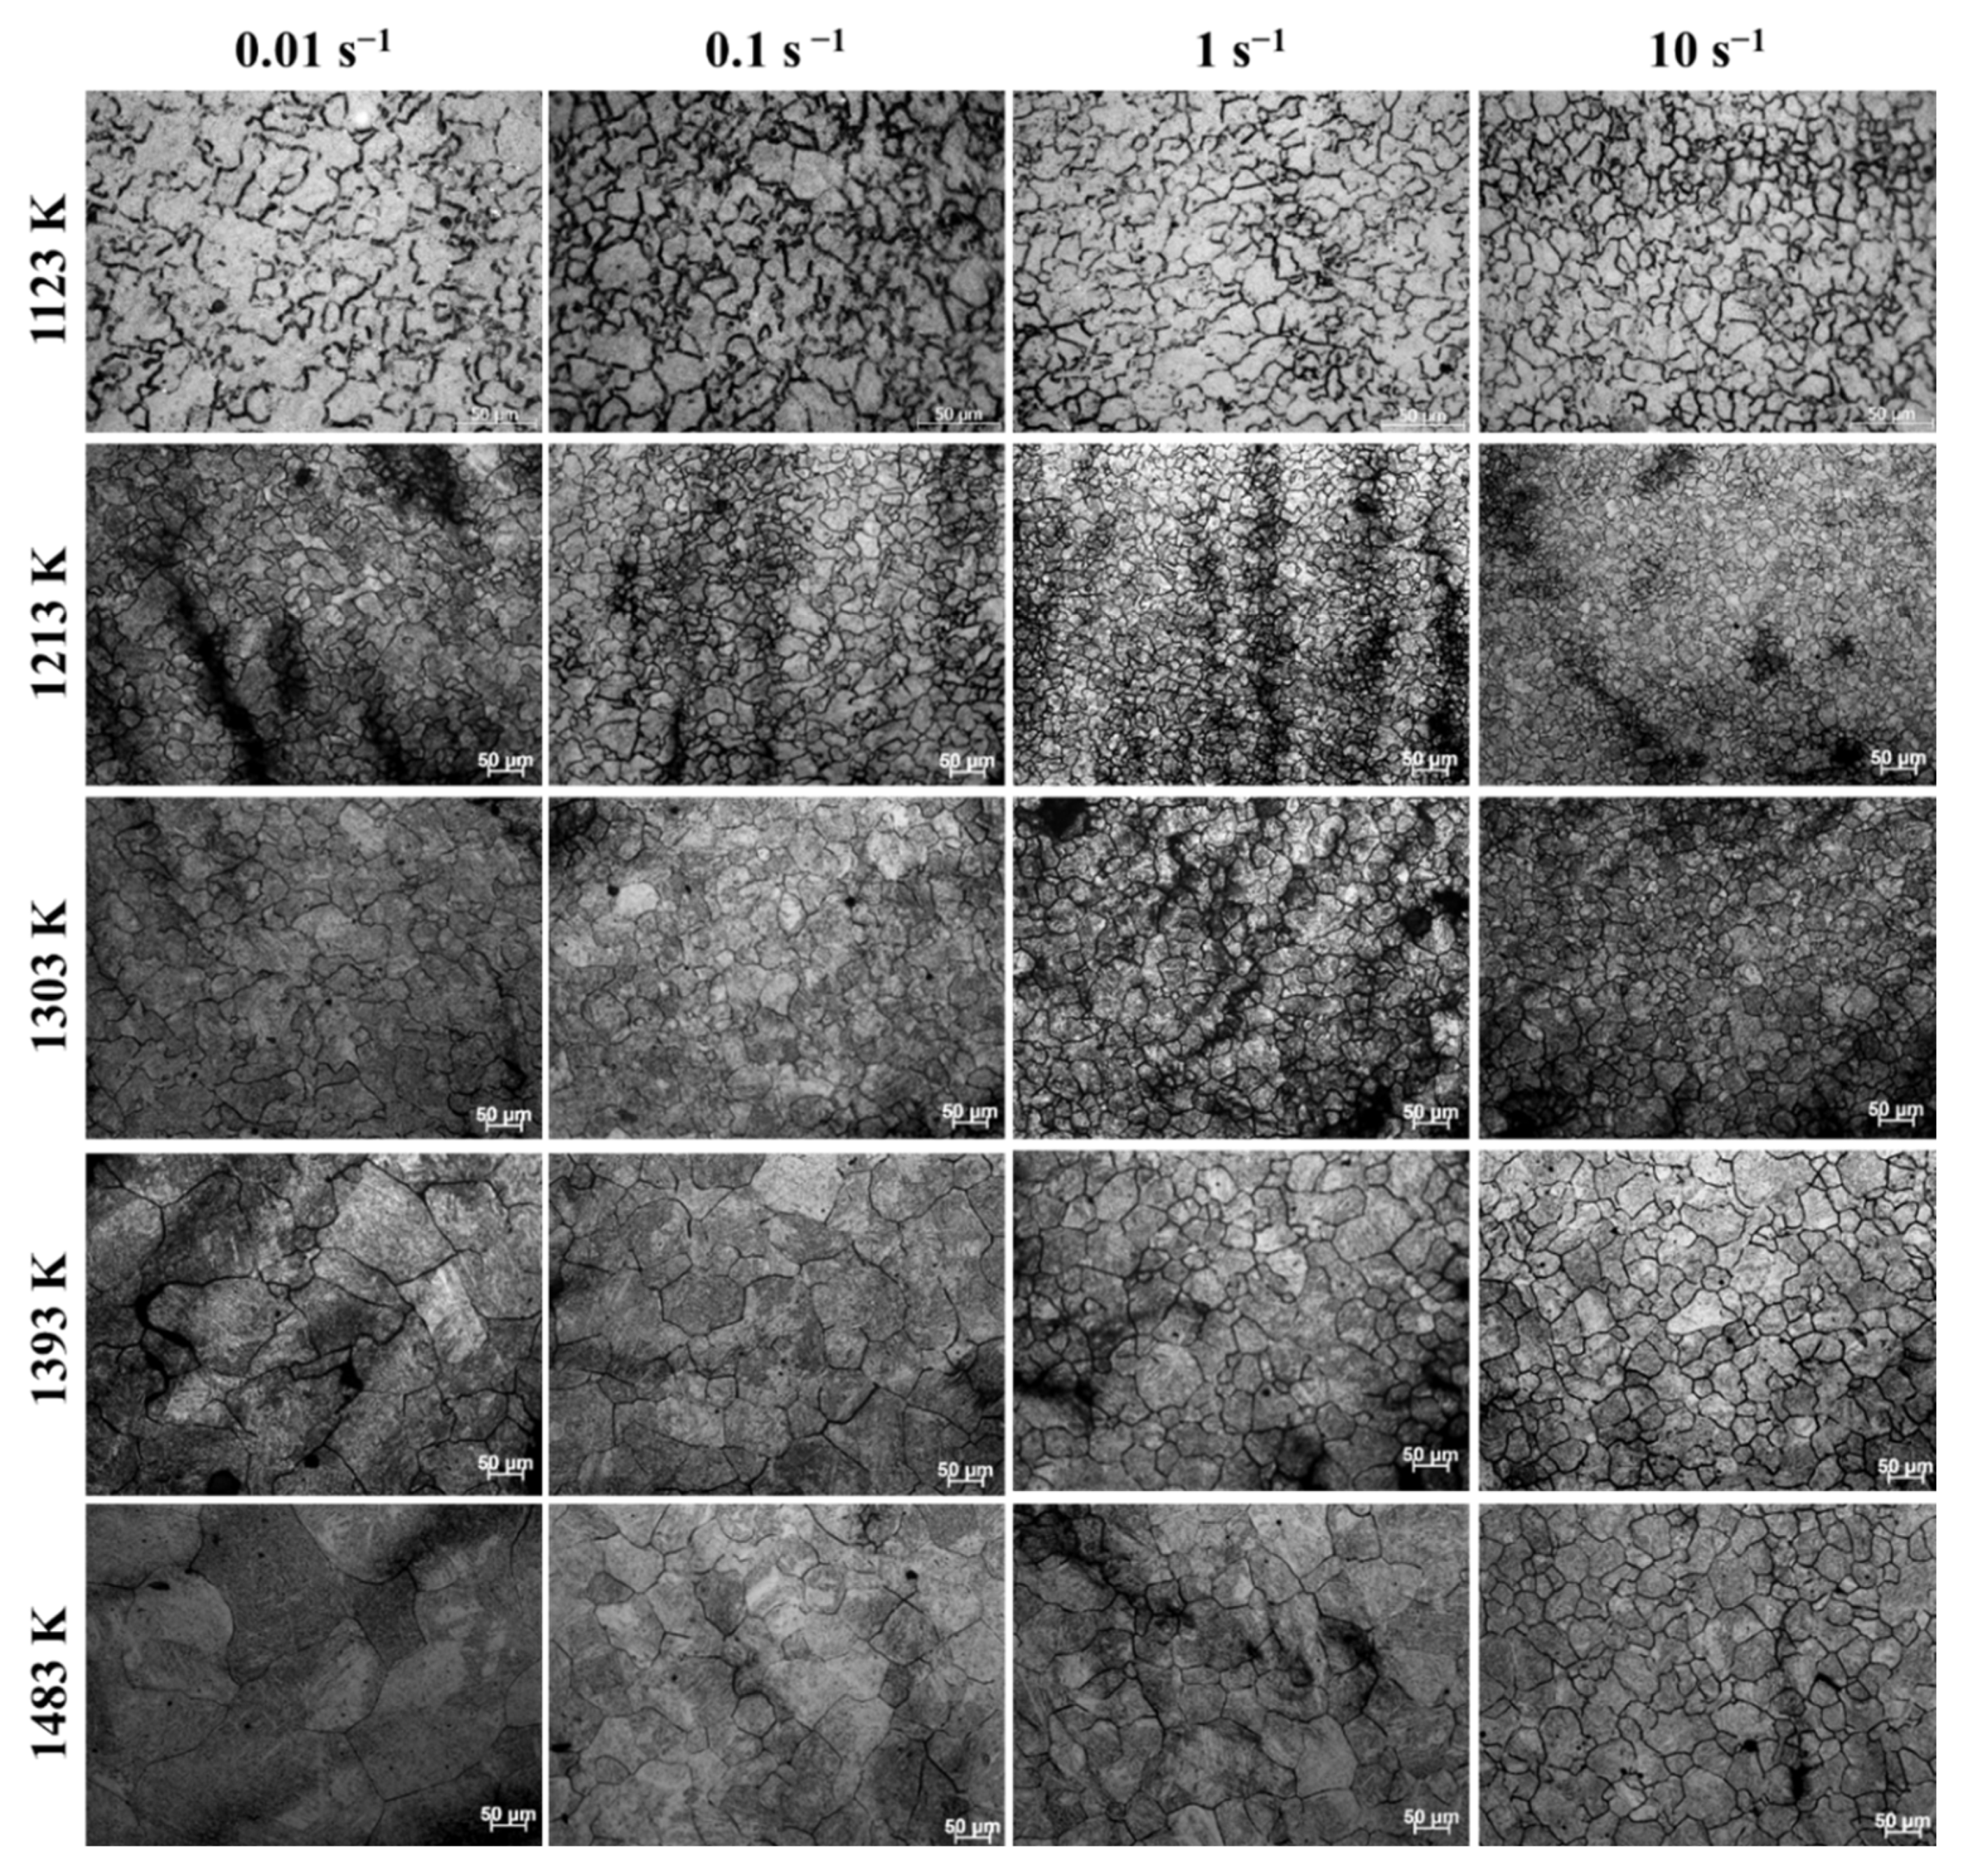
| 1123 | (17.1 ± 3.0) μm | (15.1 ± 2.6) μm | (12.3 ± 2.3) μm | (11.0 ± 2.2) μm |
| 1213 | (26.5 ± 3.6) μm | (22.6 ± 3.2) μm | (15.2 ± 2.5) μm | (14.0 ± 2.3) μm |
| 1303 | (42.0 ± 4.6) μm | (37.1 ± 4.0) μm | (28.3 ± 3.6) μm | (22.5 ± 3.1) μm |
| 1393 | (77.7 ± 6.3) μm | (63.7 ± 5.6) μm | (46.9 ± 4.1) μm | (35.2 ± 4.4) μm |
| 1483 | (88.0 ± 5.5) μm | (71.1 ± 5.2) μm | (54.4 ± 4.0) μm | (37.2 ± 4.3) μm |
| Temperature (K) | Strain Rate (s−1) | |||
|---|---|---|---|---|
| 0.01 | 0.1 | 1 | 10 | |
| 1123 | 124.12 | 173.02 | 233.75 | 343.69 |
| 1213 | 79.14 | 121.63 | 169.01 | 290.10 |
| 1303 | 59.45 | 100.29 | 100.60 | 169.96 |
| 1393 | 45.98 | 69.30 | 90.75 | 136.12 |
| 1483 | 24.79 | 48.79 | 59.76 | 97.00 |
| Temperature (K) | Strain Rate (s−1) | |||
|---|---|---|---|---|
| 0.01 | 0.1 | 1 | 10 | |
| 1123 | 14.14 | 12.46 | 11.13 | 10.40 |
| 1213 | 18.20 | 15.28 | 12.56 | 11.06 |
| 1303 | 21.65 | 18.08 | 14.26 | 12.81 |
| 1393 | 24.20 | 19.50 | 16.64 | 14.66 |
| 1483 | 29.74 | 25.00 | 22.48 | 19.36 |
| Temperature (K) | Strain Rate (s−1) | |||
|---|---|---|---|---|
| 0.01 | 0.1 | 1 | 10 | |
| 1123 | 520.81 | 891.82 | 1453.93 | 2937.06 |
| 1213 | 272.53 | 540.31 | 857.65 | 2223.80 |
| 1303 | 182.94 | 434.78 | 345.03 | 884.68 |
| 1393 | 122.30 | 223.88 | 327.65 | 649.42 |
| 1483 | 43.69 | 142.26 | 191.94 | 435.51 |
Publisher’s Note: MDPI stays neutral with regard to jurisdictional claims in published maps and institutional affiliations. |
© 2022 by the authors. Licensee MDPI, Basel, Switzerland. This article is an open access article distributed under the terms and conditions of the Creative Commons Attribution (CC BY) license (https://creativecommons.org/licenses/by/4.0/).
Share and Cite
Zhang, Y.-Q.; Quan, G.-Z.; Lei, S.; Zhao, J.; Xiong, W. Description of Dynamic Recrystallization Behaviors and Grain Evolution Mechanisms during the Hot Forming Process for SAE 5137H Steel. Materials 2022, 15, 5593. https://doi.org/10.3390/ma15165593
Zhang Y-Q, Quan G-Z, Lei S, Zhao J, Xiong W. Description of Dynamic Recrystallization Behaviors and Grain Evolution Mechanisms during the Hot Forming Process for SAE 5137H Steel. Materials. 2022; 15(16):5593. https://doi.org/10.3390/ma15165593
Chicago/Turabian StyleZhang, Yu-Qing, Guo-Zheng Quan, Sheng Lei, Jiang Zhao, and Wei Xiong. 2022. "Description of Dynamic Recrystallization Behaviors and Grain Evolution Mechanisms during the Hot Forming Process for SAE 5137H Steel" Materials 15, no. 16: 5593. https://doi.org/10.3390/ma15165593
APA StyleZhang, Y.-Q., Quan, G.-Z., Lei, S., Zhao, J., & Xiong, W. (2022). Description of Dynamic Recrystallization Behaviors and Grain Evolution Mechanisms during the Hot Forming Process for SAE 5137H Steel. Materials, 15(16), 5593. https://doi.org/10.3390/ma15165593