
siRNA Transfection Mediated by Chitosan Microparticles for the Treatment of HIV-1 Infection of Human Cell Lines

 ,
,  and
and 
Abstract
:
1. Introduction
2. Materials and Methods
2.1. Materials
2.2. Preparation and Characterization of CS-Based Complexes
2.3. DNA Release Studies
2.4. Electrophoretic Mobility Shift Assay
2.5. Preparation and Characterization of FITC-Labelled CS
2.6. Preparation and Characterization of PEI-Based Complexes
2.7. Liposomes Preparation
2.8. Cell Experiments
2.8.1. Cells
2.8.2. Cell Viability
2.8.3. Cellular Uptake of CS/hsDNA Complexes
2.8.4. Cell Infection
2.8.5. Gene Transfection and Antiviral Activity
3. Results and Discussion
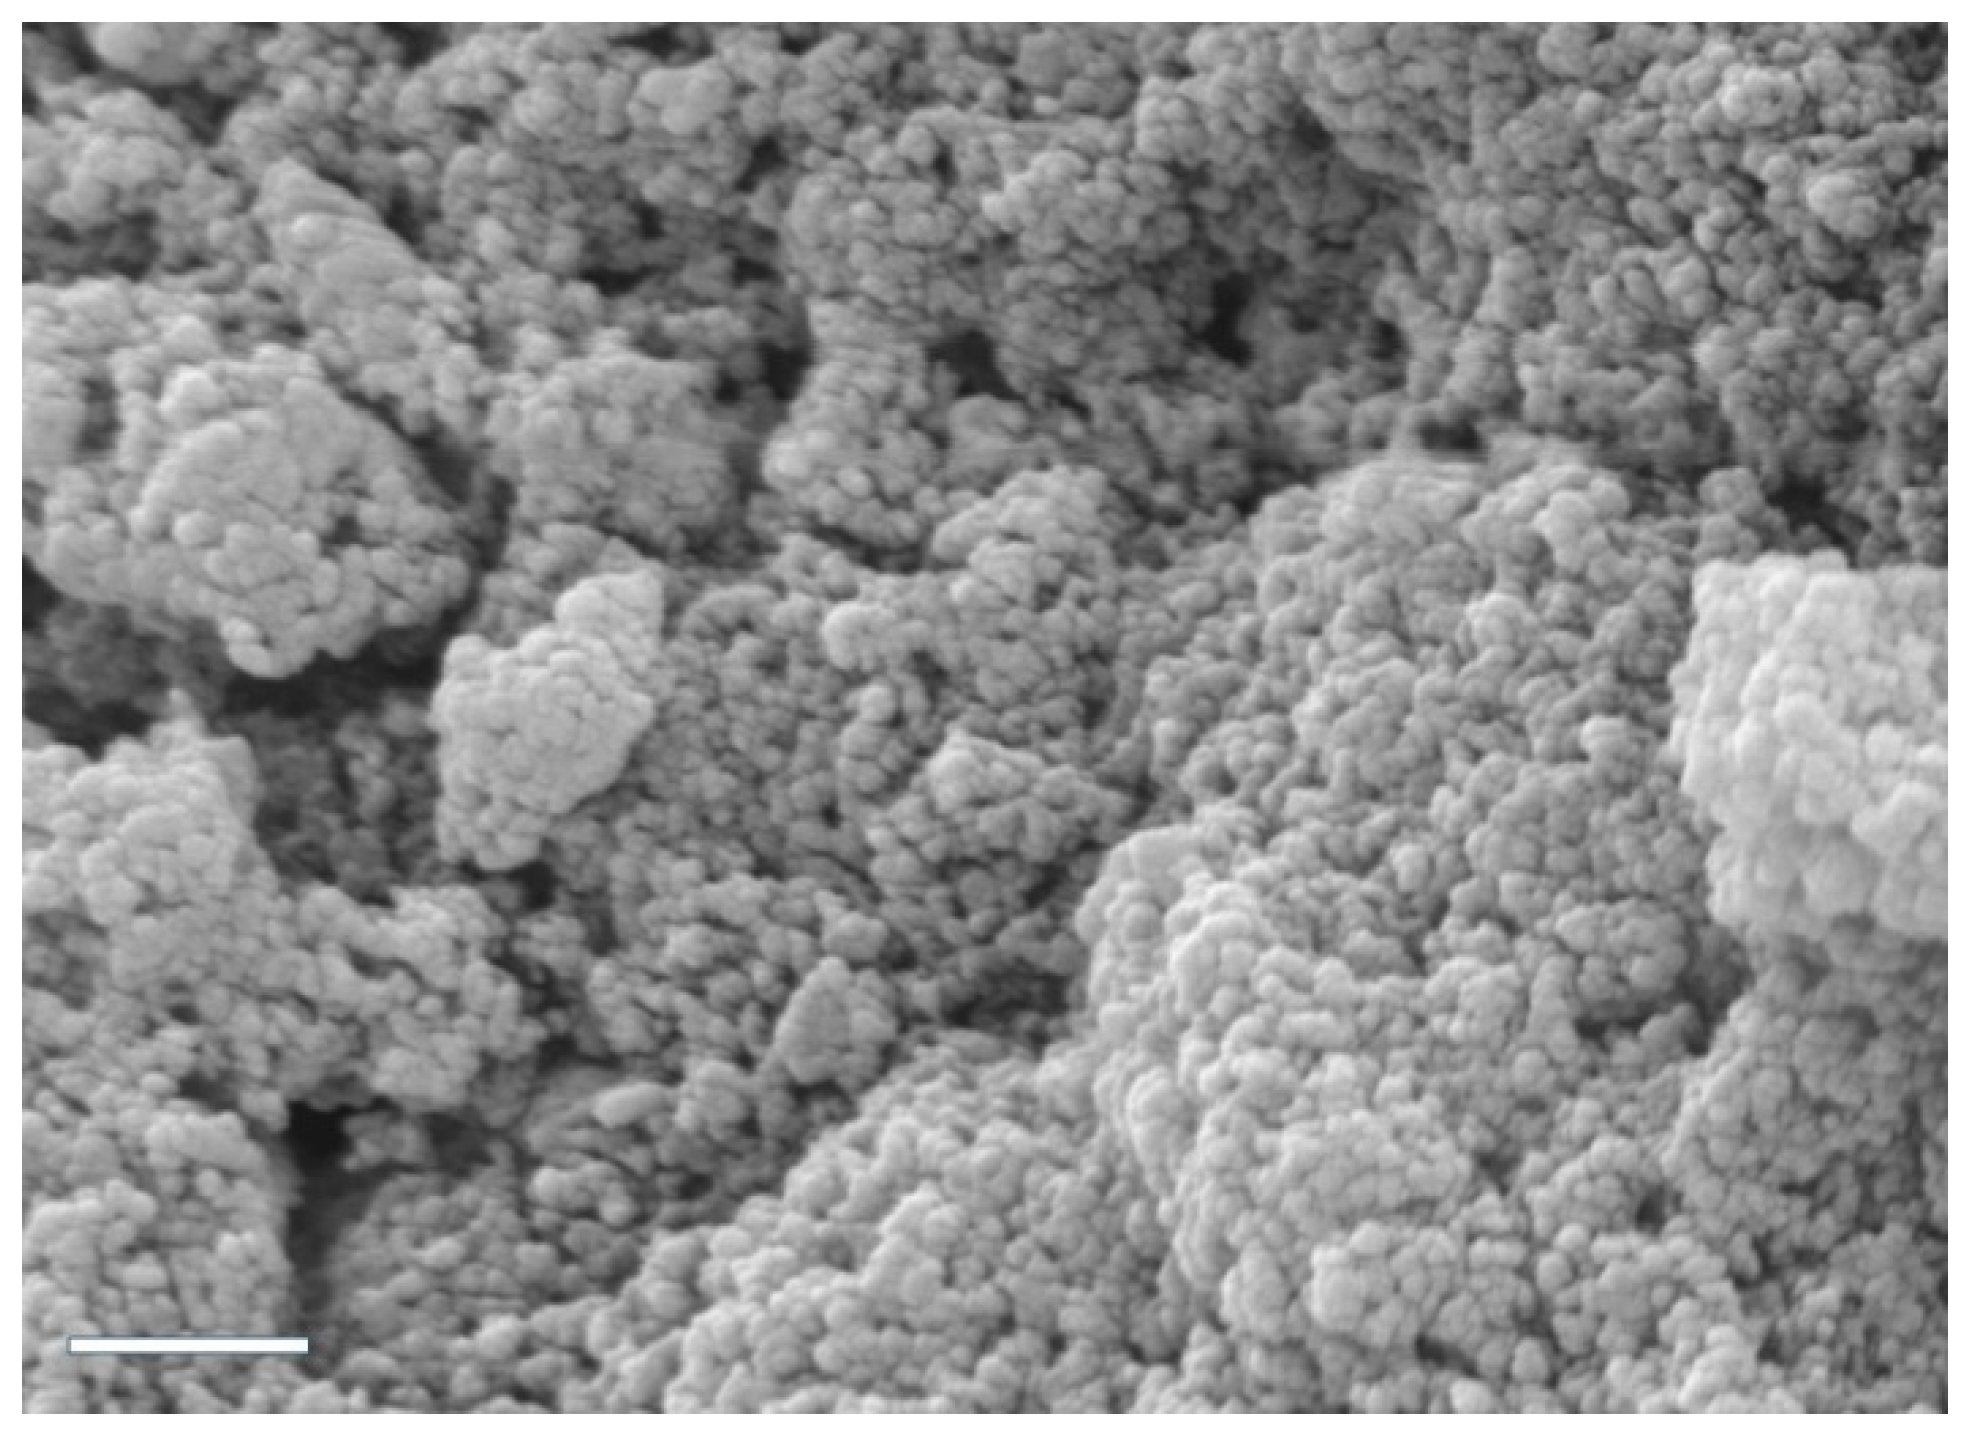
3.1. Preparation and Characterization of CS/hsDNA Complexes
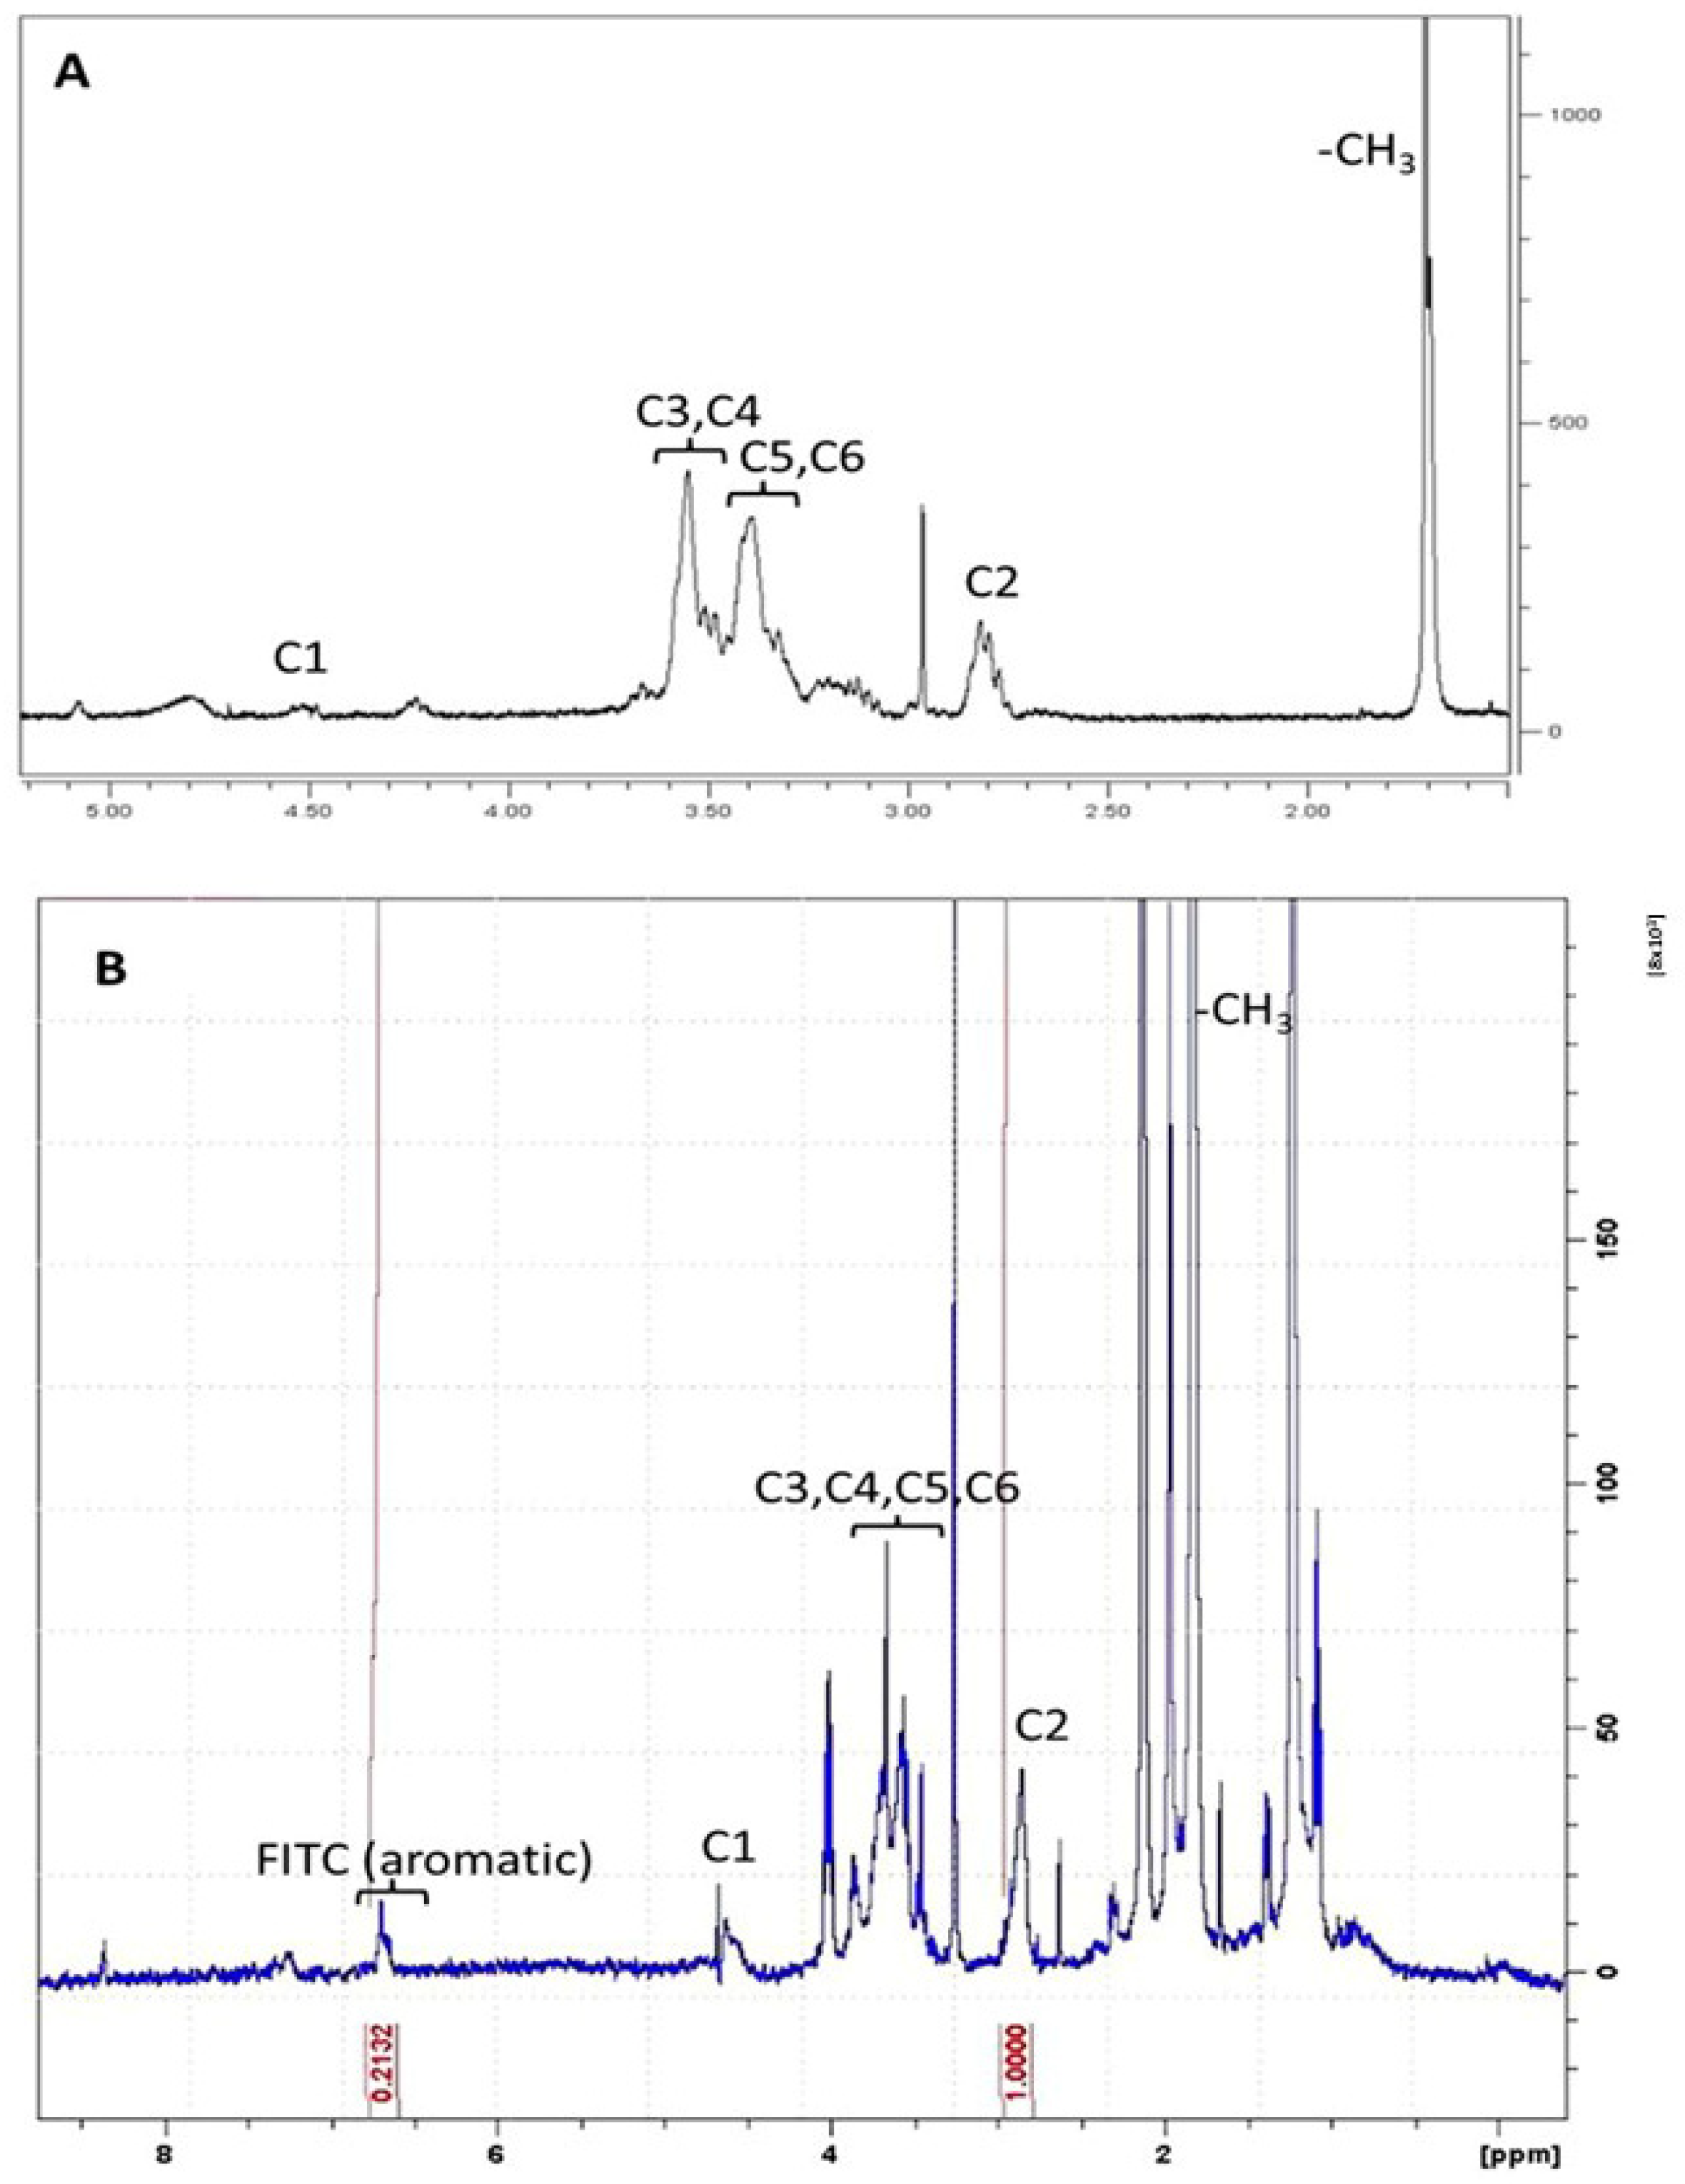
3.2. Preparation and Characterization of FITC-Labelled CS
3.3. Preparation and Characterization of CS/siRNA Tat/Rev Complexes and Control Carrier Systems for Cellular Transfection
3.4. Preparation and Characterization of PEI and Escort IV-Based Complexes
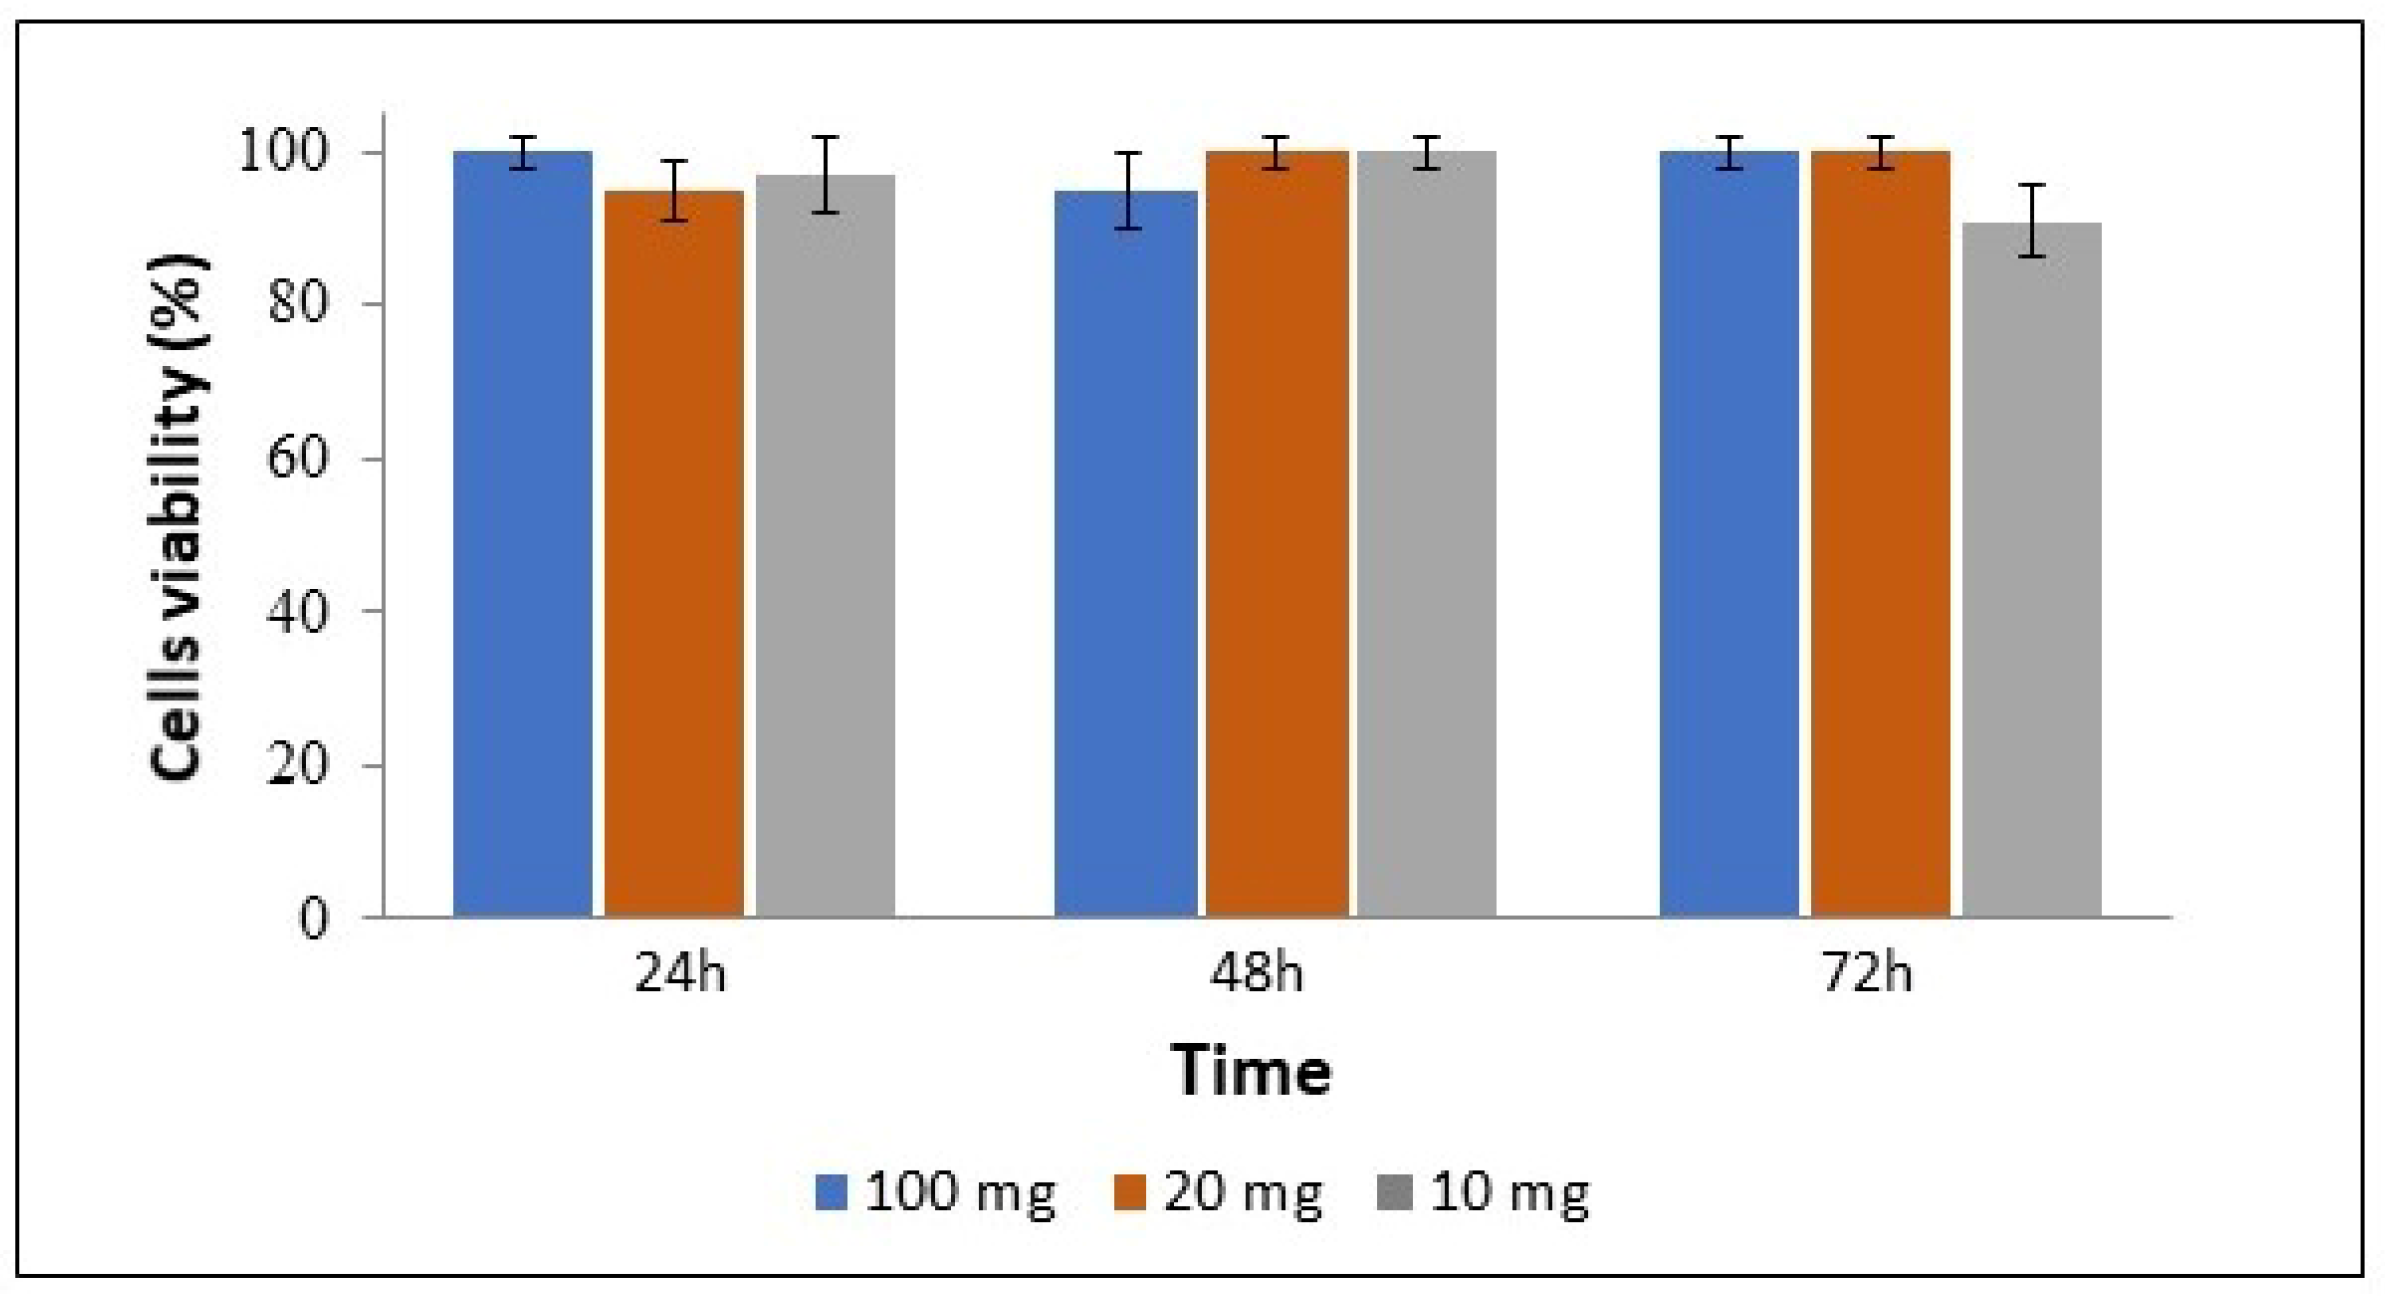
3.5. Cell Viability and Uptake of Complexes
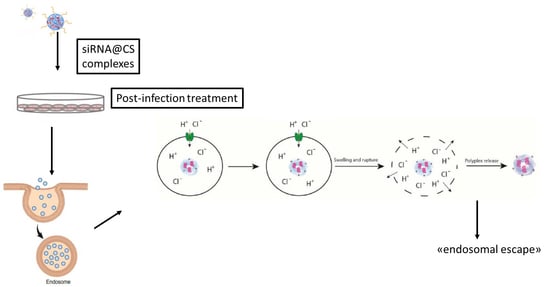
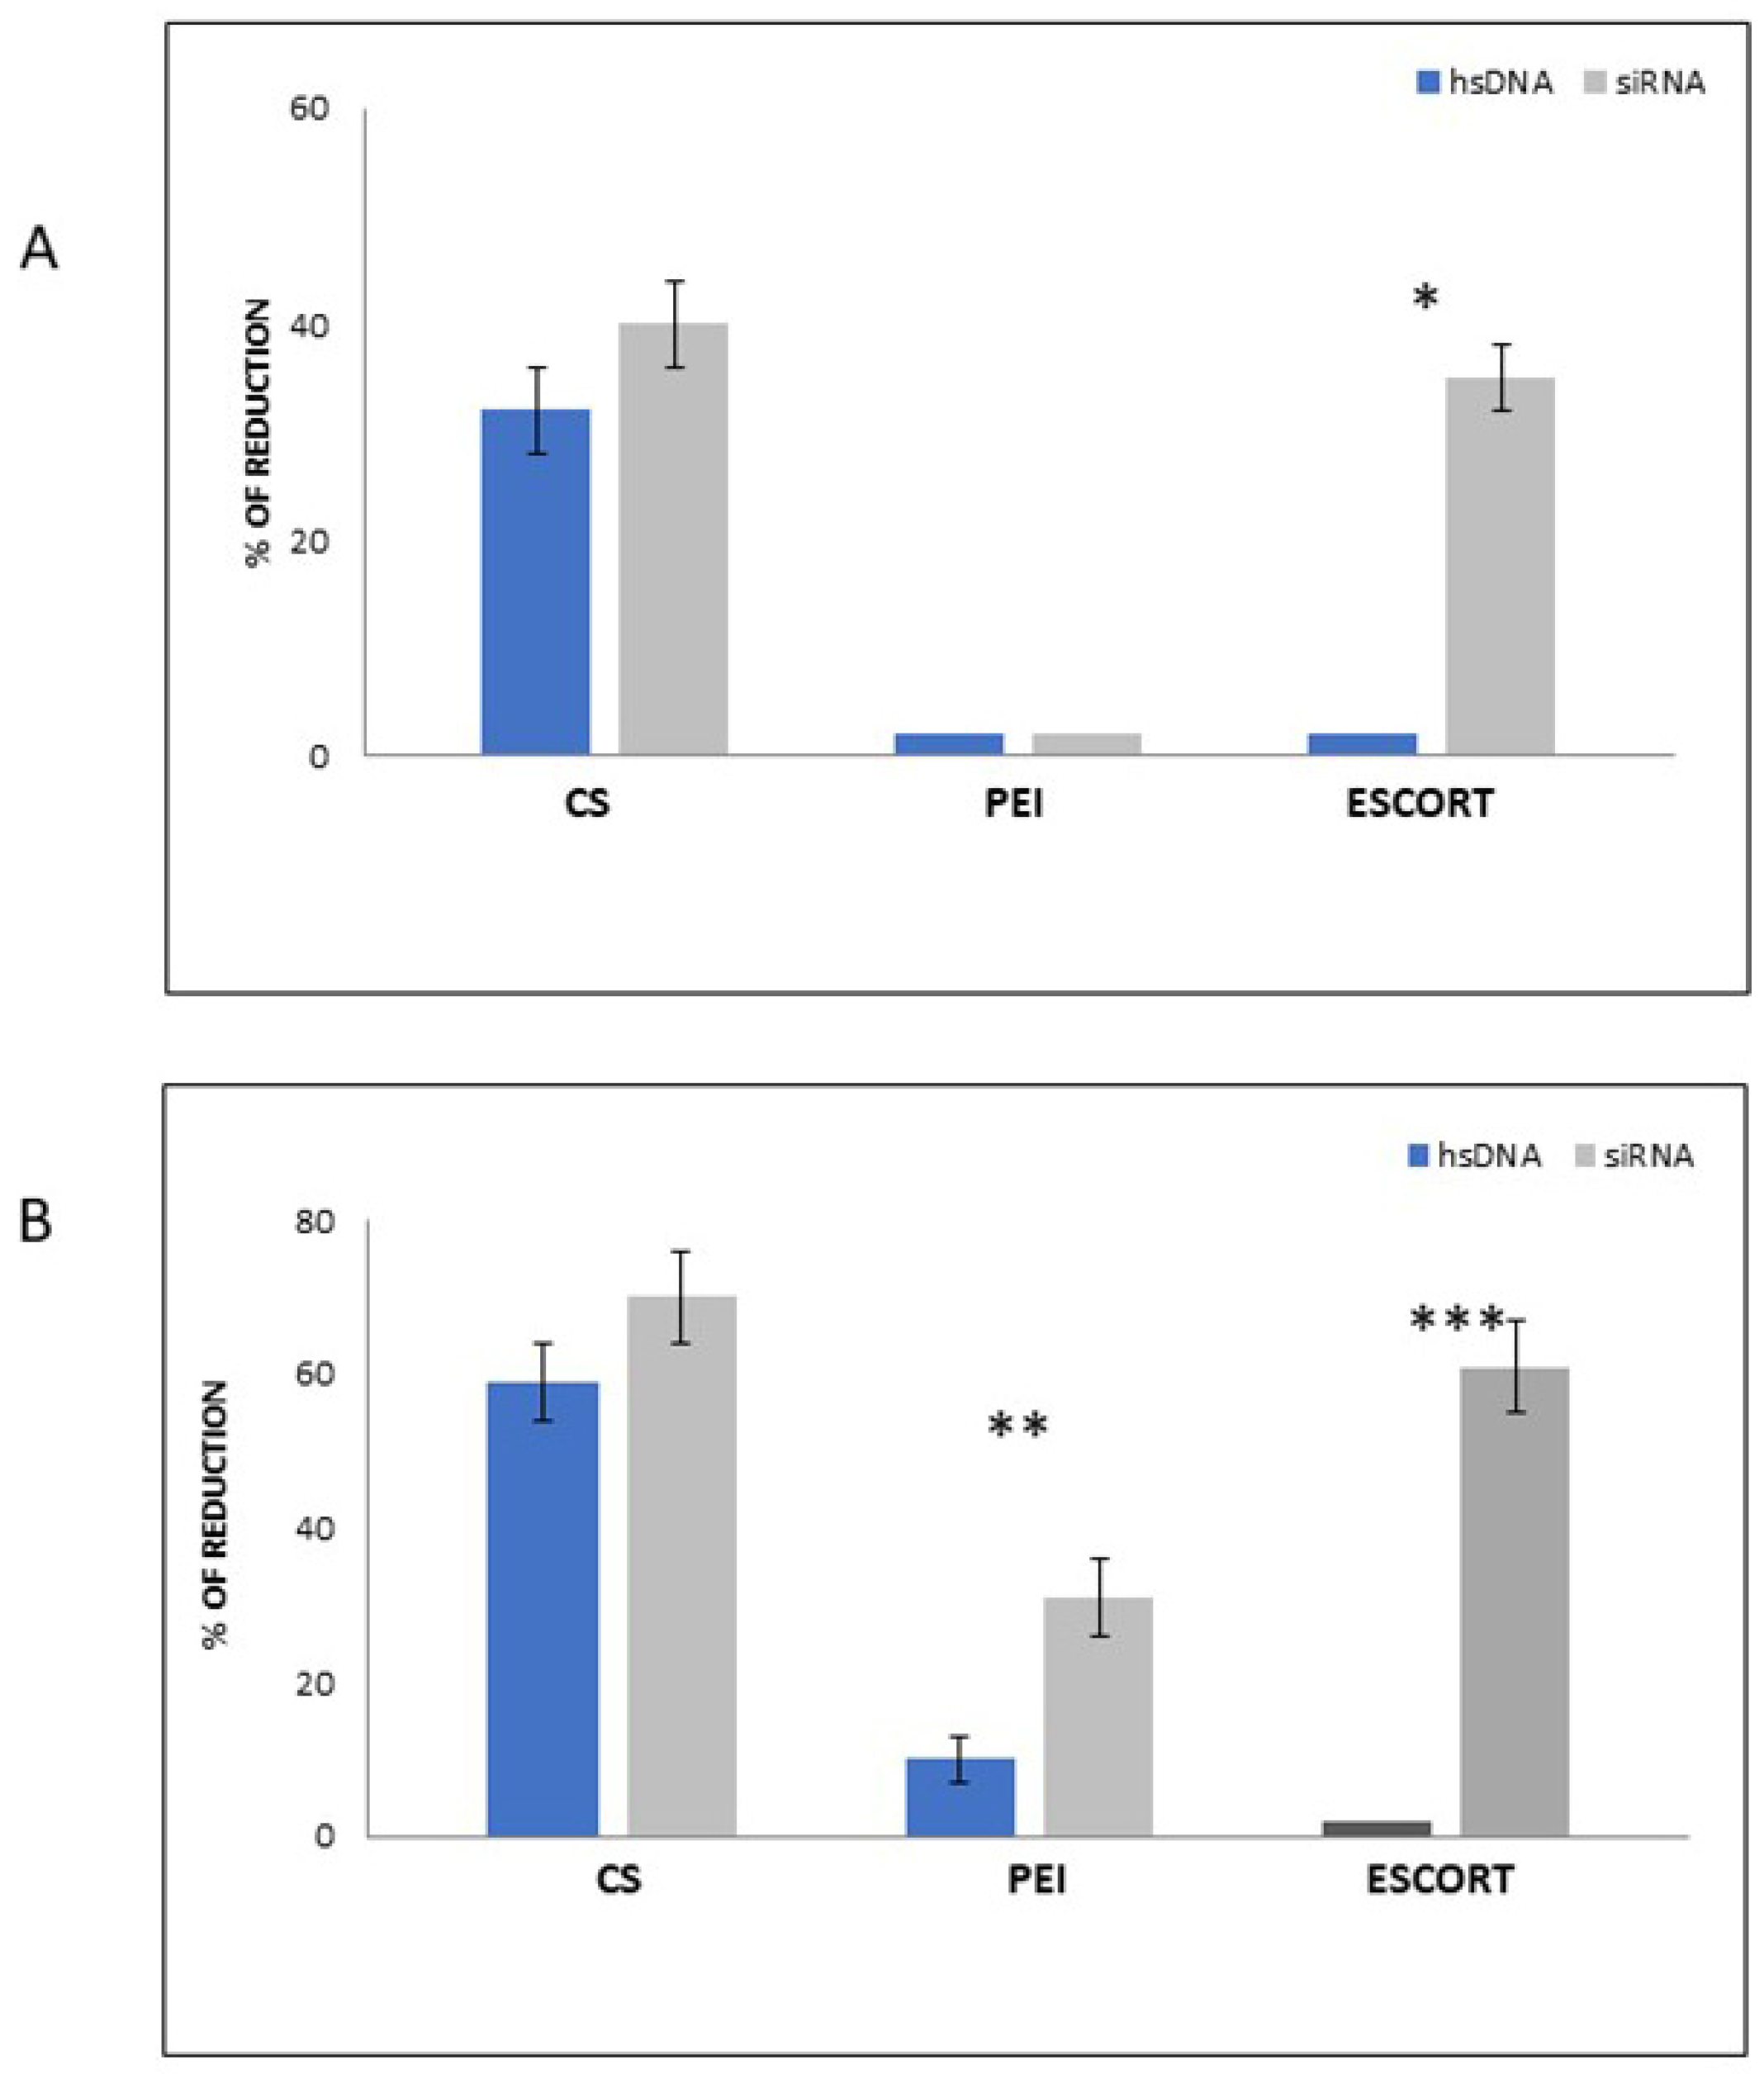
3.6. Antiviral Activity of CS-siRNA Complexes
4. Conclusions
Author Contributions
Funding
Institutional Review Board Statement
Informed Consent Statement
Data Availability Statement
Conflicts of Interest
References
- Dunbar, C.E.; High, K.A.; Joung, J.K.; Kohn, D.B.; Ozawa, K.; Sadelain, M. Gene therapy comes of age. Science 2018, 359, eaan4672. [Google Scholar] [CrossRef] [PubMed] [Green Version]
- Mendell, J.R.; Al-Zaidy, S.A.; Rodino-Klapac, L.R.; Goodspeed, K.; Gray, S.J.; Kay, C.N.; Boye, S.L.; Boye, S.E.; George, L.A.; Salabarria, S.; et al. Current Clinical Applications of In Vivo Gene Therapy with AAVs. Mol. Ther. 2021, 29, 464–488. [Google Scholar] [CrossRef] [PubMed]
- Ferrari, G.; Thrasher, A.J.; Aiuti, A. Gene therapy using haematopoietic stem and progenitor cells. Nat. Rev. Genet. 2021, 22, 216–234. [Google Scholar] [CrossRef] [PubMed]
- Zhang, B. CRISPR/Cas gene therapy. J. Cell Physiol. 2021, 236, 2459–2481. [Google Scholar] [CrossRef]
- Rossi, J.J.; Rossi, D.J. siRNA Drugs: Here to Stay. Mol. Ther. 2021, 29, 431–432. [Google Scholar] [CrossRef]
- Hu, B.; Zhong, L.; Weng, Y.; Peng, L.; Huang, Y.; Zhao, Y.; Liang, X.J. Therapeutic siRNA: State of the art. Sig. Transduct. Target. Ther. 2020, 5, 101. [Google Scholar] [CrossRef]
- Hu, B.; Weng, Y.; Xia, X.H.; Liang, X.J.; Huang, Y. Clinical advances of siRNA therapeutics. J. Gene Med. 2019, 21, e3097. [Google Scholar] [CrossRef]
- Carthew, R.W.; Sontheimer, E.J. Origins and Mechanisms of miRNAs and siRNAs. Cell 2009, 136, 642–655. [Google Scholar] [CrossRef] [Green Version]
- Kim, V.N.; Han, J.; Siomi, M.C. Biogenesis of small RNAs in animals. Nat. Rev. Mol. Cell Biol. 2009, 10, 126–139. [Google Scholar] [CrossRef]
- Ding, S.W. RNA-based antiviral immunity. Nat. Rev. Immunol. 2010, 10, 632–644. [Google Scholar] [CrossRef]
- Qiu, Y.; Xu, Y.; Zhang, Y.; Zhou, H.; Deng, Y.Q.; Li, X.F.; Miao, M.; Zhang, Q.; Zhong, B.; Hu, Y.; et al. Human Virus-Derived Small RNAs Can Confer Antiviral Immunity in Mammals. Immunity 2017, 46, 992–1004. [Google Scholar] [CrossRef] [Green Version]
- Ragelle, H.; Vanvarenberg, K.; Vandermeulen, G.; Préat, V. Chitosan Nanoparticles for SiRNA Delivery In Vitro. Methods Mol. Biol. 2016, 1364, 143–150. [Google Scholar]
- Maillard, P.V.; van der Veen, A.G.; Poirier, E.Z.; Reis e Sousa, C. Slicing and dicing viruses: Antiviral RNA interference in mammals. EMBO J. 2019, 38, e100941. [Google Scholar] [CrossRef]
- Ding, S.W.; Han, Q.; Wang, J.; Li, W.X. Antiviral RNA interference in mammals. Curr. Opin. Immunol. 2018, 54, 109–114. [Google Scholar] [CrossRef] [PubMed]
- Dong, Y.; Siegwart, D.J.; Anderson, D.G. Strategies, design, and chemistry in siRNA delivery systems. Adv. Drug Deliv. Rev. 2019, 144, 133–147. [Google Scholar] [CrossRef] [PubMed]
- Thi, E.P.; Mire, C.E.; Lee, A.C.H.; Geisbert, J.B.; Zhou, J.Z.; Agans, K.N.; Snead, N.M.; Deer, D.J.; Barnard, T.R.; Fenton, K.A.; et al. Lipid nanoparticle siRNA treatment of Ebola-virus-Makona-infected nonhuman primates. Nature 2015, 521, 362–371. [Google Scholar] [CrossRef] [PubMed] [Green Version]
- Buchholz, C.J.; Friedel, T.; Büning, H. Surface-Engineered Viral Vectors for Selective and Cell Type-Specific Gene Delivery. Trends Biotechnol. 2015, 33, 777–790. [Google Scholar] [CrossRef] [PubMed]
- Cifani, N.; Chronopoulou, L.; Pompili, B.; Di Martino, A.; Bordi, F.; Sennato, S.; Di Domenico, E.G.; Palocci, C.; Ascenzioni, F. Improved stability and efficacy of chitosan/pDNA complexes for gene delivery. Biotechnol. Lett. 2015, 37, 557–565. [Google Scholar] [CrossRef] [PubMed]
- Liu, X.; Mo, Y.; Liu, X.; Guo, R.; Zhang, Y.; Xue, W.; Zhang, Y.; Wang, C.; Ramakrishna, S. Synthesis, characterisation and preliminary investigation of the haemocompatibility of polyethyleneimine-grafted carboxymethyl chitosan for gene delivery. Mater. Sci. Eng. C 2016, 62, 173–182. [Google Scholar] [CrossRef]
- Gosangi, M.; Mujahid, T.Y.; Gopal, V.; Patri, S.V. Effects of heterocyclic-based head group modifications on the structure–activity relationship of tocopherol-based lipids for non-viral gene delivery. Org. Biomol. Chem. 2016, 14, 6857–6870. [Google Scholar] [CrossRef]
- Park, Y. Nanoparticles for Imaging and Non-Viral Gene Therapy. In Biomedical Engineering: Frontier Research and Converging Technologies; Jo, H., Jun, H.W., Shin, J., Lee, S., Eds.; Springer: Cham, Switzerland, 2016; pp. 3–18. [Google Scholar]
- Askarian, S.; Abnous, K.; Darroudi, M.; Oskuee, R.K.; Ramezani, M. Gene delivery to neuroblastoma cells by poly (l-lysine)-grafted low molecular weight polyethylenimine copolymers. Biologicals 2016, 44, 212–218. [Google Scholar] [CrossRef] [PubMed] [Green Version]
- Densmore, C.L.; Orson, F.M.; Xu, B.; Kinsey, B.M.; Waldrep, J.C.; Hua, P.; Bhogal, B.; Knight, V. Aerosol delivery of robust polyethyleneimine–DNA complexes for gene therapy and genetic immunization. Mol. Ther. 2000, 1, 180–188. [Google Scholar] [CrossRef] [PubMed]
- Messaoudi, K.; Clavreul, A.; Lagarce, F. Toward an effective strategy in glioblastoma treatment. Part II: RNA interference as a promising way to sensitize glioblastomas to temozolomide. Drug Discov. Today 2015, 20, 772–779. [Google Scholar] [CrossRef] [PubMed]
- Zheng, M.; Pan, M.; Zhang, W.; Lin, H.; Wu, S.; Lu, C.; Tang, S.; Liu, D.; Cai, J. Poly(α-l-lysine)-based nanomaterials for versatile biomedical applications: Current advances and perspectives. Bioact. Mater. 2021, 6, 1878–1909. [Google Scholar] [CrossRef]
- Yang, C.; Liu, S.Q.; Venkataraman, S.; Gao, S.J.; Ke, X.; Chia, X.T.; Hedrick, J.L.; Yang, Y.Y. Structure-directing star-shaped block copolymers: Supramolecular vesicles for the delivery of anticancer drugs. J. Control. Release 2015, 28, 93–105. [Google Scholar] [CrossRef] [PubMed]
- Amaduzzi, F.; Bomboi, F.; Bonincontro, A.; Bordi, F.; Casciardi, S.; Chronopoulou, L.; Diociaiuti, M.; Mura, F.; Palocci, C.; Sennato, S. Chitosan-DNA complexes: Charge inversion and DNA condensation. Coll. Surf. B 2014, 114, 1–10. [Google Scholar] [CrossRef] [PubMed]
- Prabhu, R.H.; Patravale, V.B.; Joshi, M.D. Polymeric nanoparticles for targeted treatment in oncology: Current insights. Int. J. Nanomed. 2015, 10, 1001–1018. [Google Scholar]
- Osawa, S.; Osada, K.; Hiki, S.; Dirisala, A.; Ishii, T.; Kataoka, K. Polyplex Micelles with Double-Protective Compartments of Hydrophilic Shell and Thermoswitchable Palisade of Poly(oxazoline)-Based Block Copolymers for Promoted Gene Transfection. Biomacromolecules 2016, 17, 354–361. [Google Scholar] [CrossRef] [PubMed]
- Omar, R.; Yang, J.; Liu, H.; Davies, N.M.; Gong, Y. Hepatic stellate cells in liver fibrosis and siRNA-based therapy. Rev. Physiol. Biochem. Pharmacol. 2016, 172, 1–37. [Google Scholar]
- Ge, Y.; Zhang, Y.; He, S.; Nie, F.; Teng, G.; Gu, N. Fluorescence Modified Chitosan-Coated Magnetic Nanoparticles for High-Efficient Cellular Imaging. Nanoscale Res. Lett. 2009, 4, 287–295. [Google Scholar] [CrossRef] [PubMed] [Green Version]
- Lai, M.; Maori, E.; Quaranta, P.; Matteoli, G.; Maggi, F.; Sgarbanti, M.; Crucitta, S.; Pacini, S.; Turriziani, O.; Antonelli, G.; et al. CRISPR/Cas9 Ablation of Integrated HIV-1 Accumulates Proviral DNA Circles with Reformed Long Terminal Repeats. J. Virol. 2021, 95, e0135821. [Google Scholar] [CrossRef] [PubMed]
- Prabha, S.; Arya, G.; Chandra, R.; Ahmed, B.; Nimesh, S. Effect of size on biological properties of nanoparticles employed in gene delivery. Artif. Cells Nanomed. Biotechnol. 2016, 44, 83–91. [Google Scholar] [CrossRef] [PubMed]
- Bordi, F.; Chronopoulou, L.; Palocci, C.; Bomboi, F.; Di Martino, A.; Cifani, N.; Pompili, B.; Ascenzioni, F.; Sennato, S. Chitosan–DNA complexes: Effect of molecular parameters on the efficiency of delivery. Colloids Surf. A Physicochem. Eng. Asp. 2014, 460, 184–190. [Google Scholar] [CrossRef]
- Islam, M.A.; Barua, S.; Barua, D. A multiscale modeling study of particle size effects on the tissue penetration efficacy of drug-delivery nanoparticles. BMC Syst. Biol. 2017, 11, 113. [Google Scholar] [CrossRef] [PubMed] [Green Version]
- Sharaf, O.Z.; Taylor, R.A.; Abu-Nada, E. On the Colloidal and Chemical Stability of Solar Nanofluids: From Nanoscale Interactions to Recent Advances. Phys. Rep. 2020, 867, 1–84. [Google Scholar] [CrossRef]
- Yan, J.; Ye, Z.; Luo, H.; Chen, M.; Zhou, Y.; Tan, W.; Xiao, Y.; Zhang, Y.; Lang, M. Synthesis, characterization, fluorescence labeling and cellular internalization of novel amine-functionalized poly(ethylene glycol)-block-poly(ε-caprolactone) amphiphilic block copolymers. Polym. Chem. 2011, 2, 1331–1340. [Google Scholar] [CrossRef]
- Pereira, A.G.B.; Muniz, E.C.; Hsieh, Y.L. 1H NMR and 1H–13C HSQC surface characterization of chitosan–chitin sheath-core nanowhiskers. Carb. Pol. 2015, 123, 46–52. [Google Scholar] [CrossRef] [Green Version]
- Costin, J.M. Cytopathic Mechanisms of HIV. Virol. J. 2007, 4, 100. [Google Scholar] [CrossRef] [Green Version]
- Nieva, J.; Madan, V.; Carrasco, L. Viroporins: Structure and biological functions. Nat. Rev. Microbiol. 2012, 10, 563–574. [Google Scholar] [CrossRef]
- Meng, Q.; Sun, Y.; Cong, H.; Hu, H.; Xu, F.J. An overview of chitosan and its application in infectious diseases. Drug Deliv. Transl. Res. 2021, 11, 1340–1351. [Google Scholar] [CrossRef]
- Cheung, R.C.; Ng, T.B.; Wong, J.H.; Chan, W.Y. Chitosan: An Update on Potential Biomedical and Pharmaceutical Applications. Mar. Drugs 2015, 13, 5156–5186. [Google Scholar] [CrossRef] [PubMed]
- Boroumand, H.; Badie, F.; Mazaheri, S.; Seyedi, Z.S.; Nahand, J.S.; Nejati, M.; Baghi, H.B.; Abbasi-Kolli, M.; Badehnoosh, B.; Ghandali, M.; et al. Chitosan-Based Nanoparticles Against Viral Infections. Front. Cell. Infect. Microbiol. 2021, 11, 643953. [Google Scholar] [CrossRef] [PubMed]
- Pyrć, K.; Milewska, A.; Barreto Duran, E.; Botwina, P.; Dabrowska, A.; Jedrysik, M.; Benedyk, M.; Lopes, R.; Arenas-Pinto, A.; Badr, M.; et al. SARS-CoV-2 inhibition using a mucoadhesive, amphiphilic chitosan that may serve as an anti-viral nasal spray. Sci. Rep. 2021, 11, 20012. [Google Scholar] [CrossRef] [PubMed]
- Leitgeb, M.; Knez, Ž.; Primožič, M. Sustainable technologies for liposome preparation. J. Supercrit. Fluids 2020, 165, 104984. [Google Scholar]


| N/P | CS (mg) | HsDNA or siRNA (µg) |
|---|---|---|
| 5 | 1 | 320 |
| 10 | 1 | 160 |
| 20 | 1 | 80 |
| N/P | PEI (mg) | hsDNA or siRNA (µg) |
|---|---|---|
| 10 | 214 | 160 |
| 20 | 214 | 80 |
| MW (kDa) | N/P 5 | N/P 10 | N/P 20 |
|---|---|---|---|
| 50 | 546.6 nm | 560.3 nm | 639.3 nm |
| 150 | 443.1 nm | 456.8 nm | 593.3 nm |
| MW (kDa) | N/P 5 | N/P 10 | N/P 20 |
|---|---|---|---|
| 50 | +16.0 | +35.0 | +48.0 |
| 150 | +10.0 | +12.0 | +16.0 |
| Ø (nm) | PdI | Z-Potential (mV) | EE (%) |
|---|---|---|---|
| 432.2 | 0.3 | +40.2 | 79.9 ± 4.8 |
| Ø (nm) | PdI | Z-Potential (mV) | EE (%) | |
|---|---|---|---|---|
| PEI/siRNA | 88.7 | 0.2 | +38 | 93.0 ± 3.2 |
| Escort/siRNA | 150.2 | 0.3 | 0 | 95.0 ± 2.8 |
| Pre-Infection | Post-Infection | Control | |
|---|---|---|---|
| C8166 FITC+ | 46.1% | 63.3% | 75.5% |
Publisher’s Note: MDPI stays neutral with regard to jurisdictional claims in published maps and institutional affiliations. |
© 2022 by the authors. Licensee MDPI, Basel, Switzerland. This article is an open access article distributed under the terms and conditions of the Creative Commons Attribution (CC BY) license (https://creativecommons.org/licenses/by/4.0/).
Share and Cite
Chronopoulou, L.; Falasca, F.; Di Fonzo, F.; Turriziani, O.; Palocci, C. siRNA Transfection Mediated by Chitosan Microparticles for the Treatment of HIV-1 Infection of Human Cell Lines. Materials 2022, 15, 5340. https://doi.org/10.3390/ma15155340
Chronopoulou L, Falasca F, Di Fonzo F, Turriziani O, Palocci C. siRNA Transfection Mediated by Chitosan Microparticles for the Treatment of HIV-1 Infection of Human Cell Lines. Materials. 2022; 15(15):5340. https://doi.org/10.3390/ma15155340
Chicago/Turabian StyleChronopoulou, Laura, Francesca Falasca, Federica Di Fonzo, Ombretta Turriziani, and Cleofe Palocci. 2022. "siRNA Transfection Mediated by Chitosan Microparticles for the Treatment of HIV-1 Infection of Human Cell Lines" Materials 15, no. 15: 5340. https://doi.org/10.3390/ma15155340
APA StyleChronopoulou, L., Falasca, F., Di Fonzo, F., Turriziani, O., & Palocci, C. (2022). siRNA Transfection Mediated by Chitosan Microparticles for the Treatment of HIV-1 Infection of Human Cell Lines. Materials, 15(15), 5340. https://doi.org/10.3390/ma15155340