
Multi-Response Optimisation of Automotive Door Using Grey Relational Analysis with Entropy Weights


Abstract
:1. Introduction
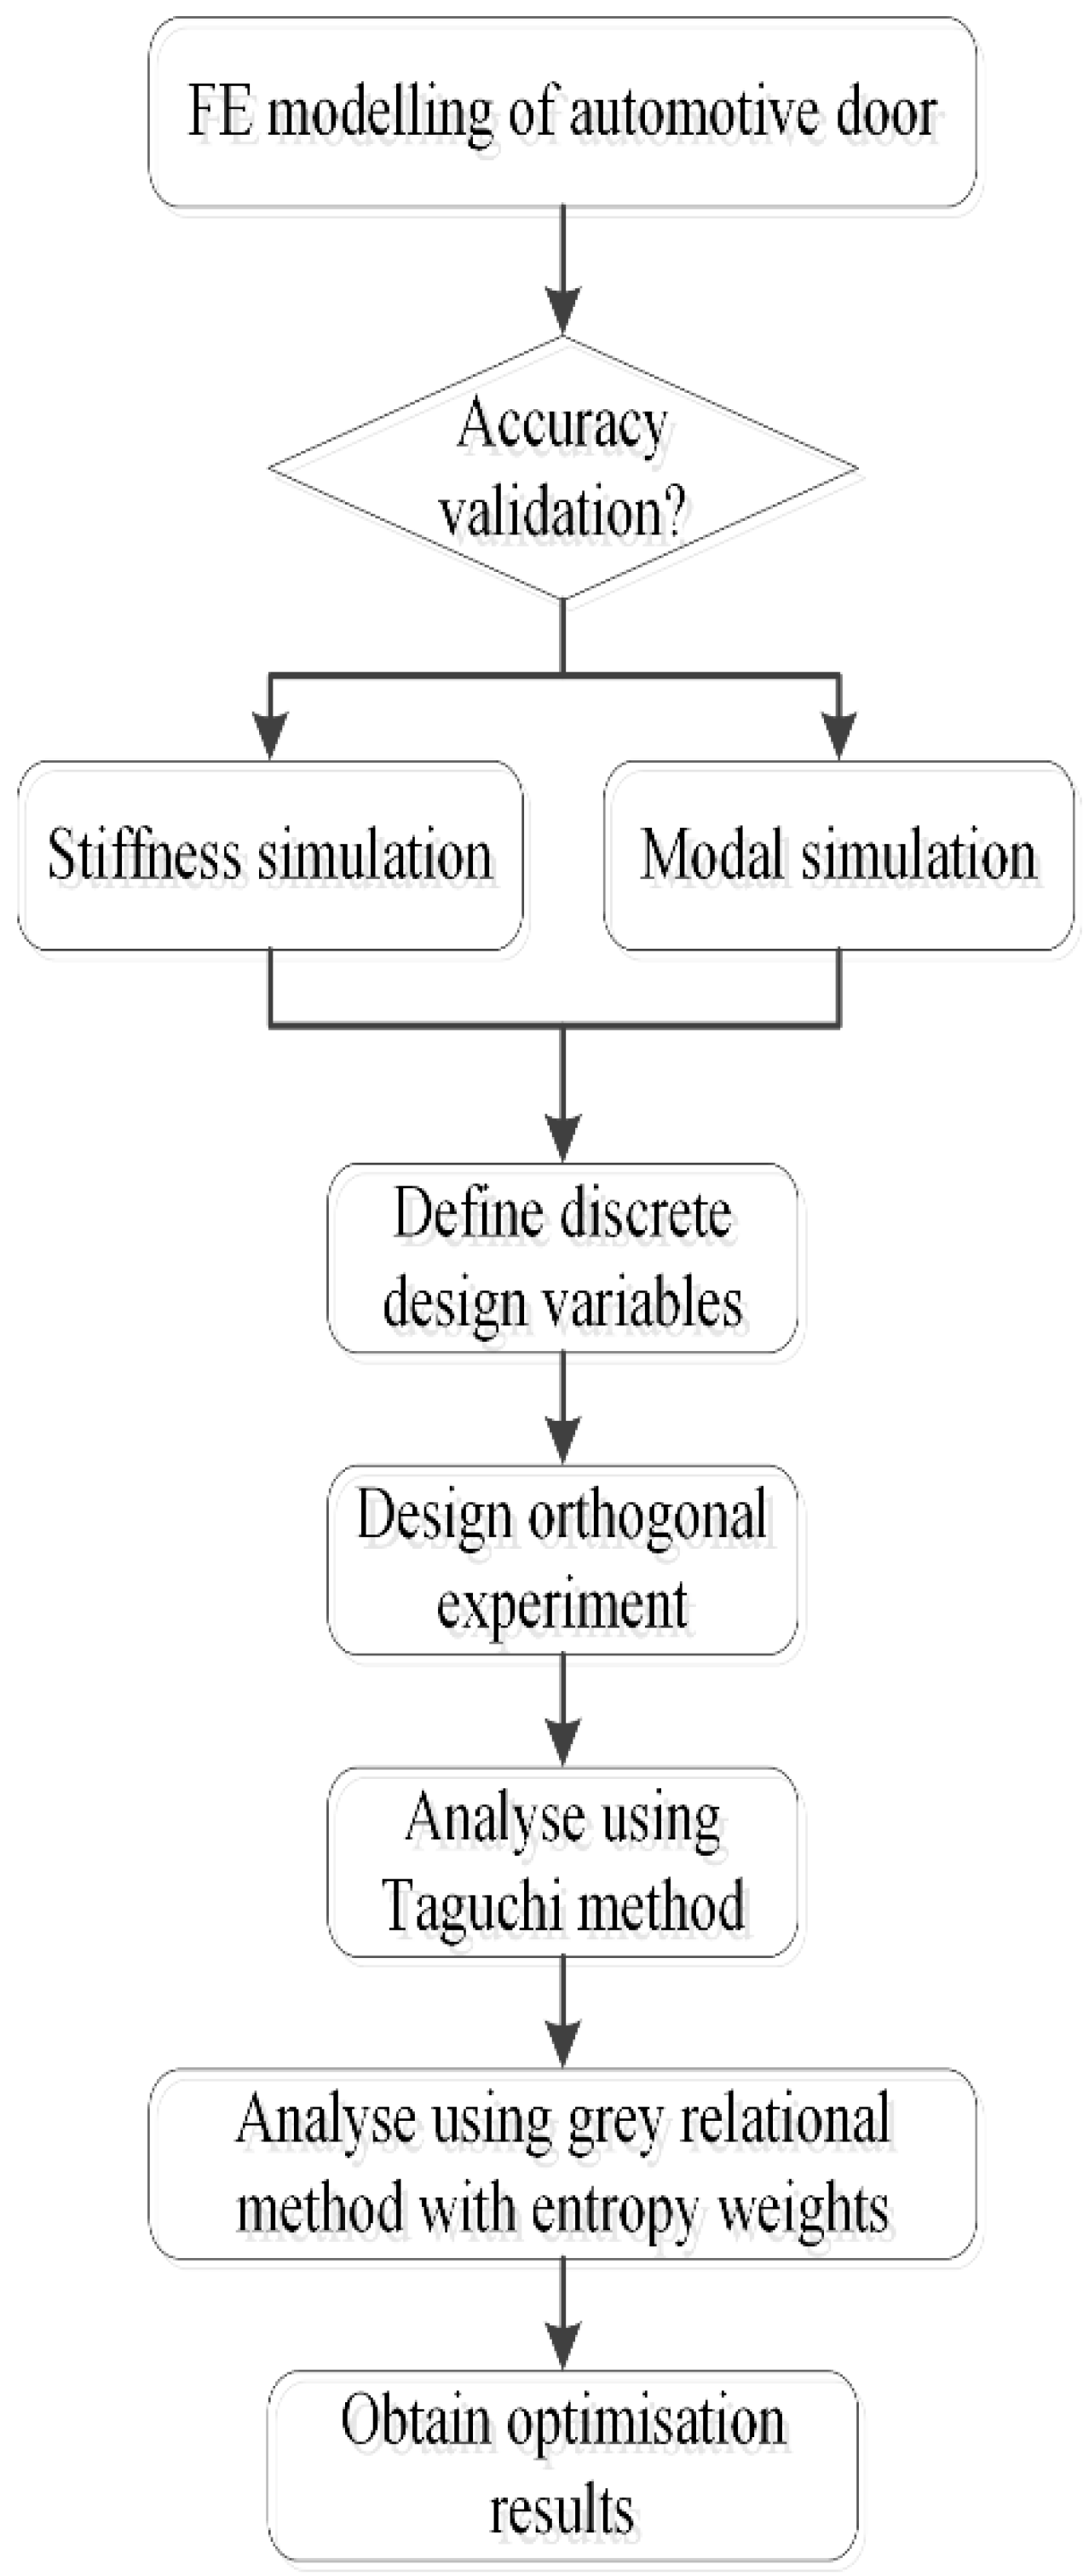
2. Methodology
2.1. Taguchi Method
2.2. Grey Relational Analysis with Entropy Weights
3. Finite Element Modelling and Experiment Validation for Automotive Door
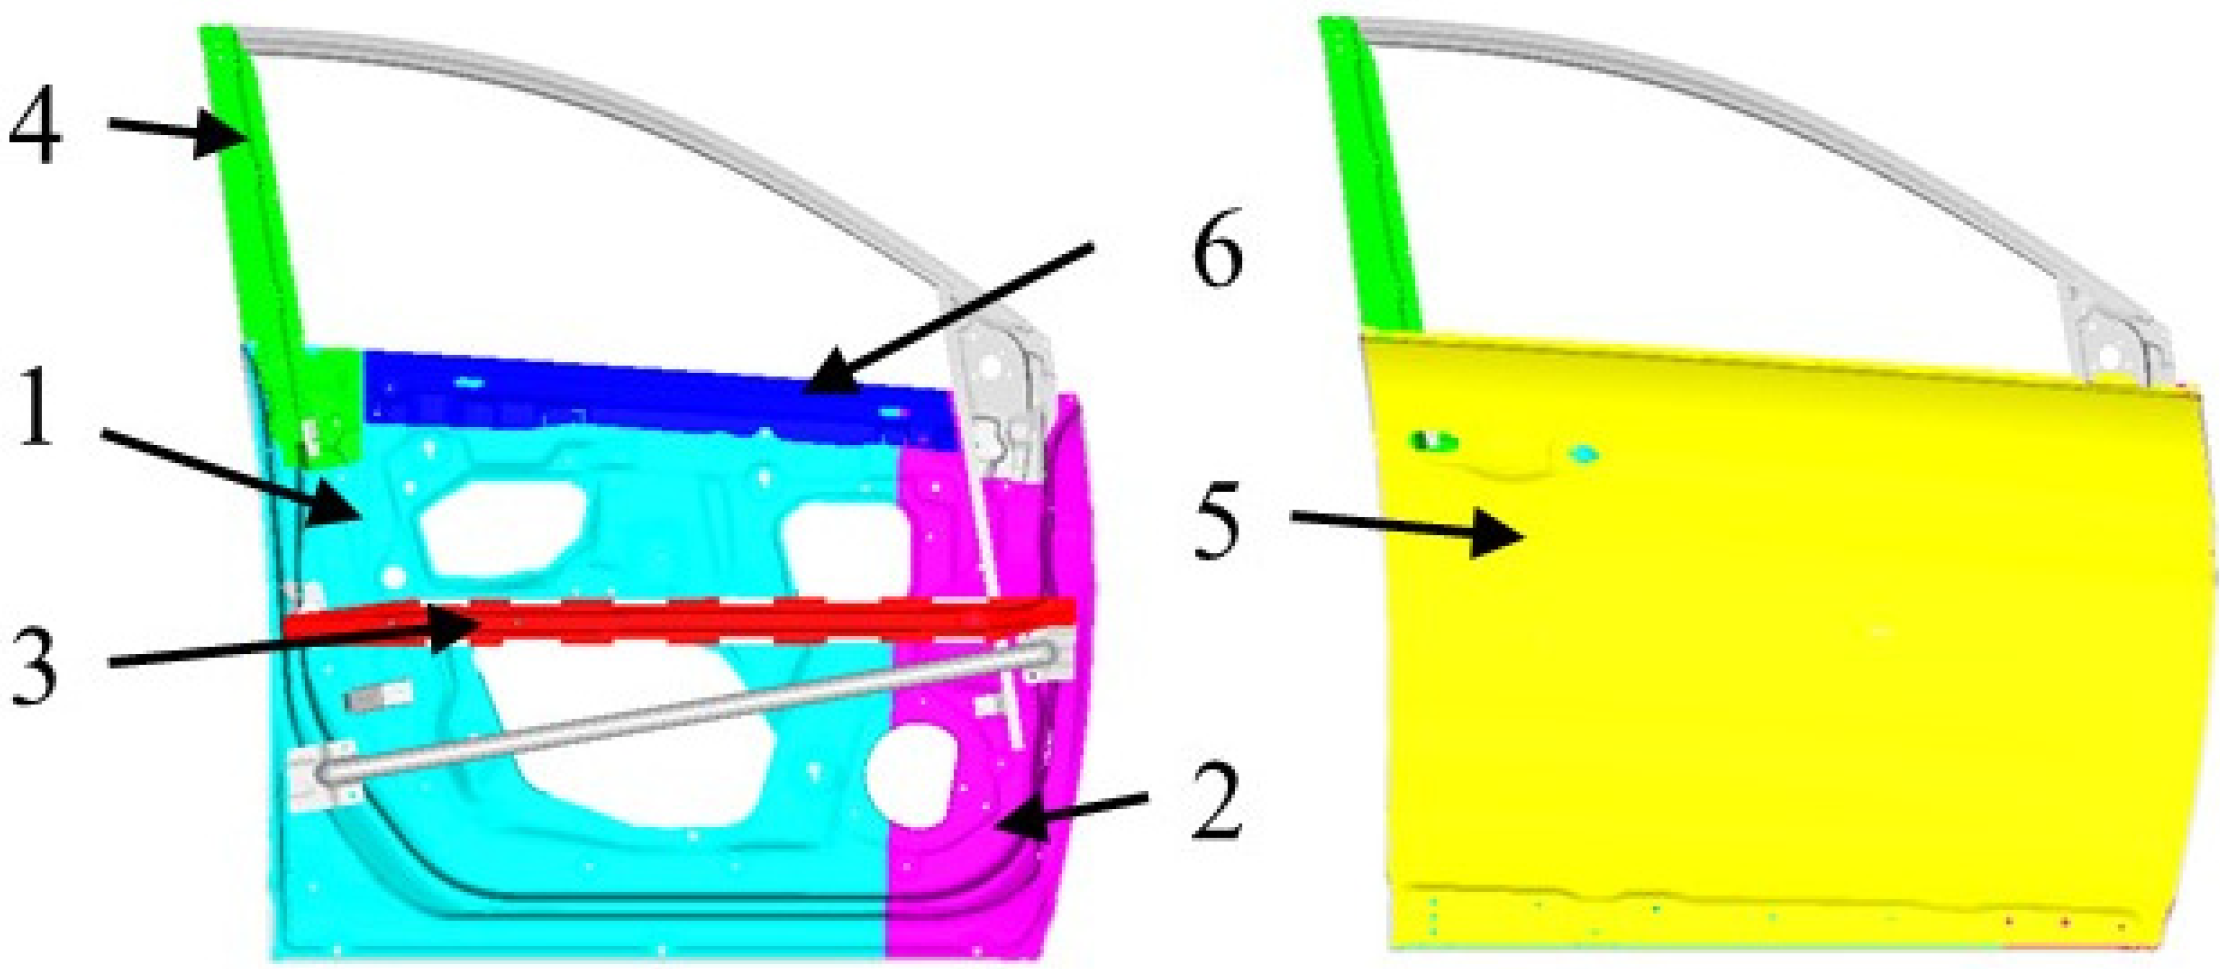
3.1. Finite Element Modelling
3.2. Experiment Validation
4. Multi-Objective Optimisation of Automotive Door
4.1. Design Variables
4.2. Multi-Objective Optimisation Model
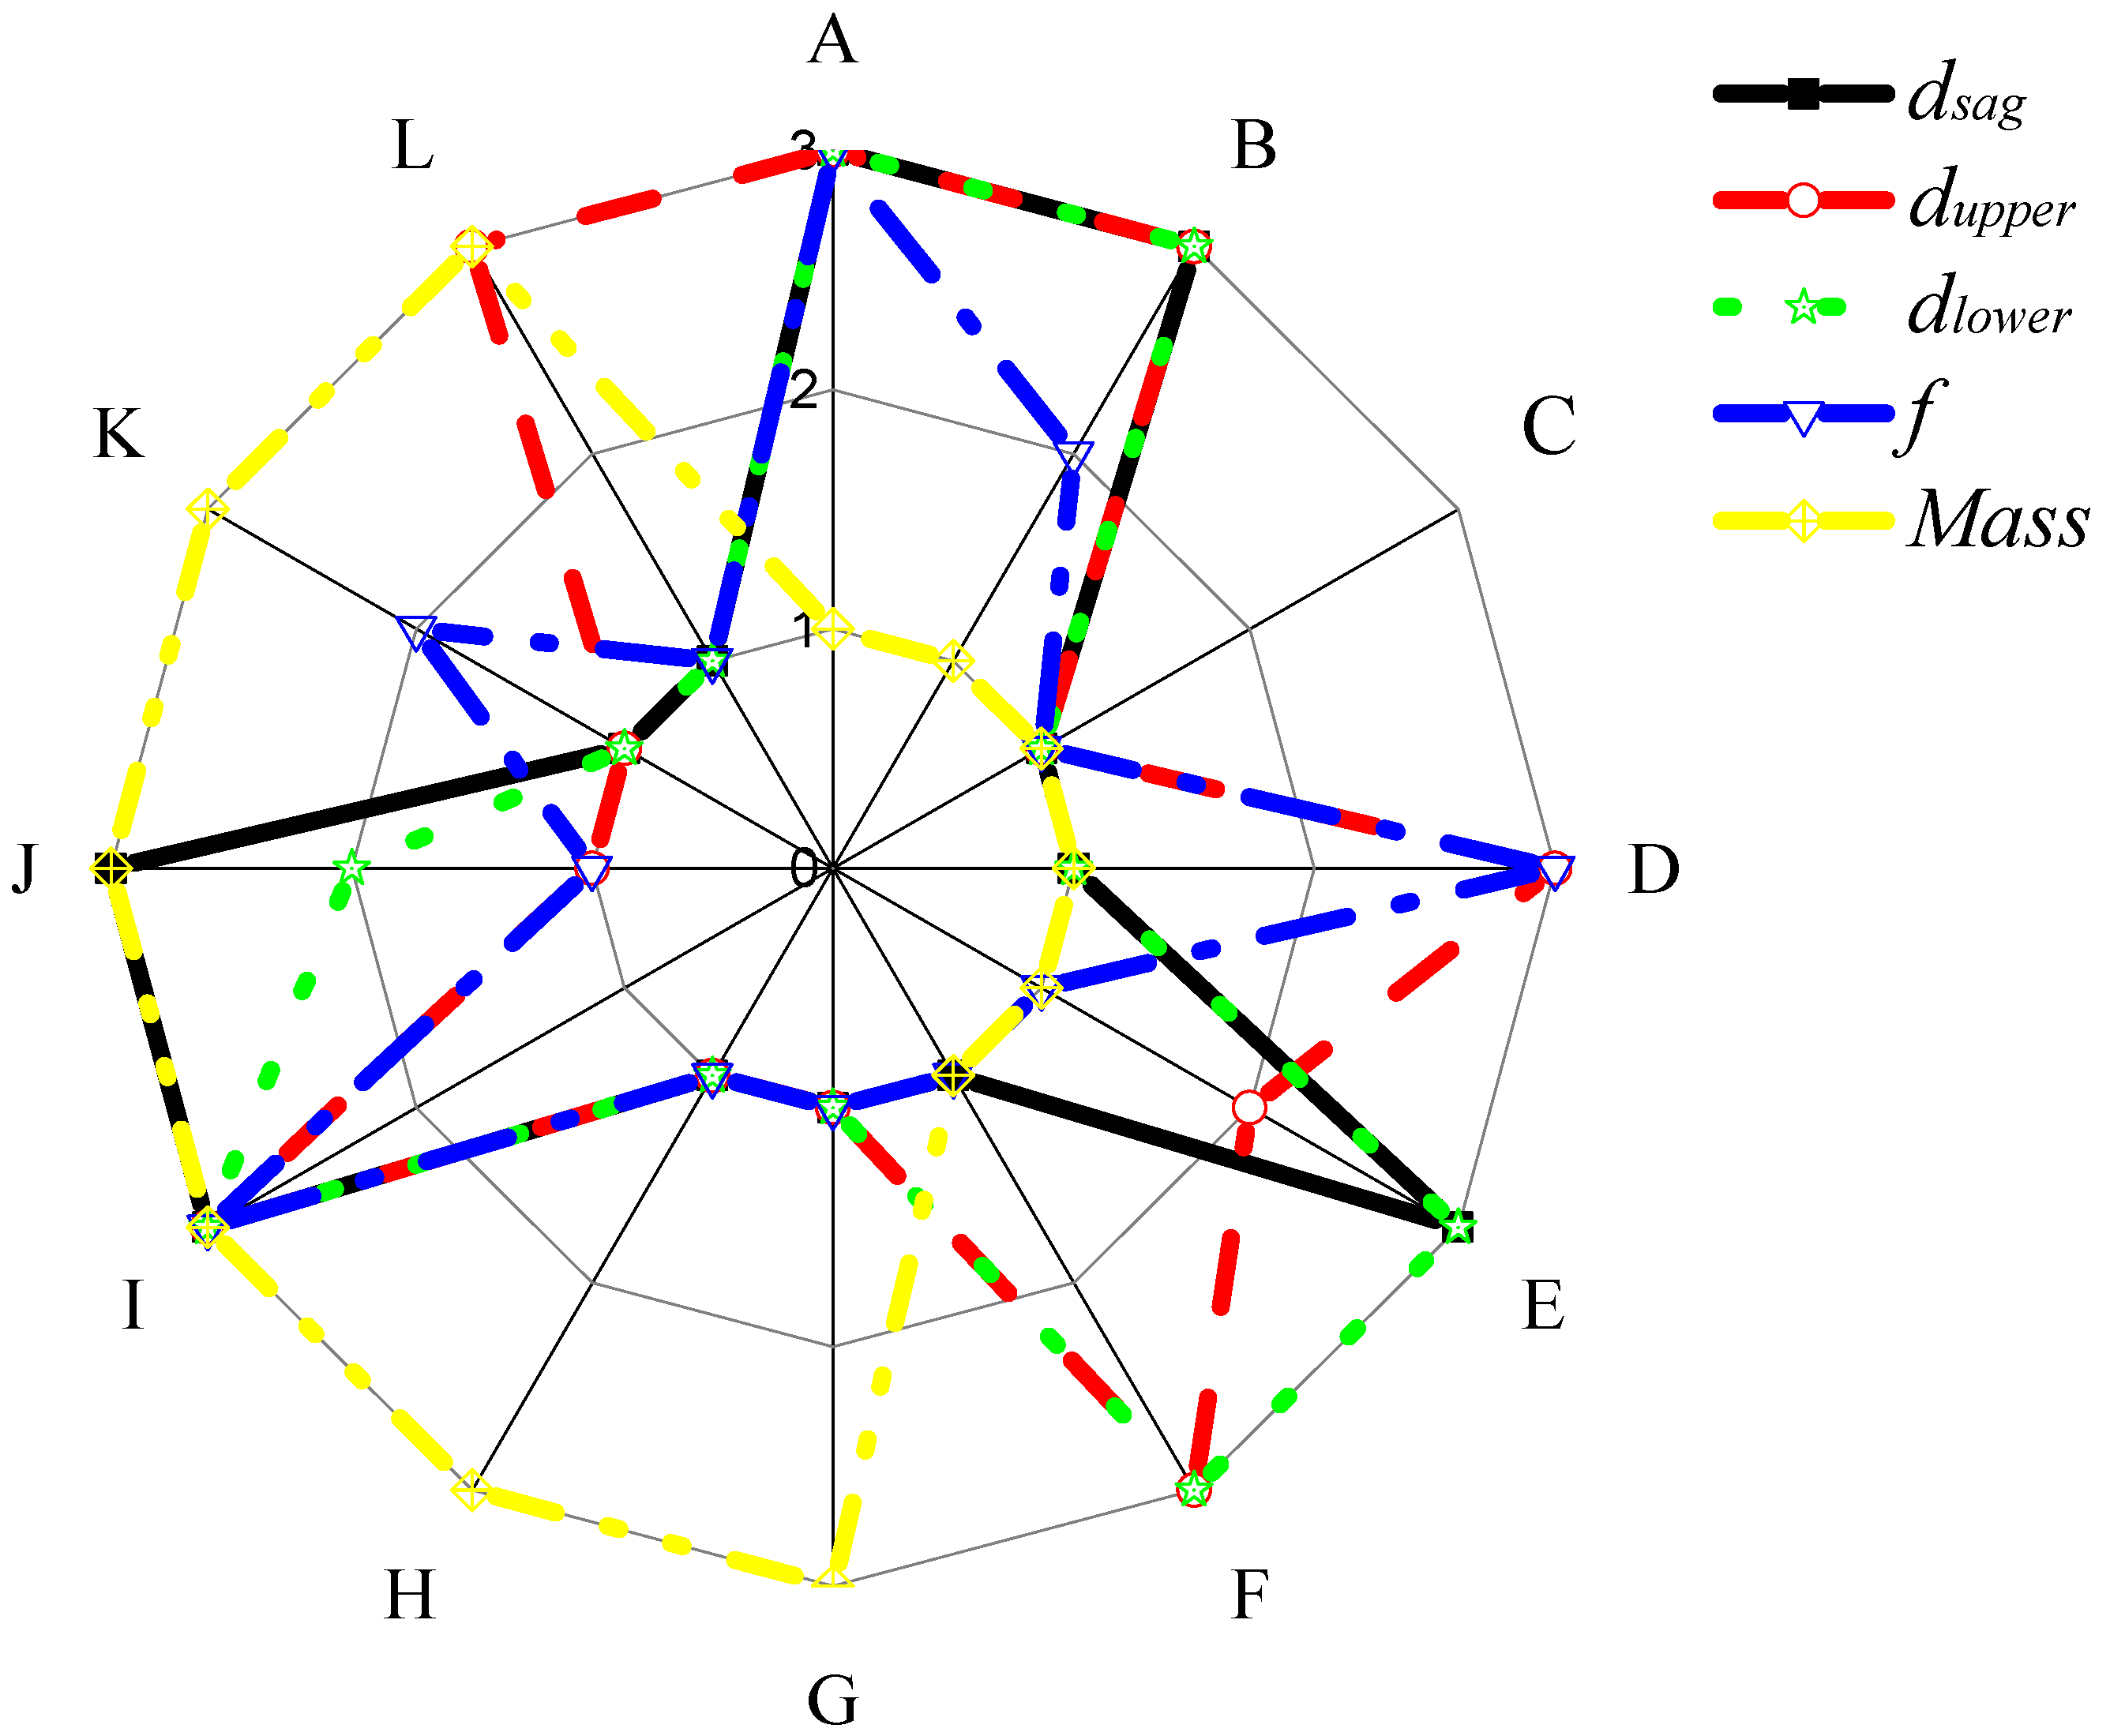
4.3. Analysis of S/N Ratios
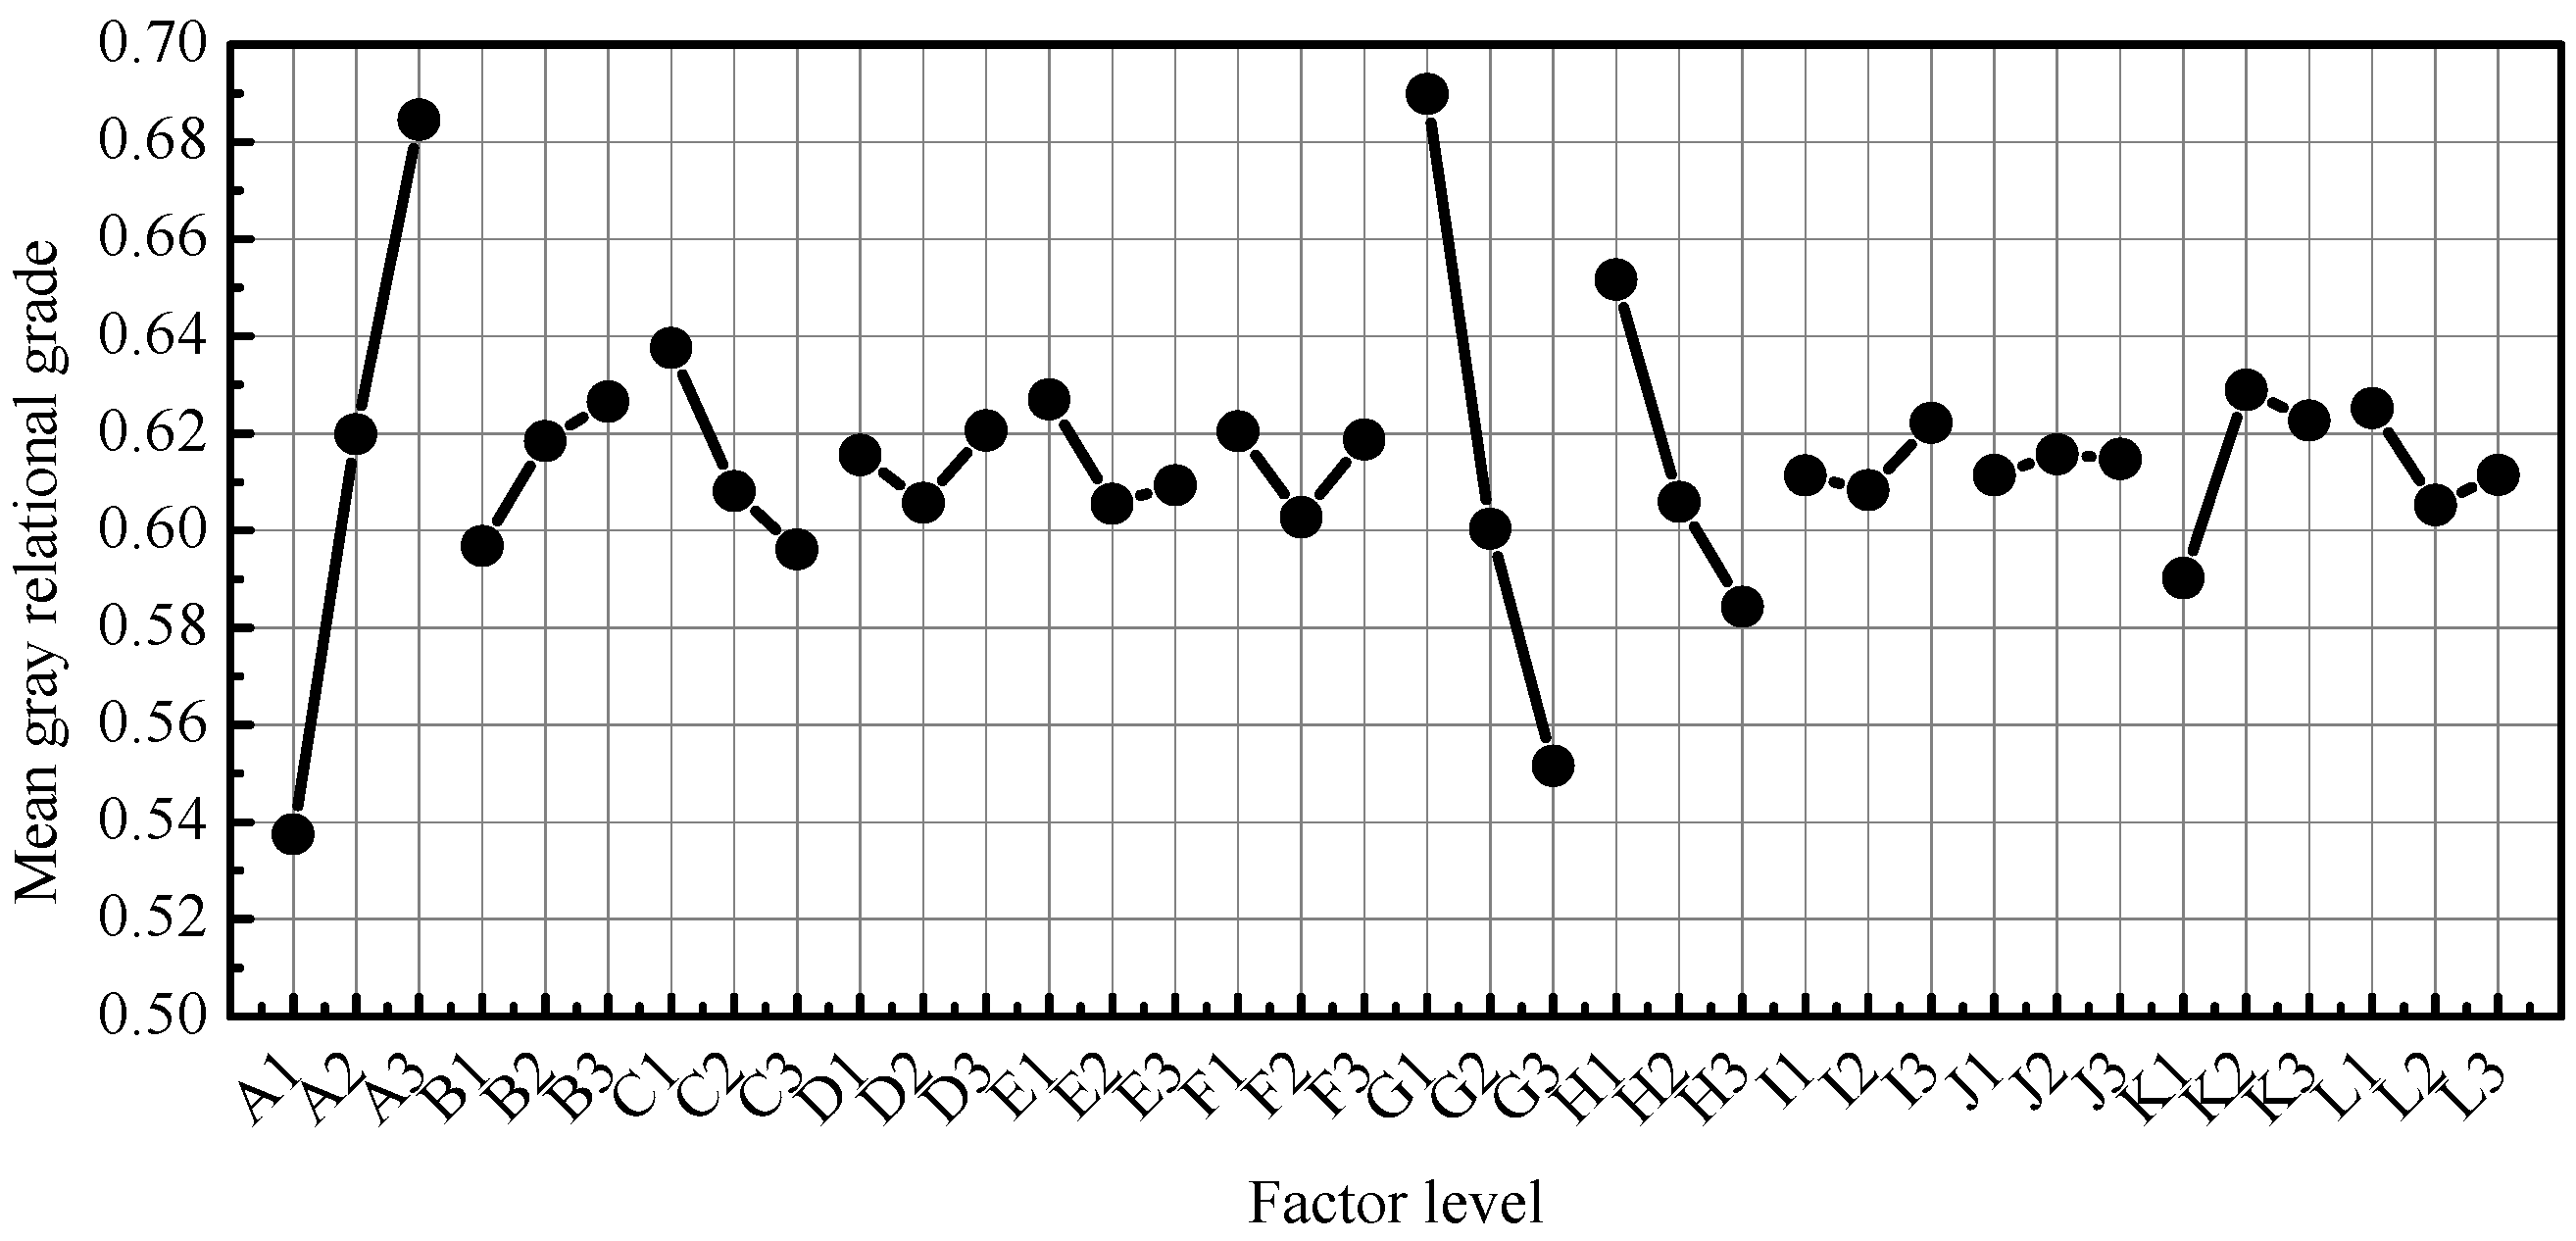
4.4. Grey Relational Analysis
5. Conclusions
- (1)
- A multi-objective discrete optimisation design was successfully developed through grey relational analysis of the S/N ratio. With only 27 iterations, this method is a discrete optimisation design with low computational costs and cost-effectiveness. Thus, it is more suitable than conventional methods for complex optimisation problems.
- (2)
- The grey relational method is feasible for optimisation. The Taguchi method and grey relational method were used to analyse the results. The number of experiments was reduced, and the influence of each parameter on the results was measured. The entropy weight method was used to obtain the weight value of each target response and determine the optimal combination of structural parameters. Grey relational analysis with entropy weights can significantly improve the comprehensive structure performance.
- (3)
- The optimisation results indicated that the weight of the door structure was reduced by 2.83 kg. The performance of the door increased and decreased but met all baseline design requirements. This method can effectively realise lightweight door design and has a high value in engineering applications.
Author Contributions
Funding
Institutional Review Board Statement
Informed Consent Statement
Data Availability Statement
Acknowledgments
Conflicts of Interest
References
- Volpe, V.; Lanzillo, S.; Affinita, G.; Villacci, B.; Pantani, R. Lightweight High-Performance Polymer Composite for Automotive Applications. Polymers 2019, 11, 326. [Google Scholar] [CrossRef] [PubMed] [Green Version]
- Lee, J.M.; Min, B.J.; Park, J.H.; Kim, D.H.; Kim, B.M.; Ko, D.C. Design of Lightweight Cfrp Automotive Part as an Alternative for Steel Part by Thickness and Lay-Up Optimization. Materials 2019, 12, 2309. [Google Scholar] [CrossRef] [PubMed] [Green Version]
- Jung, Y.; Lim, S.; Kim, J.; Min, S. Lightweight Design of Electric Bus Roof Structure Using Multi-Material Topology Optimisation. Struct. Multidiscip. Optim. 2020, 61, 1273–1285. [Google Scholar] [CrossRef]
- Wang, C.Q.; Wang, D.F.; Zhang, S. Design and Application of Lightweight Multi-Objective Collaborative Optimization for a Parametric Body-in-White Structure. Proc. Inst. Mech. Eng. Part D J. Automob. 2016, 230, 273–288. [Google Scholar] [CrossRef]
- Xu, F.X.; Wan, X.J.; Chen, Y.S. Design Optimization of Thin-Walled Circular Tubular Structures with Graded Thickness under Later Impact Loading. Int. J. Automot. Technol. 2017, 18, 439–449. [Google Scholar] [CrossRef]
- Wang, J.; Zhang, Y.; He, N.; Wang, C.H. Crashworthiness Behavior of Koch Fractal Structures. Mater. Des. 2018, 144, 229–244. [Google Scholar] [CrossRef]
- Lee, K.H.; Kang, D.H. Structural Optimization of an Automotive Door Using the Kriging Interpolation Method. Proc. Inst. Mech. Eng. Part D J. Automob. 2007, 221, 1525–1534. [Google Scholar] [CrossRef]
- Fang, J.G.; Gao, Y.K.; Sun, G.Y.; Xu, C.M.; Li, Q. Multiobjective Sequential Optimization for a Vehicle Door Using Hybrid Materials Tailor-Welded Structure. Proc. Inst. Mech. Eng. Part C J. Mech. 2016, 230, 3092–3100. [Google Scholar] [CrossRef]
- Zhu, P.; Shi, Y.L.; Zhang, K.Z.; Lin, Z.Q. Optimum Design of an Automotive Inner Door Panel with a Tailor-Welded Blank Structure. Proc. Inst. Mech. Eng. Part D J. Automob. 2008, 222, 1337–1348. [Google Scholar] [CrossRef]
- Xu, F.X.; Zhang, S.; Wu, K.Y.; Dong, Z.A. Multi-Response Optimization Design of Tailor-Welded Blank (Twb) Thin-Walled Structures Using Taguchi-Based Gray Relational Analysis. Thin Wall. Struct. 2018, 131, 286–296. [Google Scholar] [CrossRef]
- Li, G.Y.; Xu, F.X.; Huang, X.D.; Sun, G.Y. Topology Optimization of an Automotive Tailor-Welded Blank Door. J. Mech. Design 2015, 137, 055001. [Google Scholar] [CrossRef]
- Zhao, Y.; Dong, H.; Liang, H. Robust Design Optimization of Car-Door Structures with Spatially Varied Material Uncertainties. Math. Probl. Eng. 2020, 2020, 8835267. [Google Scholar] [CrossRef]
- Mohamad, N.R.; Wee, M.; Mohamed, M.A.; Hamzah, A.A.; Menon, P.S. Multi-Response Optimization of Chromium/Gold-Based Nanofilm Kretschmann-Based Surface Plasmon Resonance Glucose Sensor Using Finite-Difference Time-Domain and Taguchi Method. Nanomater. Nanotechnol. 2020, 10, 1847980420982119. [Google Scholar] [CrossRef]
- Gao, L.; Adesina, A.; Das, S. Properties of Eco-Friendly Basalt Fibre Reinforced Concrete Designed by Taguchi Method. Constr. Build. Mater. 2021, 302, 124161. [Google Scholar] [CrossRef]
- Sun, X.D.; Shi, Z.; Zhu, J.G. Multiobjective Design Optimization of an Ipmsm for Evs Based on Fuzzy Method and Sequential Taguchi Method. IEEE Trans. Ind. Electron. 2021, 68, 10592–10600. [Google Scholar] [CrossRef]
- Liu, W.L.; Yang, Y.; Zheng, R.; Wang, P.P. Robust Optimization for Suspension Parameters of Suspended Monorail Vehicle Using Taguchi Method and Kriging Surrogate Model. J. Chin. Soc. Mech. Eng. 2019, 40, 481–489. [Google Scholar]
- Shrestha, S.; Manogharan, G. Optimization of Binder Jetting Using Taguchi Method. JOM 2017, 69, 491–497. [Google Scholar] [CrossRef]
- Tran, Q.P.; Nguyen, V.N.; Huang, S.C. Drilling Process on Cfrp: Multi-Criteria Decision-Making with Entropy Weight Using Grey-Topsis Method. Appl. Sci. 2020, 10, 7207. [Google Scholar] [CrossRef]
- Wang, D.F.; Li, S.H.; Xie, C. Crashworthiness Optimisation and Lightweight for Front-End Safety Parts of Automobile Body Using a Hybrid Optimisation Method. Int. J. Crashworthiness 2022, 27, 1193–1204. [Google Scholar] [CrossRef]
- Wang, Z.H.; Yang, P.X.; Peng, H.; Li, C.; Yue, C.N.; Li, W.J.; Jiang, X.F. Comprehensive Evaluation of 47 Tea [Camellia Sinensis (L.) O. Kuntze] Germplasm Based on Entropy Weight Method and Grey Relational Degree. Genet. Resour. Crop Evol. 2021, 68, 3257–3270. [Google Scholar] [CrossRef]
- She, Y.L.; Zhang, W.T.; Liang, G.L.; Tang, Y.; Tu, S. Optimal Design of Large Mode Area All-Solid-Fiber Using a Gray Relational Optimization Technique. Optik 2021, 242, 167188. [Google Scholar]
- Dabwan, A.; Ragab, A.E.; Saleh, M.A.; Ghaleb, A.M.; Ramadan, M.Z.; Mian, S.H.; Khalaf, T.M. Multiobjective Optimization of Process Variables in Single-Point Incremental Forming Using Grey Relational Analysis Coupled with Entropy Weights. Proc. Inst. Mech. Eng. Part L J. Mater. 2021, 235, 2056–2070. [Google Scholar] [CrossRef]
- Yuvaraj, T.; Suresh, P. Analysis of Edm Process Parameters on Inconel 718 Using the Grey-Taguchi and Topsis Methods. Stroj. Vestn. J. Mech. Eng. 2019, 65, 557–564. [Google Scholar] [CrossRef]
- Rao, R.; Yadava, V. Multi-Objective Optimization of Nd:Yag Laser Cutting of Thin Superalloy Sheet Using Grey Relational Analysis with Entropy Measurement. Opt. Laser Technol. 2009, 41, 922–930. [Google Scholar] [CrossRef]
- Zhang, X.; Jin, F.; Liu, P.D. A Grey Relational Projection Method for Multi-Attribute Decision Making Based on Intuitionistic Trapezoidal Fuzzy Number. Appl. Math. Model. 2013, 37, 3467–3477. [Google Scholar] [CrossRef]
- Lotfi, F.H.; Fallahnejad, R. Imprecise Shannon’s Entropy and Multi Attribute Decision Making. Entropy 2010, 12, 53–62. [Google Scholar] [CrossRef] [Green Version]
- Xiong, F.; Wang, D.F.; Ma, Z.D.; Lv, T.T.; Ji, L.B. Lightweight Optimization of the Front End Structure of an Automobile Body Using Entropy-Based Grey Relational Analysis. Proc. Inst. Mech. Eng. Part D J. Automob. 2019, 233, 917–934. [Google Scholar] [CrossRef] [Green Version]
- Cui, X.T.; Wang, S.X.; Hu, S.J. A Method for Optimal Design of Automotive Body Assembly Using Multi-Material Construction. Mater. Des. 2008, 29, 381–387. [Google Scholar] [CrossRef]


| Material | Young’s Modulus (MPa) | Mass Density (kg/m3) | Poisson’s Ratio |
|---|---|---|---|
| High-strength steel | 2.1 × 10⁵ | 7.85 × 10³ | 0.3 |
| Glass | 6.9 × 10⁴ | 2.5 × 10³ | 0.3 |
| Adhesive | 50 | 1.2 × 10³ | 0.49 |
| Parameter | Simulation | Experiment | Error (%) |
|---|---|---|---|
| Mass, M (kg) | 27.71 | 28.03 | −1.14 |
| Natural frequency, f (Hz) | 42.68 | 40.92 | 4.30 |
| Vertical sag, dsag (mm) | 1.64 | 1.67 | −1.80 |
| Upper lateral, dupper (mm) | 1.03 | 1.06 | −2.83 |
| Lower lateral, dlower (mm) | 13.28 | 13.36 | −0.60 |
| ID | Material | Elastic Modulus (GPa) | Poisson’s Ratio | Density (kg/m3) |
|---|---|---|---|---|
| 1 | Steel | 210 | 0.30 | 7850 |
| 2 | Aluminium | 72 | 0.30 | 2770 |
| 3 | Magnesium | 45 | 0.33 | 1740 |
| Design Variable | Value Range | ||
|---|---|---|---|
| Level 1 | Level 2 | Level 3 | |
| A (mm) | 0.5 | 0.7 | 0.9 |
| B (mm) | 1.2 | 1.4 | 1.6 |
| C (mm) | 0.5 | 0.6 | 0.8 |
| D (mm) | 0.6 | 0.8 | 1.0 |
| E (mm) | 0.5 | 0.7 | 0.9 |
| F (mm) | 0.6 | 0.8 | 1.0 |
| G | DP500 | ADC12 | AM60 |
| H | DP500 | ADC12 | AM60 |
| I | DP500 | ADC12 | AM60 |
| J | DP500 | ADC12 | AM60 |
| K | DP500 | ADC12 | AM60 |
| L | DP500 | ADC12 | AM60 |
| No. | dsag (mm) | S/N | dupper (mm) | S/N | dlower (mm) | S/N | f (Hz) | S/N | M (kg) | S/N |
|---|---|---|---|---|---|---|---|---|---|---|
| 1 | 2.411 | −7.667 | 1.720 | −4.858 | 1.06 | −16.106 | 37.74 | 31.598 | 24.49 | −27.833 |
| 2 | 6.571 | −16.393 | 4.006 | −12.213 | 2.33 | −22.941 | 29.83 | 29.434 | 19.08 | −25.647 |
| 3 | 10.070 | −20.106 | 5.786 | −15.409 | 3.22 | −25.744 | 26.65 | 28.461 | 18.01 | −25.142 |
| 4 | 4.786 | −13.594 | 2.119 | −6.628 | 1.49 | −18.991 | 37.44 | 31.462 | 19.98 | −26.032 |
| 5 | 6.771 | −16.661 | 3.859 | −11.890 | 2.11 | −22.090 | 29.61 | 29.365 | 22.05 | −26.966 |
| 6 | 2.303 | −7.267 | 4.316 | −12.884 | 2.44 | −23.357 | 27.15 | 28.611 | 21.70 | −26.770 |
| 7 | 5.115 | −14.196 | 2.080 | −6.484 | 1.39 | −18.421 | 37.21 | 31.405 | 20.13 | −26.092 |
| 8 | 1.922 | −5.636 | 3.075 | −9.930 | 2.51 | −23.627 | 30.49 | 29.623 | 21.50 | −26.661 |
| 9 | 3.637 | −11.256 | 4.576 | −13.388 | 2.41 | −23.262 | 26.53 | 28.369 | 23.80 | −27.649 |
| 10 | 2.672 | −8.568 | 3.079 | −9.939 | 1.86 | −20.958 | 32.44 | 30.156 | 22.16 | −26.976 |
| 11 | 6.107 | −15.753 | 1.127 | −1.154 | 0.92 | −14.776 | 39.55 | 31.946 | 22.20 | −26.943 |
| 12 | 9.520 | −19.616 | 2.362 | −7.615 | 1.70 | −20.178 | 37.19 | 31.335 | 19.30 | −25.739 |
| 13 | 5.049 | −14.064 | 3.088 | −9.940 | 2.30 | −22.770 | 32.89 | 30.278 | 18.70 | −25.456 |
| 14 | 6.331 | −16.075 | 1.318 | −2.510 | 0.82 | −13.844 | 37.02 | 31.360 | 24.92 | −28.003 |
| 15 | 1.957 | −5.840 | 2.514 | −8.152 | 1.41 | −18.540 | 36.24 | 31.111 | 21.73 | −26.782 |
| 16 | 5.394 | −14.661 | 3.277 | −10.464 | 2.28 | −22.725 | 32.65 | 30.214 | 18.53 | −25.383 |
| 17 | 1.554 | −3.768 | 1.335 | −2.399 | 0.89 | −14.446 | 41.41 | 32.304 | 23.81 | −27.551 |
| 18 | 3.264 | −10.315 | 1.959 | −6.009 | 1.31 | −17.953 | 37.54 | 31.417 | 24.28 | −27.807 |
| 19 | 2.427 | −7.725 | 1.628 | −4.373 | 1.10 | −16.428 | 37.62 | 31.601 | 22.99 | −27.289 |
| 20 | 6.329 | −16.065 | 2.398 | −7.737 | 1.65 | −19.940 | 37.62 | 31.427 | 19.67 | −25.915 |
| 21 | 9.229 | −19.345 | 1.121 | −0.966 | 0.80 | −13.580 | 38.94 | 31.810 | 22.62 | −27.095 |
| 22 | 4.780 | −13.585 | 1.903 | −5.693 | 1.49 | −18.813 | 41.73 | 32.424 | 19.27 | −25.709 |
| 23 | 6.554 | −16.377 | 1.844 | −5.485 | 1.49 | −19.150 | 38.99 | 31.742 | 22.34 | −27.065 |
| 24 | 1.702 | −4.618 | 0.906 | 0.841 | 0.60 | −11.138 | 43.36 | 32.725 | 25.50 | −28.156 |
| 25 | 5.106 | −14.180 | 1.687 | −4.657 | 1.35 | −18.158 | 40.96 | 32.332 | 19.82 | −25.970 |
| 26 | 1.771 | −4.913 | 2.337 | −7.510 | 1.56 | −19.372 | 38.06 | 31.536 | 20.82 | −26.386 |
| 27 | 3.022 | −9.641 | 0.986 | 0.087 | 0.57 | −10.601 | 38.03 | 31.595 | 27.52 | −28.876 |
| No. | dsag | dupper | dlower | f | Mass | |||||
|---|---|---|---|---|---|---|---|---|---|---|
| NOR | GRC | NOR | GRC | NOR | GRC | NOR | GRC | NOR | GRC | |
| 1 | 0.239 | 0.396 | 0.351 | 0.435 | 0.364 | 0.440 | 0.741 | 0.659 | 0.721 | 0.641 |
| 2 | 0.773 | 0.687 | 0.803 | 0.718 | 0.815 | 0.730 | 0.245 | 0.398 | 0.135 | 0.366 |
| 3 | 1.000 | 1.000 | 1.000 | 1.000 | 1.000 | 1.000 | 0.021 | 0.338 | 0.000 | 0.333 |
| 4 | 0.601 | 0.556 | 0.460 | 0.481 | 0.554 | 0.529 | 0.710 | 0.633 | 0.238 | 0.396 |
| 5 | 0.789 | 0.703 | 0.783 | 0.698 | 0.759 | 0.674 | 0.229 | 0.393 | 0.489 | 0.494 |
| 6 | 0.214 | 0.389 | 0.845 | 0.763 | 0.842 | 0.760 | 0.056 | 0.346 | 0.436 | 0.470 |
| 7 | 0.638 | 0.580 | 0.451 | 0.477 | 0.516 | 0.508 | 0.697 | 0.623 | 0.254 | 0.401 |
| 8 | 0.114 | 0.361 | 0.663 | 0.597 | 0.860 | 0.781 | 0.288 | 0.412 | 0.407 | 0.457 |
| 9 | 0.458 | 0.480 | 0.876 | 0.801 | 0.836 | 0.753 | 0.000 | 0.333 | 0.671 | 0.603 |
| 10 | 0.294 | 0.415 | 0.663 | 0.598 | 0.684 | 0.613 | 0.410 | 0.459 | 0.491 | 0.496 |
| 11 | 0.734 | 0.652 | 0.123 | 0.363 | 0.276 | 0.408 | 0.821 | 0.737 | 0.482 | 0.491 |
| 12 | 0.970 | 0.943 | 0.520 | 0.510 | 0.632 | 0.576 | 0.681 | 0.611 | 0.160 | 0.373 |
| 13 | 0.630 | 0.575 | 0.663 | 0.598 | 0.804 | 0.718 | 0.438 | 0.471 | 0.084 | 0.353 |
| 14 | 0.753 | 0.670 | 0.206 | 0.386 | 0.214 | 0.389 | 0.687 | 0.615 | 0.766 | 0.681 |
| 15 | 0.127 | 0.364 | 0.553 | 0.528 | 0.524 | 0.512 | 0.629 | 0.574 | 0.439 | 0.471 |
| 16 | 0.667 | 0.600 | 0.696 | 0.622 | 0.801 | 0.715 | 0.424 | 0.464 | 0.065 | 0.348 |
| 17 | 0.000 | 0.333 | 0.199 | 0.384 | 0.254 | 0.401 | 0.903 | 0.838 | 0.645 | 0.585 |
| 18 | 0.401 | 0.455 | 0.422 | 0.464 | 0.485 | 0.493 | 0.700 | 0.625 | 0.714 | 0.636 |
| 19 | 0.242 | 0.398 | 0.321 | 0.424 | 0.385 | 0.448 | 0.742 | 0.660 | 0.575 | 0.540 |
| 20 | 0.753 | 0.669 | 0.528 | 0.514 | 0.617 | 0.566 | 0.702 | 0.627 | 0.207 | 0.387 |
| 21 | 0.953 | 0.915 | 0.111 | 0.360 | 0.197 | 0.384 | 0.790 | 0.704 | 0.523 | 0.512 |
| 22 | 0.601 | 0.556 | 0.402 | 0.455 | 0.542 | 0.522 | 0.931 | 0.879 | 0.152 | 0.371 |
| 23 | 0.772 | 0.687 | 0.389 | 0.450 | 0.565 | 0.534 | 0.774 | 0.689 | 0.515 | 0.508 |
| 24 | 0.052 | 0.345 | 0.000 | 0.333 | 0.035 | 0.341 | 1.000 | 1.000 | 0.807 | 0.722 |
| 25 | 0.637 | 0.580 | 0.338 | 0.430 | 0.499 | 0.500 | 0.910 | 0.847 | 0.222 | 0.391 |
| 26 | 0.070 | 0.350 | 0.514 | 0.507 | 0.579 | 0.543 | 0.727 | 0.647 | 0.333 | 0.429 |
| 27 | 0.359 | 0.438 | 0.046 | 0.344 | 0.000 | 0.333 | 0.741 | 0.659 | 1.000 | 1.000 |
| Factor | A | B | C | D | E | F | G | H | I | J | K | L | |
|---|---|---|---|---|---|---|---|---|---|---|---|---|---|
| dsag | Level 1 | 0.6255 | 0.5452 | 0.6510 | 0.6444 | 0.6396 | 0.6449 | 0.6630 | 0.8952 | 0.6370 | 0.6346 | 0.6626 | 0.6482 |
| Level 2 | 0.6441 | 0.6442 | 0.6369 | 0.6406 | 0.6296 | 0.6403 | 0.6387 | 0.5810 | 0.6407 | 0.6436 | 0.6400 | 0.6342 | |
| Level 3 | 0.6549 | 0.7351 | 0.6365 | 0.6395 | 0.6553 | 0.6393 | 0.6228 | 0.4483 | 0.6468 | 0.6463 | 0.6219 | 0.6420 | |
| Δ | 0.0293 | 0.1900 | 0.0145 | 0.0049 | 0.0257 | 0.0055 | 0.0402 | 0.4469 | 0.0098 | 0.0117 | 0.0407 | 0.0140 | |
| Rank | 5 | 2 | 7 | 12 | 6 | 11 | 4 | 1 | 10 | 9 | 3 | 8 | |
| dupper | Level 1 | 0.5183 | 0.6563 | 0.6680 | 0.6518 | 0.6551 | 0.6660 | 0.8448 | 0.6756 | 0.6649 | 0.6932 | 0.6830 | 0.6649 |
| Level 2 | 0.6794 | 0.6618 | 0.6629 | 0.6561 | 0.6687 | 0.6526 | 0.6210 | 0.6611 | 0.6543 | 0.6554 | 0.6597 | 0.6528 | |
| Level 3 | 0.7888 | 0.6685 | 0.6557 | 0.6787 | 0.6627 | 0.6680 | 0.5208 | 0.6499 | 0.6674 | 0.6380 | 0.6438 | 0.6689 | |
| Δ | 0.2705 | 0.0121 | 0.0123 | 0.0269 | 0.0136 | 0.0154 | 0.3240 | 0.0257 | 0.0131 | 0.0552 | 0.0391 | 0.0161 | |
| Rank | 2 | 12 | 11 | 5 | 9 | 8 | 1 | 6 | 10 | 3 | 4 | 7 | |
| dlower | Level 1 | 0.4881 | 0.6040 | 0.6134 | 0.6193 | 0.5819 | 0.6035 | 0.7987 | 0.6362 | 0.6111 | 0.6085 | 0.6545 | 0.6149 |
| Level 2 | 0.6224 | 0.6109 | 0.6113 | 0.6062 | 0.6046 | 0.6105 | 0.5571 | 0.6044 | 0.6028 | 0.6118 | 0.6052 | 0.6062 | |
| Level 3 | 0.7179 | 0.6135 | 0.6038 | 0.6029 | 0.6419 | 0.6144 | 0.4726 | 0.5879 | 0.6146 | 0.6081 | 0.5687 | 0.6073 | |
| Δ | 0.2298 | 0.0095 | 0.0096 | 0.0164 | 0.0600 | 0.0110 | 0.3262 | 0.0484 | 0.0118 | 0.0037 | 0.0859 | 0.0087 | |
| Rank | 2 | 10 | 9 | 6 | 4 | 8 | 1 | 5 | 7 | 12 | 3 | 11 | |
| f | Level 1 | 0.4370 | 0.5403 | 0.6285 | 0.5422 | 0.5884 | 0.5934 | 0.6781 | 0.5926 | 0.5520 | 0.5726 | 0.5305 | 0.6133 |
| Level 2 | 0.5668 | 0.5958 | 0.5570 | 0.5551 | 0.5661 | 0.5275 | 0.5643 | 0.5637 | 0.5761 | 0.5666 | 0.5939 | 0.5563 | |
| Level 3 | 0.7049 | 0.5726 | 0.5232 | 0.6114 | 0.5542 | 0.5879 | 0.4663 | 0.5524 | 0.5806 | 0.5695 | 0.5843 | 0.5391 | |
| Δ | 0.2680 | 0.0554 | 0.0716 | 0.0693 | 0.0222 | 0.0659 | 0.1138 | 0.0289 | 0.0286 | 0.0061 | 0.0635 | 0.0570 | |
| Rank | 1 | 8 | 3 | 4 | 11 | 5 | 2 | 9 | 10 | 12 | 6 | 7 | |
| Mass | Level 1 | 0.6411 | 0.6477 | 0.6361 | 0.6409 | 0.6815 | 0.6105 | 0.4934 | 0.5126 | 0.6137 | 0.5727 | 0.4592 | 0.5977 |
| Level 2 | 0.6086 | 0.5950 | 0.5943 | 0.5924 | 0.5796 | 0.6080 | 0.6351 | 0.6306 | 0.5861 | 0.6195 | 0.6577 | 0.5967 | |
| Level 3 | 0.5695 | 0.5765 | 0.5887 | 0.5860 | 0.5580 | 0.6008 | 0.6906 | 0.6759 | 0.6193 | 0.6270 | 0.7023 | 0.6248 | |
| Δ | 0.0715 | 0.0712 | 0.0474 | 0.0549 | 0.1235 | 0.0097 | 0.1972 | 0.1633 | 0.0332 | 0.0543 | 0.2431 | 0.0280 | |
| Rank | 5 | 6 | 9 | 7 | 4 | 12 | 2 | 3 | 10 | 8 | 1 | 11 |
| Parameter | Initial Design | Optimal Design | Variation |
|---|---|---|---|
| Mass, M (kg) | 27.71 | 24.88 | −10.21% |
| Natural frequency, f (Hz) | 42.68 | 42.30 | −0.89% |
| Vertical sag, dsag (mm) | 1.64 | 1.48 | −9.76% |
| Upper lateral, dupper (mm) | 1.03 | 1.04 | 0.97% |
| Lower lateral, dlower (mm) | 2.21 | 2.39 | 8.14% |
Publisher’s Note: MDPI stays neutral with regard to jurisdictional claims in published maps and institutional affiliations. |
© 2022 by the authors. Licensee MDPI, Basel, Switzerland. This article is an open access article distributed under the terms and conditions of the Creative Commons Attribution (CC BY) license (https://creativecommons.org/licenses/by/4.0/).
Share and Cite
Chen, H.; Lu, C.; Liu, Z.; Shen, C.; Sun, M. Multi-Response Optimisation of Automotive Door Using Grey Relational Analysis with Entropy Weights. Materials 2022, 15, 5339. https://doi.org/10.3390/ma15155339
Chen H, Lu C, Liu Z, Shen C, Sun M. Multi-Response Optimisation of Automotive Door Using Grey Relational Analysis with Entropy Weights. Materials. 2022; 15(15):5339. https://doi.org/10.3390/ma15155339
Chicago/Turabian StyleChen, Hao, Chihua Lu, Zhien Liu, Cunrui Shen, and Menglei Sun. 2022. "Multi-Response Optimisation of Automotive Door Using Grey Relational Analysis with Entropy Weights" Materials 15, no. 15: 5339. https://doi.org/10.3390/ma15155339
APA StyleChen, H., Lu, C., Liu, Z., Shen, C., & Sun, M. (2022). Multi-Response Optimisation of Automotive Door Using Grey Relational Analysis with Entropy Weights. Materials, 15(15), 5339. https://doi.org/10.3390/ma15155339