
Corrosion–Resistance Mechanism of TC4 Titanium Alloy under Different Stress-Loading Conditions

Abstract
:1. Introduction
2. Materials and Methods
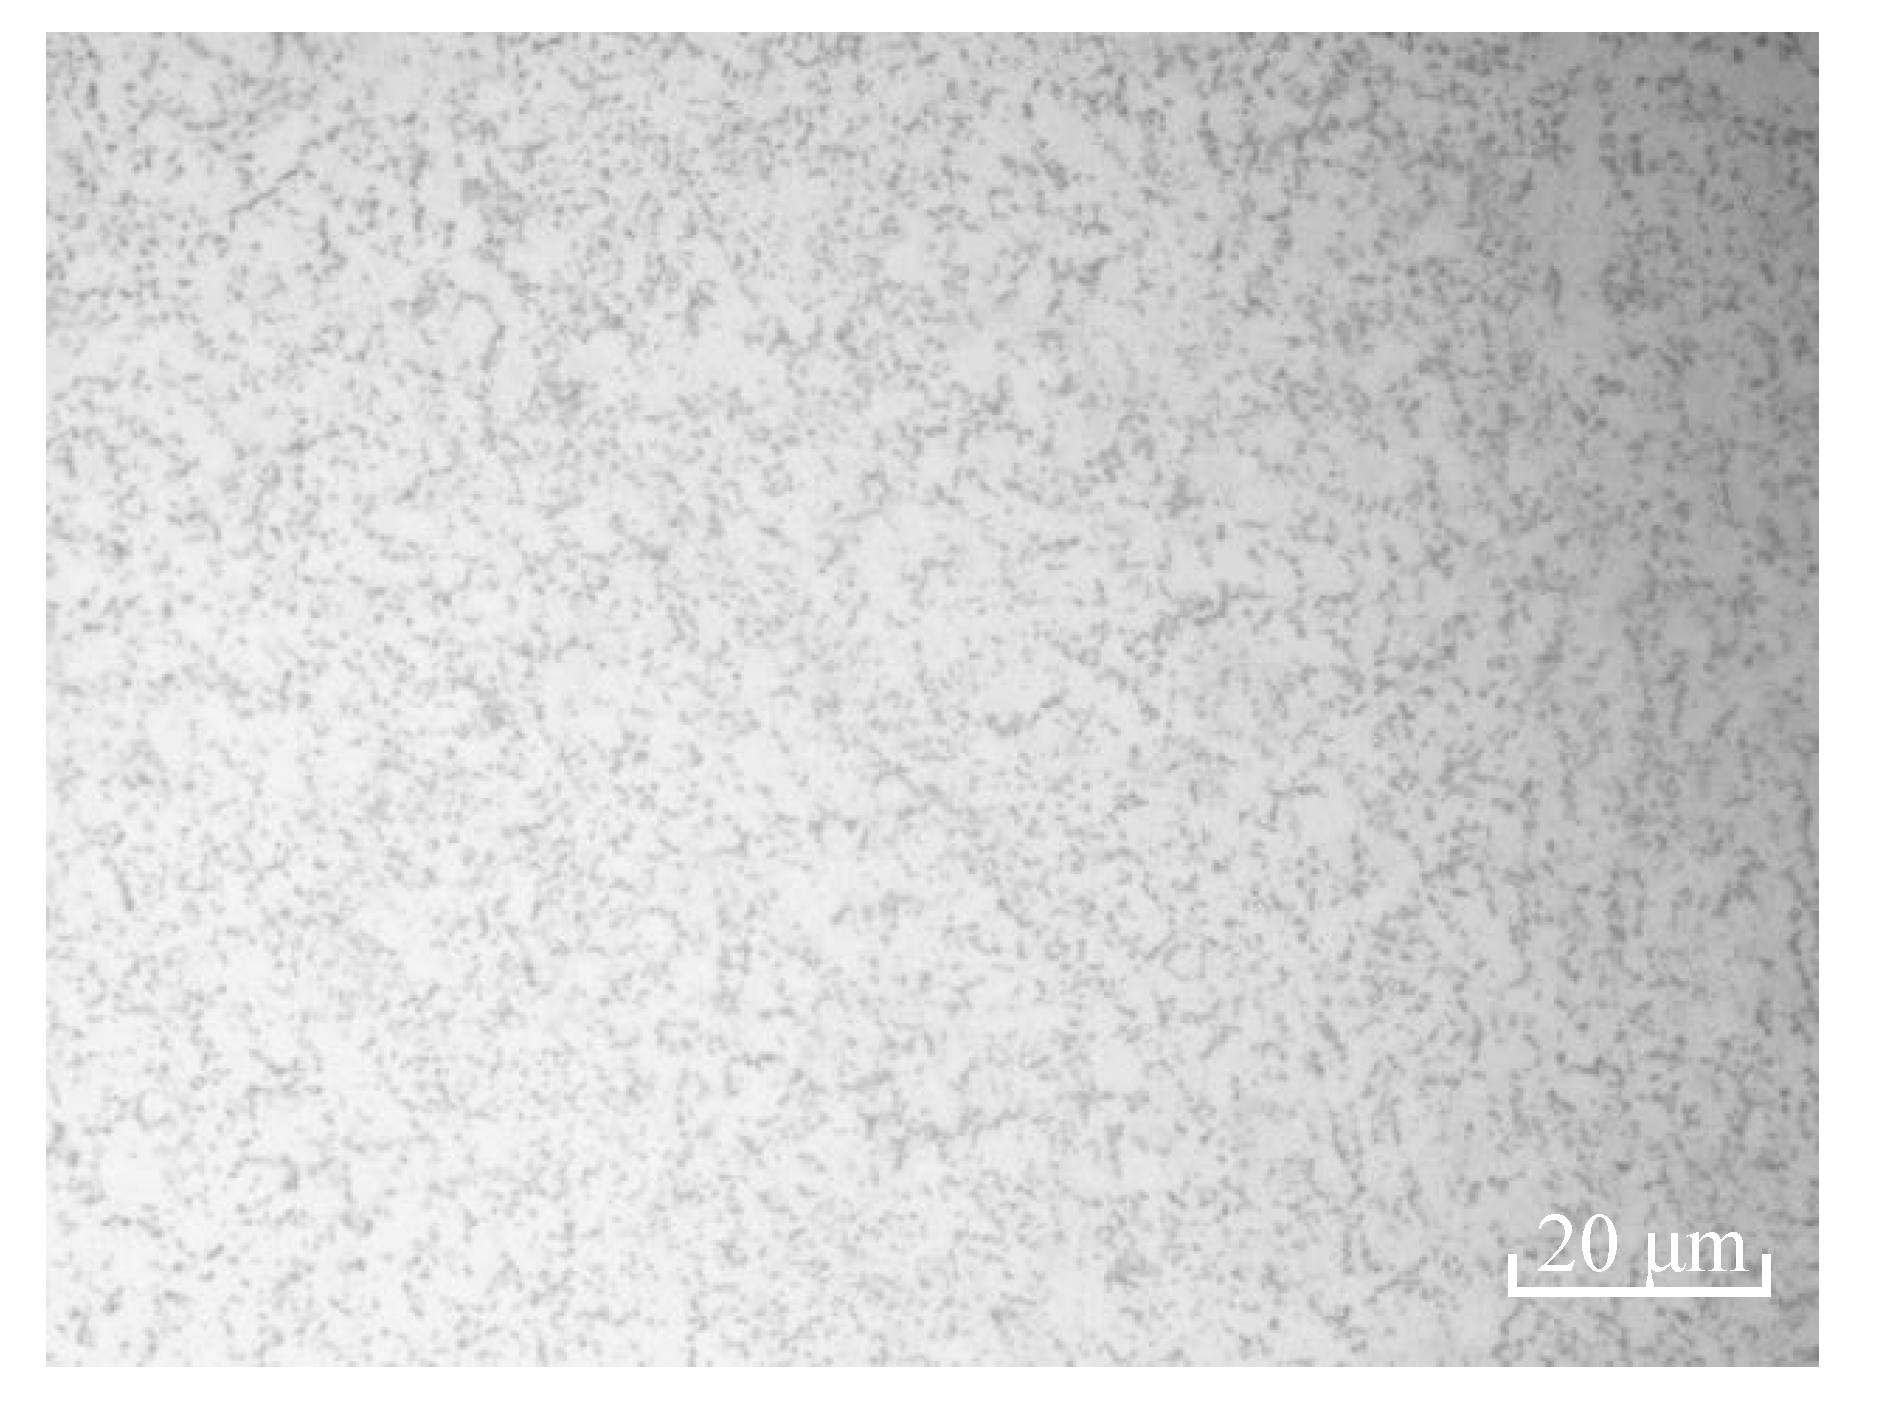
2.1. Materials
- where σ: maximum tensile stress, MPa;
- E: modulus of elasticity, MPa;
- t: thickness of specimen, mm;
- y: maximum deflection, mm;
- H: distance between external support points, mm;
- A: distance between the internal and external support points, mm.
2.2. High-Temperature and High-Pressure Corrosion Experiments
2.2.1. High-Temperature and High-Pressure Corrosion Conditions
2.2.2. High-Temperature and High-Pressure Corrosion Steps
2.3. Electrochemical Experiments
2.3.1. Electrochemical Conditions
2.3.2. Electrochemical Steps
3. Results and Discussion
3.1. Corrosion Behavior of Immersion Experiments
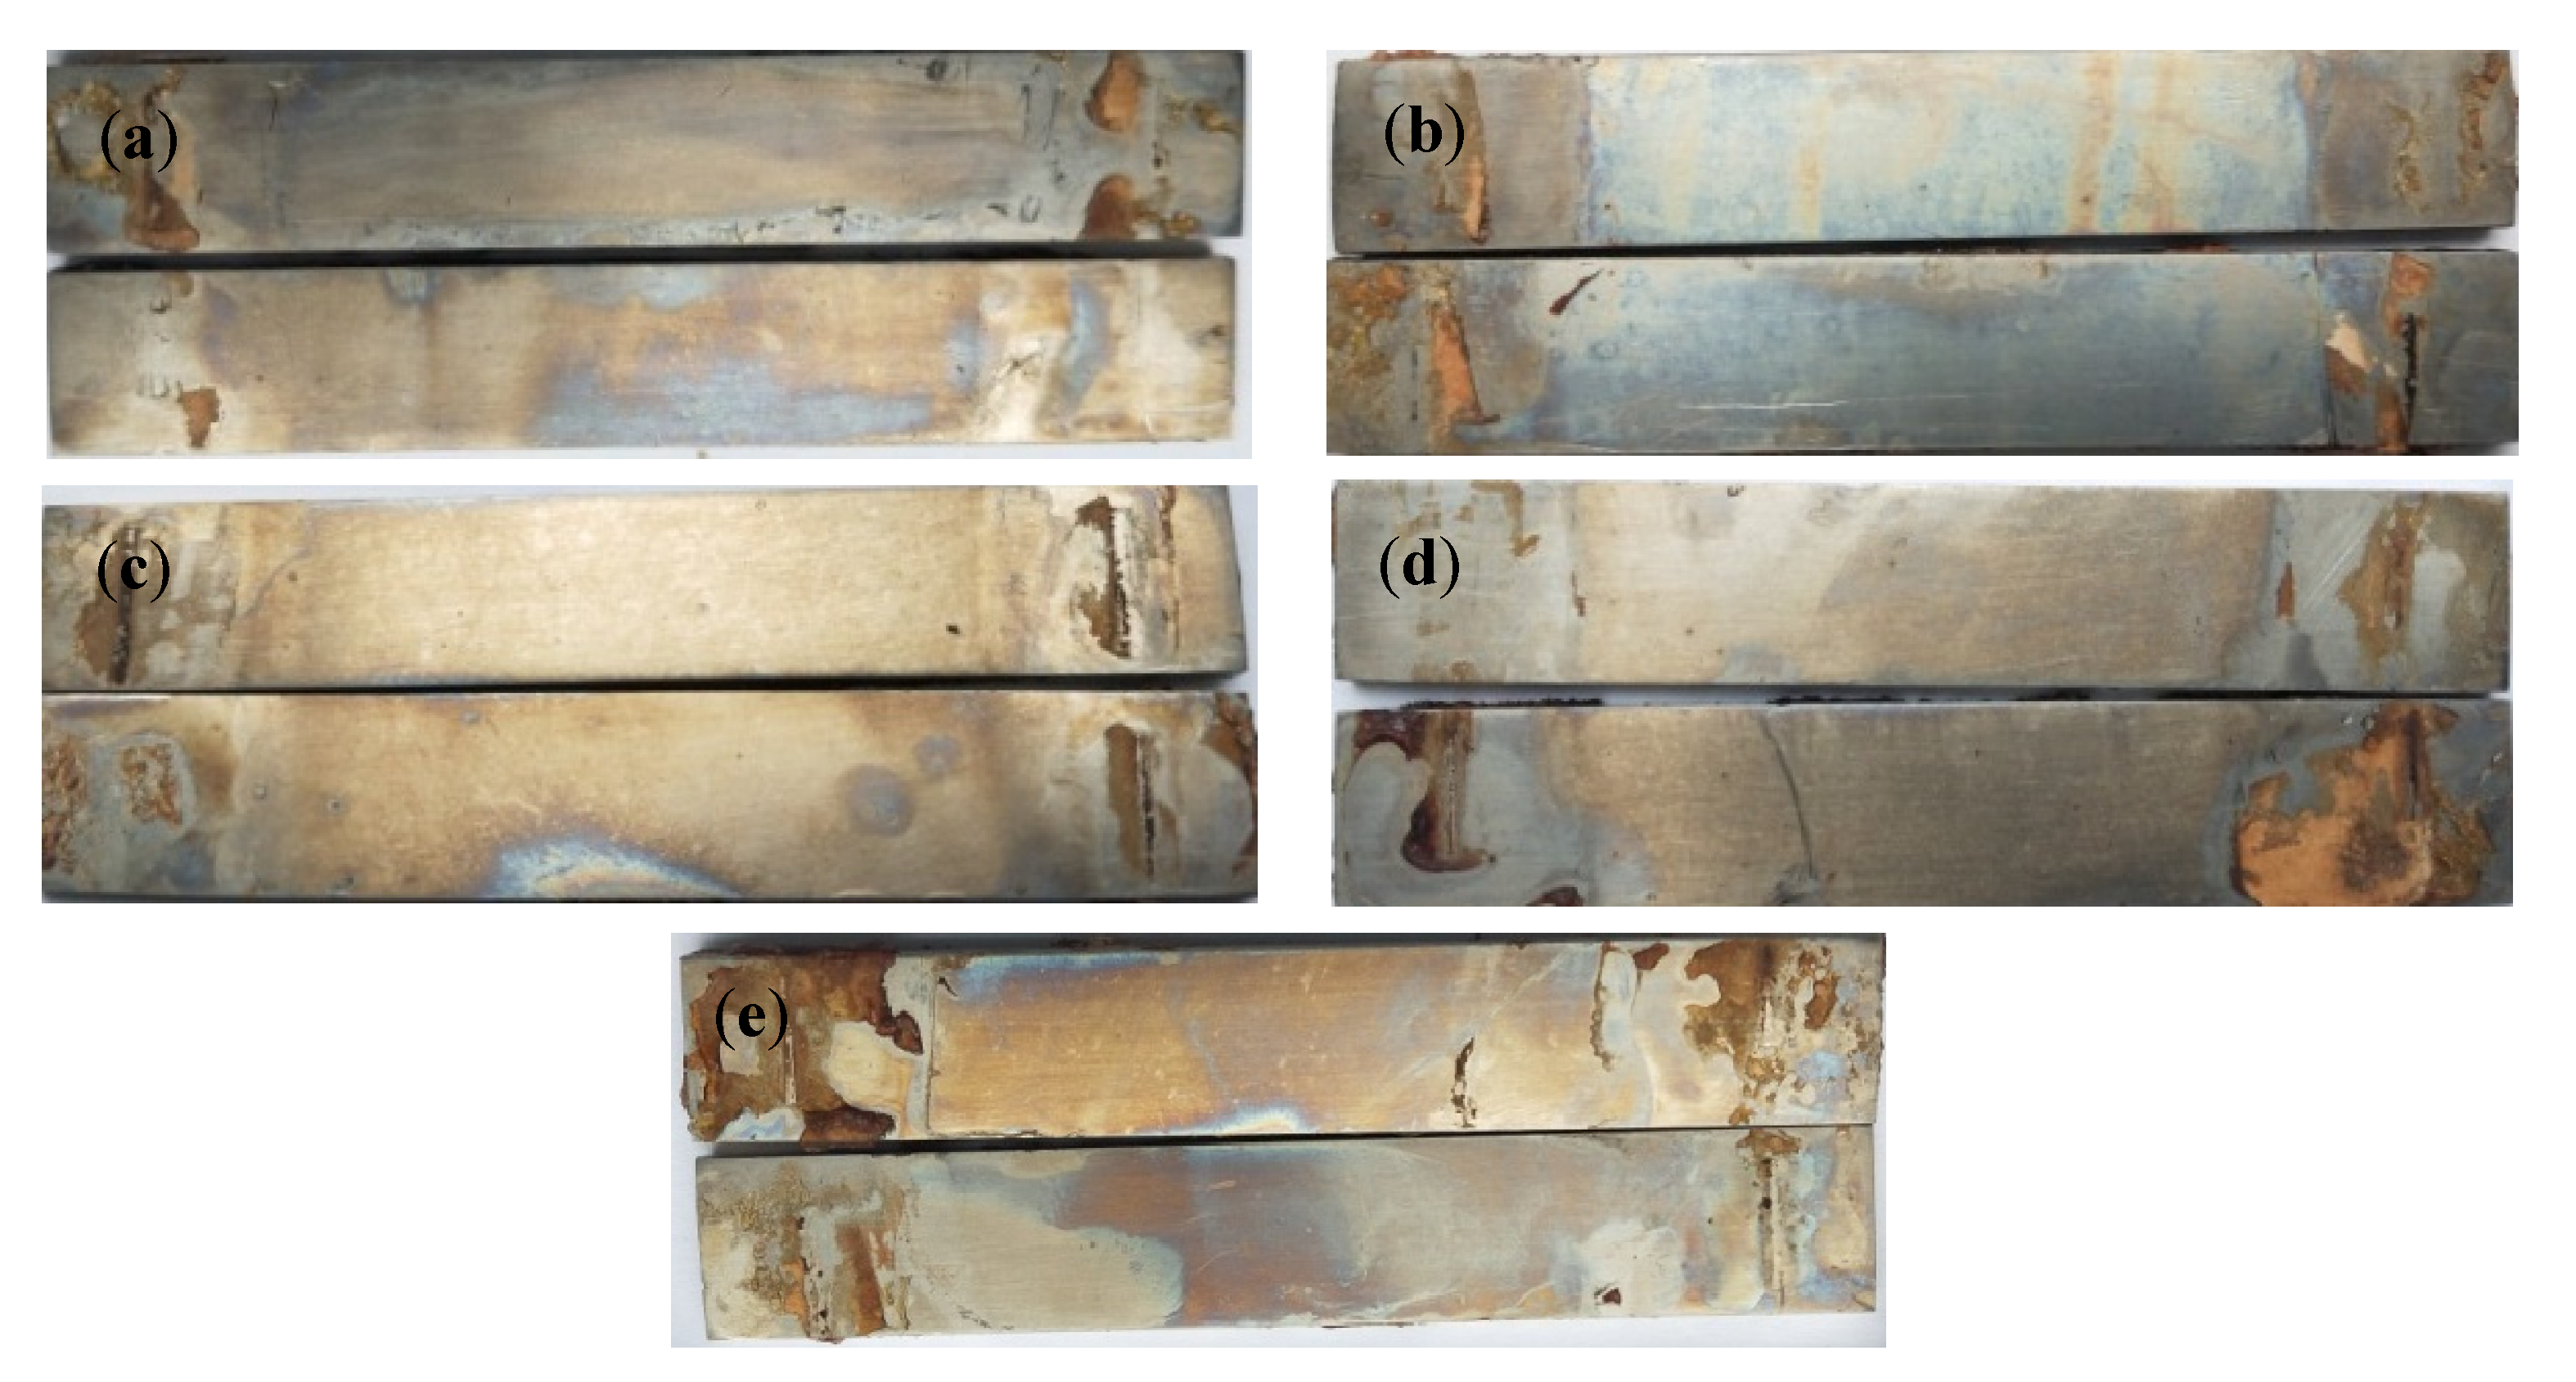
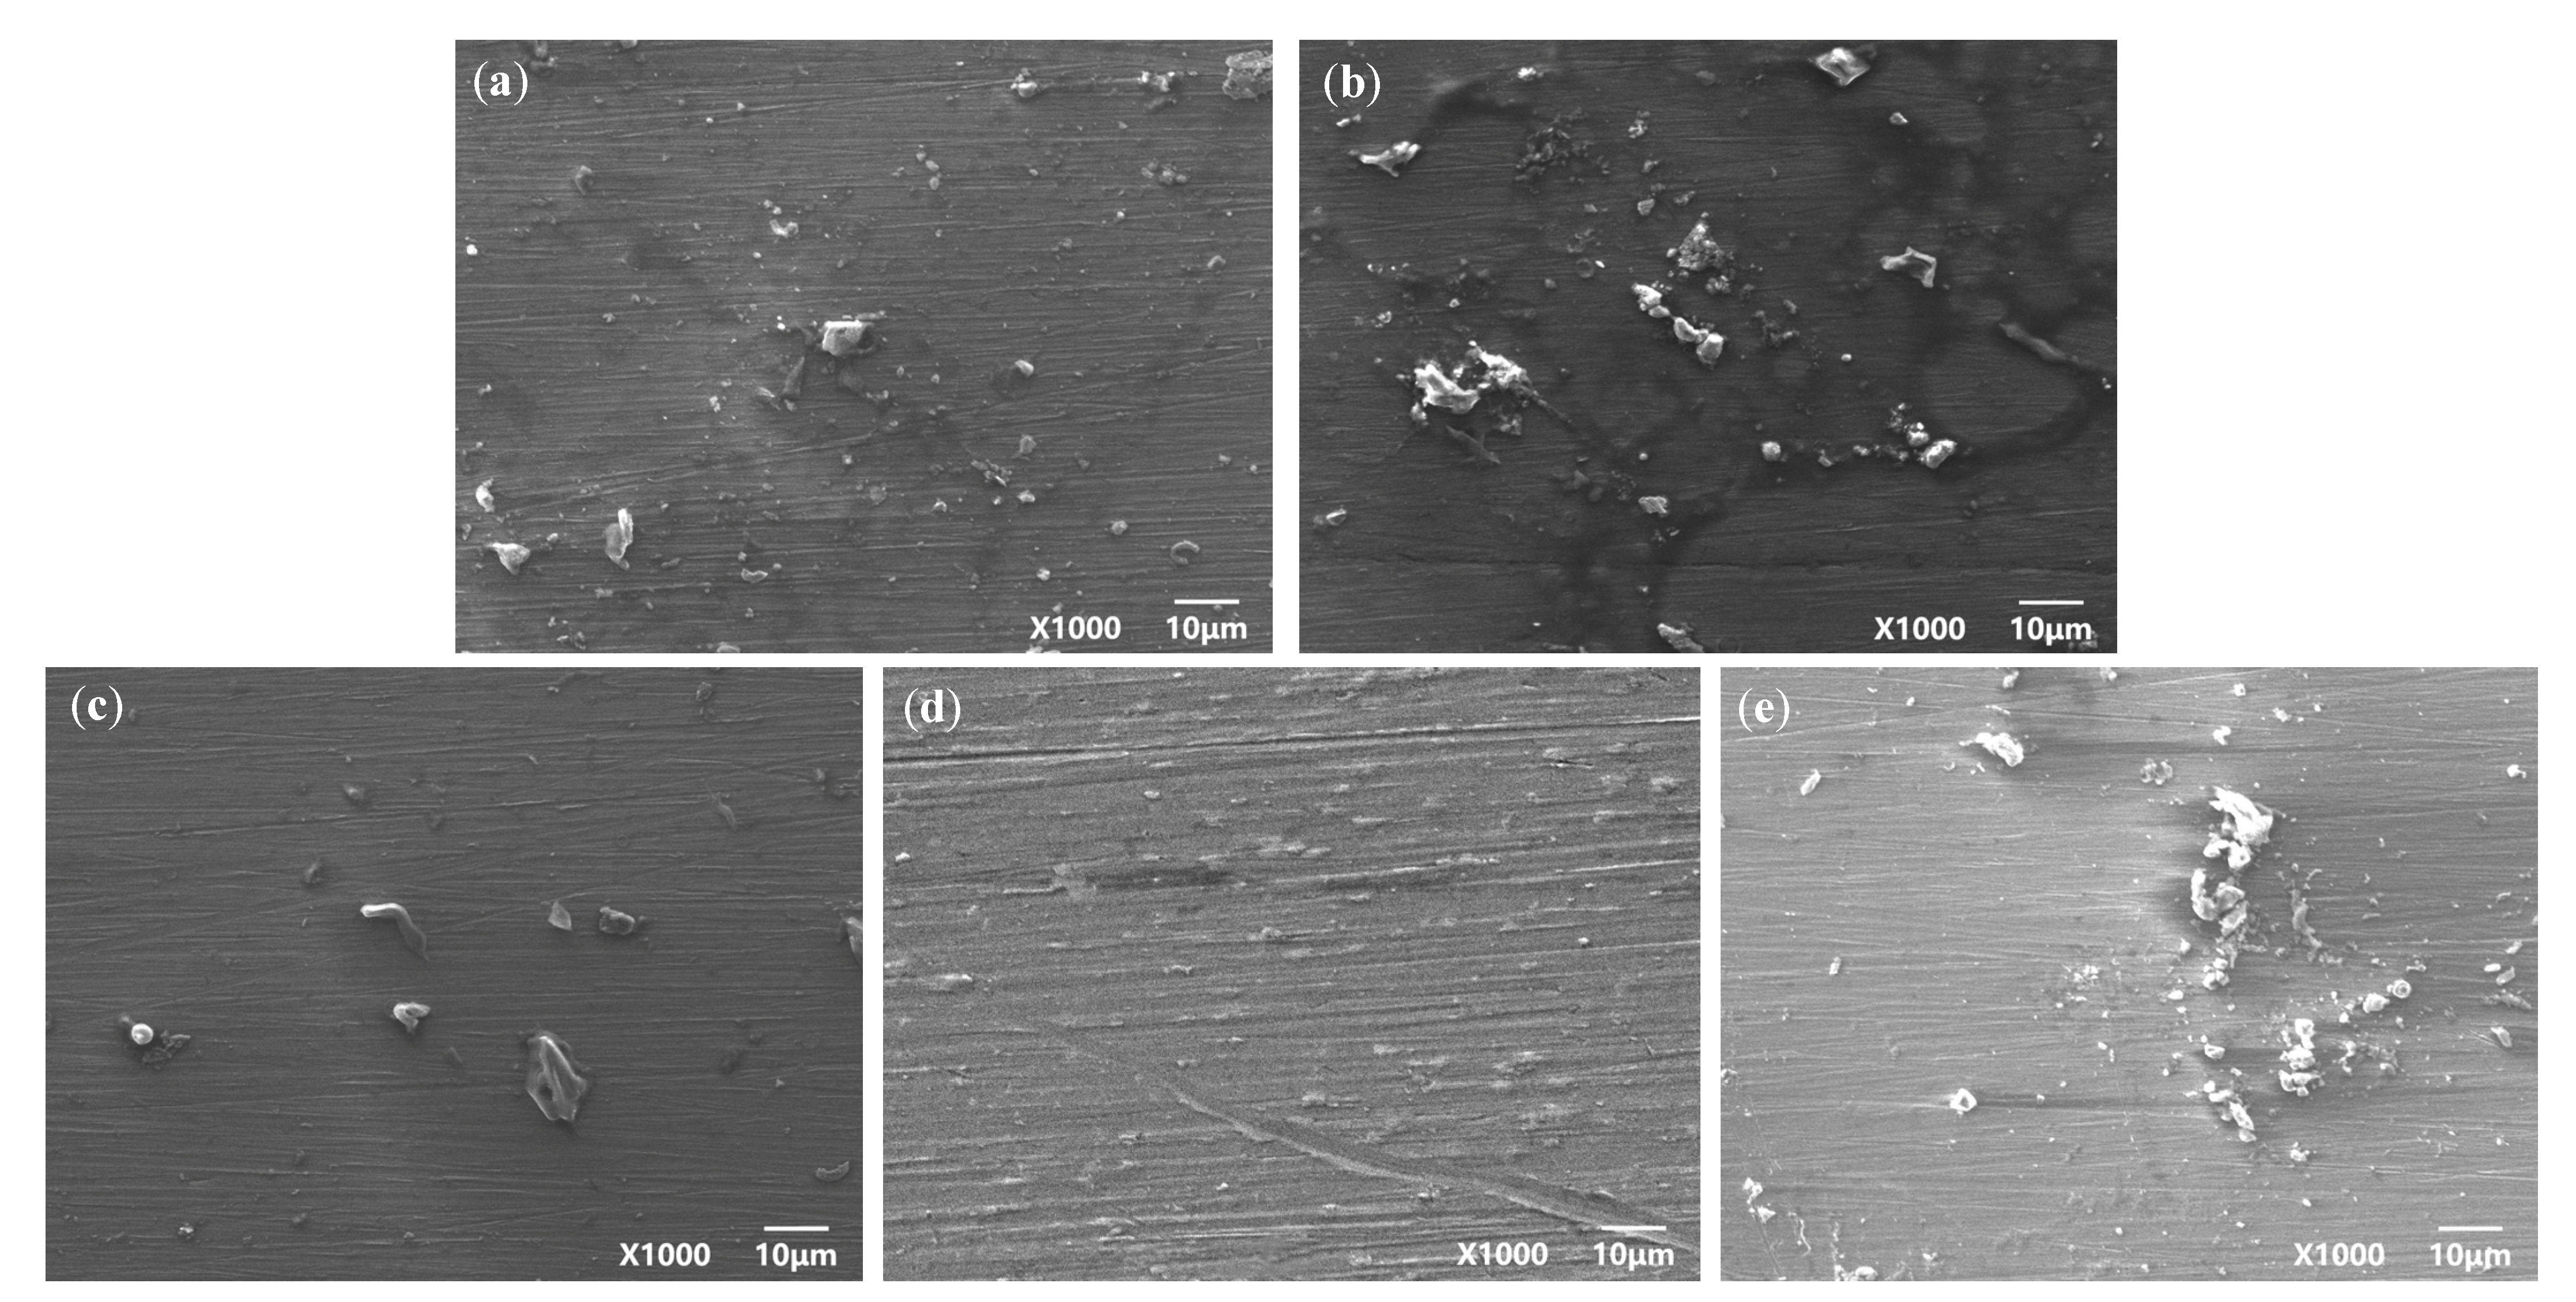
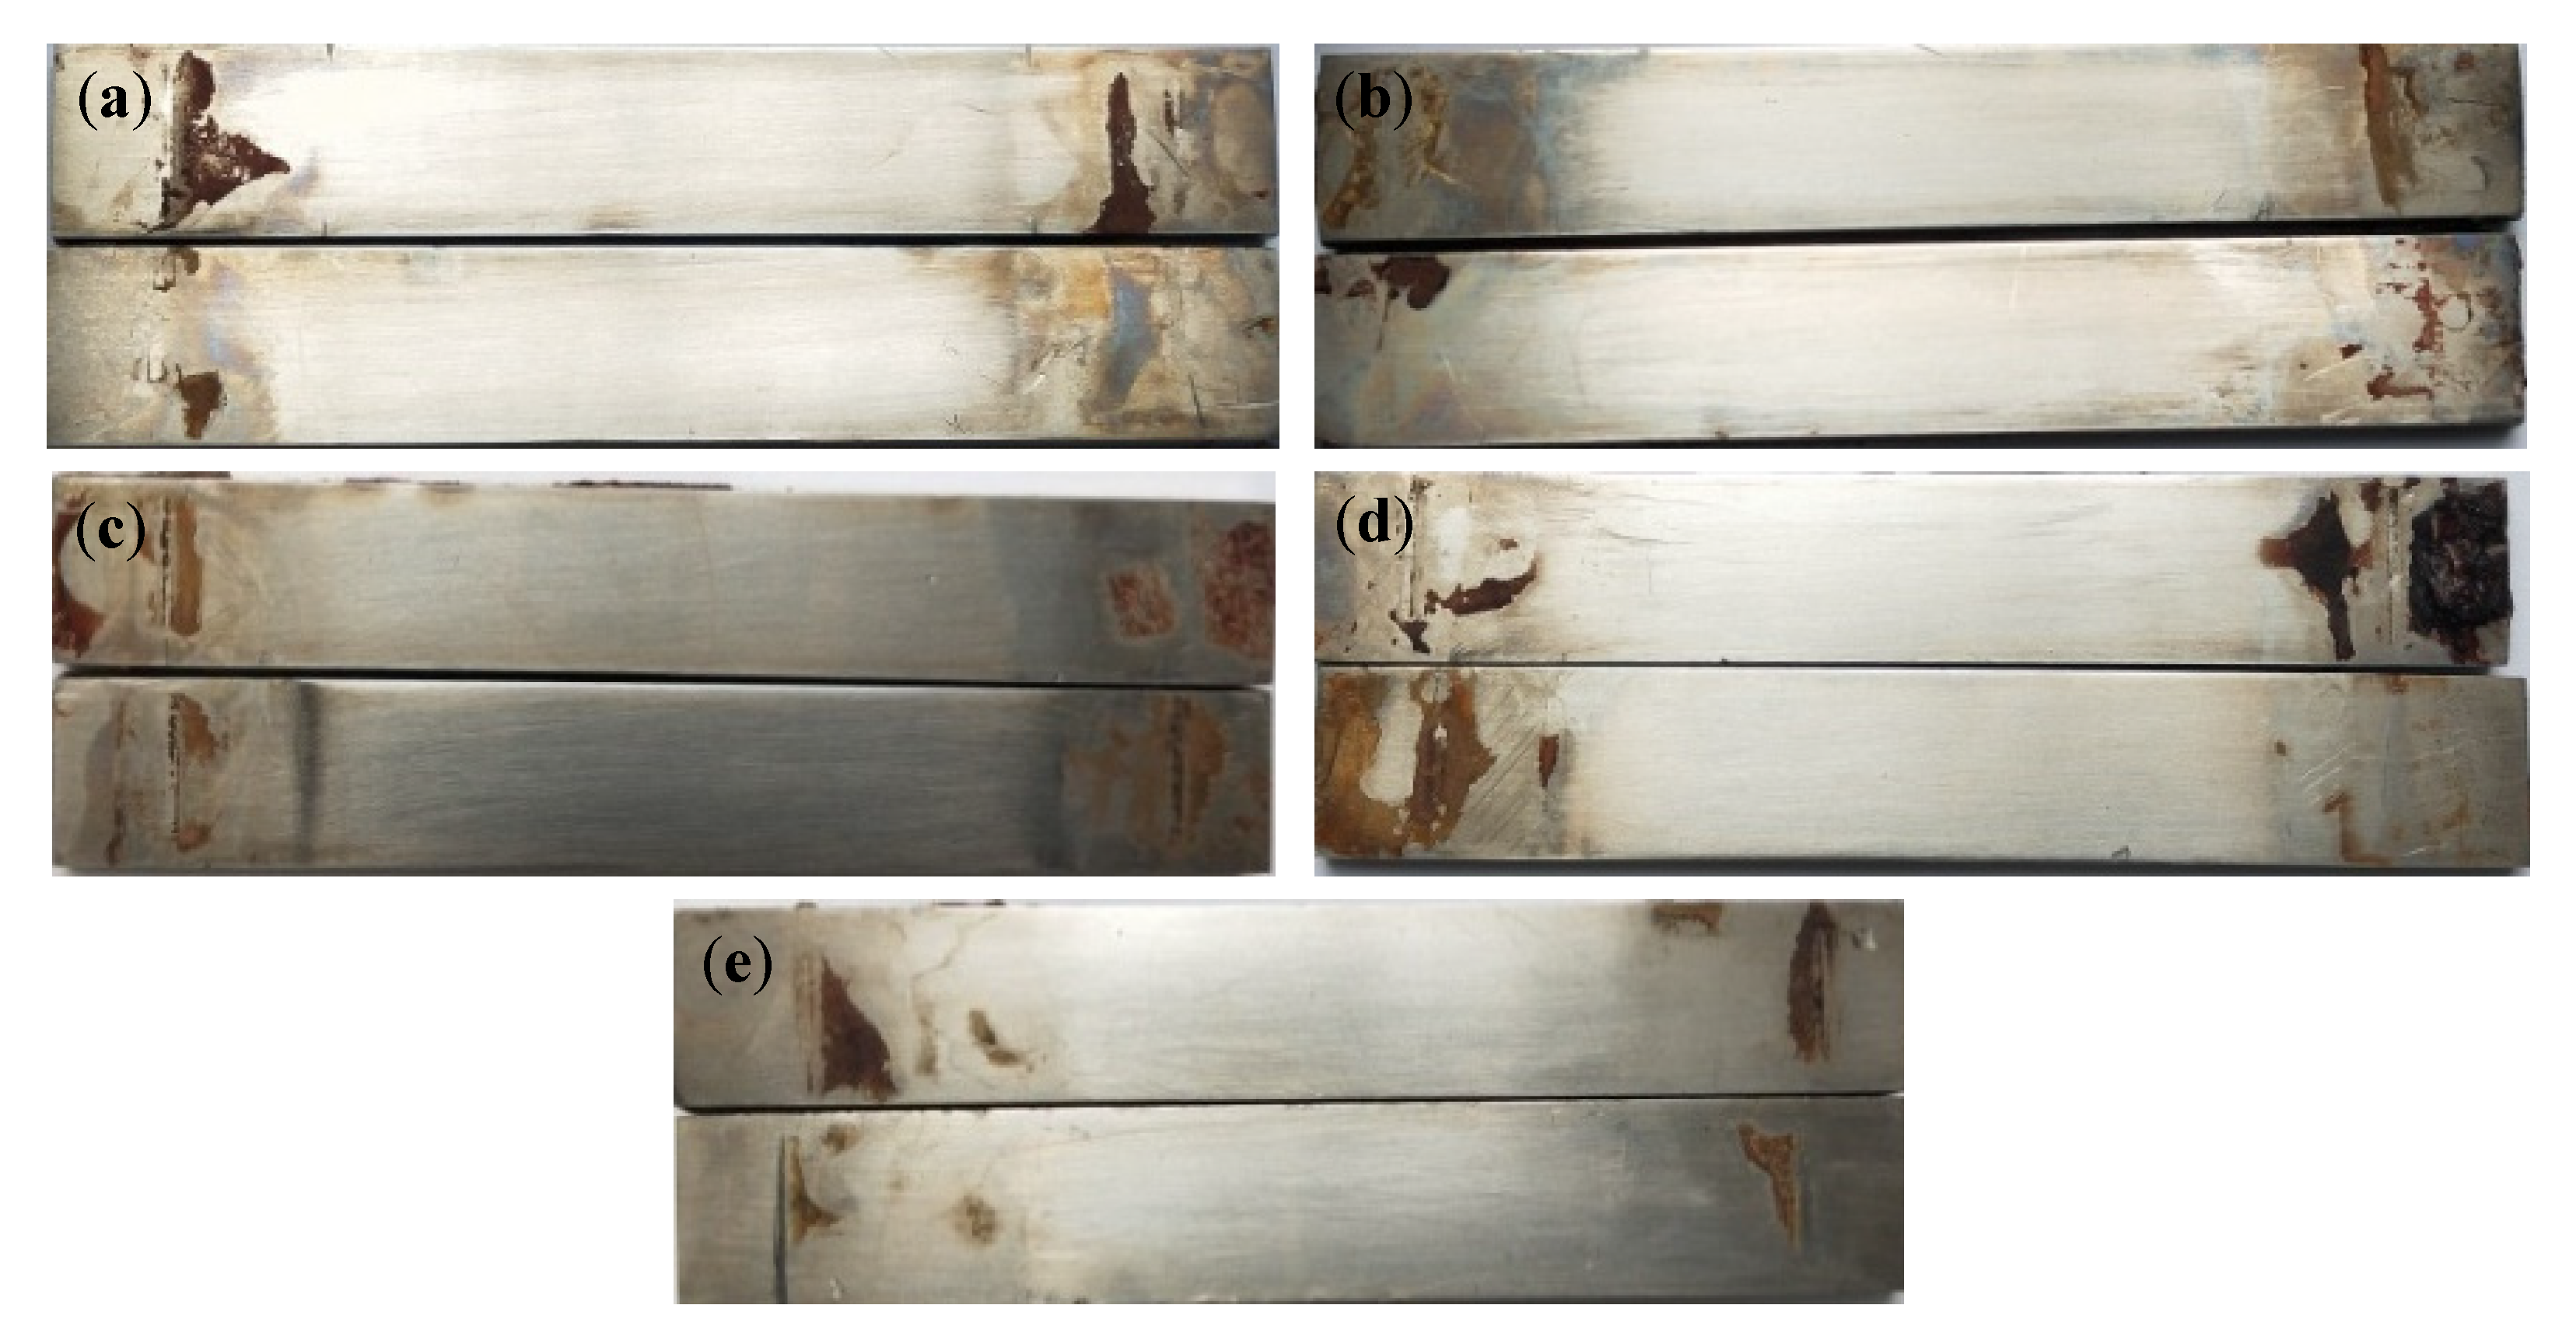
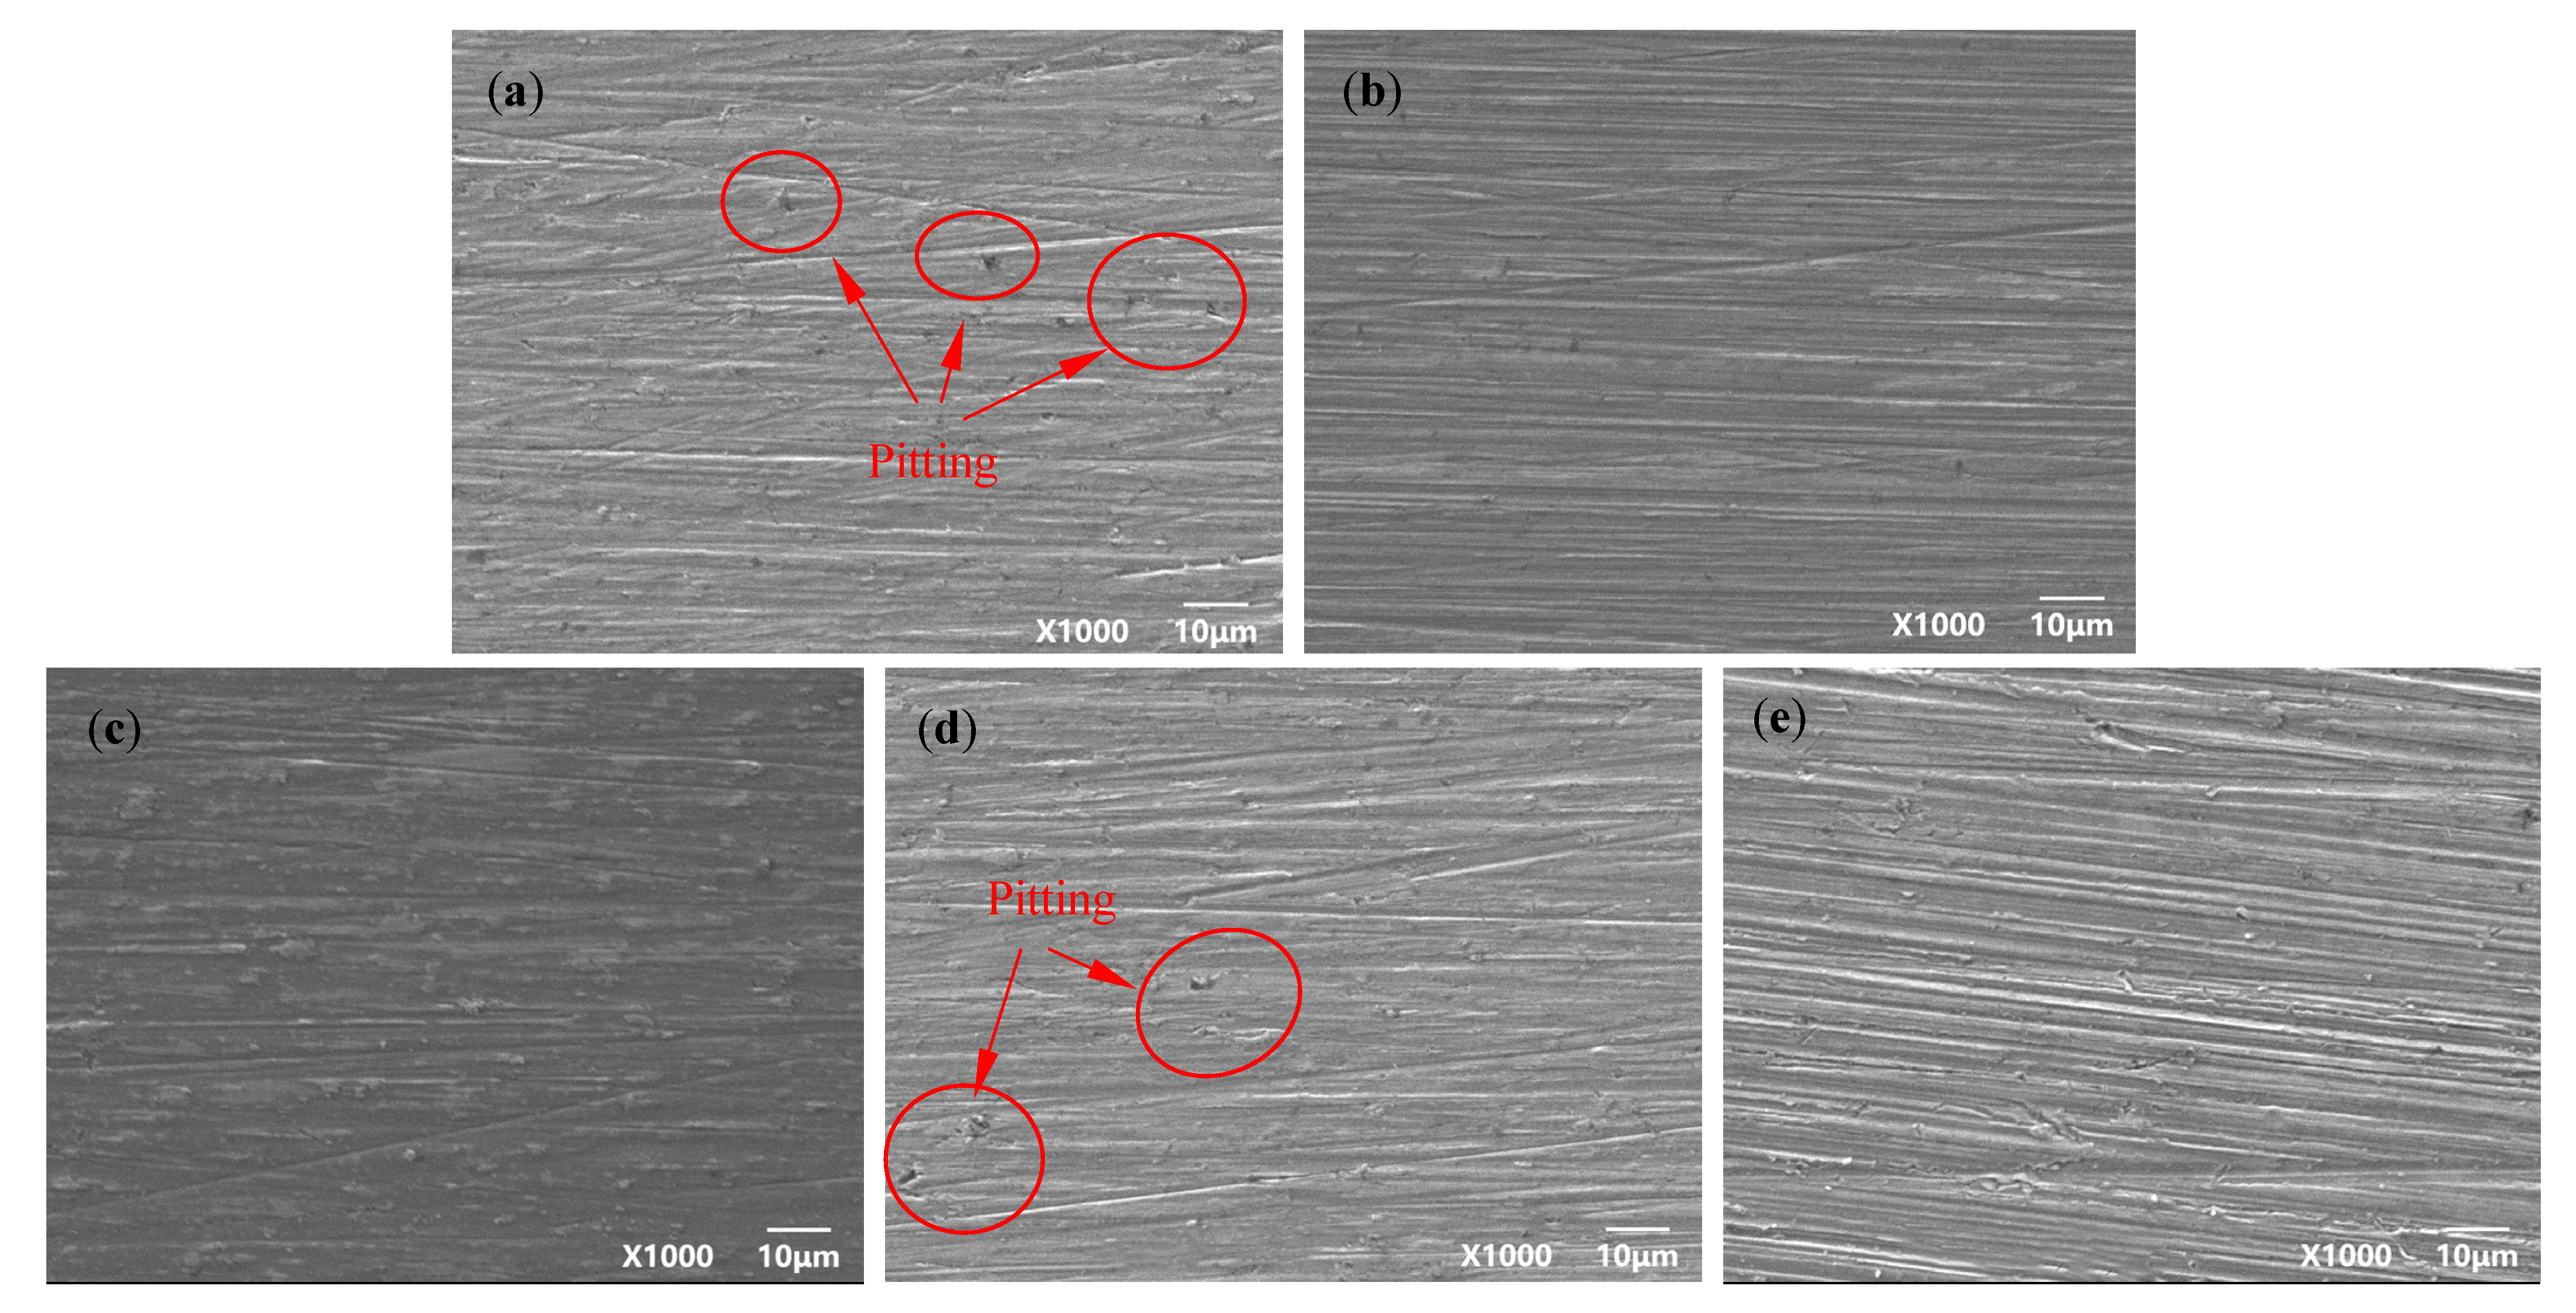
3.1.1. Corrosion Morphology
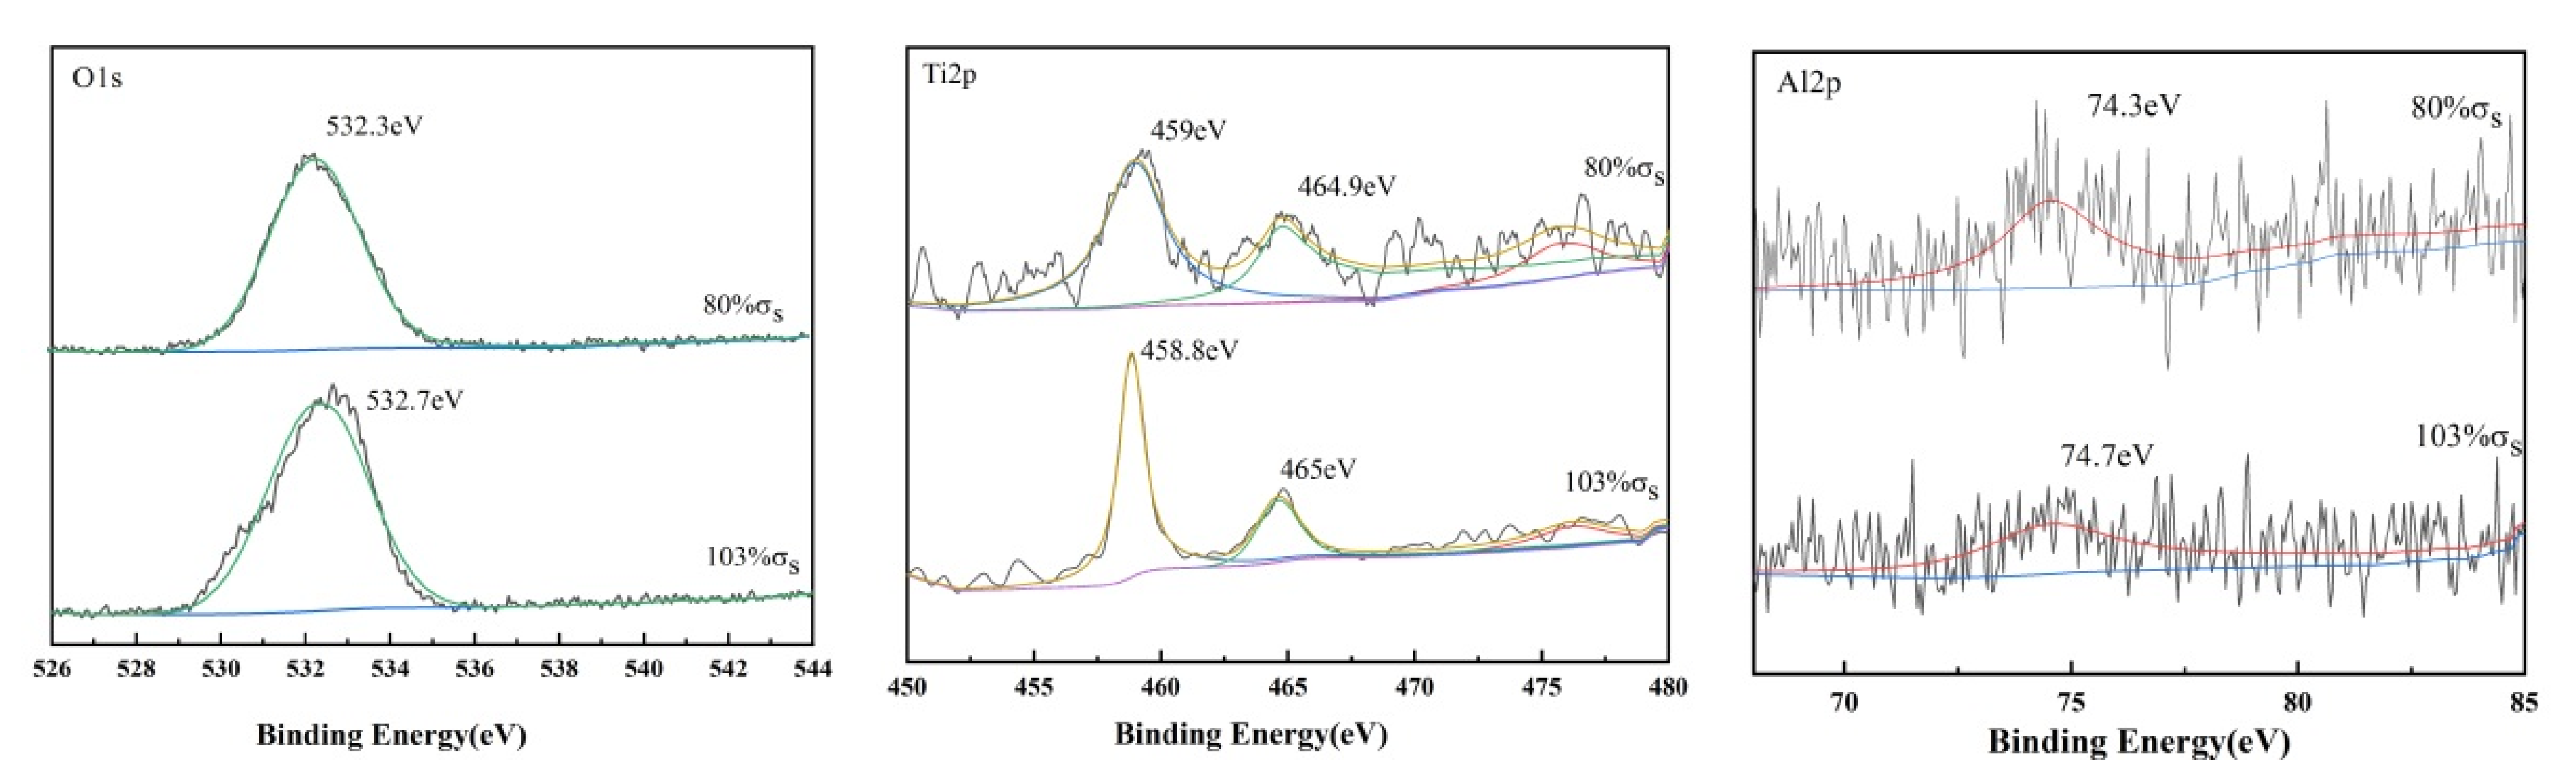
3.1.2. Corrosion Products
3.2. Electrochemical Experimental Characteristics
3.2.1. Polarization Curve
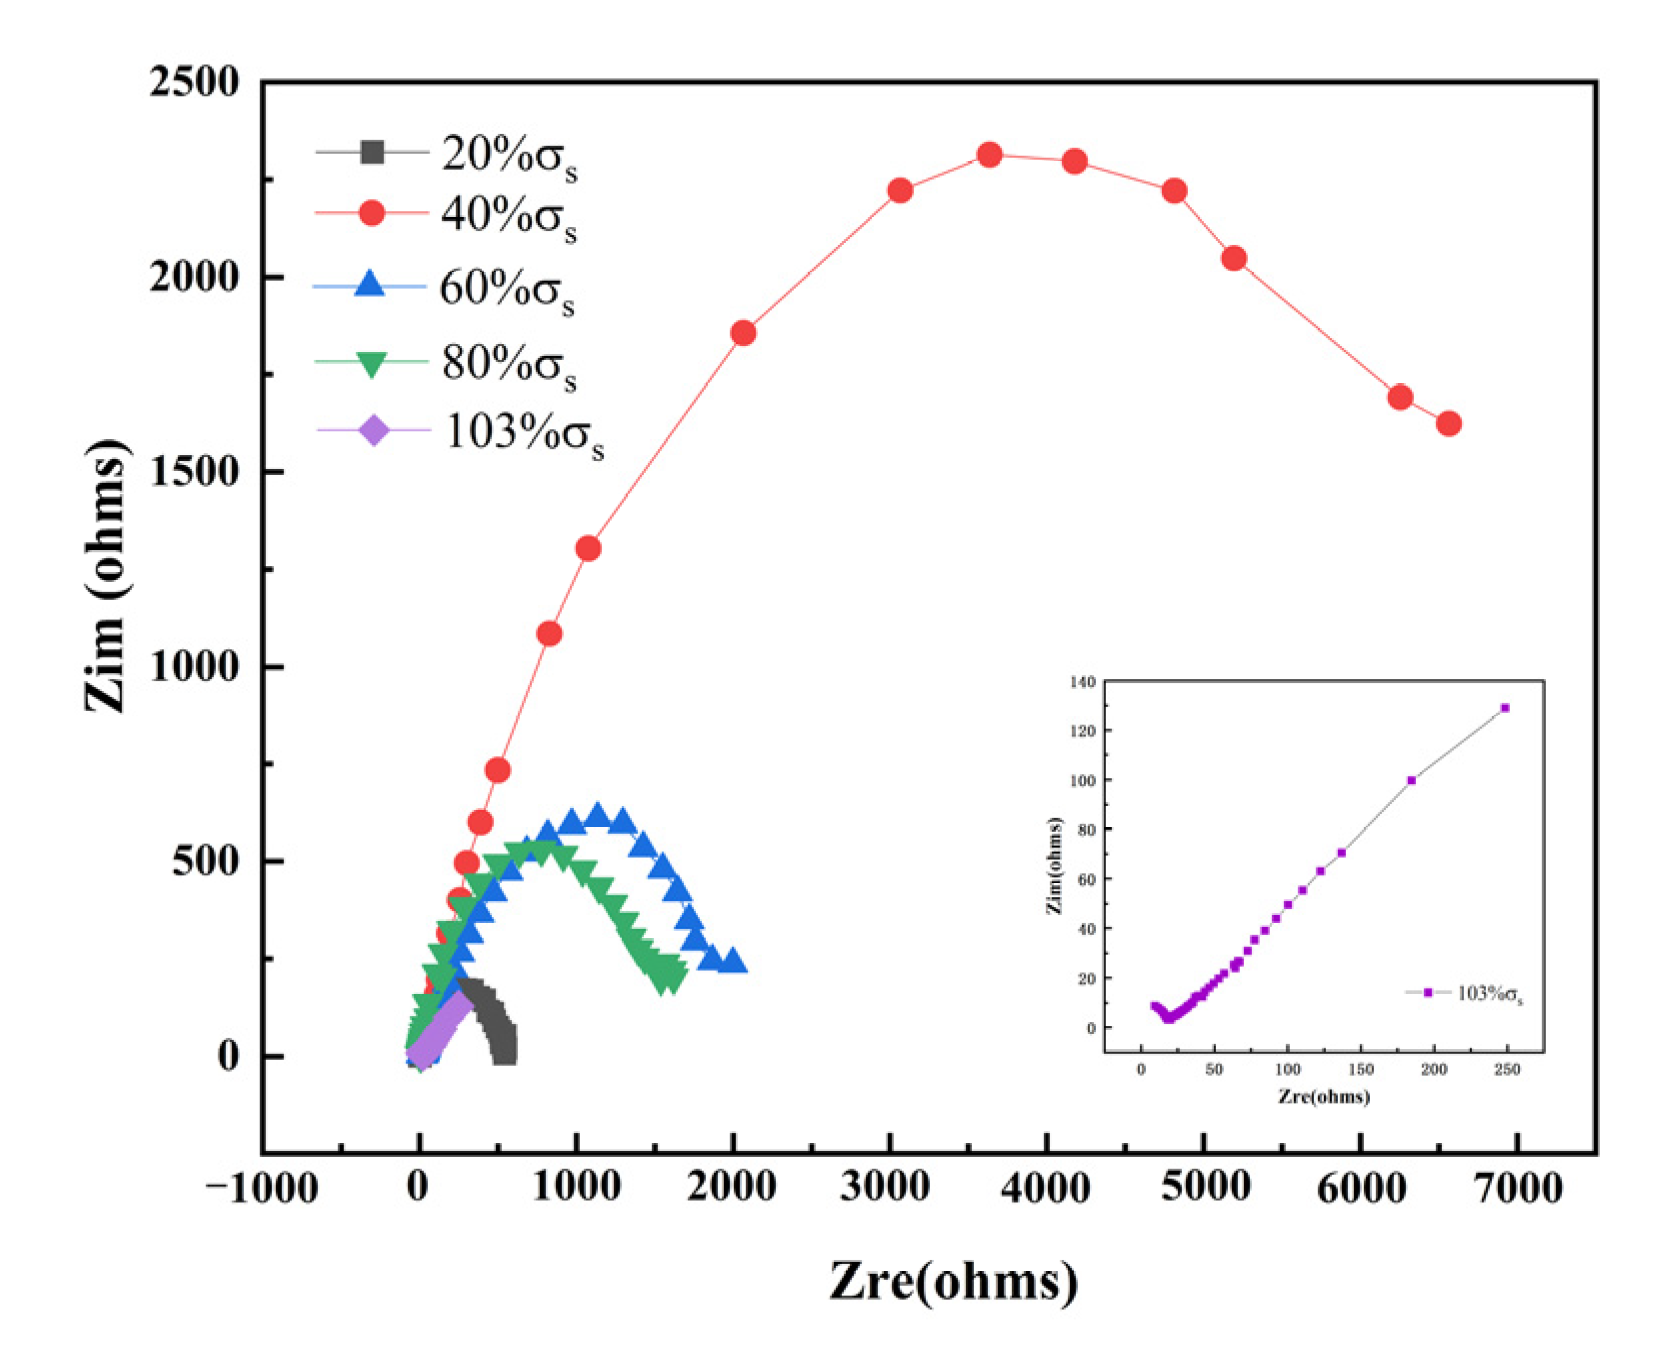
3.2.2. AC Impedance
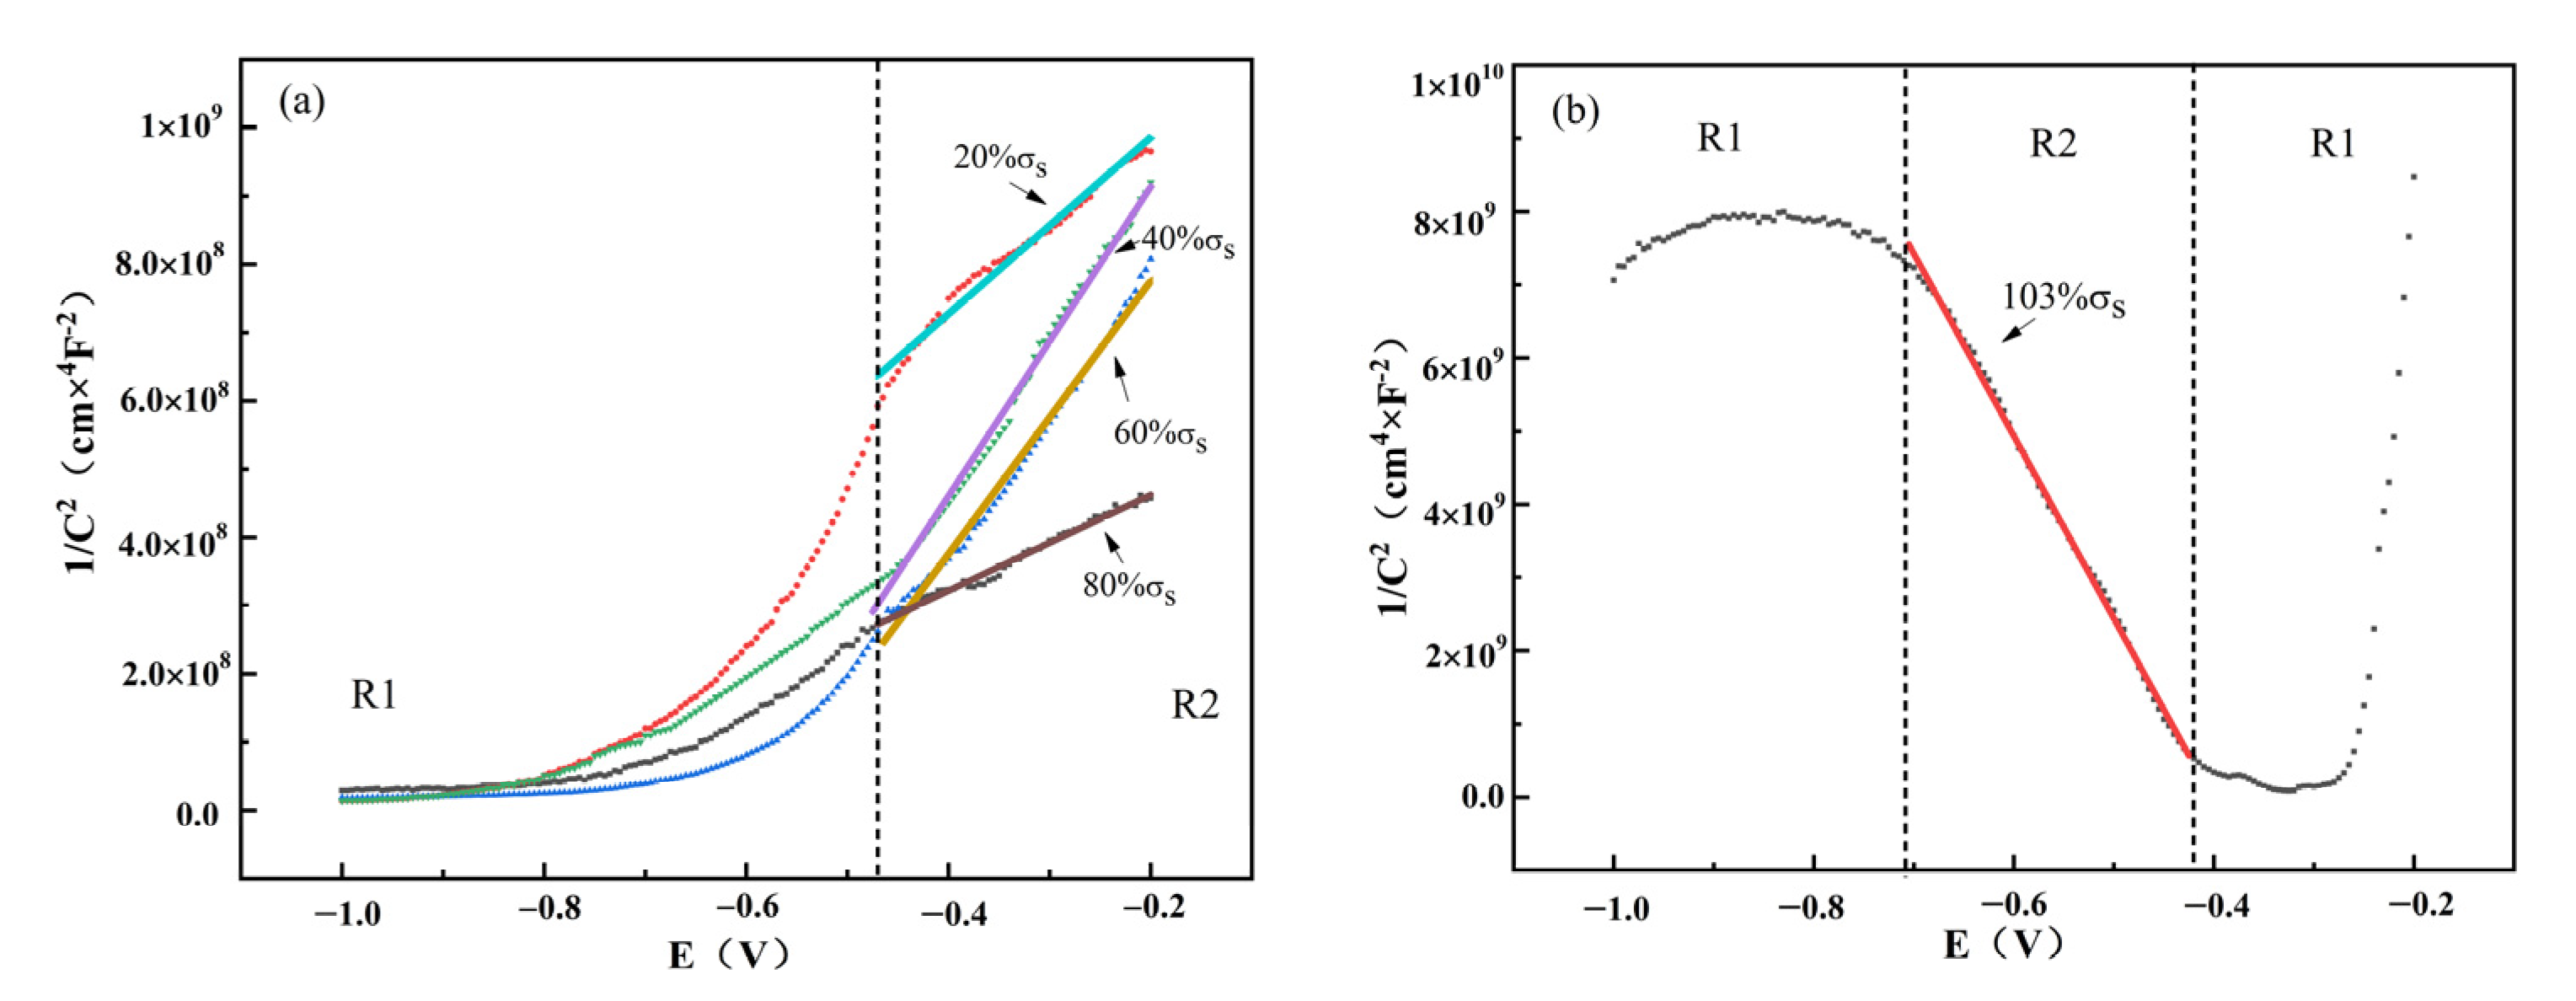
3.2.3. M-S Curve
- where, CSC, space-charge-layer capacitance of the semiconductor film; ε0, vacuum capacitance, ε0 = 8.85 × 10⁻¹² F·m−1;
- ε, the dielectric constant of the passivated film at room temperature, = 114;
- ND, the applied host concentration;
- NA, recipient concentration;
- E, potential of the reference electrode on the absolute scale; EFB, flat-band potential;
- k, Boltzmann constant, k = 1.38 × 10⁻²³;
- T, thermodynamic temperature;
- e, electron charge, e = 1.602 × 10⁻¹⁹ C.
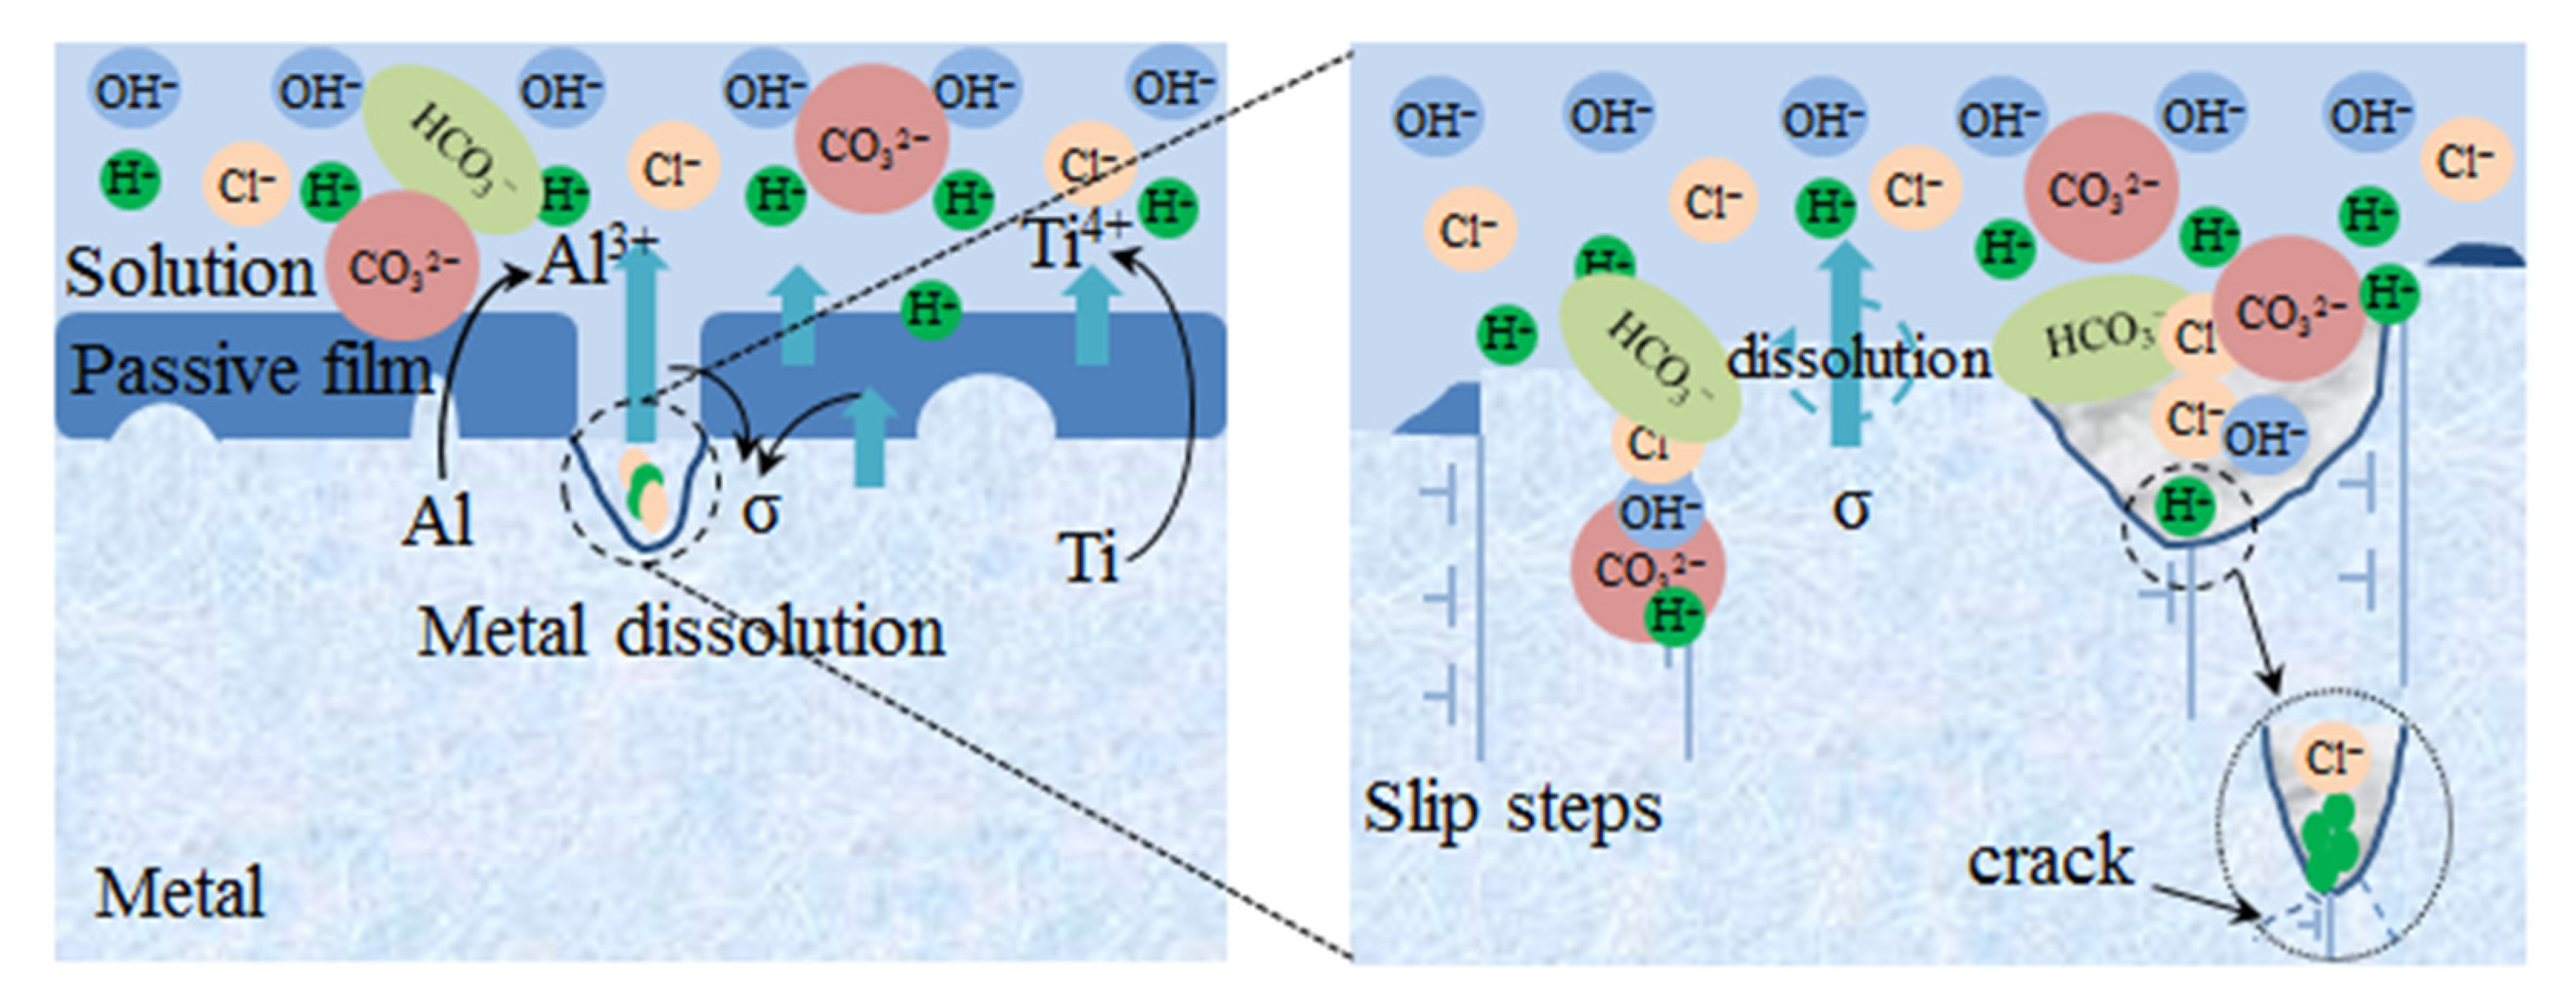
4. Corrosion Mechanisms
5. Conclusions
- (1)
- Corrosion resistance of TC4 titanium alloy loaded with different stresses was in the following order: 40% σs > 60% σs > 80% σs > 20% σs > 103% σs, among them the corrosion rate of TC4 titanium alloy loaded with 20% σs was an order of magnitude higher than that loaded with other elastic stresses, and the corrosion rate of TC4 titanium alloy loaded with 103% σs was a further order of magnitude higher.
- (2)
- In the elastic-deformation stage, TC4 titanium alloys showed double capacitance arc-resistance characteristics, the radius of the low-frequency capacitance arc further decreased, and Warburg impedance characteristics appeared when TC4 titanium alloys was loaded 103% σs, indicating the changed corrosion mechanism.
- (3)
- The semiconductor properties of TC4 titanium alloy from n-type to p-type as deformation from elastic to plastic due to the change in components of passivation film and ND value in the passivation film increased, which reduced the protection of film layer to the matrix, resulting in the more serious pitting corrosion.
Author Contributions
Funding
Data Availability Statement
Conflicts of Interest
References
- Pouilleau, J.; Devilliers, D.; Garrido, F.; Durand-Vidal, S.; Mahé, E. Structure and composition of passive titanium oxide films. Mater. Sci. Eng. B 1997, 47, 235–243. [Google Scholar] [CrossRef]
- Argall, F. Switching phenomena in titanium oxide thin films. Solid-State Electron. 1968, 11, 535–541. [Google Scholar] [CrossRef]
- Pazhanivel, B.; Sathiya, P.; Muthuraman, K.; Sozhan, G. Influence of NaCl environment on stress corrosion cracking of additive manufactured Ti-6Al-4V alloy. Eng. Fail. Anal. 2021, 127, 105515. [Google Scholar] [CrossRef]
- Furuta, T. Automobile applications of titanium. In Titanium for Consumer Applications; Elsevier: Amsterdam, The Netherlands, 2019; pp. 77–90. [Google Scholar] [CrossRef]
- Oryshchenko, A.S.; Gorynin, I.V.; Leonov, V.P.; Kudryavtsev, A.S.; Mikhailov, V.I.; Chudakov, E.V. Marine titanium alloys: Present and future. Inorg. Mater. Appl. Res. 2015, 6, 571–579. [Google Scholar] [CrossRef]
- Gomez-Gallegos, A.; Mandal, P.; Gonzalez, D.; Zuelli, N.; Blackwell, P. Studies on titanium alloys for aerospace application. In Defect and Diffusion Forum; Trans Tech Publications Ltd.: Zurich, Switzerland, 2018; Volume 385, pp. 419–423. [Google Scholar]
- Santhosh, R.; Geetha, M.; Nageswara Rao, M. Recent developments in heat treatment of beta titanium alloys for aerospace applications. Trans. Indian Inst. Met. 2017, 70, 1681–1688. [Google Scholar] [CrossRef]
- Zhang, F.F.; Feng, C.; Zhu, L.J.; Song, W.W. Research progress on corrosion resistance of titanium alloy oil well tubing. In Materials Science Forum; Trans Tech Publications Ltd.: Zurich, Switzerland, 2021; Volume 1035, pp. 528–533. [Google Scholar]
- Xie, R.; Lin, N.; Zhou, P.; Zou, J.; Han, P.; Wang, Z.; Tang, B. Surface damage mitigation of TC4 alloy via micro arc oxidation for oil and gas exploitation application: Characterizations of microstructure and evaluations on surface performance. Appl. Surf. Sci. 2018, 436, 467–476. [Google Scholar] [CrossRef]
- Yao, X.F.; Xie, F.Q.; Zhao, G.X.; Han, Y.; Wu, X.Q. Compare of wear properties and analysis of wear mechanism about TC4 alloy and P110 tubing steel in dry condition. In Advanced Materials Research; Trans Tech Publications Ltd.: Zurich, Switzerland, 2011; Volume 314, pp. 147–150. [Google Scholar]
- Chen, X.; Hu, J.; Zhang, D.; Ren, P.; Liao, D.; Cai, L. Study on corrosion resistance of TC4 titanium alloy micro-arc oxidation/(PTFE+ graphite) composite coating. Int. J. Appl. Ceram. Technol. 2022, 19, 397–408. [Google Scholar] [CrossRef]
- Niinomi, M. Mechanical properties of biomedical titanium alloys. Mater. Sci. Eng. A 1998, 243, 231–236. [Google Scholar] [CrossRef]
- Huang, N.; Yang, P.; Leng, Y.X.; Chen, J.Y.; Sun, H.; Wang, J.; Leng, Y. Hemocompatibility of titanium oxide films. Biomaterials 2003, 24, 2177–2187. [Google Scholar] [CrossRef]
- Lv, X.X.; Shu, Y.; Zhao, G.X.; Xie, J.F.; Xue, Y. Research and application progress of titanium alloy petroleum pipe. Rare Met. Mater. Eng. 2014, 43, 1518–1524. [Google Scholar]
- Liu, C.C.; Ke, G.M.; Li, Y. High efficiency development technology and practice of ultra deep and high sulfur Reef Gas Reservoir in Yuanba gas field. Nat. Gas Ind. 2019, 39 (Suppl. 1), 149–155. [Google Scholar]
- Choi, Y.S.; Nesic, S.; Ling, S. Effect of H2S on the CO2 corrosion of carbon steel in acidic solutions. Electrochim. Acta 2011, 56, 1752–1760. [Google Scholar] [CrossRef]
- Liu, S.; Sun, H.; Sun, L.; Fan, H. Effects of pH and Cl− concentration on corrosion behavior of the galvanized steel in simulated rust layer solution. Corros. Sci. 2012, 65, 520–527. [Google Scholar] [CrossRef]
- Foley, R.T. Role of the chloride ion in iron corrosion. Corrosion 1970, 26, 58–70. [Google Scholar] [CrossRef]
- Li, Z.; Wang, J.; Dong, Y.; Xu, D.; Zhang, X.H.; Wu, J.H.; Gu, T.Y.; Wang, F.H. Synergistic effect of chloride ion and Shewanella algae accelerates the corrosion of Ti-6Al-4V alloy. J. Mater. Sci. Technol. 2021, 71, 177–185. [Google Scholar] [CrossRef]
- Wang, Y.; Cheng, G.; Wu, W.; Wu, Q.Q.; Li, Y.; Li, X.F. Effect of pH and chloride on the micro-mechanism of pitting corrosion for high strength pipeline steel in aerated NaCl solutions. Appl. Surf. Sci. 2015, 349, 746–756. [Google Scholar] [CrossRef]
- Fushimi, K.; Kondo, H.; Konno, H. Anodic dissolution of titanium in chloride-containing ethylene glycol solution. Electrochim. Acta 2009, 55, 258–264. [Google Scholar] [CrossRef]
- Starosvetsky, D.; Khaselev, O.; Auinat, M.; Ein-Eli, Y. Initiation of copper dissolution in sodium chloride electrolytes. Electrochim. Acta 2006, 51, 5660–5668. [Google Scholar] [CrossRef]
- Turnbull, A.; Zhou, S. Pit to crack transition in stress corrosion cracking of a steam turbine disc steel. Corros. Sci. 2004, 46, 1239–1264. [Google Scholar] [CrossRef]
- Van Boven, G.; Chen, W.; Rogge, R. The role of residual stress in neutral pH stress corrosion cracking of pipeline steels. Part I: Pitting and cracking occurrence. Acta Mater. 2007, 55, 29–42. [Google Scholar] [CrossRef]
- Akid, R.; Dmytrakh, I.M.; Gonzalez-Sanchez, J. Fatigue damage accumulation: The role of corrosion on the early stages of crack development. Corros. Eng. Sci. Technol. 2006, 41, 328–335. [Google Scholar] [CrossRef]
- Sanderson, G.; Powell, D.T.; Scully, J.C. The stress-corrosion cracking of Ti alloys in aqueous chloride solutions at room temperature. Corros. Sci. 1968, 8, 473–481. [Google Scholar] [CrossRef]
- Sanderson, G.; Scully, J.C. The stress corrosion of ti alloys in methanolic solutions. Corros. Sci. 1968, 8, 541–548. [Google Scholar] [CrossRef]
- Tan, C.; Lu, Y.; Zhang, X. Life extension and repair decision-making of ageing offshore platforms based on DHGF method. Ocean. Eng. 2016, 117, 238–245. [Google Scholar] [CrossRef]
- Zeinoddini, M.; Ranjbar, P.; Khalili, H.; Ranaei, A.; Golpour, H.; Fakheri, J. Remaining fatigue life assessment of aging fixed steel offshore jacket platforms. Struct. Infrastruct. Eng. 2016, 12, 223–238. [Google Scholar] [CrossRef]
- Tang, J.; Luo, H.; Qi, Y.; Xu, P.; Ma, S.; Zhang, Z.; Ma, Y. The effect of cryogenic burnishing on the formation mechanism of corrosion product film of Ti-6Al-4V titanium alloy in 0.9% NaCl solution. Surf. Coat. Technol. 2018, 345, 123–131. [Google Scholar] [CrossRef]
- Gao, G.; Li, Y.; Hu, D.; Xi, Z. Structure and Infrared Emissivity Properties of the MAO Coatings Formed on TC4 Alloys in K2ZrF6-Based Solution. Materials 2018, 11, 254. [Google Scholar] [CrossRef] [PubMed] [Green Version]
- Wang, Q.; Huang, F.; Cui, Y.T.; Yoshida, H.; Wen, L.; Jin, Y. Influences of formation potential on oxide film of TC4 in 0.5 M sulfuric acid. Appl. Surf. Sci. 2021, 544, 148888. [Google Scholar] [CrossRef]
- Zhou, H.; Shi, X.; Lu, G.; Chen, Y.; Yang, Z.; Wu, C.; Ibrahim, A.M.M. Friction and wear behaviors of TC4 alloy with surface microporous channels filled by Sn-Ag-Cu and Al2O3 nanoparticles. Surf. Coat. Technol. 2020, 387, 125552. [Google Scholar] [CrossRef]
- Li, X.; Dong, Y.C.; Dan, Z.H.; Chang, H.; Fang, Z.G.; Guo, Y.H. Corrosion behavior of ultrafine grained pure Ti procced by equal channel angular pressing. Acta Metall. Sin. 2019, 55, 967–975. [Google Scholar]
- Xie, F.; He, X.; Cao, S.; Mei, M.; Qu, X. Influence of pore characteristics on microstructure mechanical properties and corrosion resistance of selective laser sintered porous Ti–Mo alloys for biomedical applications. Electrochim. Acta 2013, 105, 121–129. [Google Scholar] [CrossRef]
- Li, J.; Chen, P.; Wang, Y.; Wang, G. Corrosion resistance of surface texturing epoxy resin coatings reinforced with fly ash cenospheres and multiwalled carbon nanotubes. Prog. Org. Coat. 2021, 158, 106388. [Google Scholar] [CrossRef]
- Li, J.D.; Chen, C.; Zhang, S.G.; Lin, B.; Wang, Y.Y.; Zhu, Y.Q.; Tang, Y.L. Research progress on localized corrosion behaviors of stress steal under different stress conditions. Surf. Technol. 2021, 50, 101–115. [Google Scholar]
- Fang, H.; Young, D.; Nesic, S. Corrosion of mild steel in the presence of elemental sulfur. NACE-International Corrosion Conference Series, Proceeding of the CORROSION 2008, New Orleans, LA, USA, 16–20 March 2008; National Association of Corrosion Engineers: Houston, TX, USA, 2008; p. 08637. [Google Scholar]
- Mott, N.F. The theory of crystal rectifiers. Proc. R. Soc. Lond. Ser. A Math. Phys. Sci. 1939, 171, 27–38. [Google Scholar]
- Macdonald, D.D.; Urquidi-Macdonald, M. Theory of steady-state passive films. J. Electrochem. Soc. 1990, 137, 2395. [Google Scholar] [CrossRef]
- Tan, Y.; Aung, N.N.; Liu, T. Evaluating localised corrosion intensity using the wire beam electrode. Corros. Sci. 2012, 63, 379–386. [Google Scholar] [CrossRef]
- Munirathinam, B.; Narayanan, R.; Neelakantan, L. Electrochemical and semiconducting properties of thin passive film formed on titanium in chloride medium at various pH conditions. Thin Solid Films 2016, 598, 260–270. [Google Scholar] [CrossRef]
- Ren, K.; Gan, Y.X.; Young, T.J.; Moutassem, Z.M.; Zhang, L. Photoelectrochemical responses of doped and coated titanium dioxide composite nanotube anodes. Compos. Part B Eng. 2013, 52, 292–302. [Google Scholar] [CrossRef]
- Wilhelm, S.M.; Yun, K.S.; Ballenger, L.W.; Hackerman, N. Semiconductor properties of iron oxide electrodes. J. Electrochem. Soc. 1979, 126, 419. [Google Scholar] [CrossRef]
- Alrobei, H.; Kumar, A.; Ram, M.K. Aluminum–α-hematite thin films for photoelectrochemical applications. Surf. Rev. Lett. 2018, 25, 1950031. [Google Scholar] [CrossRef]
- Timoshnev, S.N.; Mizerov, A.M.; Lapushkin, M.N.; Kukushkin, S.A.; Bouravleuv, A.D. Electronic Structure of SiN Layers on Si (111) and SiC/Si (111) Substrates. Semiconductors 2019, 53, 1935–1938. [Google Scholar] [CrossRef]
- Sobolev, A.; Bograchev, D.; Zinigrad, M.; Borodianskiy, K. Evolution of corrosion on microstructure of ceramic coating produced by plasma electrolytic oxidation in molten salt. Ceram. Int. 2022, 48, 10990–10998. [Google Scholar] [CrossRef]
- Ling, W.; Xie, J.F.; Wang, Y.Q.; Ji, L.; Zhao, M.F.; Liang, J.J.; Lv, X.H.; Zhao, G.X. Study on Corrosion Electrochemical Properties of Titanium Alloy Tubesin Severe Environment. Hot Work. Technol. 2018, 47, 98–102. [Google Scholar]
- Cao, C.N.; Chang, X.Y.; Lin, H.C. Characteristics of electrochemical noise in pitting process. J. Chin. Soc. Corros. Prot. 1989, 9, 21–28. [Google Scholar] [CrossRef]
- Shao, R.K. Study on the correlation between mechanochemical effects of elastically deformed metals and corrosion processes. J. Civ. Aviat. Inst. China 1997, 15, 67–73. [Google Scholar]
- Liu, J.; Zhang, T.; Meng, G.; Shao, Y.; Wang, F. Effect of pitting nucleation on criticle pitting temperature 316L stainless by nitric acid passivation. Corros. Sci. 2015, 91, 232–244. [Google Scholar] [CrossRef]
- Yu, M.; Wei, X.D.; Fan, S.Y.; Liu, J.H.; Li, S.M.; Zhong, J.Y. Corrosion behavior of 2297 Al-Li alloy under tensile load. J. Chin. Soc. Corros. Prot. 2019, 39, 439–445. [Google Scholar]
- Scully, J.C. Kinetic Features of Stress-Corrosion Cracking. Corros. Sci. 1967, 7, 197–207. [Google Scholar] [CrossRef]
- Gutman, E.M. Mechanochemistry of Solid Surfaces; World Scientific Publication: Singapore, 1994. [Google Scholar]
- Streicher, M.A. Pitting corrosion of 18Cr-8Ni stainless steel. J. Electrochem. Soc. 1956, 103, 375. [Google Scholar] [CrossRef]
- Liu, Y.; Xiang, Y.; Xu, H.; Li, H. The reuse of nano-TiO2 under different concentration of CO32− using coagulation process and its photocatalytic ability in treatment of methyl orange. Sep. Purif. Technol. 2022, 282, 120152. [Google Scholar] [CrossRef]
- He, J.; Yan, M.S.; Yang, L.J.; Yang, L.J.; Song, Z.L.; Jiang, Y.H. Electrochemical corrosion and critical pitting temperature of S32750 super duplex stainless steel in NaCl solution. J. Chin. Soc. Corros. Prot. 2015, 35, 106–112. [Google Scholar]
- Liu, J.H.; Hao, X.L.; Li, S.M.; Yu, M. Resistance to stress corrosion cracking of new Al-Mg-Cu alloy containing Sc. Chin. J. Nonferrous Met. 2010, 20, 415–419. [Google Scholar]


| Element | Al | V | Fe | Si | C | O | N | H | Ti |
|---|---|---|---|---|---|---|---|---|---|
| Content | 6.80 | 4.00 | 0.30 | 0.13 | 0.10 | 0.20 | 0.05 | 0.015 | Balance |
| Sample | Plastic Elongation Strength/MPa | Tensile Strength/MPa | Elongation after Break/% | Rm/MPa | Rp0.2/MPa | Rp0.1/MPa | A/% | Z/% | E/GPa |
|---|---|---|---|---|---|---|---|---|---|
| TC4 | 1130 | 1171 | 11.27 | 967 | 860 | 836 | 16.2 | 44.1 | 110 |
| Applied Load | 20% σs | 40% σs | 60% σs | 80% σs | 103% σs |
|---|---|---|---|---|---|
| Value/MPa | 172 | 344 | 516 | 688 | 885.8 |
| y/mm | 0.323 | 0.646 | 0.969 | 1.292 | 1.663 |
| Conditions | Parameters | ||||
|---|---|---|---|---|---|
| Applied stress/MPa | 20% σs | 40% σs | 60% σs | 80% σs | 103% σs |
| Cl− concentration/mg/L | 25,000 | ||||
| Total pressure/MPa | 10 | ||||
| CO2 partial pressure/MPa | 4 | ||||
| Temperature/°C | 200 | ||||
| Conditions | Parameters | ||||
|---|---|---|---|---|---|
| Applied stress/MPa | 20% σs | 40% σs | 60% σs | 80% σs | 103% σs |
| Cl− concentration/mg/L | 25,000 | ||||
| CO2 partial pressure/MPa | CO2 was continuously introduced during the experiment | ||||
| Temperature/°C | 200 | ||||
| Element | 80% σs | 103% σs | ||
|---|---|---|---|---|
| Mass% | Atom% | Mass% | Atom% | |
| C | 9.44 | 26.87 | 8.70 | 22.65 |
| O | 3.80 | 8.11 | 8.33 | 16.18 |
| Na | 0.63 | 0.94 | 2.47 | 3.36 |
| Al | 4.49 | 5.69 | 6.37 | 9.06 |
| Si | - | - | 2.42 | 2.61 |
| Cl | 0.64 | 0.61 | 1.81 | 1.60 |
| Ti | 80.38 | 57.35 | 67.06 | 42.81 |
| V | 0.62 | 0.43 | 2.84 | 1.73 |
| Total | 100 | 100 | 100 | 100 |
| Corrosive Environments | Loaded Stress | Ecorr (V) | icorr (A·cm−2) | Bc (mV) | Ba (mV) | RP (Ω·cm−2) |
|---|---|---|---|---|---|---|
| 25,000 mg/L Cl− 90 °C CO2 | 20% σs | −0.413 | 1.168 × 10⁻⁴ | 27.548 | 89.865 | 7.85 × 10⁴ |
| 40% σs | −0.351 | 5.471 × 10⁻⁵ | 98.638 | 96.763 | 3.88 × 10⁵ | |
| 60% σs | −0.358 | 5.122 × 10⁻⁵ | 34.666 | 36.221 | 1.50 × 10⁵ | |
| 80% σs | −0.391 | 7.290 × 10⁻⁵ | 29.484 | 21.586 | 7.43 × 10⁴ | |
| 103% σs | −0.426 | 6.759 × 10⁻³ | 21.364 | 36.486 | 8.67 × 10⁵ |
| Corrosive Environment | Applied Stress/(MPa) | Rs/(Ω·cm2) | Cc/(F·cm−2) | Rc/(Ω·cm2) | Cdl/(F·cm−2) | Rct/(Ω·cm2) | W/(Ω·cm2) |
|---|---|---|---|---|---|---|---|
| 25,000 mg/L Cl− CO2 | 20% σs | 3.189 | 3.476 × 10⁻⁶ | 65.34 | 1.344 × 10⁻⁵ | 427.1 | / |
| 40% σs | 29.41 | 4.168 × 10⁻⁵ | 256.5 | 3.34 × 10⁻⁴ | 5691 | / | |
| 60% σs | 22.58 | 4.028 × 10⁻⁵ | 208.6 | 2.645 × 10⁻⁴ | 1468 | / | |
| 80% σs | 30.93 | 6.473 × 10⁻⁶ | 148.2 | 5.243 × 10⁻⁵ | 775.8 | / | |
| 103% σs | 20.13 | 6.306 × 10⁻⁵ | 19.36 | / | / | 1.483 × 10⁻² |
| Corrosive Environment | Loading Stress/MPa | ND/cm−3 | NA/cm−3 |
|---|---|---|---|
| 25,000 mg/L Cl− CO2 90 °C | 20% σs | 2.053 × 10²¹ | 1.763 × 10²¹ |
| 40% σs | 9.051 × 10²⁰ | 5.464 × 10²⁰ | |
| 60% σs | 9.948 × 10²⁰ | 9.565 × 10²⁰ | |
| 80% σs | 1.203 × 10²¹ | 1.611 × 10²¹ | |
| 103% σs | 1.235 × 10²⁰ | 4.965 × 10¹⁹ |
Publisher’s Note: MDPI stays neutral with regard to jurisdictional claims in published maps and institutional affiliations. |
© 2022 by the authors. Licensee MDPI, Basel, Switzerland. This article is an open access article distributed under the terms and conditions of the Creative Commons Attribution (CC BY) license (https://creativecommons.org/licenses/by/4.0/).
Share and Cite
Wang, X.-Y.; Zhu, S.-D.; Yang, Z.-G.; Wang, C.-D.; Wang, N.; Zhang, Y.-Q.; Yu, F.-L. Corrosion–Resistance Mechanism of TC4 Titanium Alloy under Different Stress-Loading Conditions. Materials 2022, 15, 4381. https://doi.org/10.3390/ma15134381
Wang X-Y, Zhu S-D, Yang Z-G, Wang C-D, Wang N, Zhang Y-Q, Yu F-L. Corrosion–Resistance Mechanism of TC4 Titanium Alloy under Different Stress-Loading Conditions. Materials. 2022; 15(13):4381. https://doi.org/10.3390/ma15134381
Chicago/Turabian StyleWang, Xin-Yu, Shi-Dong Zhu, Zhi-Gang Yang, Cheng-Da Wang, Ning Wang, Yong-Qiang Zhang, and Feng-Ling Yu. 2022. "Corrosion–Resistance Mechanism of TC4 Titanium Alloy under Different Stress-Loading Conditions" Materials 15, no. 13: 4381. https://doi.org/10.3390/ma15134381
APA StyleWang, X.-Y., Zhu, S.-D., Yang, Z.-G., Wang, C.-D., Wang, N., Zhang, Y.-Q., & Yu, F.-L. (2022). Corrosion–Resistance Mechanism of TC4 Titanium Alloy under Different Stress-Loading Conditions. Materials, 15(13), 4381. https://doi.org/10.3390/ma15134381