
Investigating the Ultrasonic Pulse Velocity of Concrete Containing Waste Marble Dust and Its Estimation Using Artificial Intelligence

 , ,
, ,  ,
, 
Abstract
:1. Introduction
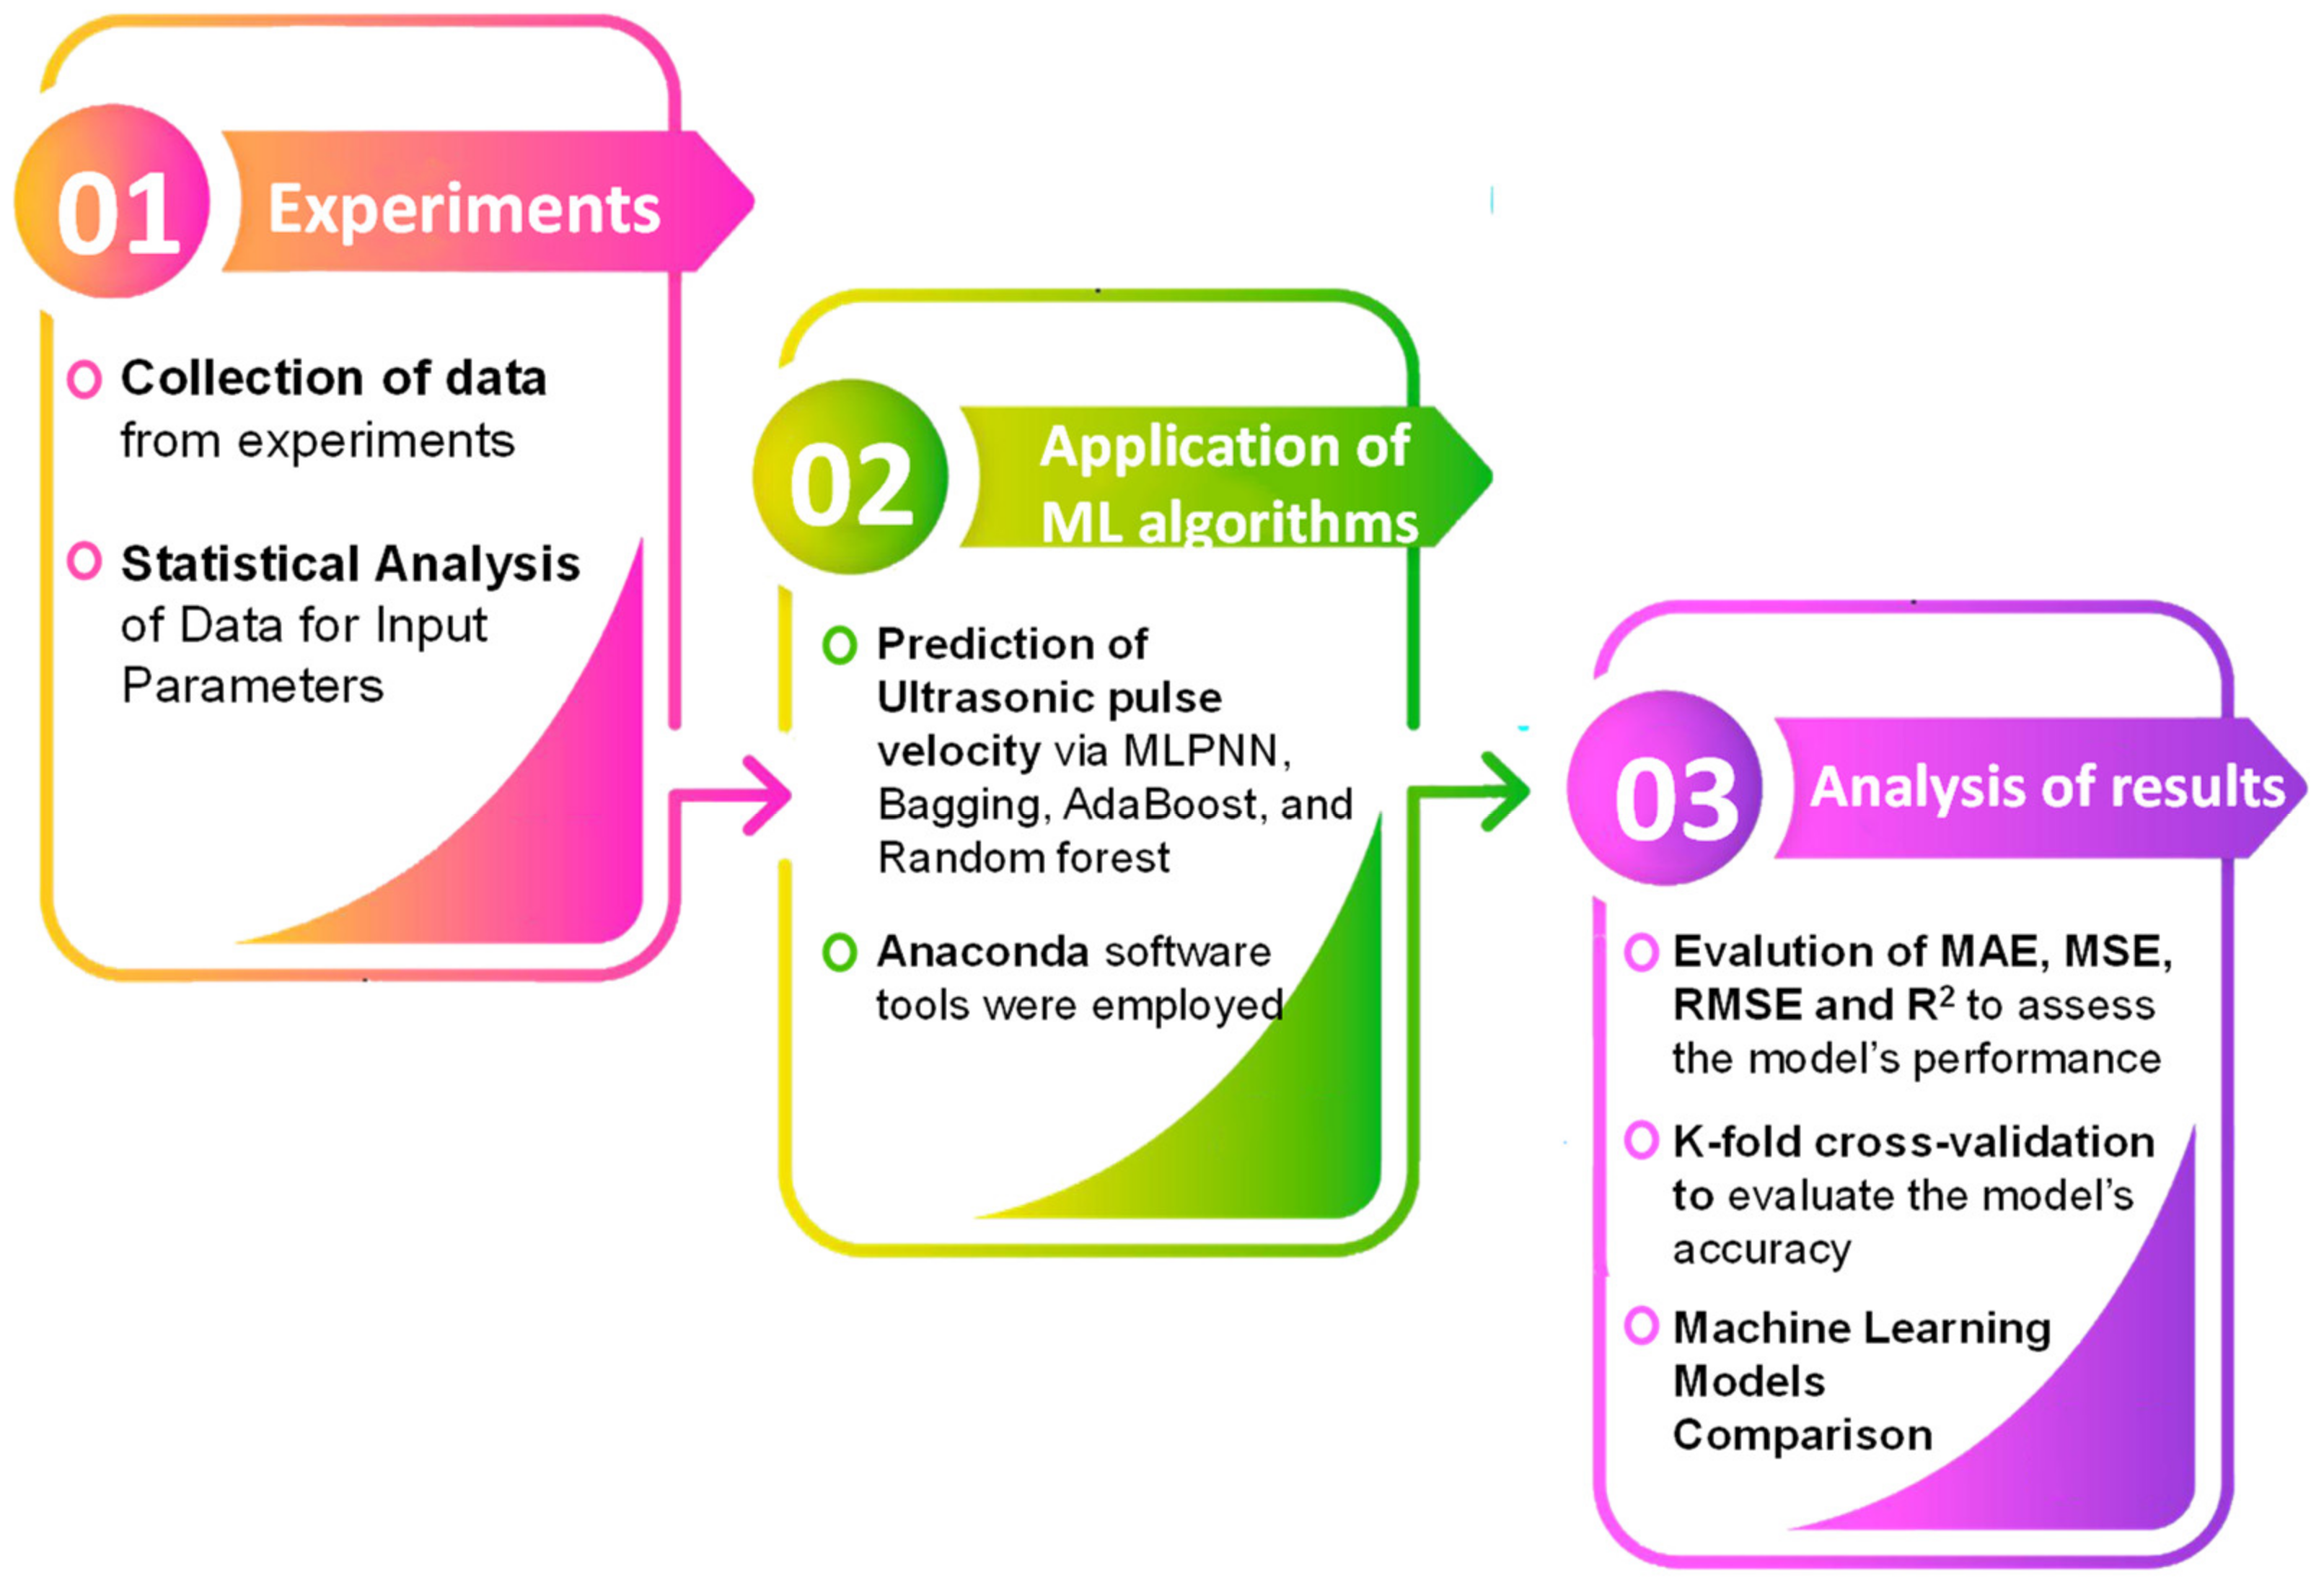
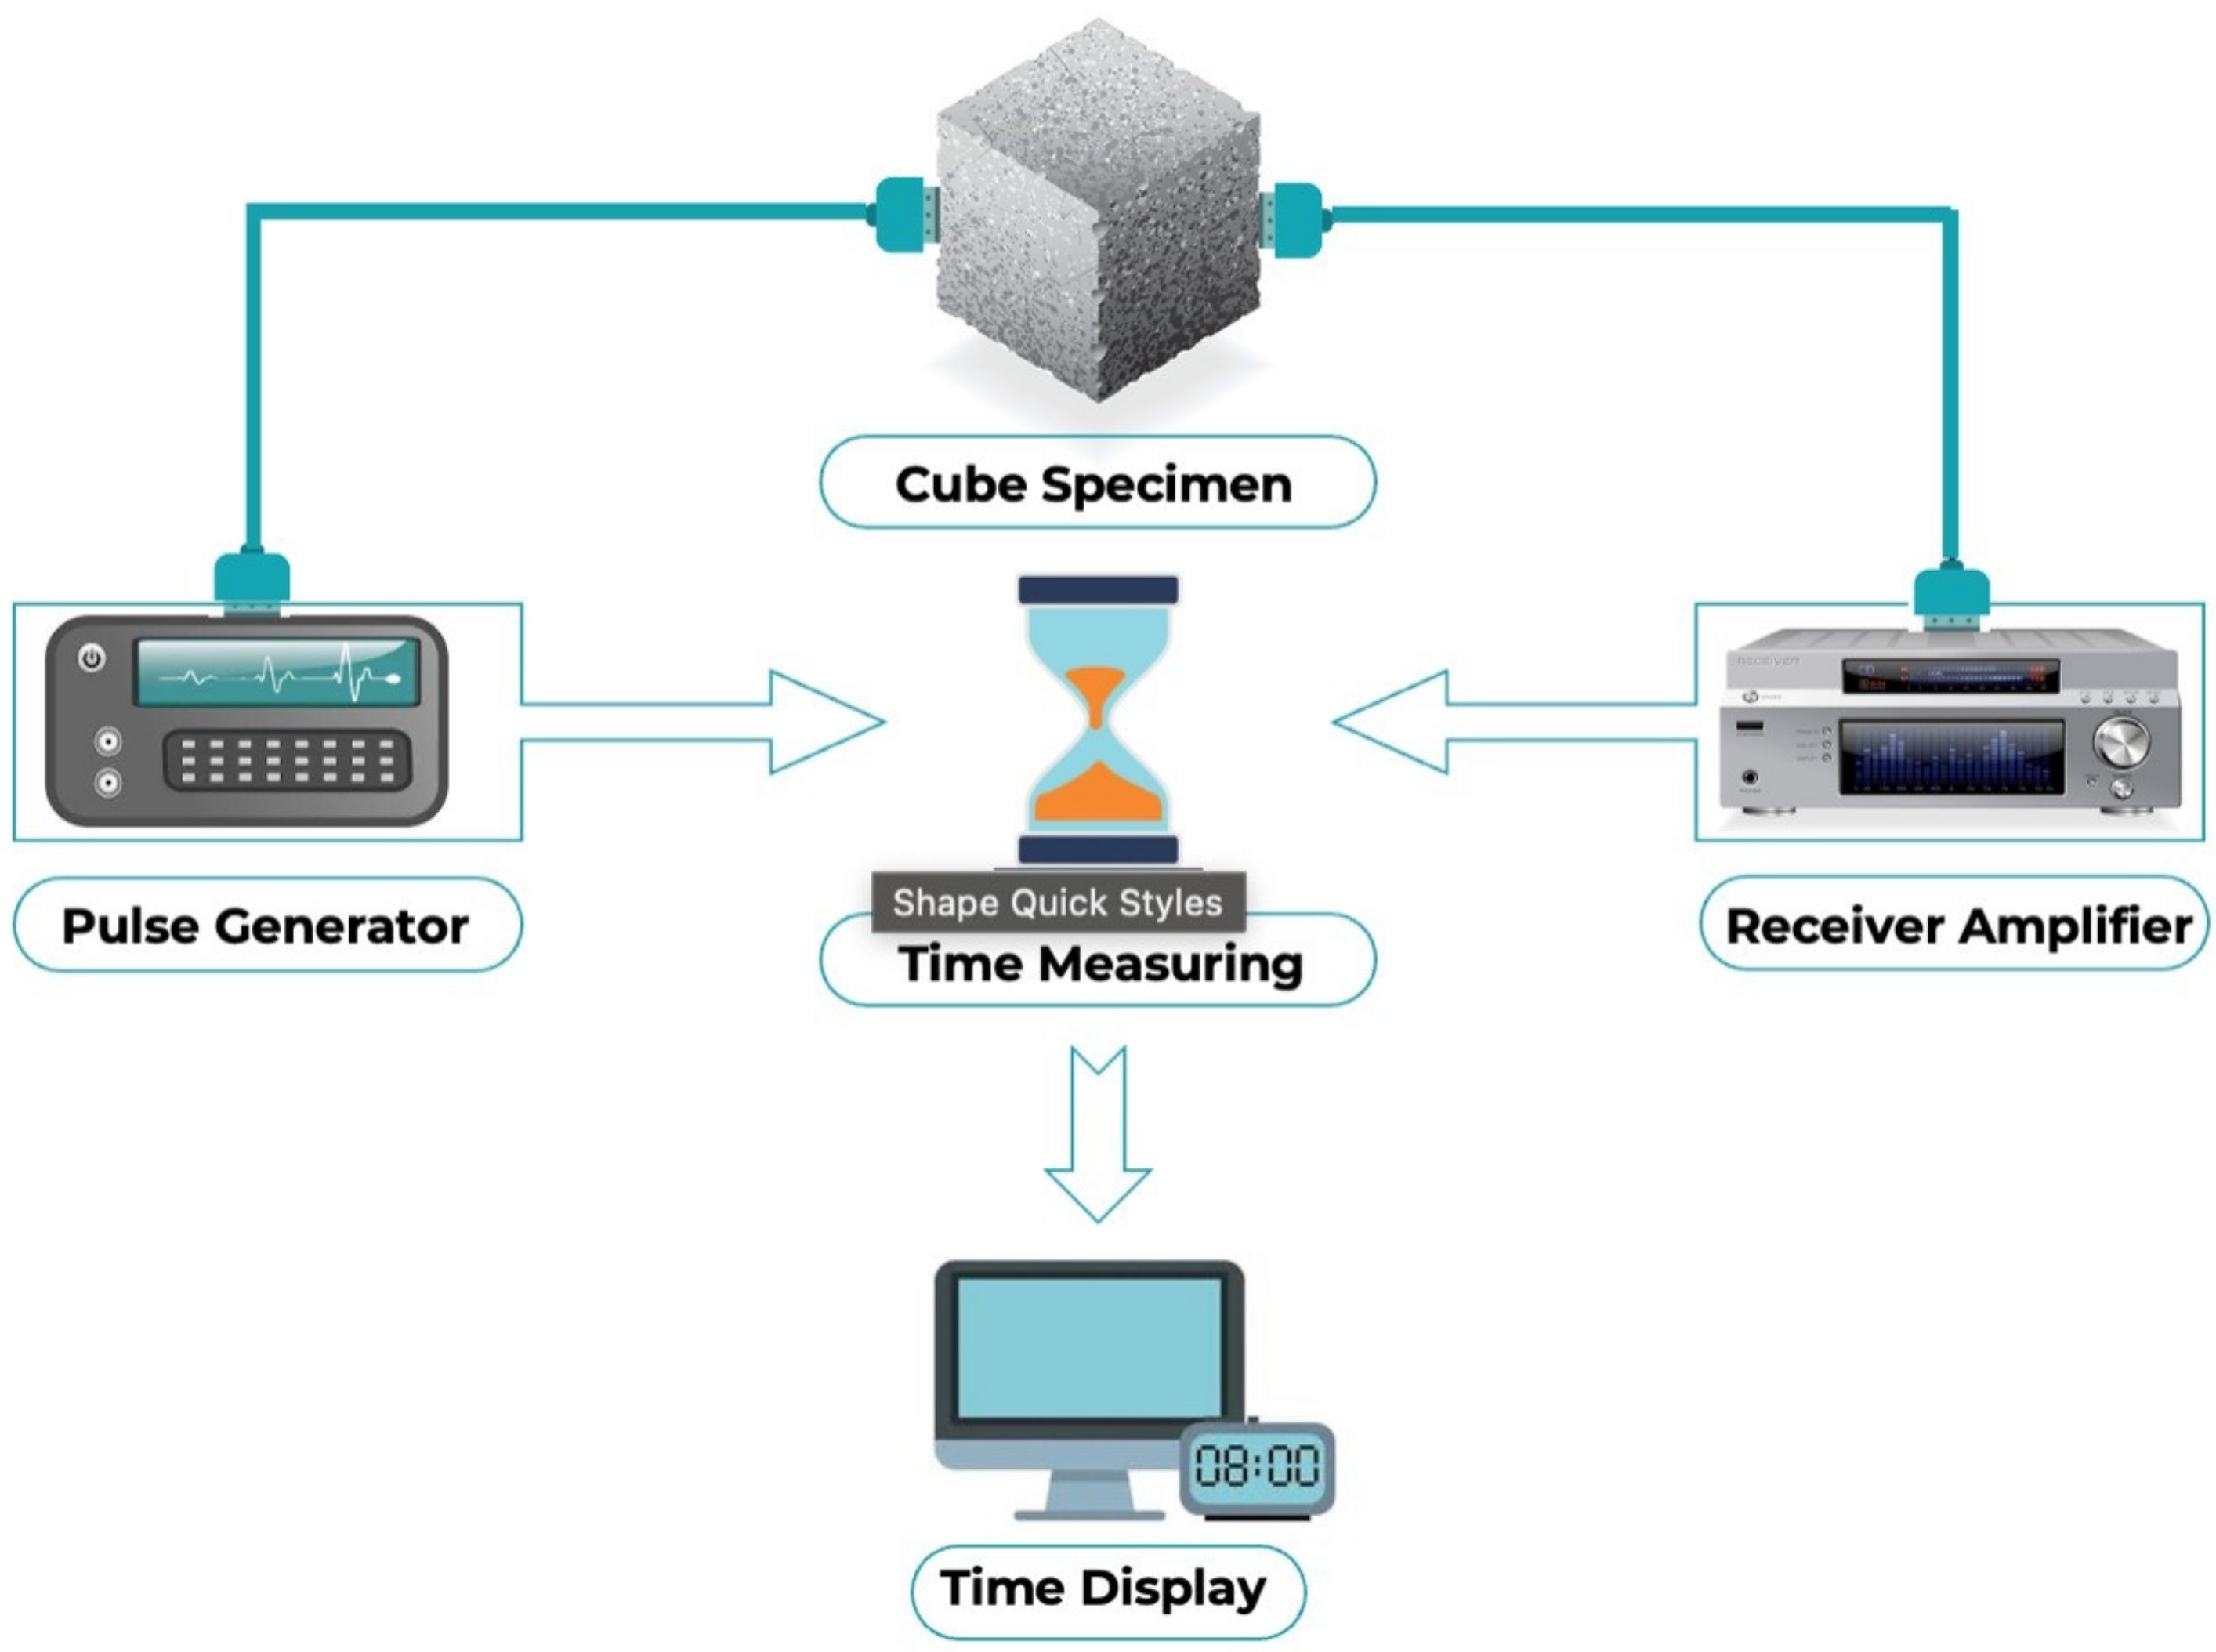
2. Materials and Methods
3. Results and Discussion
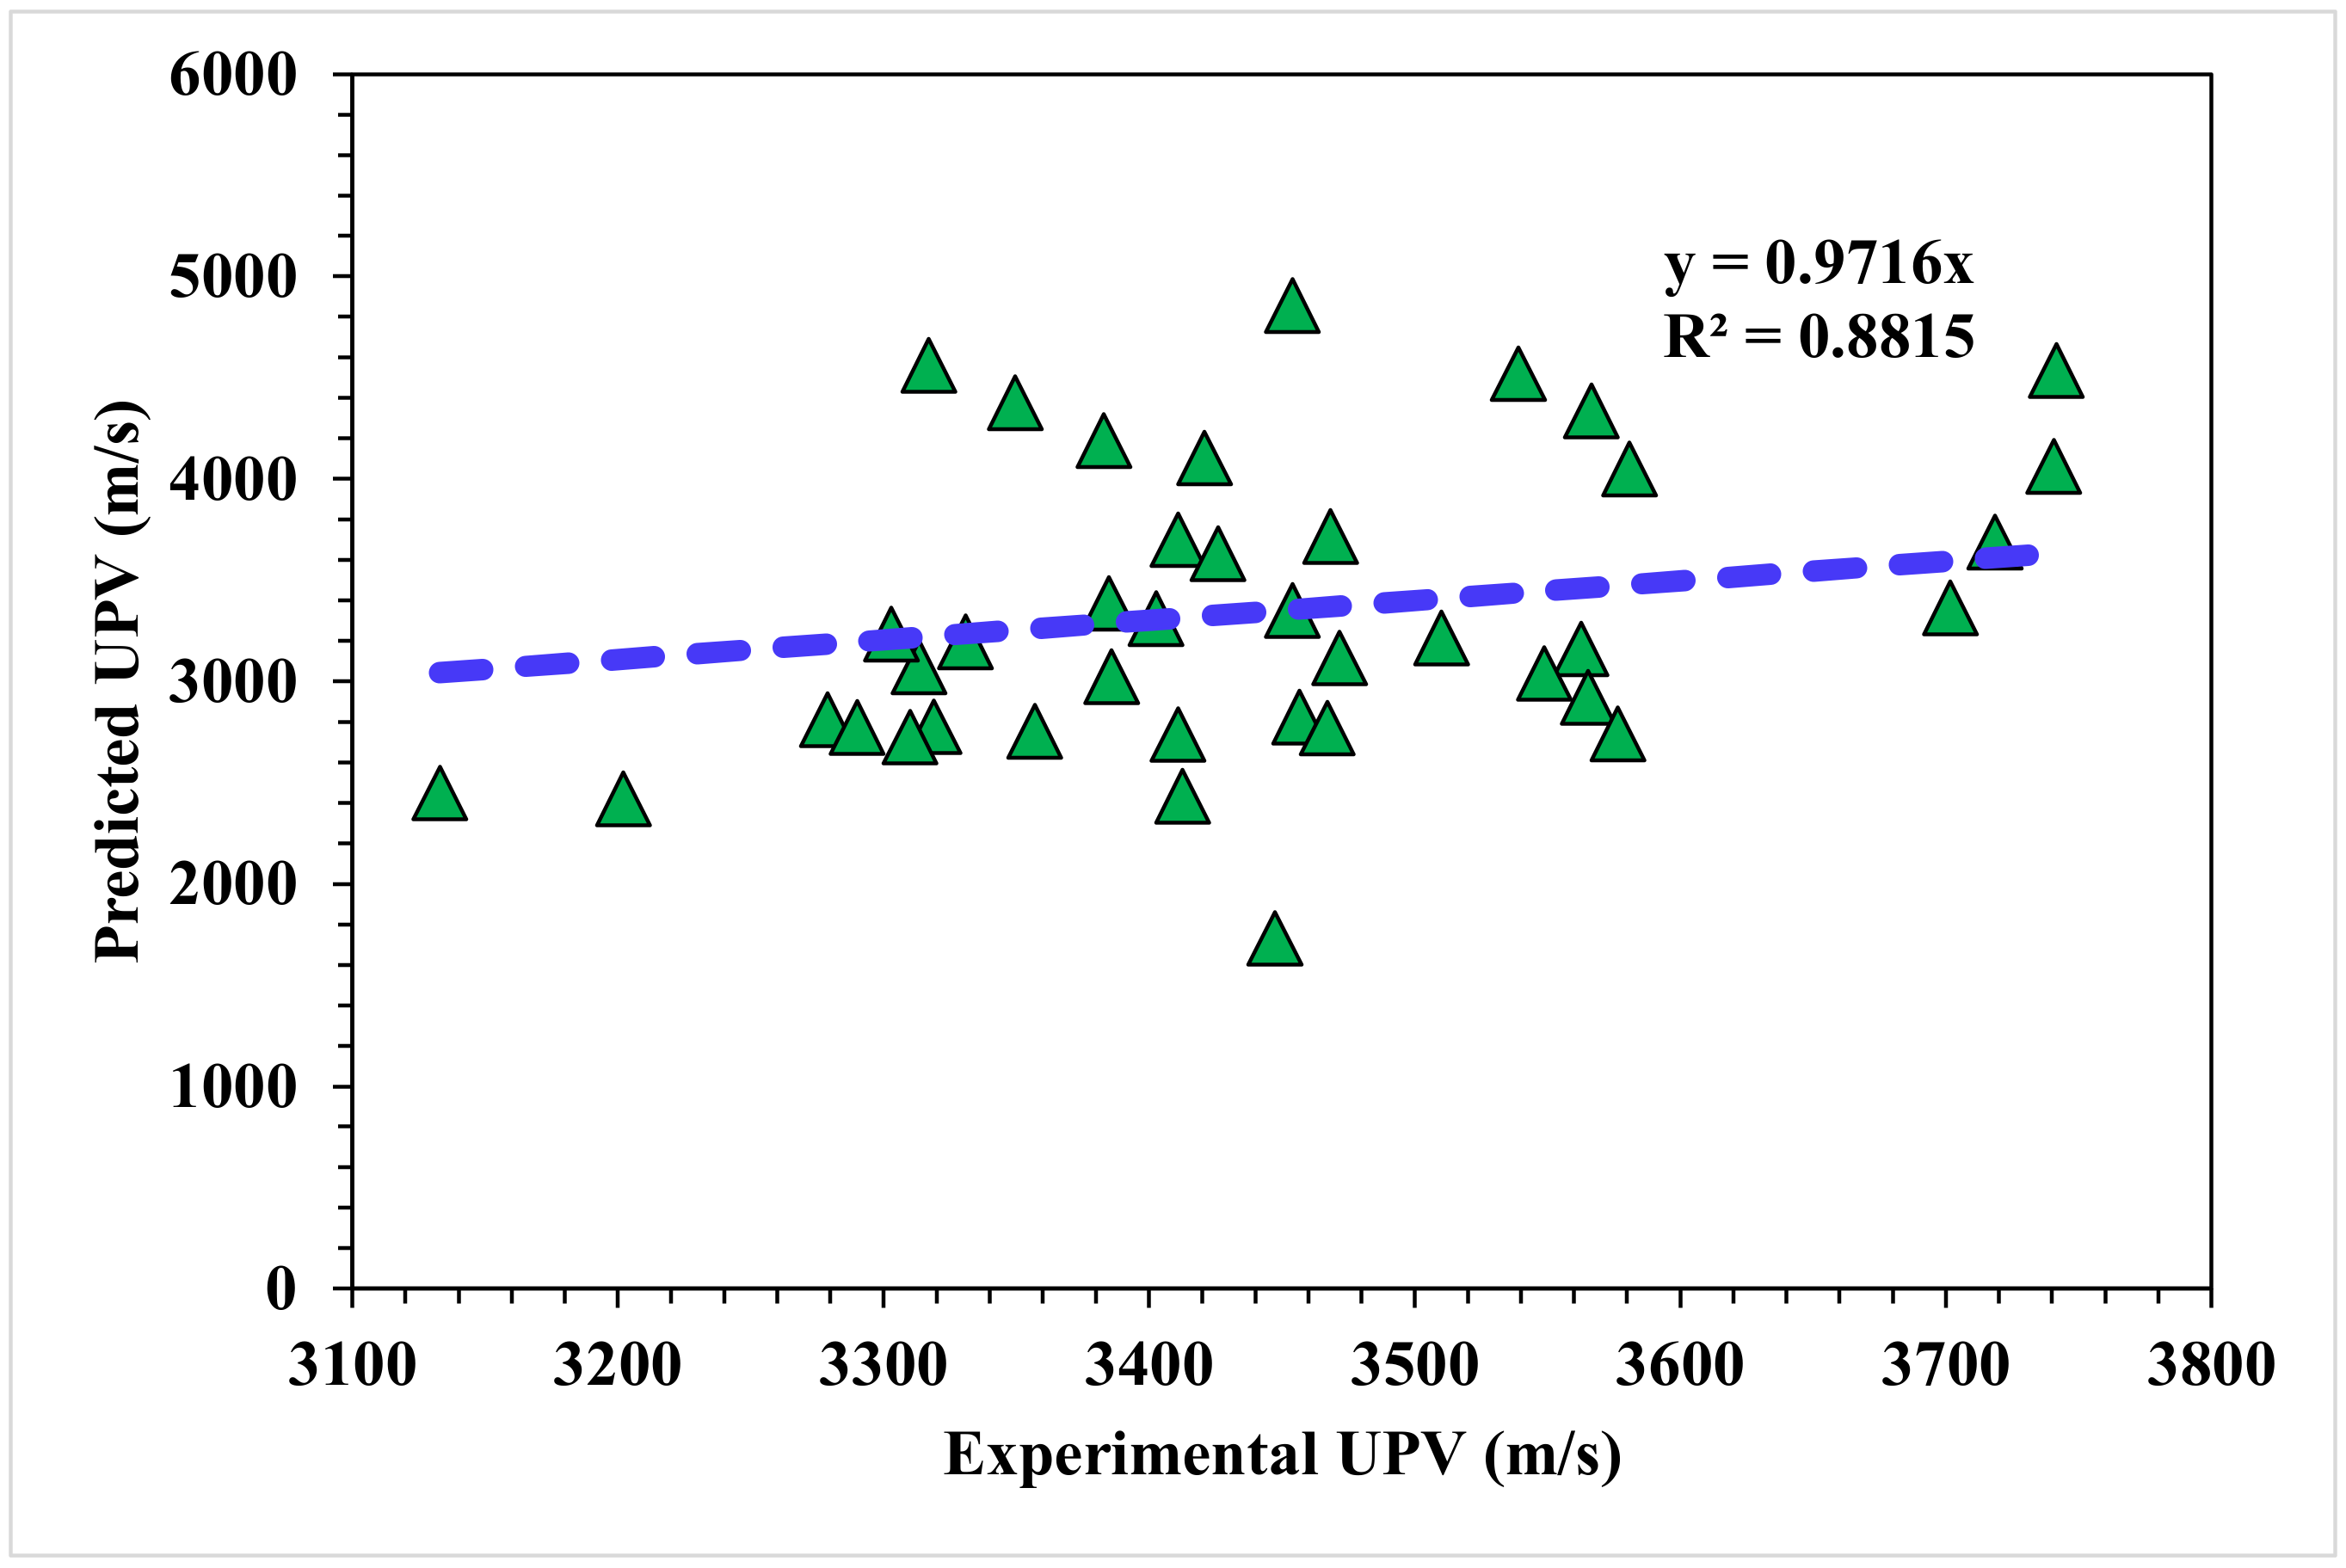
3.1. Multiple-Layer Perceptron Neural Network (MLPNN) Algorithm
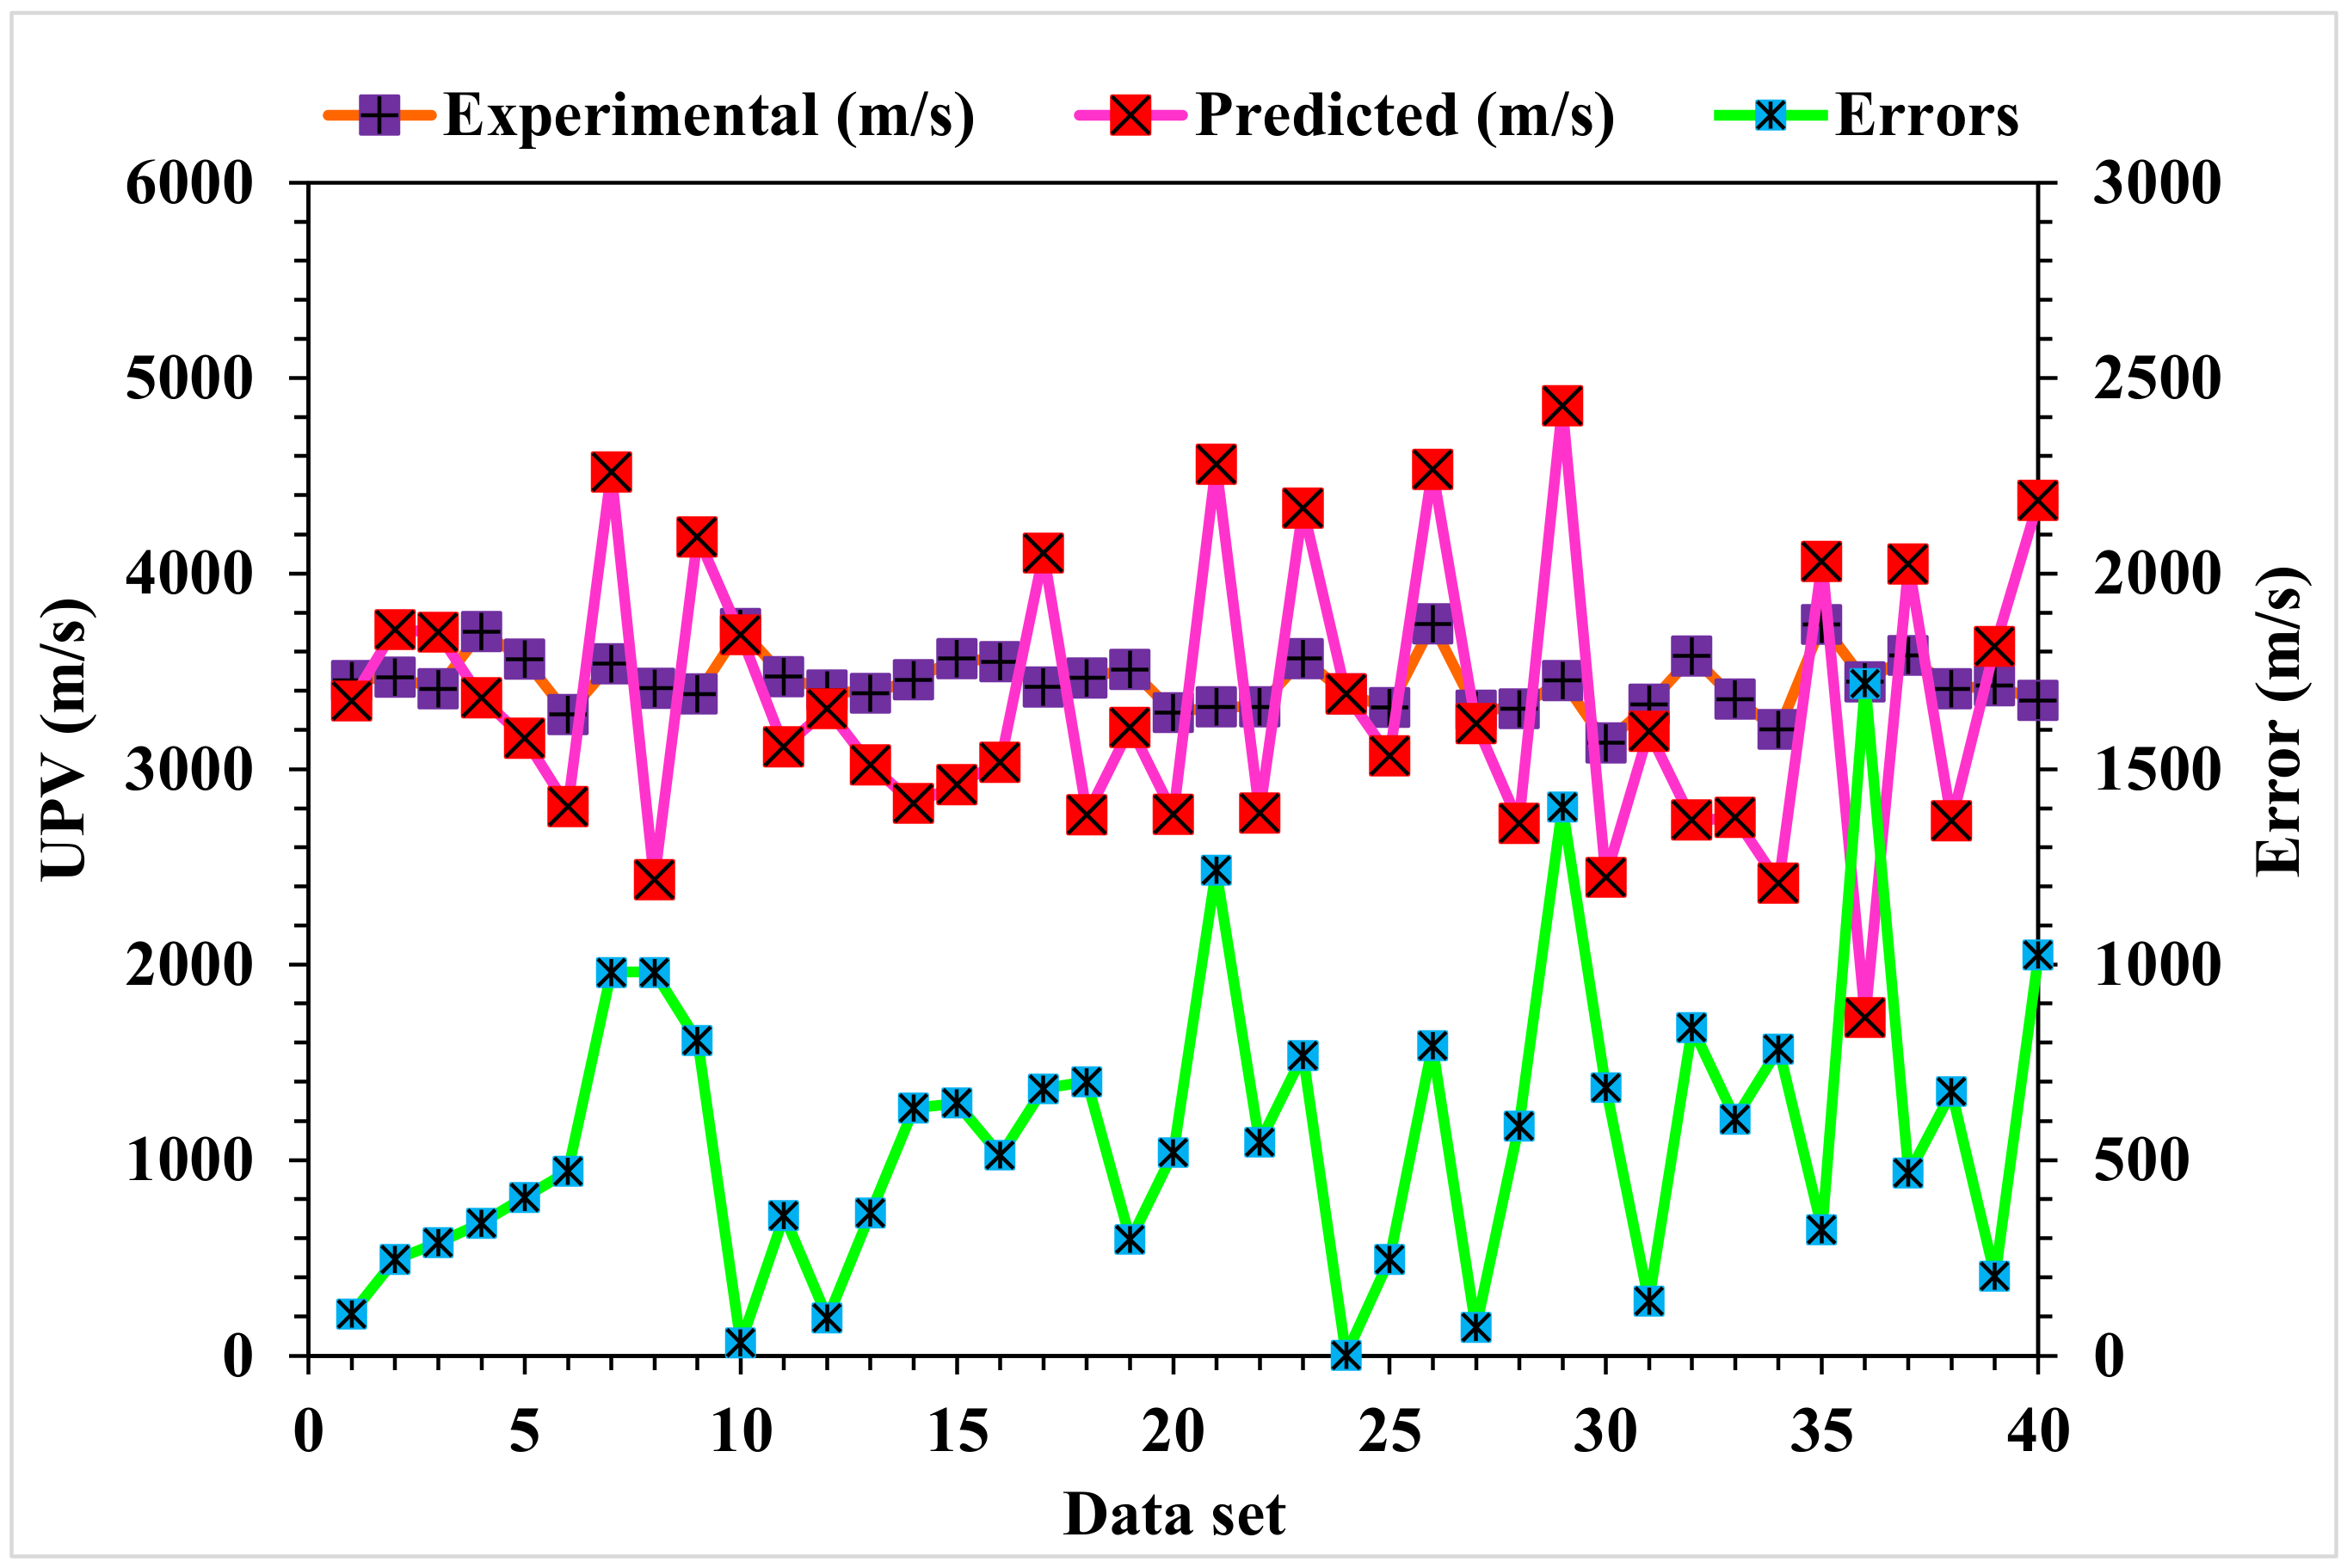
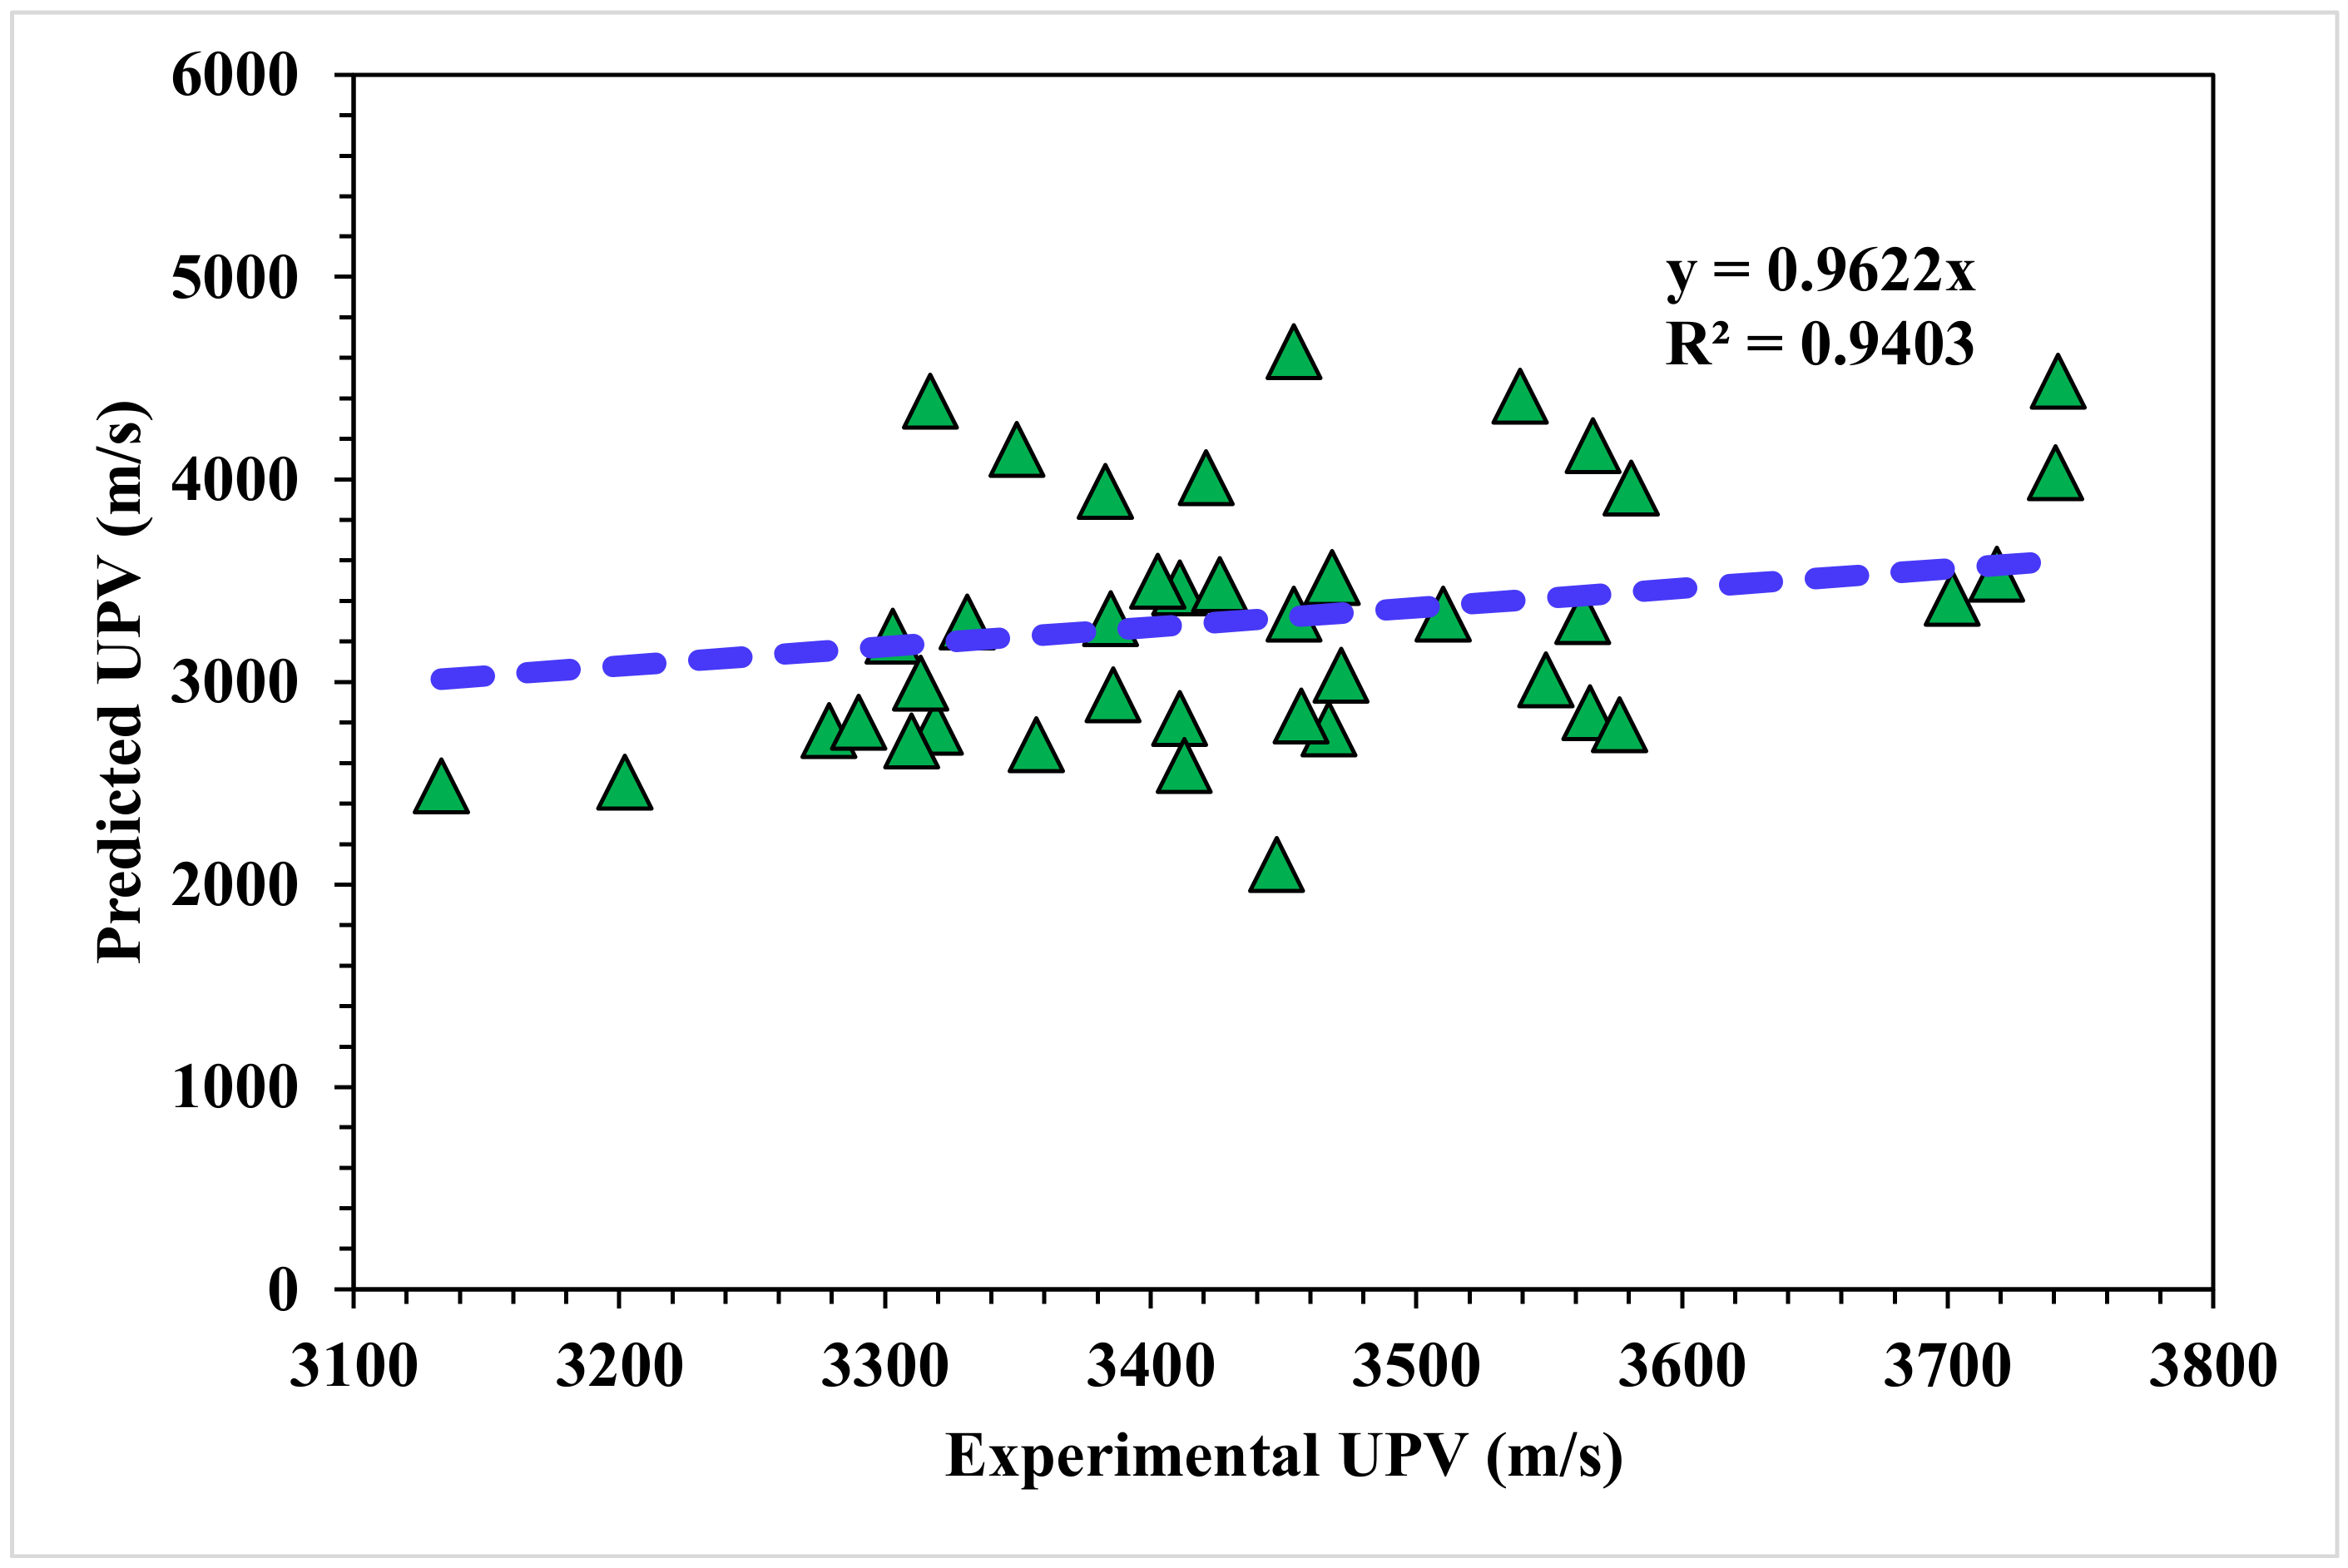
3.2. Bagging Algorithm
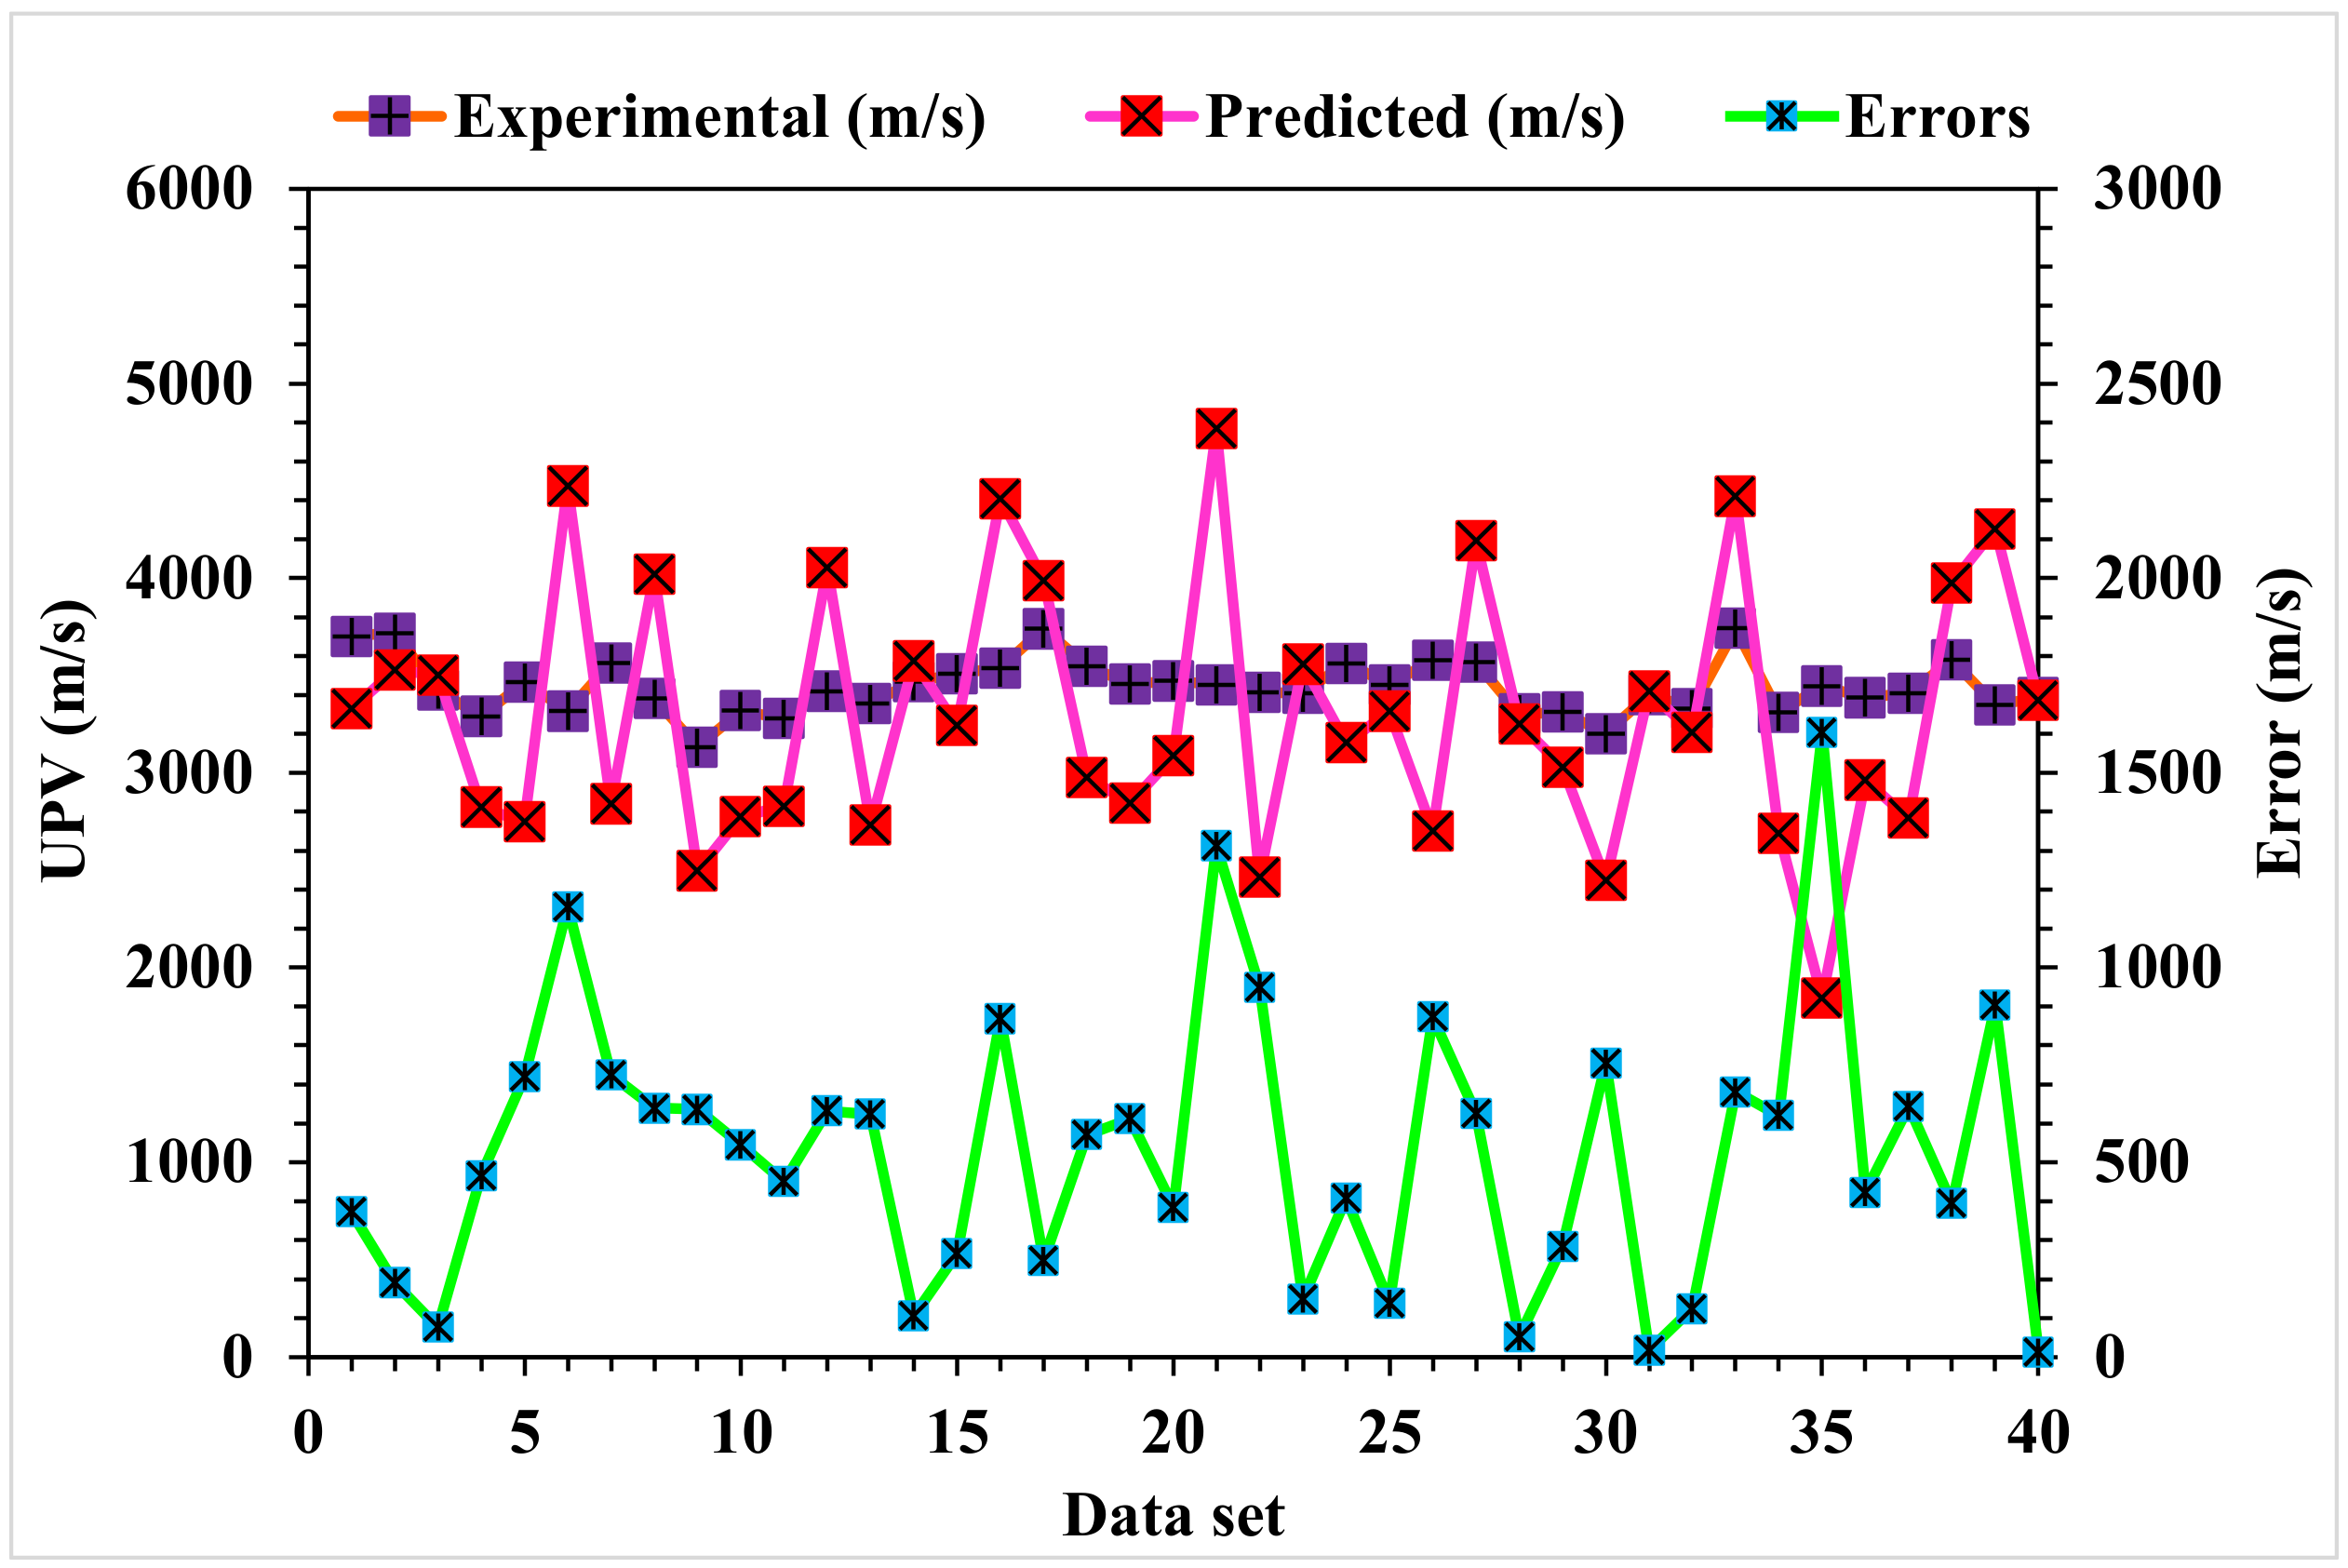
3.3. AdaBoost Algorithm
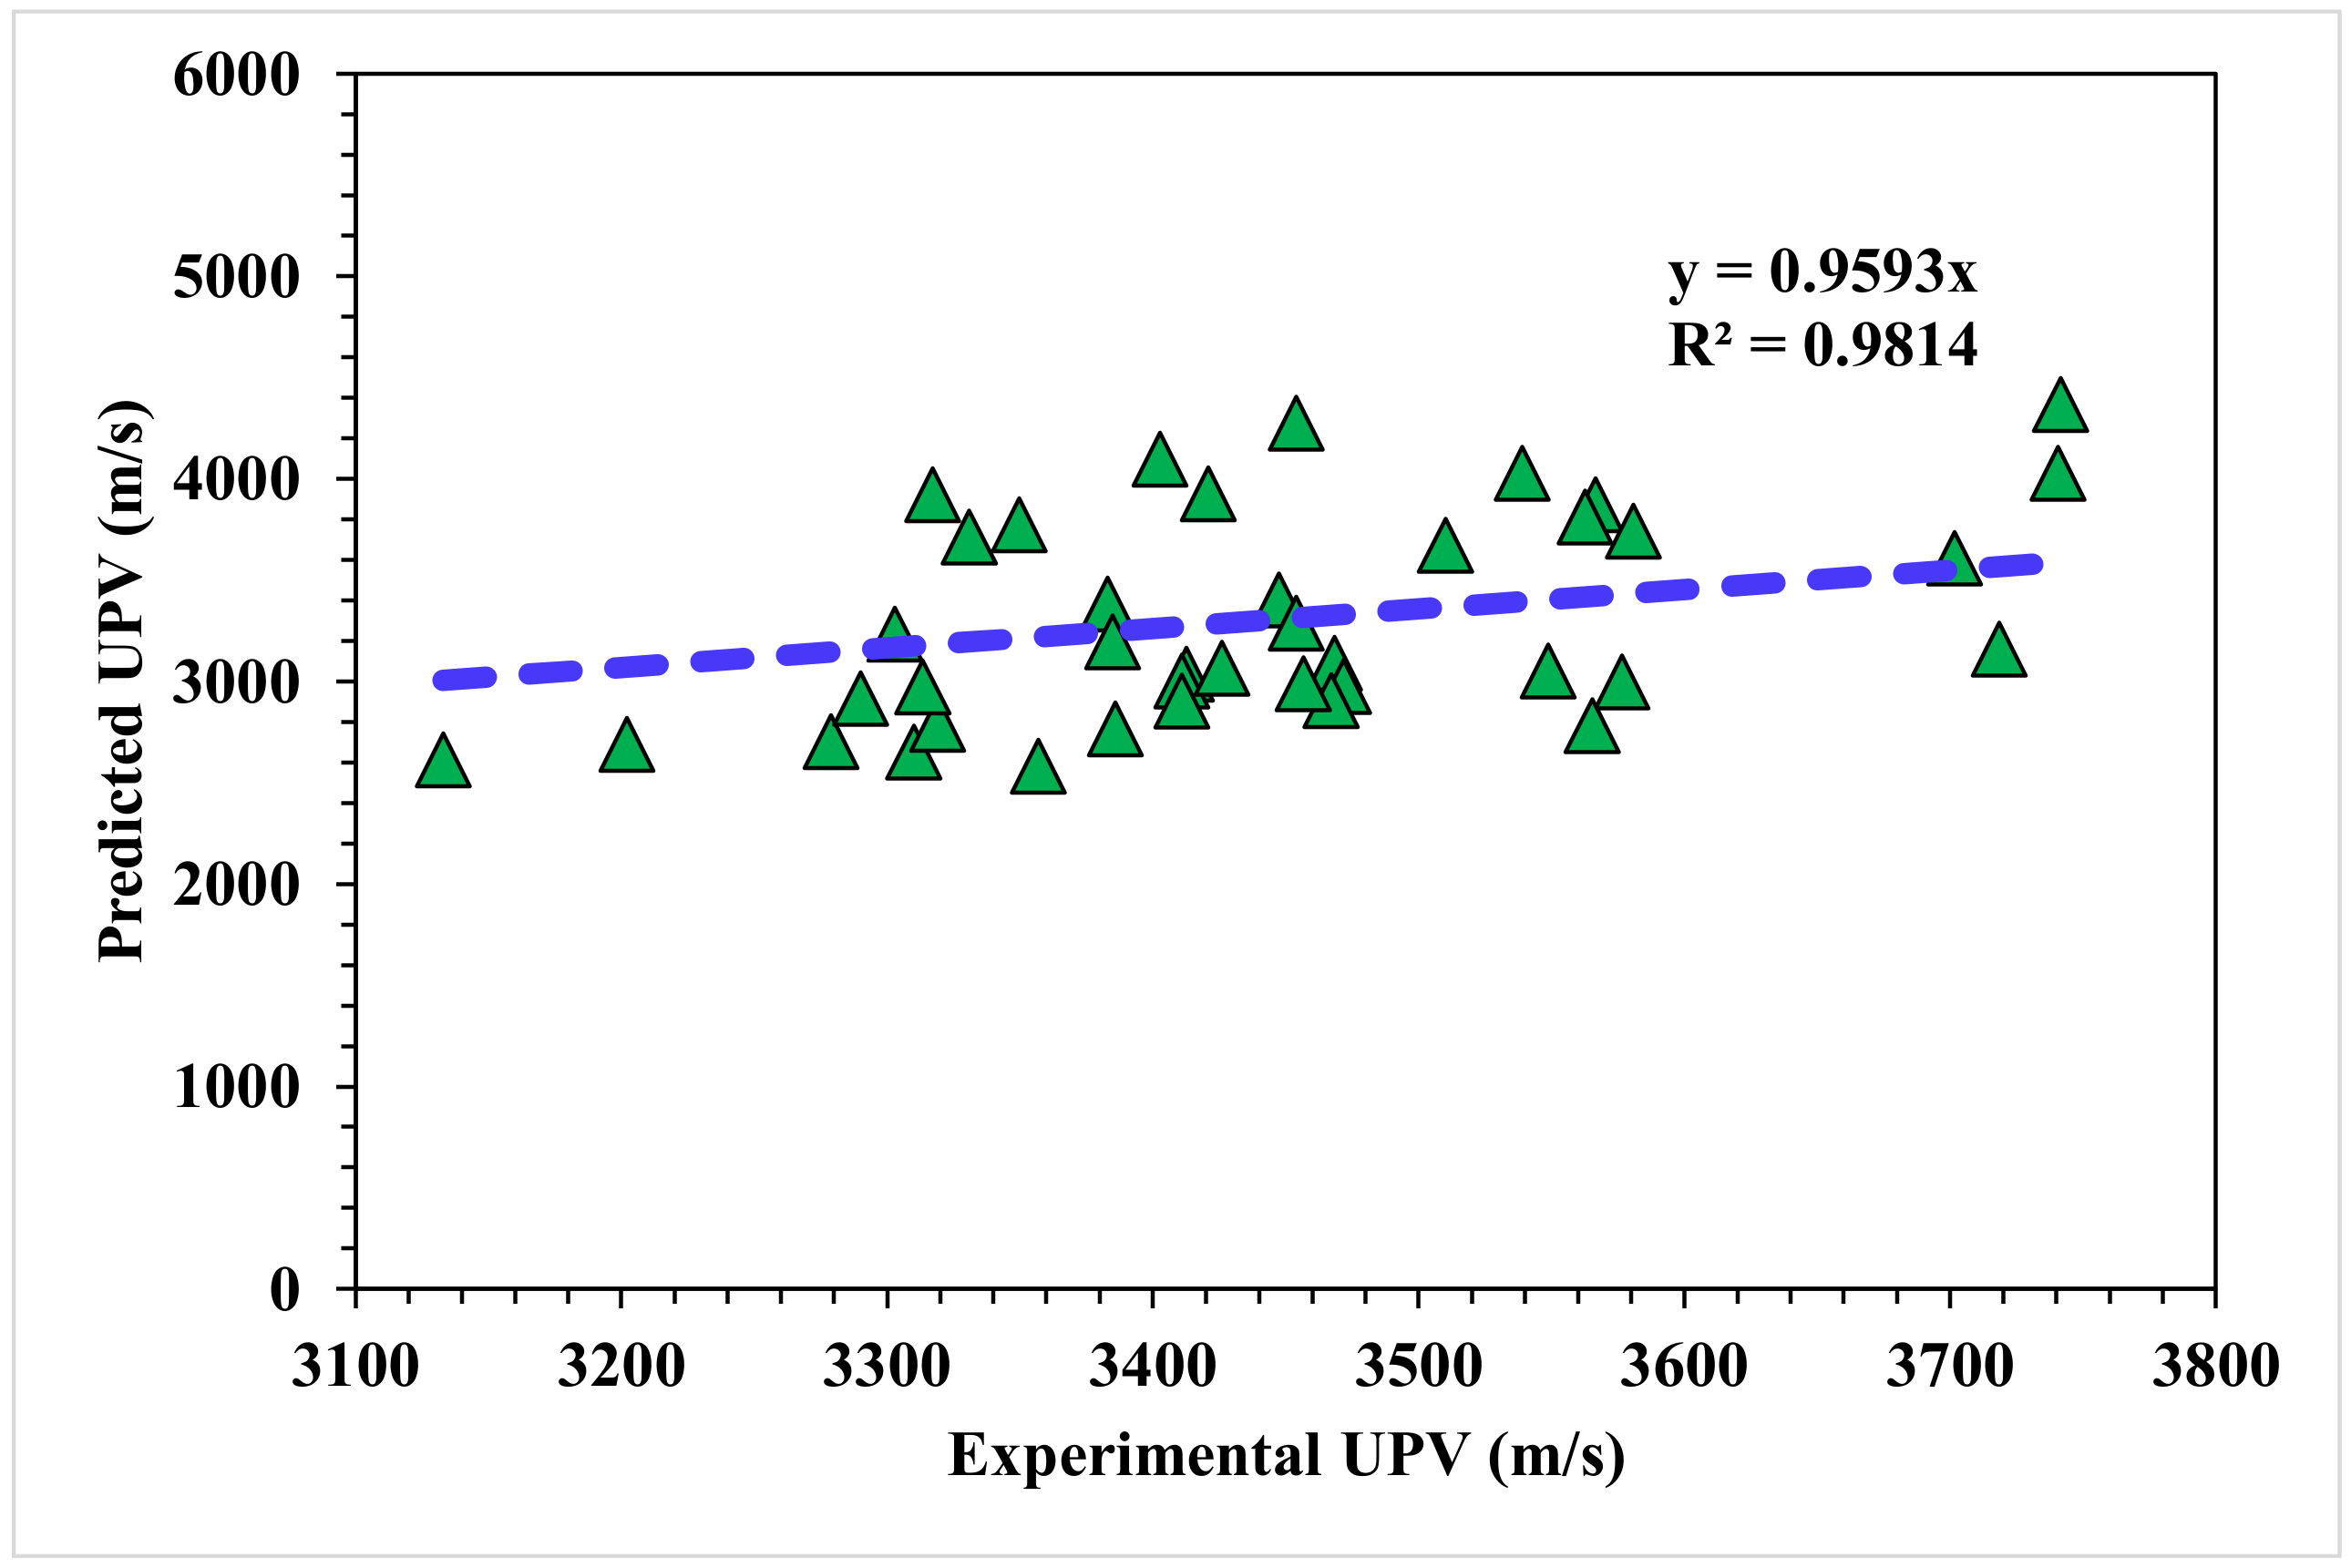
3.4. Random Forest Algorithm
4. Model Performance Assessment
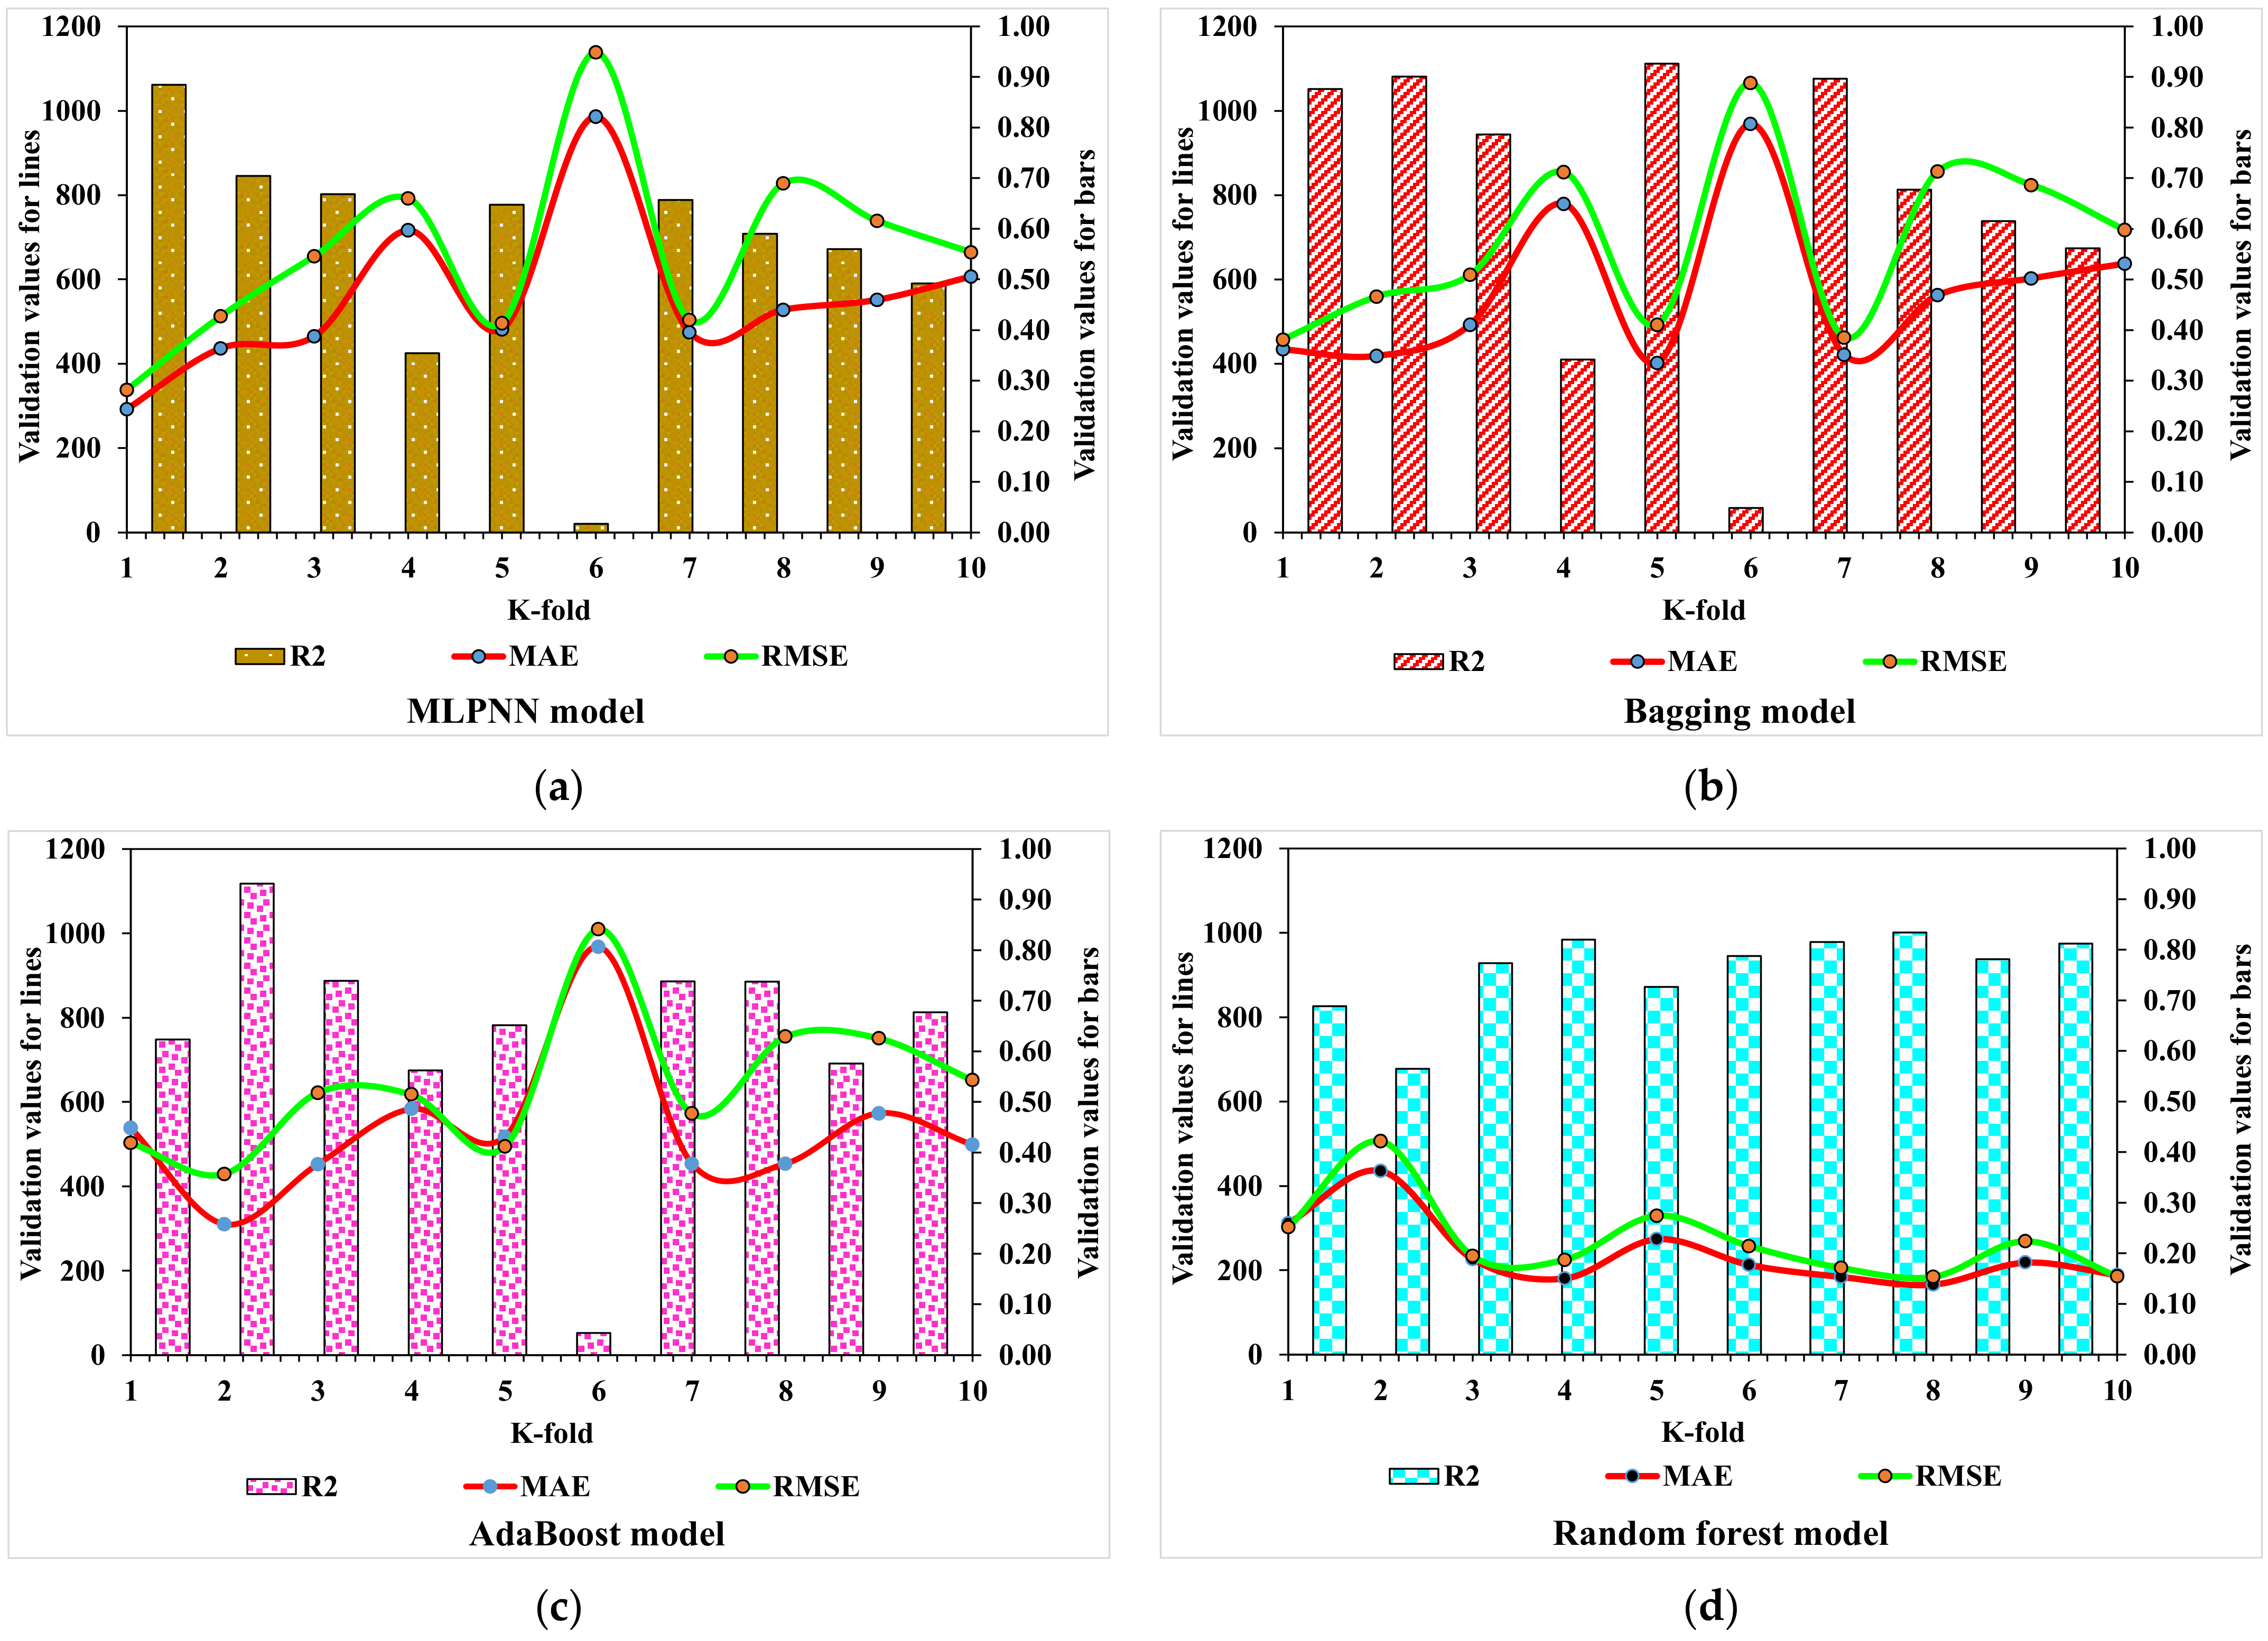
4.1. K-Fold Cross-Validation Checks
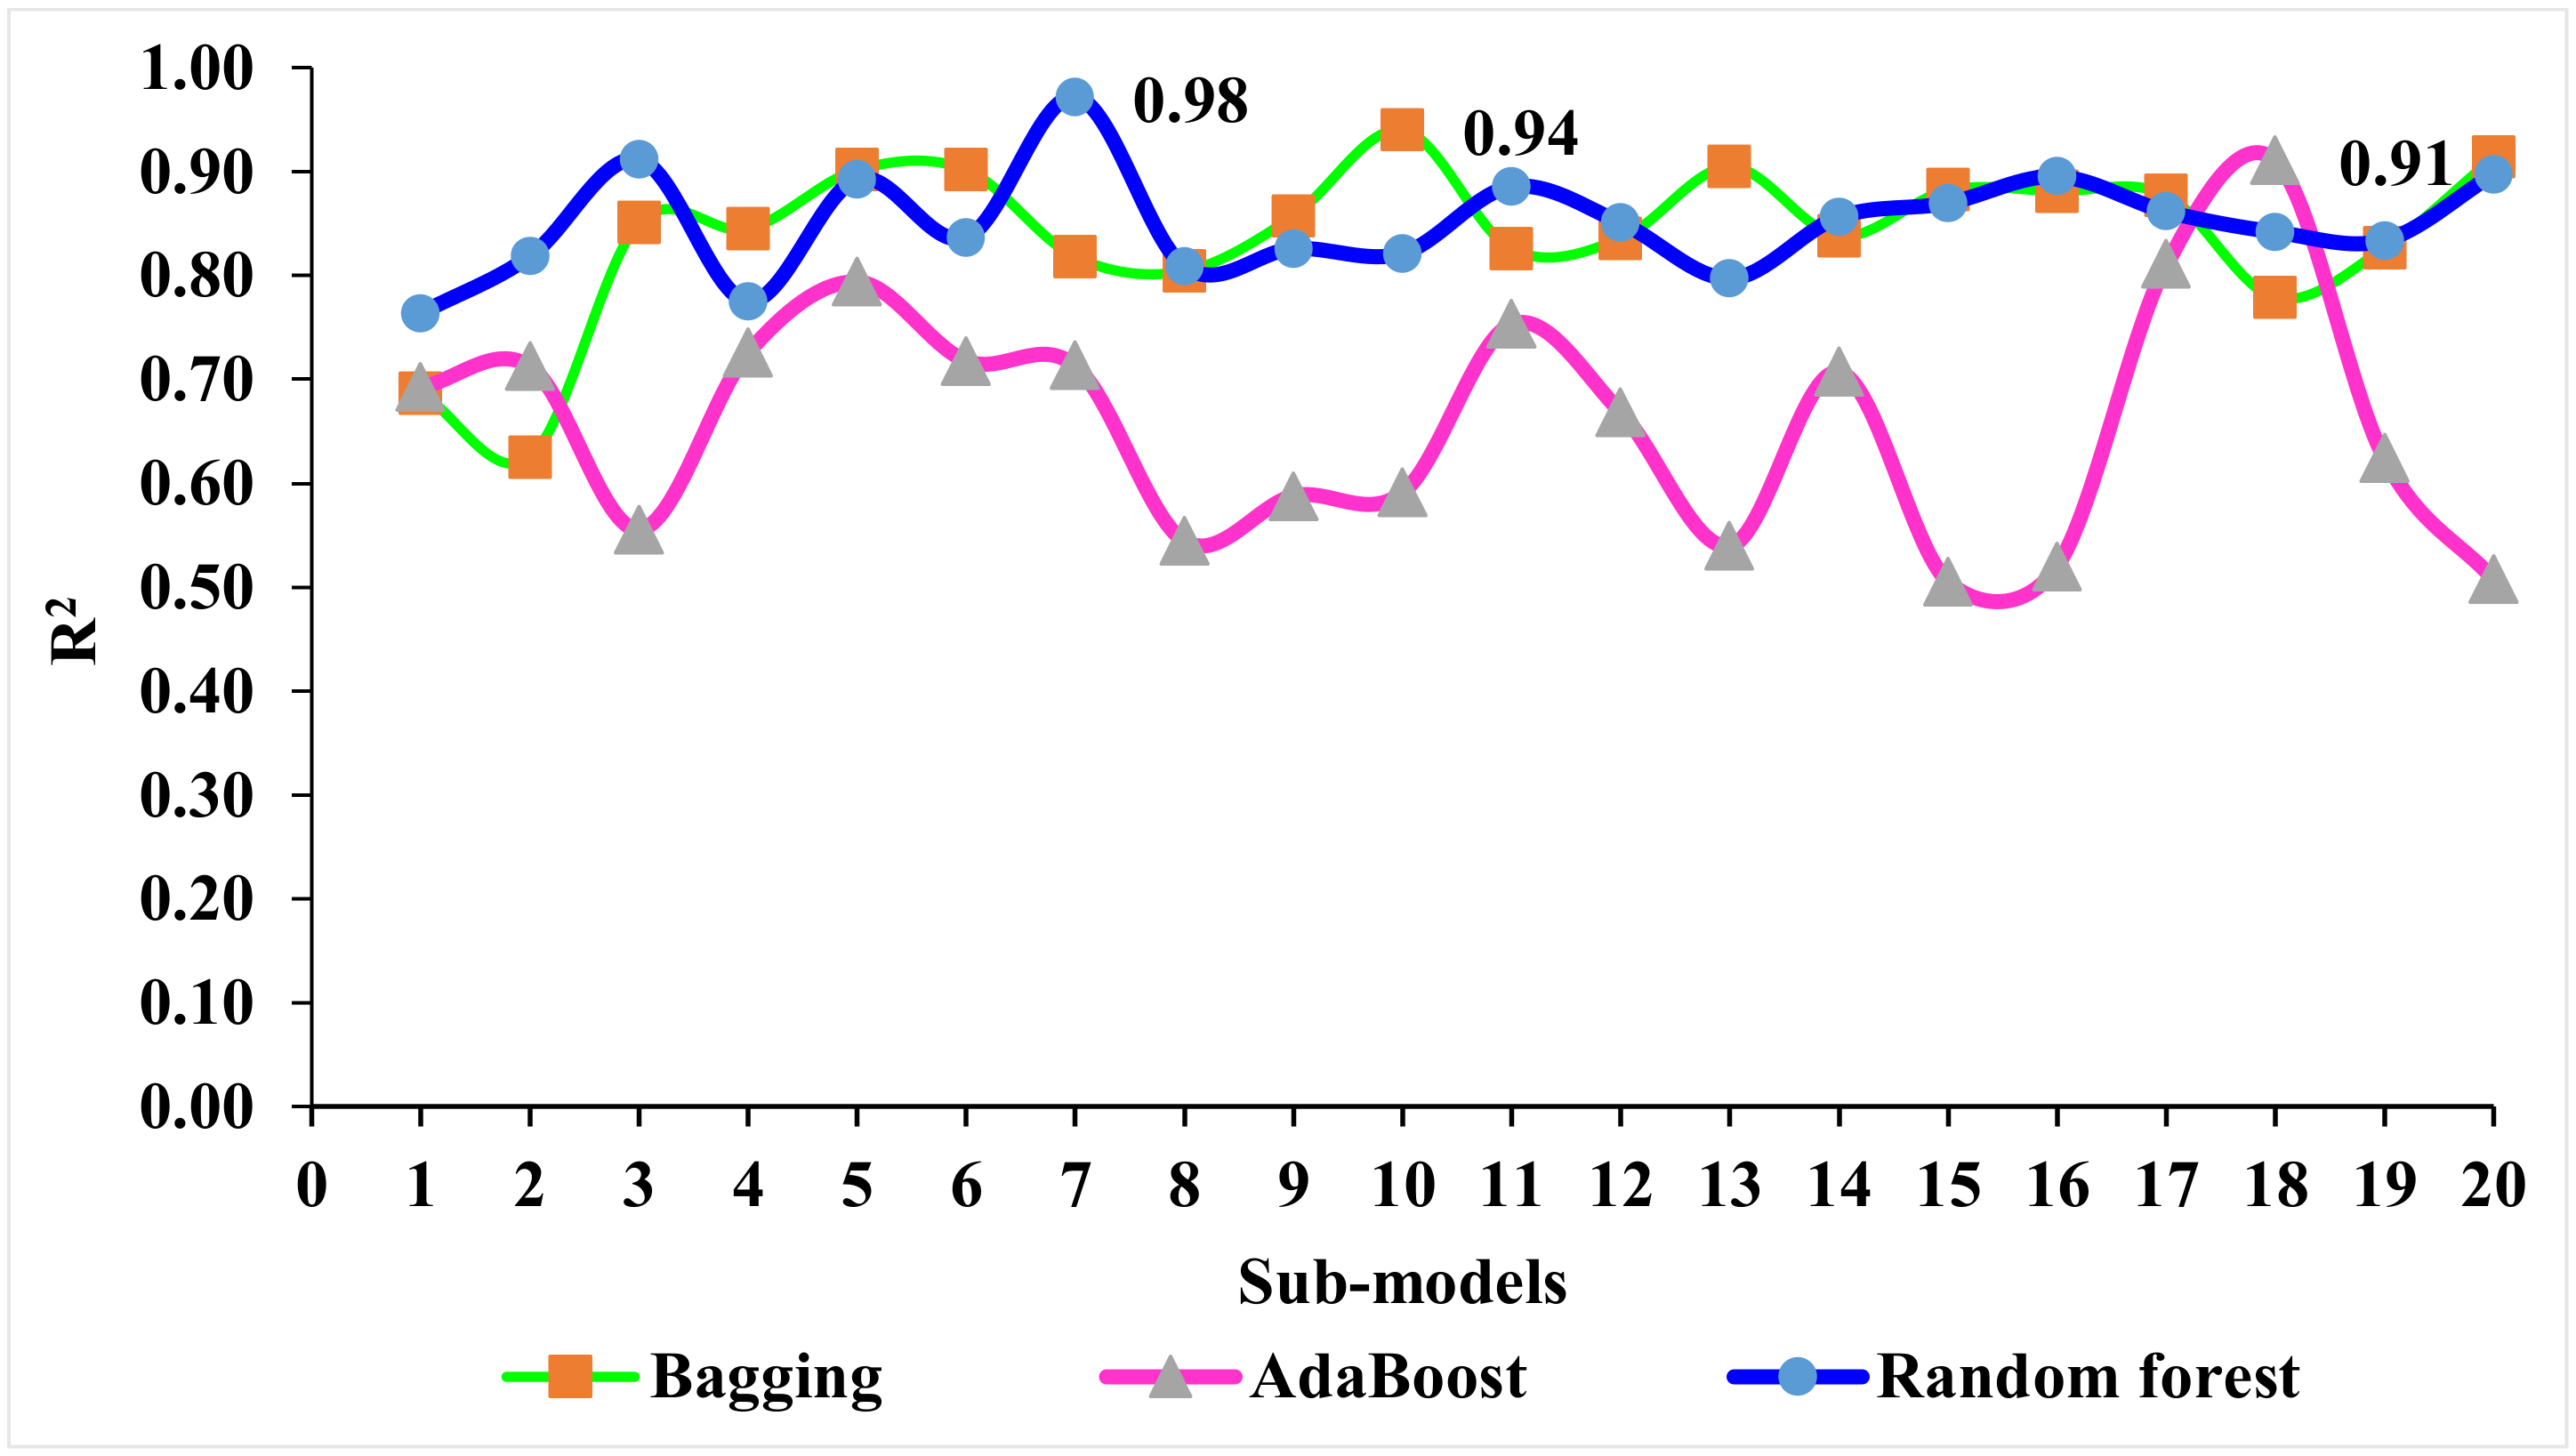
4.2. Comparison of Machine Learning Models
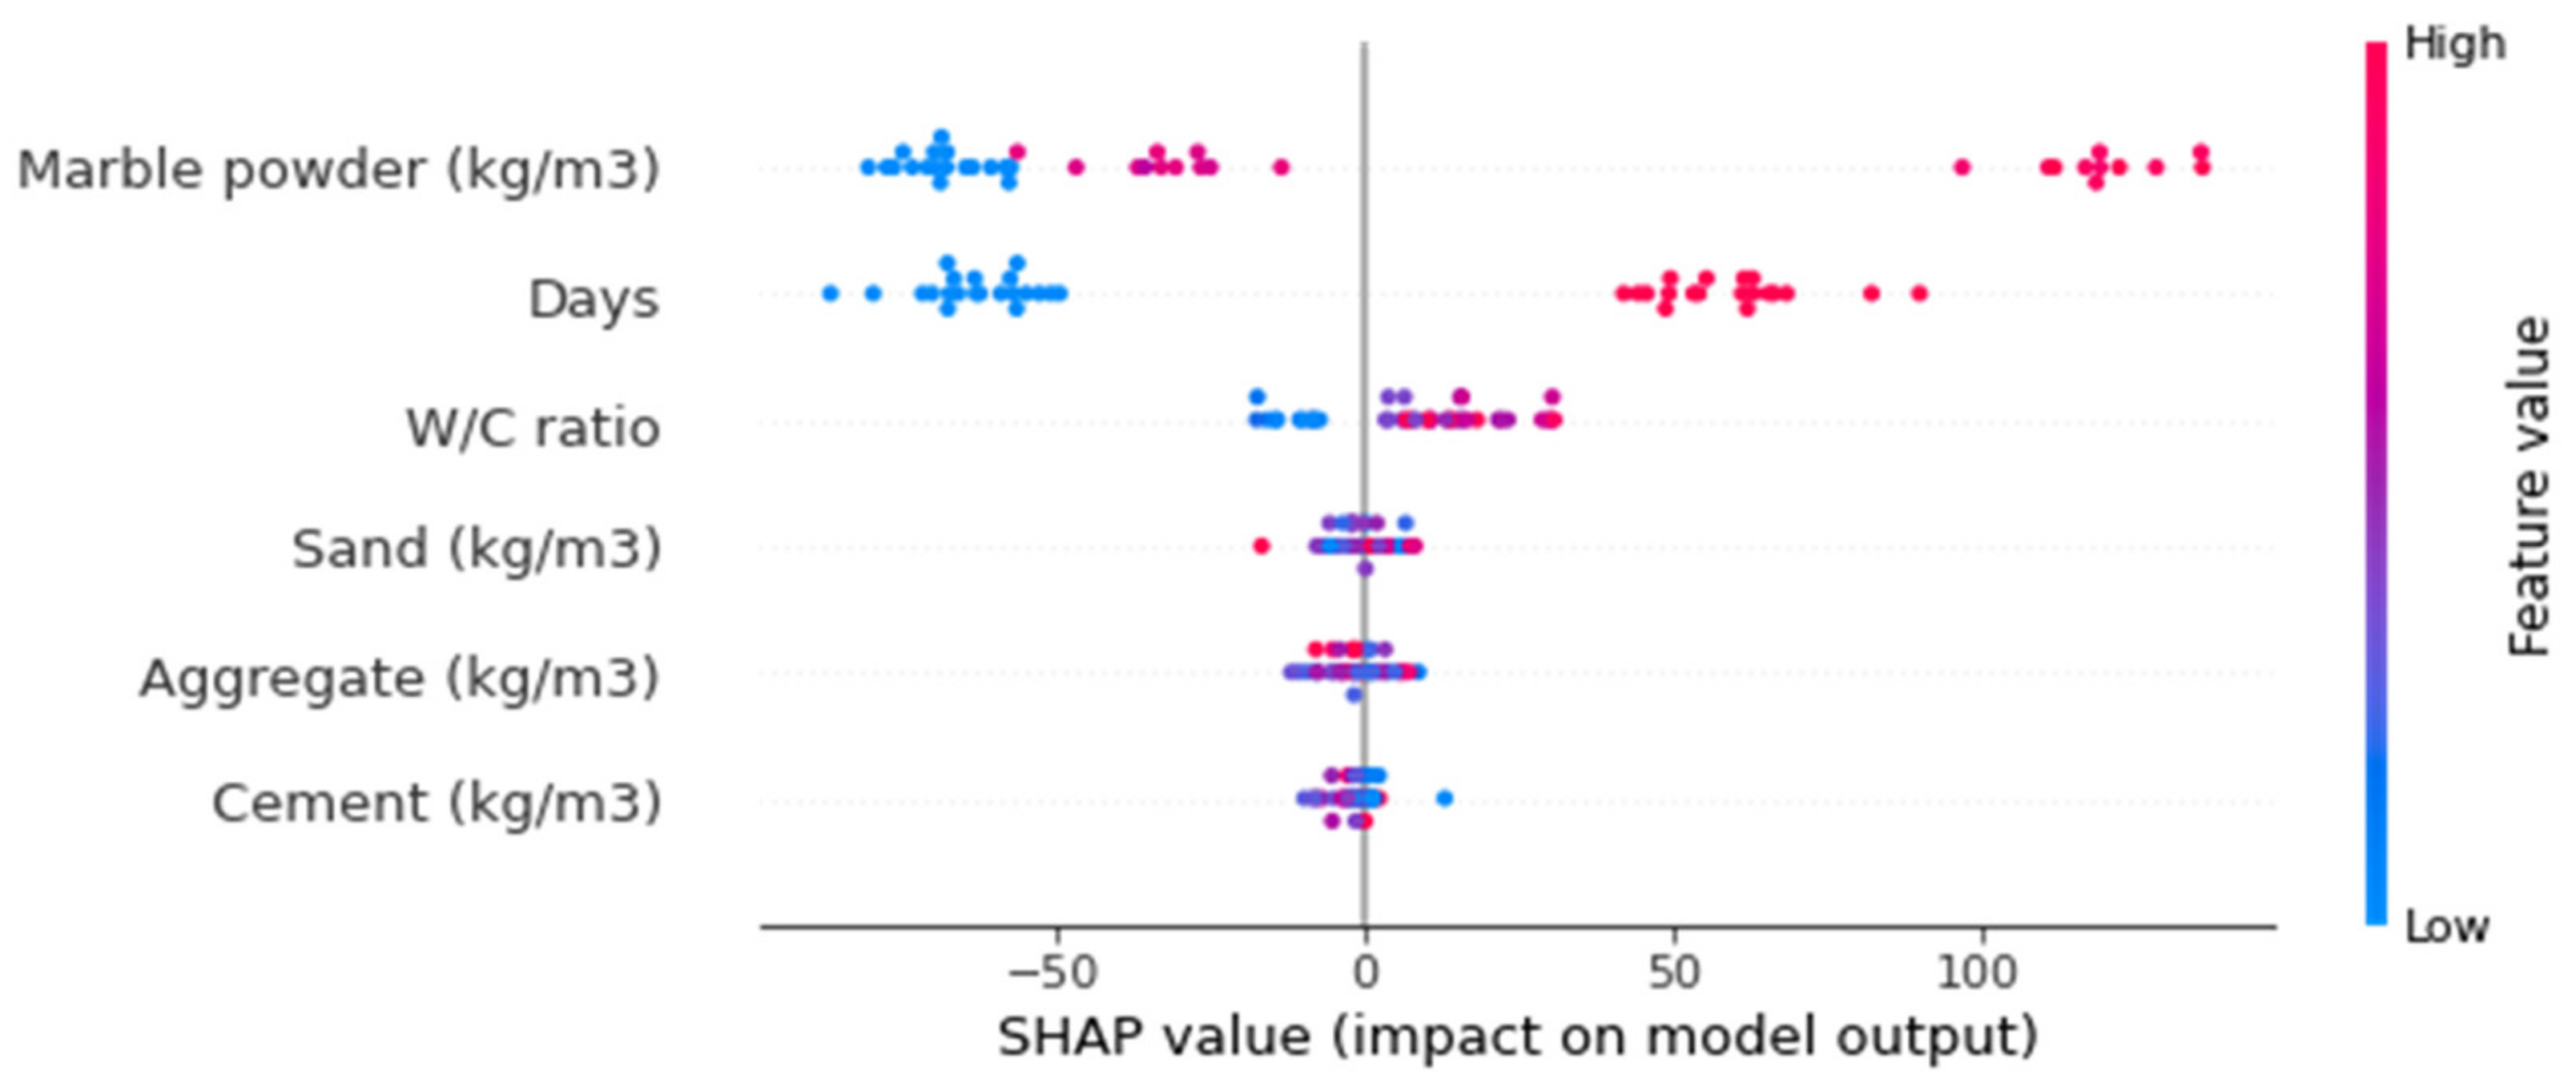
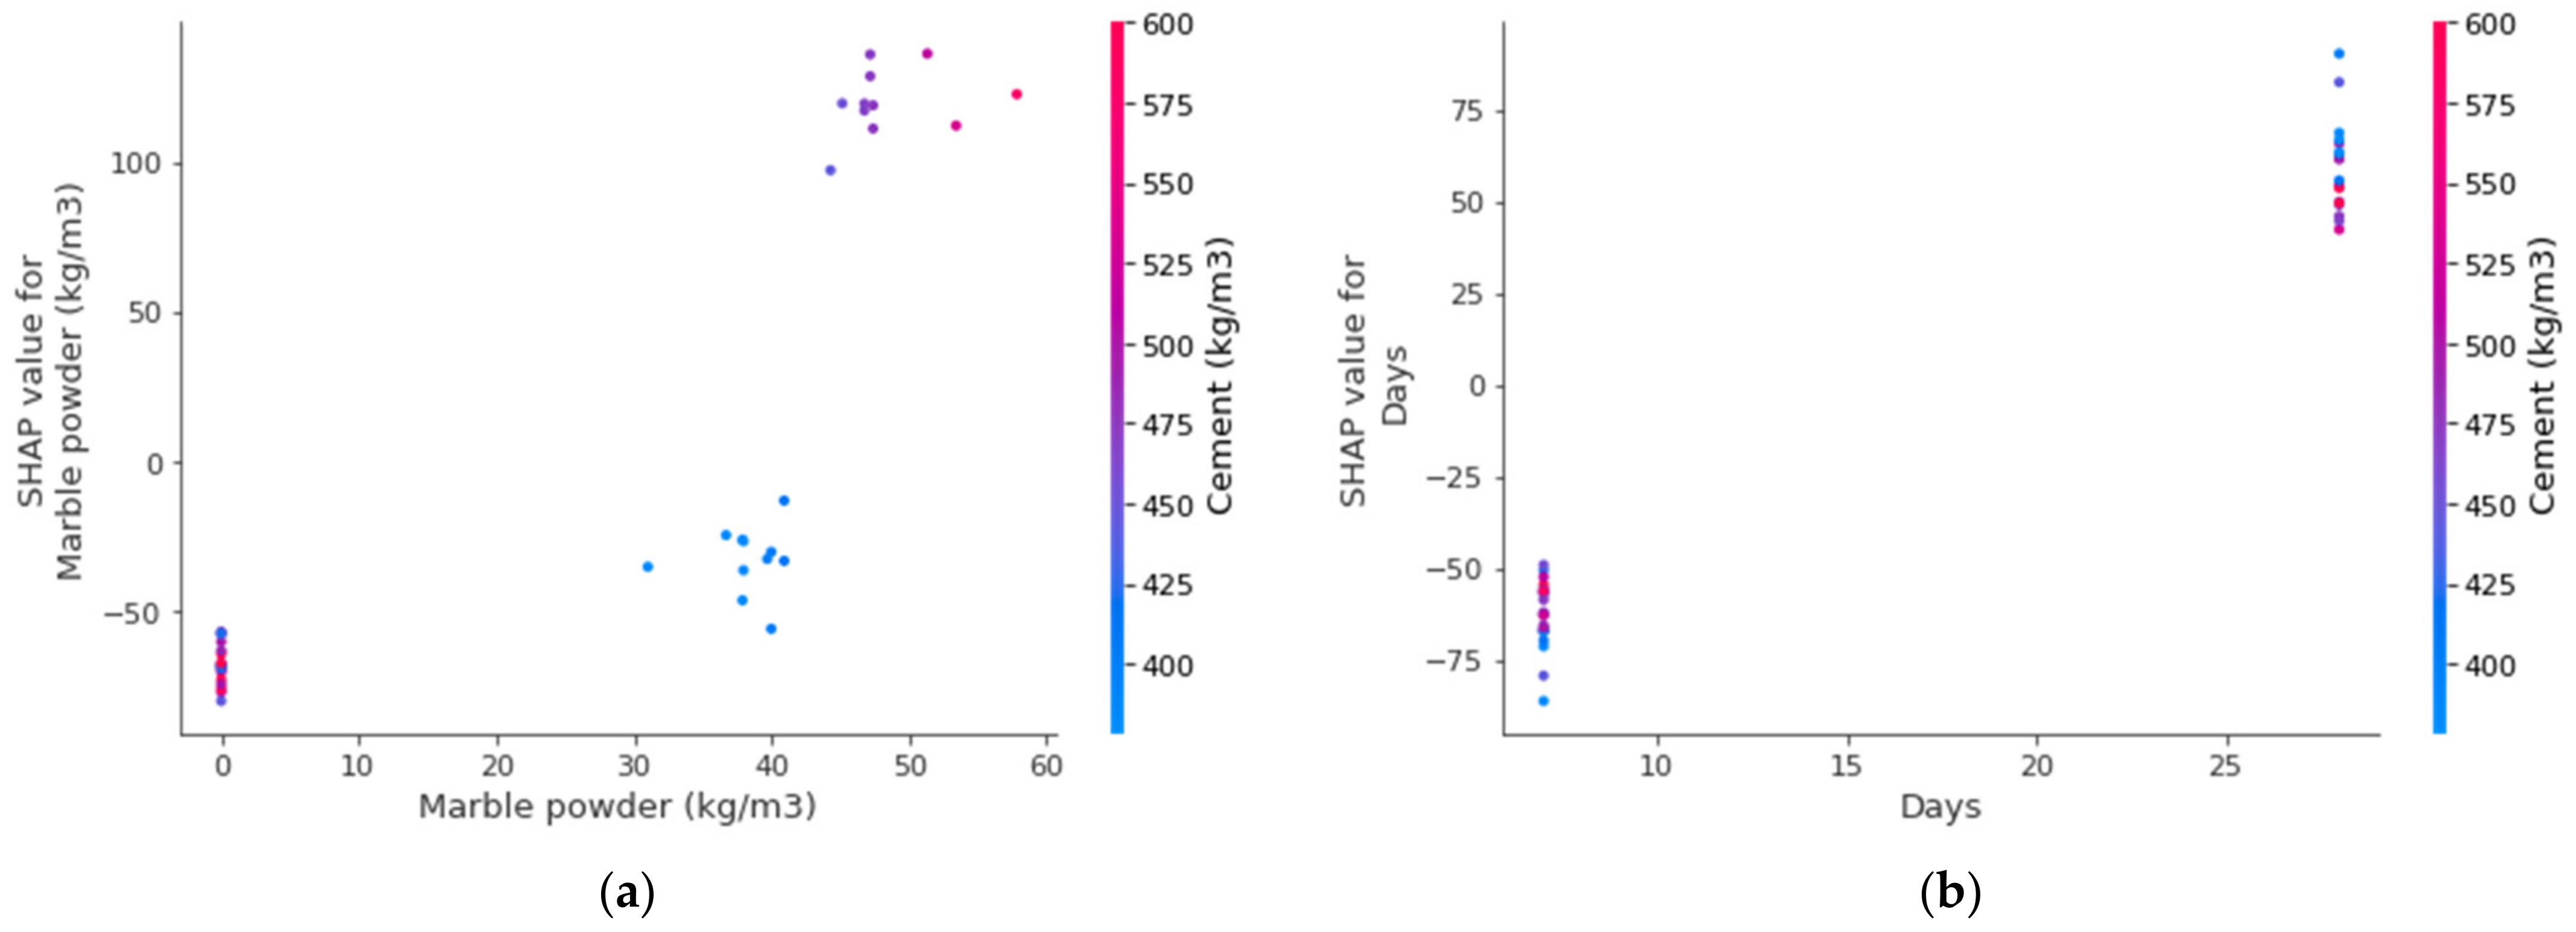
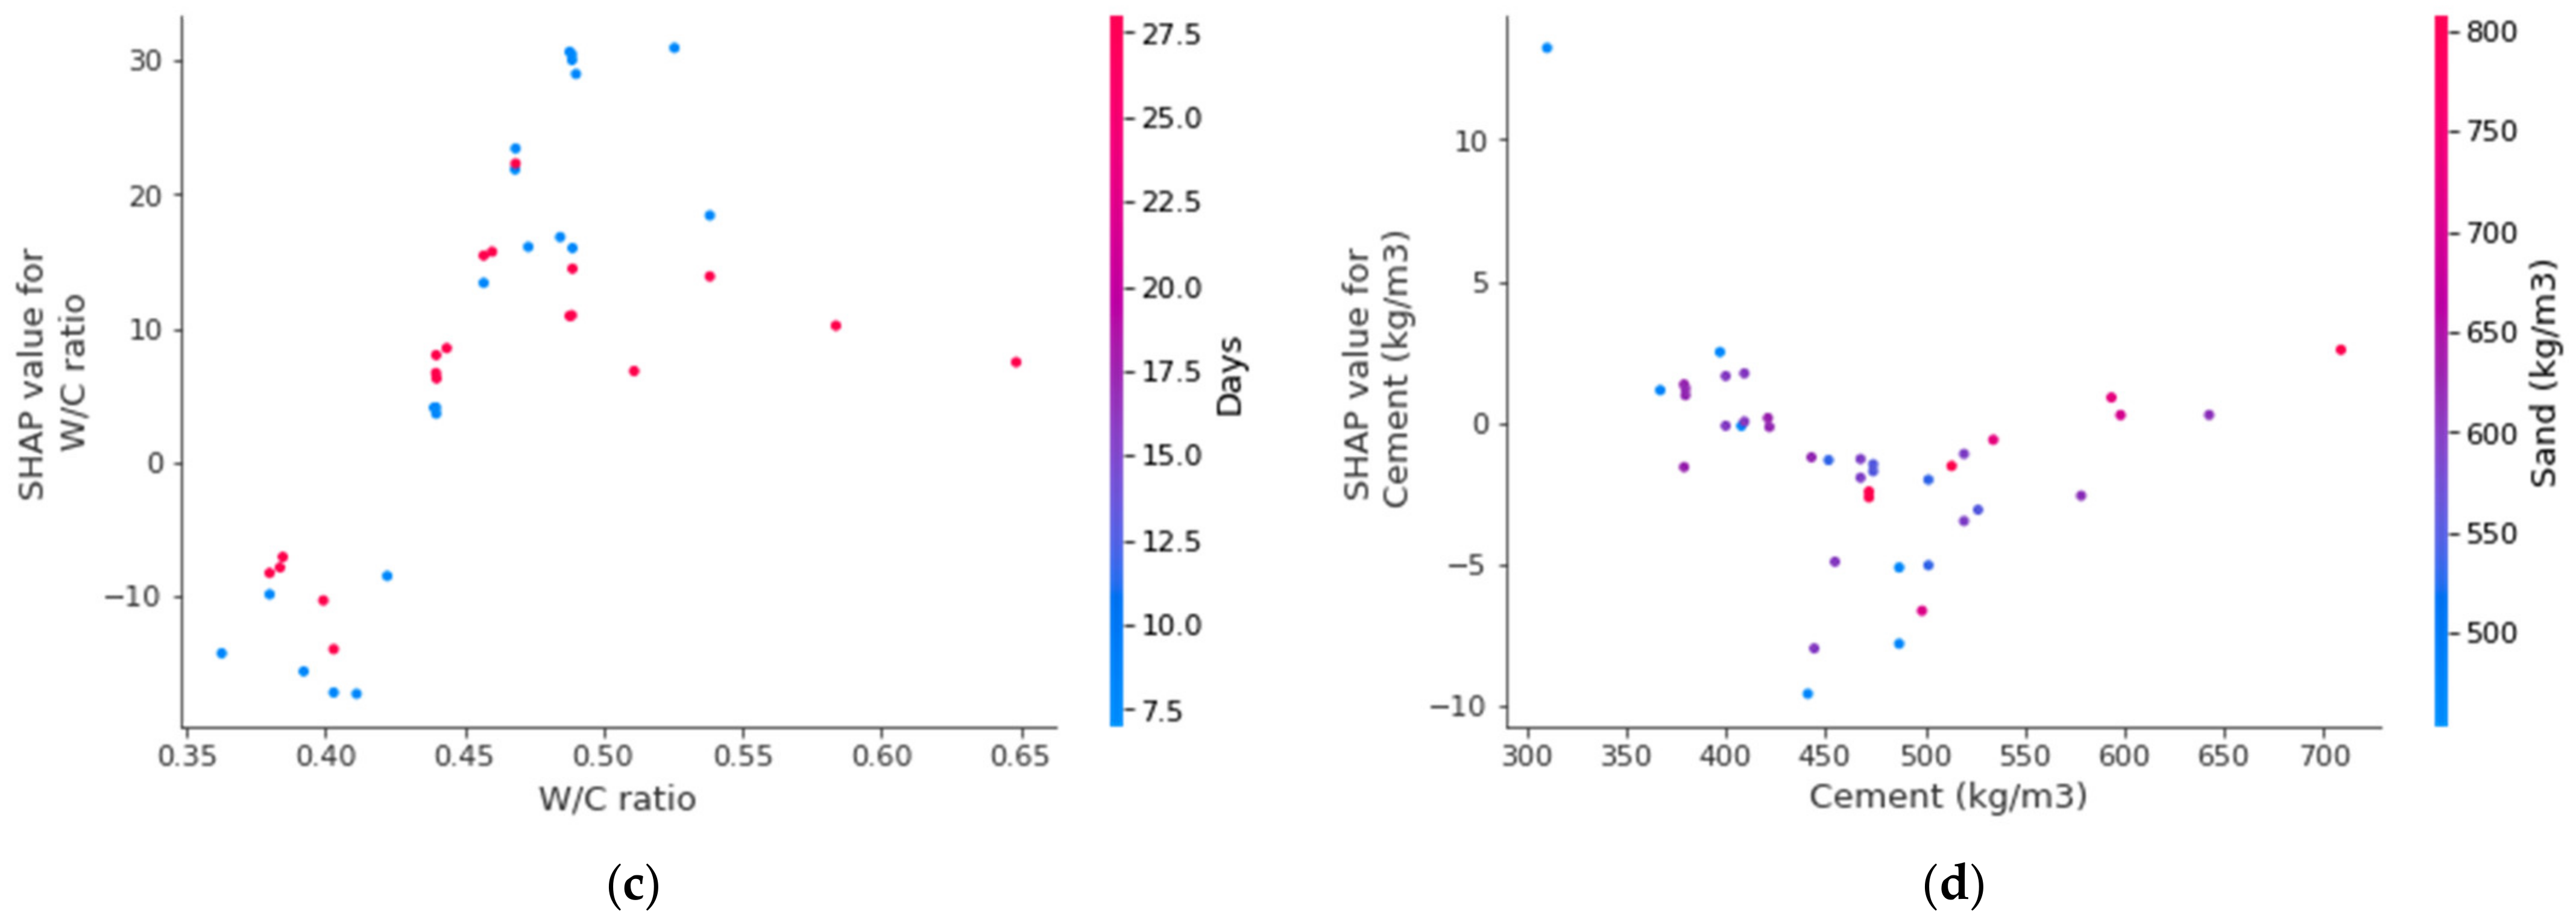
4.3. Effect of Raw Ingredients and Their Interactions Using SHAP Analysis
5. Conclusions
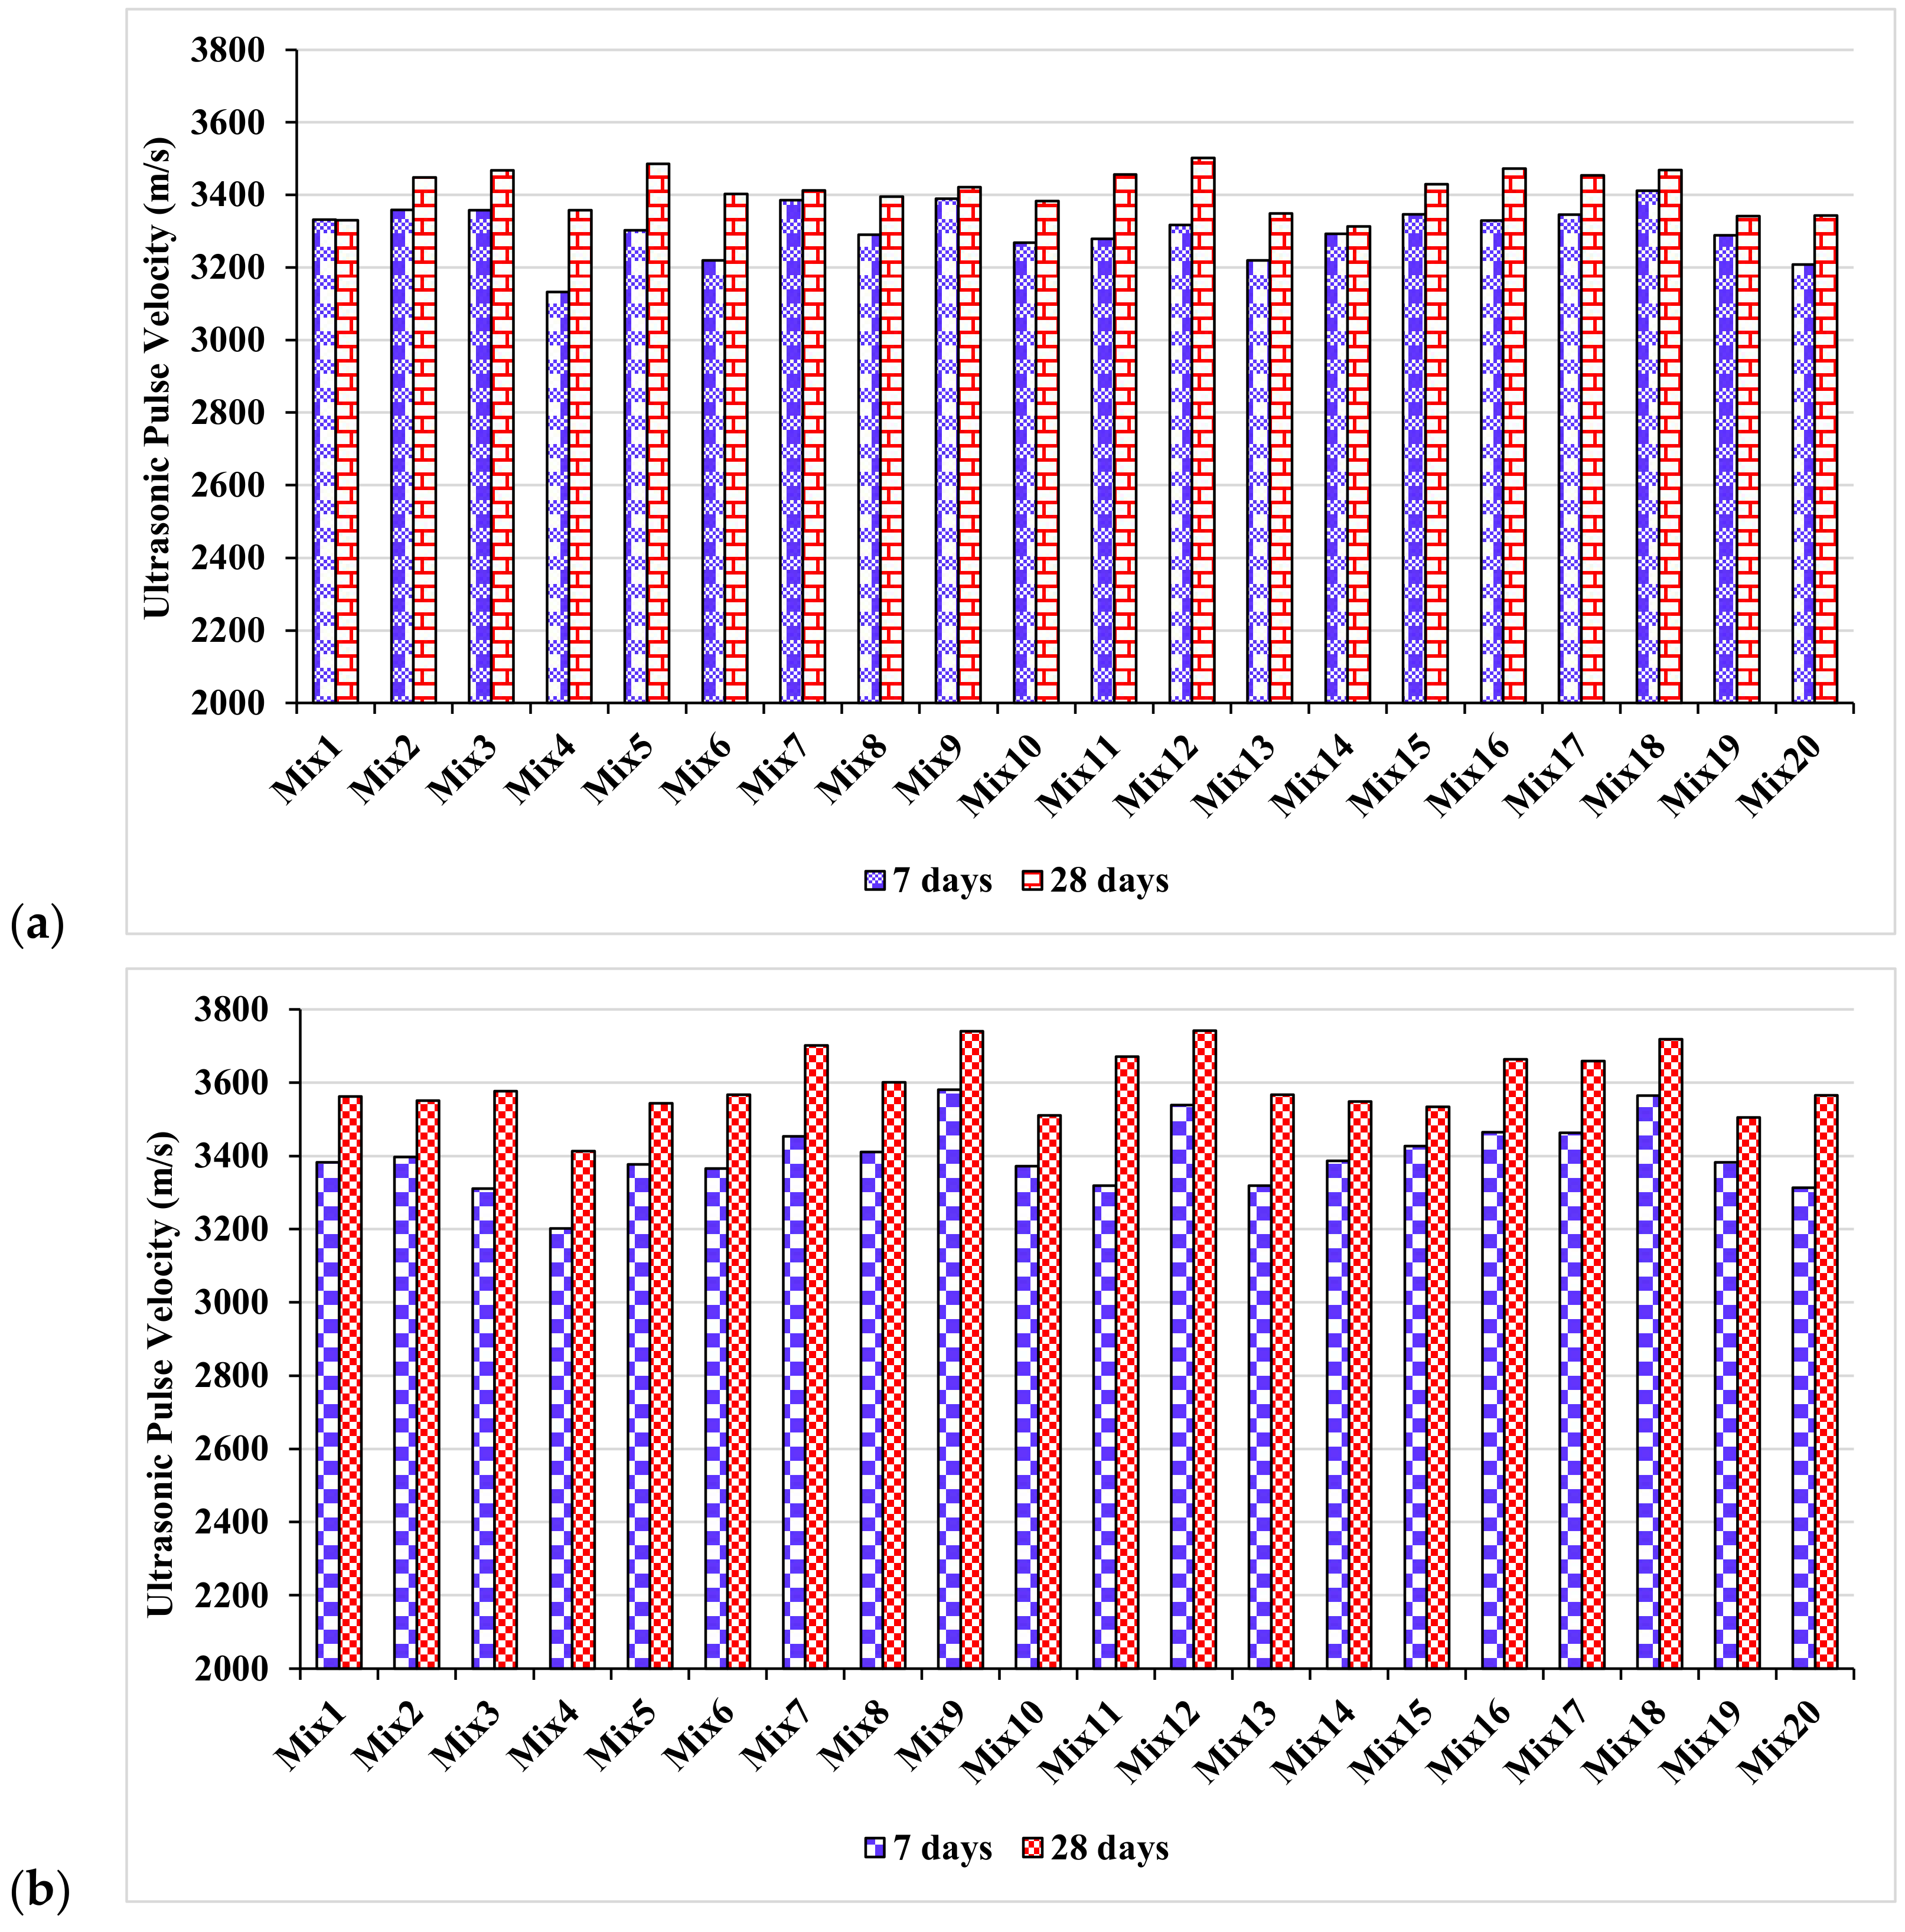
- An amount of 10% marble dust in concrete influenced the ultrasonic pulse velocity. The ultrasonic pulse velocity increased due to the reduced porosity of concrete with marble dust. In this case, waste marble dust concrete with 10% marble dust (as a replacement) showed improved UPV compared to the control mix with 0% marble dust.
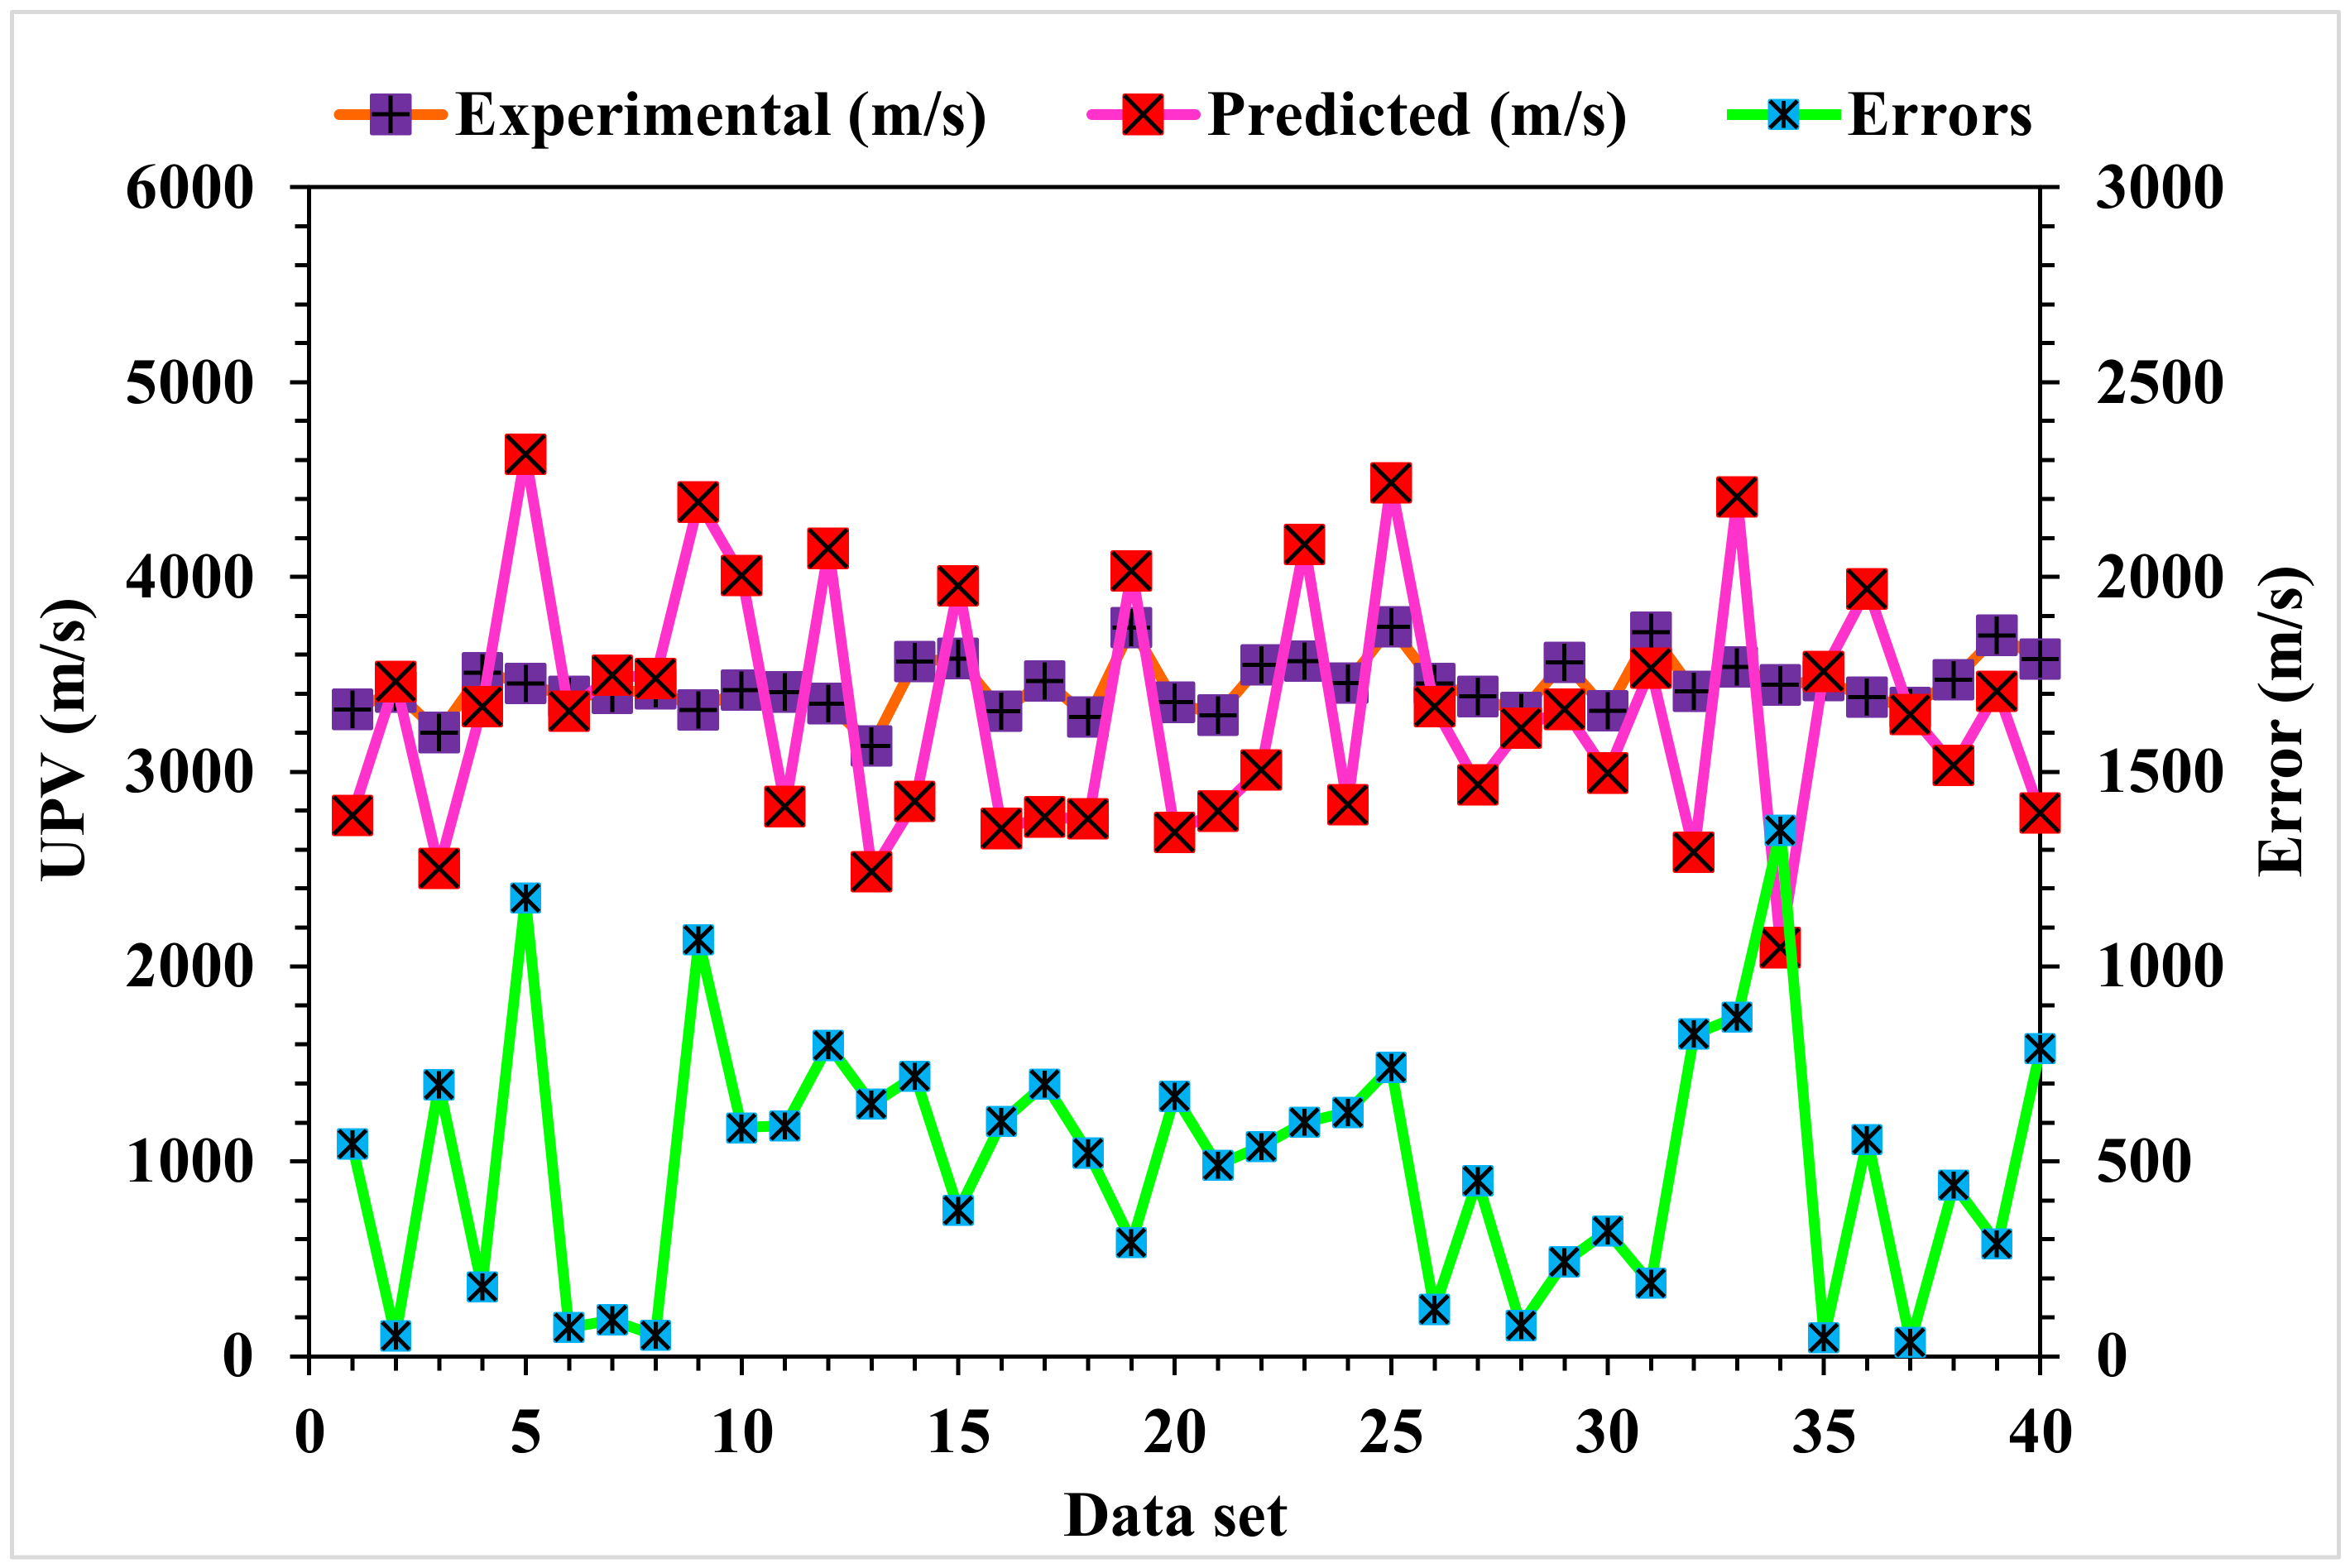
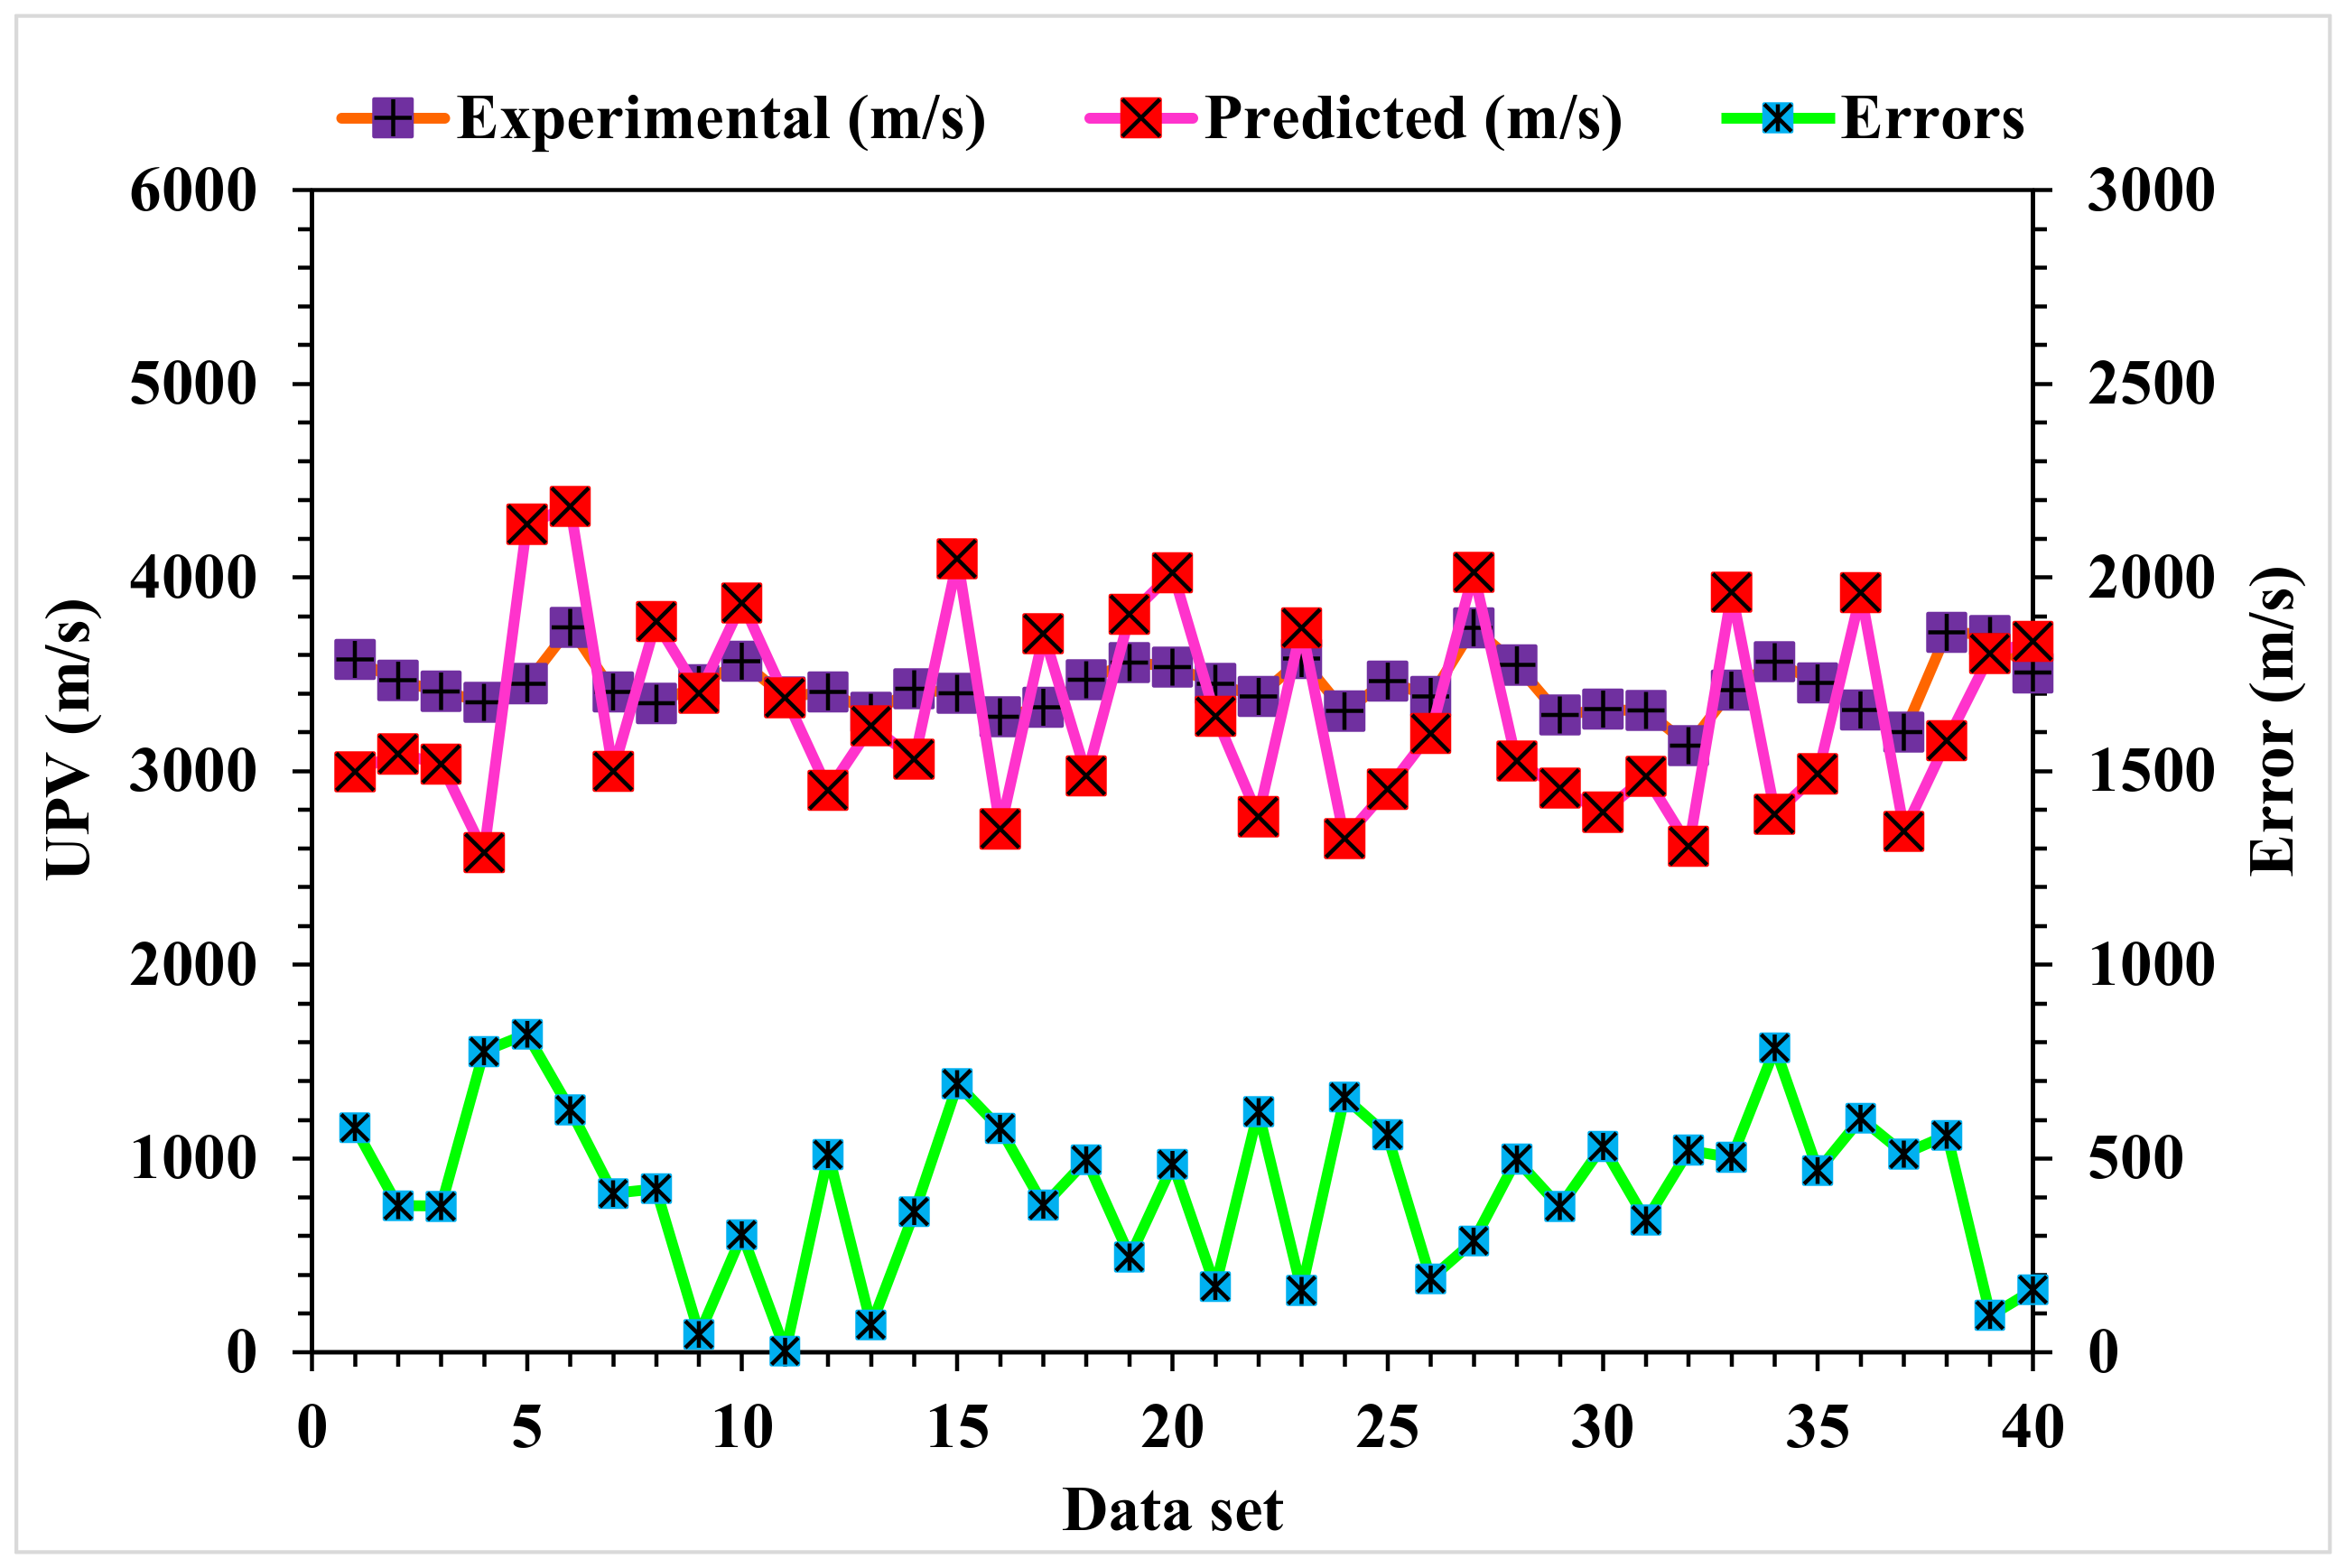
- Due to its greater R2 and lower error levels, the Random Forest model outperformed AdaBoost, Bagging, and MLPNN techniques in terms of prediction. The MLPNN, Bagging, AdaBoost, and Random Forest models had R2 values of 0.88, 0.94, 0.91, and 0.97, respectively. However, the ensemble model results for Random Forest, followed by Bagging and AdaBoost, were acceptable.
- A k-fold cross-validation technique and statistical analyses revealed adequate Random Forest, AdaBoost, and Bagging outcomes. These tests also showed that the Random Forest model outperformed the MLPNN, AdaBoost, and Bagging models.
- The study validated the application of ultrasonic pulse velocity for forecasting the ultrasonic pulse velocity of sustainable cementitious composite. Therefore, the presented techniques using artificial intelligence seemed reliable for predicting waste marble dust concrete properties.
- A higher SHAP-plot value depicted the positive relation of marble dust content with the UPV of marble dust concrete.
- The feature interaction plot represented that marble dust and curing days positively interacted with cement content and improved the UPV of concrete.
Author Contributions
Funding
Institutional Review Board Statement
Informed Consent Statement
Data Availability Statement
Acknowledgments
Conflicts of Interest
References
- Assi, L.N.; Carter, K.; Deaver, E.; Ziehl, P. Review of availability of source materials for geopolymer/sustainable concrete. J. Clean. Prod. 2020, 263, 121477. [Google Scholar] [CrossRef]
- Ahmad, W.; Ahmad, A.; Ostrowski, K.A.; Aslam, F.; Joyklad, P. A scientometric review of waste material utilization in concrete for sustainable construction. Case Stud. Constr. Mater. 2021, 15, e00683. [Google Scholar] [CrossRef]
- Khan, M.; Cao, M.; Ai, H.; Hussain, A. Basalt Fibers in Modified Whisker Reinforced Cementitious Composites. Period. Polytech. Civ. Eng. 2022, 66, 344–354. [Google Scholar] [CrossRef]
- De Azevedo, A.R.; Alexandre, J.; Xavier, G.D.C.; Pedroti, L.G. Recycling paper industry effluent sludge for use in mortars: A sustainability perspective. J. Clean. Prod. 2018, 192, 335–346. [Google Scholar] [CrossRef]
- Khan, M.; Ali, M. Improvement in concrete behavior with fly ash, silica-fume and coconut fibres. Constr. Build. Mater. 2019, 203, 174–187. [Google Scholar] [CrossRef]
- Cao, M.; Xie, C.; Li, L.; Khan, M. Effect of different PVA and steel fiber length and content on mechanical properties of CaCO3 whisker reinforced cementitious composites. Mater. Construcción 2019, 69, e200. [Google Scholar] [CrossRef] [Green Version]
- Cao, M.; Khan, M.; Ahmed, S. Effectiveness of Calcium Carbonate Whisker in Cementitious Composites. Period. Polytech. Civ. Eng. 2020, 64, 265. [Google Scholar] [CrossRef] [Green Version]
- Xie, C.; Cao, M.; Khan, M.; Yin, H.; Guan, J. Review on different testing methods and factors affecting fracture properties of fiber reinforced cementitious composites. Constr. Build. Mater. 2021, 273, 121766. [Google Scholar] [CrossRef]
- Tayeh, B.A. Effects of marble, timber, and glass powder as partial replacements for cement. J. Civ. Eng. Constr. 2018, 7, 63–71. [Google Scholar] [CrossRef] [Green Version]
- Marvila, M.T.; de Azevedo, A.R.; Alexandre, J.; Colorado, H.; Pereira Antunes, M.L.; Vieira, C.M. Circular economy in cementitious ceramics: Replacement of hydrated lime with a stoichiometric balanced combination of clay and marble waste. Int. J. Appl. Ceram. Technol. 2021, 18, 192–202. [Google Scholar] [CrossRef]
- Kore, S.D.; Vyas, A. Impact of marble waste as coarse aggregate on properties of lean cement concrete. Case Stud. Constr. Mater. 2016, 4, 85–92. [Google Scholar] [CrossRef] [Green Version]
- Marvila, M.T.; Alexandre, J.; de Azevedo, A.R.; Zanelato, E.B. Evaluation of the use of marble waste in hydrated lime cement mortar based. J. Mater. Cycles Waste Manag. 2019, 21, 1250–1261. [Google Scholar] [CrossRef]
- Rajamony Laila, L.; Gurupatham, B.G.A.; Roy, K.; Lim, J.B.P. Effect of super absorbent polymer on microstructural and mechanical properties of concrete blends using granite pulver. Struct. Concr. 2021, 22, E898–E915. [Google Scholar] [CrossRef]
- Rajamony Laila, L.; Gurupatham, B.G.A.; Roy, K.; Lim, J.B. Influence of super absorbent polymer on mechanical, rheological, durability, and microstructural properties of self-compacting concrete using non-biodegradable granite pulver. Struct. Concr. 2021, 22, E1093–E1116. [Google Scholar] [CrossRef]
- De Azevedo, A.R.G.; Alexandre, J.; Zanelato, E.B.; Marvila, M.T. Influence of incorporation of glass waste on the rheological properties of adhesive mortar. Constr. Build. Mater. 2017, 148, 359–368. [Google Scholar] [CrossRef]
- De Azevedo, A.R.; Teixeira Marvila, M.; Barbosa de Oliveira, L.; Macario Ferreira, W.; Colorado, H.; Rainho Teixeira, S.; Mauricio Fontes Vieira, C. Circular economy and durability in geopolymers ceramics pieces obtained from glass polishing waste. Int. J. Appl. Ceram. Technol. 2021, 18, 1891–1900. [Google Scholar] [CrossRef]
- De Azevedo, A.R.; Marvila, M.T.; Ali, M.; Khan, M.I.; Masood, F.; Vieira, C.M.F. Effect of the addition and processing of glass polishing waste on the durability of geopolymeric mortars. Case Stud. Constr. Mater. 2021, 15, e00662. [Google Scholar] [CrossRef]
- Marvila, M.T.; Azevedo, A.R.G.D.; Matos, P.R.d.; Monteiro, S.N.; Vieira, C.M.F. Rheological and the fresh state properties of alkali-activated mortars by blast furnace slag. Materials 2021, 14, 2069. [Google Scholar] [CrossRef]
- Ahmad, W.; Ahmad, A.; Ostrowski, K.A.; Aslam, F.; Joyklad, P.; Zajdel, P. Sustainable approach of using sugarcane bagasse ash in cement-based composites: A systematic review. Case Stud. Constr. Mater. 2021, 15, e00698. [Google Scholar] [CrossRef]
- Alaloul, W.S.; Musarat, M.A.; Tayeh, B.A.; Sivalingam, S.; Rosli, M.F.B.; Haruna, S.; Khan, M.I. Mechanical and deformation properties of rubberized engineered cementitious composite (ECC). Case Stud. Constr. Mater. 2020, 13, e00385. [Google Scholar] [CrossRef]
- Alyousef, R.; Ahmad, W.; Ahmad, A.; Aslam, F.; Joyklad, P.; Alabduljabbar, H. Potential use of recycled plastic and rubber aggregate in cementitious materials for sustainable construction: A review. J. Clean. Prod. 2021, 329, 129736. [Google Scholar] [CrossRef]
- Mustafa, M.A.-T.; Hanafi, I.; Mahmoud, R.; Tayeh, B.A. Effect of Partial Replacement of Sand by Plastic Waste on Impact Resistance of Concrete: Experiment And Simulation; Elsevier: Amsterdam, The Netherlands, 2019; pp. 519–526. [Google Scholar]
- Tawfik, T.A.; Metwally, K.A.; El-Beshlawy, S.A.; Al Saffar, D.M.; Tayeh, B.A.; Hassan, H.S. Exploitation of the nanowaste ceramic incorporated with nano silica to improve concrete properties. J. King Saud Univ.-Eng. Sci. 2021, 33, 581–588. [Google Scholar] [CrossRef]
- Amin, M.; Zeyad, A.M.; Tayeh, B.A.; Agwa, I.S. Engineering properties of self-cured normal and high strength concrete produced using polyethylene glycol and porous ceramic waste as coarse aggregate. Constr. Build. Mater. 2021, 299, 124243. [Google Scholar] [CrossRef]
- Khan, M.; Cao, M.; Xie, C.; Ali, M. Efficiency of basalt fiber length and content on mechanical and microstructural properties of hybrid fiber concrete. Fatigue Fract. Eng. Mater. Struct. 2021, 44, 2135–2152. [Google Scholar] [CrossRef]
- Khan, M.; Cao, M.; Xie, C.; Ali, M. Hybrid fiber concrete with different basalt fiber length and content. Struct. Concr. 2021, 23, 346–364. [Google Scholar] [CrossRef]
- Khan, M.; Cao, M.; Hussain, A.; Chu, S. Effect of silica-fume content on performance of CaCO3 whisker and basalt fiber at matrix interface in cement-based composites. Constr. Build. Mater. 2021, 300, 124046. [Google Scholar] [CrossRef]
- Arshad, S.; Sharif, M.B.; Irfan-ul-Hassan, M.; Khan, M.; Zhang, J.-L. Efficiency of supplementary cementitious materials and natural fiber on mechanical performance of concrete. Arab. J. Sci. Eng. 2020, 45, 8577–8589. [Google Scholar] [CrossRef]
- Arafa, M.; Tayeh, B.A.; Alqedra, M.; Shihada, S.; Hanoona, H. Investigating the effect of sulfate attack on compressive strength of recycled aggregate concrete. J. Eng. Res. Technol. 2017, 4, 1–7. [Google Scholar]
- Elsayed, M.; Tayeh, B.A.; Mohamed, M.; Elymany, M.; Mansi, A.H. Punching shear behaviour of RC flat slabs incorporating recycled coarse aggregates and crumb rubber. J. Build. Eng. 2021, 44, 103363. [Google Scholar] [CrossRef]
- Taher, S.M.S.; Saadullah, S.T.; Haido, J.H.; Tayeh, B.A. Behavior of geopolymer concrete deep beams containing waste aggregate of glass and limestone as a partial replacement of natural sand. Case Stud. Constr. Mater. 2021, 15, e00744. [Google Scholar] [CrossRef]
- Amin, M.; Zeyad, A.M.; Tayeh, B.A.; Agwa, I.S. Effects of nano cotton stalk and palm leaf ashes on ultrahigh-performance concrete properties incorporating recycled concrete aggregates. Constr. Build. Mater. 2021, 302, 124196. [Google Scholar] [CrossRef]
- Aliabdo, A.A.; Abd Elmoaty, M.; Auda, E.M. Re-use of waste marble dust in the production of cement and concrete. Constr. Build. Mater. 2014, 50, 28–41. [Google Scholar] [CrossRef]
- Keleştemur, O.; Arıcı, E.; Yıldız, S.; Gökçer, B. Performance evaluation of cement mortars containing marble dust and glass fiber exposed to high temperature by using Taguchi method. Constr. Build. Mater. 2014, 60, 17–24. [Google Scholar] [CrossRef] [Green Version]
- Rodrigues, R.D.; De Brito, J.; Sardinha, M. Mechanical properties of structural concrete containing very fine aggregates from marble cutting sludge. Constr. Build. Mater. 2015, 77, 349–356. [Google Scholar] [CrossRef]
- Aruntaş, H.Y.; Gürü, M.; Dayı, M.; Tekin, I. Utilization of waste marble dust as an additive in cement production. Mater. Des. 2010, 31, 4039–4042. [Google Scholar] [CrossRef]
- Arel, H.Ş. Recyclability of waste marble in concrete production. J. Clean. Prod. 2016, 131, 179–188. [Google Scholar] [CrossRef]
- Badurdeen, F.; Aydin, R.; Brown, A. A multiple lifecycle-based approach to sustainable product configuration design. J. Clean. Prod. 2018, 200, 756–769. [Google Scholar] [CrossRef]
- Uysal, M.; Yilmaz, K. Effect of mineral admixtures on properties of self-compacting concrete. Cem. Concr. Compos. 2011, 33, 771–776. [Google Scholar] [CrossRef]
- Belaidi, A.; Azzouz, L.; Kadri, E.; Kenai, S. Effect of natural pozzolana and marble powder on the properties of self-compacting concrete. Constr. Build. Mater. 2012, 31, 251–257. [Google Scholar] [CrossRef]
- Gesoğlu, M.; Güneyisi, E.; Kocabağ, M.E.; Bayram, V.; Mermerdaş, K. Fresh and hardened characteristics of self compacting concretes made with combined use of marble powder, limestone filler, and fly ash. Constr. Build. Mater. 2012, 37, 160–170. [Google Scholar] [CrossRef]
- Gencel, O.; Ozel, C.; Koksal, F.; Erdogmus, E.; Martínez-Barrera, G.; Brostow, W. Properties of concrete paving blocks made with waste marble. J. Clean. Prod. 2012, 21, 62–70. [Google Scholar] [CrossRef]
- Li, L.; Huang, Z.; Tan, Y.; Kwan, A.; Chen, H. Recycling of marble dust as paste replacement for improving strength, microstructure and eco-friendliness of mortar. J. Clean. Prod. 2019, 210, 55–65. [Google Scholar] [CrossRef]
- Li, L.; Huang, Z.; Tan, Y.; Kwan, A.; Liu, F. Use of marble dust as paste replacement for recycling waste and improving durability and dimensional stability of mortar. Constr. Build. Mater. 2018, 166, 423–432. [Google Scholar] [CrossRef]
- Feng, D.-C.; Liu, Z.-T.; Wang, X.-D.; Chen, Y.; Chang, J.-Q.; Wei, D.-F.; Jiang, Z.-M. Machine learning-based compressive strength prediction for concrete: An adaptive boosting approach. Constr. Build. Mater. 2020, 230, 117000. [Google Scholar] [CrossRef]
- Amlashi, A.T.; Abdollahi, S.M.; Goodarzi, S.; Ghanizadeh, A.R. Soft computing based formulations for slump, compressive strength, and elastic modulus of bentonite plastic concrete. J. Clean. Prod. 2019, 230, 1197–1216. [Google Scholar] [CrossRef]
- Farooq, F.; Ahmed, W.; Akbar, A.; Aslam, F.; Alyousef, R. Predictive modeling for sustainable high-performance concrete from industrial wastes: A comparison and optimization of models using ensemble learners. J. Clean. Prod. 2021, 292, 126032. [Google Scholar] [CrossRef]
- Chaabene, W.B.; Flah, M.; Nehdi, M.L. Machine learning prediction of mechanical properties of concrete: Critical review. Constr. Build. Mater. 2020, 260, 119889. [Google Scholar] [CrossRef]
- Tiwari, N.; Satyam, N. Coupling effect of pond ash and polypropylene fiber on strength and durability of expansive soil subgrades: An integrated experimental and machine learning approach. J. Rock Mech. Geotech. Eng. 2021, 13, 1101–1112. [Google Scholar] [CrossRef]
- Ahmad, W.; Ahmad, A.; Ostrowski, K.A.; Aslam, F.; Joyklad, P.; Zajdel, P. Application of Advanced Machine Learning Approaches to Predict the Compressive Strength of Concrete Containing Supplementary Cementitious Materials. Materials 2021, 14, 5762. [Google Scholar] [CrossRef]
- Song, H.; Ahmad, A.; Ostrowski, K.A.; Dudek, M. Analyzing the compressive strength of ceramic waste-based concrete using experiment and artificial neural network (ANN) approach. Materials 2021, 14, 4518. [Google Scholar] [CrossRef]
- Amini, K.; Jalalpour, M.; Delatte, N. Advancing concrete strength prediction using non-destructive testing: Development and verification of a generalizable model. Constr. Build. Mater. 2016, 102, 762–768. [Google Scholar] [CrossRef] [Green Version]
- Turgut, P. Evaluation of the ultrasonic pulse velocity data coming on the field. Ibis 2004, 6, 573–578. [Google Scholar]
- CEN EN 12504–4:2006; Testing Concrete–Part 4: Determination of Ultrasonic Pulse Velocity. British Standards Institution: London, UK, 2004.
- British Standards Institution. Testing Concrete in Structures: Part 2: Non-Destructive Testing-Determination of Rebound Number; British Standards Institution: London, UK, 2001. [Google Scholar]
- Lundberg, S.M.; Erion, G.; Chen, H.; DeGrave, A.; Prutkin, J.M.; Nair, B.; Katz, R.; Himmelfarb, J.; Bansal, N.; Lee, S.-I. From local explanations to global understanding with explainable AI for trees. Nat. Mach. Intell. 2020, 2, 56–67. [Google Scholar] [CrossRef] [PubMed]
- Ahmad, A.; Chaiyasarn, K.; Farooq, F.; Ahmad, W.; Suparp, S.; Aslam, F. Compressive strength prediction via gene expression programming (GEP) and artificial neural network (ANN) for concrete containing RCA. Buildings 2021, 11, 324. [Google Scholar] [CrossRef]
- Aslam, F.; Farooq, F.; Amin, M.N.; Khan, K.; Waheed, A.; Akbar, A.; Javed, M.F.; Alyousef, R.; Alabdulijabbar, H. Applications of gene expression programming for estimating compressive strength of high-strength concrete. Adv. Civ. Eng. 2020, 2020, 8850535. [Google Scholar] [CrossRef]
- Feng, D.-C.; Liu, Z.-T.; Wang, X.-D.; Jiang, Z.-M.; Liang, S.-X. Failure mode classification and bearing capacity prediction for reinforced concrete columns based on ensemble machine learning algorithm. Adv. Eng. Inform. 2020, 45, 101126. [Google Scholar] [CrossRef]
- Farooq, F.; Nasir Amin, M.; Khan, K.; Rehan Sadiq, M.; Faisal Javed, M.; Aslam, F.; Alyousef, R. A comparative study of random forest and genetic engineering programming for the prediction of compressive strength of high strength concrete (HSC). Appl. Sci. 2020, 10, 7330. [Google Scholar] [CrossRef]
- Ahmad, A.; Ahmad, W.; Chaiyasarn, K.; Ostrowski, K.A.; Aslam, F.; Zajdel, P.; Joyklad, P. Prediction of geopolymer concrete compressive strength using novel machine learning algorithms. Polymers 2021, 13, 3389. [Google Scholar] [CrossRef]
- Lundberg, S.M.; Erion, G.; Chen, H.; DeGrave, A.; Prutkin, J.M.; Nair, B.; Katz, R.; Himmelfarb, J.; Bansal, N.; Lee, S.-I. Explainable AI for trees: From local explanations to global understanding. arXiv 2019, arXiv:1905.04610. [Google Scholar] [CrossRef]


| Components | Marble Dust | Cement |
|---|---|---|
| SiO2 | 14.08 | 18.93 |
| Al2O3 | 2.69 | 9.89 |
| MgO | 2.77 | 1.67 |
| CaO | 42.14 | 59.6 |
| K2O | 0.63 | 1.13 |
| Na2O | 0.61 | 0.90 |
| Fe2O3 | 1.94 | 3.59 |
| Parameters | Maximum Size | Fineness Modulus | Moisture Content | Density |
|---|---|---|---|---|
| mm | - | % | kg/m3 | |
| Cement | - | - | - | 1432 |
| Marble dust | - | 1.86 | - | 1118 |
| Sand | - | 2.72 | 1.57 | 1790 |
| Coarse aggregate | 25.4 | - | 1.49 | 1591 |
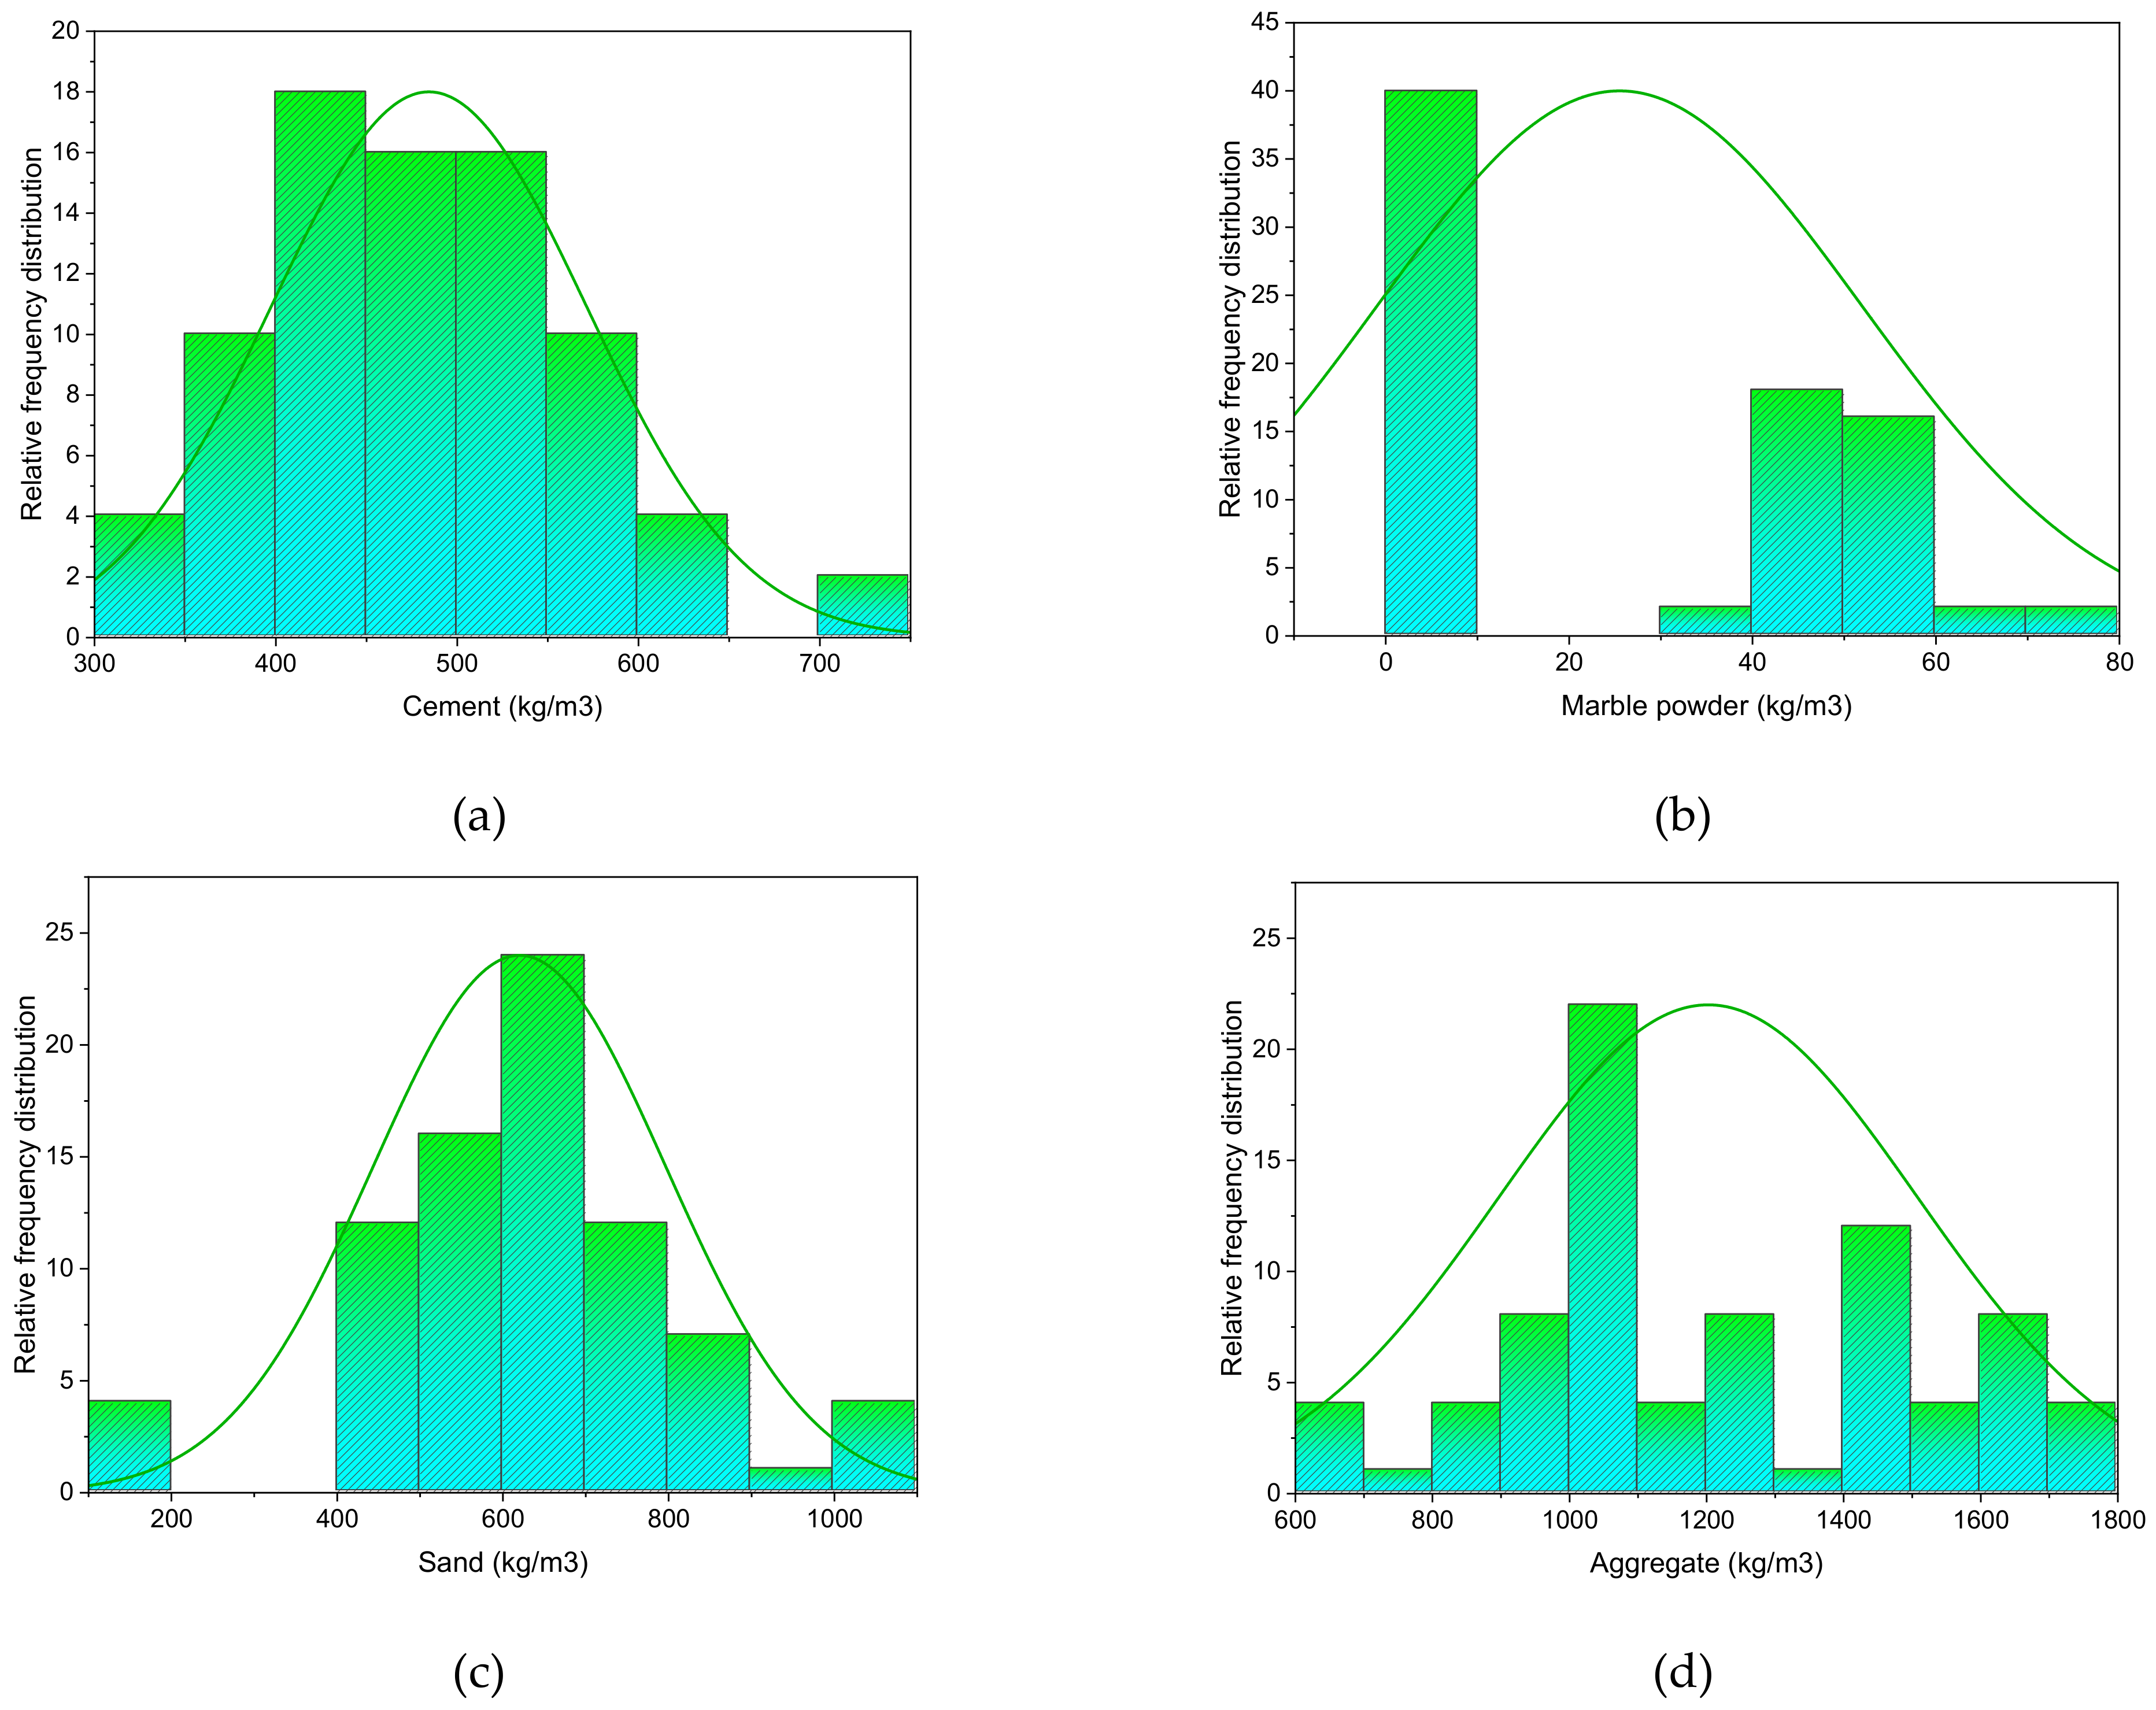
| Input Data | |||||||
|---|---|---|---|---|---|---|---|
| Cement (kg/m3) | Marble Dust (kg/m3) | Sand (kg/m3) | Aggregate (kg/m3) | Water (kg/m3) | Days | UPV (m/s) | |
| Standard Error | 9.73 | 2.95 | 19.55 | 33.62 | 4.55 | 1.18 | 42.34 |
| Median | 472.84 | 17.24 | 615.26 | 1116.36 | 220.83 | 17.50 | 3334 |
| Minimum | 310.15 | 0.00 | 129.47 | 659.33 | 130.97 | 7.00 | 3110 |
| Maximum | 708.80 | 70.89 | 1020.65 | 1750.97 | 303.96 | 28.00 | 4502 |
| Mode | 486.95 | 0.00 | 620.06 | 1201.29 | 185.03 | 7.00 | 3357 |
| Mean | 484.40 | 25.49 | 618.70 | 1202.28 | 217.13 | 17.50 | 3518 |
| Standard Deviation | 86.98 | 26.39 | 174.90 | 300.70 | 40.67 | 10.57 | 378.68 |
| Range | 398.65 | 70.89 | 891.17 | 1091.64 | 172.99 | 21.00 | 1392 |
| Models | MAE (m/s) | RMSE (m/s) | R2 |
|---|---|---|---|
| MLPNN | 564.4 | 676.7 | 0.88 |
| Bagging | 500.8 | 594.7 | 0.94 |
| AdaBoost | 531.4 | 637.6 | 0.91 |
| Random Forest | 429.3 | 475.7 | 0.98 |
Publisher’s Note: MDPI stays neutral with regard to jurisdictional claims in published maps and institutional affiliations. |
© 2022 by the authors. Licensee MDPI, Basel, Switzerland. This article is an open access article distributed under the terms and conditions of the Creative Commons Attribution (CC BY) license (https://creativecommons.org/licenses/by/4.0/).
Share and Cite
Yang, D.; Zhao, J.; Suhail, S.A.; Ahmad, W.; Kamiński, P.; Dyczko, A.; Salmi, A.; Mohamed, A. Investigating the Ultrasonic Pulse Velocity of Concrete Containing Waste Marble Dust and Its Estimation Using Artificial Intelligence. Materials 2022, 15, 4311. https://doi.org/10.3390/ma15124311
Yang D, Zhao J, Suhail SA, Ahmad W, Kamiński P, Dyczko A, Salmi A, Mohamed A. Investigating the Ultrasonic Pulse Velocity of Concrete Containing Waste Marble Dust and Its Estimation Using Artificial Intelligence. Materials. 2022; 15(12):4311. https://doi.org/10.3390/ma15124311
Chicago/Turabian StyleYang, Dawei, Jiahui Zhao, Salman Ali Suhail, Waqas Ahmad, Paweł Kamiński, Artur Dyczko, Abdelatif Salmi, and Abdullah Mohamed. 2022. "Investigating the Ultrasonic Pulse Velocity of Concrete Containing Waste Marble Dust and Its Estimation Using Artificial Intelligence" Materials 15, no. 12: 4311. https://doi.org/10.3390/ma15124311
APA StyleYang, D., Zhao, J., Suhail, S. A., Ahmad, W., Kamiński, P., Dyczko, A., Salmi, A., & Mohamed, A. (2022). Investigating the Ultrasonic Pulse Velocity of Concrete Containing Waste Marble Dust and Its Estimation Using Artificial Intelligence. Materials, 15(12), 4311. https://doi.org/10.3390/ma15124311