
Exploring the Use of Waste Marble Powder in Concrete and Predicting Its Strength with Different Advanced Algorithms

 , , ,
, , ,  and
and
Abstract
:1. Introduction
2. Research Significance
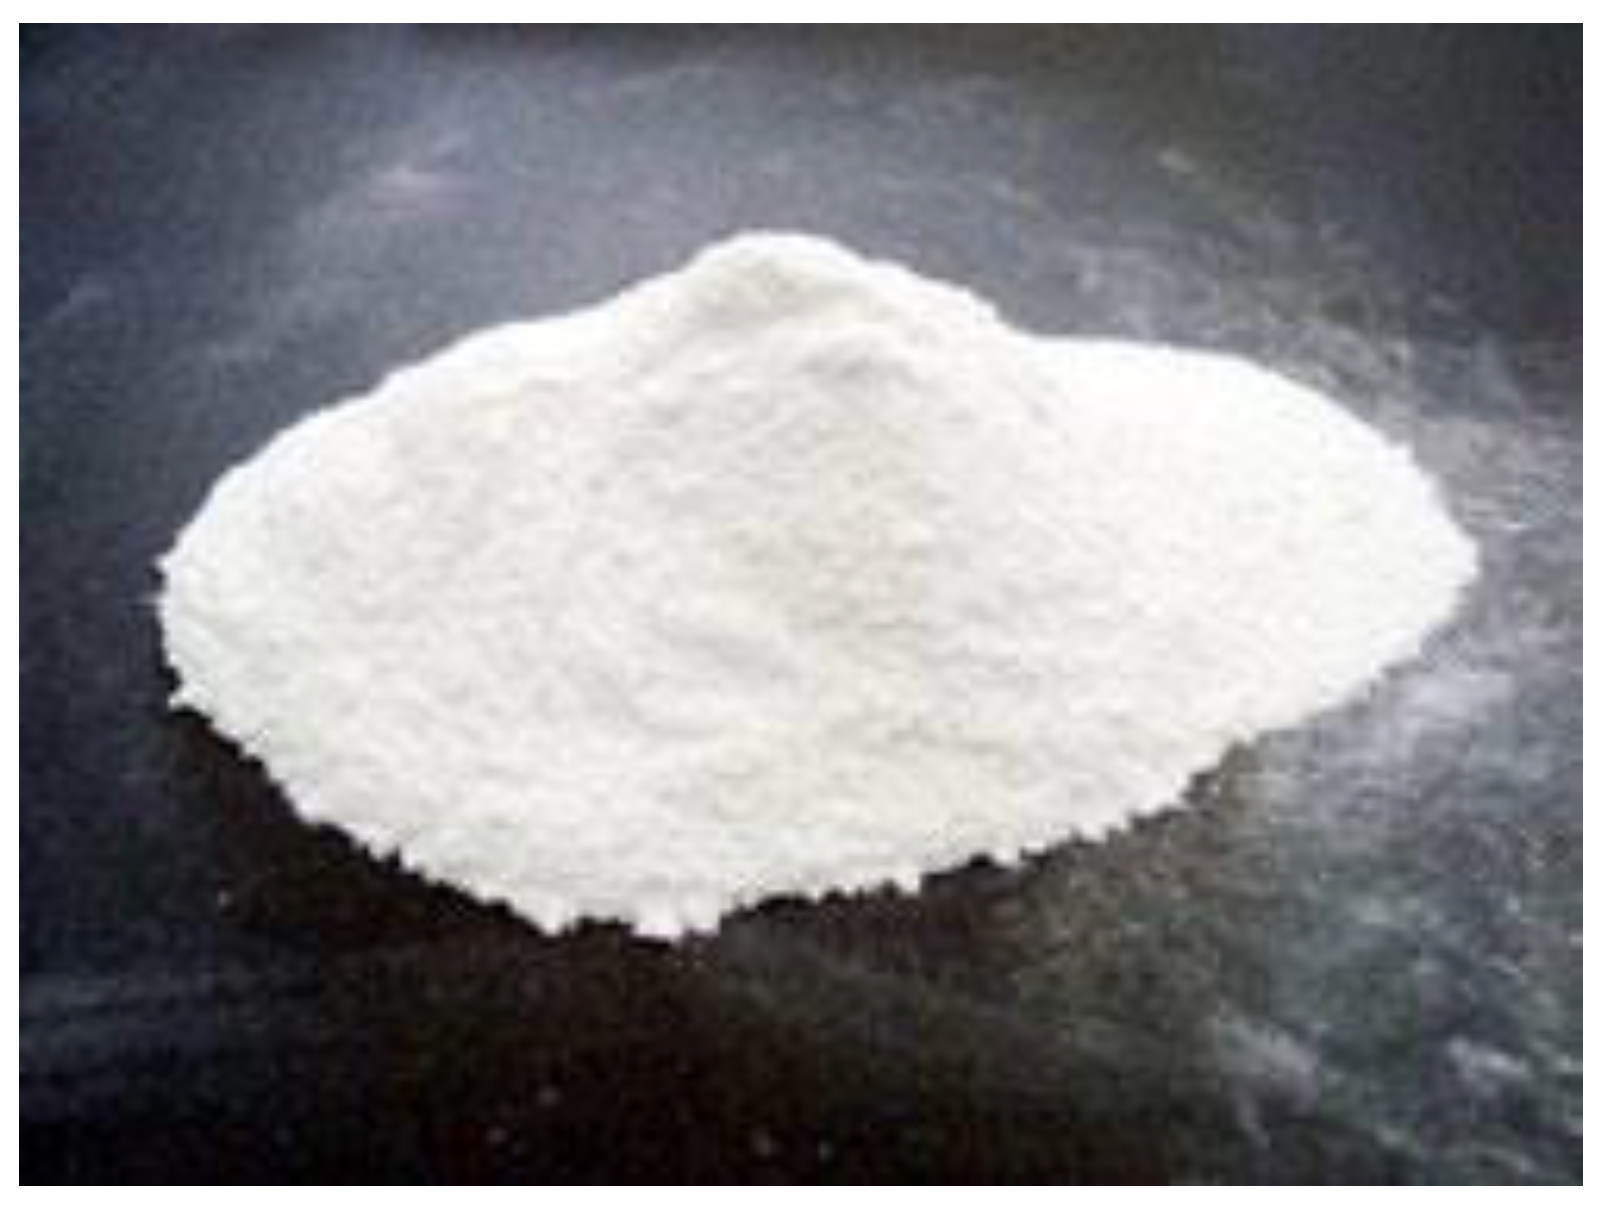
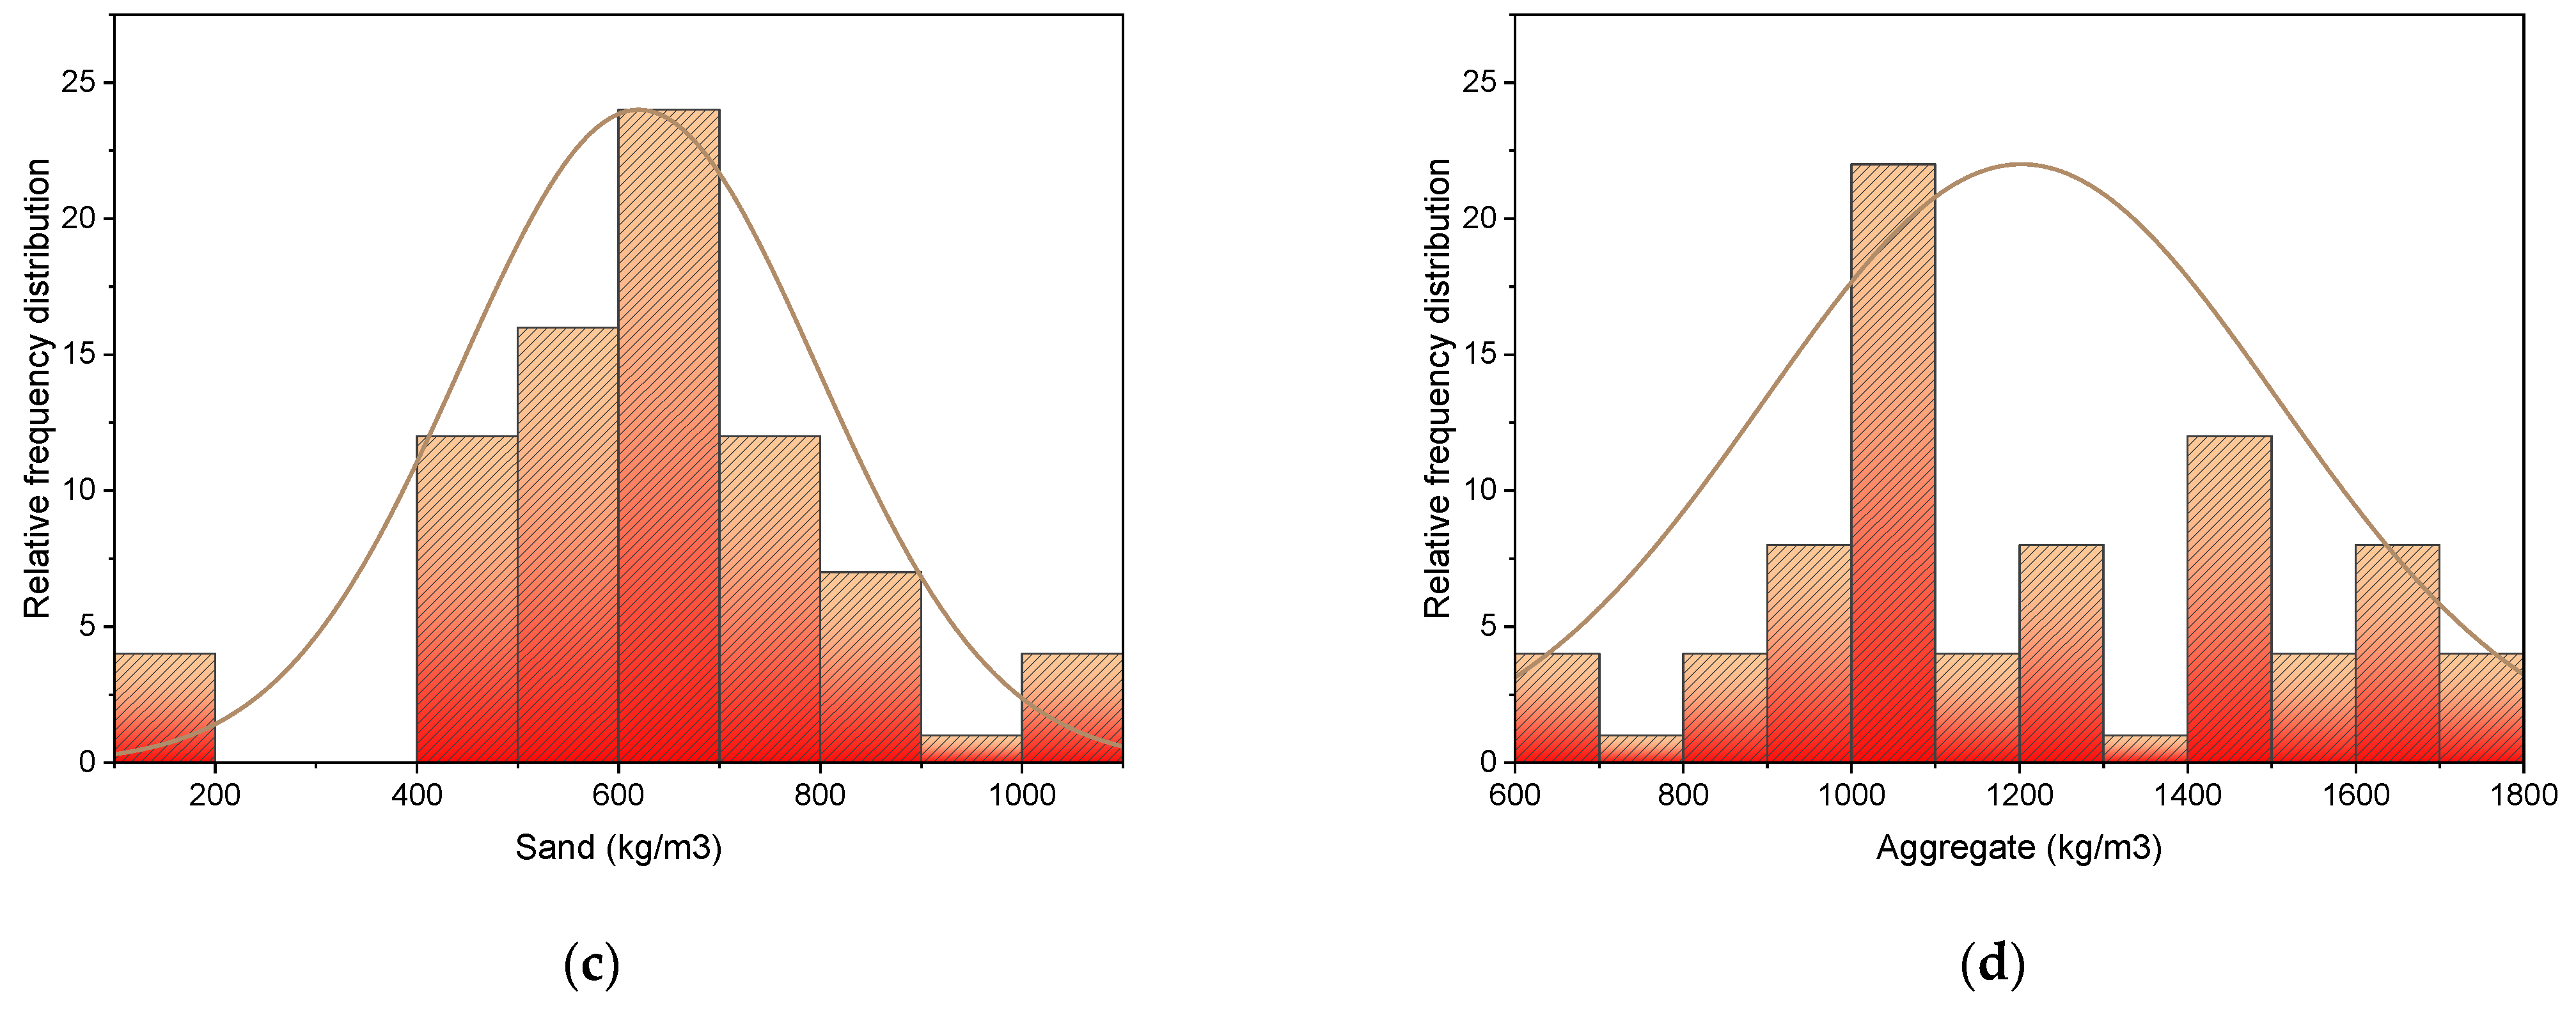
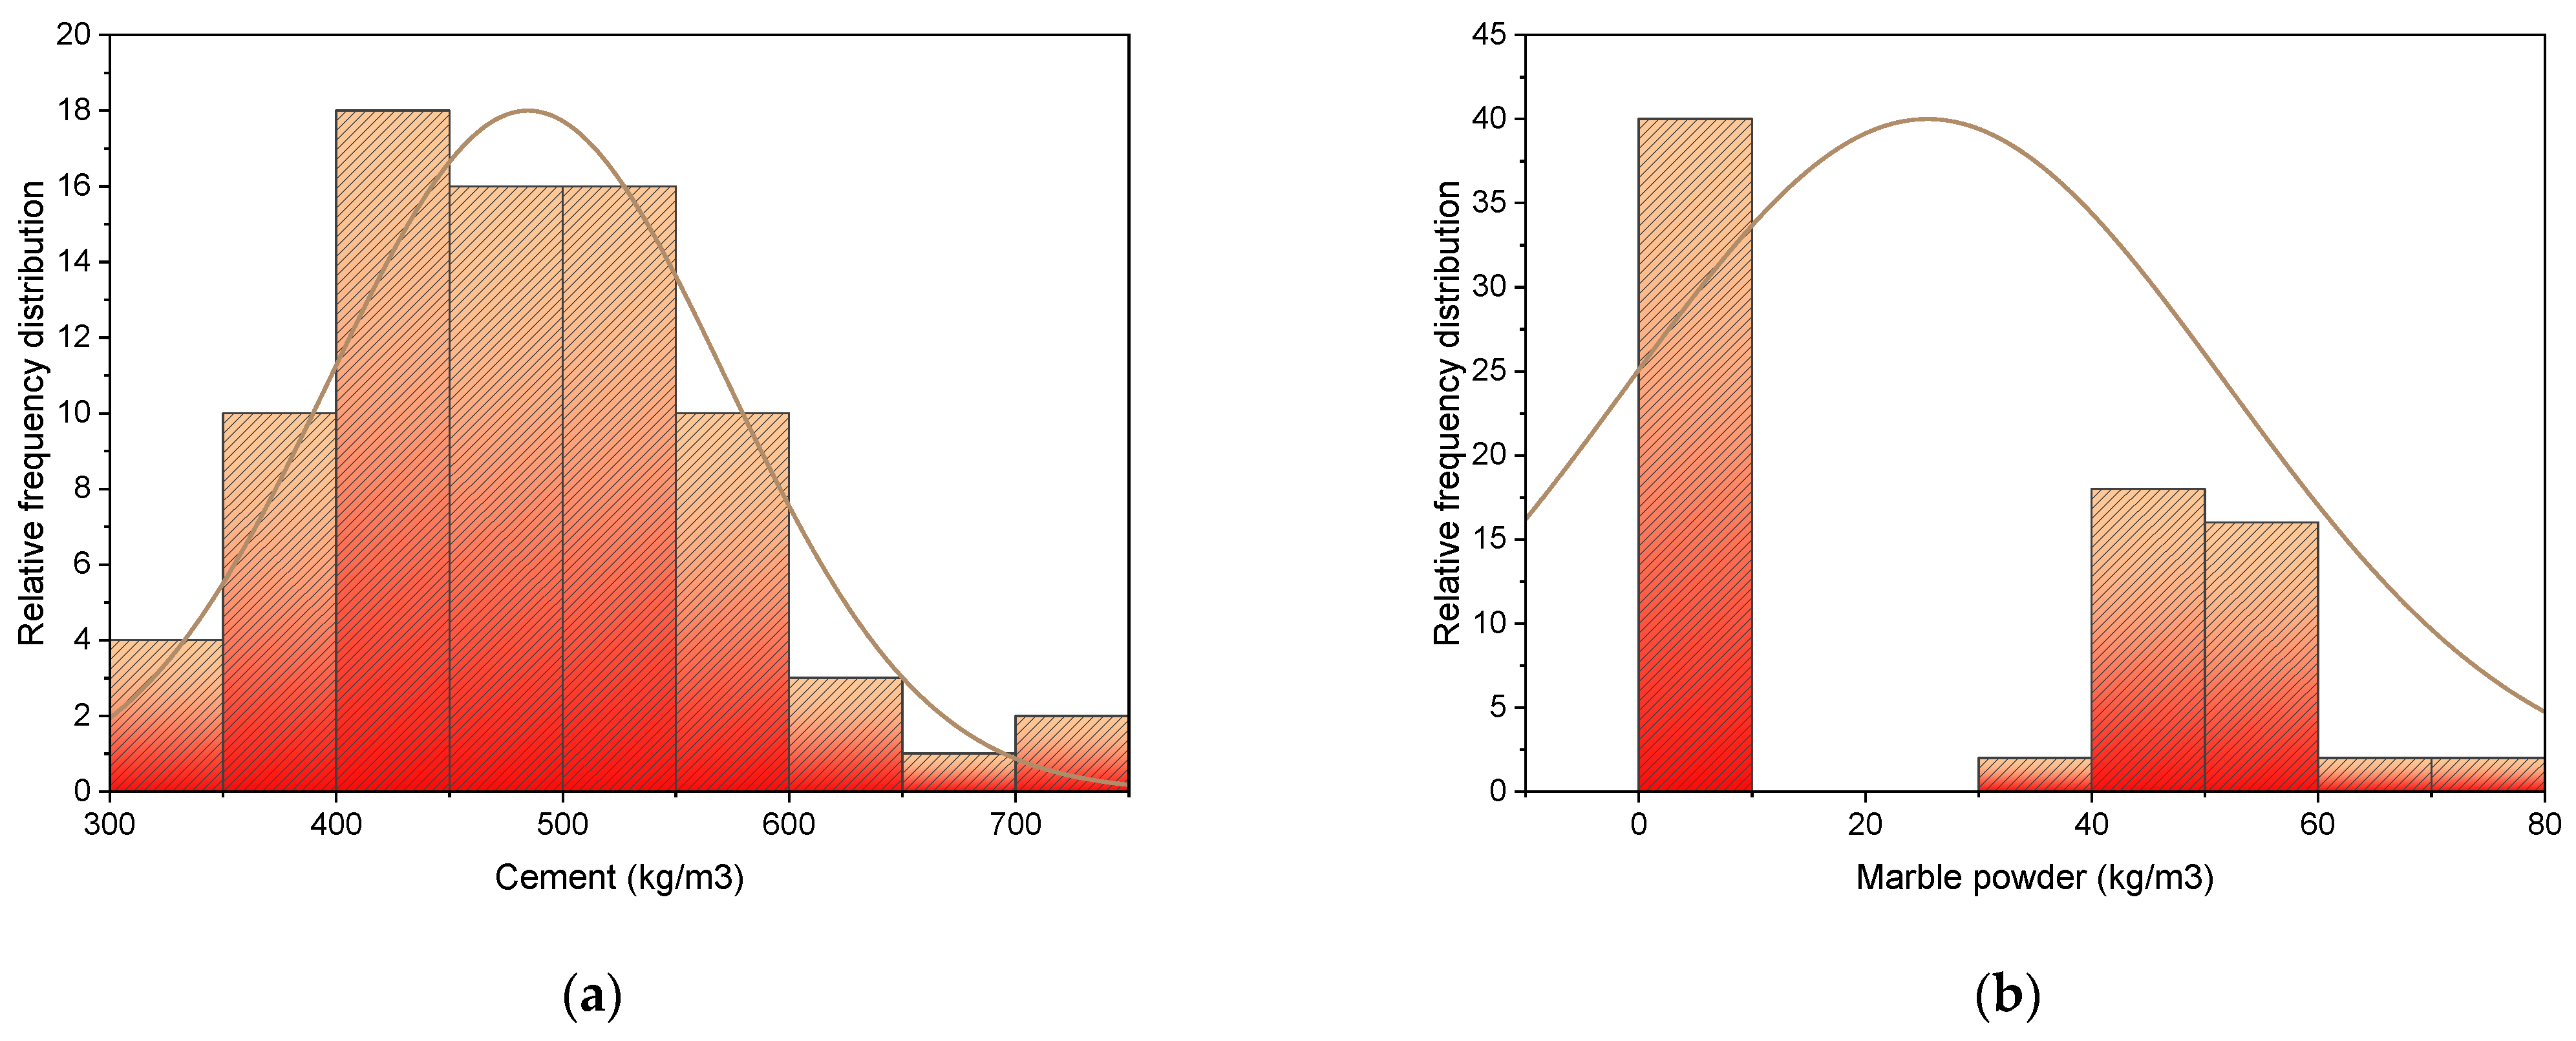
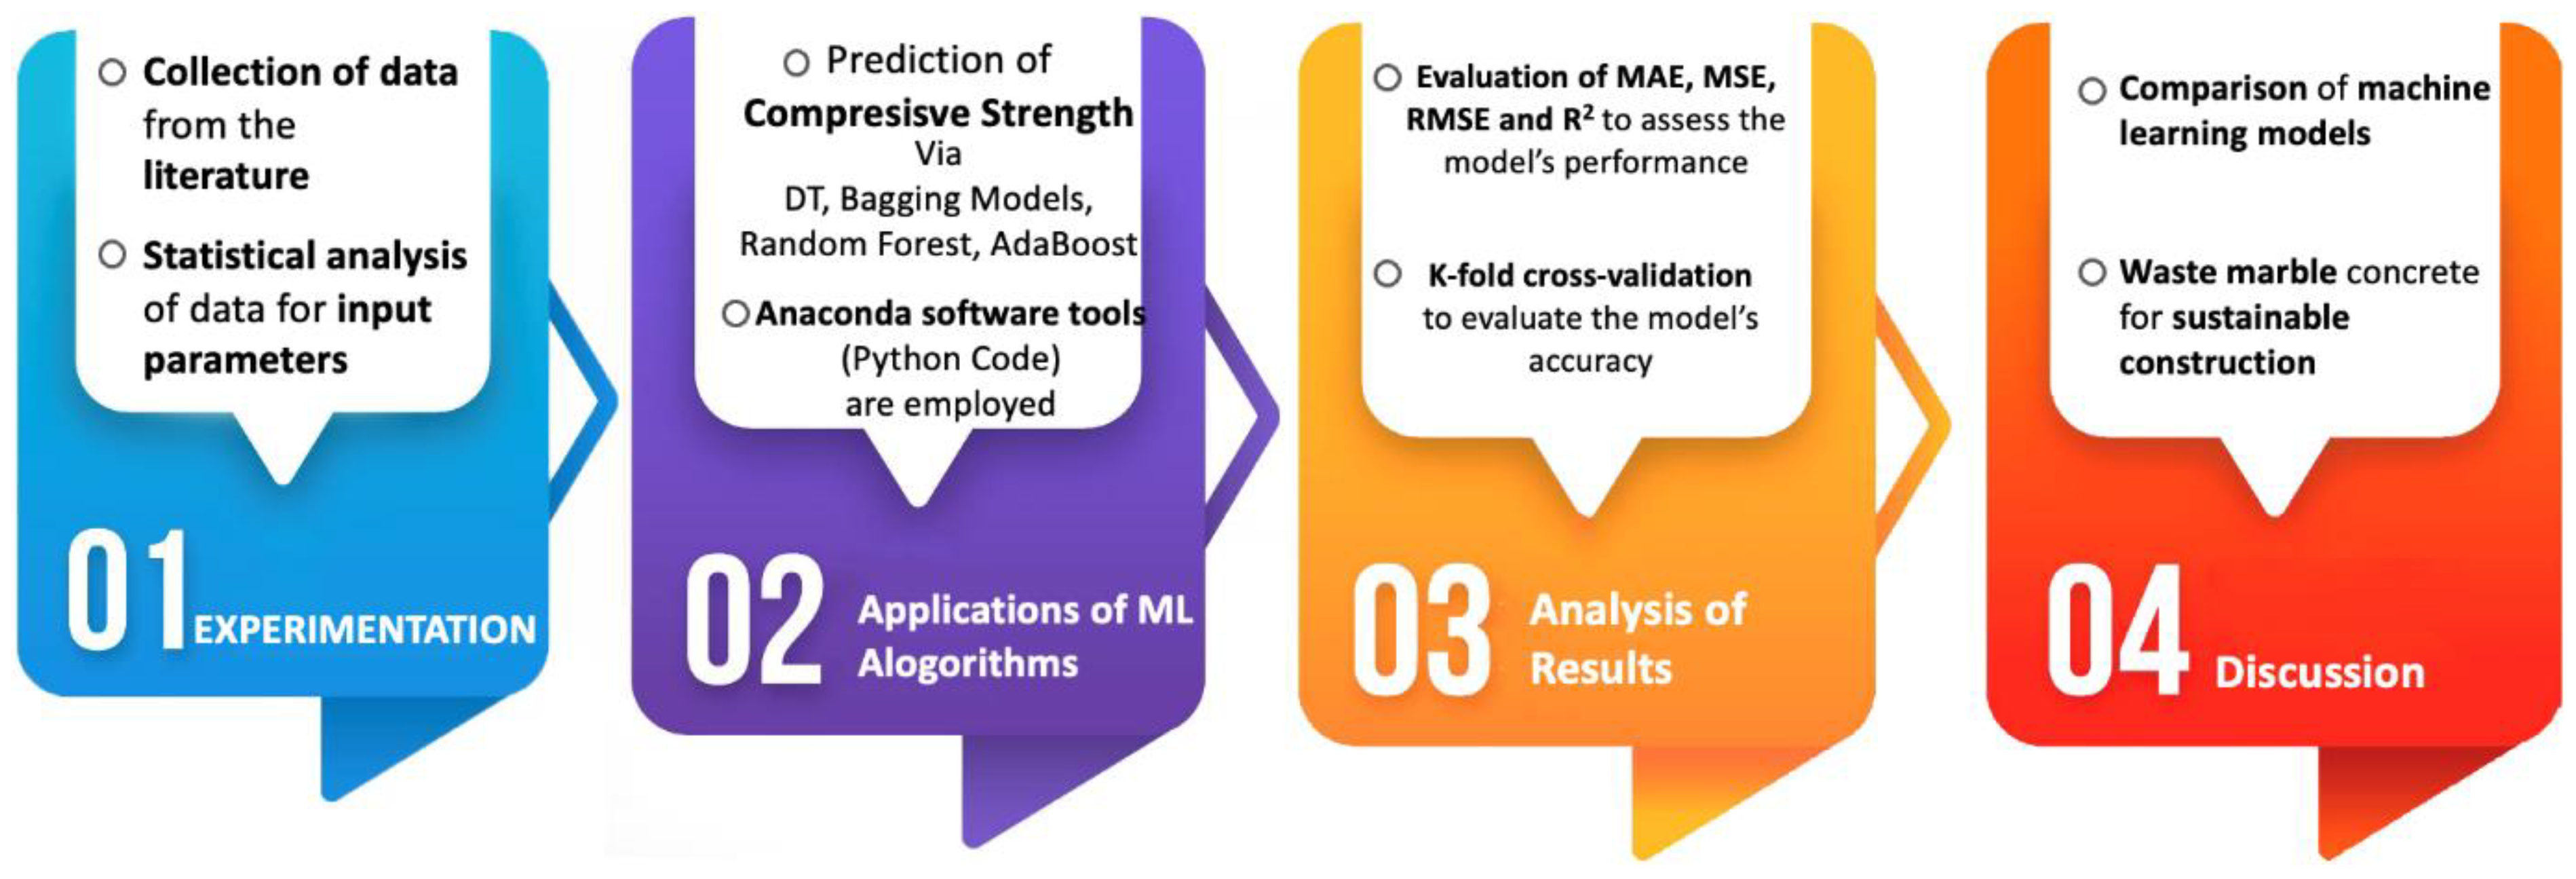
3. Experimentation and Data Description
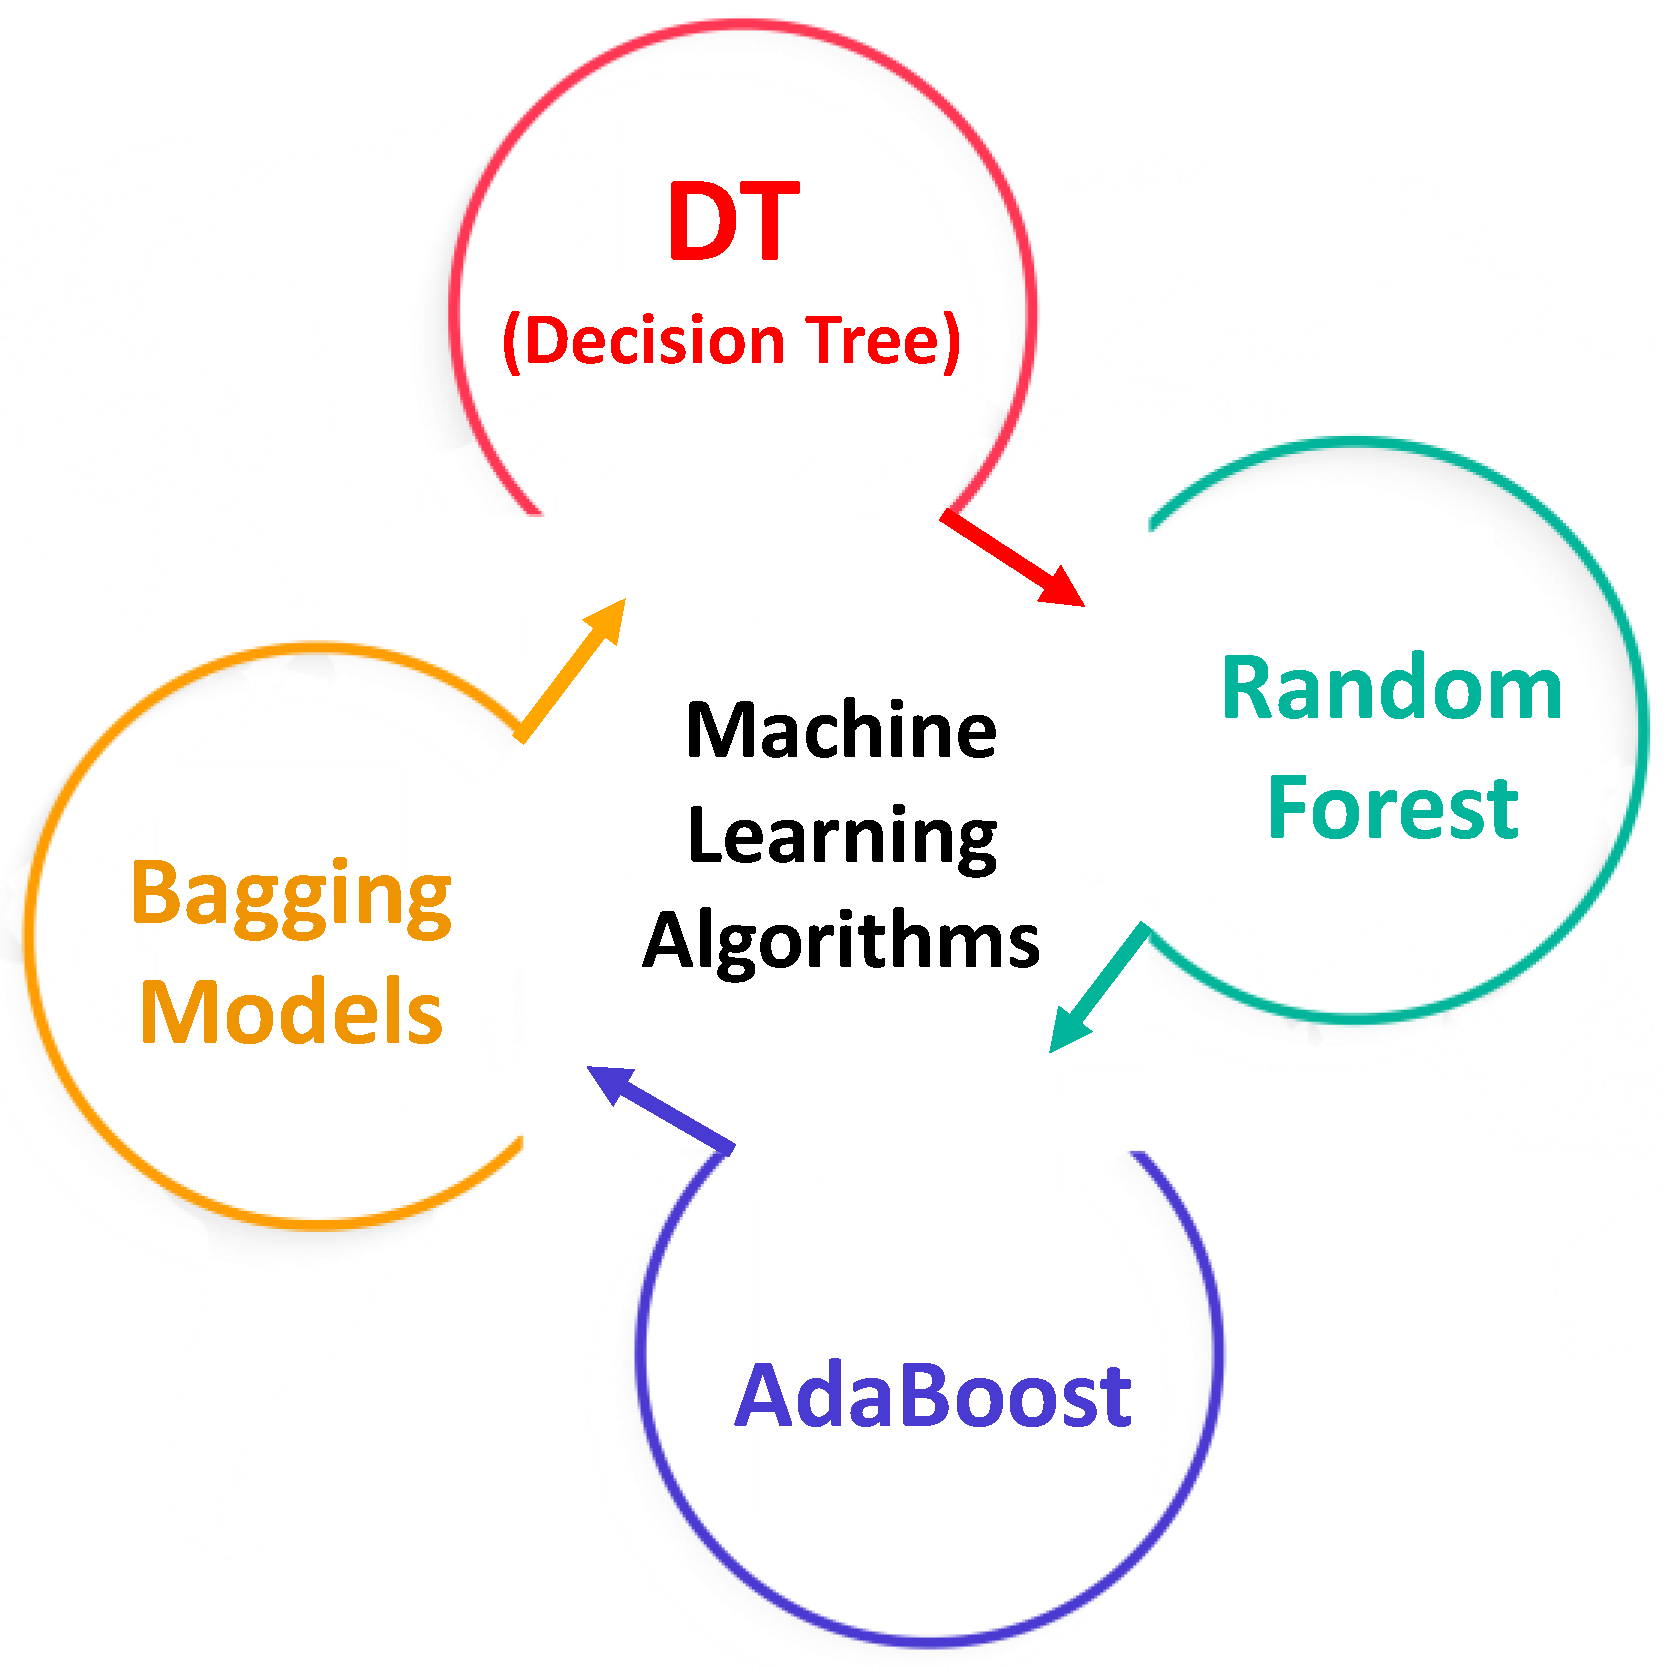
4. Modelling Techniques Description
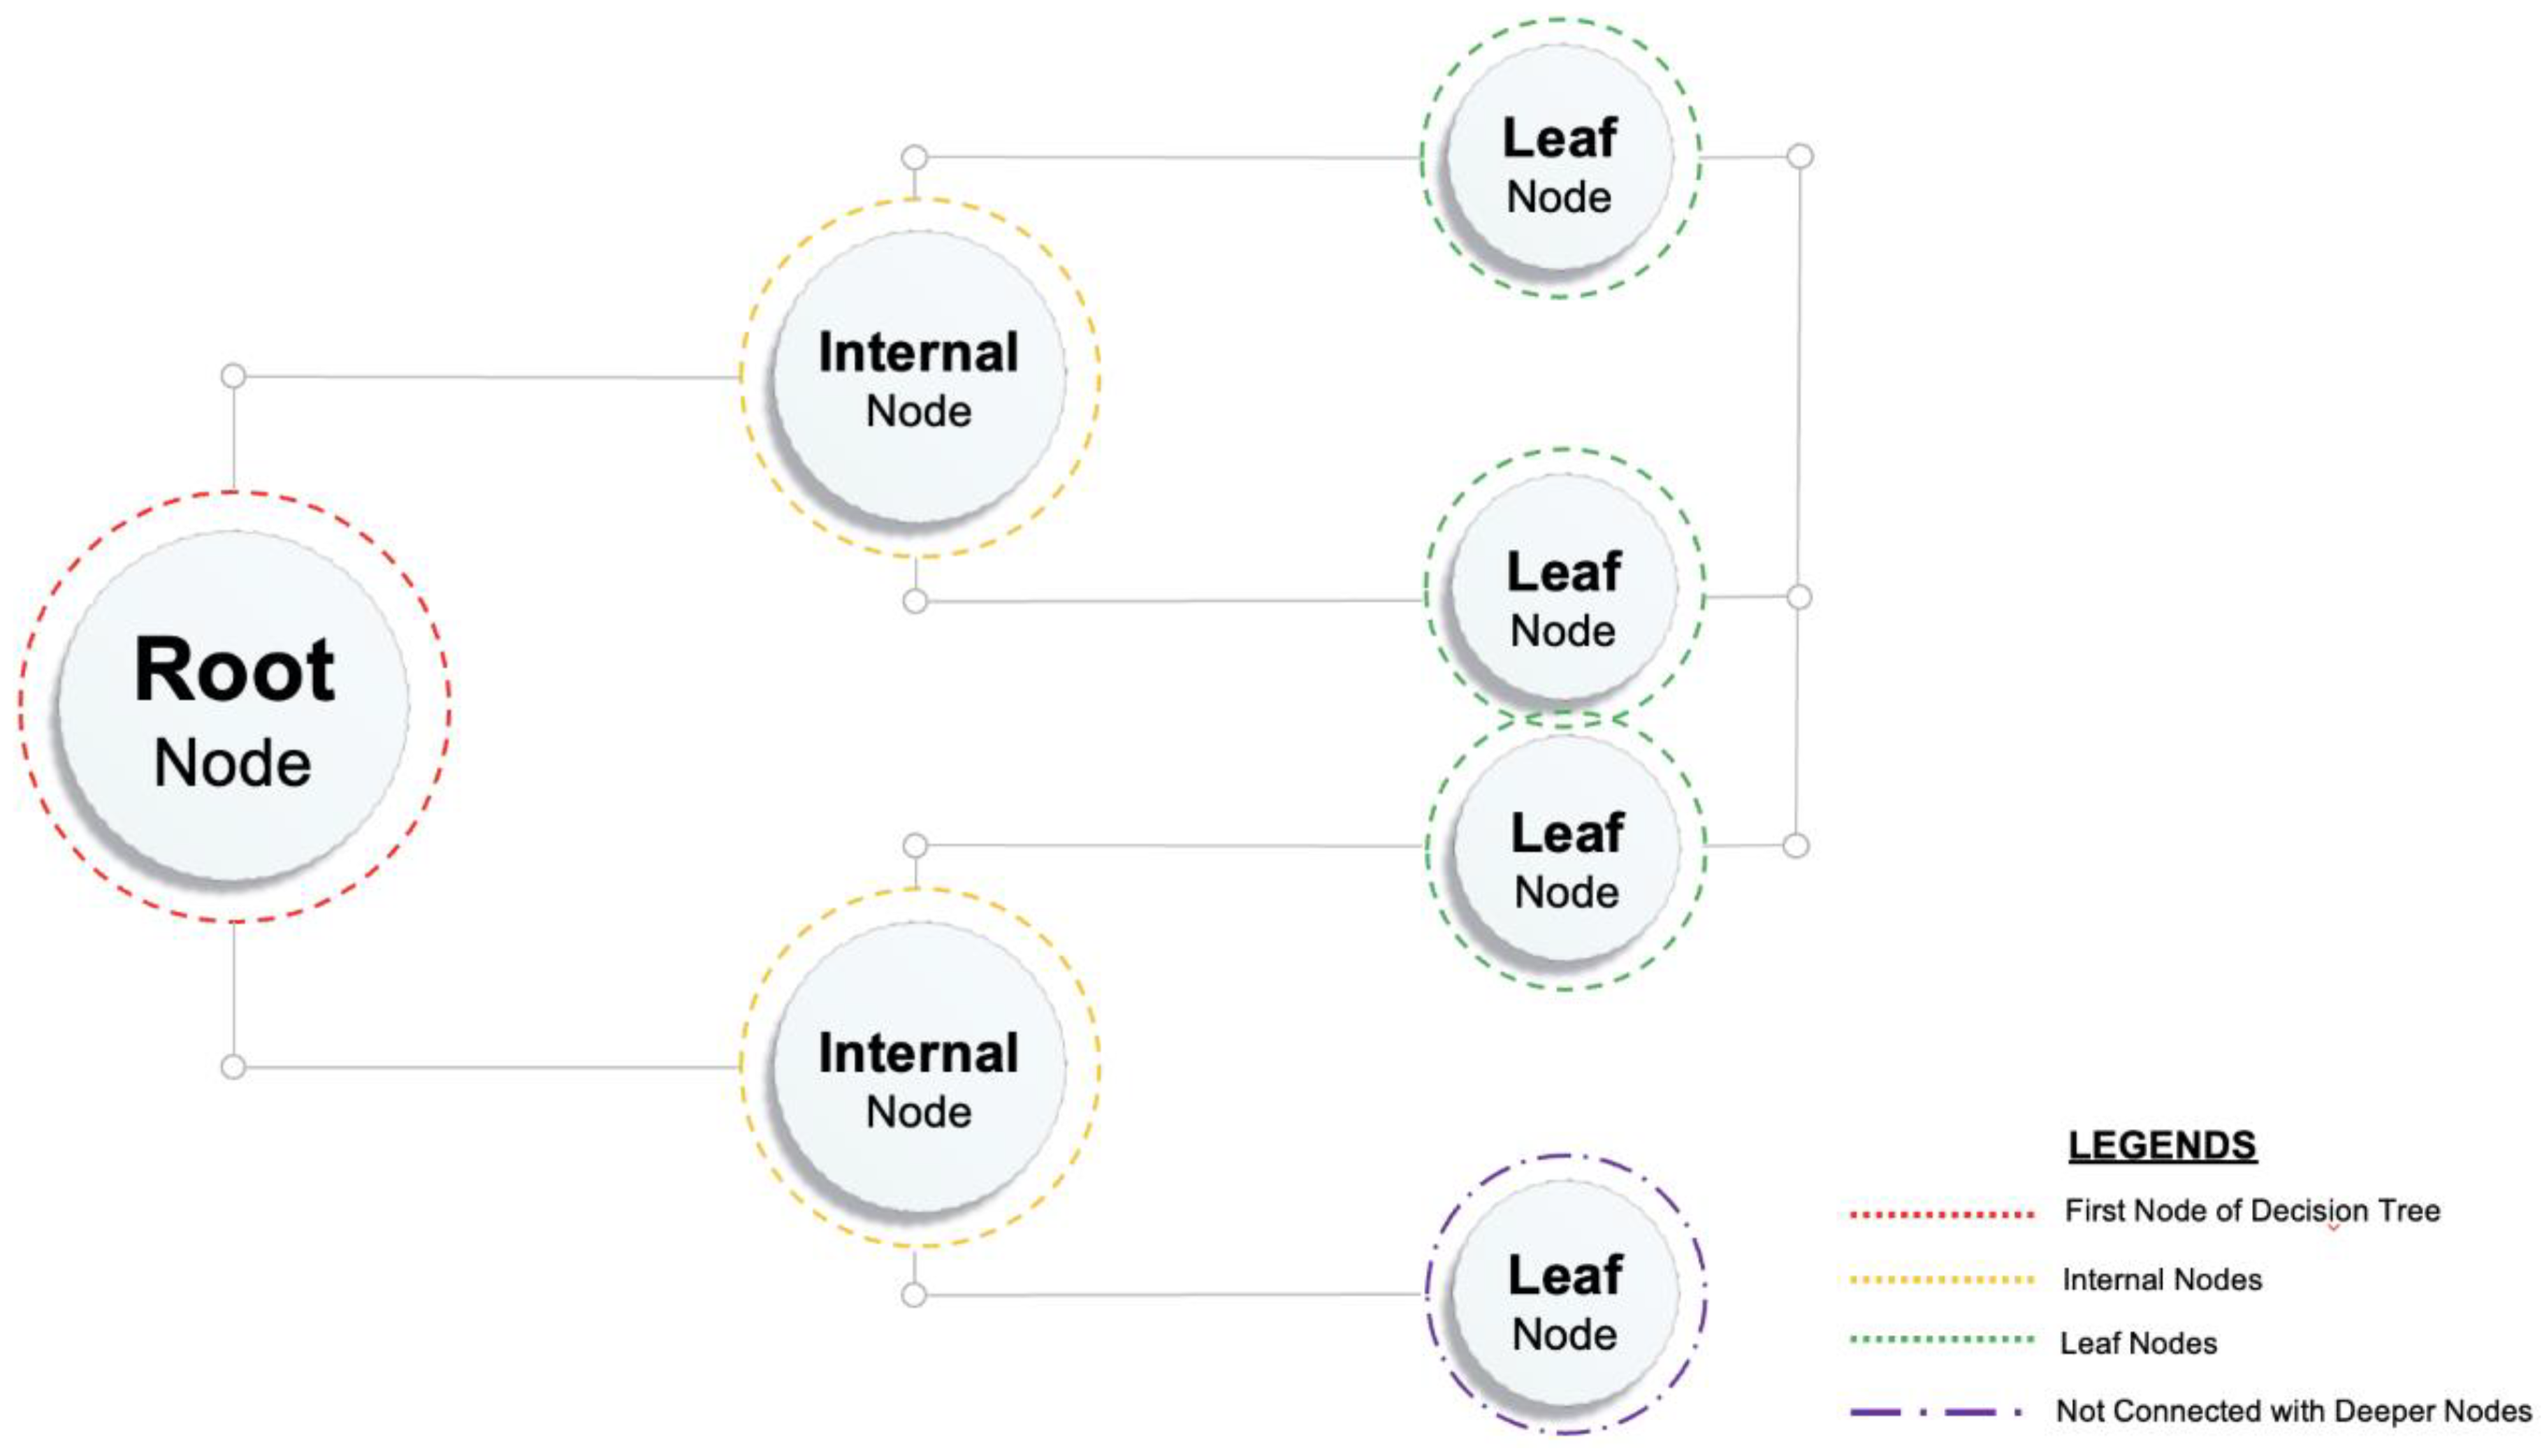
4.1. Decision Tree Algorithm
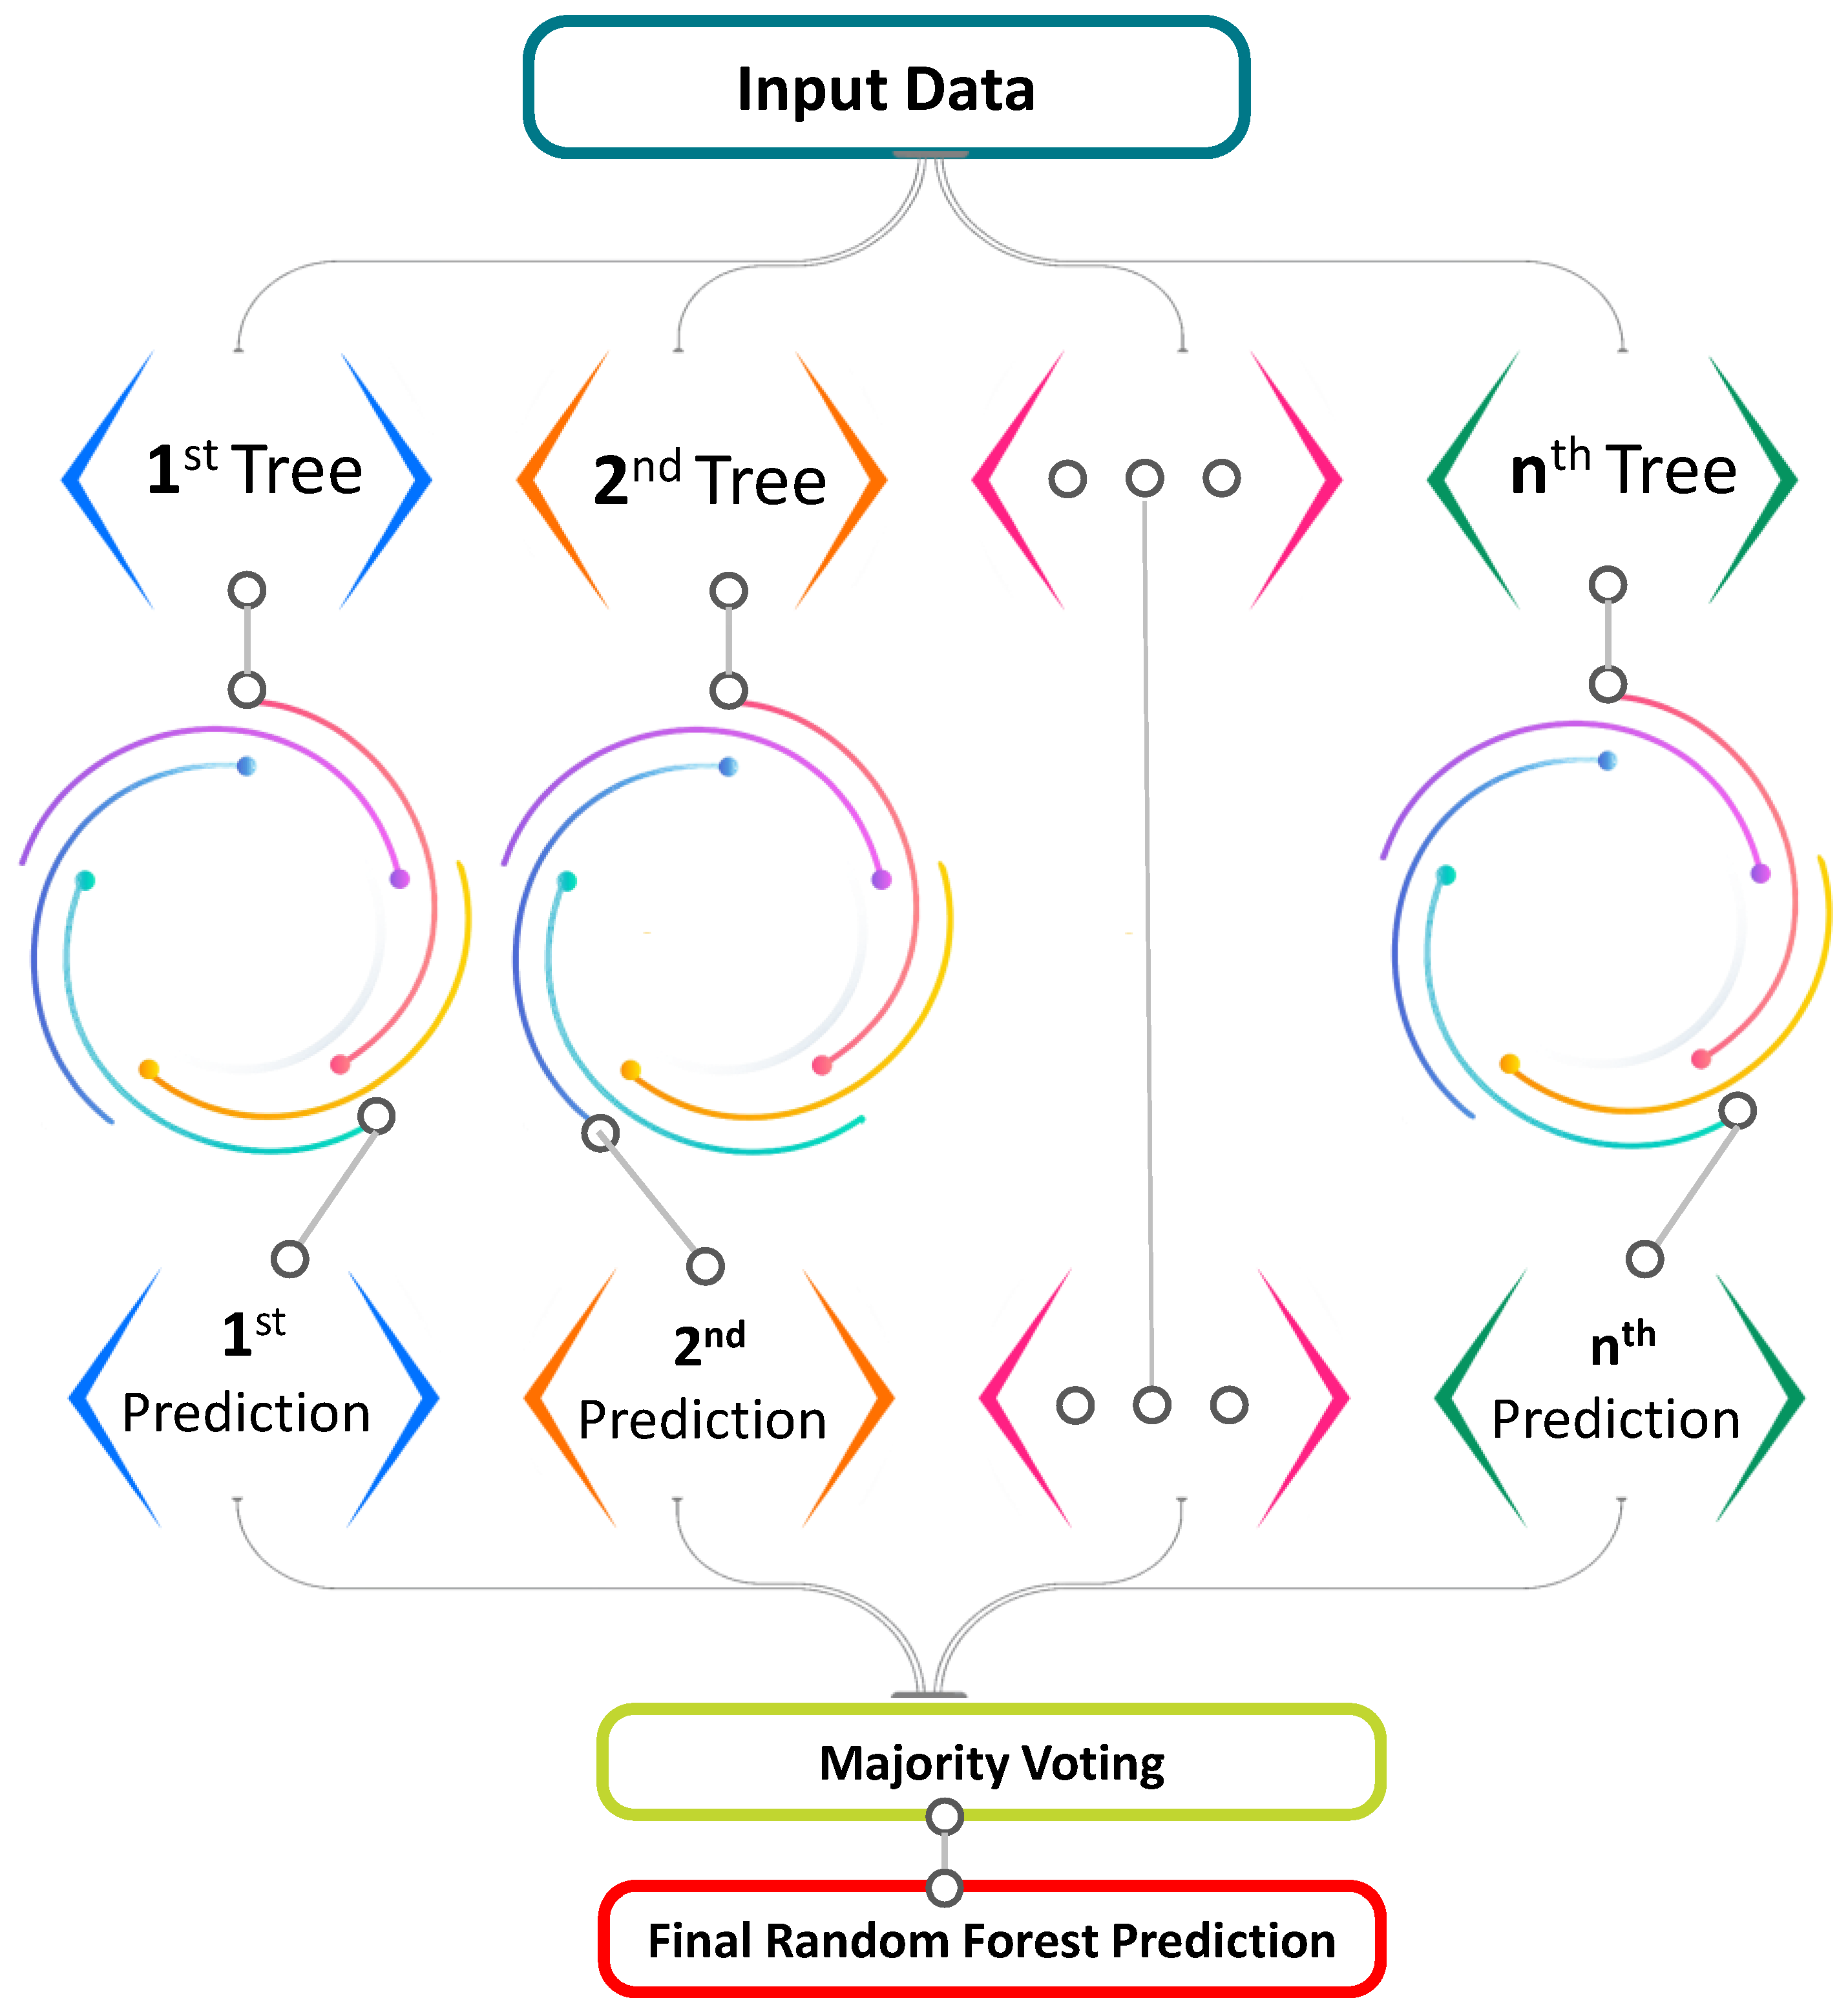
4.2. Random Forest Algorithm
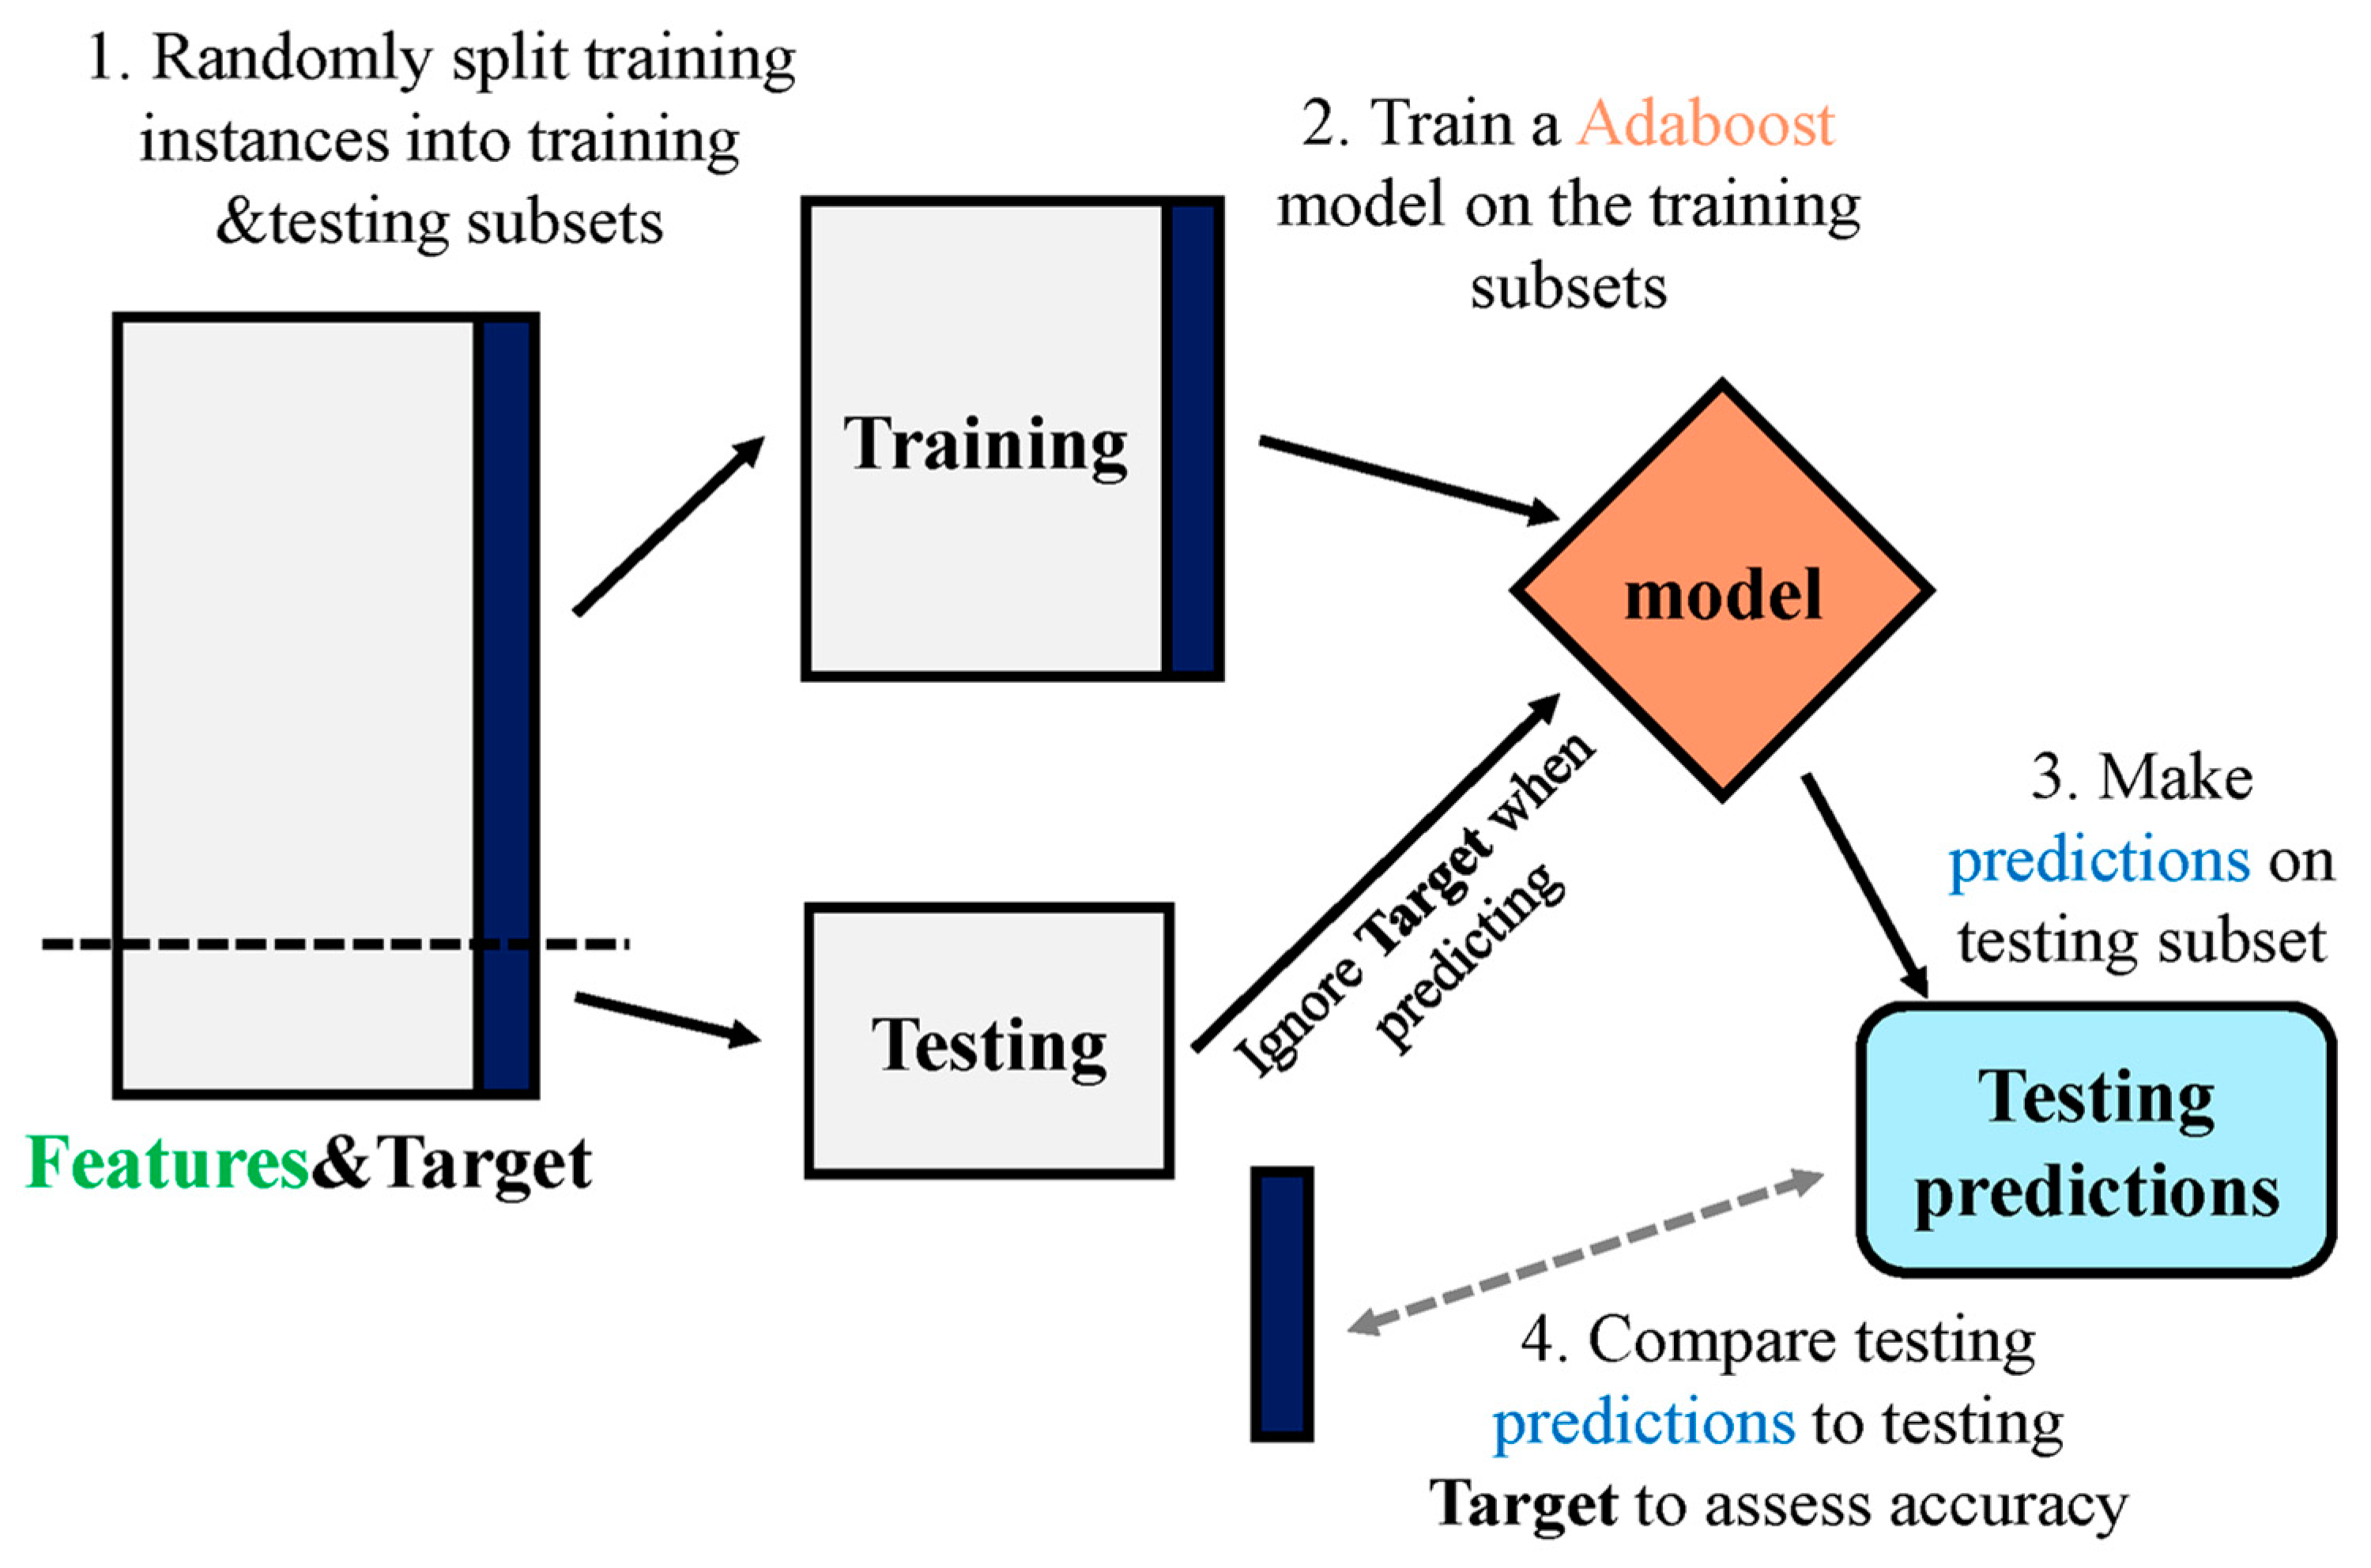
4.3. AdaBoost Algorithm
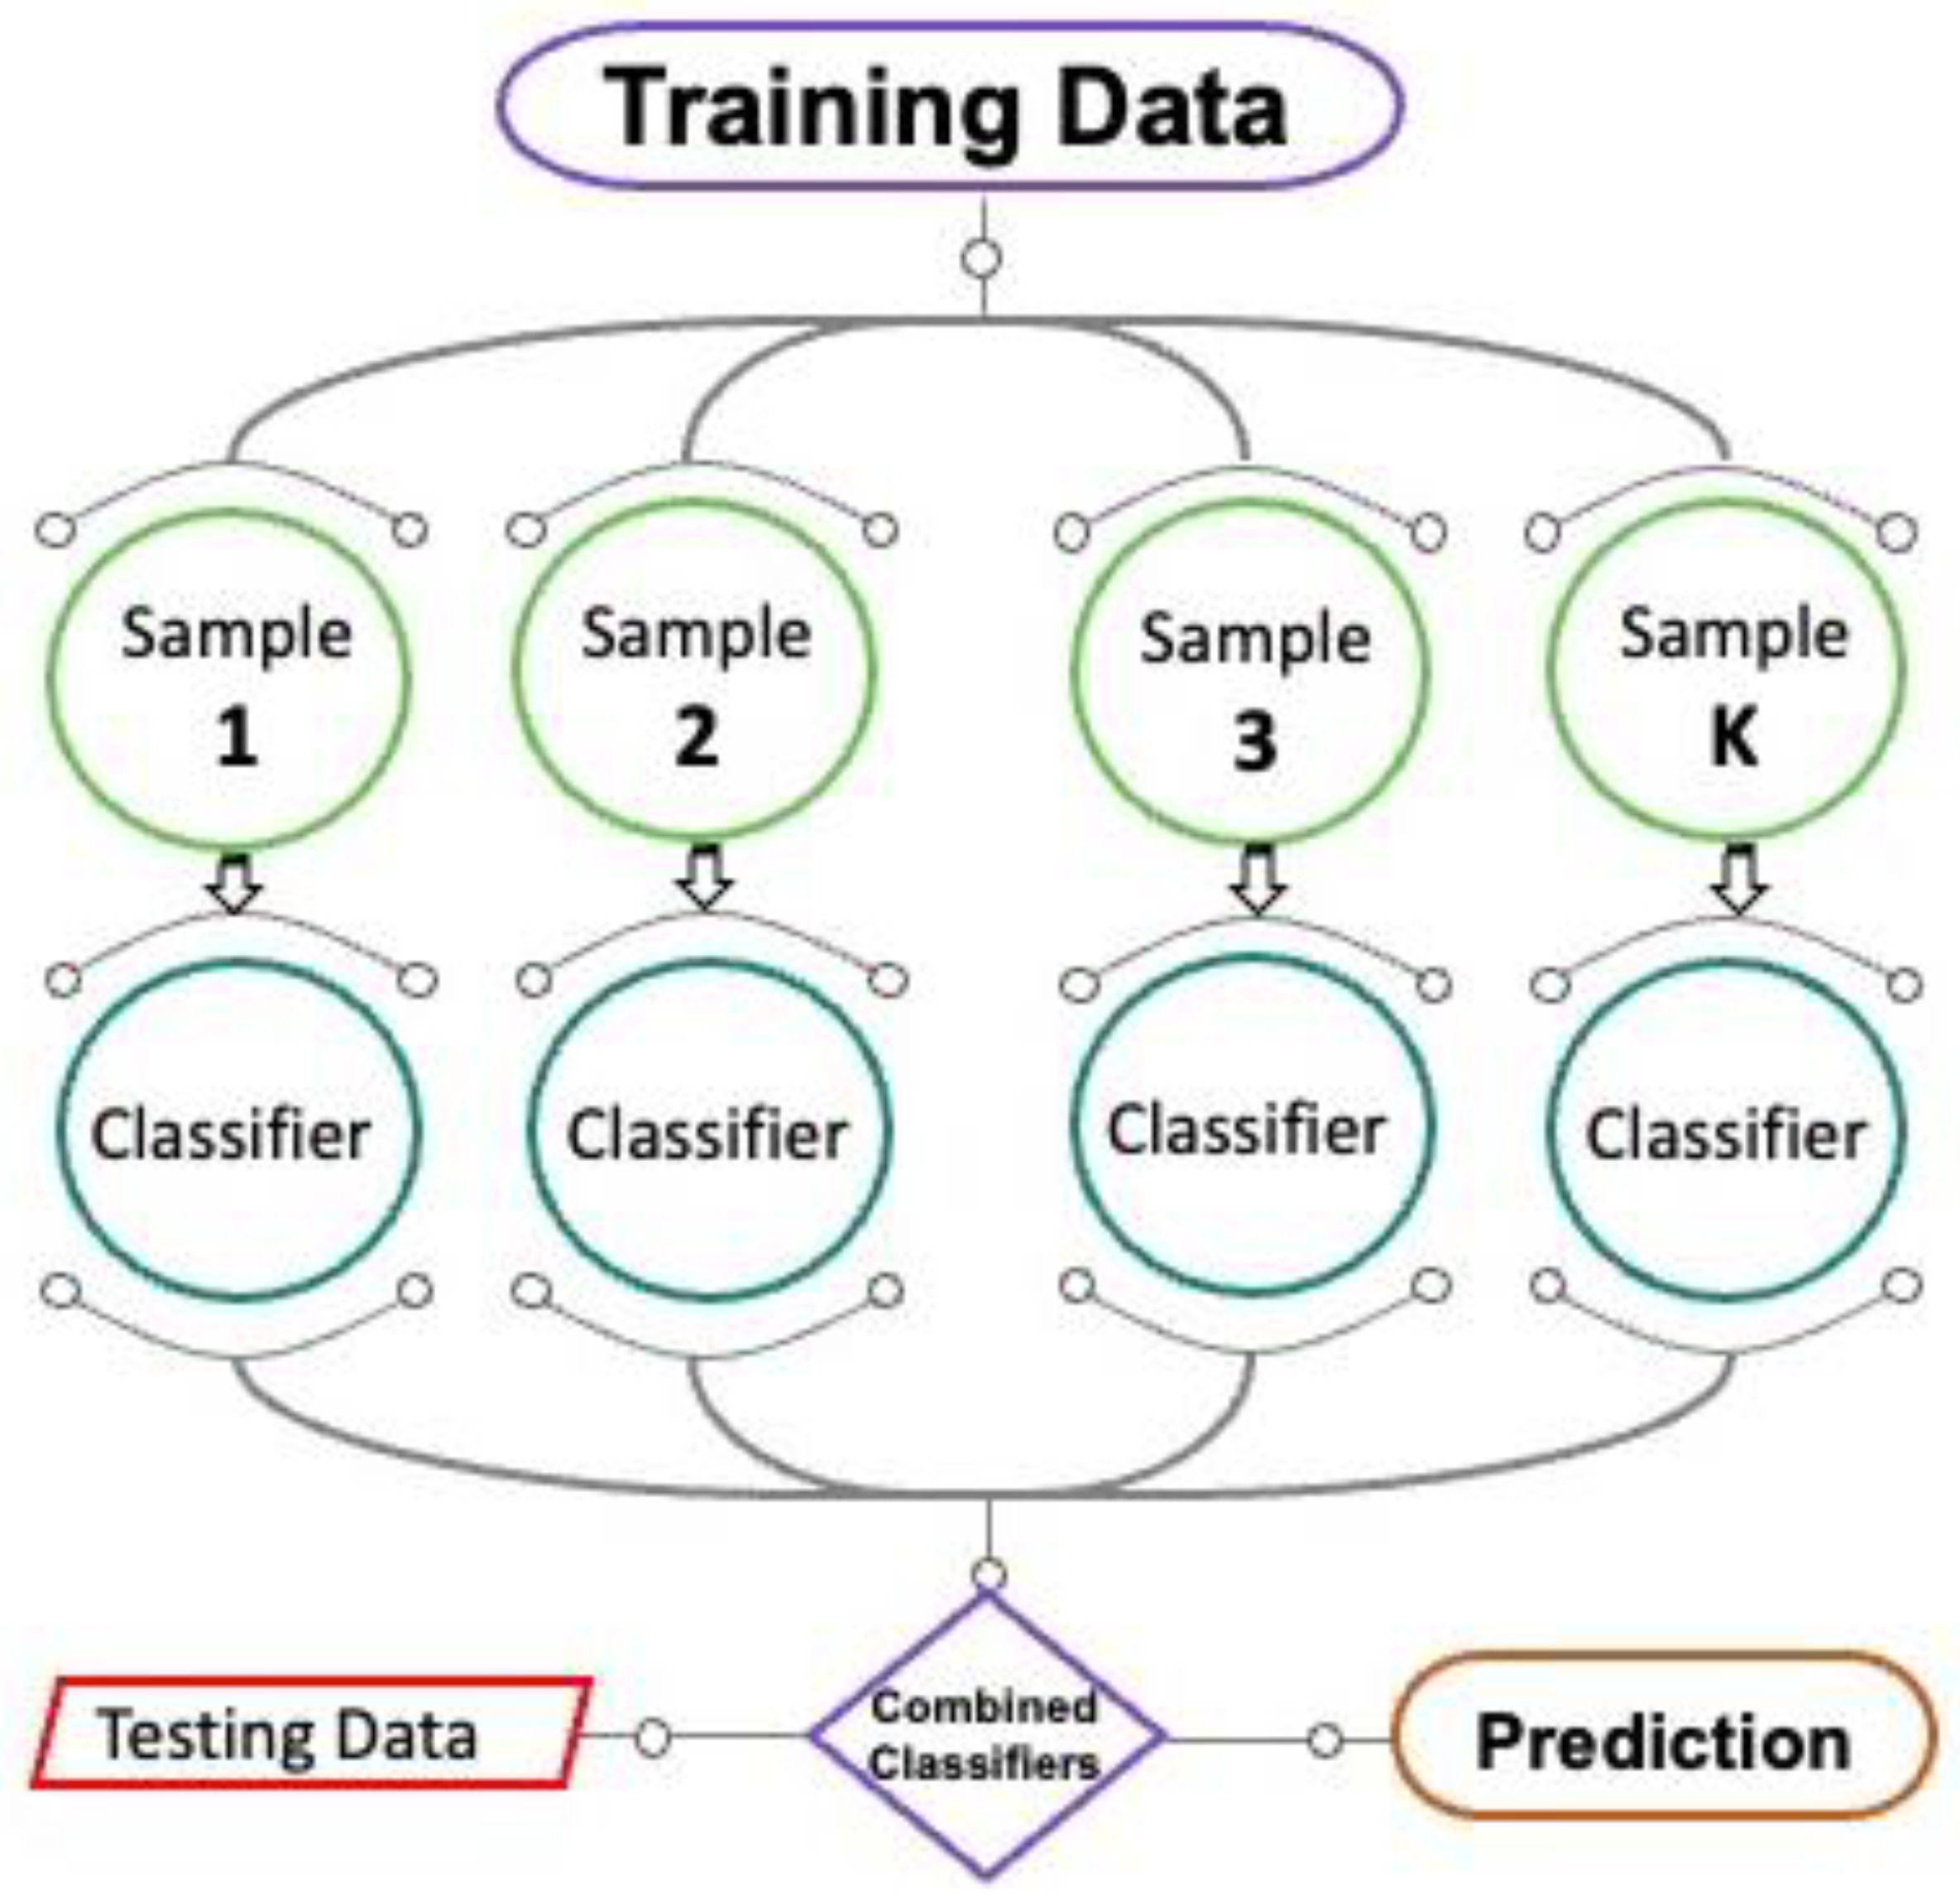
4.4. Bagging Algorithm
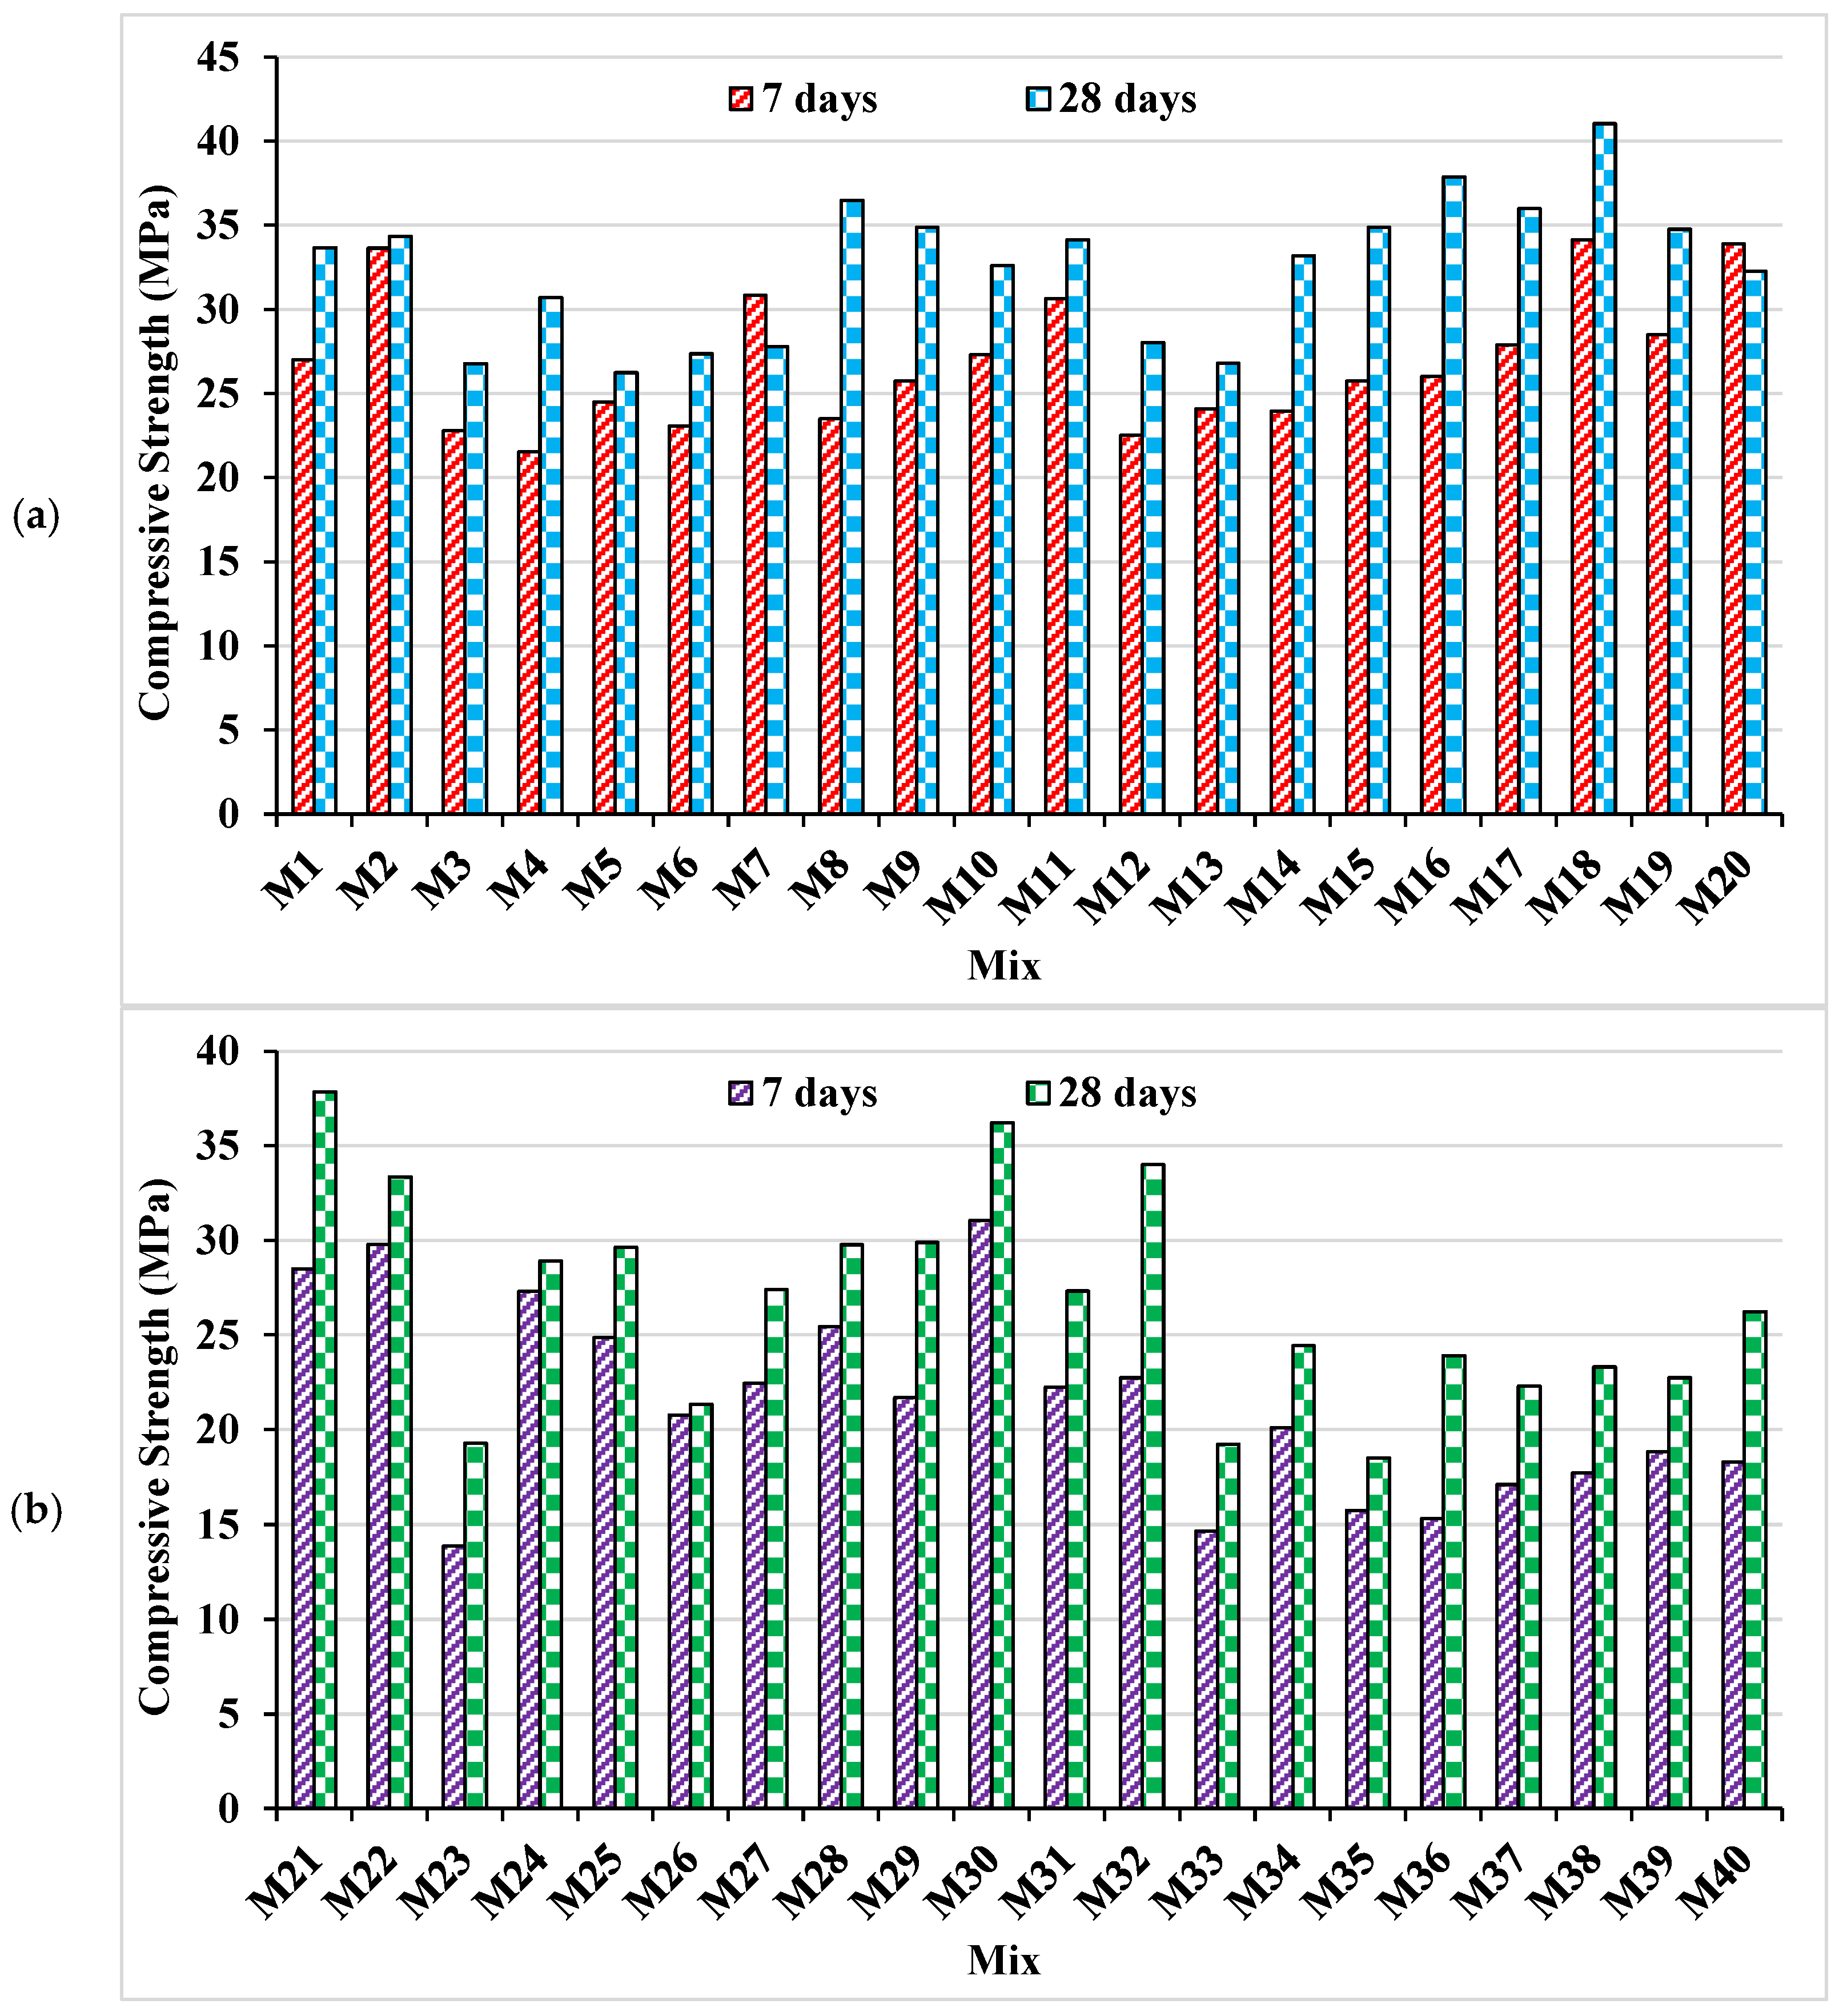
5. Experimental Compressive Strength Test Results
6. Analysis and Modelling Results
6.1. Prediction of Compressive Strength by Different Models
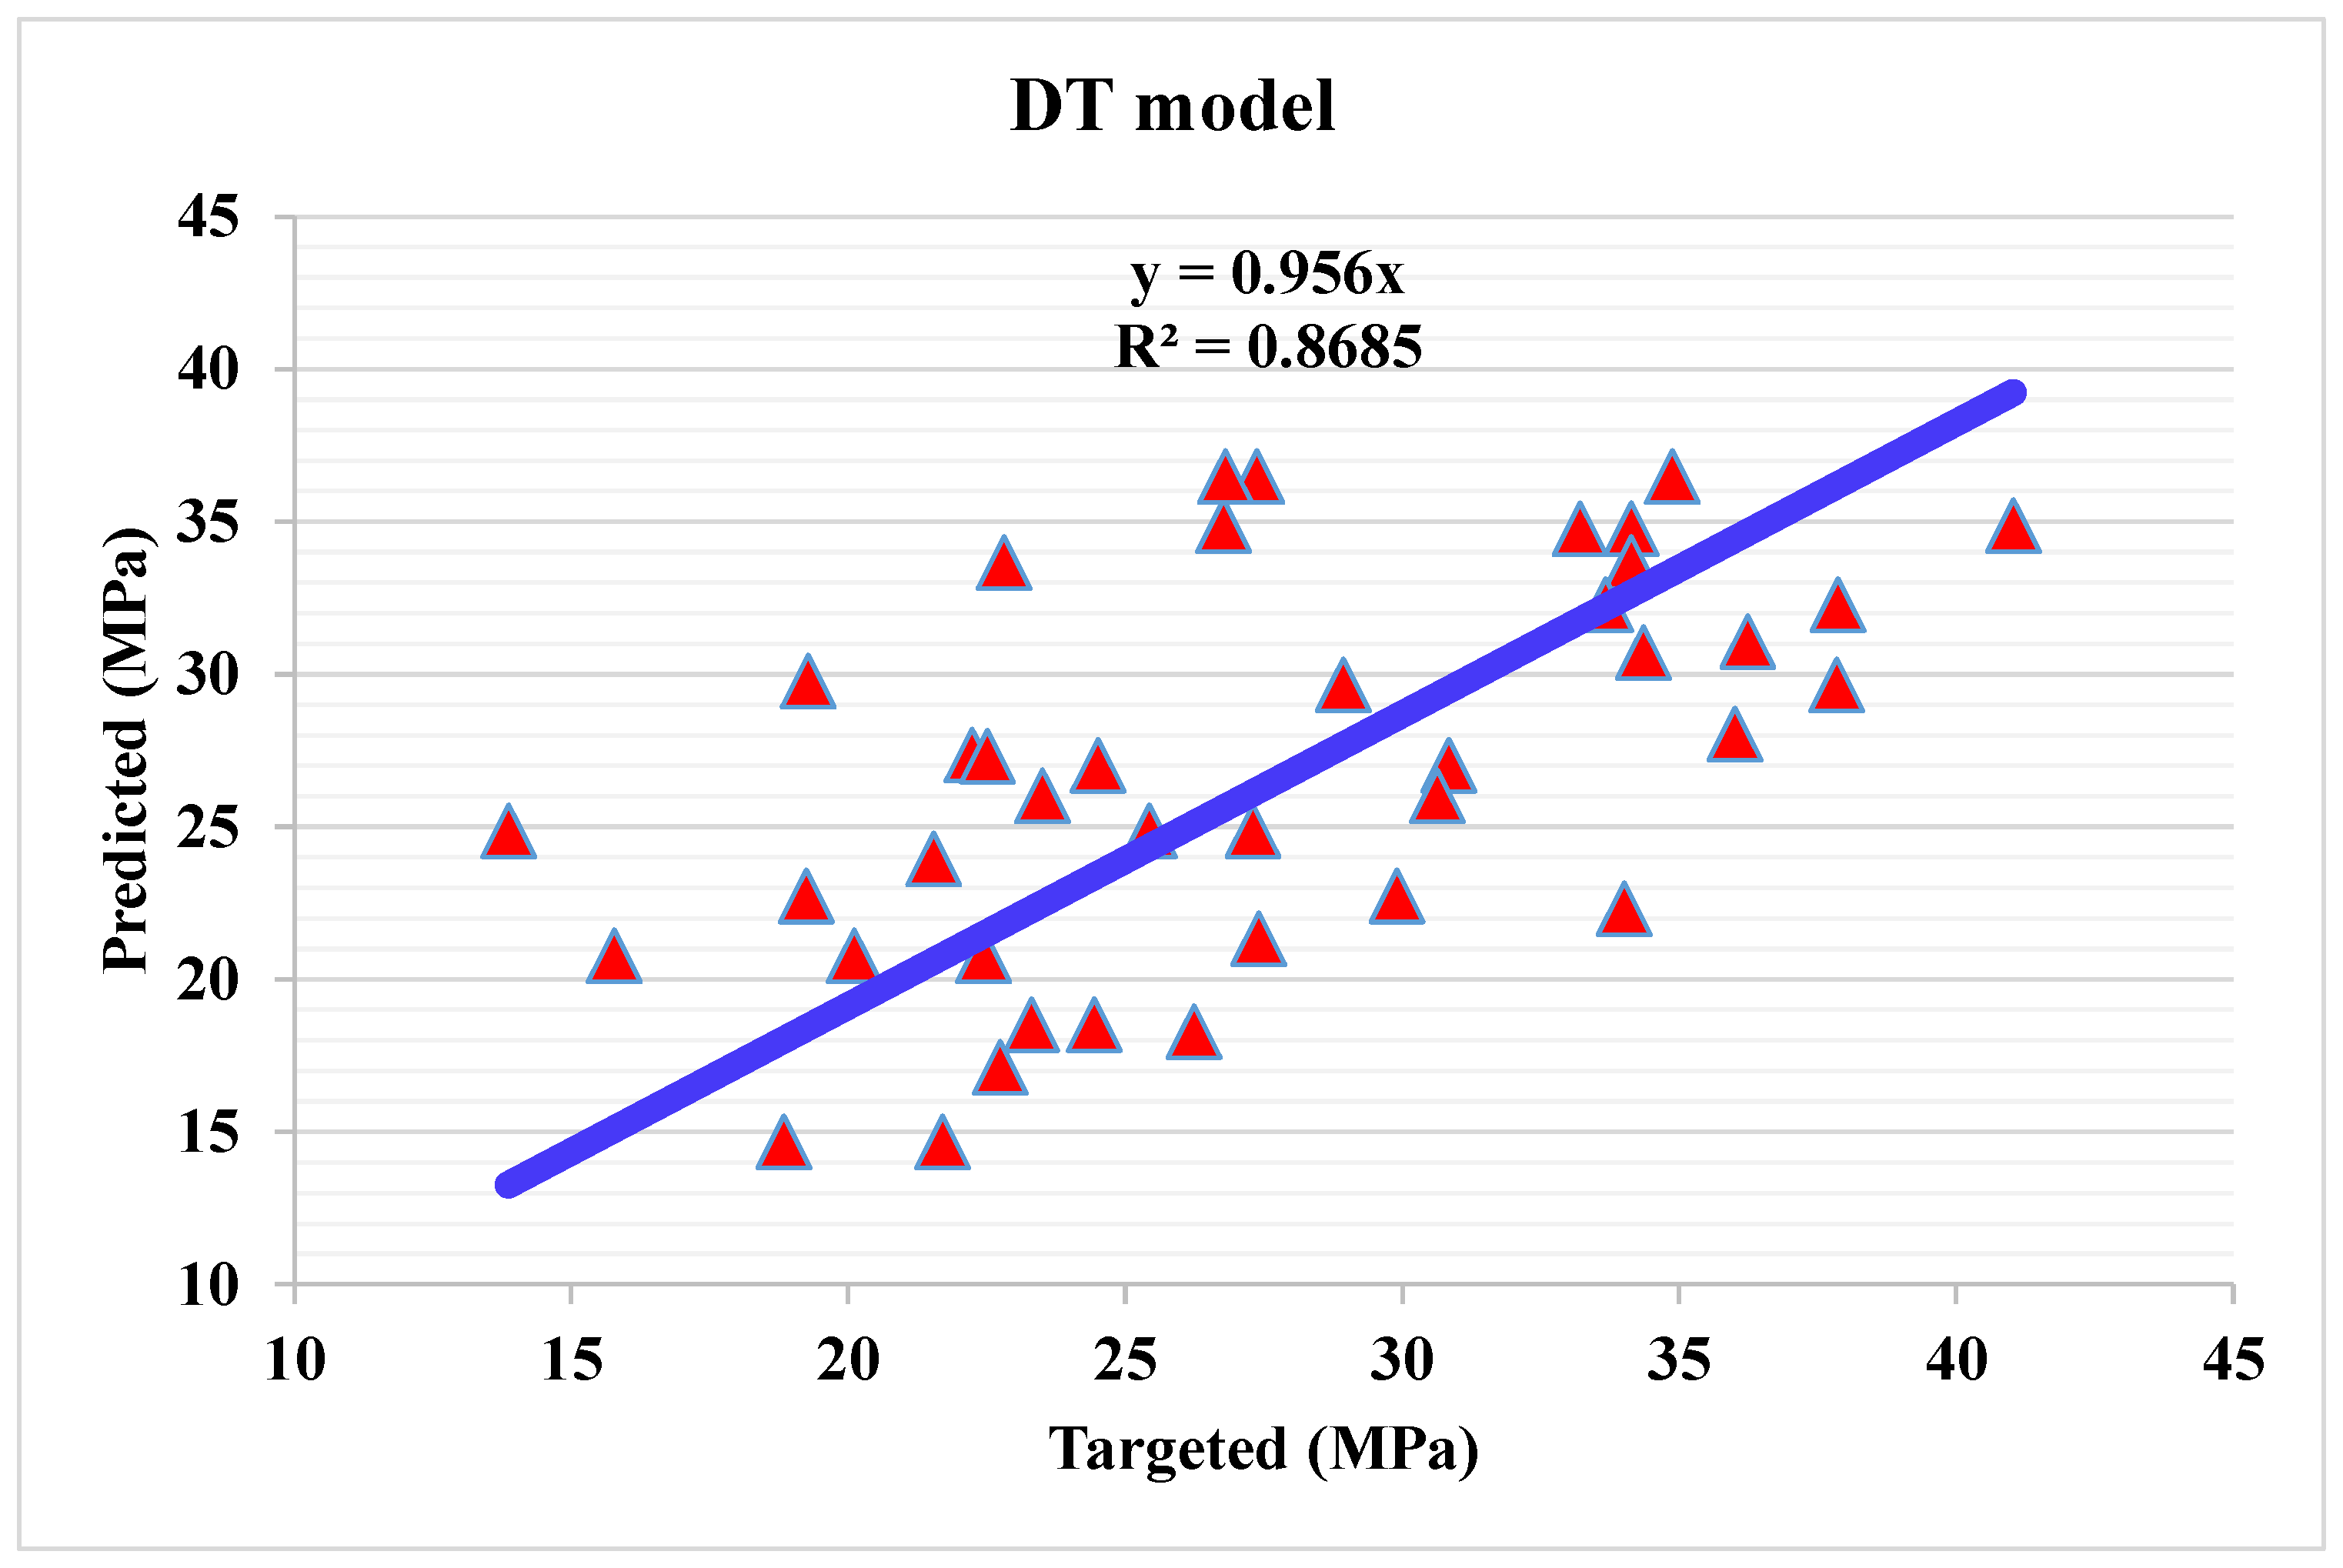
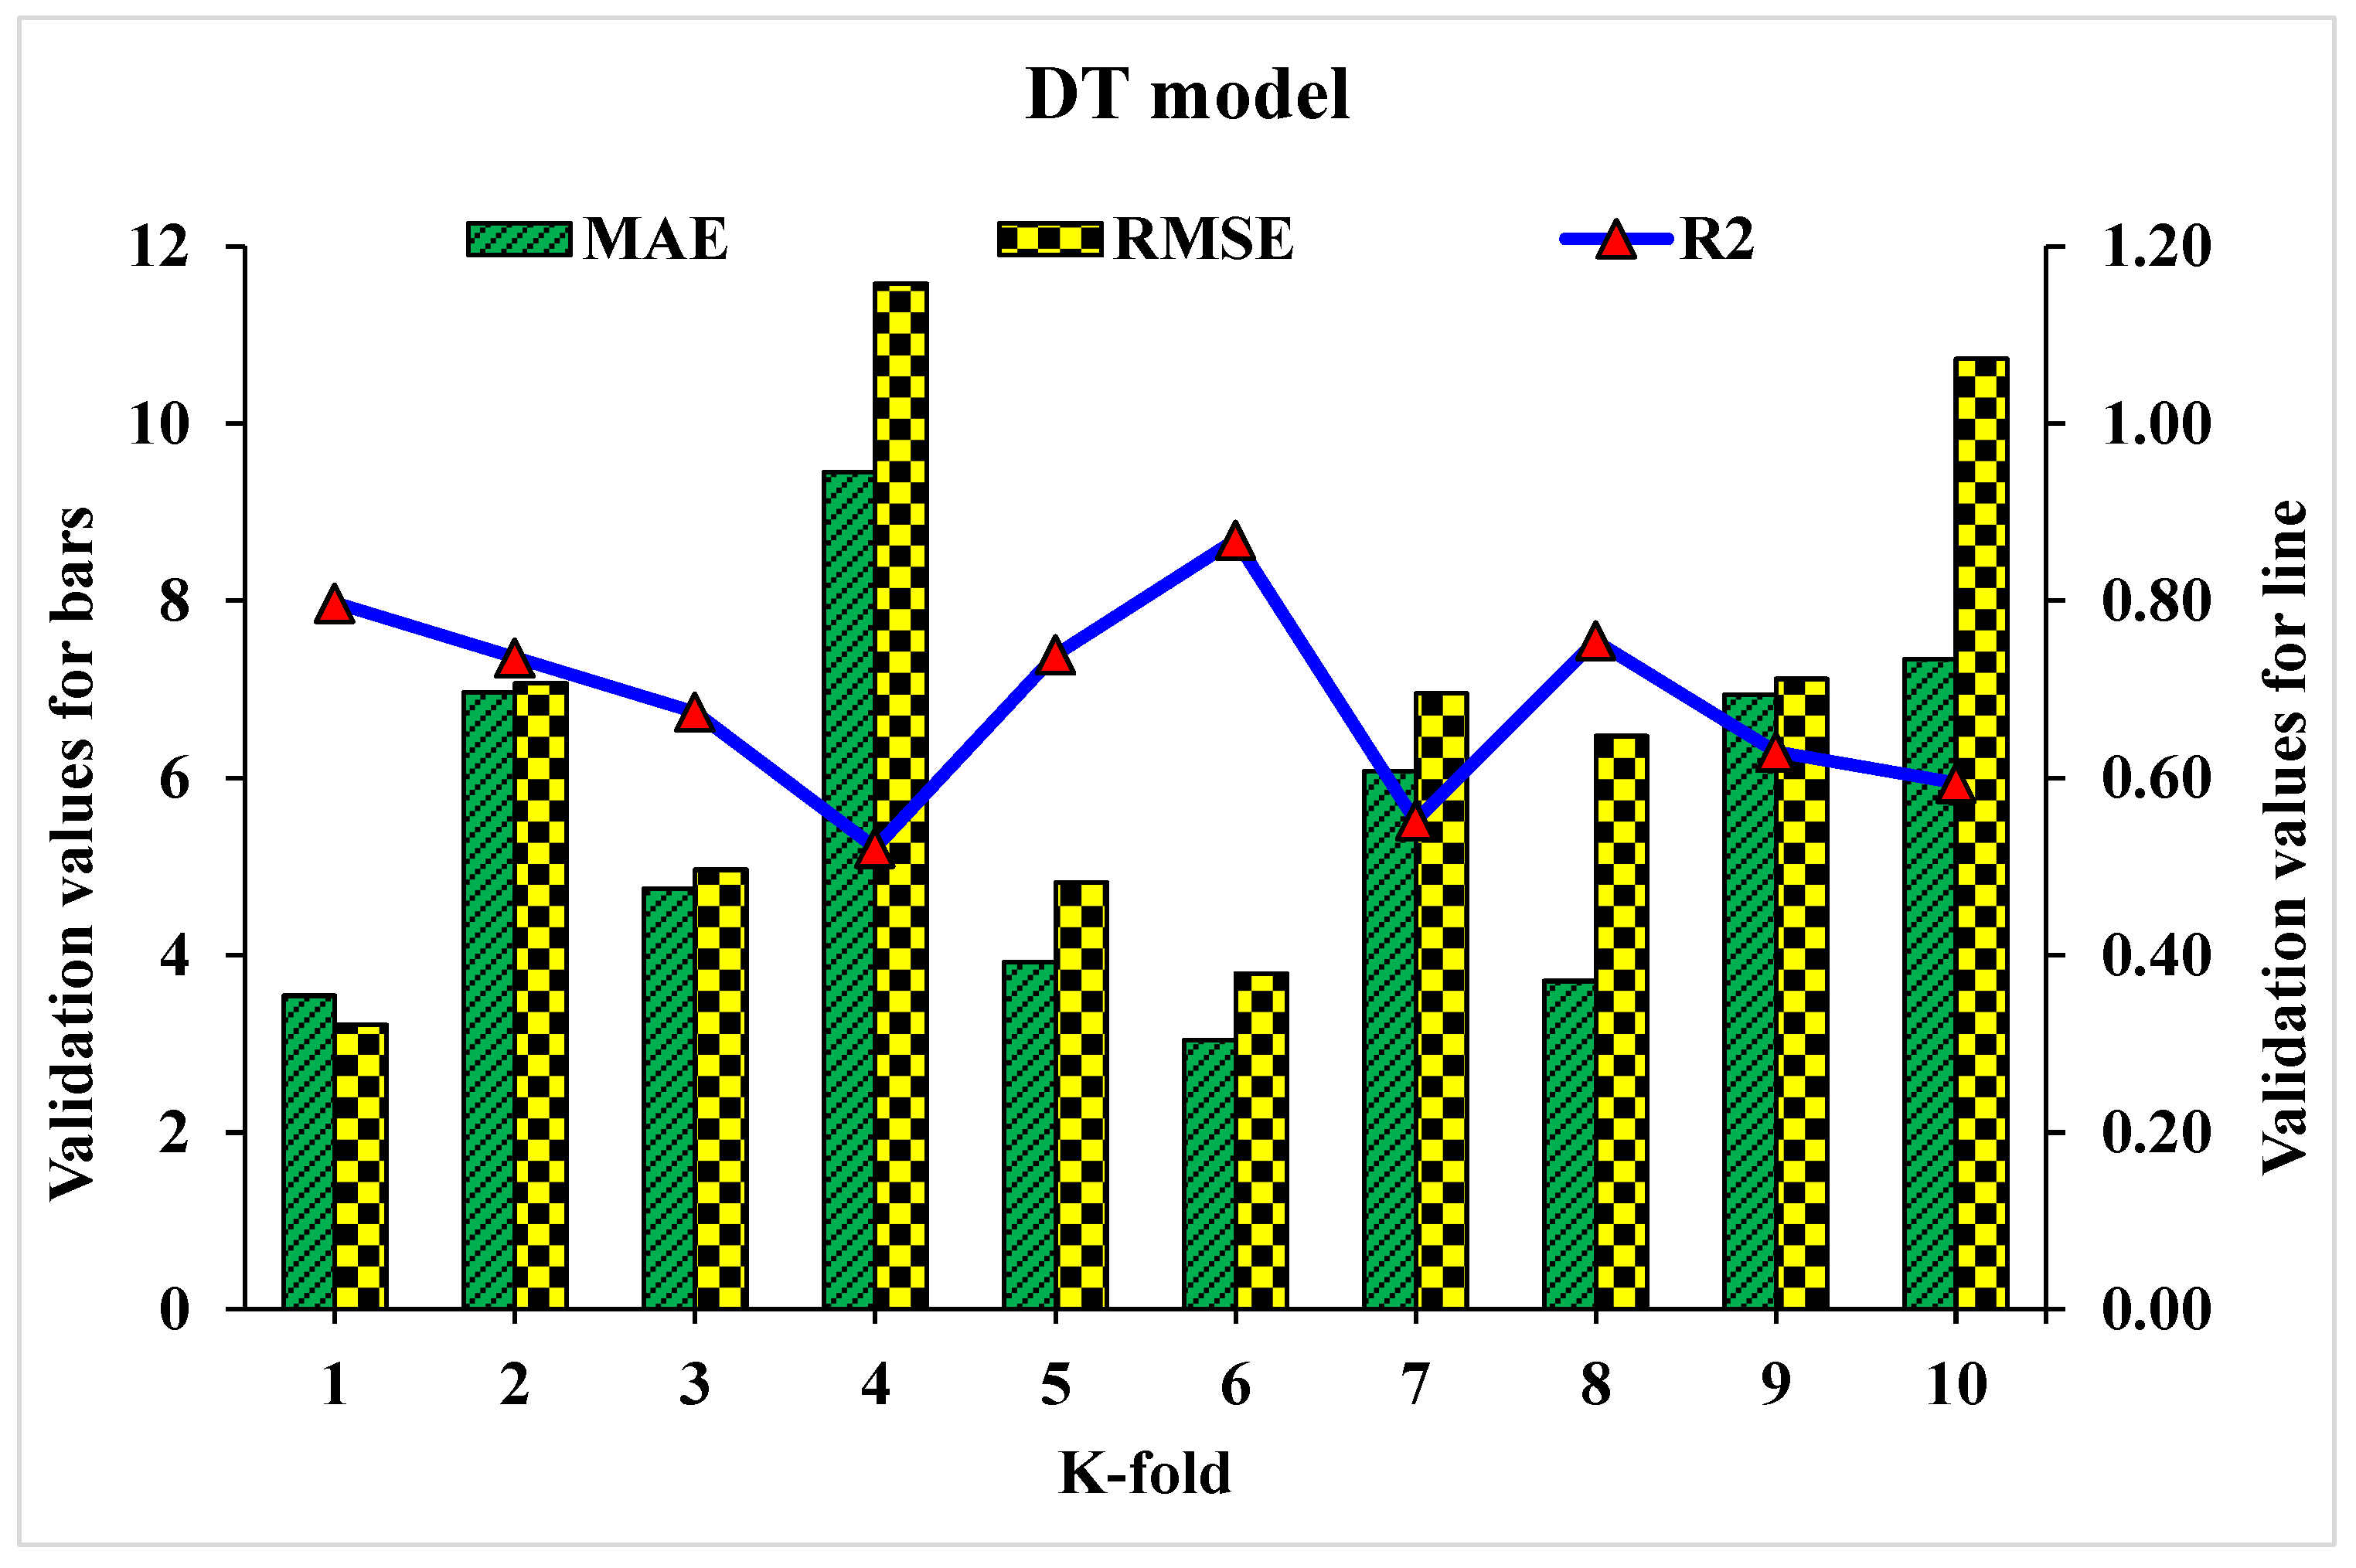
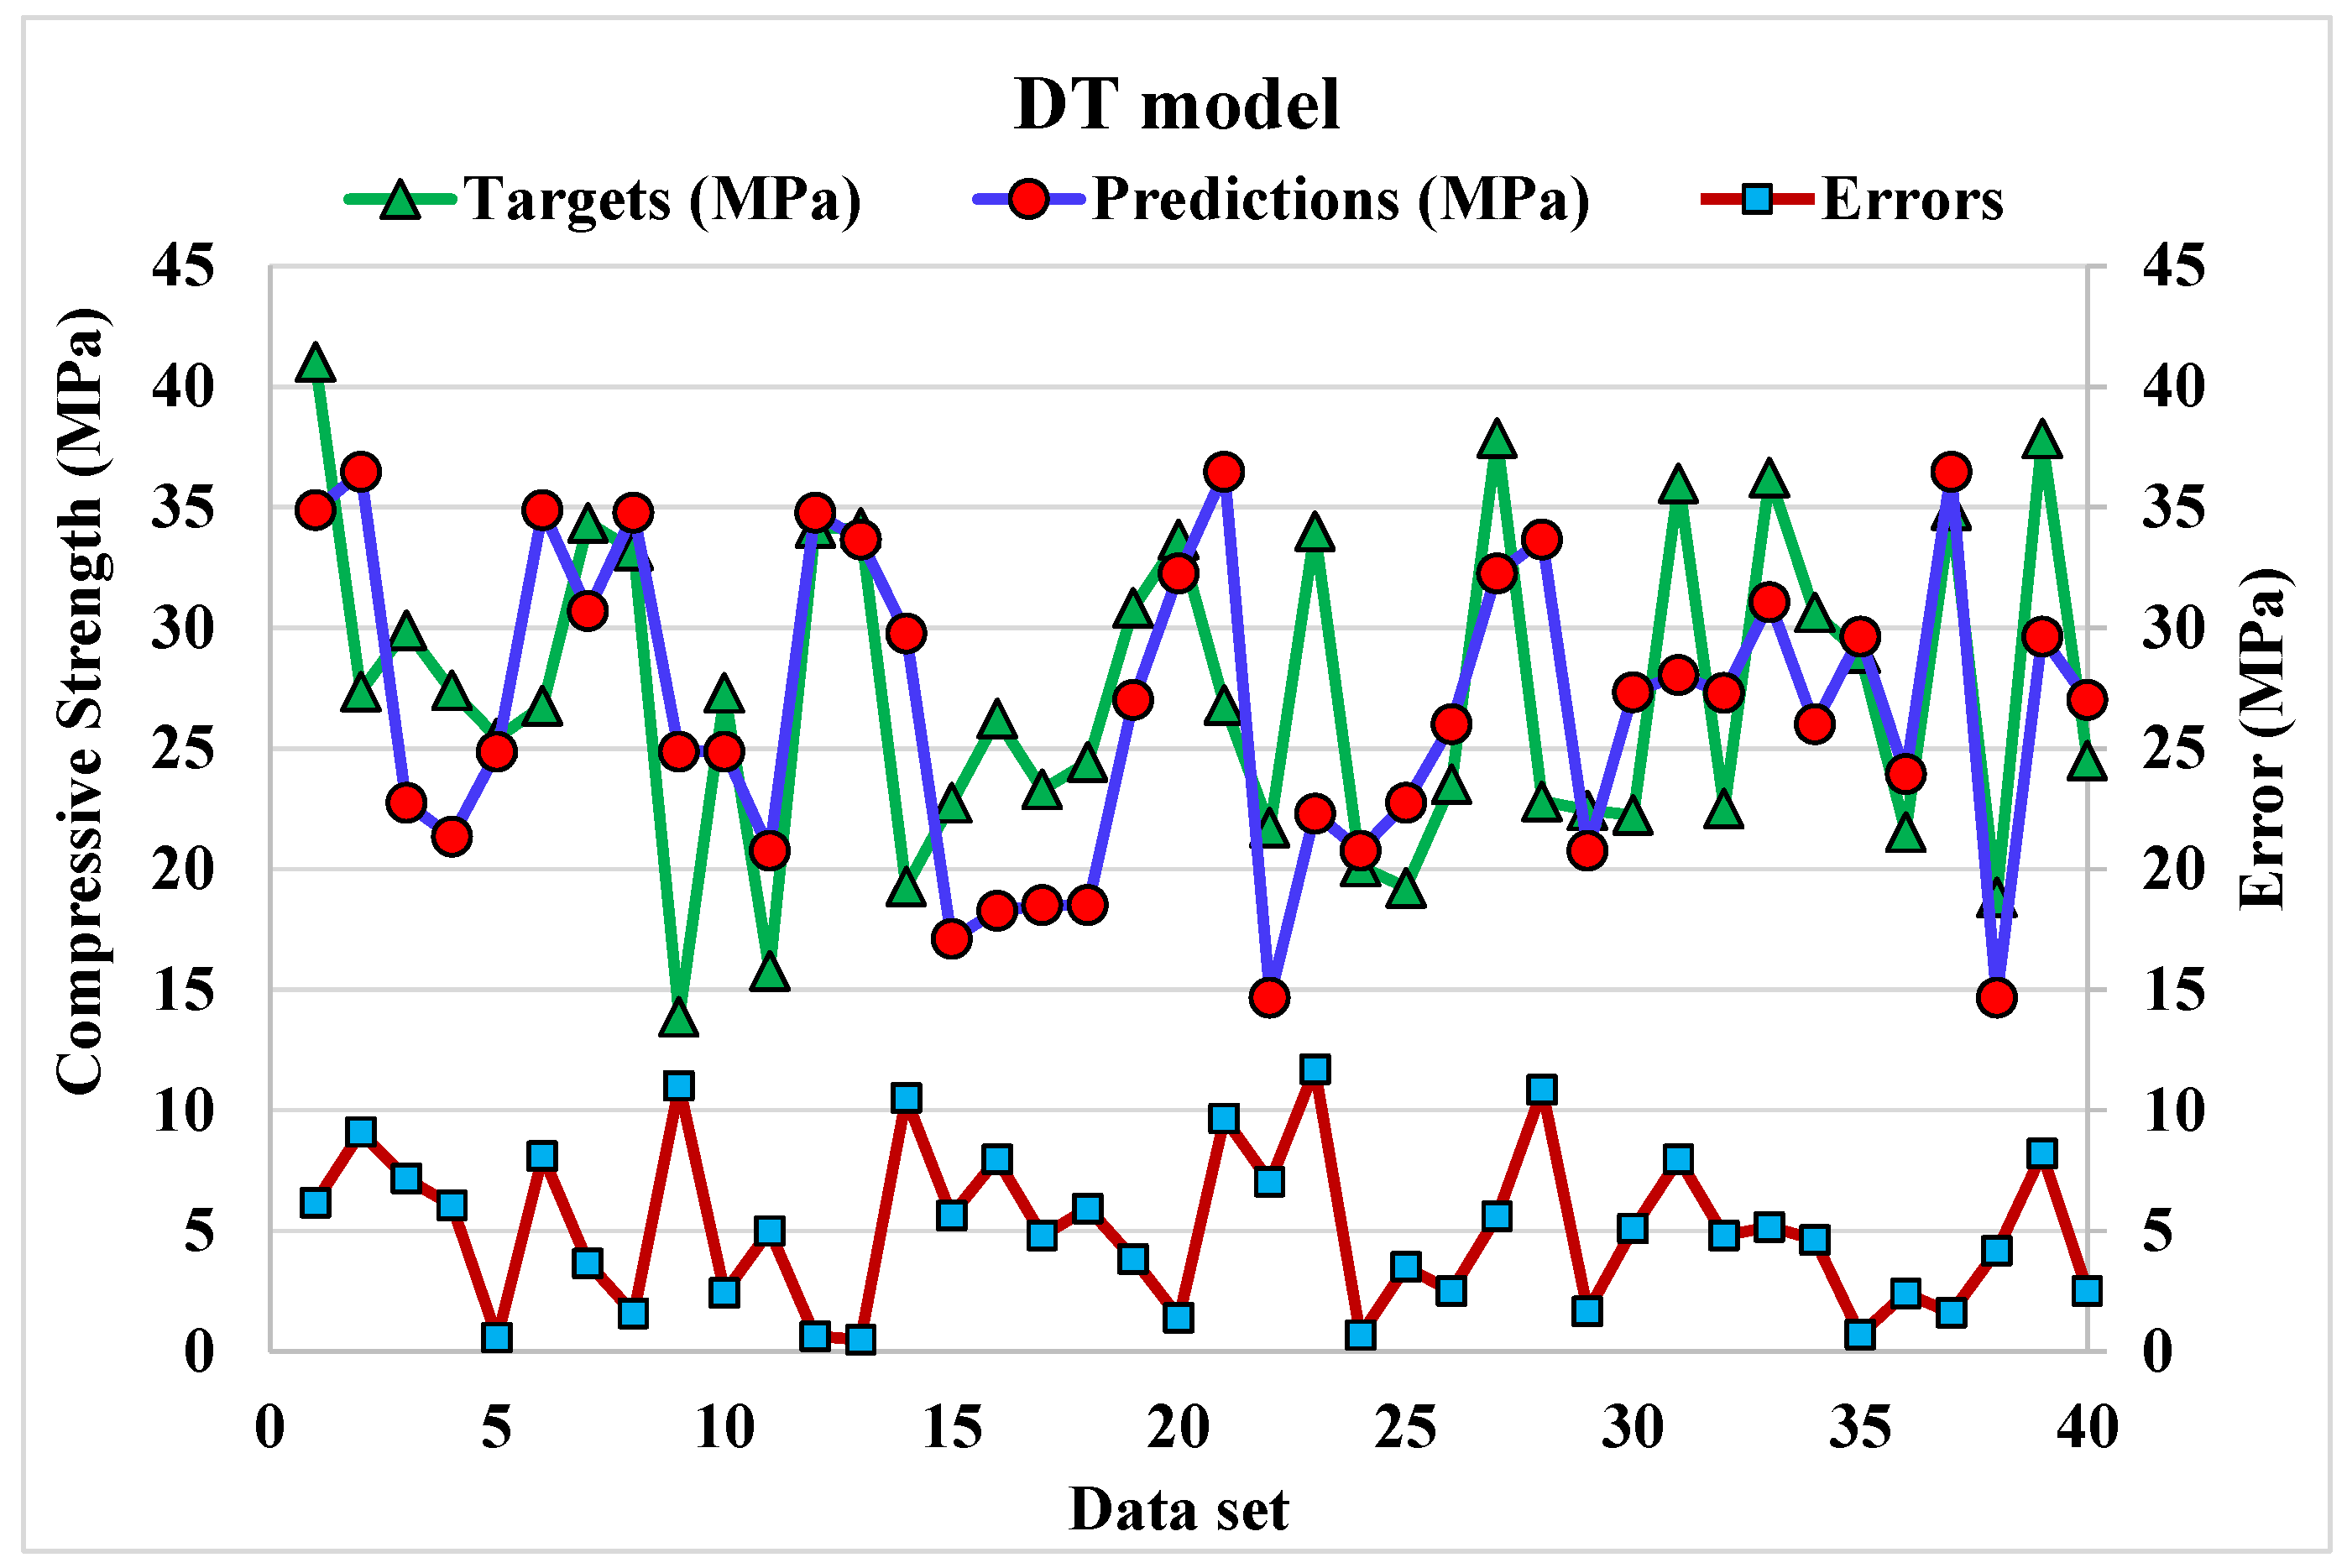
- Decision tree modelling
- ii.
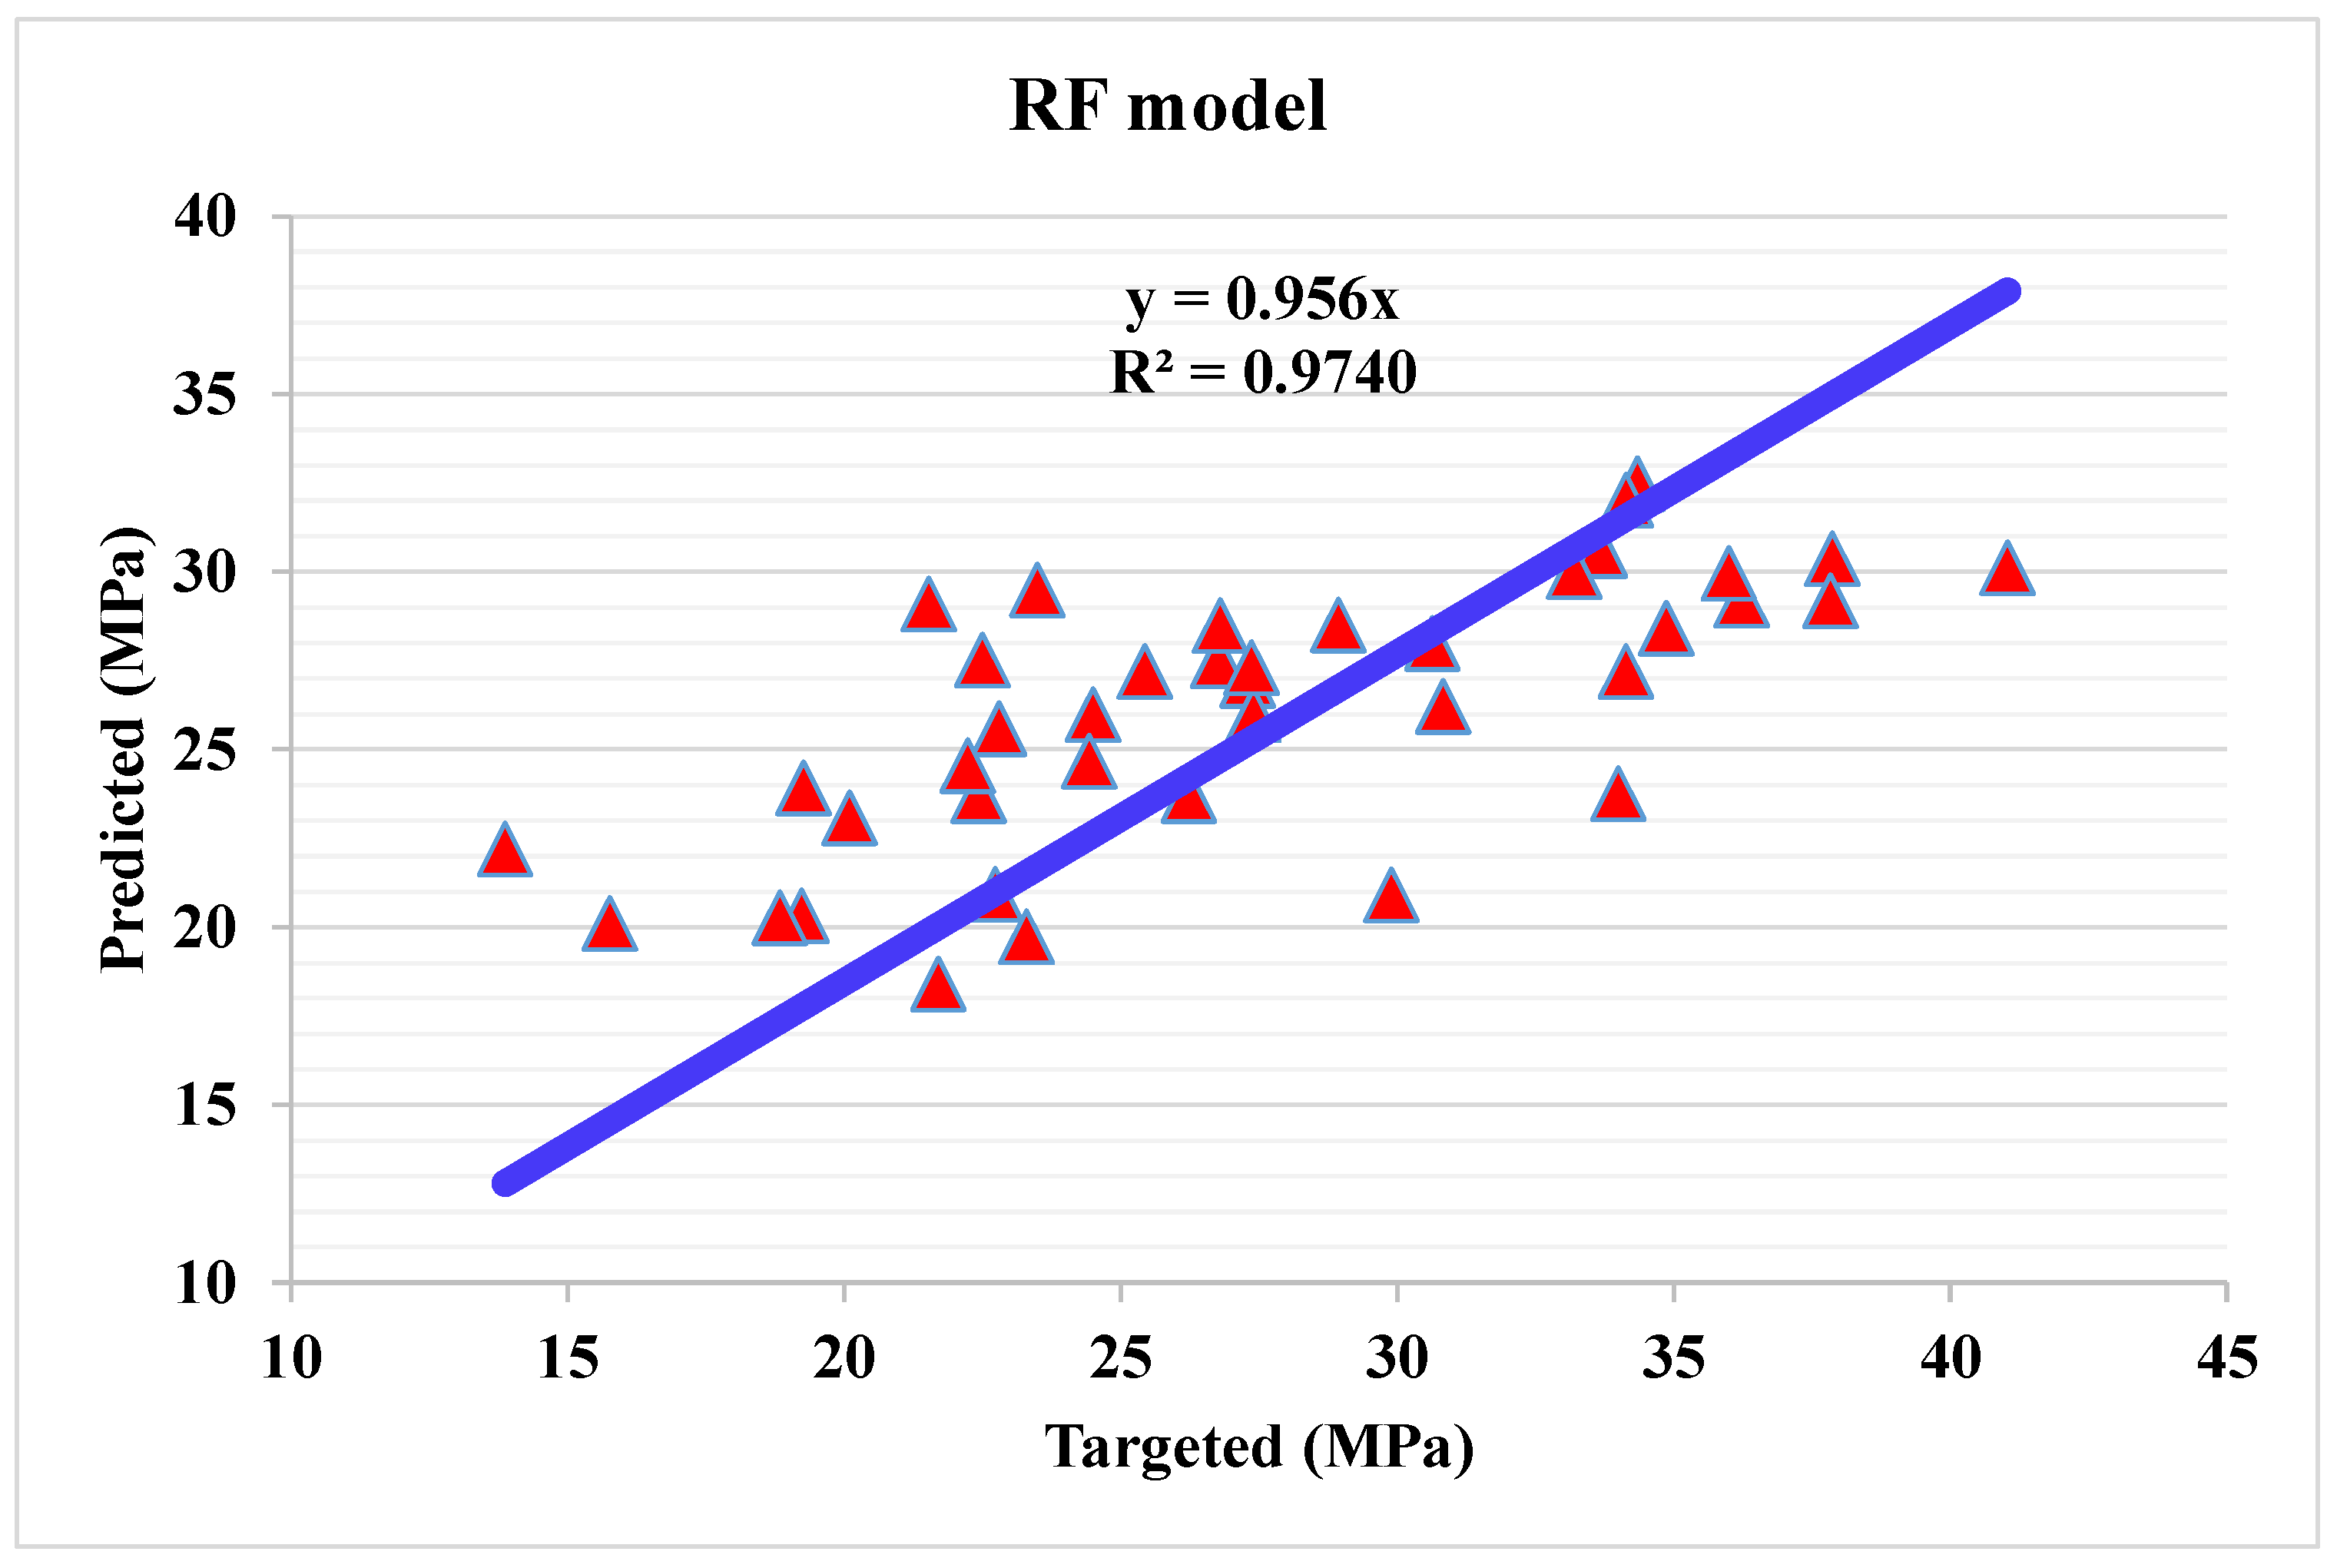
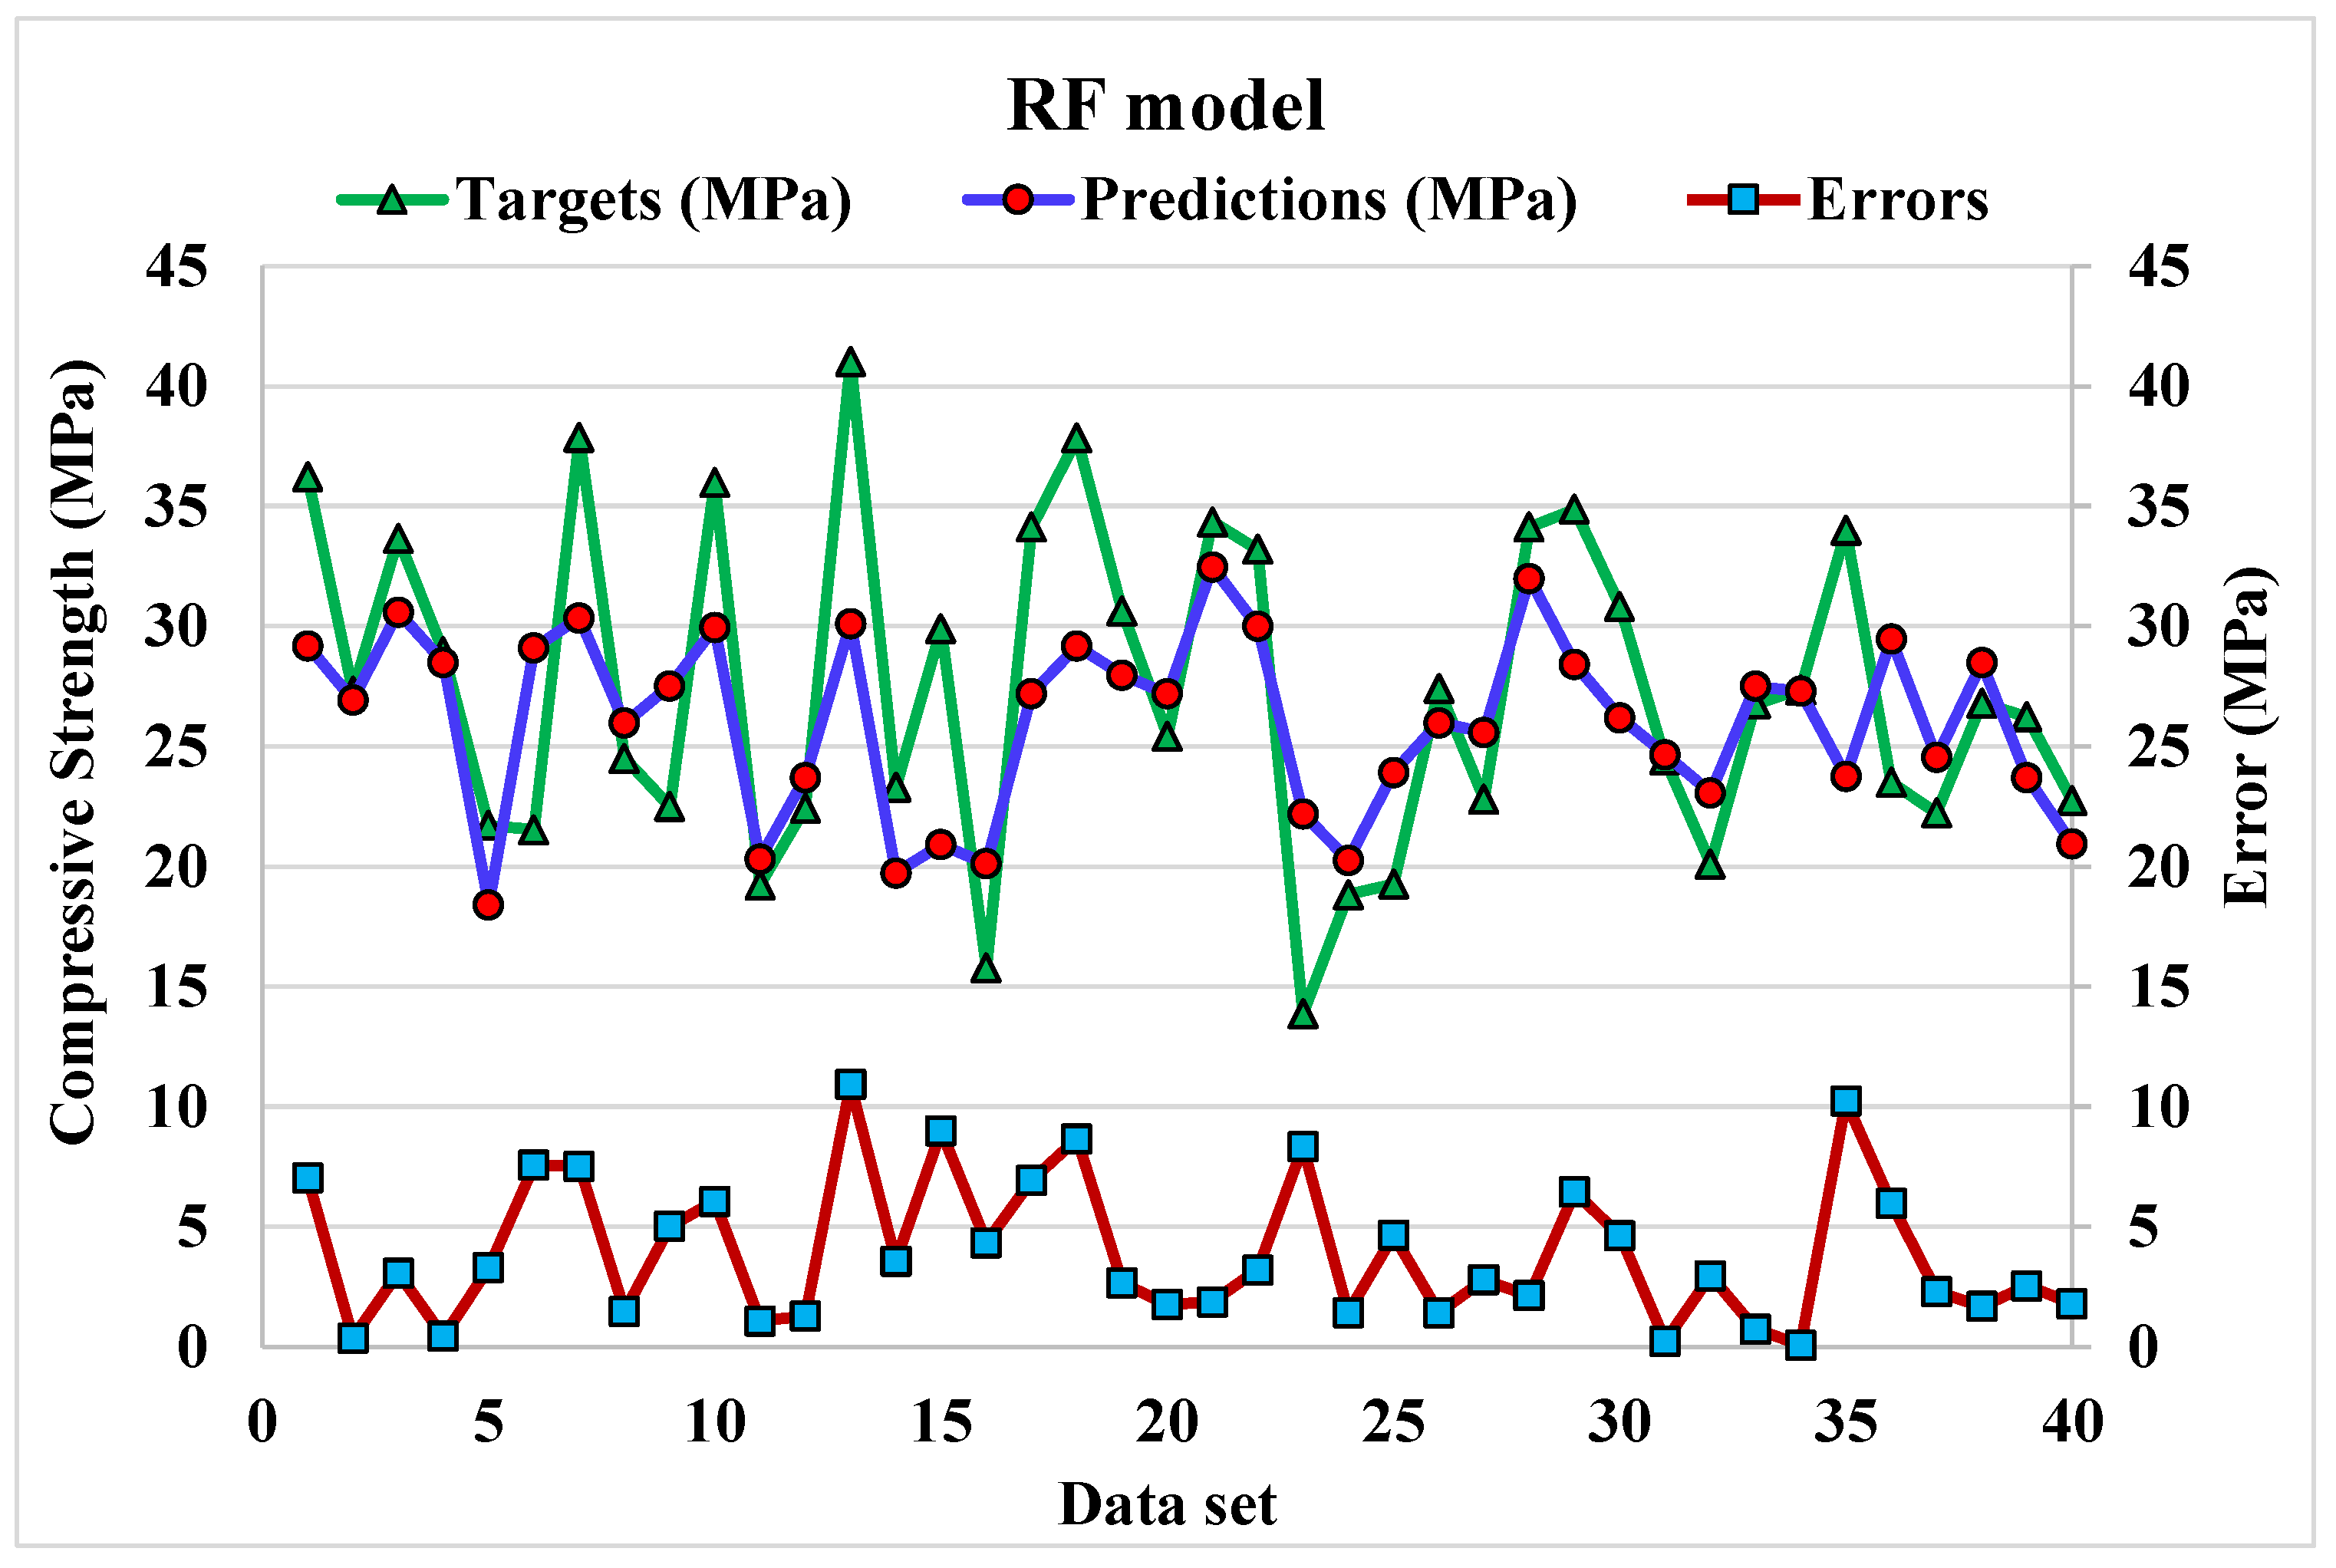
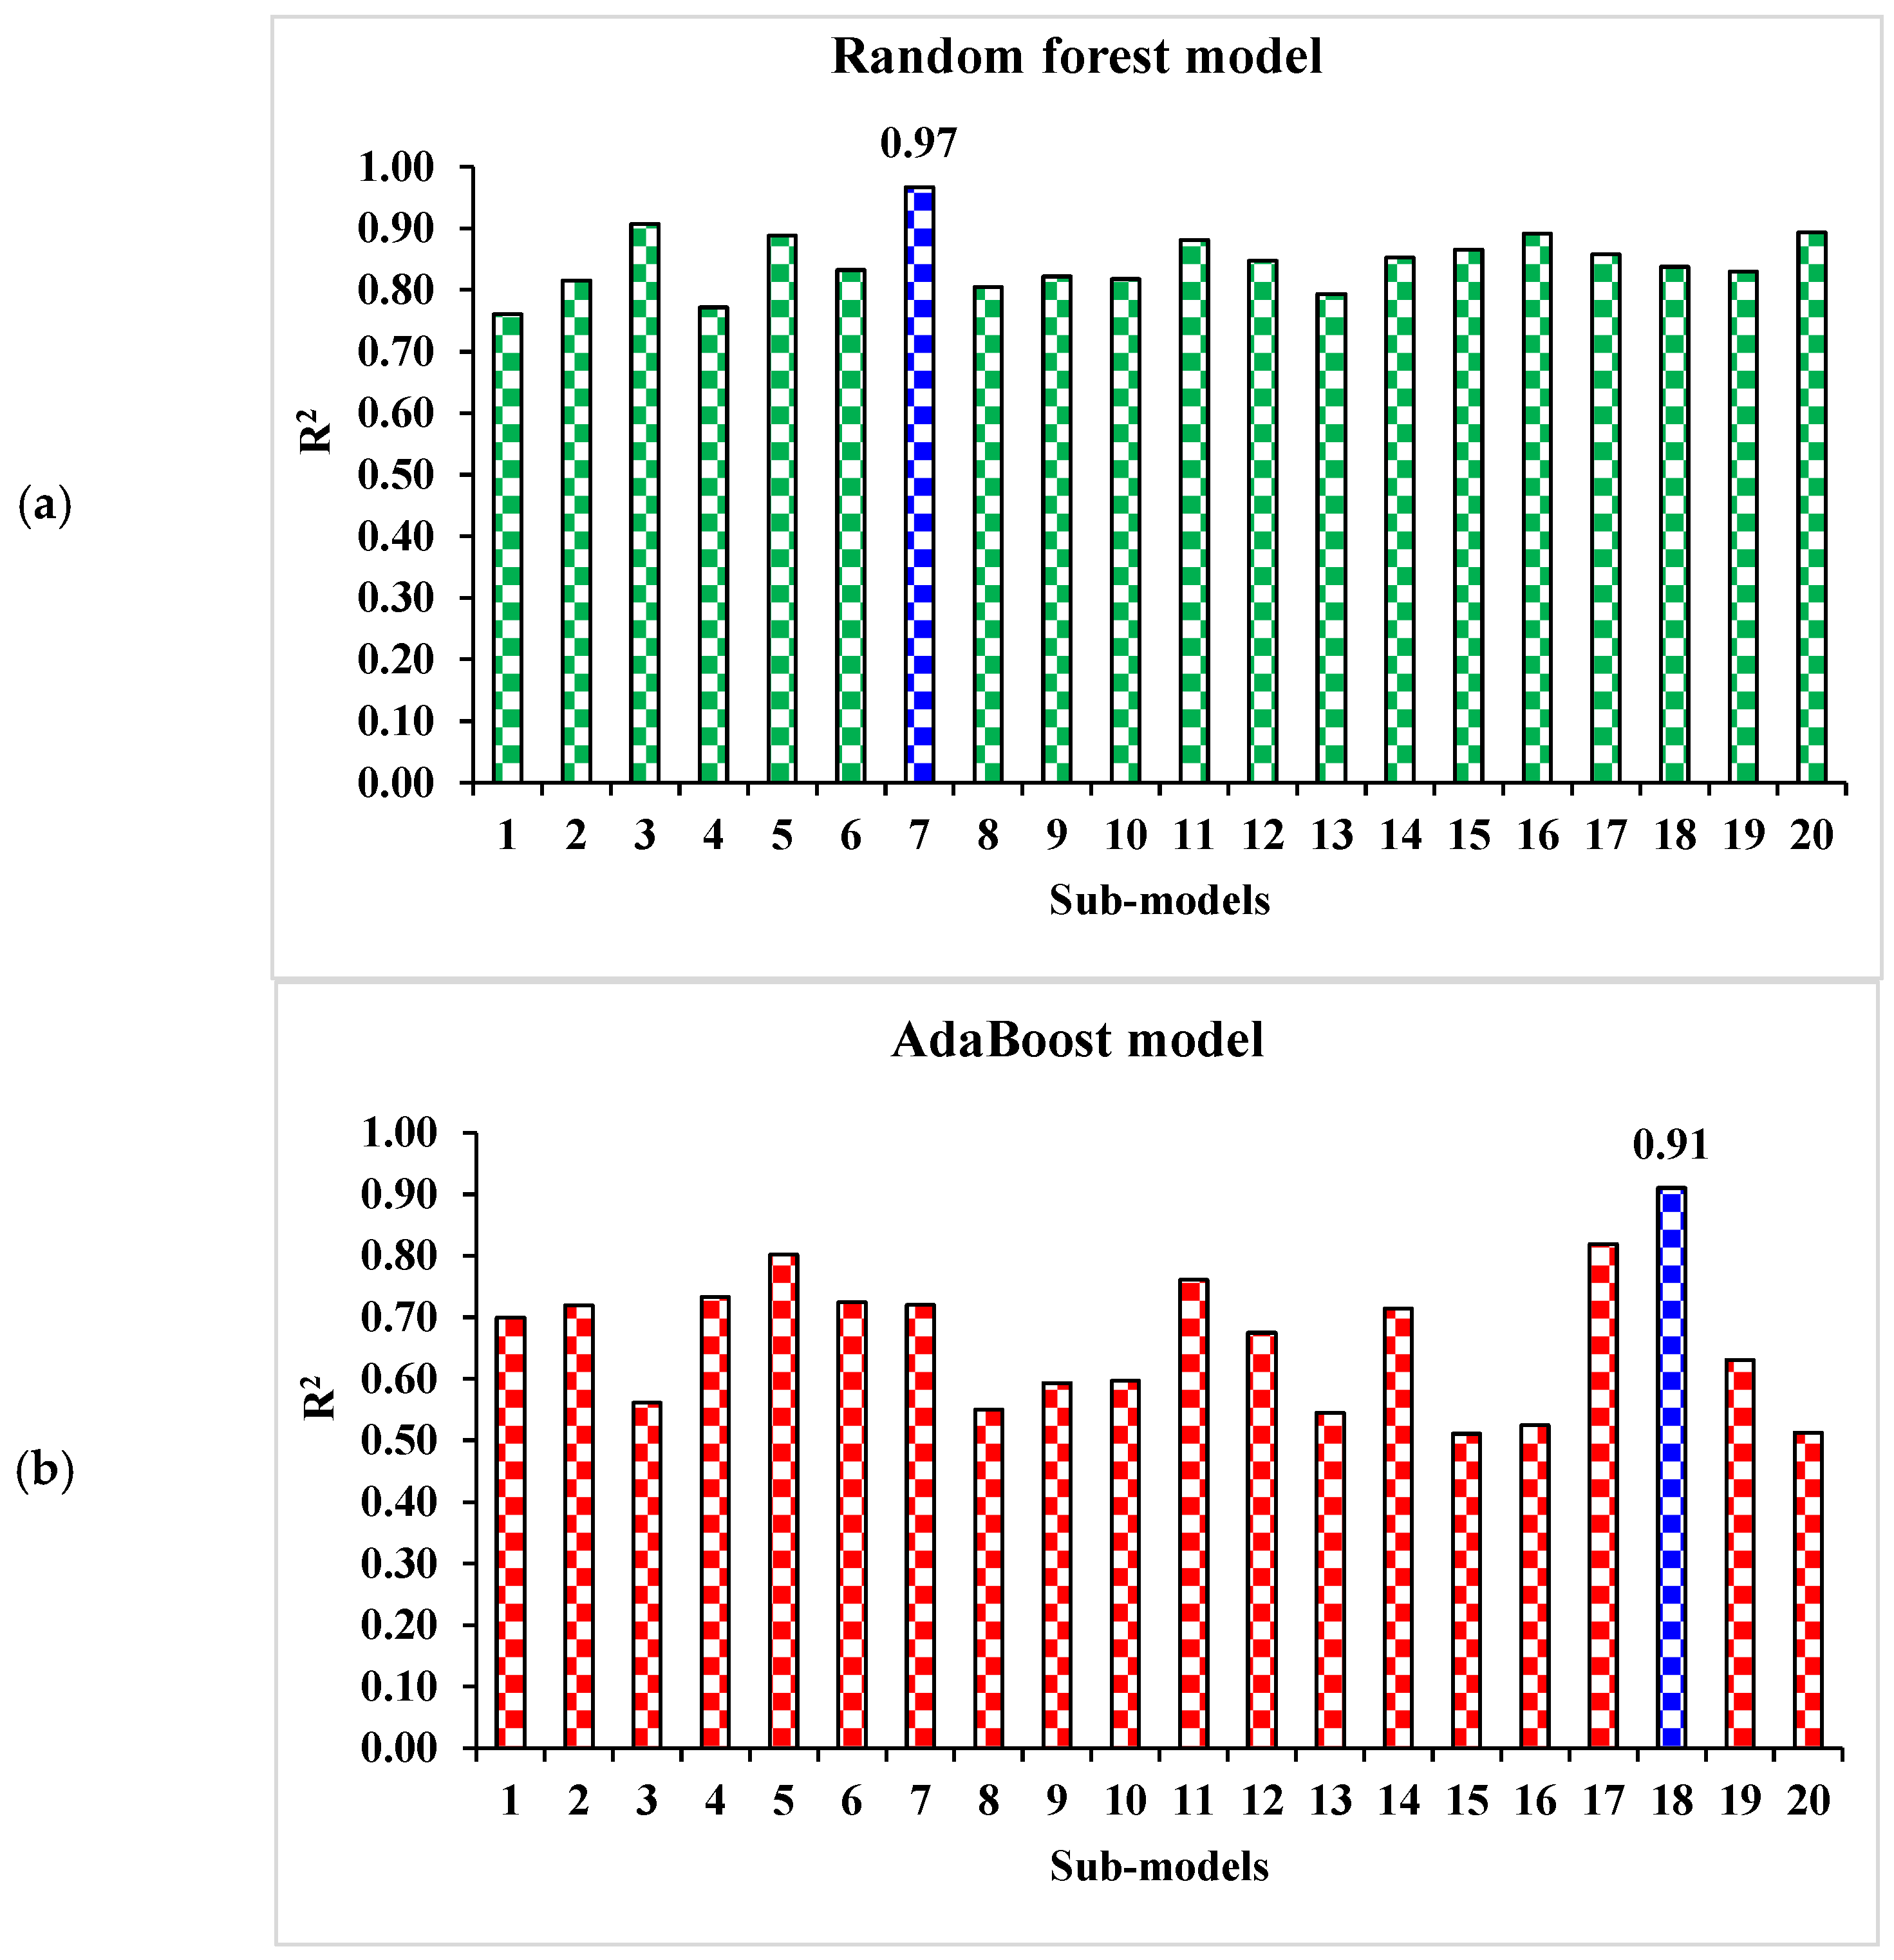
- Random forest modelling
- iii.
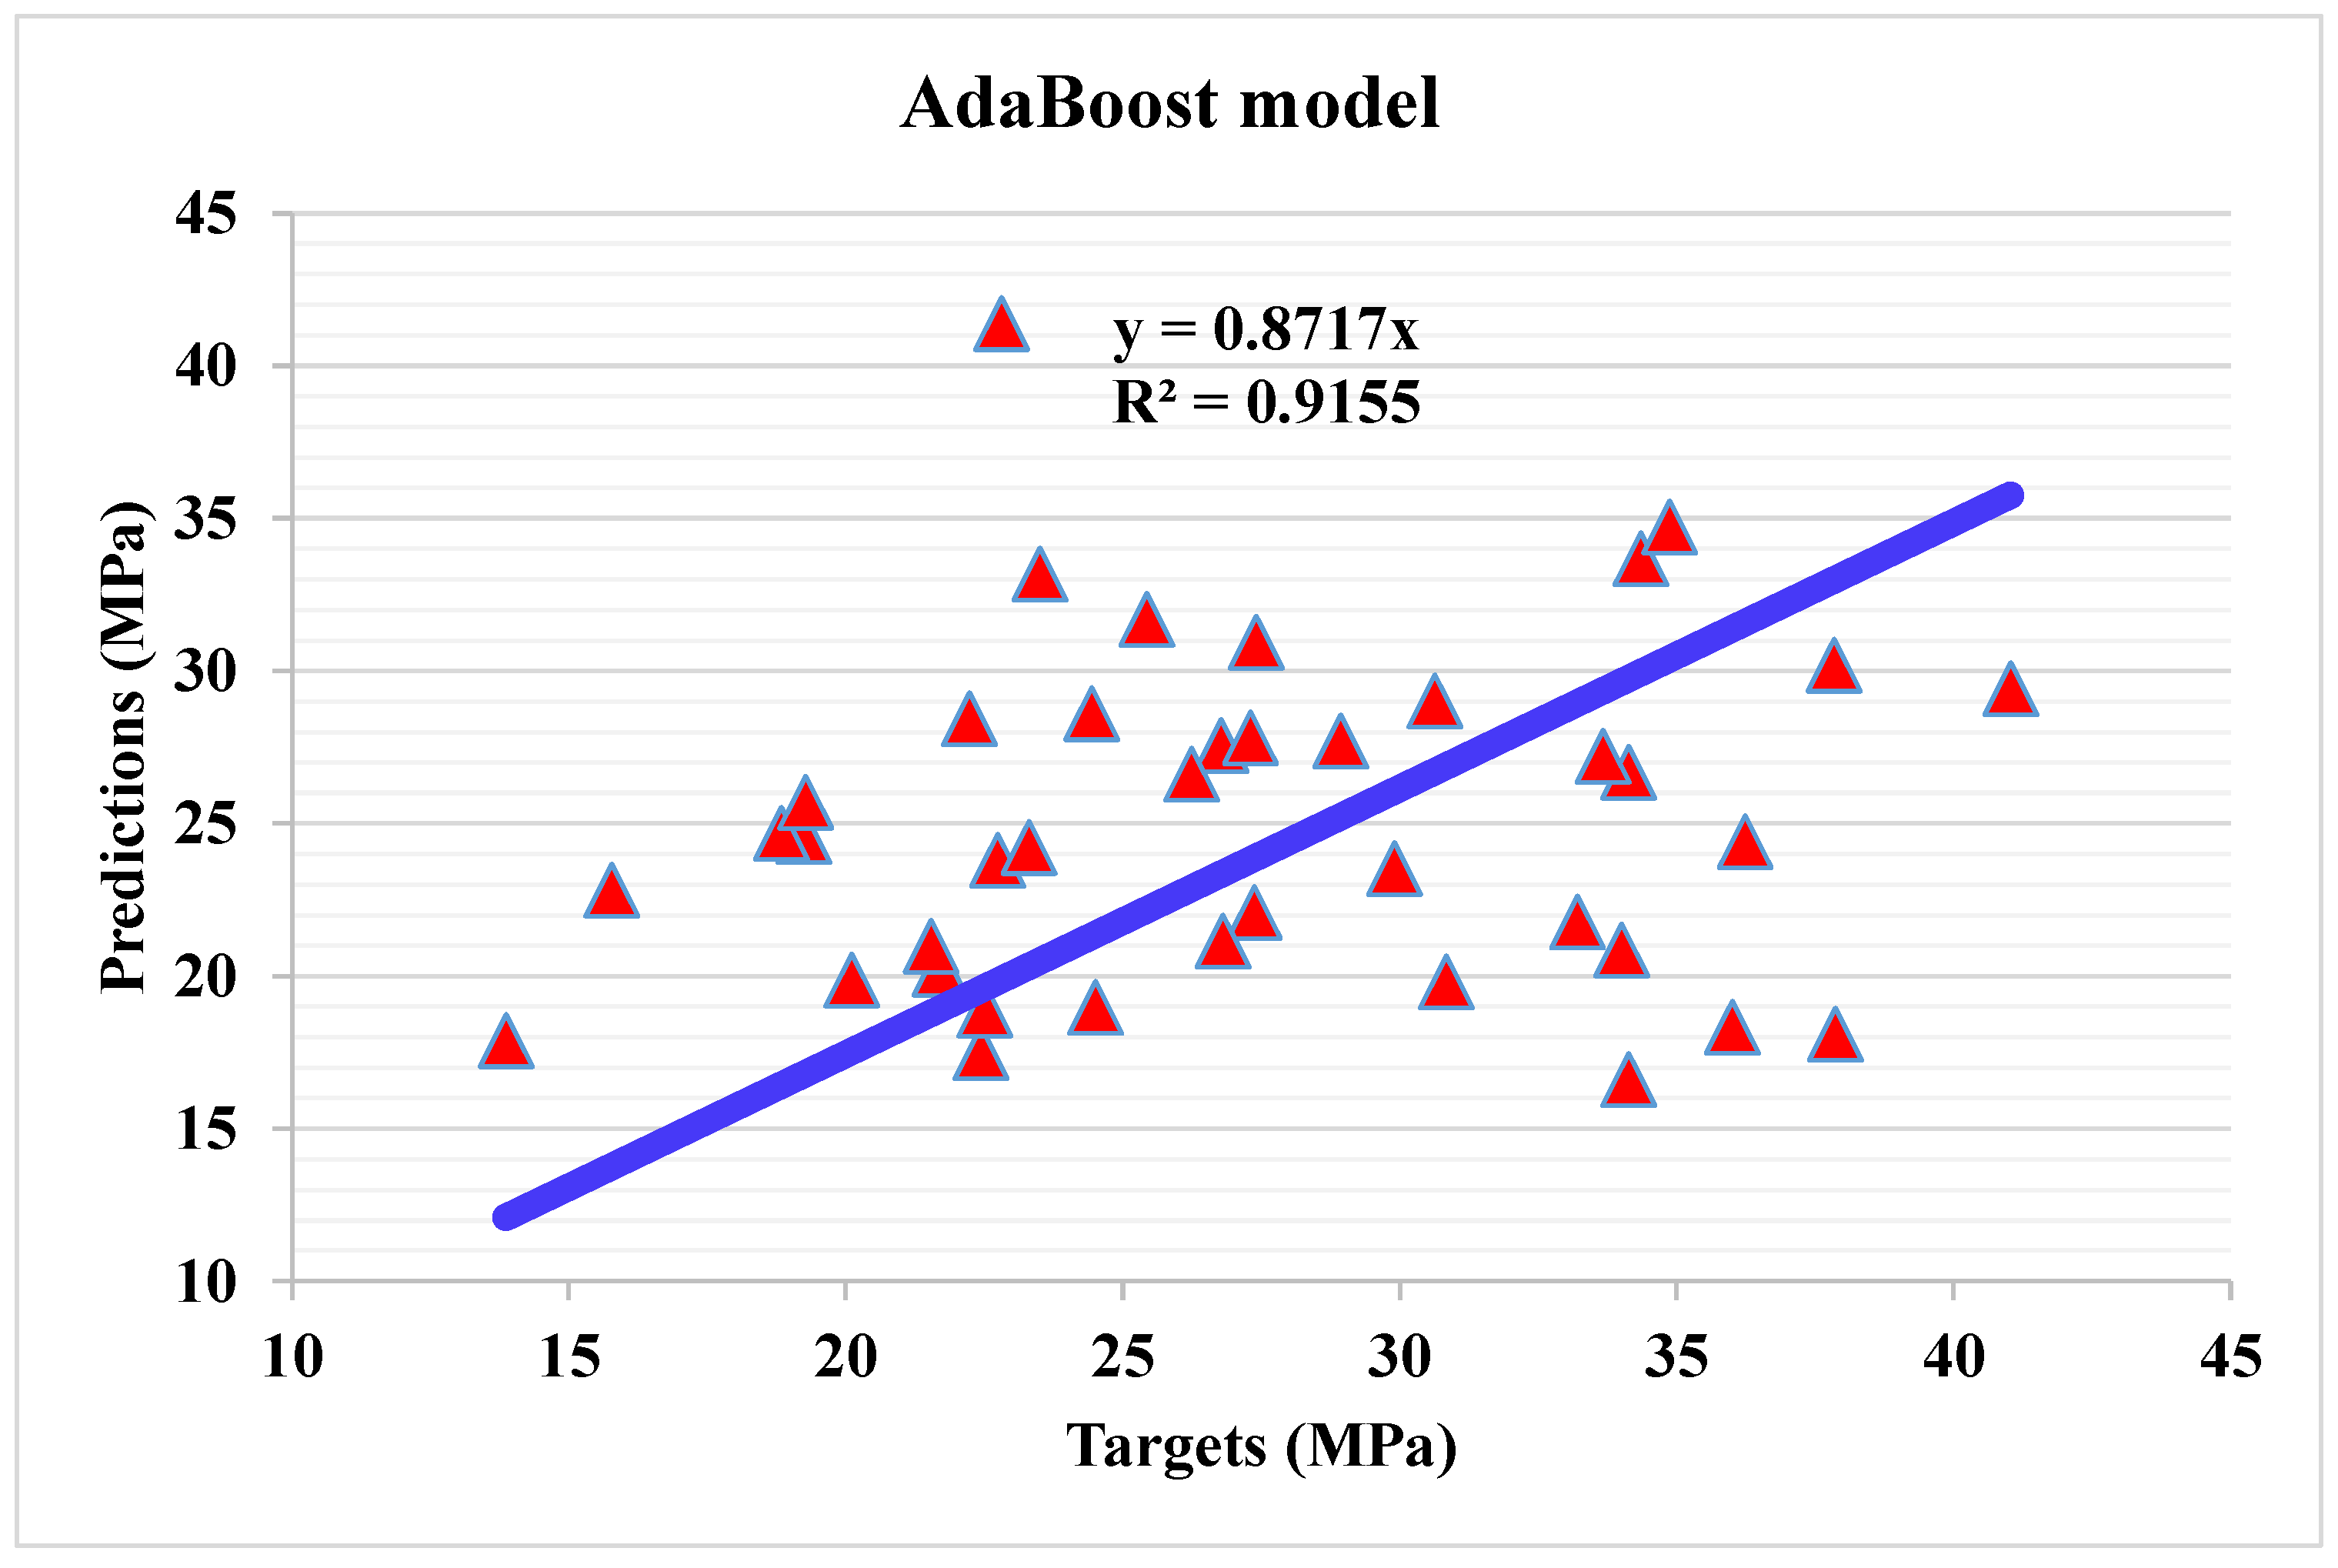
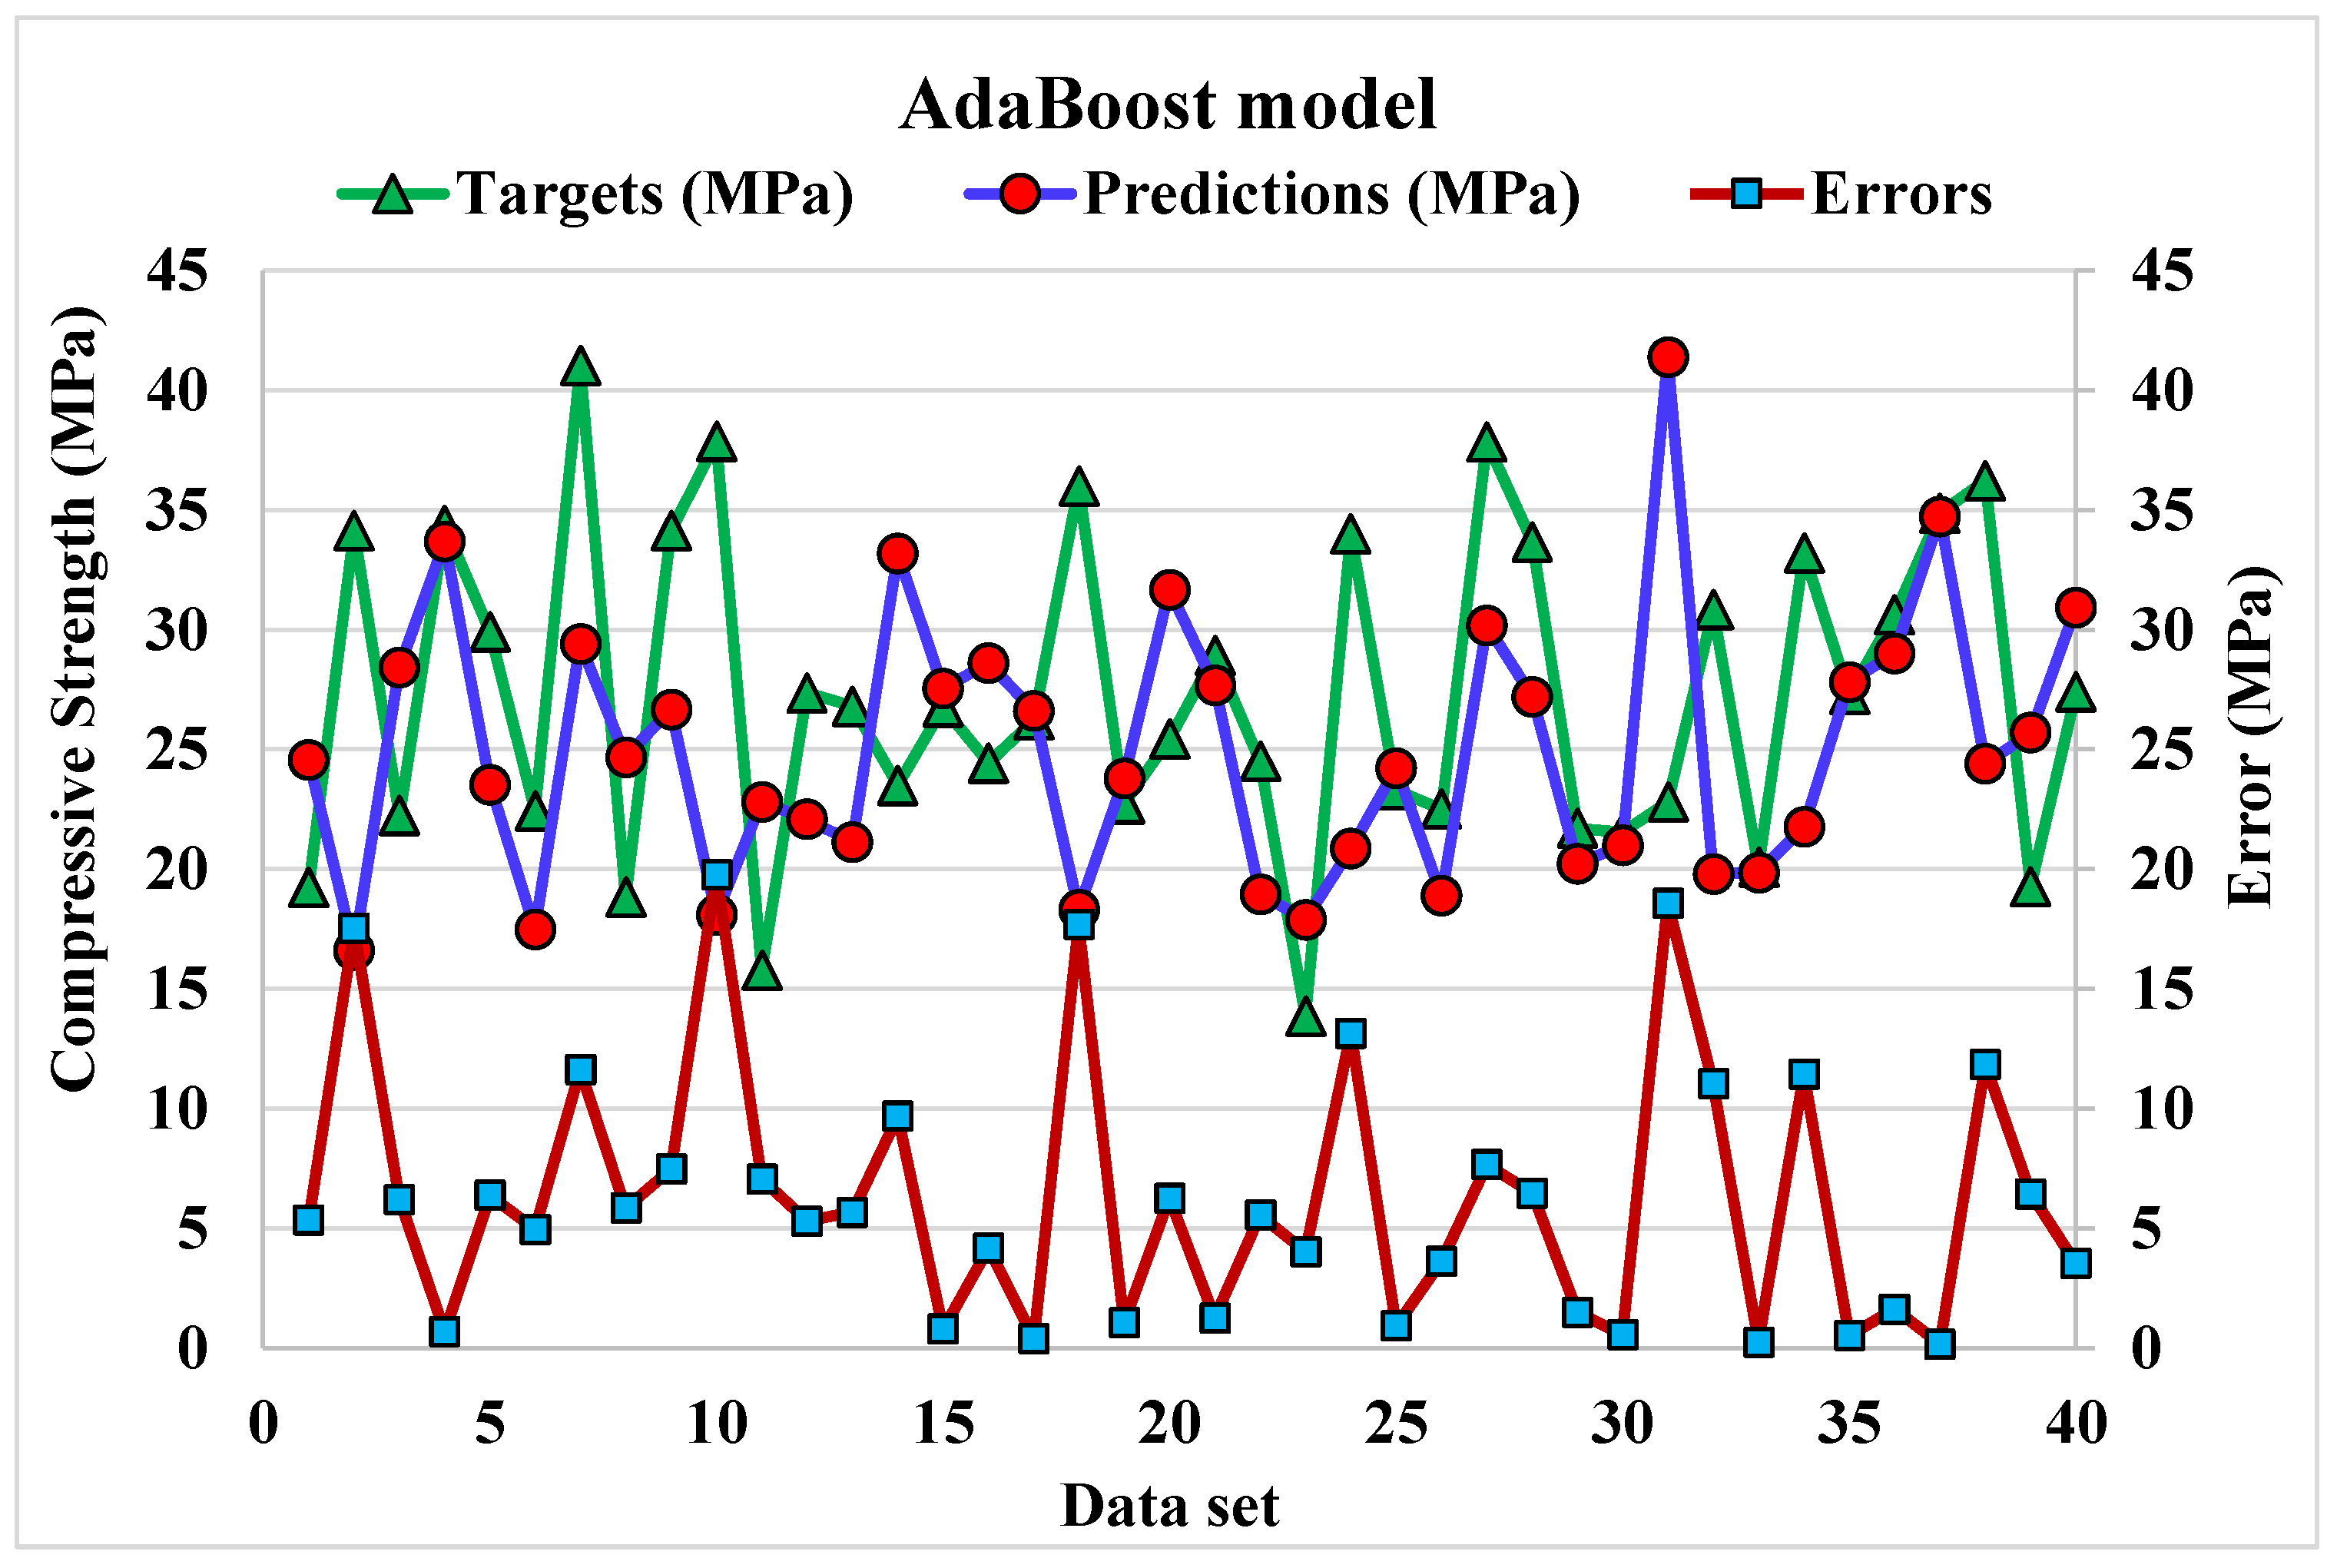
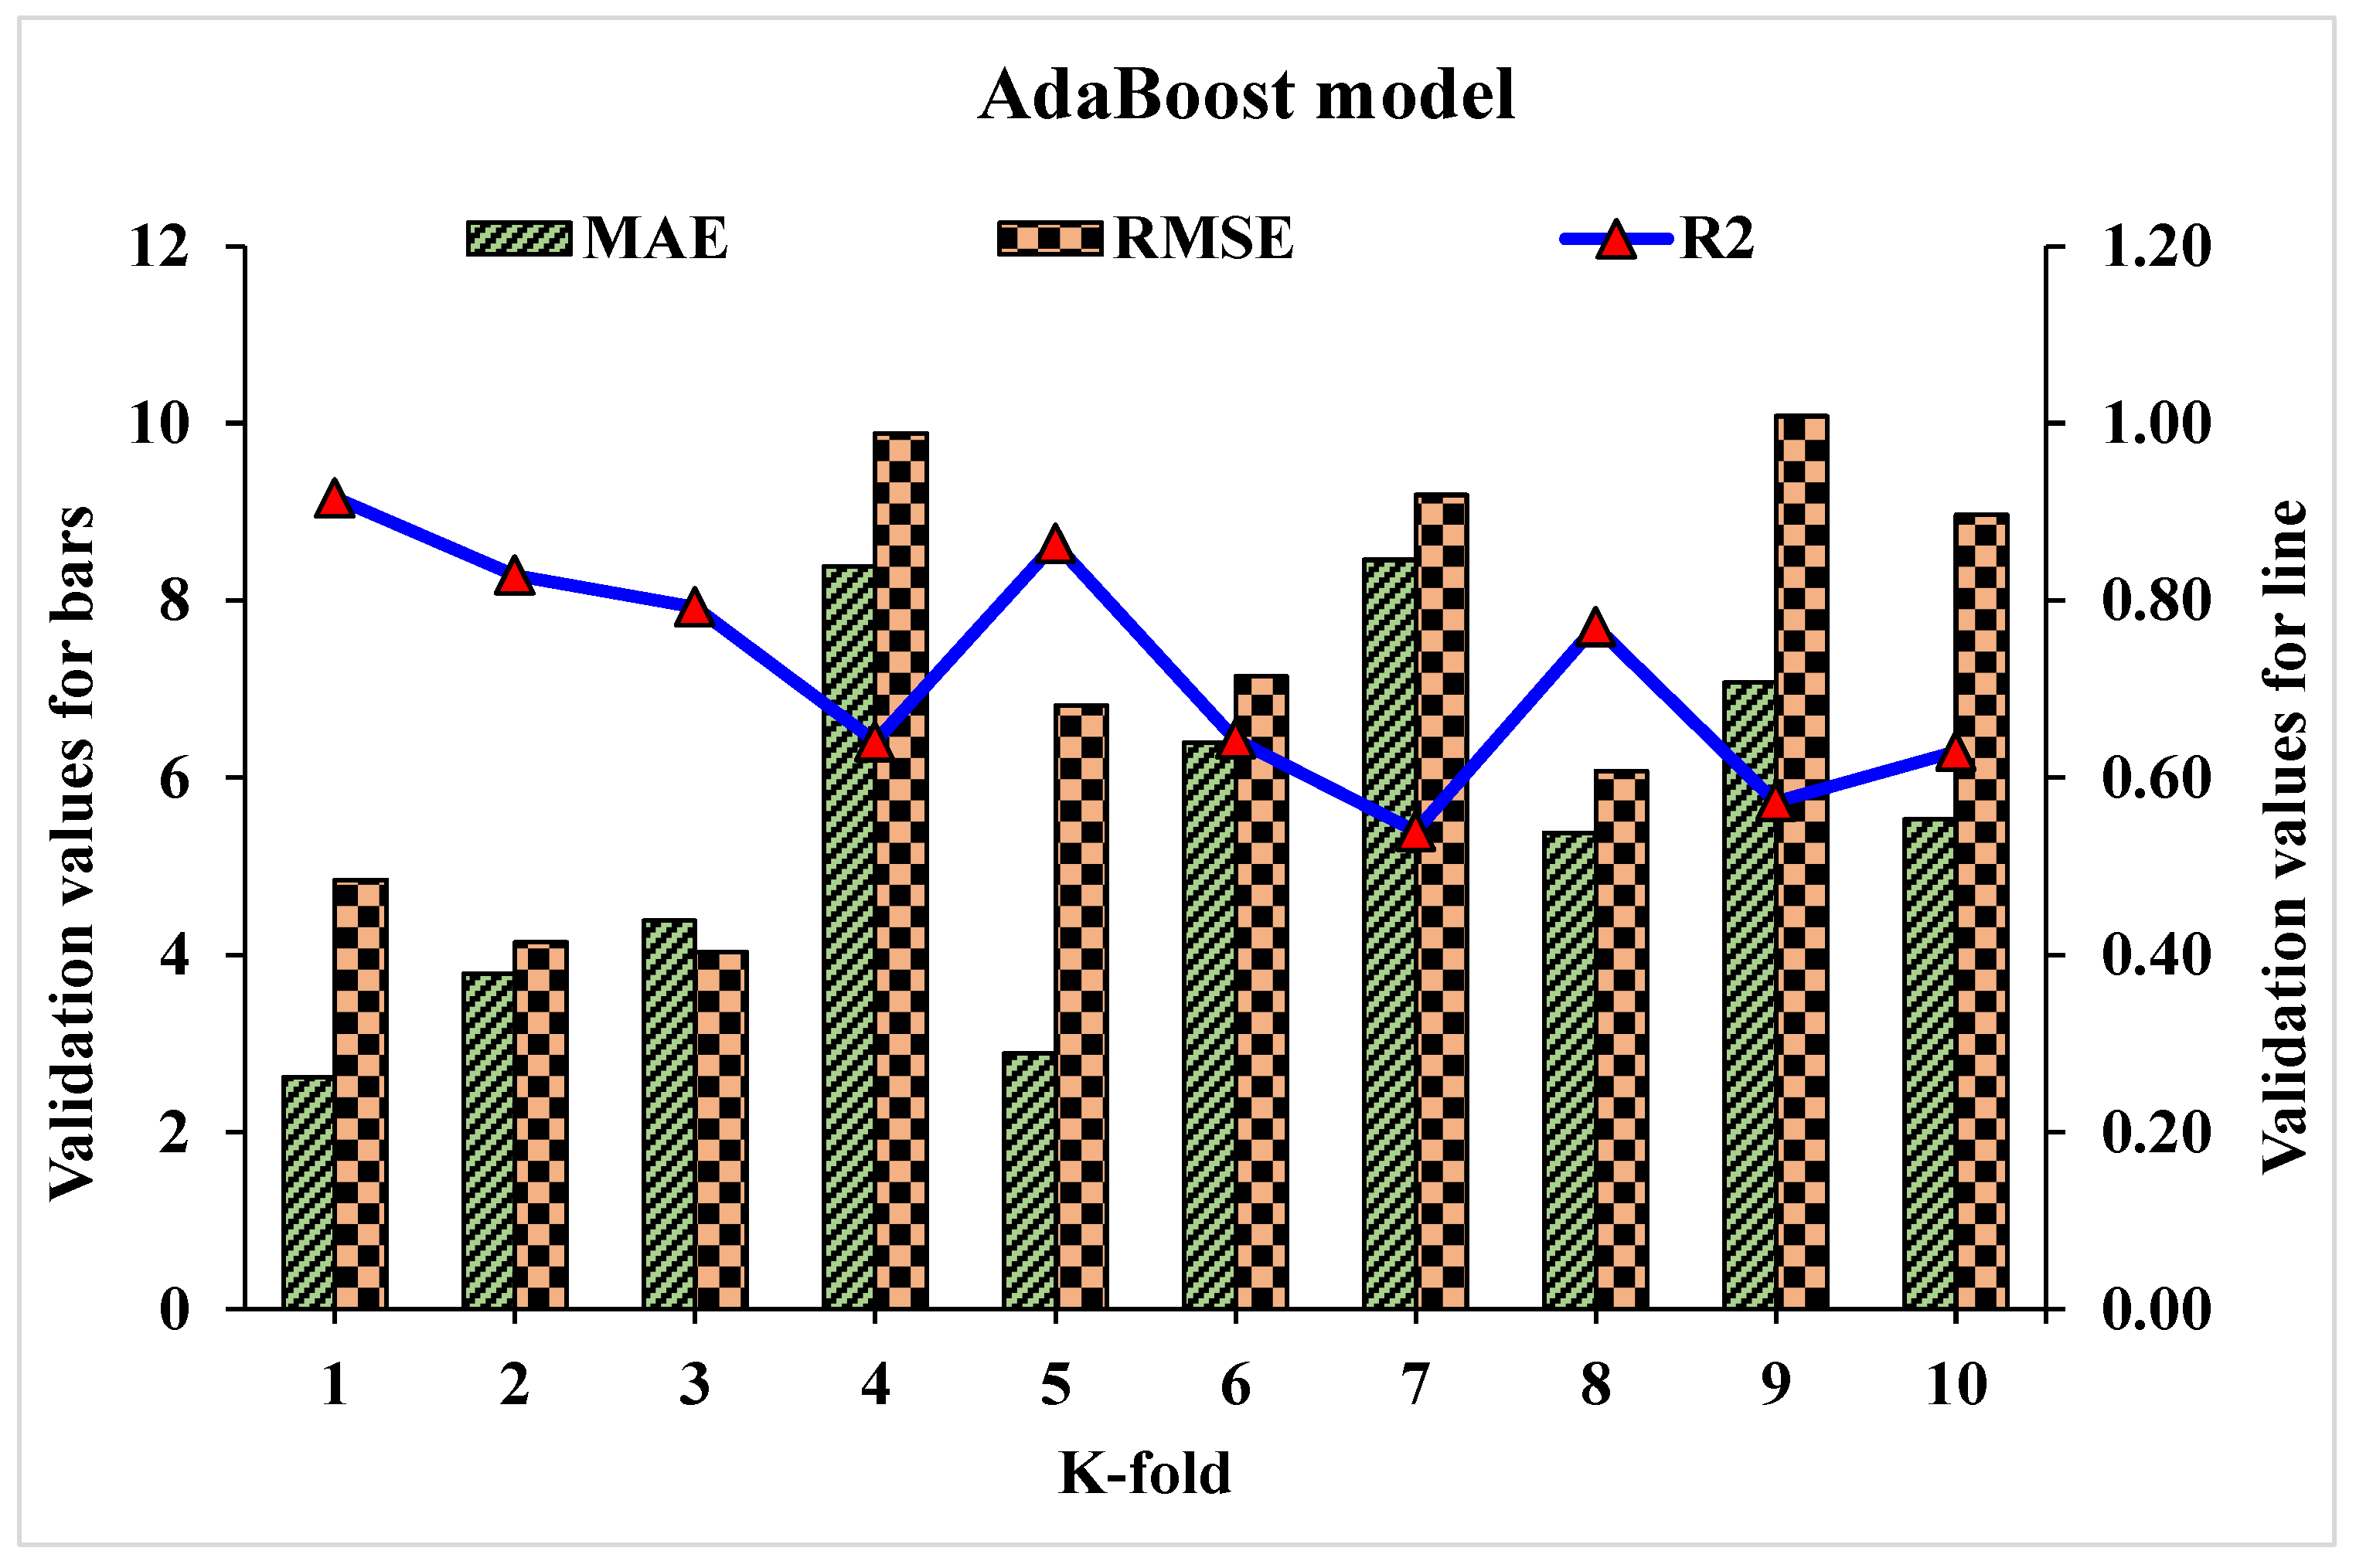
- AdaBoost modelling
- iv.
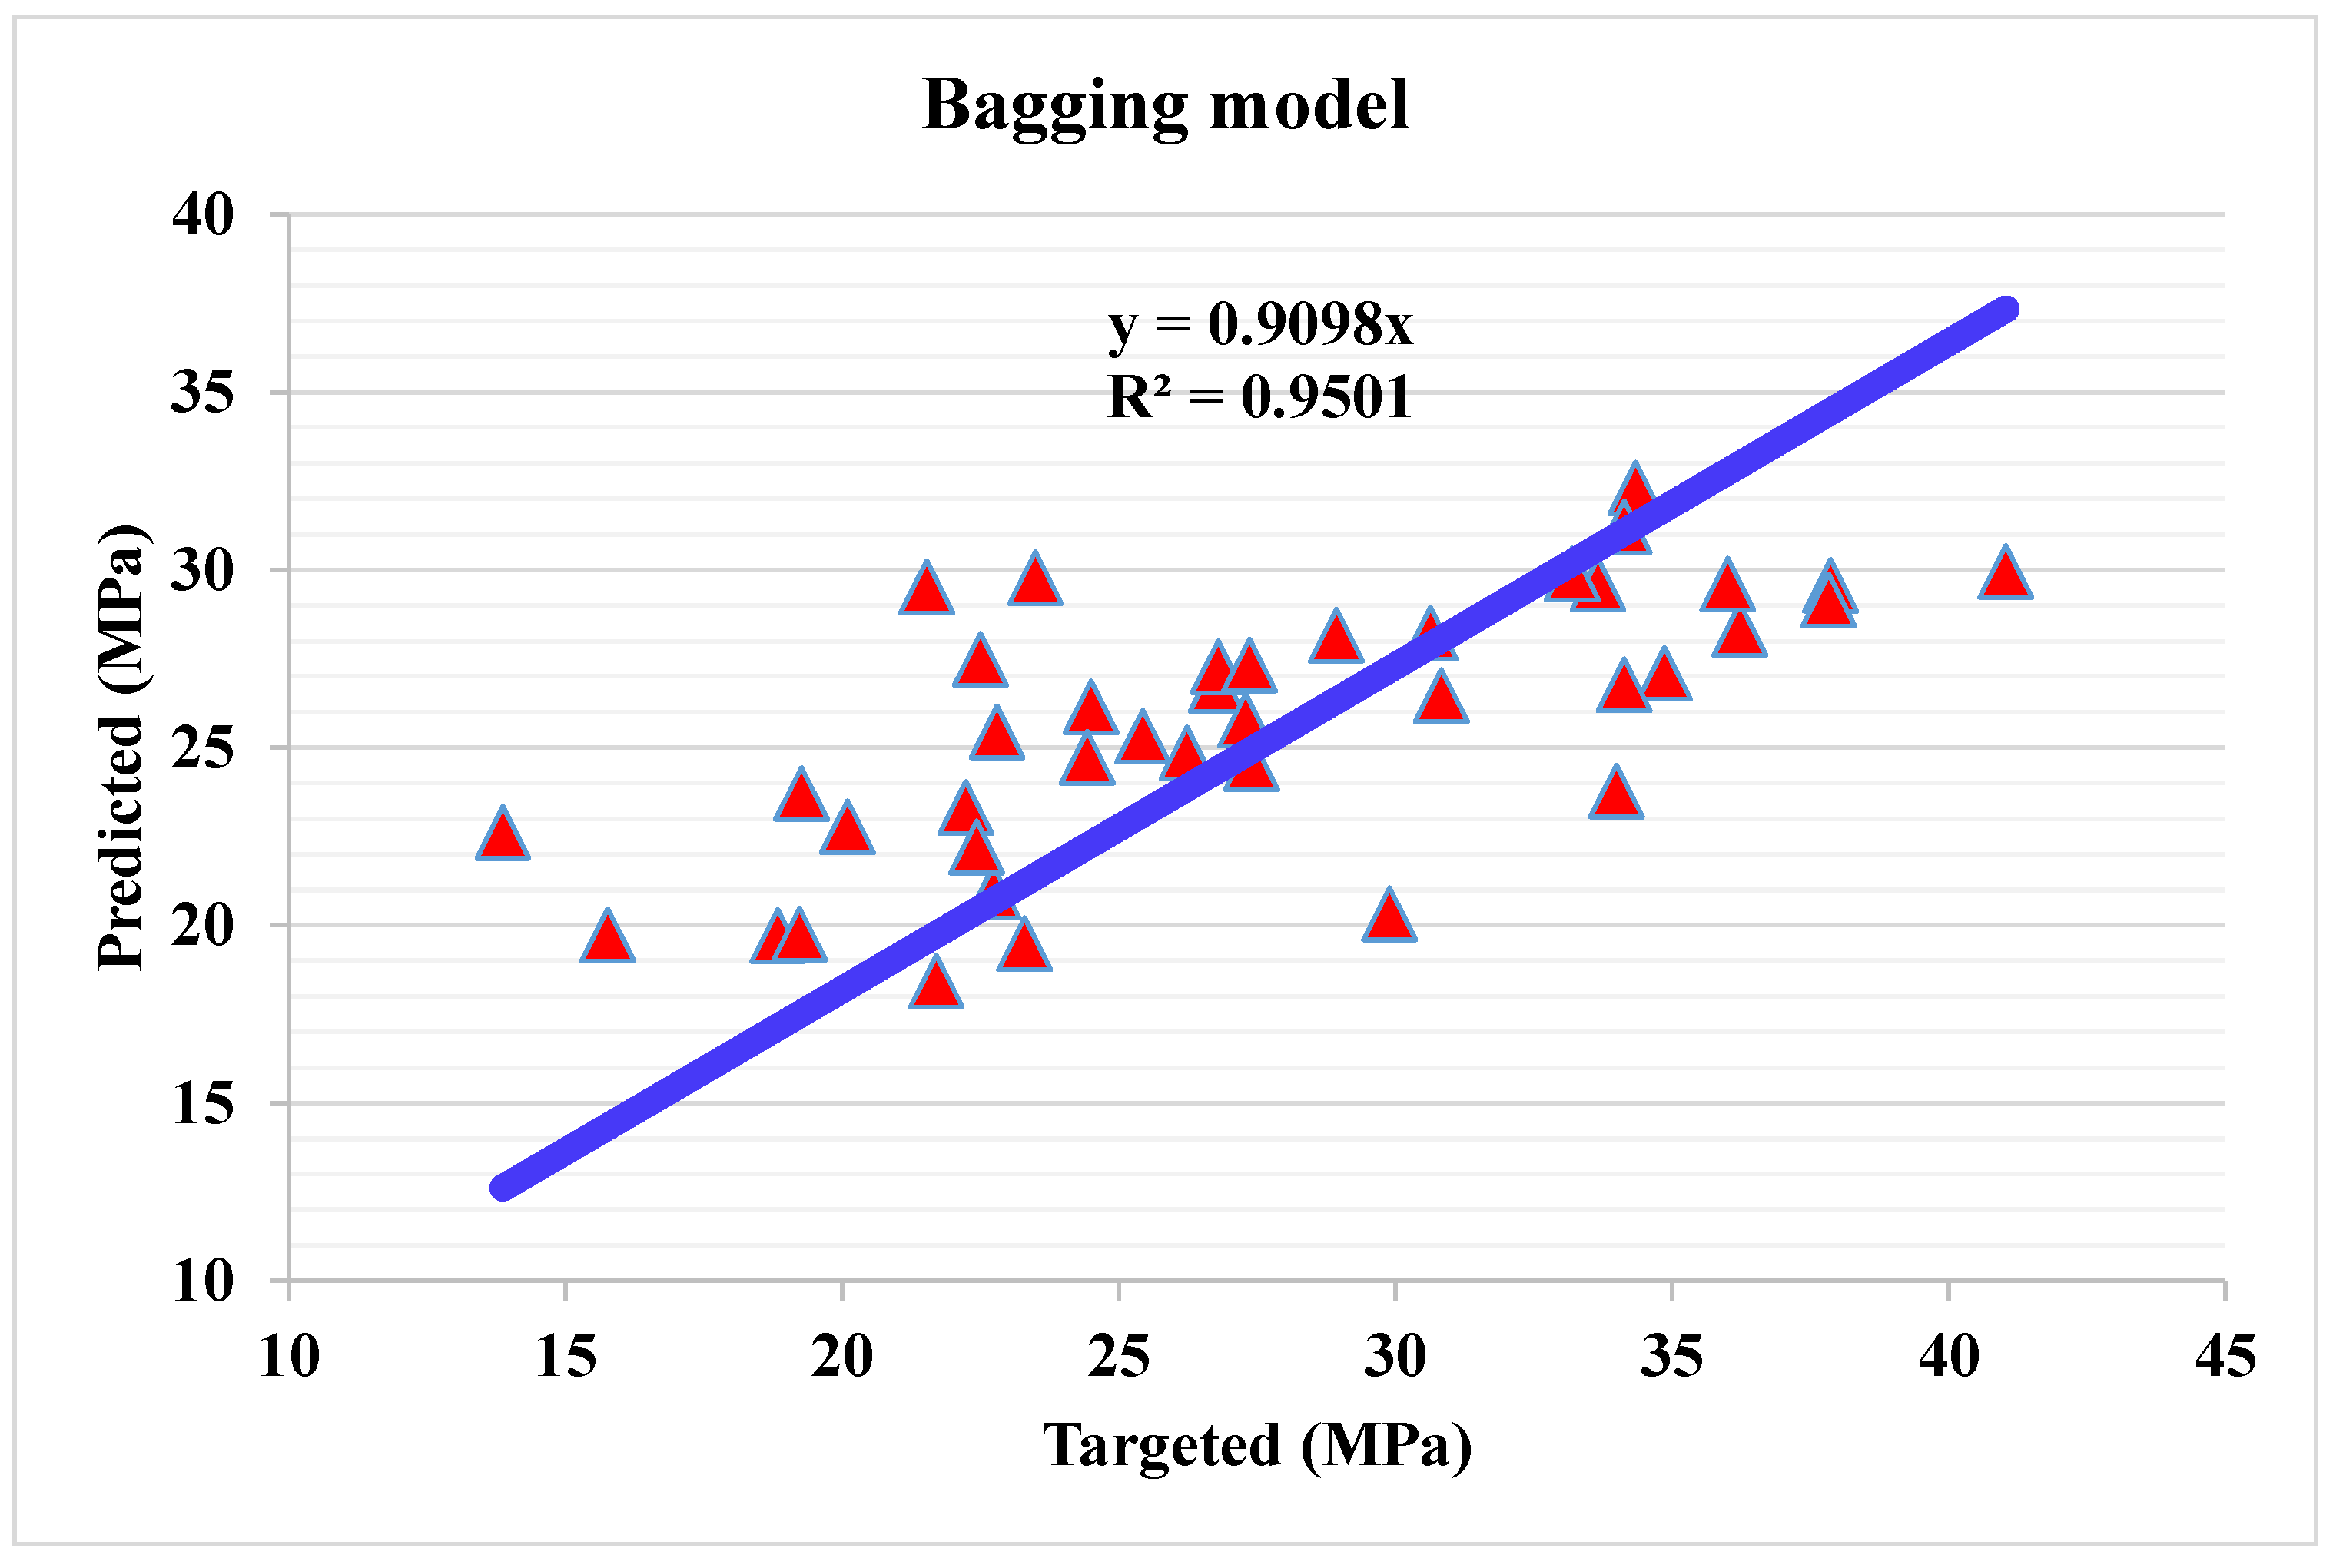
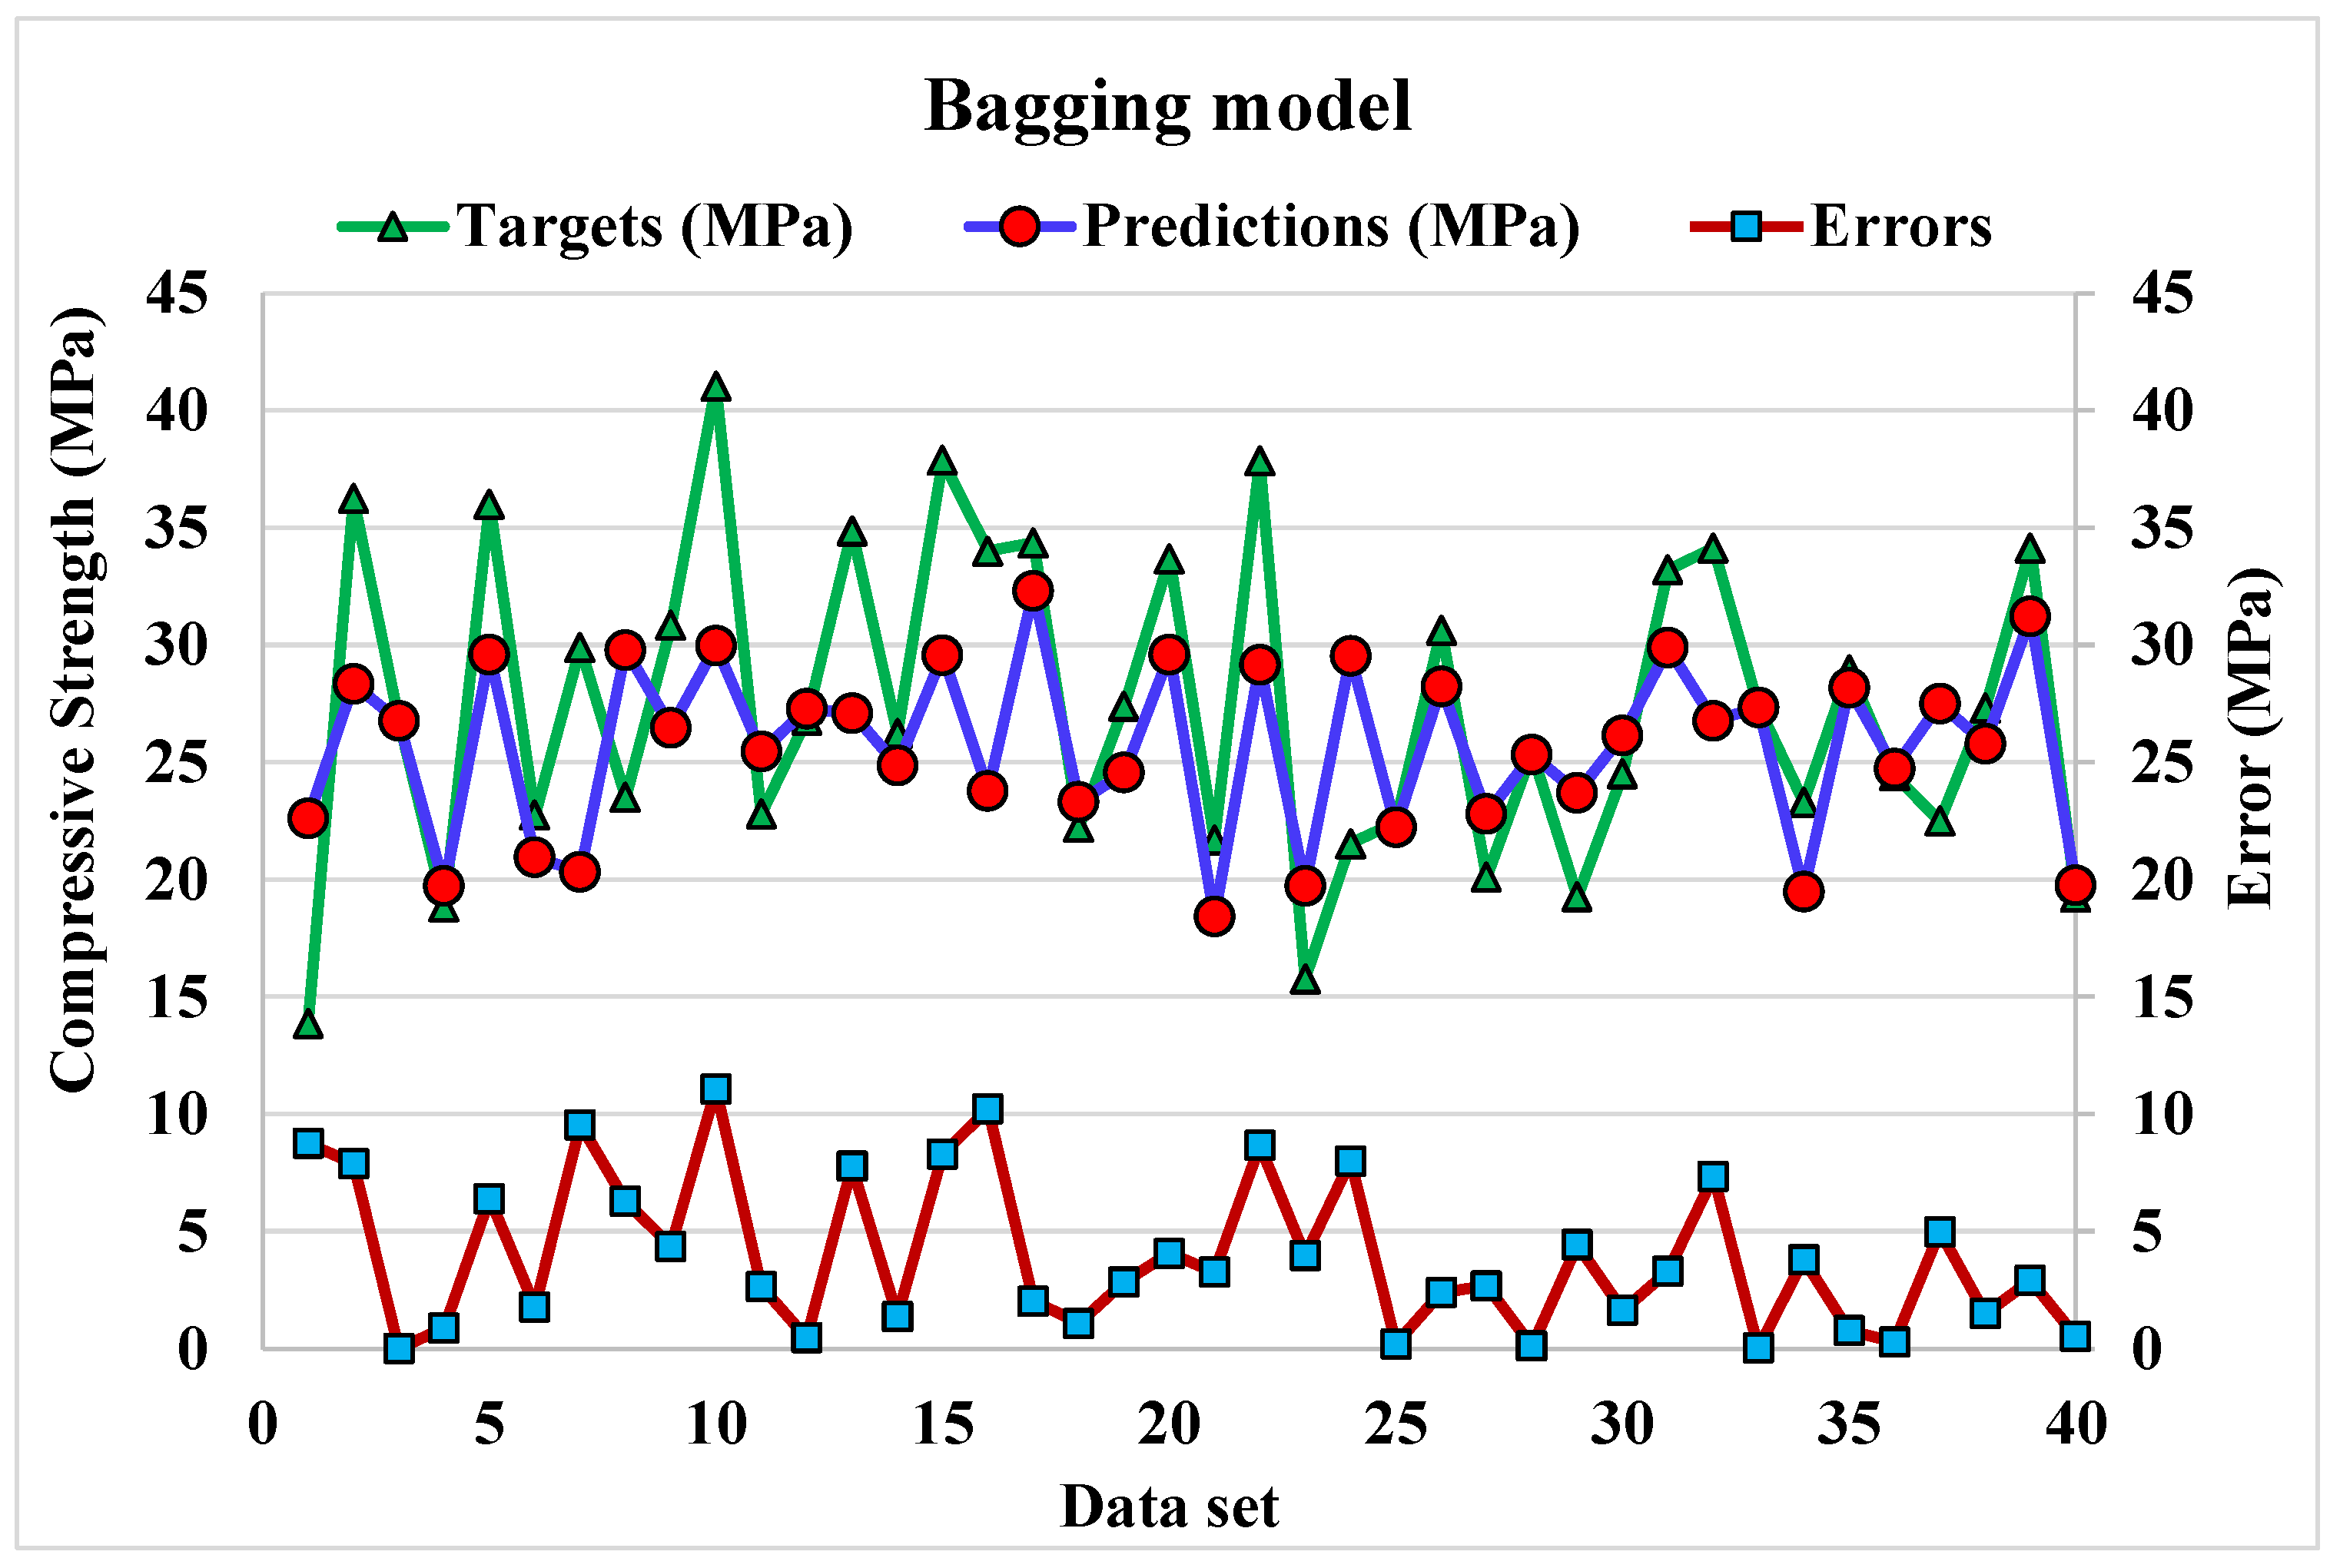
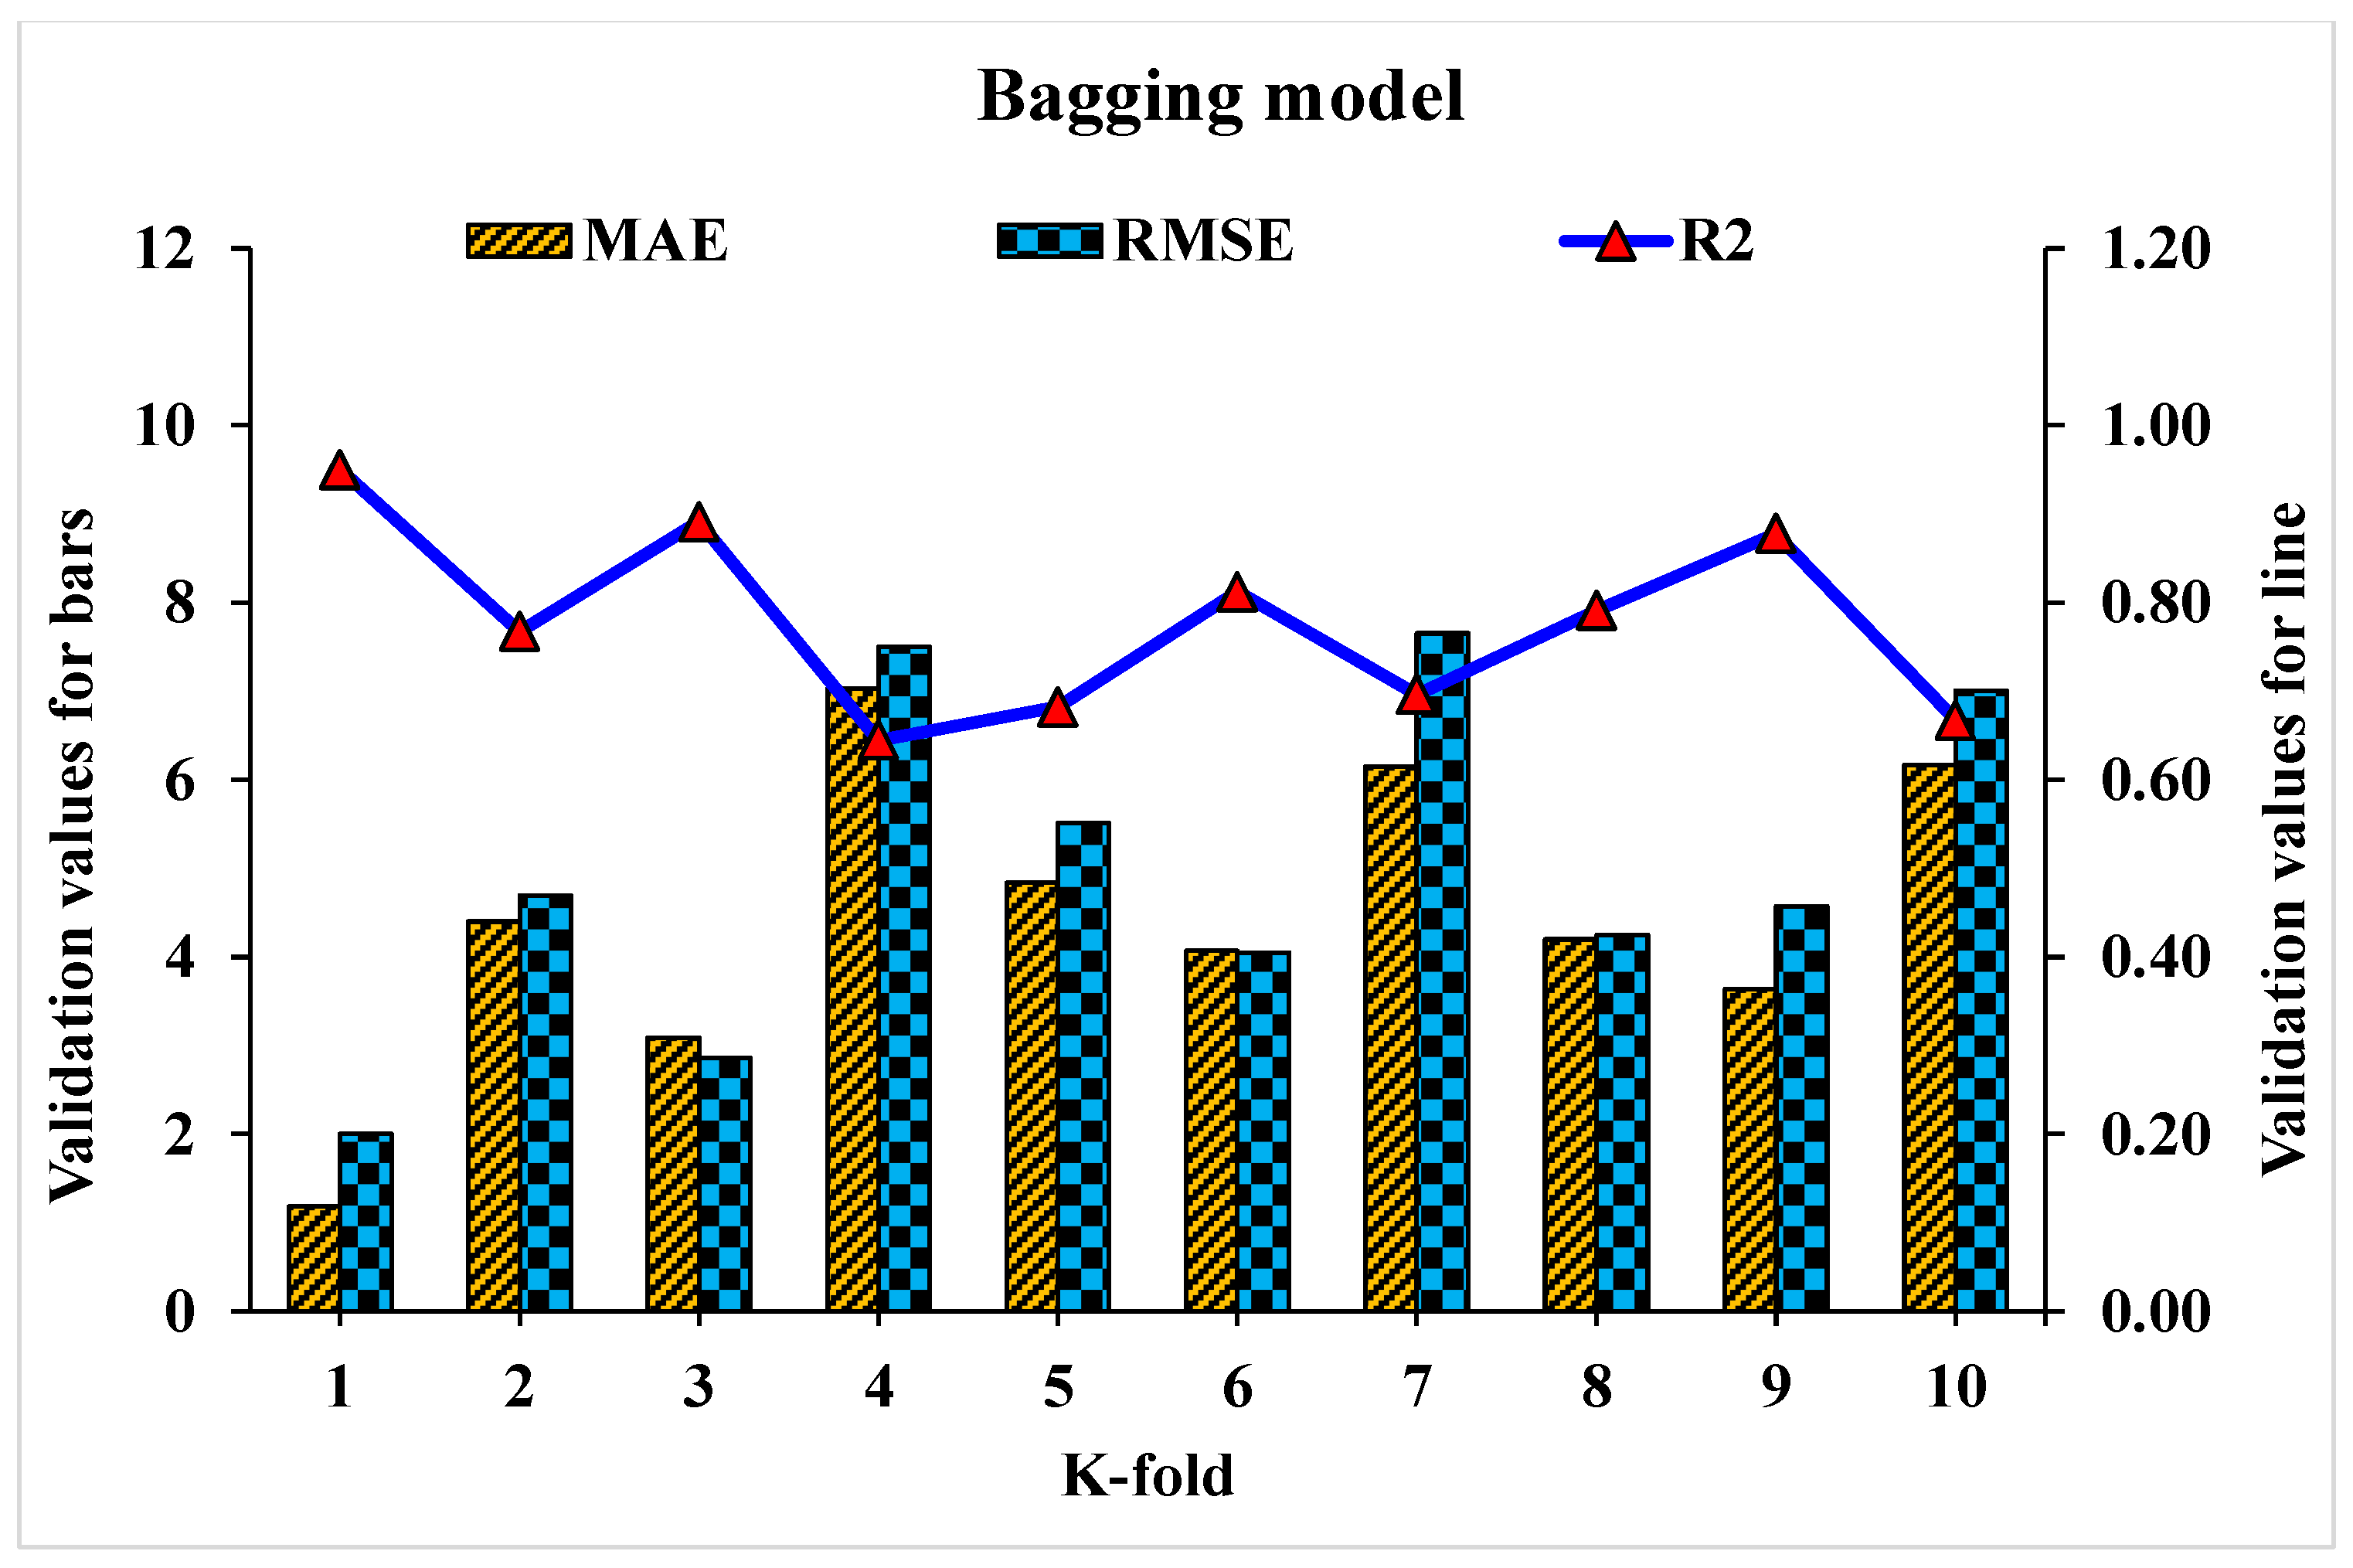
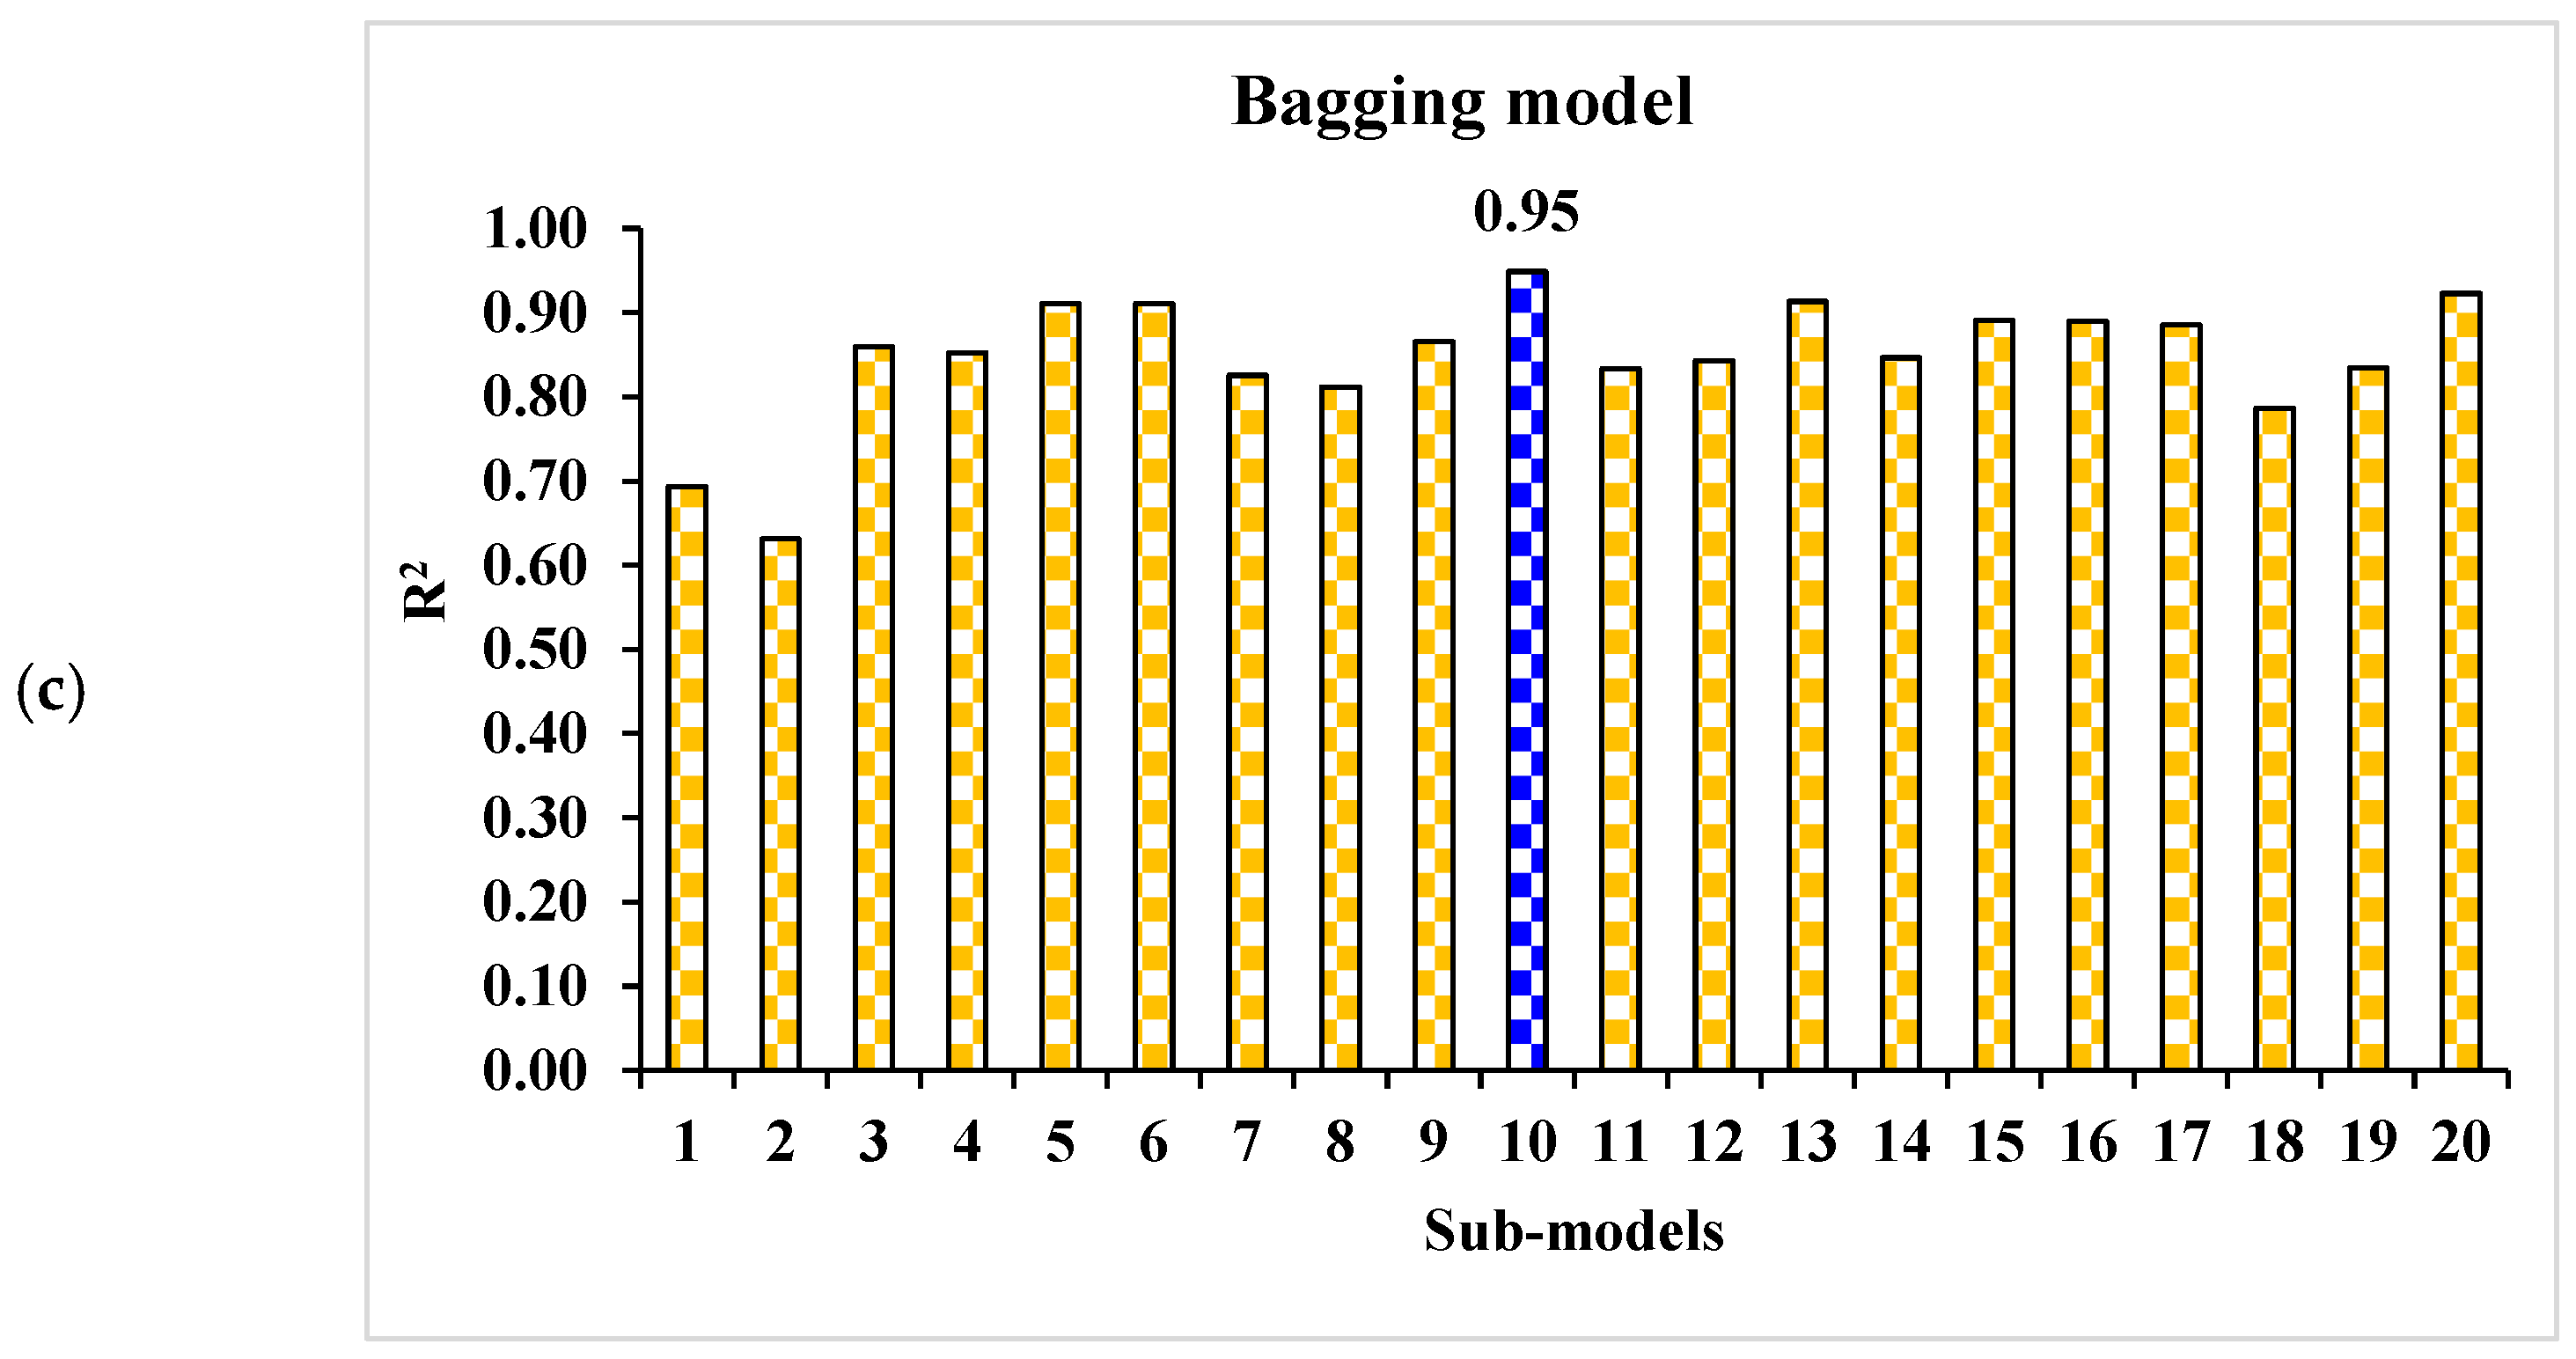
- Bagging modelling
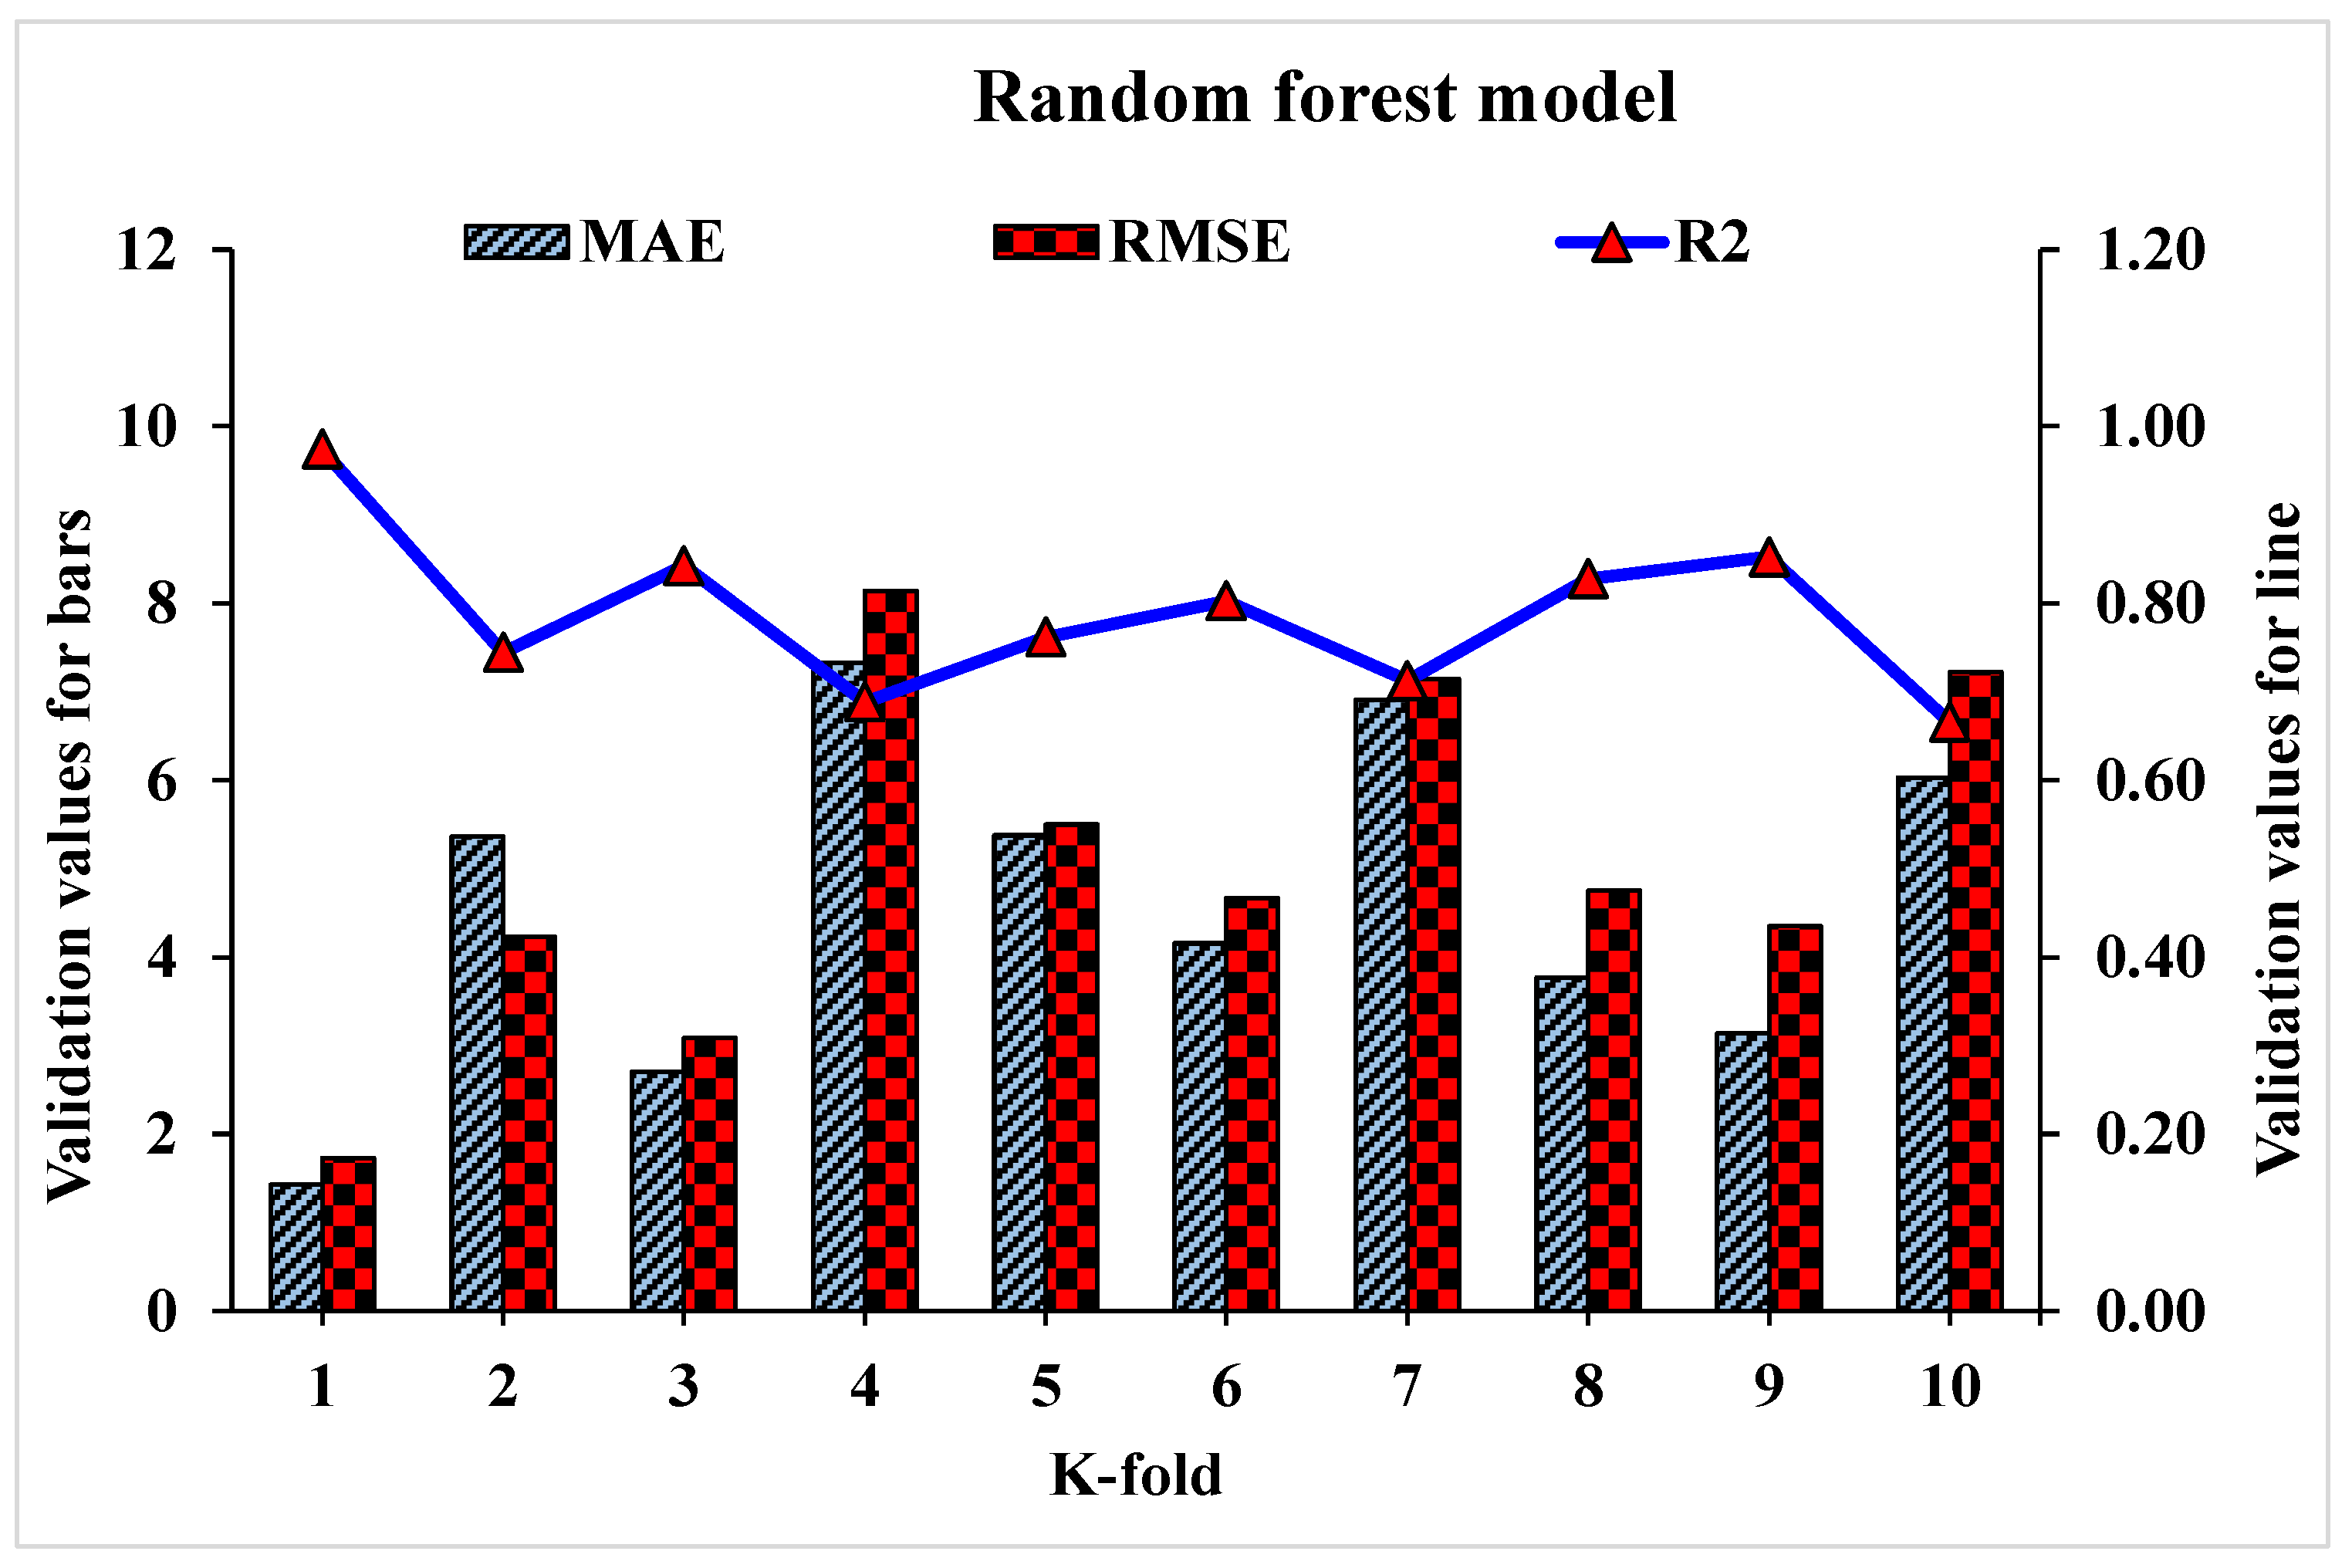
6.2. K-Fold Cross Validation Checks

| Models | Mean Absolute Error (MPa) | Mean Square Error (MPa) | Root Mean Square Error (MPa) |
|---|---|---|---|
| Decision tree | 6.204 | 26.173 | 5.116 |
| Random forest | 3.937 | 24.197 | 4.919 |
| AdaBoost | 4.665 | 30.947 | 5.563 |
| Bagging | 3.969 | 62.679 | 7.917 |


7. Discussion
7.1. Comparison of Machine Learning Models
7.2. Waste Marble Concrete for Sustainable Construction
8. Conclusions
- Bricks manufactured of 10% marble powder as a substitute had the highest compressive strengths of 37.8 MPa at 28 days. Such type of waste marble concrete may be used in the form of blocks for emergency light-weight structures such as hospitals and refuge homes during earthquakes and flooding. In this scenario, WMC having a 10% marble powder content (as a substitute) is proposed to be used as construction material.
- The random forest model has come out to be most effective in terms of prediction with respect to AdaBoost, bagging, and decision tree approaches due to higher values of R2 with lower error values. Decision tree, random forest, AdaBoost, and bagging models have R2 values of 0.86, 0.97, 0.91, and 0.95, respectively. However, the findings of ensembled models (RF, AdaBoost, and bagging) are within an acceptable range.
- Satisfactory outputs of random forest, AdaBoost, and bagging are also demonstrated by the k-fold cross-validation approach and statistical analysis. In addition, the higher performance of the random forest model with respect to the decision tree, AdaBoost, and bagging models is also established through these checks.
- ML can achieve more accurate prediction of material strength properties approaches without putting additional effort and time for sampling, casting, curing, and testing.
Supplementary Materials
Author Contributions
Funding
Institutional Review Board Statement
Informed Consent Statement
Data Availability Statement
Acknowledgments
Conflicts of Interest
References
- Rana, A.; Kalla, P.; Csetenyi, L.J. Recycling of dimension limestone industry waste in concrete. Int. J. Min. Reclam. Environ. 2017, 31, 231–250. [Google Scholar] [CrossRef]
- Rana, A.; Kalla, P.; Verma, H.; Mohnot, J. Recycling of dimensional stone waste in concrete: A review. J. Clean. Prod. 2016, 135, 312–331. [Google Scholar] [CrossRef]
- Munir, M.J.; Kazmi, S.M.S.; Wu, Y.-F.; Hanif, A.; Khan, M.U.A. Thermally efficient fired clay bricks incorporating waste marble sludge: An industrial-scale study. J. Clean. Prod. 2018, 174, 1122–1135. [Google Scholar] [CrossRef]
- Seghir, N.T.; Mellas, M.; Sadowski, Ł.; Żak, A. Effects of marble powder on the properties of the air-cured blended cement paste. J. Clean. Prod. 2018, 183, 858–868. [Google Scholar] [CrossRef]
- Ashish, D.K. Concrete made with waste marble powder and supplementary cementitious material for sustainable development. J. Clean. Prod. 2019, 211, 716–729. [Google Scholar] [CrossRef]
- Demirel, B.; Alyamaç, K.E. Waste marble powder/dust. In Waste and Supplementary Cementitious Materials in Concrete; Elsevier: Amsterdam, The Netherlands, 2018; pp. 181–197. [Google Scholar]
- MSME. Status Report on Commercial Utilization of Marble Slurry in Rajasthan; Ministry of Micro Small and Medium Enterprisese Development Institute, Govt. of India, Ministry of Micro, Small & Medium Enterprises: Jaipur, India, 2016.
- Sarkar, R.; Das, S.K.; Mandal, P.K.; Maiti, H.S. Phase and microstructure evolution during hydrothermal solidification of clay–quartz mixture with marble dust source of reactive lime. J. Eur. Ceram. Soc. 2006, 26, 297–304. [Google Scholar] [CrossRef]
- Aliabdo, A.A.; Abd Elmoaty, M.; Auda, E.M. Re-use of waste marble dust in the production of cement and concrete. Constr. Build. Mater. 2014, 50, 28–41. [Google Scholar] [CrossRef]
- USGS. Stone (Dimension), Dimension Stone Statistics and Information; National Minerals Information Center: Reston, VA, USA, 2018.
- IBM. Indian Minerals Yearbook 2016 (Parte III: Mineral Reviews), 55th Edition Marble ed; Ministry of Mines, Indian Bureau of Mines, Government of India: Nagpur, India, 2018.
- Li, L.; Huang, Z.; Tan, Y.; Kwan, A.; Liu, F. Use of marble dust as paste replacement for recycling waste and improving durability and dimensional stability of mortar. Constr. Build. Mater. 2018, 166, 423–432. [Google Scholar] [CrossRef]
- Mehdi, A.; Chaudhry, M.A. Diagnostic Study Marble & Granite Cluster Rawalpindi Pakistan; UNIDO-SMEDA Cluster Development Programme: Rawalpindi, Pakistan, 2006. [Google Scholar]
- Khodabakhshian, A.; Ghalehnovi, M.; De Brito, J.; Shamsabadi, E.A. Durability performance of structural concrete containing silica fume and marble industry waste powder. J. Clean. Prod. 2018, 170, 42–60. [Google Scholar] [CrossRef]
- Mashaly, A.O.; El-Kaliouby, B.A.; Shalaby, B.N.; El–Gohary, A.M.; Rashwan, M.A. Effects of marble sludge incorporation on the properties of cement composites and concrete paving blocks. J. Clean. Prod. 2016, 112, 731–741. [Google Scholar] [CrossRef]
- Arel, H.Ş. Recyclability of waste marble in concrete production. J. Clean. Prod. 2016, 131, 179–188. [Google Scholar] [CrossRef]
- Binici, H.; Kaplan, H.; Yilmaz, S. Influence of marble and limestone dusts as additives on some mechanical properties of concrete. Sci. Res. Essays 2007, 2, 372–379. [Google Scholar]
- Al-Akhras, N.M.; Ababneh, A.; Alaraji, W.A. Using burnt stone slurry in mortar mixes. Constr. Build. Mater. 2010, 24, 2658–2663. [Google Scholar] [CrossRef]
- Alyamac, K.E.; Ghafari, E.; Ince, R. Development of eco-efficient self-compacting concrete with waste marble powder using the response surface method. J. Clean. Prod. 2017, 144, 192–202. [Google Scholar] [CrossRef]
- Shirazi, E.K. Reusing of stone waste in various industrial activities. In Proceedings of the 2011 2nd International Conference on Environmental Science and Development IPCBEE, Singapore, 26–28 February 2011. [Google Scholar]
- Sadek, D.M.; El-Attar, M.M.; Ali, H.A. Reusing of marble and granite powders in self-compacting concrete for sustainable development. J. Clean. Prod. 2016, 121, 19–32. [Google Scholar] [CrossRef]
- Ashish, D.K.; Verma, S.K. An overview on mixture design of self-compacting concrete. Struct. Concr. 2019, 20, 371–395. [Google Scholar] [CrossRef] [Green Version]
- Brundtland, G.H. Report of the World Commission on Environment and Development: “Our Common Future”; UN: New York, NY, USA, 1987. [Google Scholar]
- Levy, S.M.; Helene, P. Durability of recycled aggregates concrete: A safe way to sustainable development. Cem. Concr. Res. 2004, 34, 1975–1980. [Google Scholar] [CrossRef]
- de Azevedo, A.R.; Alexandre, J.; Xavier, G.d.C.; Pedroti, L.G. Recycling paper industry effluent sludge for use in mortars: A sustainability perspective. J. Clean. Prod. 2018, 192, 335–346. [Google Scholar] [CrossRef]
- Li, H.; Xu, W.; Yang, X.; Wu, J. Preparation of Portland cement with sugar filter mud as lime-based raw material. J. Clean. Prod. 2014, 66, 107–112. [Google Scholar] [CrossRef]
- Li, H.; Dong, L.; Jiang, Z.; Yang, X.; Yang, Z. Study on utilization of red brick waste powder in the production of cement-based red decorative plaster for walls. J. Clean. Prod. 2016, 133, 1017–1026. [Google Scholar] [CrossRef]
- Klee, H. The Cement Sustainability Initiative: Recycling Concrete; World Business Council for Sustainable Development (WBCSD): Geneva, Switzerland, 2009. [Google Scholar]
- Amin, M.N.; Khan, K.; Saleem, M.U.; Khurram, N.; Niazi, M.U.K. Aging and curing temperature effects on compressive strength of mortar containing lime stone quarry dust and industrial granite sludge. Materials 2017, 10, 642. [Google Scholar] [CrossRef] [PubMed] [Green Version]
- Miller, S.A.; Moore, F.C. Climate and health damages from global concrete production. Nat. Clim. Chang. 2020, 10, 439–443. [Google Scholar] [CrossRef]
- Environment, U.; Scrivener, K.L.; John, V.M.; Gartner, E.M. Eco-efficient cements: Potential economically viable solutions for a low-CO2 cement-based materials industry. Cem. Concr. Res. 2018, 114, 2–26. [Google Scholar]
- Habert, G.; Miller, S.A.; John, V.M.; Provis, J.L.; Favier, A.; Horvath, A.; Scrivener, K.L. Environmental impacts and decarbonization strategies in the cement and concrete industries. Nat. Rev. Earth Environ. 2020, 1, 559–573. [Google Scholar] [CrossRef]
- Thomas, B.S.; Yang, J.; Bahurudeen, A.; Abdalla, J.A.; Hawileh, R.; Hamada, H.M.; Nazar, S.; Jittin, V.; Ashish, D.K. Sugarcane bagasse ash as supplementary cementitious material in concrete–A review. Mater. Today Sustain. 2021, 15, 100086. [Google Scholar] [CrossRef]
- Farooqi, M.U.; Ali, M. Effect of pre-treatment and content of wheat straw on energy absorption capability of concrete. Constr. Build. Mater. 2019, 224, 572–583. [Google Scholar] [CrossRef]
- Farooqi, M.U.; Ali, M. Effect of Fibre Content on Splitting-Tensile Strength of Wheat Straw Reinforced Concrete for Pavement Applications. In Key Engineering Materials; Trans Tech Publications Ltd.: Bäch SZ, Switzerland, 2018; pp. 349–354. [Google Scholar] [CrossRef]
- Khan, M.; Ali, M. Improvement in concrete behavior with fly ash, silica-fume and coconut fibres. Constr. Build. Mater. 2019, 203, 174–187. [Google Scholar] [CrossRef]
- Cao, M.; Xie, C.; Li, L.; Khan, M. Effect of different PVA and steel fiber length and content on mechanical properties of CaCO3 whisker reinforced cementitious composites. Mater. De Construcción 2019, 69, e200. [Google Scholar] [CrossRef] [Green Version]
- Cao, M.; Khan, M.; Ahmed, S. Effectiveness of Calcium Carbonate Whisker in Cementitious Composites. Period. Polytechnica. Civ. Eng. 2020, 64, 265. [Google Scholar] [CrossRef] [Green Version]
- Xie, C.; Cao, M.; Khan, M.; Yin, H.; Guan, J. Review on different testing methods and factors affecting fracture properties of fiber reinforced cementitious composites. Constr. Build. Mater. 2021, 273, 121766. [Google Scholar] [CrossRef]
- Khan, M.; Cao, M.; Xie, C.; Ali, M. Efficiency of basalt fiber length and content on mechanical and microstructural properties of hybrid fiber concrete. Fatigue Fract. Eng. Mater. Struct. 2021, 44, 2135–2152. [Google Scholar] [CrossRef]
- Khan, M.; Cao, M.; Xie, C.; Ali, M. Hybrid fiber concrete with different basalt fiber length and content. Struct. Concr. 2021, 23, 346–364. [Google Scholar] [CrossRef]
- Khan, M.; Cao, M.; Hussain, A.; Chu, S. Effect of silica-fume content on performance of CaCO3 whisker and basalt fiber at matrix interface in cement-based composites. Constr. Build. Mater. 2021, 300, 124046. [Google Scholar] [CrossRef]
- Arshad, S.; Sharif, M.B.; Irfan-ul-Hassan, M.; Khan, M.; Zhang, J.-L. Efficiency of supplementary cementitious materials and natural fiber on mechanical performance of concrete. Arab. J. Sci. Eng. 2020, 45, 8577–8589. [Google Scholar] [CrossRef]
- Ahmad, W.; Ahmad, A.; Ostrowski, K.A.; Aslam, F.; Joyklad, P.; Zajdel, P. Sustainable approach of using sugarcane bagasse ash in cement-based composites: A systematic review. Case Stud. Constr. Mater. 2021, 15, e00698. [Google Scholar] [CrossRef]
- Keleştemur, O.; Arıcı, E.; Yıldız, S.; Gökçer, B. Performance evaluation of cement mortars containing marble dust and glass fiber exposed to high temperature by using Taguchi method. Constr. Build. Mater. 2014, 60, 17–24. [Google Scholar] [CrossRef] [Green Version]
- Rodrigues, R.d.; De Brito, J.; Sardinha, M. Mechanical properties of structural concrete containing very fine aggregates from marble cutting sludge. Constr. Build. Mater. 2015, 77, 349–356. [Google Scholar] [CrossRef]
- Aruntaş, H.Y.; Gürü, M.; Dayı, M.; Tekin, I. Utilization of waste marble dust as an additive in cement production. Mater. Des. 2010, 31, 4039–4042. [Google Scholar] [CrossRef]
- Badurdeen, F.; Aydin, R.; Brown, A. A multiple lifecycle-based approach to sustainable product configuration design. J. Clean. Prod. 2018, 200, 756–769. [Google Scholar] [CrossRef]
- AYDIN, E. Effects of elevated temperature for the marble cement paste products for better sustainable construction. Politek. Derg. 2019, 22, 259–267. [Google Scholar]
- Gesoğlu, M.; Güneyisi, E.; Kocabağ, M.E.; Bayram, V.; Mermerdaş, K. Fresh and hardened characteristics of self compacting concretes made with combined use of marble powder, limestone filler, and fly ash. Constr. Build. Mater. 2012, 37, 160–170. [Google Scholar] [CrossRef]
- Topcu, I.B.; Bilir, T.; Uygunoğlu, T. Effect of waste marble dust content as filler on properties of self-compacting concrete. Constr. Build. Mater. 2009, 23, 1947–1953. [Google Scholar] [CrossRef]
- Gencel, O.; Ozel, C.; Koksal, F.; Erdogmus, E.; Martínez-Barrera, G.; Brostow, W. Properties of concrete paving blocks made with waste marble. J. Clean. Prod. 2012, 21, 62–70. [Google Scholar] [CrossRef]
- Ergün, A. Effects of the usage of diatomite and waste marble powder as partial replacement of cement on the mechanical properties of concrete. Constr. Build. Mater. 2011, 25, 806–812. [Google Scholar] [CrossRef]
- Uysal, M.; Yilmaz, K. Effect of mineral admixtures on properties of self-compacting concrete. Cem. Concr. Compos. 2011, 33, 771–776. [Google Scholar] [CrossRef]
- Li, L.; Huang, Z.; Tan, Y.; Kwan, A.; Chen, H. Recycling of marble dust as paste replacement for improving strength, microstructure and eco-friendliness of mortar. J. Clean. Prod. 2019, 210, 55–65. [Google Scholar] [CrossRef]
- Belaidi, A.; Azzouz, L.; Kadri, E.; Kenai, S. Effect of natural pozzolana and marble powder on the properties of self-compacting concrete. Constr. Build. Mater. 2012, 31, 251–257. [Google Scholar] [CrossRef]
- Şanal, İ. Significance of concrete production in terms of carbondioxide emissions: Social and environmental impacts. Politek. Derg. 2018, 21, 369–378. [Google Scholar] [CrossRef] [Green Version]
- Farooq, F.; Akbar, A.; Khushnood, R.A.; Muhammad, W.L.B.; Rehman, S.K.U.; Javed, M.F. Experimental investigation of hybrid carbon nanotubes and graphite nanoplatelets on rheology, shrinkage, mechanical, and microstructure of SCCM. Materials 2020, 13, 230. [Google Scholar] [CrossRef] [Green Version]
- Khaloo, A.R.; Dehestani, M.; Rahmatabadi, P. Mechanical properties of concrete containing a high volume of tire–rubber particles. Waste Manag. 2008, 28, 2472–2482. [Google Scholar] [CrossRef]
- Qin, D.; Gao, P.; Aslam, F.; Sufian, M.; Alabduljabbar, H. A comprehensive review on fire damage assessment of reinforced concrete structures. Case Stud. Constr. Mater. 2021, 16, e00843. [Google Scholar] [CrossRef]
- Rashid, M.A.; Mansur, M.A. Considerations in producing high strength concrete. J. Civ. Eng. 2009, 37, 53–63. [Google Scholar]
- Cotsovos, D.; Pavlović, M. Numerical investigation of concrete subjected to compressive impact loading. Part 2: Parametric investigation of factors affecting behaviour at high loading rates. Comput. Struct. 2008, 86, 164–180. [Google Scholar] [CrossRef]
- Li, M.; Hao, H.; Shi, Y.; Hao, Y. Specimen shape and size effects on the concrete compressive strength under static and dynamic tests. Constr. Build. Mater. 2018, 161, 84–93. [Google Scholar] [CrossRef]
- Feng, D.-C.; Liu, Z.-T.; Wang, X.-D.; Chen, Y.; Chang, J.-Q.; Wei, D.-F.; Jiang, Z.-M. Machine learning-based compressive strength prediction for concrete: An adaptive boosting approach. Constr. Build. Mater. 2020, 230, 117000. [Google Scholar] [CrossRef]
- Nafees, A.; Khan, S.; Javed, M.F.; Alrowais, R.; Mohamed, A.M.; Mohamed, A.; Vatin, N.I. Forecasting the Mechanical Properties of Plastic Concrete Employing Experimental Data Using Machine Learning Algorithms: DT, MLPNN, SVM, and RF. Polymers 2022, 14, 1583. [Google Scholar] [CrossRef] [PubMed]
- Nafees, A.; Javed, M.; Khan, S.; Nazir, K.; Farooq, F.; Aslam, F.; Musarat, M.; Vatin, N. Predictive Modeling of Mechanical Properties of Silica Fume-Based Green Concrete Using Artificial Intelligence Approaches: MLPNN, ANFIS, and GEP. Materials 2021, 14, 7531. [Google Scholar] [CrossRef]
- Salehi, H.; Burgueño, R. Emerging artificial intelligence methods in structural engineering. Eng. Struct. 2018, 171, 170–189. [Google Scholar] [CrossRef]
- Rahman, J.; Ahmed, K.S.; Khan, N.I.; Islam, K.; Mangalathu, S. Data-driven shear strength prediction of steel fiber reinforced concrete beams using machine learning approach. Eng. Struct. 2021, 233, 111743. [Google Scholar] [CrossRef]
- Behnood, A.; Golafshani, E.M. Predicting the compressive strength of silica fume concrete using hybrid artificial neural network with multi-objective grey wolves. J. Clean. Prod. 2018, 202, 54–64. [Google Scholar] [CrossRef]
- Güçlüer, K.; Özbeyaz, A.; Göymen, S.; Günaydın, O. A comparative investigation using machine learning methods for concrete compressive strength estimation. Mater. Today Commun. 2021, 27, 102278. [Google Scholar] [CrossRef]
- Getahun, M.A.; Shitote, S.M.; Gariy, Z.C.A. Artificial neural network based modelling approach for strength prediction of concrete incorporating agricultural and construction wastes. Constr. Build. Mater. 2018, 190, 517–525. [Google Scholar] [CrossRef]
- Ling, H.; Qian, C.; Kang, W.; Liang, C.; Chen, H. Combination of Support Vector Machine and K-Fold cross validation to predict compressive strength of concrete in marine environment. Constr. Build. Mater. 2019, 206, 355–363. [Google Scholar] [CrossRef]
- Yaseen, Z.M.; Deo, R.C.; Hilal, A.; Abd, A.M.; Bueno, L.C.; Salcedo-Sanz, S.; Nehdi, M.L. Predicting compressive strength of lightweight foamed concrete using extreme learning machine model. Adv. Eng. Softw. 2018, 115, 112–125. [Google Scholar] [CrossRef]
- Taffese, W.Z.; Sistonen, E. Machine learning for durability and service-life assessment of reinforced concrete structures: Recent advances and future directions. Autom. Constr. 2017, 77, 1–14. [Google Scholar] [CrossRef]
- Yokoyama, S.; Matsumoto, T. Development of an automatic detector of cracks in concrete using machine learning. Procedia Eng. 2017, 171, 1250–1255. [Google Scholar] [CrossRef]
- Chaabene, W.B.; Flah, M.; Nehdi, M.L. Machine learning prediction of mechanical properties of concrete: Critical review. Constr. Build. Mater. 2020, 260, 119889. [Google Scholar] [CrossRef]
- Ahmad, W.; Ahmad, A.; Ostrowski, K.A.; Aslam, F.; Joyklad, P.; Zajdel, P. Application of advanced machine learning approaches to predict the compressive strength of concrete containing supplementary cementitious materials. Materials 2021, 14, 5762. [Google Scholar] [CrossRef]
- Song, H.; Ahmad, A.; Ostrowski, K.A.; Dudek, M. Analyzing the compressive strength of ceramic waste-based concrete using experiment and artificial neural network (ANN) approach. Materials 2021, 14, 4518. [Google Scholar] [CrossRef]
- Ahmad, A.; Farooq, F.; Niewiadomski, P.; Ostrowski, K.; Akbar, A.; Aslam, F.; Alyousef, R. Prediction of compressive strength of fly ash based concrete using individual and ensemble algorithm. Materials 2021, 14, 794. [Google Scholar] [CrossRef]
- Balf, F.R.; Kordkheili, H.M.; Kordkheili, A.M. A New Method for Predicting the Ingredients of Self-Compacting Concrete (SCC) Including Fly Ash (FA) Using Data Envelopment Analysis (DEA). Arab. J. Sci. Eng. 2021, 46, 4439–4460. [Google Scholar] [CrossRef]
- Bušić, R.; Benšić, M.; Miličević, I.; Strukar, K. Prediction models for the mechanical properties of self-compacting concrete with recycled rubber and silica fume. Materials 2020, 13, 1821. [Google Scholar] [CrossRef] [PubMed] [Green Version]
- Saha, P.; Debnath, P.; Thomas, P. Prediction of fresh and hardened properties of self-compacting concrete using support vector regression approach. Neural Comput. Appl. 2020, 32, 7995–8010. [Google Scholar] [CrossRef]
- Al-Mughanam, T.; Aldhyani, T.H.; AlSubari, B.; Al-Yaari, M. Modeling of compressive strength of sustainable self-compacting concrete incorporating treated palm oil fuel ash using artificial neural network. Sustainability 2020, 12, 9322. [Google Scholar] [CrossRef]
- Farooq, F.; Nasir Amin, M.; Khan, K.; Rehan Sadiq, M.; Faisal Javed, M.; Aslam, F.; Alyousef, R. A comparative study of random forest and genetic engineering programming for the prediction of compressive strength of high strength concrete (HSC). Appl. Sci. 2020, 10, 7330. [Google Scholar] [CrossRef]
- Selvaraj, S.; Sivaraman, S. Prediction model for optimized self-compacting concrete with fly ash using response surface method based on fuzzy classification. Neural Comput. Appl. 2019, 31, 1365–1373. [Google Scholar] [CrossRef]
- Zhang, J.; Ma, G.; Huang, Y.; Aslani, F.; Nener, B. Modelling uniaxial compressive strength of lightweight self-compacting concrete using random forest regression. Constr. Build. Mater. 2019, 210, 713–719. [Google Scholar] [CrossRef]
- Karbassi, A.; Mohebi, B.; Rezaee, S.; Lestuzzi, P. Damage prediction for regular reinforced concrete buildings using the decision tree algorithm. Comput. Struct. 2014, 130, 46–56. [Google Scholar] [CrossRef]
- Erdal, H.I. Two-level and hybrid ensembles of decision trees for high performance concrete compressive strength prediction. Eng. Appl. Artif. Intell. 2013, 26, 1689–1697. [Google Scholar] [CrossRef]
- Han, Q.; Gui, C.; Xu, J.; Lacidogna, G. A generalized method to predict the compressive strength of high-performance concrete by improved random forest algorithm. Constr. Build. Mater. 2019, 226, 734–742. [Google Scholar] [CrossRef]
- Shaqadan, A. Prediction of concrete mix strength using random forest model. Int. J. Appl. Eng. Res. 2016, 11, 11024–11029. [Google Scholar]
- Xu, Y.; Ahmad, W.; Ahmad, A.; Ostrowski, K.A.; Dudek, M.; Aslam, F.; Joyklad, P. Computation of High-Performance Concrete Compressive Strength Using Standalone and Ensembled Machine Learning Techniques. Materials 2021, 14, 7034. [Google Scholar] [CrossRef] [PubMed]
- Ribeiro, M.H.D.M.; dos Santos Coelho, L. Ensemble approach based on bagging, boosting and stacking for short-term prediction in agribusiness time series. Appl. Soft Comput. 2020, 86, 105837. [Google Scholar] [CrossRef]
- Wang, C.; Xu, S.; Yang, J. Adaboost Algorithm in Artificial Intelligence for Optimizing the IRI Prediction Accuracy of Asphalt Concrete Pavement. Sensors 2021, 21, 5682. [Google Scholar] [CrossRef] [PubMed]
- Huang, J.; Sun, Y.; Zhang, J. Reduction of computational error by optimizing SVR kernel coefficients to simulate concrete compressive strength through the use of a human learning optimization algorithm. Eng. Comput. 2021, 1–18. [Google Scholar] [CrossRef]
- Ahmad, A.; Ahmad, W.; Aslam, F.; Joyklad, P. Compressive strength prediction of fly ash-based geopolymer concrete via advanced machine learning techniques. Case Stud. Constr. Mater. 2021, 16, e00840. [Google Scholar] [CrossRef]
- Yuan, X.; Tian, Y.; Ahmad, W.; Ahmad, A.; Usanova, K.I.; Mohamed, A.M.; Khallaf, R. Machine Learning Prediction Models to Evaluate the Strength of Recycled Aggregate Concrete. Materials 2022, 15, 2823. [Google Scholar] [CrossRef]
- Shang, M.; Li, H.; Ahmad, A.; Ahmad, W.; Ostrowski, K.A.; Aslam, F.; Joyklad, P.; Majka, T.M. Predicting the Mechanical Properties of RCA-Based Concrete Using Supervised Machine Learning Algorithms. Materials 2022, 15, 647. [Google Scholar] [CrossRef]
- Ahmad, A.; Chaiyasarn, K.; Farooq, F.; Ahmad, W.; Suparp, S.; Aslam, F. Compressive strength prediction via gene expression programming (GEP) and artificial neural network (ANN) for concrete containing RCA. Buildings 2021, 11, 324. [Google Scholar] [CrossRef]
- Farooq, F.; Ahmed, W.; Akbar, A.; Aslam, F.; Alyousef, R. Predictive modeling for sustainable high-performance concrete from industrial wastes: A comparison and optimization of models using ensemble learners. J. Clean. Prod. 2021, 292, 126032. [Google Scholar] [CrossRef]
- Aslam, F.; Farooq, F.; Amin, M.N.; Khan, K.; Waheed, A.; Akbar, A.; Javed, M.F.; Alyousef, R.; Alabdulijabbar, H. Applications of gene expression programming for estimating compressive strength of high-strength concrete. Adv. Civ. Eng. 2020, 2020, 8850535. [Google Scholar] [CrossRef]
- Singh, M.; Choudhary, K.; Srivastava, A.; Sangwan, K.S.; Bhunia, D. A study on environmental and economic impacts of using waste marble powder in concrete. J. Build. Eng. 2017, 13, 87–95. [Google Scholar] [CrossRef]


| Algorithm Name | Notation | Prediction Properties | Year | Waste Material Used | Ref. |
|---|---|---|---|---|---|
| Individual (decision tree) and ensemble algorithm (bagging) | DT and Bg | Compressive Strength | 2021 | FA | [79] |
| Ensemble modelling (bagging and boosting) | Bg and AdB | Compressive strength | 2021 | FA | [22] |
| Individual Algorithms (decision tree) | DT | Chloride Concentration | 2021 | FA | [18] |
| Data Envelopment Analysis | DEA | Compressive strength Slump test L-box test V-funnel test | 2021 | FA | [80] |
| Multivariate | MV | Compressive strength | 2020 | Crumb rubber with SF | [81] |
| Support vector machine | SVM | Slump test L-box test V-funnel test Compressive strength | 2020 | FA | [82] |
| Adaptive neuro fuzzy inference system | ANFIS with ANN | Compressive strength | 2020 | POFA | [83] |
| Random forest | RF | Compressive strength | 2020 | - | [84] |
| Intelligent rule-based enhanced multiclass support vector machine and fuzzy rules | IREMSVM-FR with RSM | Compressive strength | 2019 | FA | [85] |
| Random forest | RF | Compressive strength | 2019 | FA GGBFS FA | [86] |
| Decision tree | DT | Compressive strength | 2021 | Ceramic waste | [62] |
| Components Details | Cement | Marble Powder |
|---|---|---|
| Calcium Oxide (CaO) | 61.81 | 42.14 |
| Magnesium Oxide (MgO) | 1.96 | 2.77 |
| Silica (SiO2) | 22.07 | 0.79 |
| Potassium Oxide (K2O) | 0.46 | 0.63 |
| Alumina (Al2O3) | 6.96 | 2.69 |
| Sodium Oxide (Na2O) | 0.11 | 0.61 |
| Iron Oxide (Fe2O3) | 3.62 | 1.94 |
| Sulfur Trioxide (SO3) | 2.14 | 0.042 |
| LOI | 1.2 | 42.28 |
| Property | Dry Rodded Bulk Density | Bulk Specific Gravity | Moisture Content | Water Absorption | Fineness Modulus | Nominal Maximum Size |
|---|---|---|---|---|---|---|
| kg/m3 | - | % | % | - | mm | |
| Sand | 1800 | 2.61 | 1.57 | 2 | 2.72 | - |
| Aggregate | 1601 | 2.51 | 1.49 | 1.65 | - | 25.4 |
| Followed Standards | ASTM C29 | ASTM C128/C127 | ASTM C566 | ASTM C136 | - | |
| Input Variables | ||||||
|---|---|---|---|---|---|---|
| Parameters | Cement (kg/m3) | Marble Powder (kg/m3) | Sand (kg/m3) | Aggregate (kg/m3) | W/C Ratio | Days |
| Mean | 484.396 | 25.4941 | 618.7 | 1202.28 | 0.45045 | 17.5 |
| Standard Error | 9.72503 | 2.95033 | 19.5542 | 33.6188 | 0.00637 | 1.18 |
| Median | 472.838 | 17.238 | 615.264 | 1116.36 | 0.43994 | 17.5 |
| Mode | 486.948 | 0 | 620.058 | 1201.29 | 0.37997 | 7 |
| Standard Deviation | 86.9833 | 26.3886 | 174.898 | 300.695 | 0.05696 | 10.56 |
| Range | 398.65 | 70.89 | 891.174 | 1091.64 | 0.28578 | 21 |
| Parameters | Abbreviation | Unit | Minimum Value | Maximum Value | |
|---|---|---|---|---|---|
| Input | Cement | C | kg/m3 | 310.148 | 708.798 |
| Marble powder | MP | kg/m3 | 0 | 70.89 | |
| Sand | S | kg/m3 | 129.472 | 1020.65 | |
| Aggregate | A | kg/m3 | 659.328 | 1750.97 | |
| Water to cement ratio | W/C | kg/m3 | 0.36273 | 0.64851 | |
| Days | D | Days | 7 | 28 | |
| Output | Compressive Strength | C.S | MPa | 9.49 | 72.11 |
Publisher’s Note: MDPI stays neutral with regard to jurisdictional claims in published maps and institutional affiliations. |
© 2022 by the authors. Licensee MDPI, Basel, Switzerland. This article is an open access article distributed under the terms and conditions of the Creative Commons Attribution (CC BY) license (https://creativecommons.org/licenses/by/4.0/).
Share and Cite
Khan, K.; Ahmad, W.; Amin, M.N.; Ahmad, A.; Nazar, S.; Alabdullah, A.A.; Arab, A.M.A. Exploring the Use of Waste Marble Powder in Concrete and Predicting Its Strength with Different Advanced Algorithms. Materials 2022, 15, 4108. https://doi.org/10.3390/ma15124108
Khan K, Ahmad W, Amin MN, Ahmad A, Nazar S, Alabdullah AA, Arab AMA. Exploring the Use of Waste Marble Powder in Concrete and Predicting Its Strength with Different Advanced Algorithms. Materials. 2022; 15(12):4108. https://doi.org/10.3390/ma15124108
Chicago/Turabian StyleKhan, Kaffayatullah, Waqas Ahmad, Muhammad Nasir Amin, Ayaz Ahmad, Sohaib Nazar, Anas Abdulalim Alabdullah, and Abdullah Mohammad Abu Arab. 2022. "Exploring the Use of Waste Marble Powder in Concrete and Predicting Its Strength with Different Advanced Algorithms" Materials 15, no. 12: 4108. https://doi.org/10.3390/ma15124108
APA StyleKhan, K., Ahmad, W., Amin, M. N., Ahmad, A., Nazar, S., Alabdullah, A. A., & Arab, A. M. A. (2022). Exploring the Use of Waste Marble Powder in Concrete and Predicting Its Strength with Different Advanced Algorithms. Materials, 15(12), 4108. https://doi.org/10.3390/ma15124108