
Experimental Investigation of the Tensile Behavior of Selected Tire Cords Using Novel Testing Equipment


Abstract
:1. Introduction
2. Materials
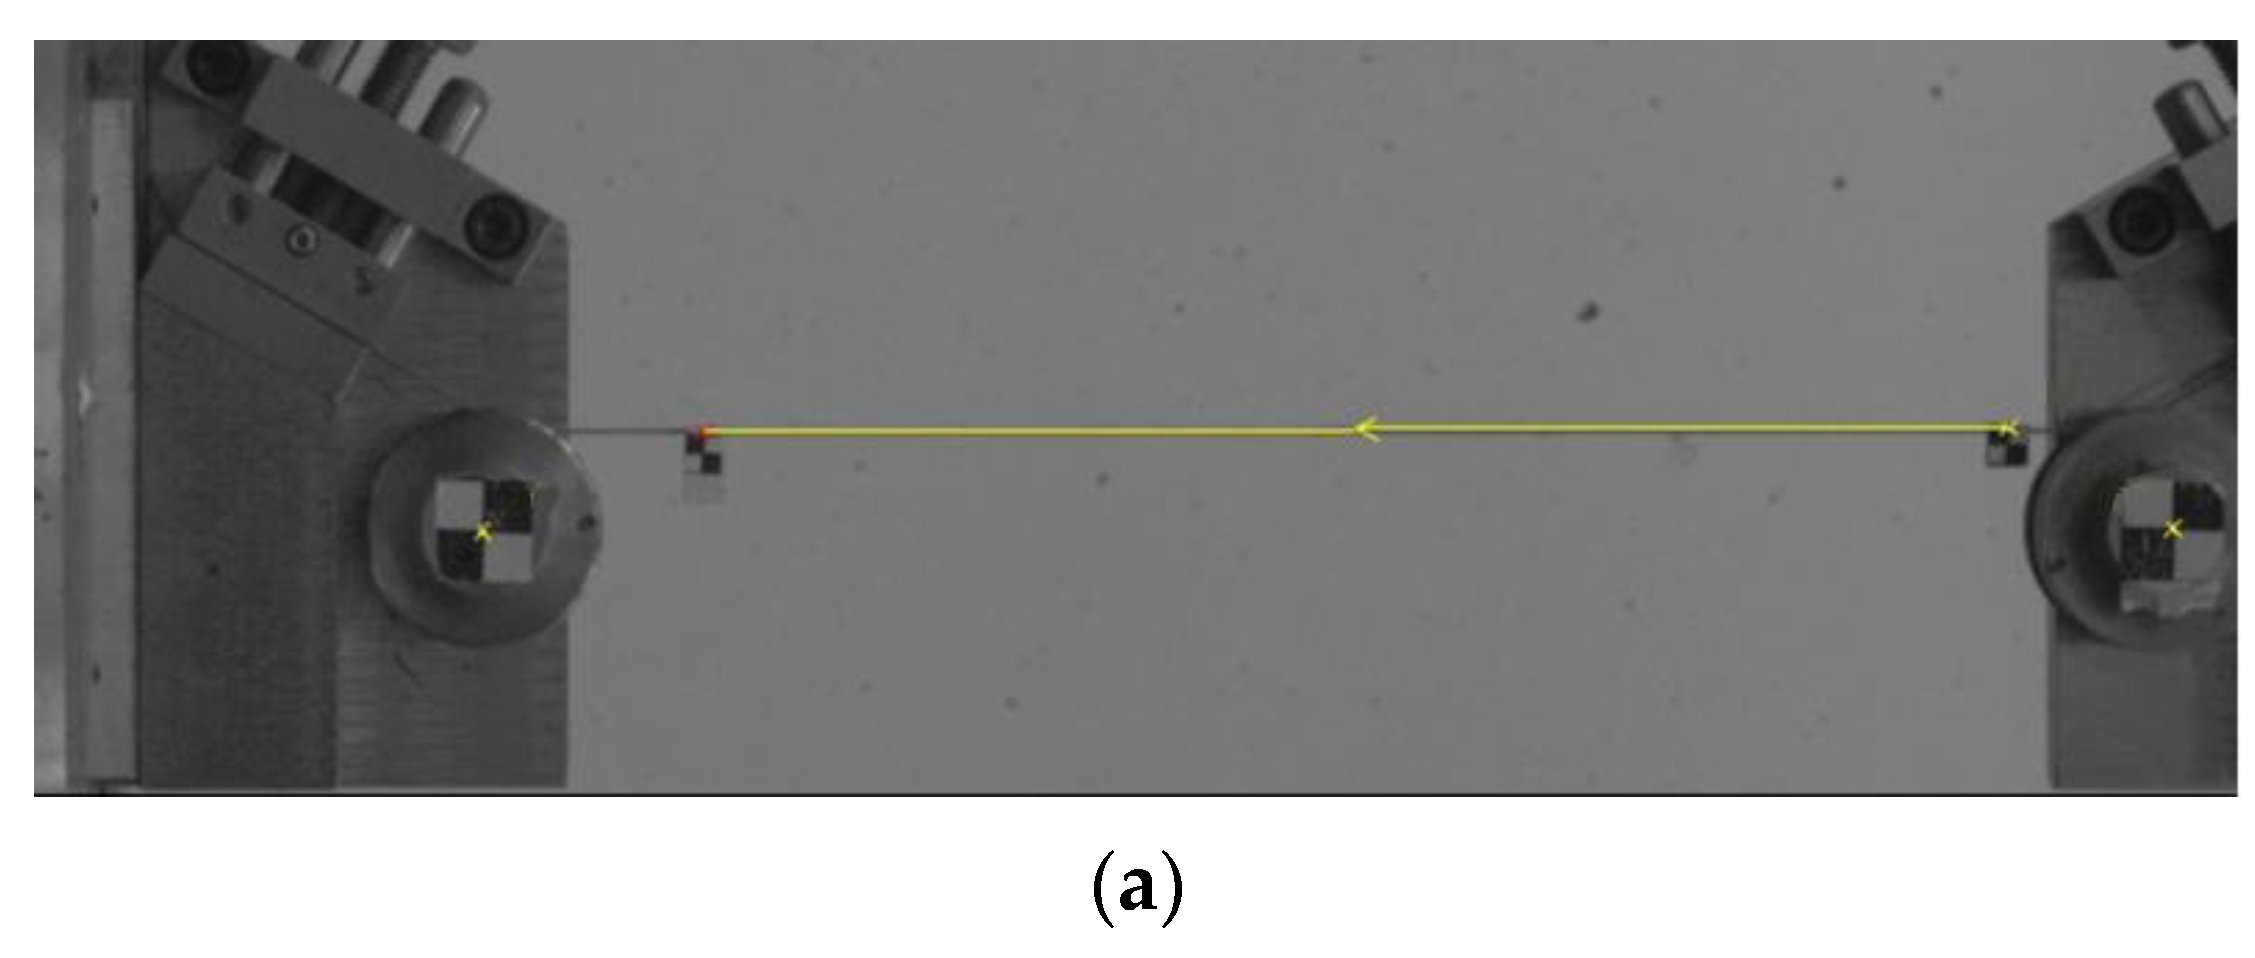
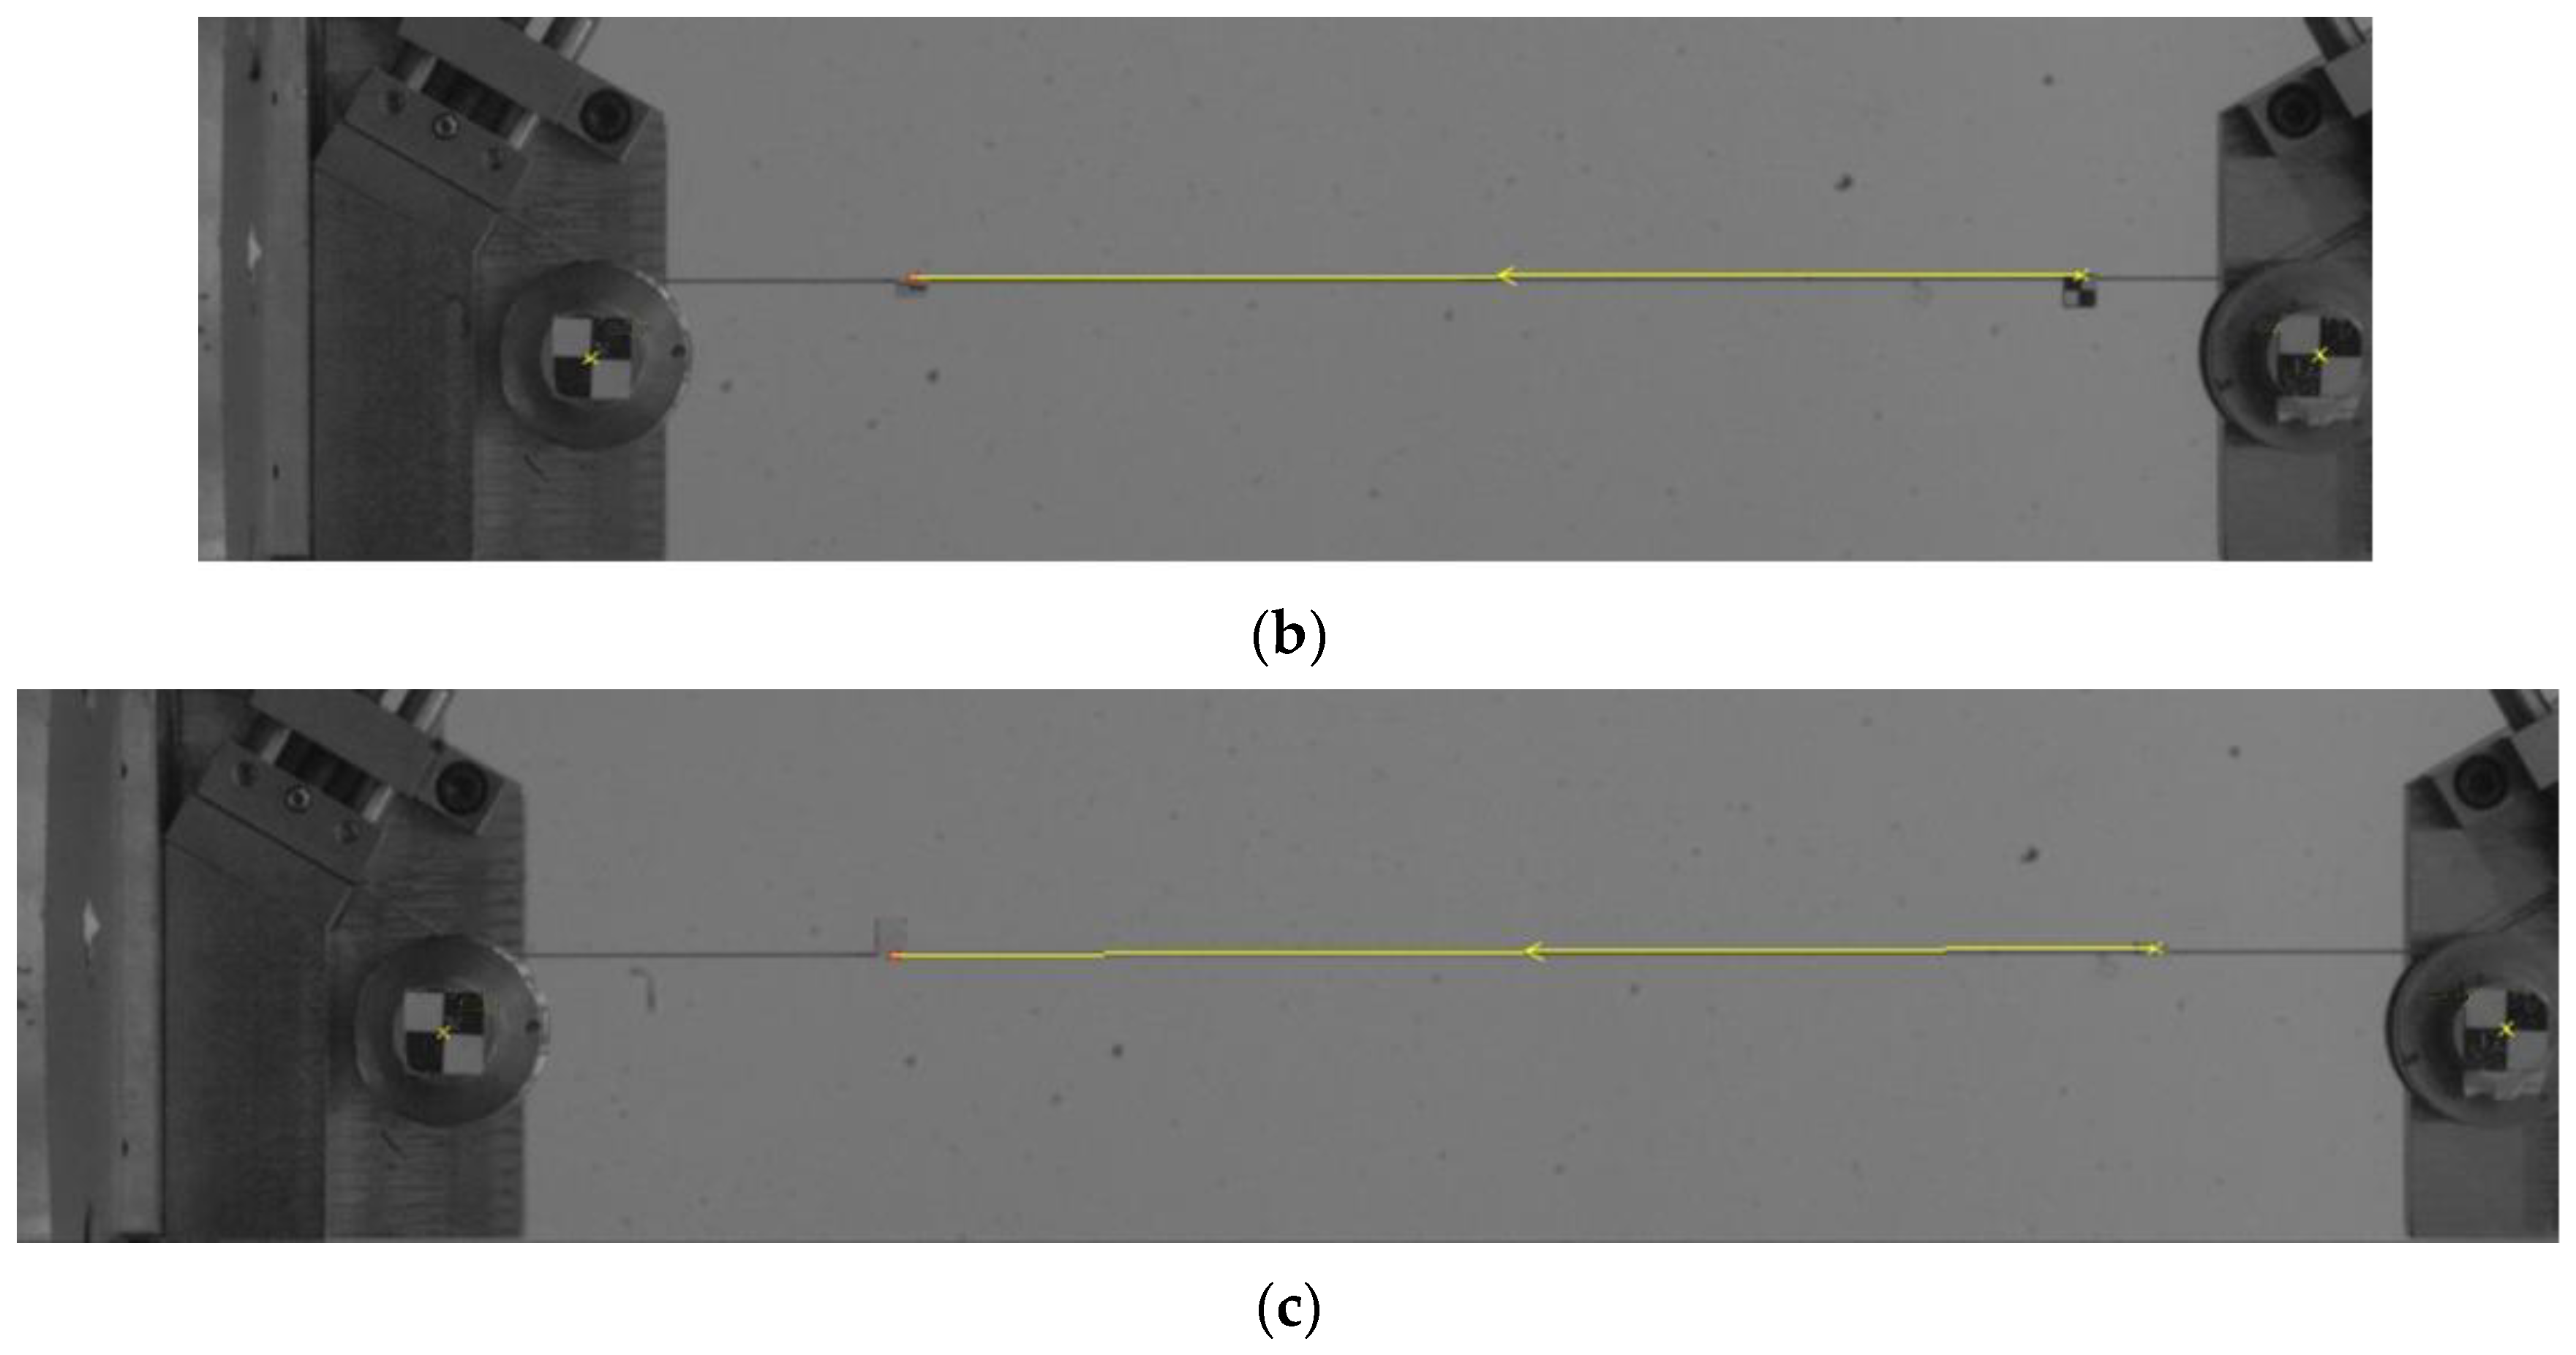
3. Methods
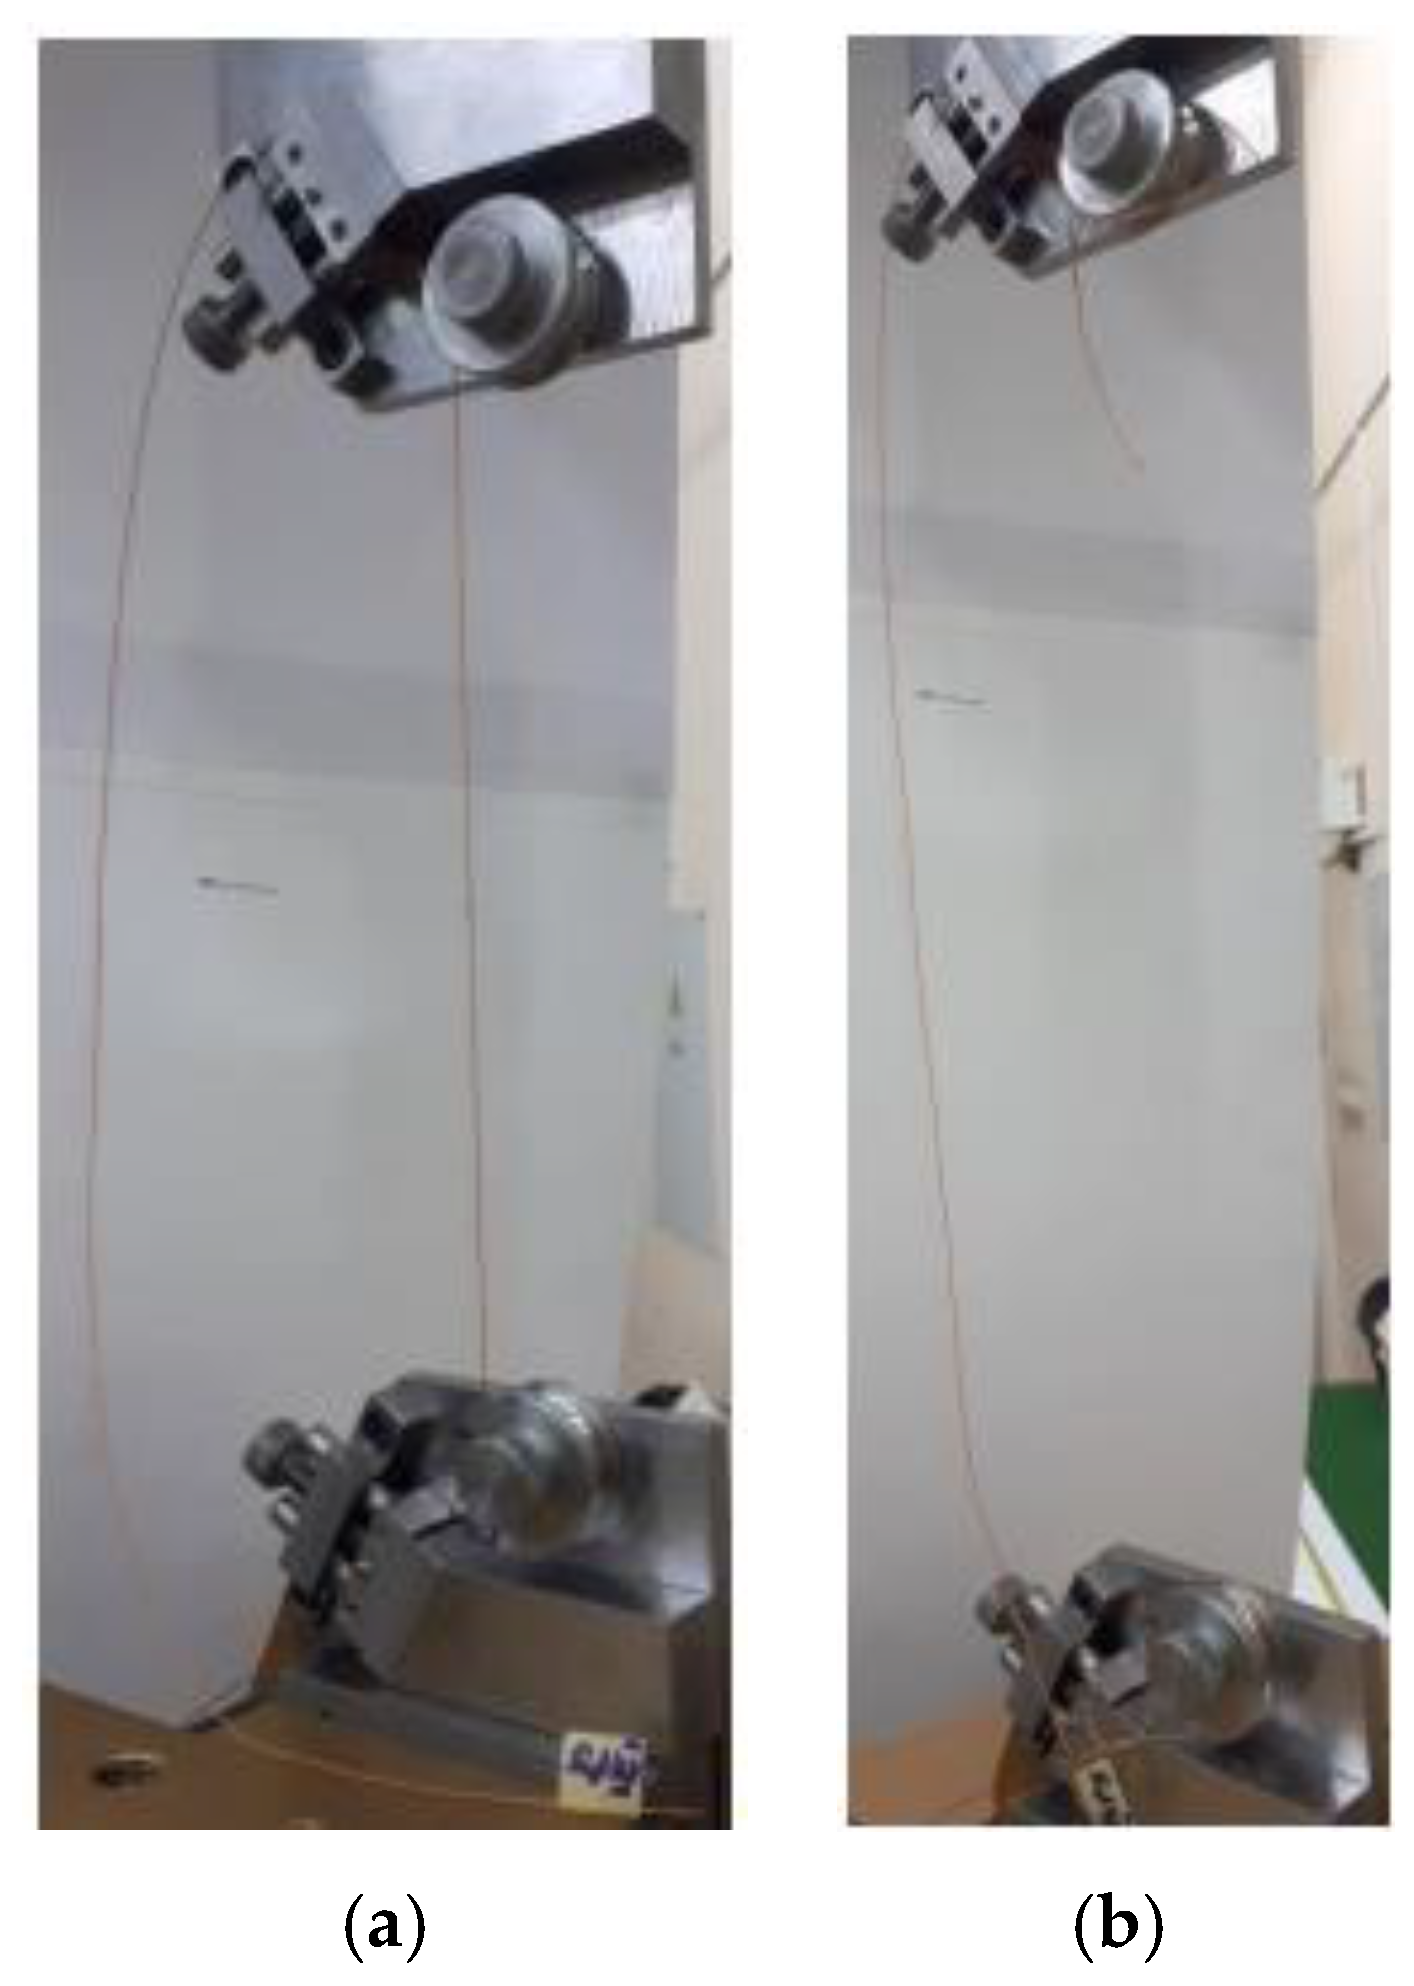
4. Testing Procedure
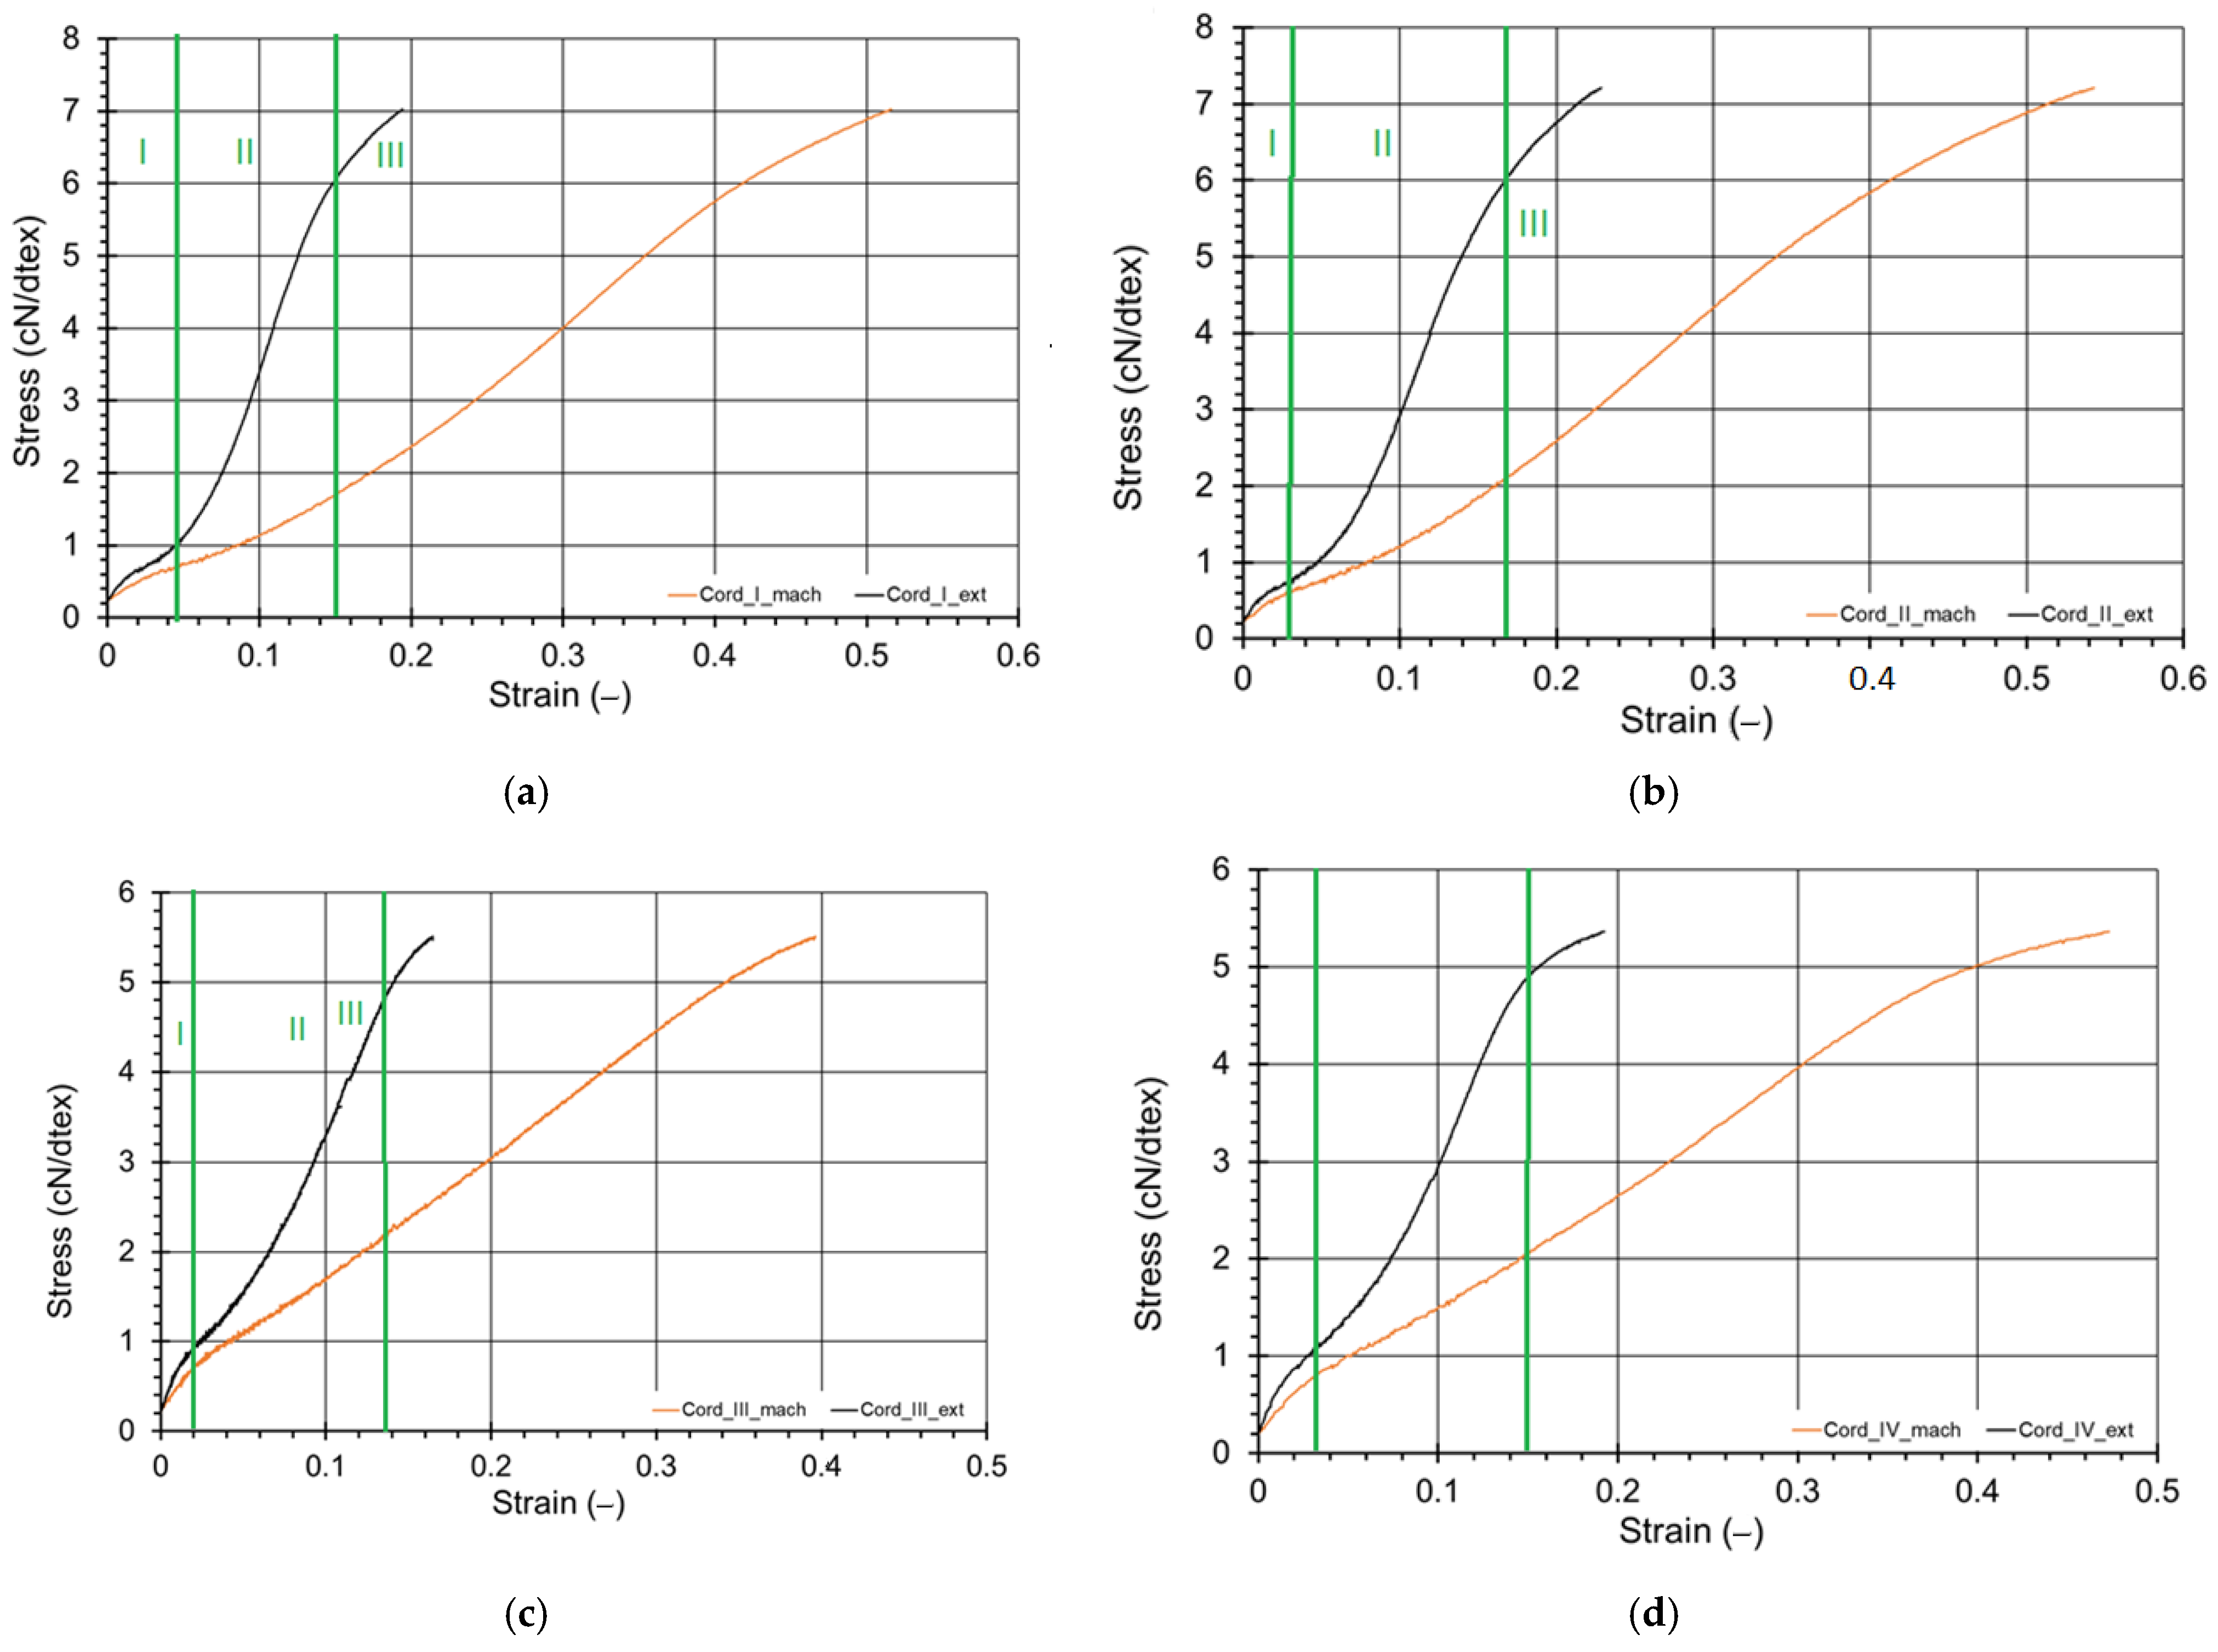
5. Results and Discussion
6. Conclusions
Author Contributions
Funding
Institutional Review Board Statement
Informed Consent Statement
Data Availability Statement
Conflicts of Interest
References
- Aziz, S.; Naficy, S.; Foroughi, J.; Brown, H.R.; Spinks, G.M. Characterisation of torsional actuation in highly twisted yarns and fibres. Polym. Test. 2015, 46, 88–97. [Google Scholar] [CrossRef] [Green Version]
- Horrocks, R.A.; Sitpalan, A.; Kandola, B.K. Design and characterisation of bicomponent polyamide 6 fibres with specific locations of each flame retardant component for enhanced flame retardancy. Polym. Test. 2019, 79, 106041. [Google Scholar] [CrossRef]
- Miedzińska, D.; Giełżecki, J.; Mania, R.; Marszalek, K.; Wolański, R. Influence of Ti-Si-N Nanocomposite Coating on Heat Radiation Resistance of Fireproof Fabrics. Materials 2021, 14, 3493. [Google Scholar] [CrossRef]
- Horrocks, R.; Sitpalan, A.; Zhou, C.; Kandola, B.K. Flame Retardant Polyamide Fibres: The Challenge of Minimising Flame Retardant Additive Contents with Added Nanoclays. Polymers 2016, 8, 288. [Google Scholar] [CrossRef] [PubMed] [Green Version]
- Schwarz, I.; Kovačević, S.; Vitlov, I. Influential Parameters of Starching Process on Mechanical Properties of Yarns Intended for Multifunctional Woven Fabrics for Thermal Protective Clothing. Polymers 2021, 13, 73. [Google Scholar] [CrossRef]
- Zhu, D.; Mobasher, B.; Rajan, S. Dynamic Tensile Testing of Kevlar 49 Fabrics. J. Mater. Civ. Eng. 2011, 23, 230–239. [Google Scholar] [CrossRef]
- Wu, L.; Wang, W.; Jiang, Q.; Xiang, C.; Lou, C.-W. Mechanical Characterization and Impact Damage Assessment of Hybrid Three-Dimensional Five-Directional Composites. Polymers 2019, 11, 1395. [Google Scholar] [CrossRef] [PubMed] [Green Version]
- Tonatto, M.L.P.; Forte, M.M.C.; Amico, S.C. Compressive-tensile fatigue behavior of cords/rubber composites. Polym. Test. 2017, 61, 185–190. [Google Scholar] [CrossRef]
- Carbone, M.G.P.; Parthenios, J.; Tsoukleri, G.; Cotugno, S.; Mensitieri, G.; Galiotis, C. Assessing micromechanical behaviour of PET cords in rubber matrix composites by laser Raman microscopy. Compos. Sci. Technol. 2013, 85, 104–110. [Google Scholar] [CrossRef]
- Qian, X.; Wang, H.; Zhang, D.; Wen, G. High strain rate out-of-plane compression properties of aramid fabric reinforced polyamide composite. Polym. Test. 2016, 53, 314–322. [Google Scholar] [CrossRef]
- Klata, E.; Van de Velde, K.; Krucińska, I. DSC investigations of polyamide 6 in hybrid GF/PA 6 yarns and composites. Polym. Test. 2003, 22, 929–937. [Google Scholar] [CrossRef]
- Giannopoulos, P.; Burgoyne, C.J. Stress limits for aramid fibres. Proc. Inst. Civ. Eng. Struct. Build. 2009, SB41, 221–232. [Google Scholar] [CrossRef] [Green Version]
- Hengstermann, M.; Mohammad, M.; Hasan, B.; Abdkader, A.; Cherif, C. Influence of Fibre Length and Preparation on Mechanical Properties of Carbon Fibre/Polyamidea 6 Hybrid Yarns and Composites. Fibres Text. East. Eur. 2016, 24, 55–62. [Google Scholar] [CrossRef]
- Gürgen, S.; Kuşhan, M.C. The ballistic performance of aramid based fabrics impregnated with multi-phase shear thickening fluids. Polym. Test. 2017, 64, 296–306. [Google Scholar] [CrossRef]
- Ghosh, A.; Majumdar, A.; Butola, B.S. Modulating the rheological response of shear thickening fluids by variation in molecular weight of carrier fluid and its correlation with impact resistance of treated p-aramid fabrics. Polym. Test. 2020, 91, 106830. [Google Scholar] [CrossRef]
- Hedayati, S.K.; Behravesh, A.H.; Hasannia, S.; Saed, A.B.; Akhoundi, B. 3D printed PCL scaffold reinforced with continuous biodegradable fiber yarn: A study on mechanical and cell viability properties. Polym. Test. 2020, 83, 106347. [Google Scholar] [CrossRef]
- Ding, Z.; Zhao, H.; Hu, W.; Wang, R. The role of twist on tensile and frictional characteristics of aramid filament yarns (AFYs). Mater. Res. Express 2021, 8, 025301. [Google Scholar] [CrossRef]
- Mandlekar, N.; Cayla, A.; Rault, F.; Giraud, S.; Salaün, F.; Guan, J. Development of Novel Polyamide 11 Multifilaments and Fabric Structures Based on Industrial Lignin and Zinc Phosphinate as Flame Retardants. Molecules 2020, 25, 4963. [Google Scholar] [CrossRef]
- Siyao, M.; Liu, S.; Peihua, Z.; Hairu, L. Functional Investigation on Automotive Interior Materials Based on Variable Knitted Structural Parameters. Polymers 2020, 12, 2455. [Google Scholar] [CrossRef]
- Lemmi, T.S.; Barburski, M.; Kabziński, A.; Frukacz, K. Effect of Thermal Aging on the Mechanical Properties of High Tenacity Polyester Yarn. Materials 2021, 14, 1666. [Google Scholar] [CrossRef]
- Kirshanov, K.; Toms, R.; Melnikov, P.; Gervald, A. Investigation of Polyester Tire Cord Glycolysis Accompanied by Rubber Crumb Devulcanization. Polymers 2022, 14, 684. [Google Scholar] [CrossRef] [PubMed]
- Chen, C.; Sun, M.; Wang, B.; Zhou, J.; Jiang, Z. Recent Advances on Drawing Technology of Ultra-Fine Steel Tire Cord and Steel Saw Wire. Metals 2021, 11, 1590. [Google Scholar] [CrossRef]
- Humeau, C.; Davies, P.; Smeets, P.; Engels, T.A.P.; Govaert, L.E.; Vlasblom, M.; Jacquemin, F. Tension fatigue failure prediction for HMPE fibre ropes. Polym. Test. 2018, 65, 497–504. [Google Scholar] [CrossRef] [Green Version]
- Mooneghi, S.A.; Gharehaghaji, A.A.; Hosseini-Toudeshky, H.; Torkaman, G. Tensile fatigue behavior of polyamide 66 nanofiber yarns. Polym. Eng. Sci. 2015, 55, 1805–1811. [Google Scholar] [CrossRef]
- Jing, L.; Shanyuan, W. Analysis and discussion of the modulus-strain curves of poly(ethylene terephthalate) and polyamide industrial yarns. Appl. Polym. Sci. 2005, 95, 859–862. [Google Scholar] [CrossRef]
- Freire, T.F.; Quinaz, T.; Fertuzinhos, A.; Quyền, N.T.; de Moura, M.F.S.M.; Martins, M.; Zille, A.; Dourado, N. Thermal, Mechanical and Chemical Analysis of Poly(vinyl alcohol) Multifilament and Braided Yarns. Polymers 2021, 13, 3644. [Google Scholar] [CrossRef]
- Bolskis, E.; Adomavičiūtė, E.; Griškonis, E. Formation and Investigation of Mechanical, Thermal, Optical and Wetting Properties of Melt-Spun Multifilament Poly(lactic acid) Yarns with Added Rosins. Polymers 2022, 14, 379. [Google Scholar] [CrossRef]
- Farsi Dooraki, B.; Nemes, J.A.; Bolduc, M. Study of parameters affecting the strength of yarns. In Journal De Physique IV (Proceedings); EDP Sciences: Ulis, France, 2006; Volume 134, pp. 1183–1188. [Google Scholar] [CrossRef]
- Baranowski, P.; Bogusz, P.; Gotowicki, P.; Malachowski, J. Assessment of mechanical properties of offroad vehicle tire: Coupons testing and FE model development. Acta Mech. Autom. 2012, 6, 17–22. [Google Scholar]
- ASTM D 885-03; Standard Test Methods for Tire Cords, Tire Cord Fabrics, and Industrial Filament Yarns Made from Manufactured Organic-Base Fibers. ASTM International: West Conshohocken, PA, USA, 2011.
- ASTM D7269/D7269M–17; Standard Test Methods for Tensile Testing of Aramid Yarns. ASTM International: West Conshohocken, PA, USA, 2020.
- Chu, T.C.; Ranson, W.F.; Sutton, M.A.; Peters, W.H. Application of digital-image correlation techniques to experimental mechanics. Exp. Mech. 1985, 25, 232–244. [Google Scholar] [CrossRef]
- Kowalewski, Z.; Dietrich, L.; Kopeć, M.; Szymczak, T.; Grzywna, P. Nowoczesne systemy optyczne w badaniach mechanicznych-budowa, działanie, zastosowania (Modern optical systems in mechanical research-structure, operation, applications). In Proceedings of the XXII Seminarium: Nieniszczące Badania Materiałów, Zakopane, Poland, 16–18 March 2016; pp. 1–32. [Google Scholar]
- Tian, L.; Lv, P.; Zhuo, J.; Wei, Q. Preparation and characteristics of an advanced polyester tire cord with hybrid effect. J. Eng. Fibers Fabr. 2019, 14, 1–7. [Google Scholar] [CrossRef] [Green Version]
- Aytac, A.; Yilmaz, B.; Deniz, V. Effects of Linear Density and Twist Level on the Mechanical Properties of Nylon 6.6 Tyre Cords. Fibers Polym. 2010, 11, 309–315. [Google Scholar] [CrossRef]
- Kiselev, S.V.; Pereborova, N.V.; Titova, L.V. Influence of Degree of Twist of Polyester Sewing Threads on Their Deformation Properties. Fibre Chem. 2021, 53, 171–175. [Google Scholar] [CrossRef]
- Brereton, M.G.; Croll, S.G.; Duckett, R.A.; Ward, I.M. Non-linear viscoelastic behaviour of polymers: An implicit equation approach. J. Mech. Phys. Solids 1974, 22, 97–125. [Google Scholar] [CrossRef]
- Miedzińska, D.; Popławski, A.; Kwietniewski, M.; Lutyński, M. The impact of CO2 injection on steel balls embedment in shale rock—Experimental research. J. Nat. Gas Sci. Eng. 2018, 56, 619–628. [Google Scholar] [CrossRef]
- Miedzińska, D.; Gieleta, R.; Popławski, A. Experimental Study on Influence of Curing Time on Strength Behavior of SLA-Printed Samples Loaded with Different Strain Rates. Materials 2020, 13, 5825. [Google Scholar] [CrossRef] [PubMed]


| Name | Symbol | Dtex | Doubling | Breaking Force Min. (N) | Elongation for 45N | Elongation at Break | Thickness (mm) | Twist | Initial Force (N) |
|---|---|---|---|---|---|---|---|---|---|
| Kordarna Plus PA6 | I | 1880 | ×1×2 | 265 | 6.5% | 24 ± 2% | 0.76 | S 335/335 | 9.40 |
| PA6_Cordenka | II | 1880 | ×1×2 | 265 | 6.5% | 23 ± 2% | 0.76 | S 335/335 | 9.40 |
| PES 1440 (special version) | III | 1440 | ×1×2 | 173 | NA | 16 ± 2% | 0.65 | S 410/410 | 7.20 |
| Kordarna Plus PES | IV | 1670 | ×1×2 | 205 | 3.5% | 16 ± 2% | 0.70 | S 390/390 | 8.35 |
| Sample Symbol | Data Sampling Rate Instron 8802 | Load Speed | Initial Force |
|---|---|---|---|
| (Hz) | (mm/min) | (N) | |
| All samples | 50 | 300 | 1.7–2.1 |
| Standard Deviation | Cord I | Cord II | Cord III | Cord IV |
|---|---|---|---|---|
| Breaking force (N) | 6.8 | 6.2 | 3.3 | 3.1 |
| Elongation at break * (−) | 0.0268 | 0.0162 | 0.0167 | 0.0235 |
| Elongation at break ext ** (−) | 0.0060 | |||
| Uncertainty (95% of Confidence) | Cord I | Cord II | Cord III | Cord IV |
| Breaking force (N) | ±3.8 | ±4.4 | ±2.0 | ±1.9 |
| Elongation at break * (−) | ±0.0148 | ±0.0116 | ±0.0101 | ±0.0142 |
| Elongation at break ext ** (−) | ±0.0149 |
| Name | Symbol | Actual Linear Density (Dtex) | Data Source | Initial Modulus (cN/dtex) | Breaking Force (N) Min./Aver. | Relative Error (%) | Elongation at Break (−) | Relative Error (%) | Strain Correction Factor |
|---|---|---|---|---|---|---|---|---|---|
| Extensometer/Machine Head | |||||||||
| Kordarna Plus PA6 | I | 4068 | Producer’s | - | 265/- | - | 0.24 | - | - |
| Machine head | - | 274.2/286.3 | 3.5/8.0 | 0.50 | 109.7 | - | |||
| Extensometer | 13.80 | 274.2/286.3 | 3.5/8.0 | 0.188 | −21.5 | 0.374 | |||
| PA6_Cordenka | II | 4139 | Producer’s | - | 265/- | - | 0.23 | - | - |
| Machine head | - | 281.5/290.5 | 6.2/9.6 | 0.54 | 132.8 | - | |||
| Extensometer | 13.30 | 281.5/290.5 | 6.2/9.6 | 0.228 | −0.70 | 0.427 | |||
| PES 1440 | III | 3382 | Producer’s | - | 173/- | - | 0.16 | - | - |
| Machine head | - | 178.5/184.4 | 3.2/6.6 | 0.390 | 143.7 | - | |||
| Extensometer | 21.30 | 178.5/184.4 | 3.2/6.6 | 0.165 | 2.94 | 0.422 | |||
| Kordarna Plus PES | IV | 3963 | Producer’s | - | 205/- | - | 0.16 | - | - |
| Machine head | - | 205.8/211.8 | 0.4/3.3 | 0.456 | 185.0 | - | |||
| Extensometer | 19.20 | 205.8/211.8 | 0.4/3.3 | 0.192 | 20.25 | 0.422 |
Publisher’s Note: MDPI stays neutral with regard to jurisdictional claims in published maps and institutional affiliations. |
© 2022 by the authors. Licensee MDPI, Basel, Switzerland. This article is an open access article distributed under the terms and conditions of the Creative Commons Attribution (CC BY) license (https://creativecommons.org/licenses/by/4.0/).
Share and Cite
Bogusz, P.; Miedzińska, D.; Wieczorek, M. Experimental Investigation of the Tensile Behavior of Selected Tire Cords Using Novel Testing Equipment. Materials 2022, 15, 4163. https://doi.org/10.3390/ma15124163
Bogusz P, Miedzińska D, Wieczorek M. Experimental Investigation of the Tensile Behavior of Selected Tire Cords Using Novel Testing Equipment. Materials. 2022; 15(12):4163. https://doi.org/10.3390/ma15124163
Chicago/Turabian StyleBogusz, Paweł, Danuta Miedzińska, and Marcin Wieczorek. 2022. "Experimental Investigation of the Tensile Behavior of Selected Tire Cords Using Novel Testing Equipment" Materials 15, no. 12: 4163. https://doi.org/10.3390/ma15124163
APA StyleBogusz, P., Miedzińska, D., & Wieczorek, M. (2022). Experimental Investigation of the Tensile Behavior of Selected Tire Cords Using Novel Testing Equipment. Materials, 15(12), 4163. https://doi.org/10.3390/ma15124163