
Comparative Analysis of the Thermal Conductivity of Handmade and Mechanical Bricks Used in the Cultural Heritage


 , and
, and 
Abstract
:1. Introduction
2. Materials and Methods
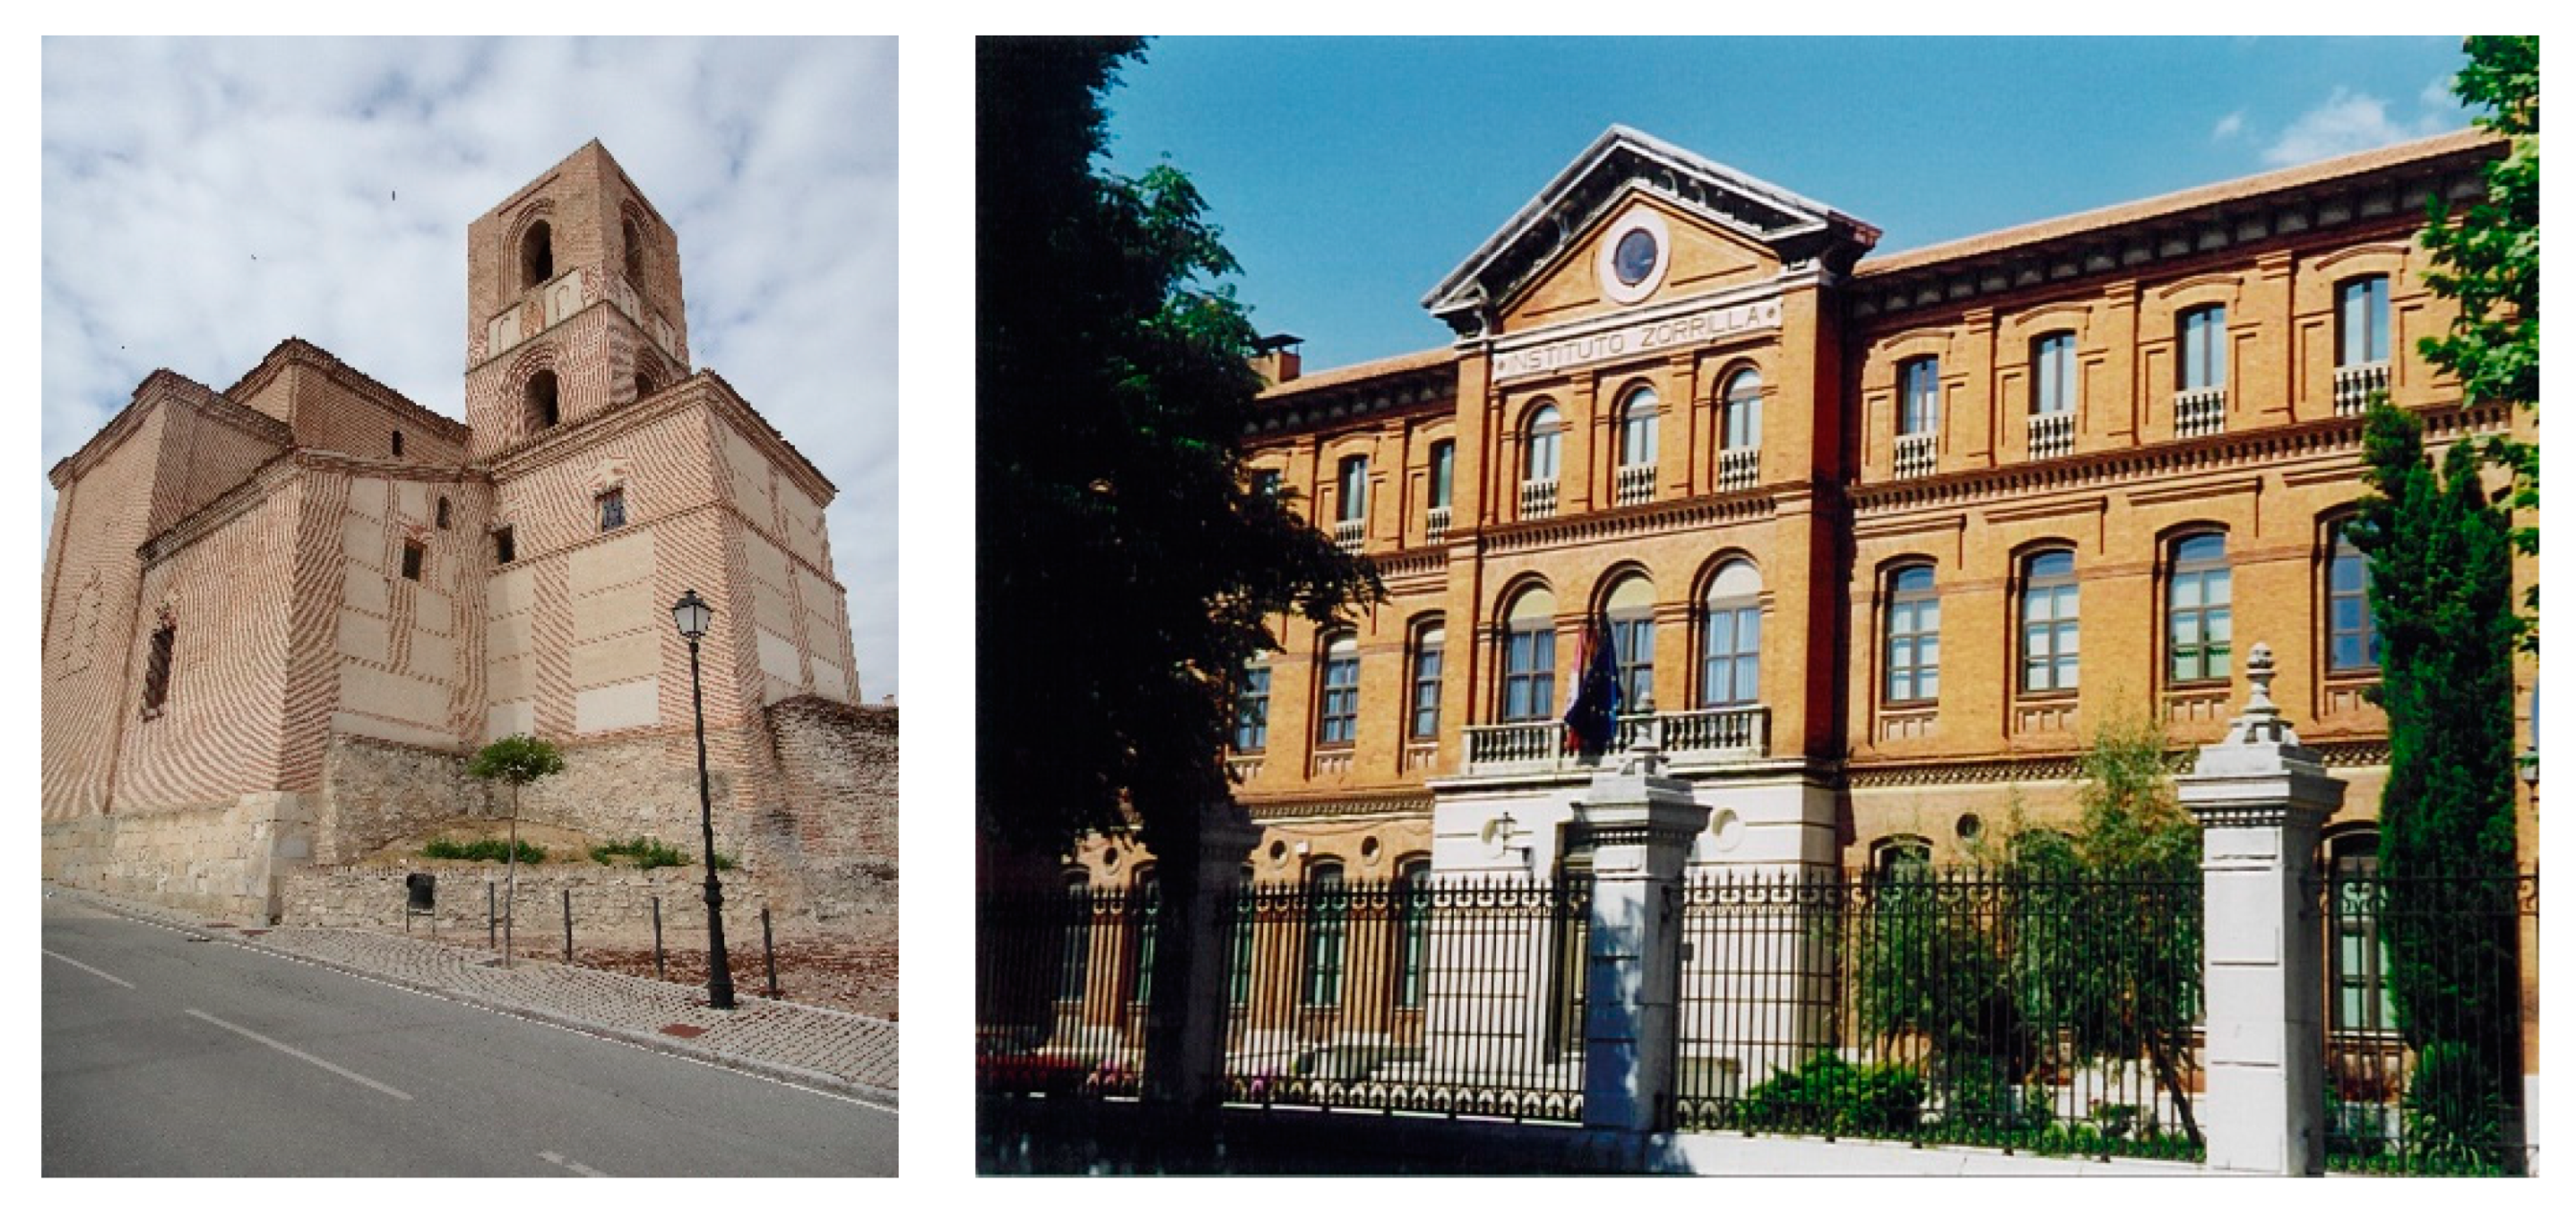
2.1. Location and Selection of Study Material
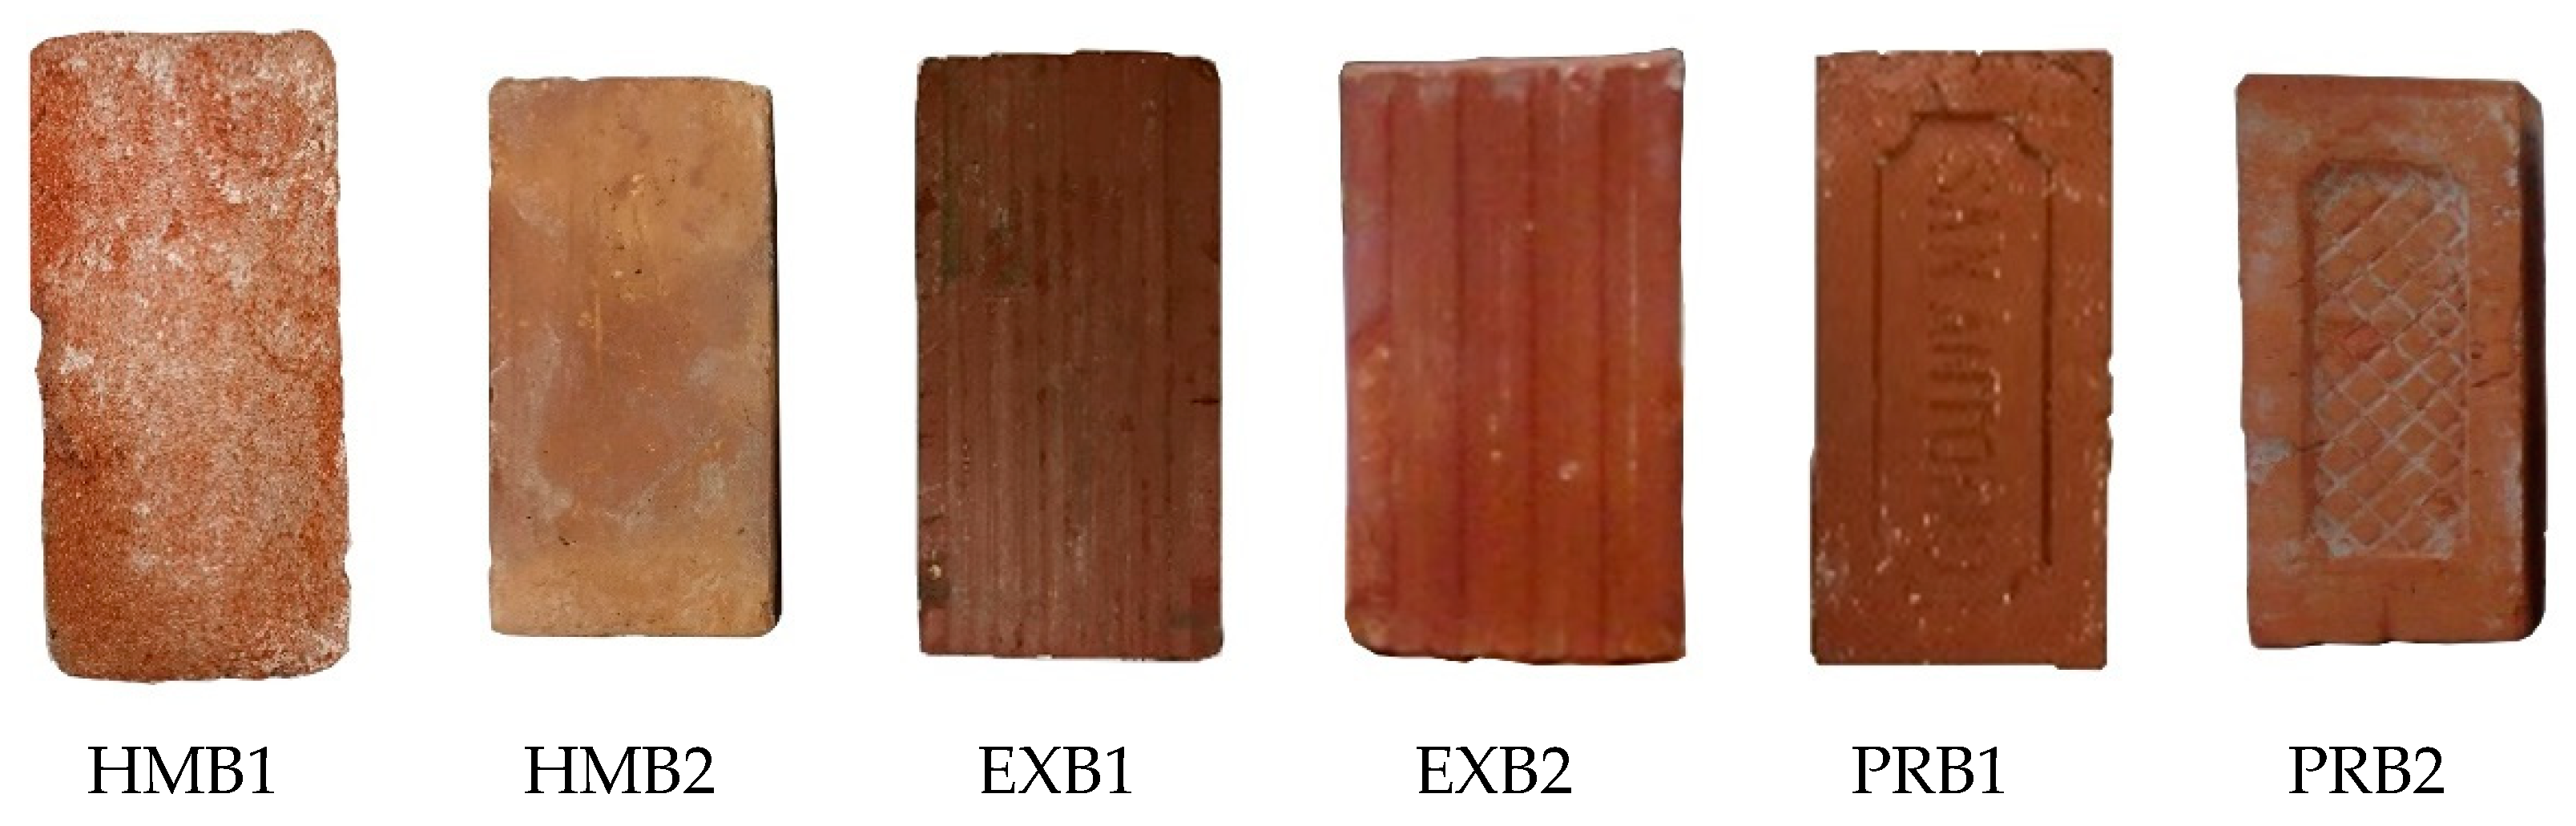
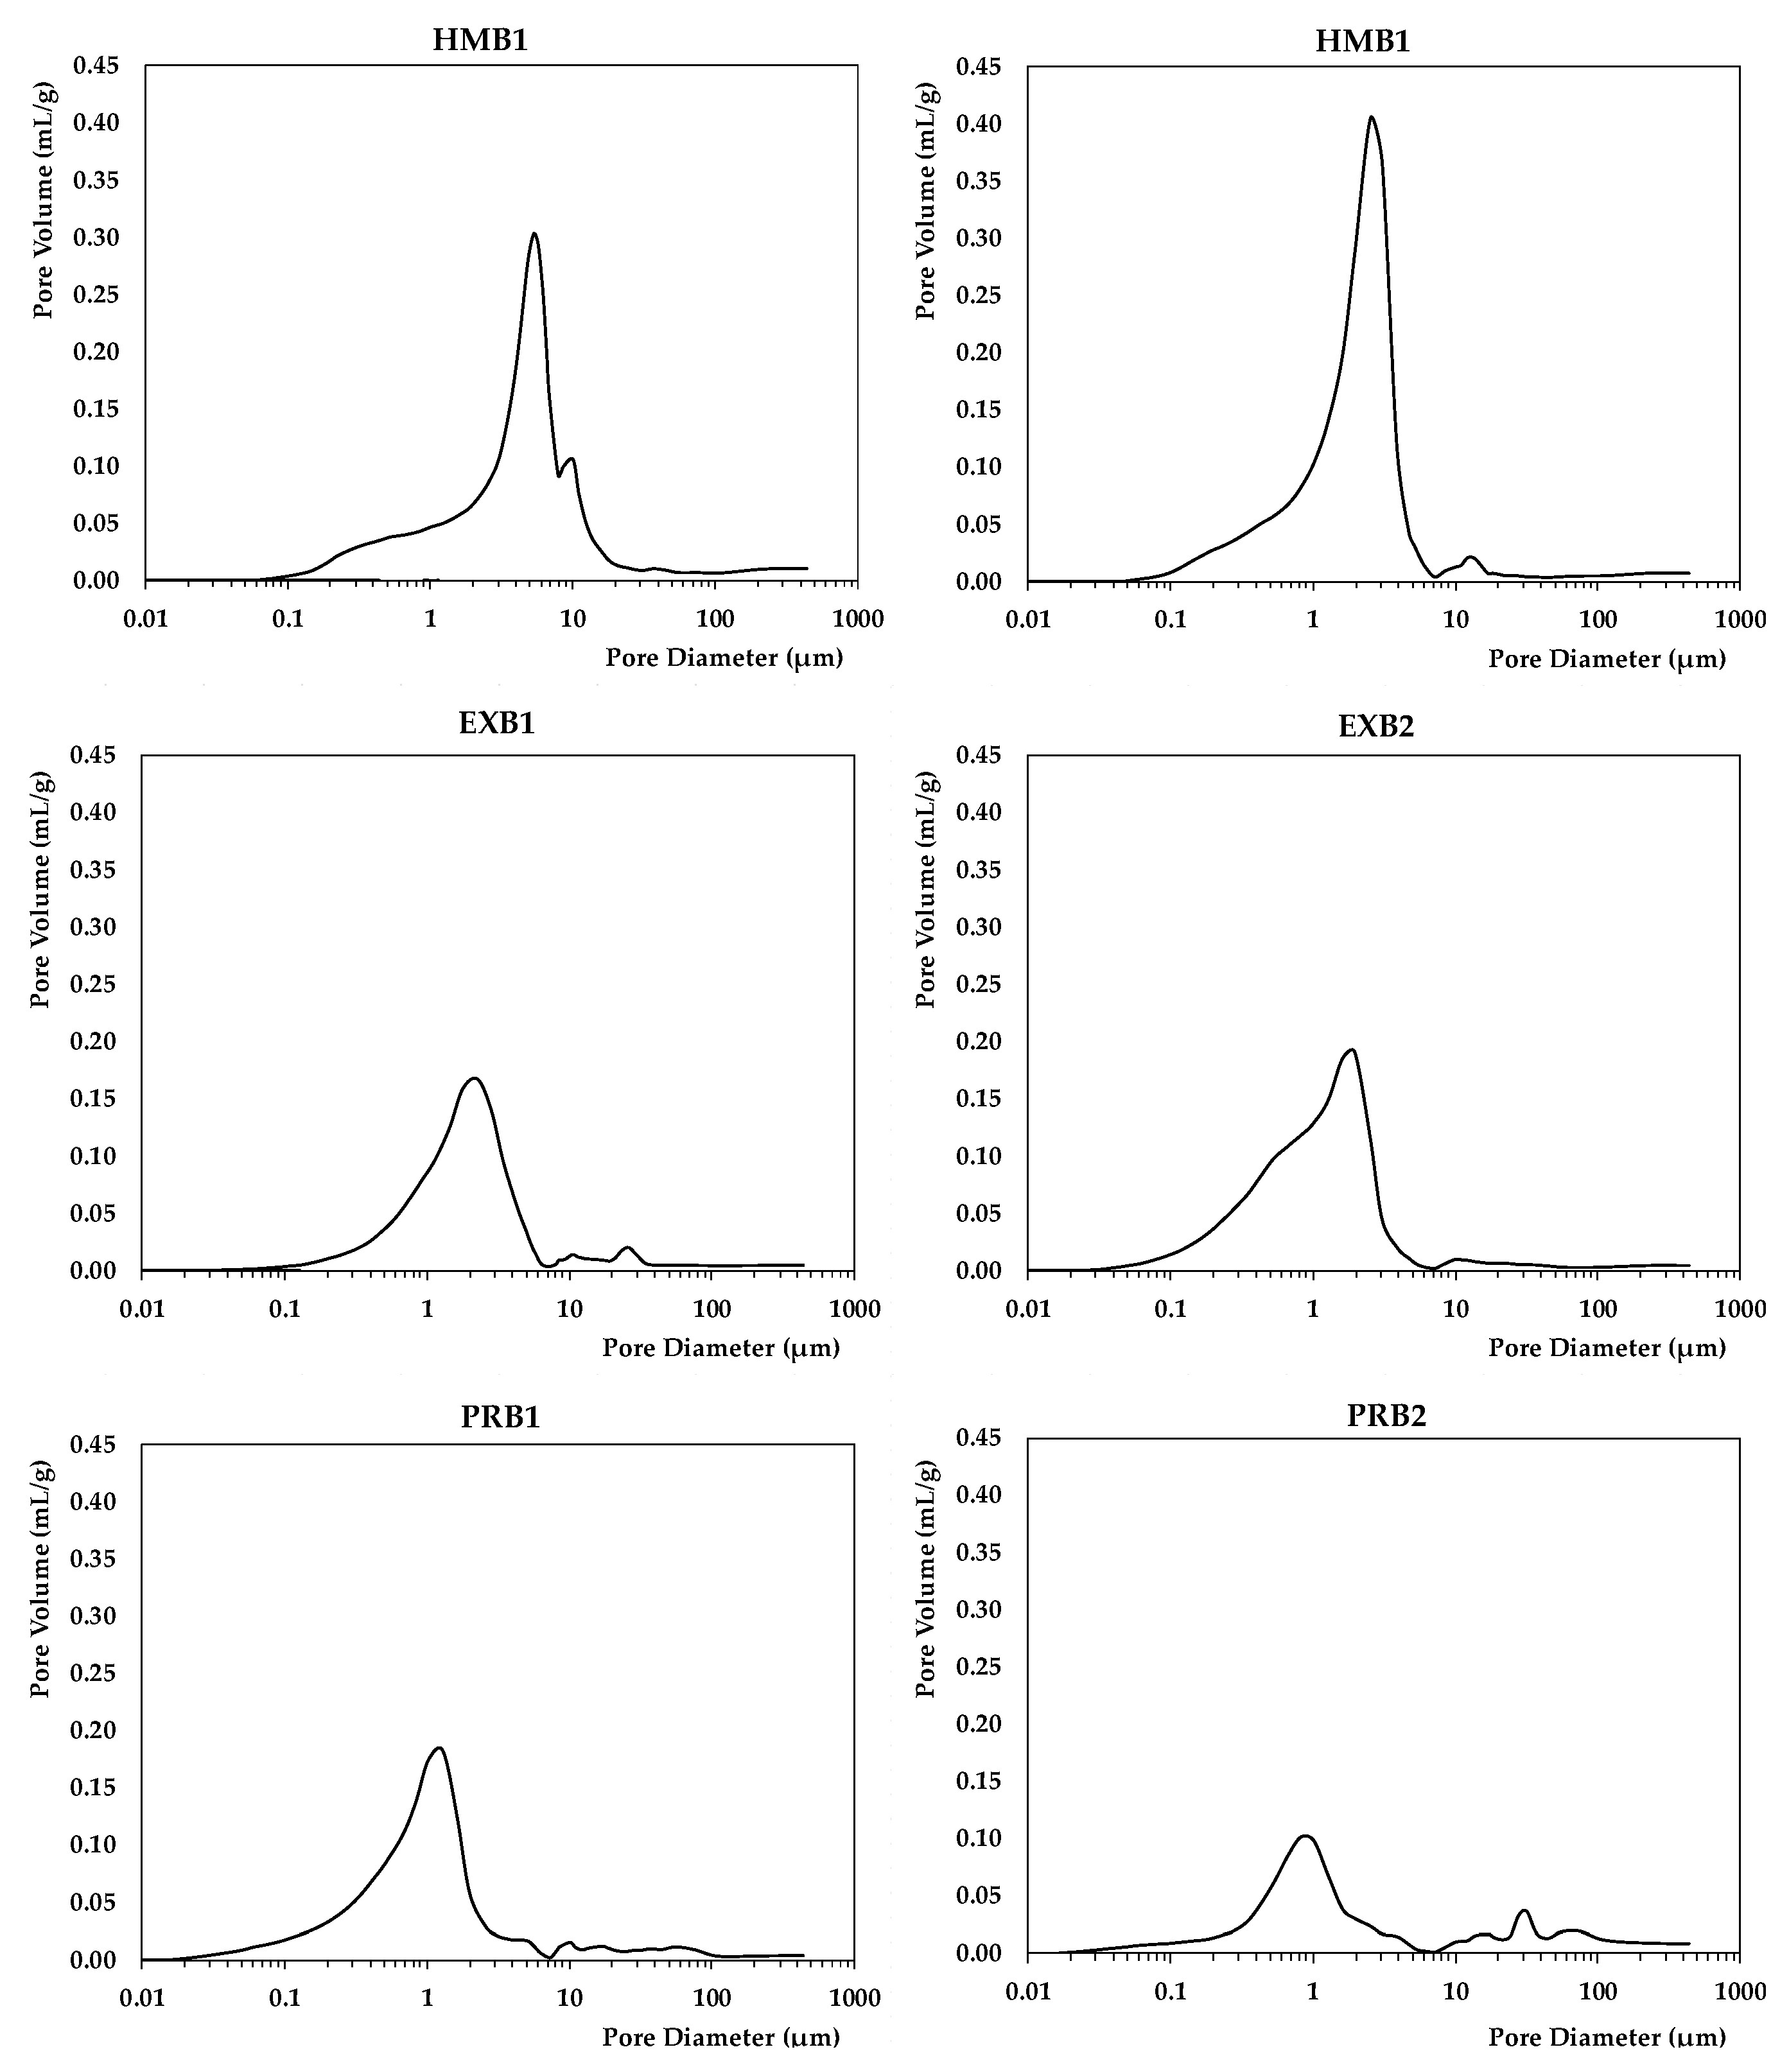
2.2. Characterization of Brick Pieces
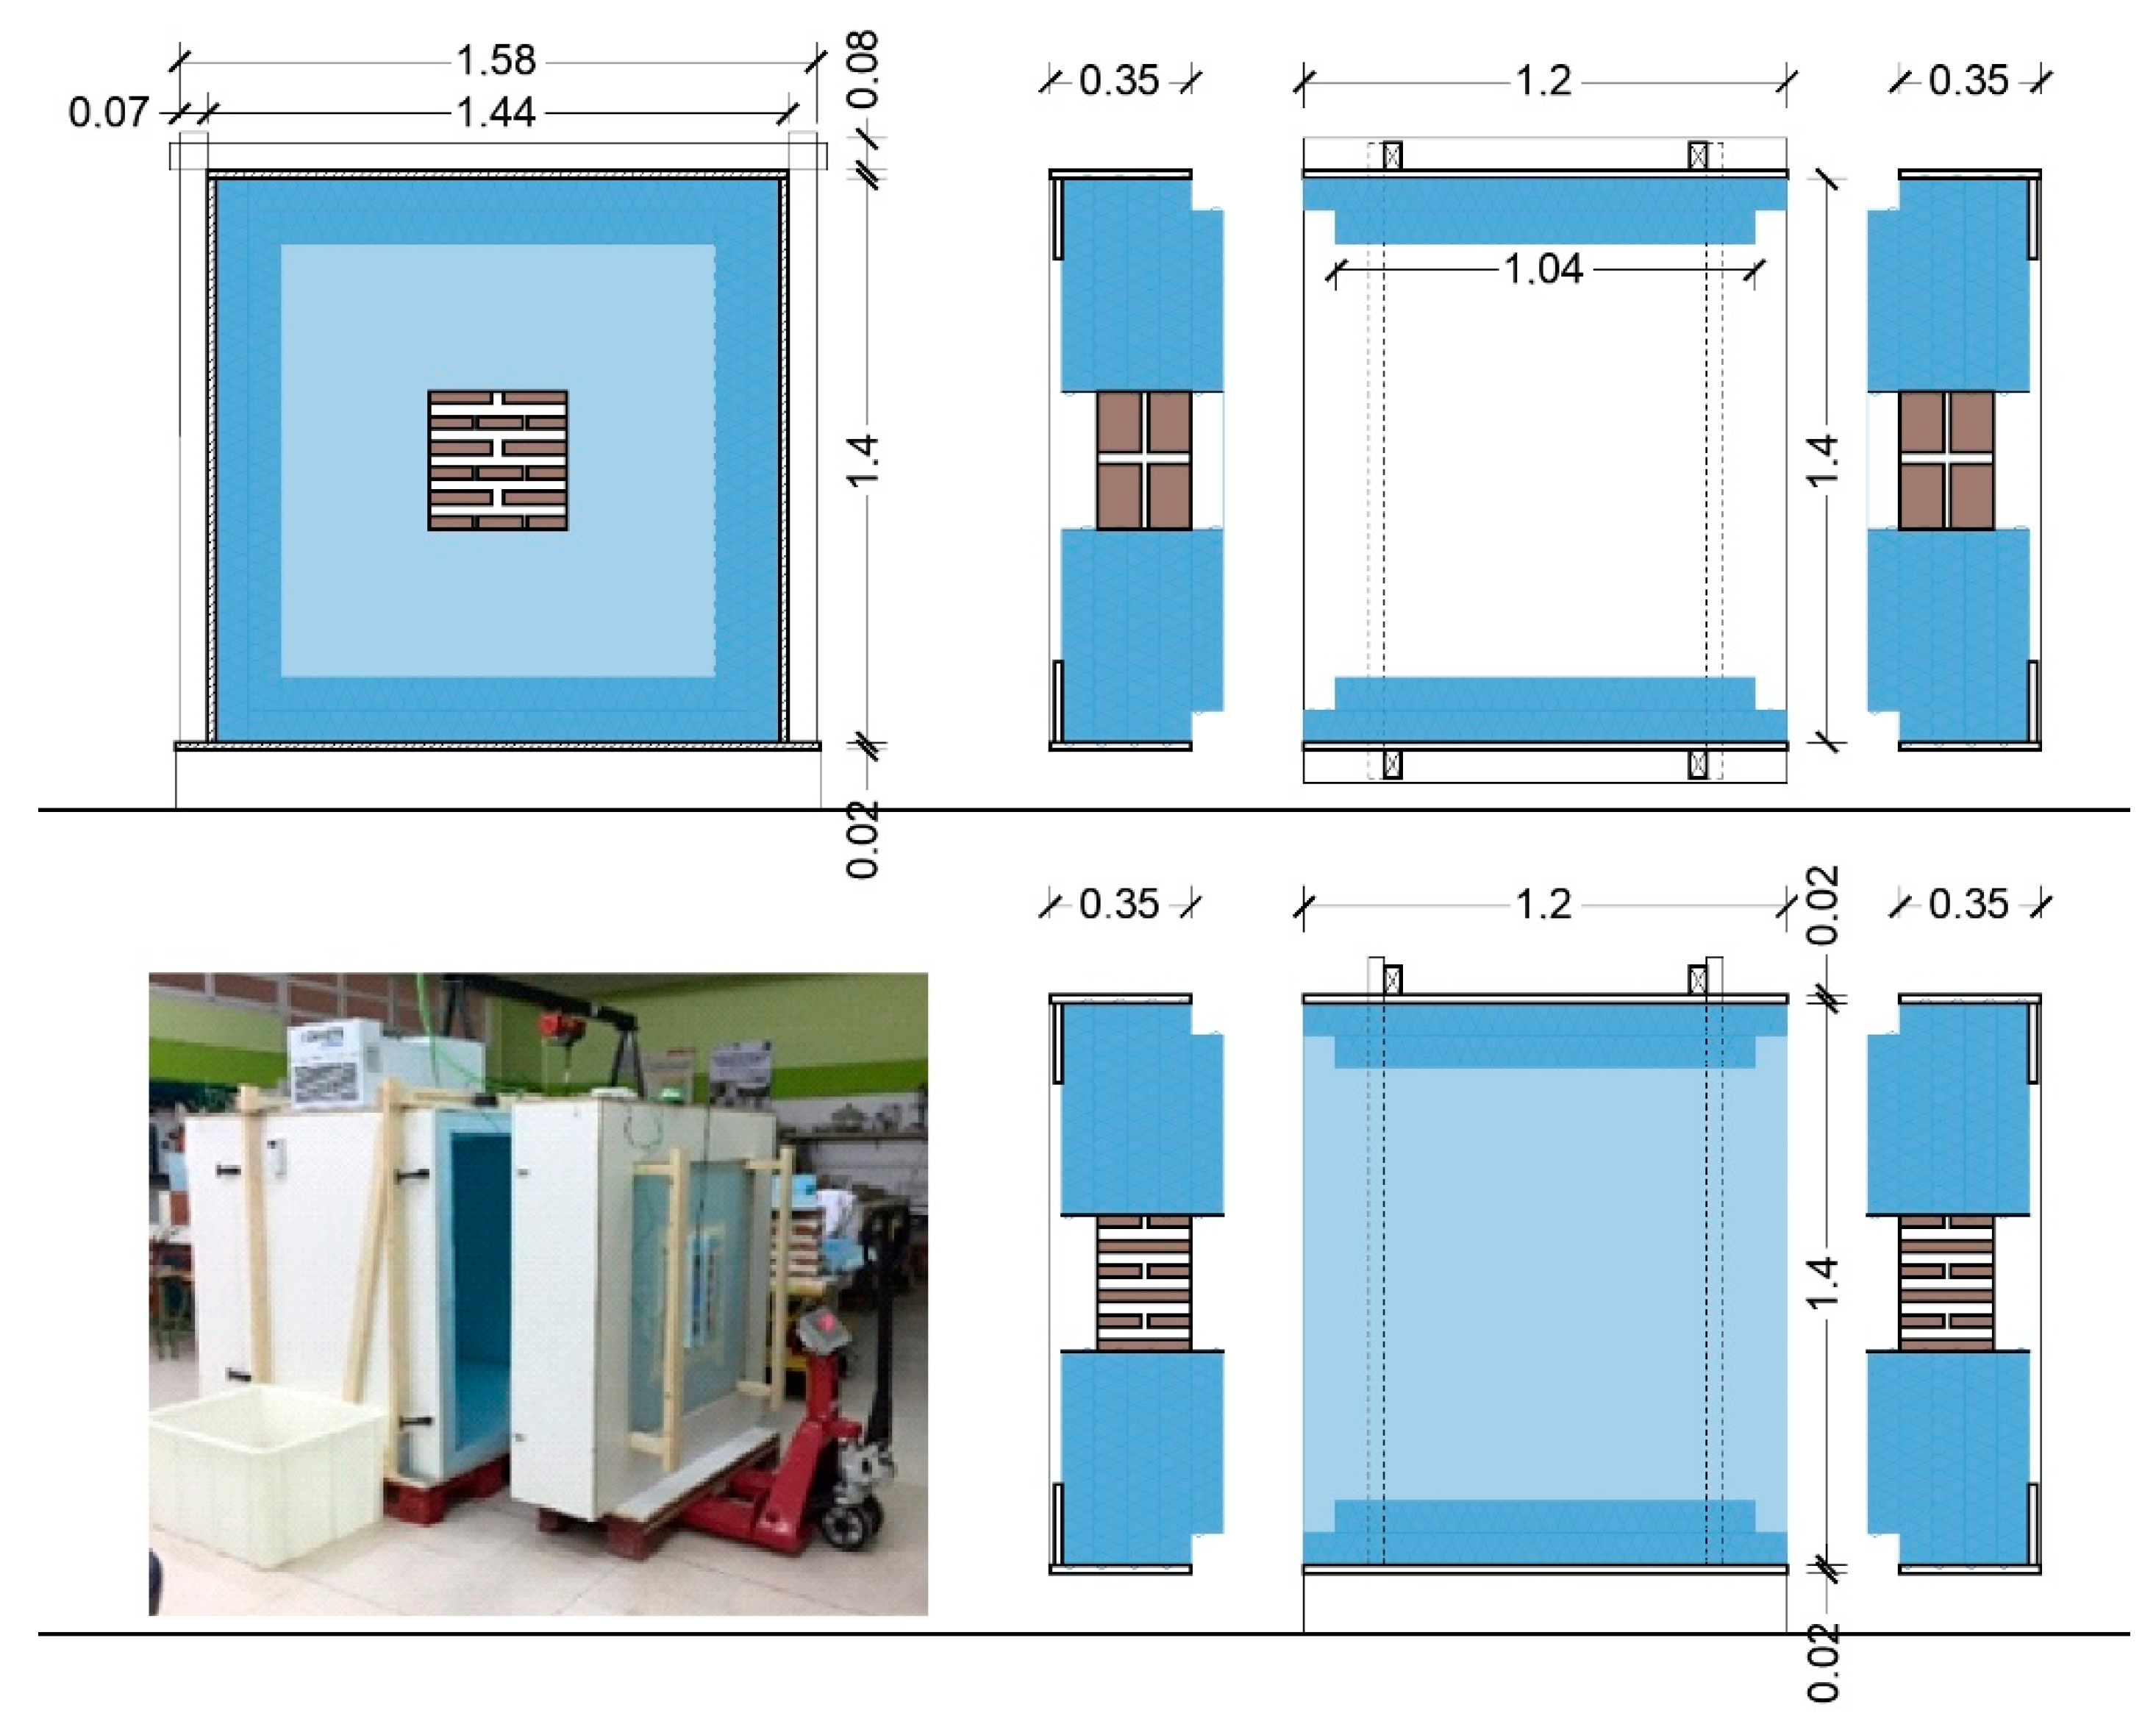
2.3. Manufacture of Test Samples
2.4. Heat Flow Tests
2.5. Analytical Calculation According to Standard UNE-EN 1745
2.6. Data Analysis and Comparative Study
3. Results
3.1. Results of Tests Performed on Bricks
3.2. Results of Tests on Test Samples
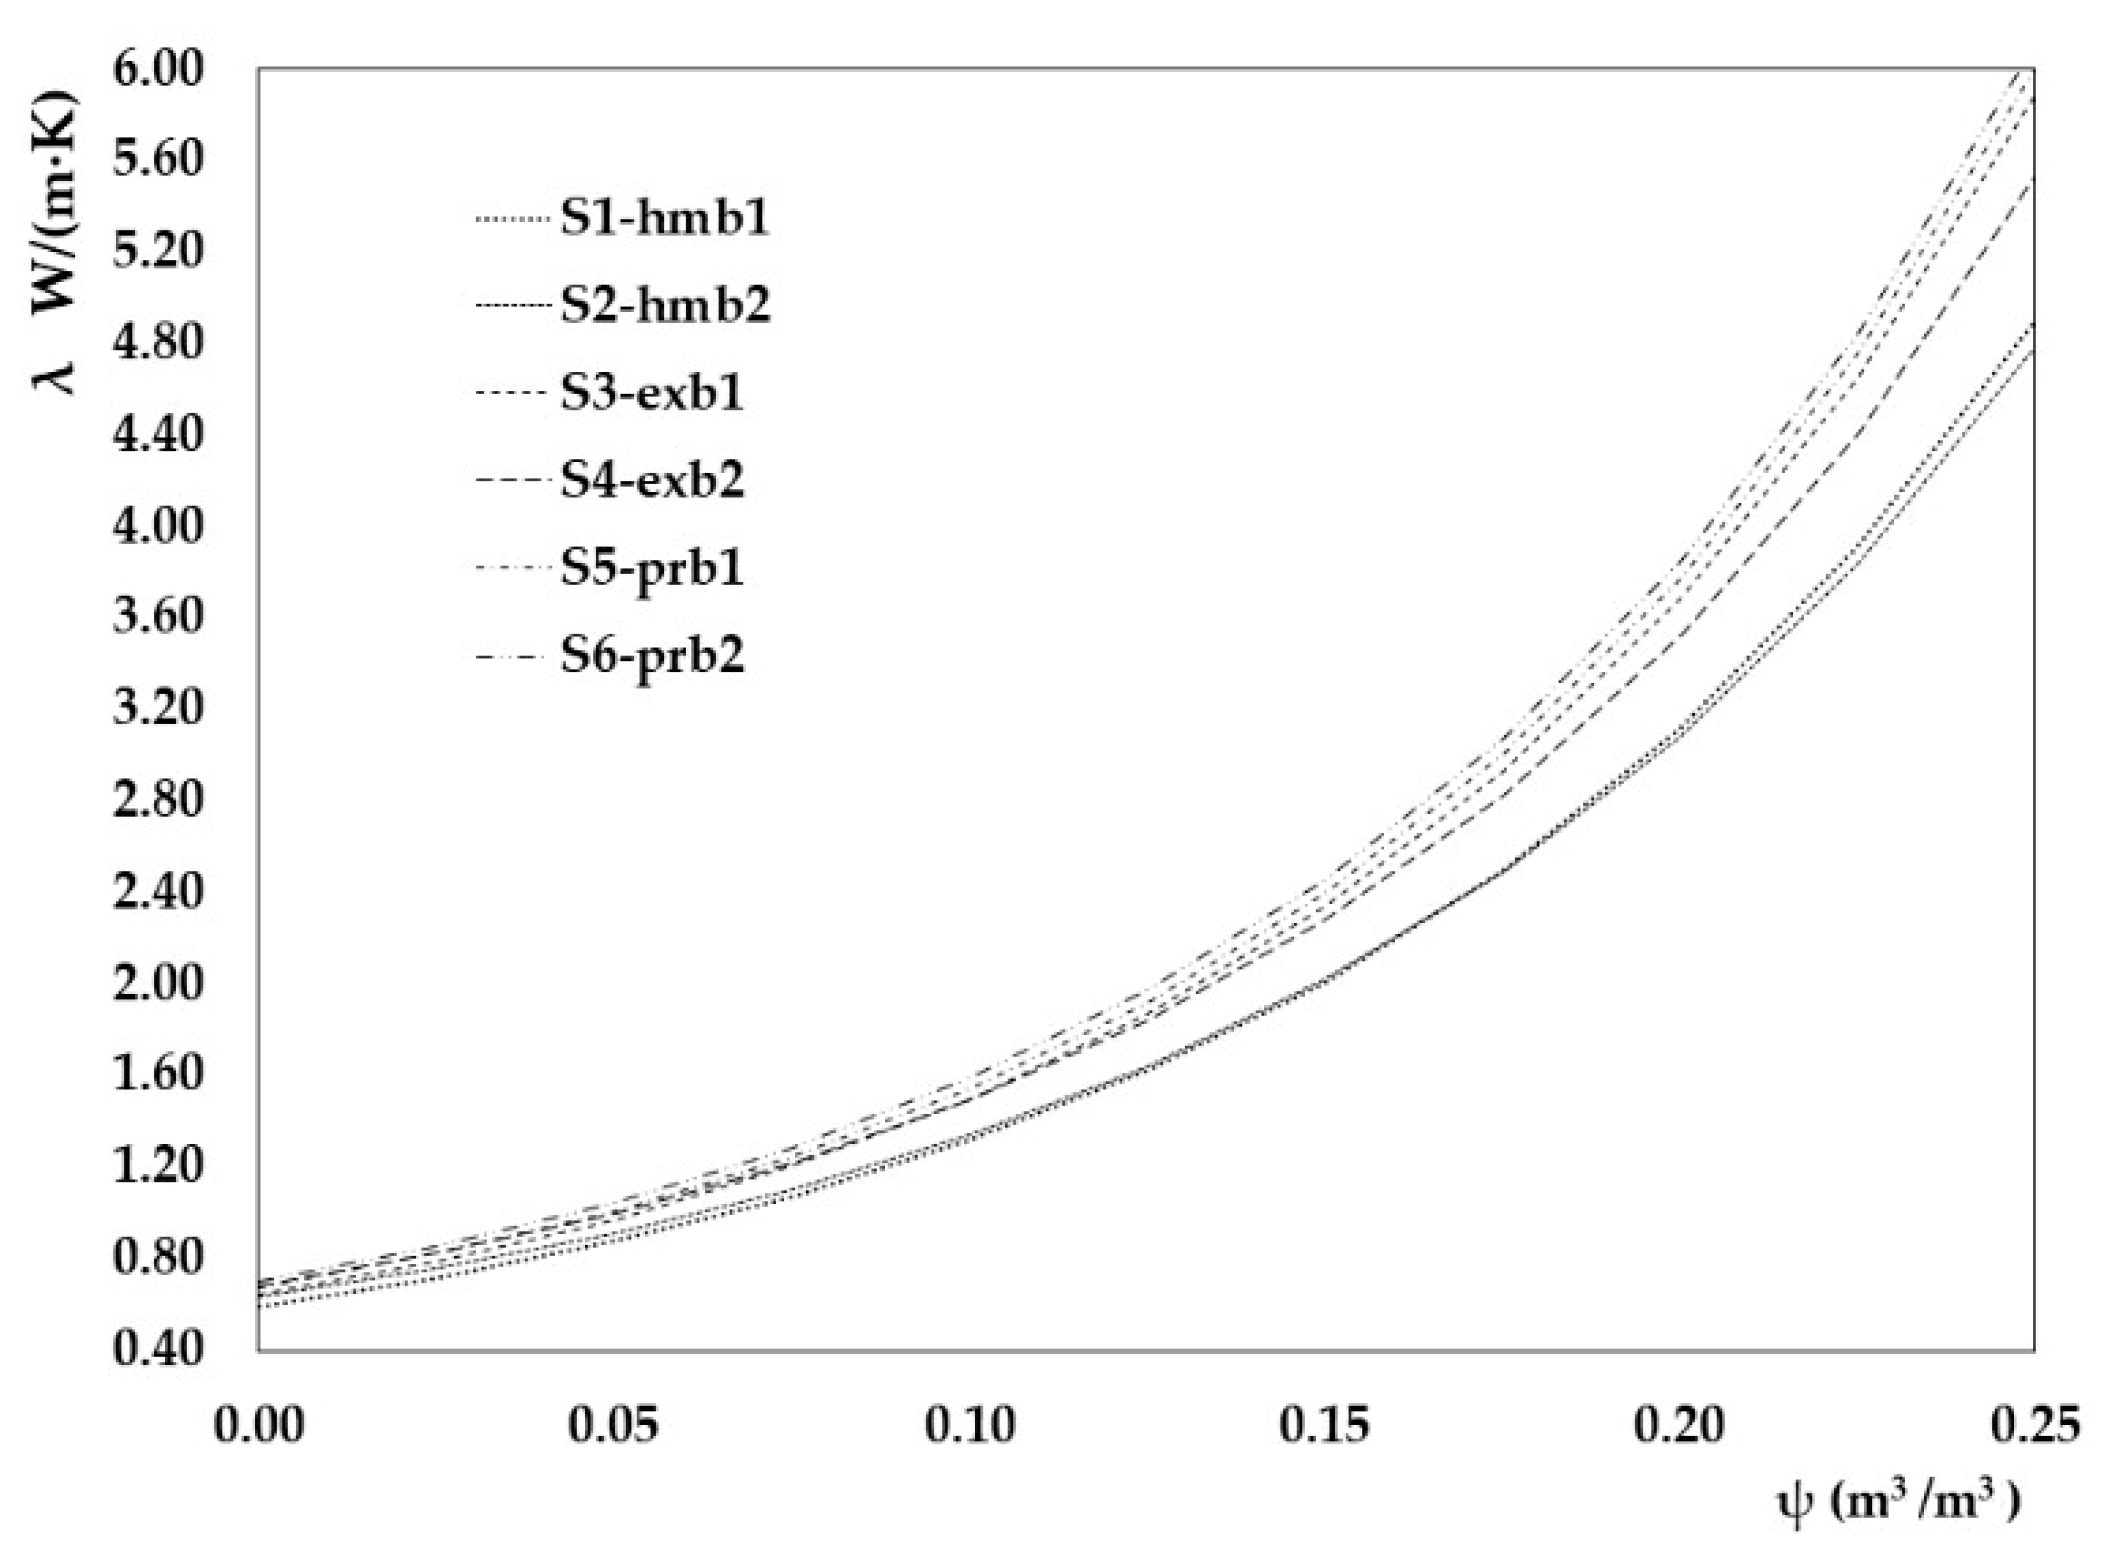
3.3. Results of the Analytical Study
4. Discussion
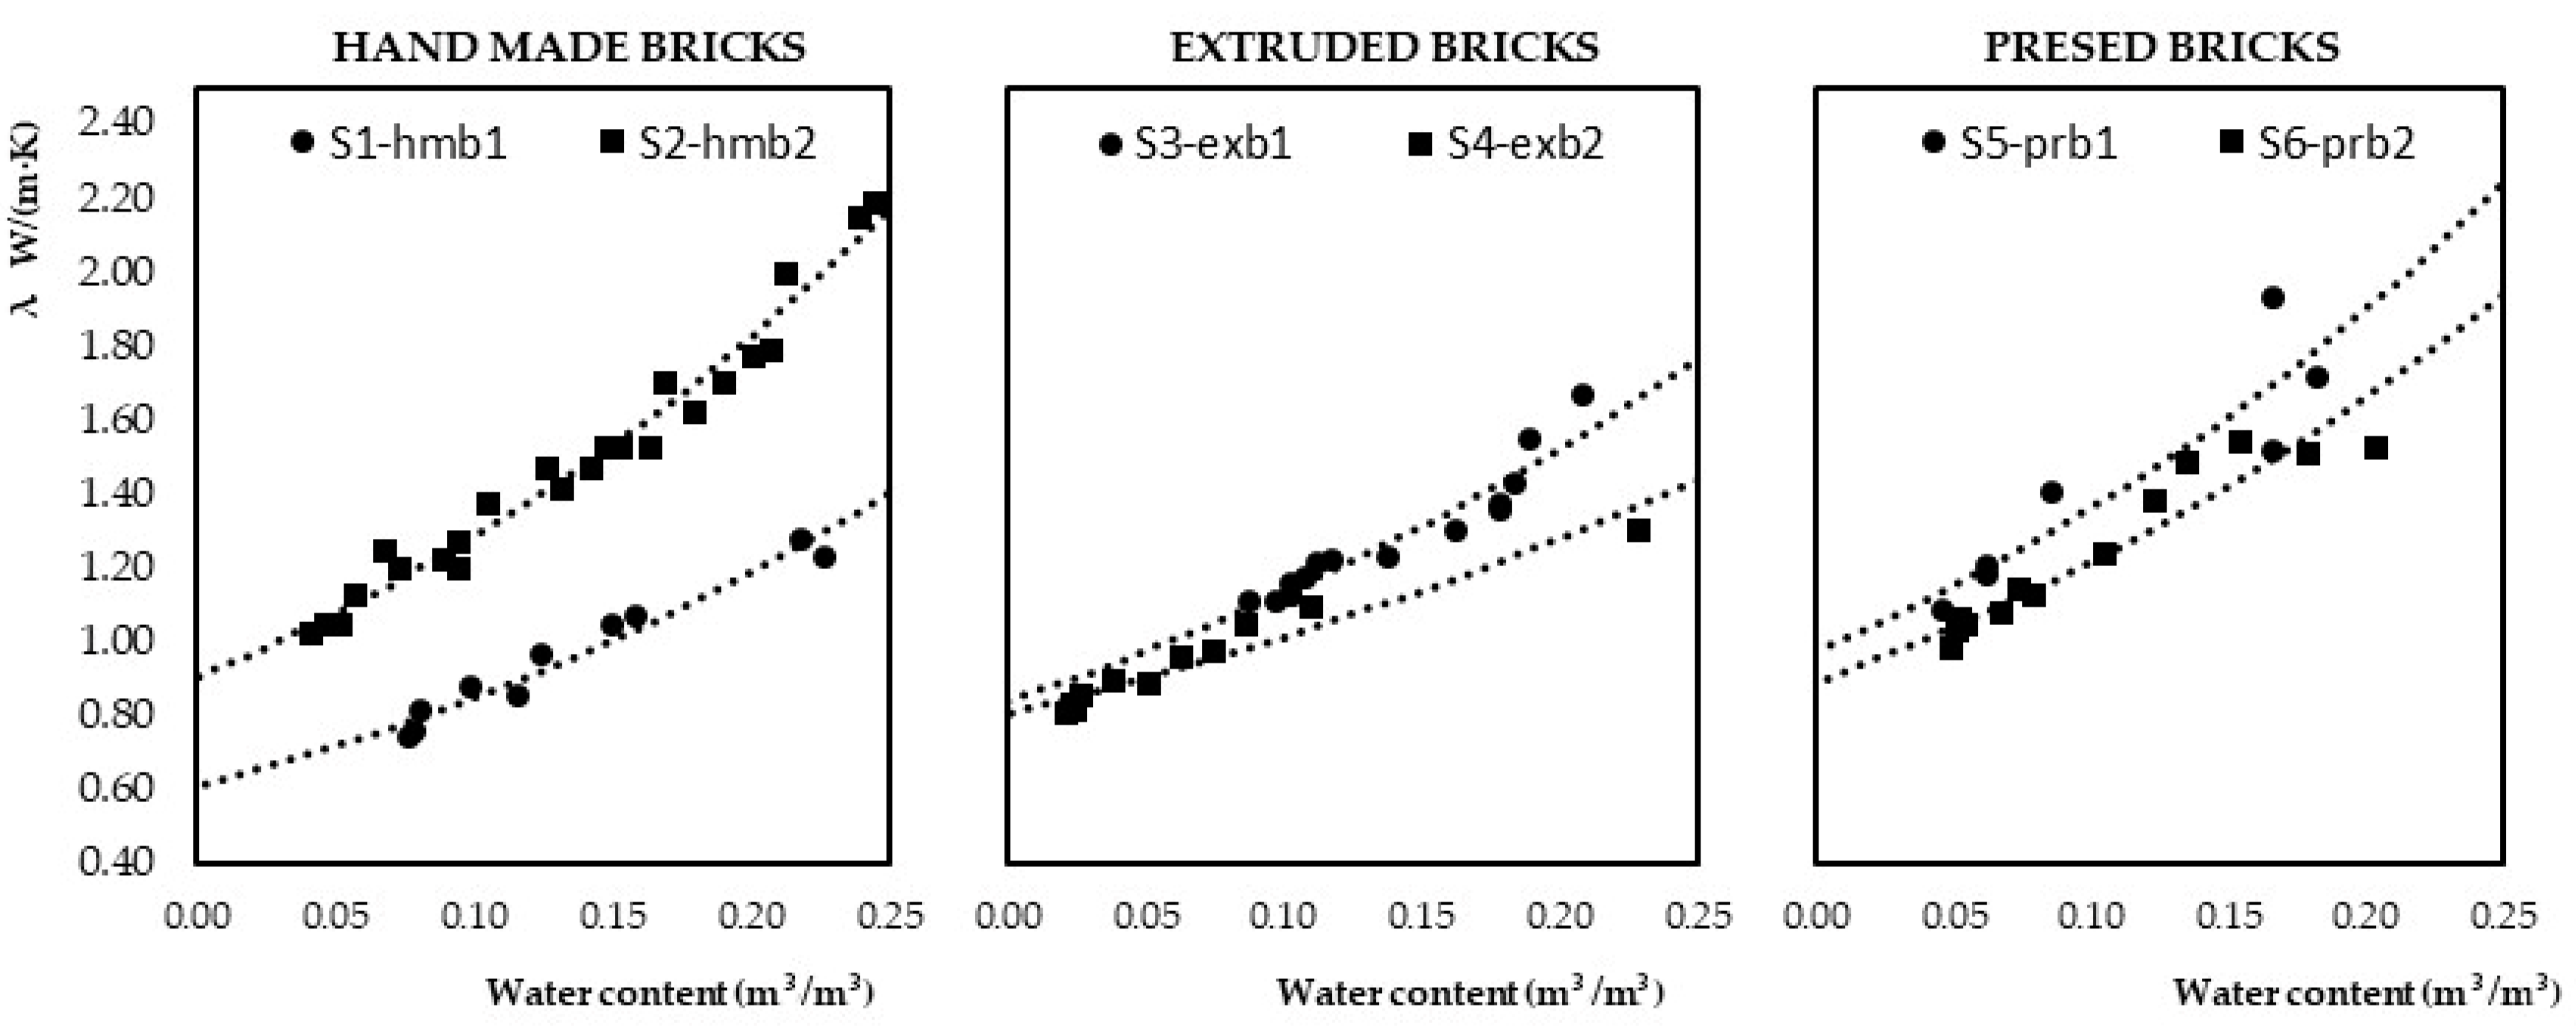
- 1.
- The higher the water content, the higher the conductivity.
- 2.
- For the same water content, the higher the density value, the higher the conductivity.
- 3.
- Quantitatively, the conductivity results obtained for each group of test samples are different, which determines that the manufacturing process of the bricks used influences the behaviour of the set.
- 1.
- The samples with handmade bricks with lower density show a reduction of up to 40% of the conductivity value for the same water content as the denser ones.
- 2.
- In the samples with extruded and pressed bricks, these differences are less than 10% in the first case and 1% in the second.

| Samples | S1-hmb1 | S2-hmb2 | S3-exb1 | S4-exb2 | S5-prb1 | S6-prb2 | |
|---|---|---|---|---|---|---|---|
| Apparent density (kg/m3) | 1692 | 1730 | 1830 | 1827 | 1911 | 1894 | |
| Water abpsortion (m3/m3) | 0.242 | 0.245 | 0.253 | 0.237 | 0.223 | 0.184 | |
| λdry W(m·K) | Calculation | 0.59 | 0.61 | 0.65 | 0.67 | 0.68 | 0.71 |
| λdry W(m·K) | Test | 0.61 | 0.91 | 0.84 | 0.93 | 0.89 | 0.98 |
| λsatured W(m·K) | Calculation | 4.61 | 4.93 | 5.83 | 5.26 | 4.64 | 3.45 |
| λsatured W(m·K) | Test | 1.35 | 2.14 | 1.79 | 1.94 | 1.78 | 1.79 |
5. Conclusions
- -
- The thermal conductivity of brick masonry presents higher values with higher moisture content, although the results of the tests carried out do not give values as high as those when the calculation is made according to the EN 1745 standard. Possibly, the moisture conversion factor given in the standard is very high for old bricks recovered in building interventions.
- -
- The conductivity value also depends on the density and porosity. If bricks made or manufactured by the same process are compared, the higher the density, the higher the conductivity value. However, the same statement cannot be made when analysing handmade bricks with mechanical bricks (extruded and pressed).
- -
- Another characteristic that influences conductivity is porosity. In the tests carried out, it was observed that there is a significant difference in the ratio between the real porosity and the apparent porosity between handmade bricks and mechanical bricks. In the handmade bricks, there is not as much difference between the two porosities as there is in the mechanical bricks, and it seems that this value may indicate the difference between the conductivity graphs to the water content of the samples made with different bricks. In the dry state, the difference in conductivity of mechanical brick samples is smaller in proportion to their density than that of handmade bricks. In the dry state, the difference in conductivity of mechanical brick samples is smaller in proportion to their density than that of handmade bricks.
- -
- When analyzing the conductivity values in dry and saturated states, the handmade brick with the lowest density performed better in the test, with lower thermal conductivity values in the dry state.
- -
- If the results of the laboratory tests are compared with those that have been estimated by the EN 1745 procedure based on the densities of the bricks, it can be concluded that, in the dry state, the conductivity values, resulting from the tests, are higher; however, this values, in the saturated state, are much lower. This could indicate that the values used according to the current standards are not appropriate for the historical brick masonry.
- -
- These results obtained are important for the energetic rehabilitation of old buildings built with bricks, since they allow us to know the real values of conductivity of this type of masonry, and evaluate the importance of controlling the water content in the interventions, not only because of injuries that can occur, but also because the difference in conductance between dry and saturated walls can be from 1.82 to 2.21 depending on the type of brick; these differences can cause important errors in the study of the thermal behaviour of these buildings if this factor is not taken into account.
Author Contributions
Funding
Institutional Review Board Statement
Conflicts of Interest
References
- European Standard EN 16883; Conservation of Cultural Heritage—Guidelines for Improving the Energy Performance of Historic Buildings. European Committee for Standardization: Brussels, Belgium, 2017.
- Lucchi, E.; Pracchi, V. Efficienza Energetica E Patrimonio Costruito: La Sfida Del Miglioramento delle Prestazioni nell’edilizia Storica; Maggioli Editore: Santarcangelo, Italy, 2013; Volume 662. [Google Scholar]
- De Santoli, L. Guidelines on energy efficiency of cultural heritage. Energy Build. 2015, 86, 534–540. [Google Scholar] [CrossRef]
- Lidelöw, S.; Örn, T.; Luciani, A.; Rizzo, A. Energy-efficiency measures for heritage buildings: A literature review. Sustain. Cities Soc. 2019, 45, 231–242. [Google Scholar] [CrossRef]
- Historic England. Energy Efficiency and Historic Buildings: Application of Part I of the Buildings Regulations to Historic and Traditionally Constructed Buildings; English Heritage: London, UK, 2011. [Google Scholar]
- Archittetura Energia Research Centre. HeLLo-Heritage Energy Living Lab Onsite. Available online: https://hellomscaproject.eu/ (accessed on 8 October 2021).
- Co2olBricks—Climate Change, Cultural Heritage and Energy-Efficient Monuments Is a Project in the Framework of the Baltic Sea Region Programme 2007–2013. Available online: http://www.co2olbricks.de/index.php?id=175 (accessed on 8 October 2021).
- Bastian, Z.; Troi, A. Energy Efficiency Solutions for Historic Buildings; 3encult-Project-Welcome–Home; De Gruyter Open: Berlin, Germany, 2015. [Google Scholar]
- Cabeza-Prieto, A.; Camino-Olea, M.S.; Rodríguez-Esteban, M.A.; Llorente-Álvarez, A.; Pérez, M.P.S. Moisture influence on the thermal operation of the late 19th century brick facade, in a historic building in the city of Zamora. Energies 2020, 13, 1307. [Google Scholar] [CrossRef] [Green Version]
- Chazarra, A.; Flórez García, E.; Peraza, B.; Tohá Rebull, T.; Lorenzo Mariño, B.; Criado, E.; Moreno García, J.V.; Romero Fresneda, R.; Botey, M.R. Mapas climáticos de España (1981–2010) y ETo (1996–2016). 2018. Available online: http://www.aemet.es/es/conocermas/recursos_en_linea/publicaciones_y_estudios/publicaciones/detalles/MapasclimaticosdeEspana19812010 (accessed on 15 March 2022).
- Camino-Olea, M.S. Construcción y Ornamentación de las Fachadas de Ladrillo prensado, al Descubierto, en la Ciudad de Valladolid. Ph.D. Thesis, Universidad de Valladolid, Valladolid, Spain, 2001. [Google Scholar]
- Valdés Fernández, M. Arquitectura Mudéjar En León Y Castilla; Secretariado de Publicaciones de la Universidad de León: León, Spain, 1984. [Google Scholar]
- BIA2015-68449. Project “Proposal for the evaluation of the humidity that rises by capillarity in the masonry walls of the historical heritage through non-destructive sampling” This work has been carried out with funding from the Ministry of Economy and Competitiveness of Spain and the European Regional Development Fund (MINECO/FEDER, EU).
- Llorente-Alvarez, A.; Camino-Olea, M.S.; Cabeza-Prieto, A.; Saez-Perez, M.P.; Rodríguez-Esteban, M.A. The thermal conductivity of the masonry of handmade brick Cultural Heritage with respect to density and humidity. J. Cult. Herit. 2022, 53, 212–219. [Google Scholar] [CrossRef]
- Camino-Olea, M.S.; Cabeza-Prieto, A.; Llorente-Alvarez, A.; Saez-Perez, M.P.; Rodriguez-Esteban, M.A. Brick Walls of Buildings of the Historical Heritage. Comparative Analysis of the Thermal Conductivity in Dry and Saturated State. IOP Conf. Ser. Mater. Sci. Eng. 2019, 471, 082059. [Google Scholar] [CrossRef]
- Rodríguez-Esteban, M.A.; Camino-Olea, M.S.; Llorente-Álvarez, A.; Cabeza-Prieto, A.; Sáez-Pérez, M.P. Brick of the Historical Heritage: Comparative Analysis of The Thermal Conductivity, Density and Moisture. IOP Conf. Ser. Mater. Sci. Eng. 2021, 1203, 032042. [Google Scholar] [CrossRef]
- Olea, M.S.C.; Pérez, M.P.S.; Álvarez, A.L.; Prieto, A.C.; Esteban, M.A.R. Propuesta de ensayo no destructivo para conocer el contenido de agua en fachadas de ladrillo del Patrimonio Cultural = Non-destructive testing proposal to know the water content in brick facades of the Cultural Heritage. Rev. Electron. ReCoPar 2021, 14, 8–20. [Google Scholar]
- Netinger Grubeša, I.; Teni, M.; Krstić, H.; Vračević, M. Influence of freeze/thaw cycles on mechanical and thermal properties of masonry wall and masonry wall materials. Energies 2019, 12, 1464. [Google Scholar] [CrossRef] [Green Version]
- Pérez-Bella, J.M.; Domínguez-Hernández, J.; Rodríguez-Soria, B.; del Coz-Díaz, J.J.; Cano-Suñén, E. Estimation of the exposure of buildings to driving rain in Spain from daily wind and rain data. Build. Environ. 2012, 57, 259–270. [Google Scholar] [CrossRef]
- Perez-Bella, J.M.; Dominguez-Hernandez, J.; Cano-Sunen, E.; del Coz-Diaz, J.J.; Rabanal, F.P.A. A correction factor to approximate the design thermal conductivity of building materials. Application to Spanish façades. Energy Build. 2015, 88, 153–164. [Google Scholar] [CrossRef]
- Li, R.; Zhou, Y.; Li, C.; Li, S.; Huang, Z. Recycling of industrial waste iron tailings in porous bricks with low thermal conductivity. Constr. Build. Mater. 2019, 3, 43–50. [Google Scholar] [CrossRef]
- Sumirat, I.; Ando, Y.; Shimamura, S. Theoretical consideration of the effect of porosity on thermal conductivity of porous materials. J. Porous Mater. 2006, 13, 439–443. [Google Scholar] [CrossRef]
- Haffen, S.; Géraud, Y.; Rosener, M.; Diraison, M. Thermal conductivity and porosity maps for different materials: A combined case study of granite and sandstone. Geothermics 2017, 66, 143–150. [Google Scholar] [CrossRef]
- Chin, W.Q.; Lee, Y.H.; Amran, M.; Fediuk, R.; Vatin, N.; Kueh, A.B.H.; Lee, Y.Y. A Sustainable Reuse of Agro-Industrial Wastes into Green Cement Bricks. Materials 2022, 15, 1713. [Google Scholar] [CrossRef] [PubMed]
- Olivar Parra, J.M.; Llorente Álvarez, A.; Camino Olea, M.S.; Poza Casado, I. Elaboración artesanal de adobes y ladrillos de tejar en la cerámica Nietos de Eulogio Bernardos Artesanos, en Arévalo. In Construcción Con Tierra: Investigación Y Documentación; GRUPO TIERRA: Valladolid, Spain, 2015; pp. 287–296. [Google Scholar]
- European Standard EN 1745; Masonry and Masonry Products. Methods for Masonry Determination Thermal Properties. European Committee for Standardization: Brussels, Belgium, 2020.
- Esteban, M.A.R. La Arquitectura de Ladrillo Y Su Construcción En La Ciudad de Zamora (1888–1931). Ph.D. Thesis, Universidad de Valladolid, Valladolid, Spain, 2012. [Google Scholar]
- Llorente Álvarez, A. Tesis Doctoral. Influencia de Las Juntas de Argamasa de Cal En El Ascenso de Humedad Capilar Que Afecta a Las Fábricas de Ladrillo de Tejar Antiguo. Ph.D. Thesis, Universidad de Valladolid, Valladolid, Spain, 2018. [Google Scholar]
- Camino-Olea, Mª.S.; León-Vallejo, F.J.; Llorente-Álvarez, A.; Rodríguez-Esteba, Mª.A.; Pérez-Sáez, Mª.P.; Olivar-Parra, J.Mª. Estudio comparativo de ensayos de durabilidad de ladrillo prensado en fachadas de finales del siglo XIX en Castilla y León (España). In Proceedings of the CREPAT 2017, Congresso de Rehabilitaçao do Patrimonio, Aveiro, Portugal, 29–30 June 2017. [Google Scholar]
- Tunkiewicz, M.; Misiewicz, J.; Sikora, P.; Chung, S.Y. Hygric Properties of Machine-Made, Historic Clay Bricks from North-Eastern Poland (Former East Prussia): Characterization and Specification for Replacement Materials. Materials 2021, 14, 6706. [Google Scholar] [CrossRef] [PubMed]
- European Standard EN 772-16; Methods of Test for Masonry Units. Part 16: Determination of Dimensions. European Committee for Standardization: Brussels, Belgium, 2011.
- European Standard EN 772-13; Methods of Test for Masonry Units. Part 13: Determination of Net and Gross Dry Density of Masonry Units (Eccepts for Natural Stone). European Committee for Standardization: Brussels, Belgium, 2000.
- UNE EN 772-3; Methods of Test for Masonry Units. Part 3: Determination of Net Volume and Percentage of Voids of Clay Masonry by Hydrostatic Weighing Aenor. AENOR: Madrid, Spain, 1998.
- ASTM D4404-18; Standard Test Method for Determination of Pore Volume and Pore Volume Distribution of Soil and Rock by Mercury Intrusion Porosimetry. Swedish Institute for Standards: Stockholm, Swedish, 2018.
- Martínez, C.; Cotes, T.; Corpas, F.A. Recovering wastes from the paper industry: Development of ceramic materials. Fuel Process. Technol. 2012, 103, 117–124. [Google Scholar] [CrossRef]
- De Villanueva, J. Arte de Albañilería o Instrucciones Para los Jóvenes que se Dediquen a él, en que se Trata de las Herramientas Necesarias al albañil, formación de Andamios, y Toda Clase de Fábricas que se Puedan Ofrecer. Editorial Maxtor: Madrid, Spain, 1827. [Google Scholar]
- European Standard EN 1015-10; Methods of Test Mortar for Masonry. Part 10: Determination of Dry Bulk Density of Hardened Mortar. European Committee for Standardization: Brussels, Belgium, 2006.
- ISO 9869-1; Thermal Insulation—Building Elements—In Situ Measurement of Thermal Resistance and Thermal Transmittance. Part: 1 Heat Flow Meter Method. ISO (International Organization for Standardization): Geneva, Switzerland, 2014.
- European Standard EN 772-21; Methods of Test for Masonry Units: Part 21: Determination of Water Absorption of Cay and Calcium Silicate Masonry Units by Cold Water Absorption. European Committee for Standardization: Brussels, Belgium, 2011.
- Lucchi, E.; Roberti, F.; Alexandra, T. Definition of an experimental procedure with the hot box method for the thermal performance evaluation of inhomogeneous walls. Energy Build. 2018, 179, 99–111. [Google Scholar] [CrossRef]
- Lucchi, E. Thermal transmittance of historical brick masonries: A comparison among standard data, analytical calculation procedures, and in situ heat flow meter measurements. Energy Build. 2017, 134, 171–184. [Google Scholar] [CrossRef]
- Andreotti, M.; Calzolari, M.; Davoli, P.; Dias Pereira, L.; Lucchi, E.; Malaguti, R. Design and construction of a new metering hot box for the in situ hygrothermal measurement in dynamic conditions of historic masonries. Energies 2020, 13, 2950. [Google Scholar] [CrossRef]
- Camino Olea, M.S.; Llorente Álvarez, A.; Cabeza Prieto, A.; Rodríguez Esteban, M.A.; Sáez Pérez, M.P.; Olivar Parra, J.M. Ensayo Para Evaluar La Relación Entre El Flujo de Calor Y El Volumen de Agua En Probetas de Ladrillo Antiguo Y Argamasa. In Proceedings of the REHABEND 2018: Construction Pathology, Rehabilitation Technology and Heritage Management. 7th REHABEND Congress, Caceres, Spain, 15–18 May 2018. [Google Scholar]
- European Standard EN ISO 10456; Building Materials and Products. Hygrothermal Properties. Tabulated Design Values and Procedures for Determining Declared and Design Thermal Values. ISO: Geneve, Switzerland, 2007.
| Instruments | ||
|---|---|---|
| Heat flux plate | name | AMR model FQAD18TSI de Ahlborn |
| shape of place | square | |
| dimensions | 120 × 120 mm | |
| thickness | 3 mm | |
| type of the substrate | Silicone | |
| accuracy of the measurement | ±0.02% | |
| sensitivity of the instruments | Not specify | |
| Surface temperature probes | Number of probes | 2 surface temperature, inside and outside |
| typology | thermocouple | |
| position | internal and external of camera | |
| range of the measurement | −00 a + 95 °C | |
| accuracy of the measurement | ±0.05% | |
| Brick/Mortar | Dimensions (mm) | Apparent Density (kg/m3) | ||||||
|---|---|---|---|---|---|---|---|---|
| Length | Width | Thickness | ||||||
| Media | Dev. | Media | Dev. | Media | Dev. | Media | Dev. | |
| HMB1 | 302 | 3 | 148 | 3 | 40 | 3 | 1676 | 16 |
| HMB2 | 250 | 5 | 122 | 4 | 52 | 3 | 1735 | 55 |
| EXB1 | 234 | 3 | 123 | 1 | 56 | 1 | 1865 | 23 |
| EXB2 | 257 | 4 | 137 | 2 | 48 | 2 | 1922 | 63 |
| PRB1 | 261 | 1 | 127 | 1 | 53 | 1 | 1934 | 17 |
| PRB2 | 224 | 3 | 109 | 2 | 53 | 1 | 2044 | 95 |
| mortar | 160 | 2 | 40 | 1 | 40 | 1 | 1729 | 20 |
| Brick/mortar | Apparent porosity (%) | Total Porosity (%) | Ø pore media (μm) |
|---|---|---|---|
| HMB1 | 25.17 | 26.94 | 1.59 |
| HMB2 | 25.37 | 27.51 | 2.63 |
| EXB1 | 25.72 | 29.18 | 1.01 |
| EXB2 | 22.49 | 29.50 | 0.59 |
| PRB1 | 22.02 | 26.19 | 0.44 |
| PRB2 | 16.68 | 20.91 | 0.64 |
| mortar | 23.06 | 28.04 | 1.04 |
| Sample | S1-hmb1 | S2-hmb2 | S3-exb1 | S4-exb2 | S5-prb1 | S6-prb2 |
|---|---|---|---|---|---|---|
| Photographs | 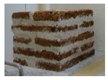 |  |  | 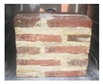 |  |  |
| Dimensions (cm3) | 30 × 30.5 × 25.5 | 38.5 × 25.5 × 39 | 25 × 27 × 25 | 41 × 34.5 × 28.5 | 41 × 31 × 26 | 34 × 32 × 23.5 |
| Proportion by volume Brick/mortar | 69/31% | 61/39% | 74/26% | 63/37% | 71/29% | 68/32% |
| Apparent density (kg/m3) | 1692 | 1730 | 1830 | 1827 | 1911 | 1894 |
| Water absorption (m3/m3) | 0.242 | 0.245 | 0.253 | 0.237 | 0.223 | 0.184 |
| Sample | S1-hmb1 | S2-hmb2 | S3-exb1 | S4-exb2 | S5-prb1 | S6-prb2 |
|---|---|---|---|---|---|---|
| λdry W(m·K) | 0.61 | 0.91 | 0.84 | 0.93 | 0.89 | 0.98 |
| λsatured W(m·K) | 1.35 | 2.14 | 1.79 | 1.94 | 1.78 | 1.79 |
| Apparent porosity/Total porosity % | 93.43 | 92.22 | 86.28 | 76.24 | 84.04 | 79.77 |
| Sample | S1-hmb1 | S2-hmb2 | S3-exb1 | S4-exb2 | S5-prb1 | S6-prb2 |
|---|---|---|---|---|---|---|
| λdry W(m·K) | 0.58 | 0.61 | 0.63 | 0.75 | 0.66 | 0.68 |
| λsatured W(m·K) | 4.56 | 4.58 | 6.05 | 4.91 | 4.64 | 3.33 |
| Sample | S1-hmb1 | S2-hmb2 | S3-exb1 | S4-exb2 | S5-prb1 | S6-prb2 |
|---|---|---|---|---|---|---|
| λ W(m·K) test | ||||||
| λ W(m·K) calculation |
Publisher’s Note: MDPI stays neutral with regard to jurisdictional claims in published maps and institutional affiliations. |
© 2022 by the authors. Licensee MDPI, Basel, Switzerland. This article is an open access article distributed under the terms and conditions of the Creative Commons Attribution (CC BY) license (https://creativecommons.org/licenses/by/4.0/).
Share and Cite
Cabeza-Prieto, A.; Camino-Olea, M.S.; Sáez-Pérez, M.P.; Llorente-Álvarez, A.; Ramos Gavilán, A.B.; Rodríguez-Esteban, M.A. Comparative Analysis of the Thermal Conductivity of Handmade and Mechanical Bricks Used in the Cultural Heritage. Materials 2022, 15, 4001. https://doi.org/10.3390/ma15114001
Cabeza-Prieto A, Camino-Olea MS, Sáez-Pérez MP, Llorente-Álvarez A, Ramos Gavilán AB, Rodríguez-Esteban MA. Comparative Analysis of the Thermal Conductivity of Handmade and Mechanical Bricks Used in the Cultural Heritage. Materials. 2022; 15(11):4001. https://doi.org/10.3390/ma15114001
Chicago/Turabian StyleCabeza-Prieto, Alejandro, María Soledad Camino-Olea, María Paz Sáez-Pérez, Alfredo Llorente-Álvarez, Ana Belén Ramos Gavilán, and María Ascensión Rodríguez-Esteban. 2022. "Comparative Analysis of the Thermal Conductivity of Handmade and Mechanical Bricks Used in the Cultural Heritage" Materials 15, no. 11: 4001. https://doi.org/10.3390/ma15114001
APA StyleCabeza-Prieto, A., Camino-Olea, M. S., Sáez-Pérez, M. P., Llorente-Álvarez, A., Ramos Gavilán, A. B., & Rodríguez-Esteban, M. A. (2022). Comparative Analysis of the Thermal Conductivity of Handmade and Mechanical Bricks Used in the Cultural Heritage. Materials, 15(11), 4001. https://doi.org/10.3390/ma15114001