
Synthesis and In Vitro/Ex Vivo Characterizations of Ceftriaxone-Loaded Sodium Alginate/poly(vinyl alcohol) Clay Reinforced Nanocomposites: Possible Applications in Wound Healing


 ,
,  , ,
, ,  and
and 
Abstract
:1. Introduction
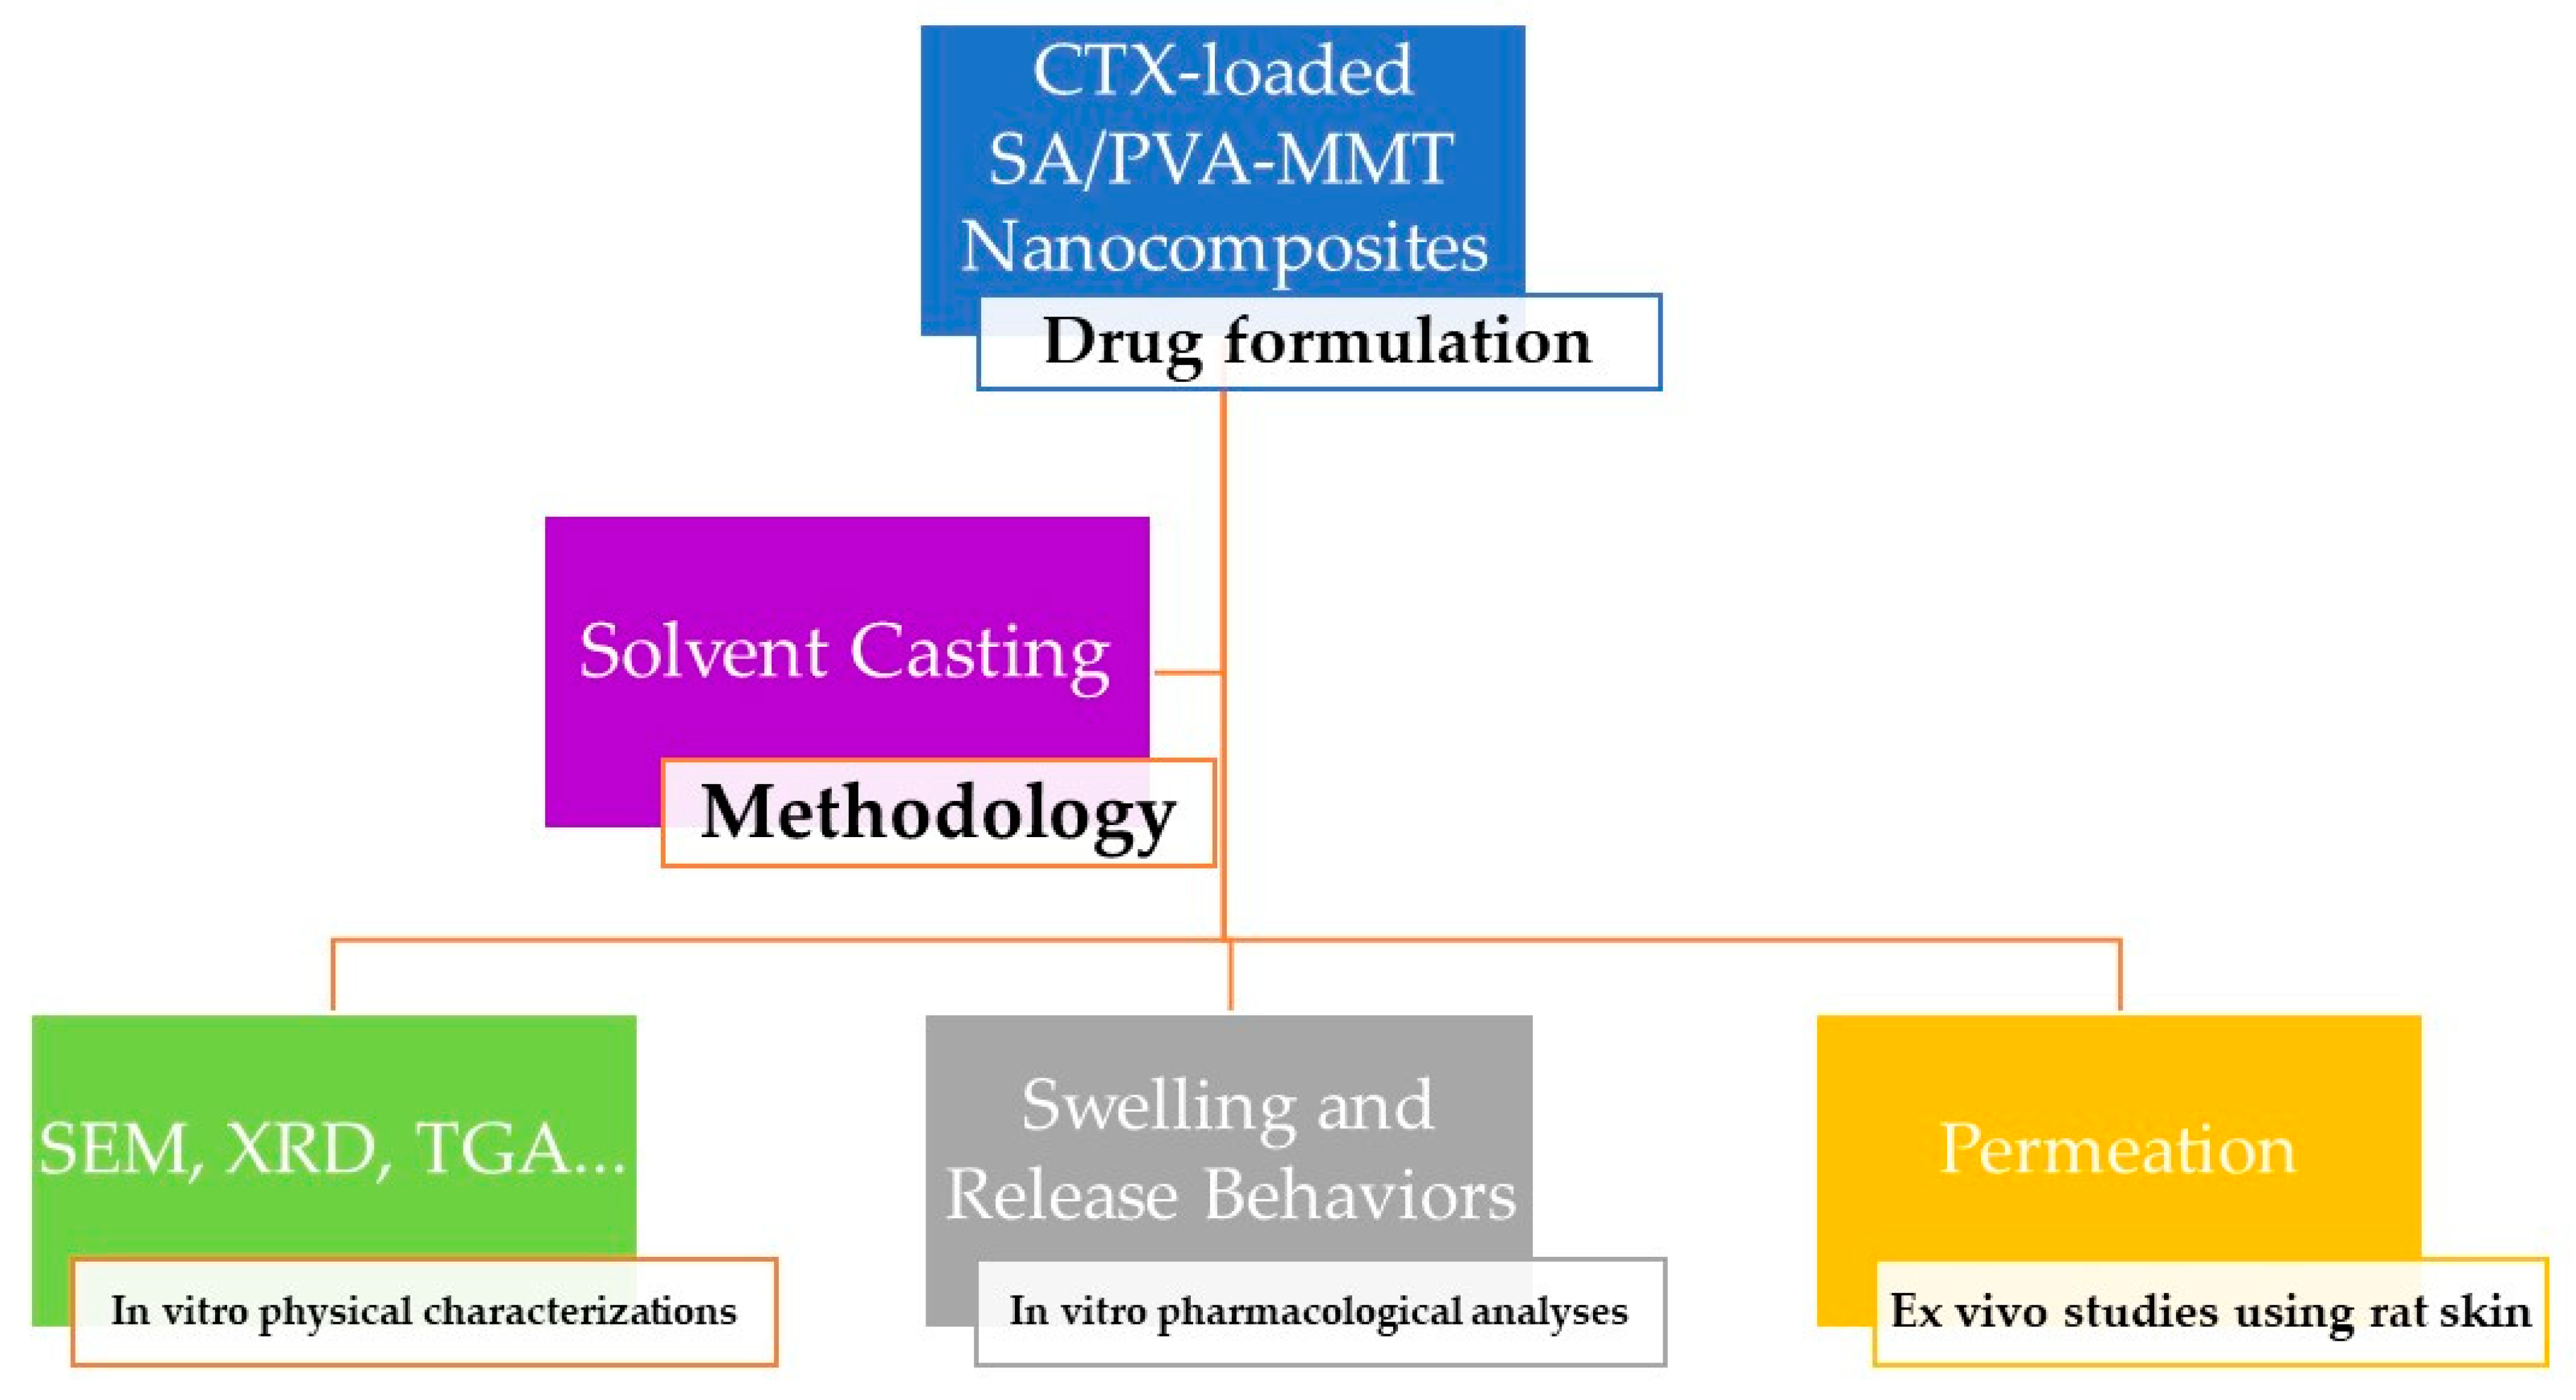
2. Materials and Methods
2.1. Reagents
2.2. Preparation of SA/PVA Nanocomposites
2.3. Physico-Chemical Characterizations
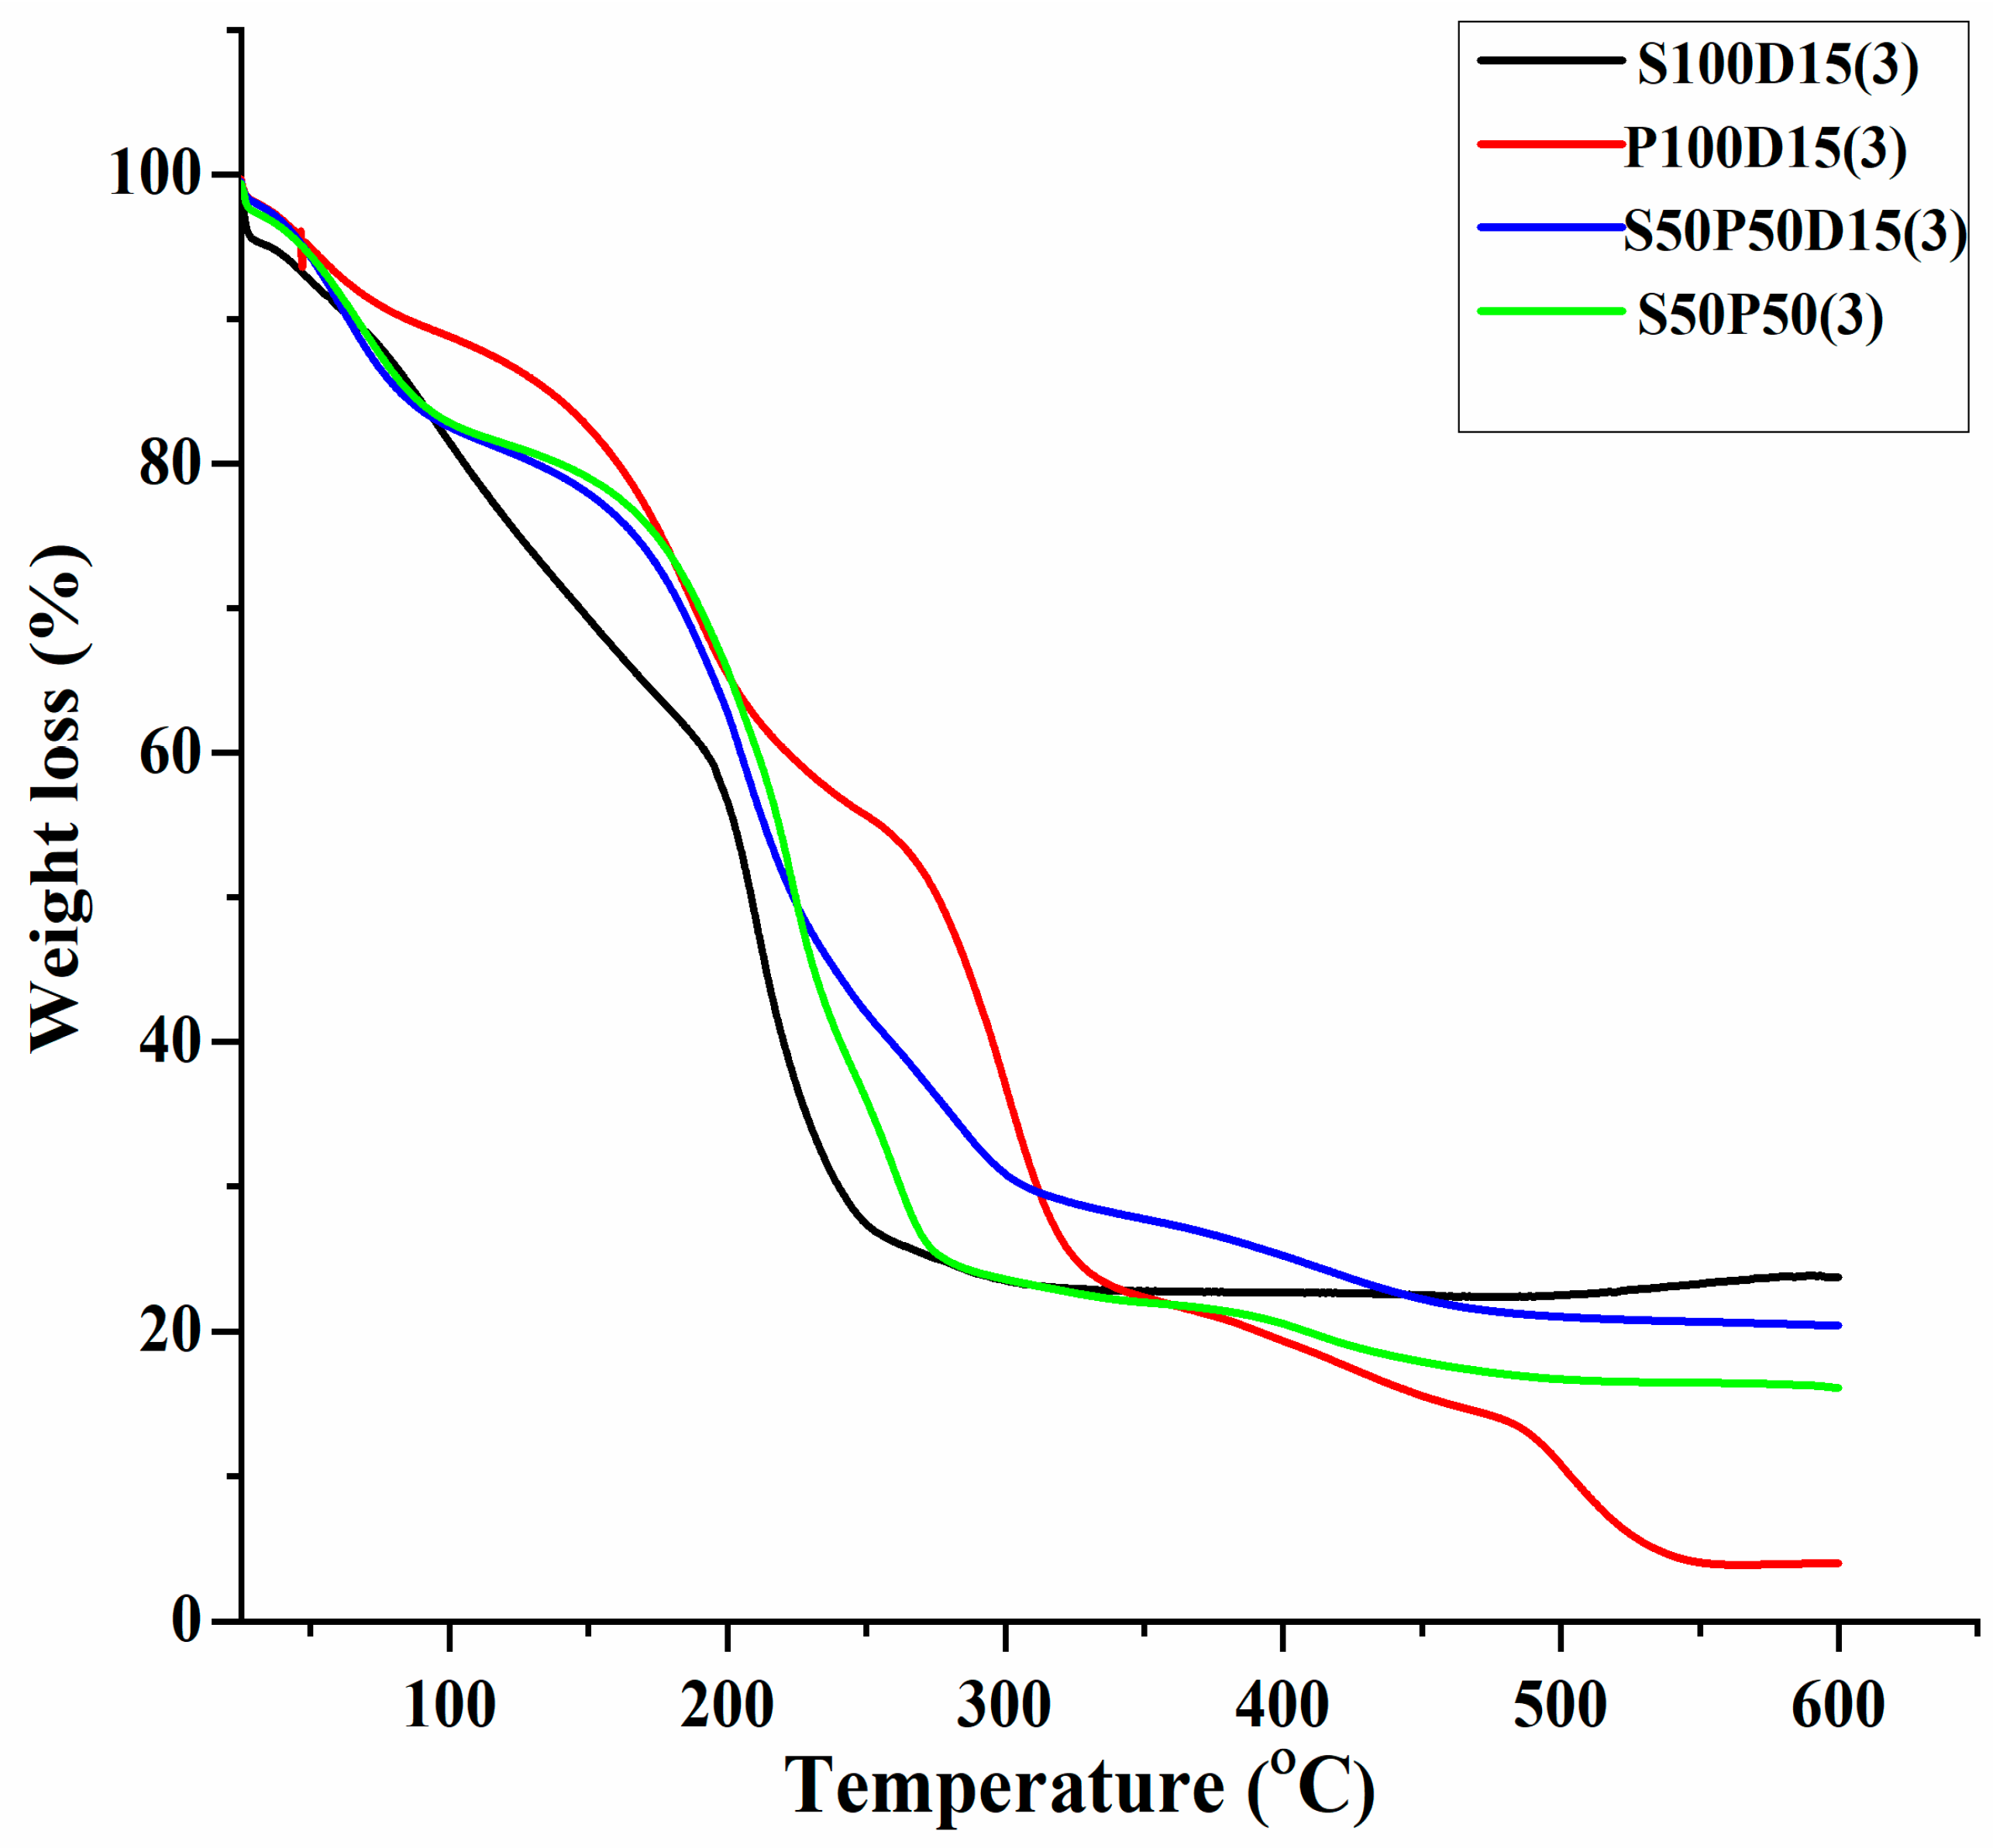
2.3.1. Thermogravimetric Analysis
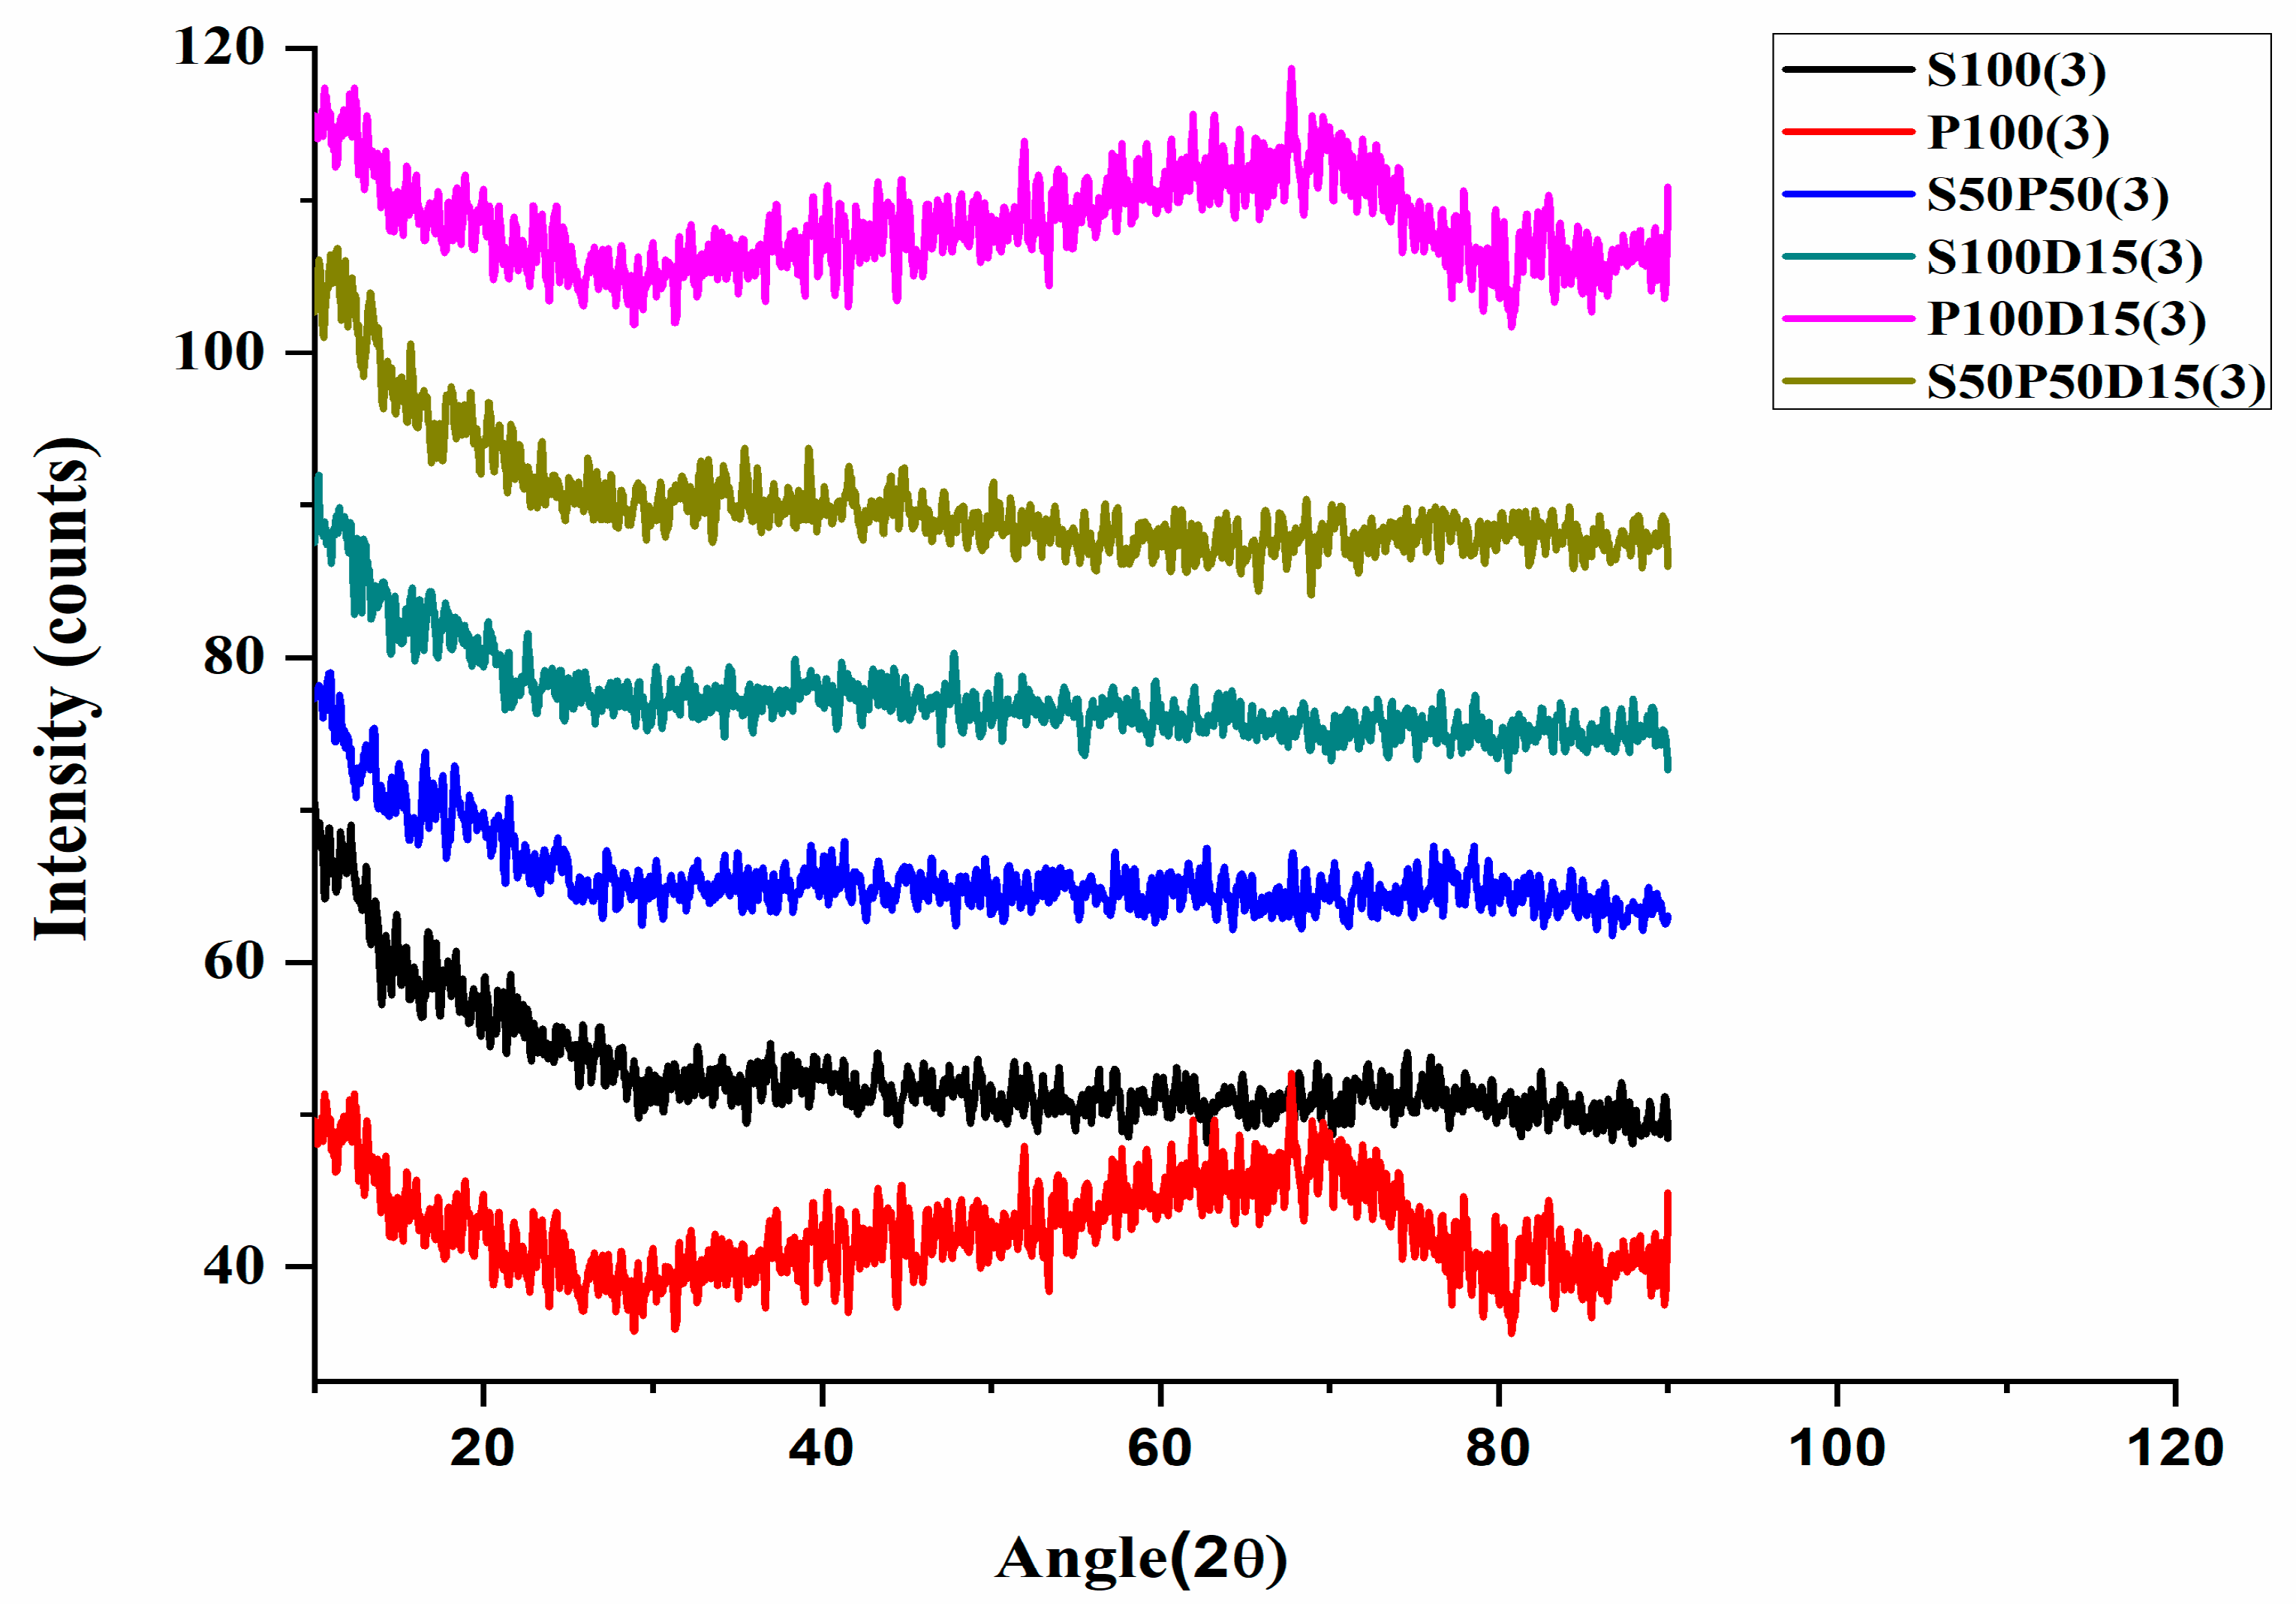
2.3.2. XRD Analysis
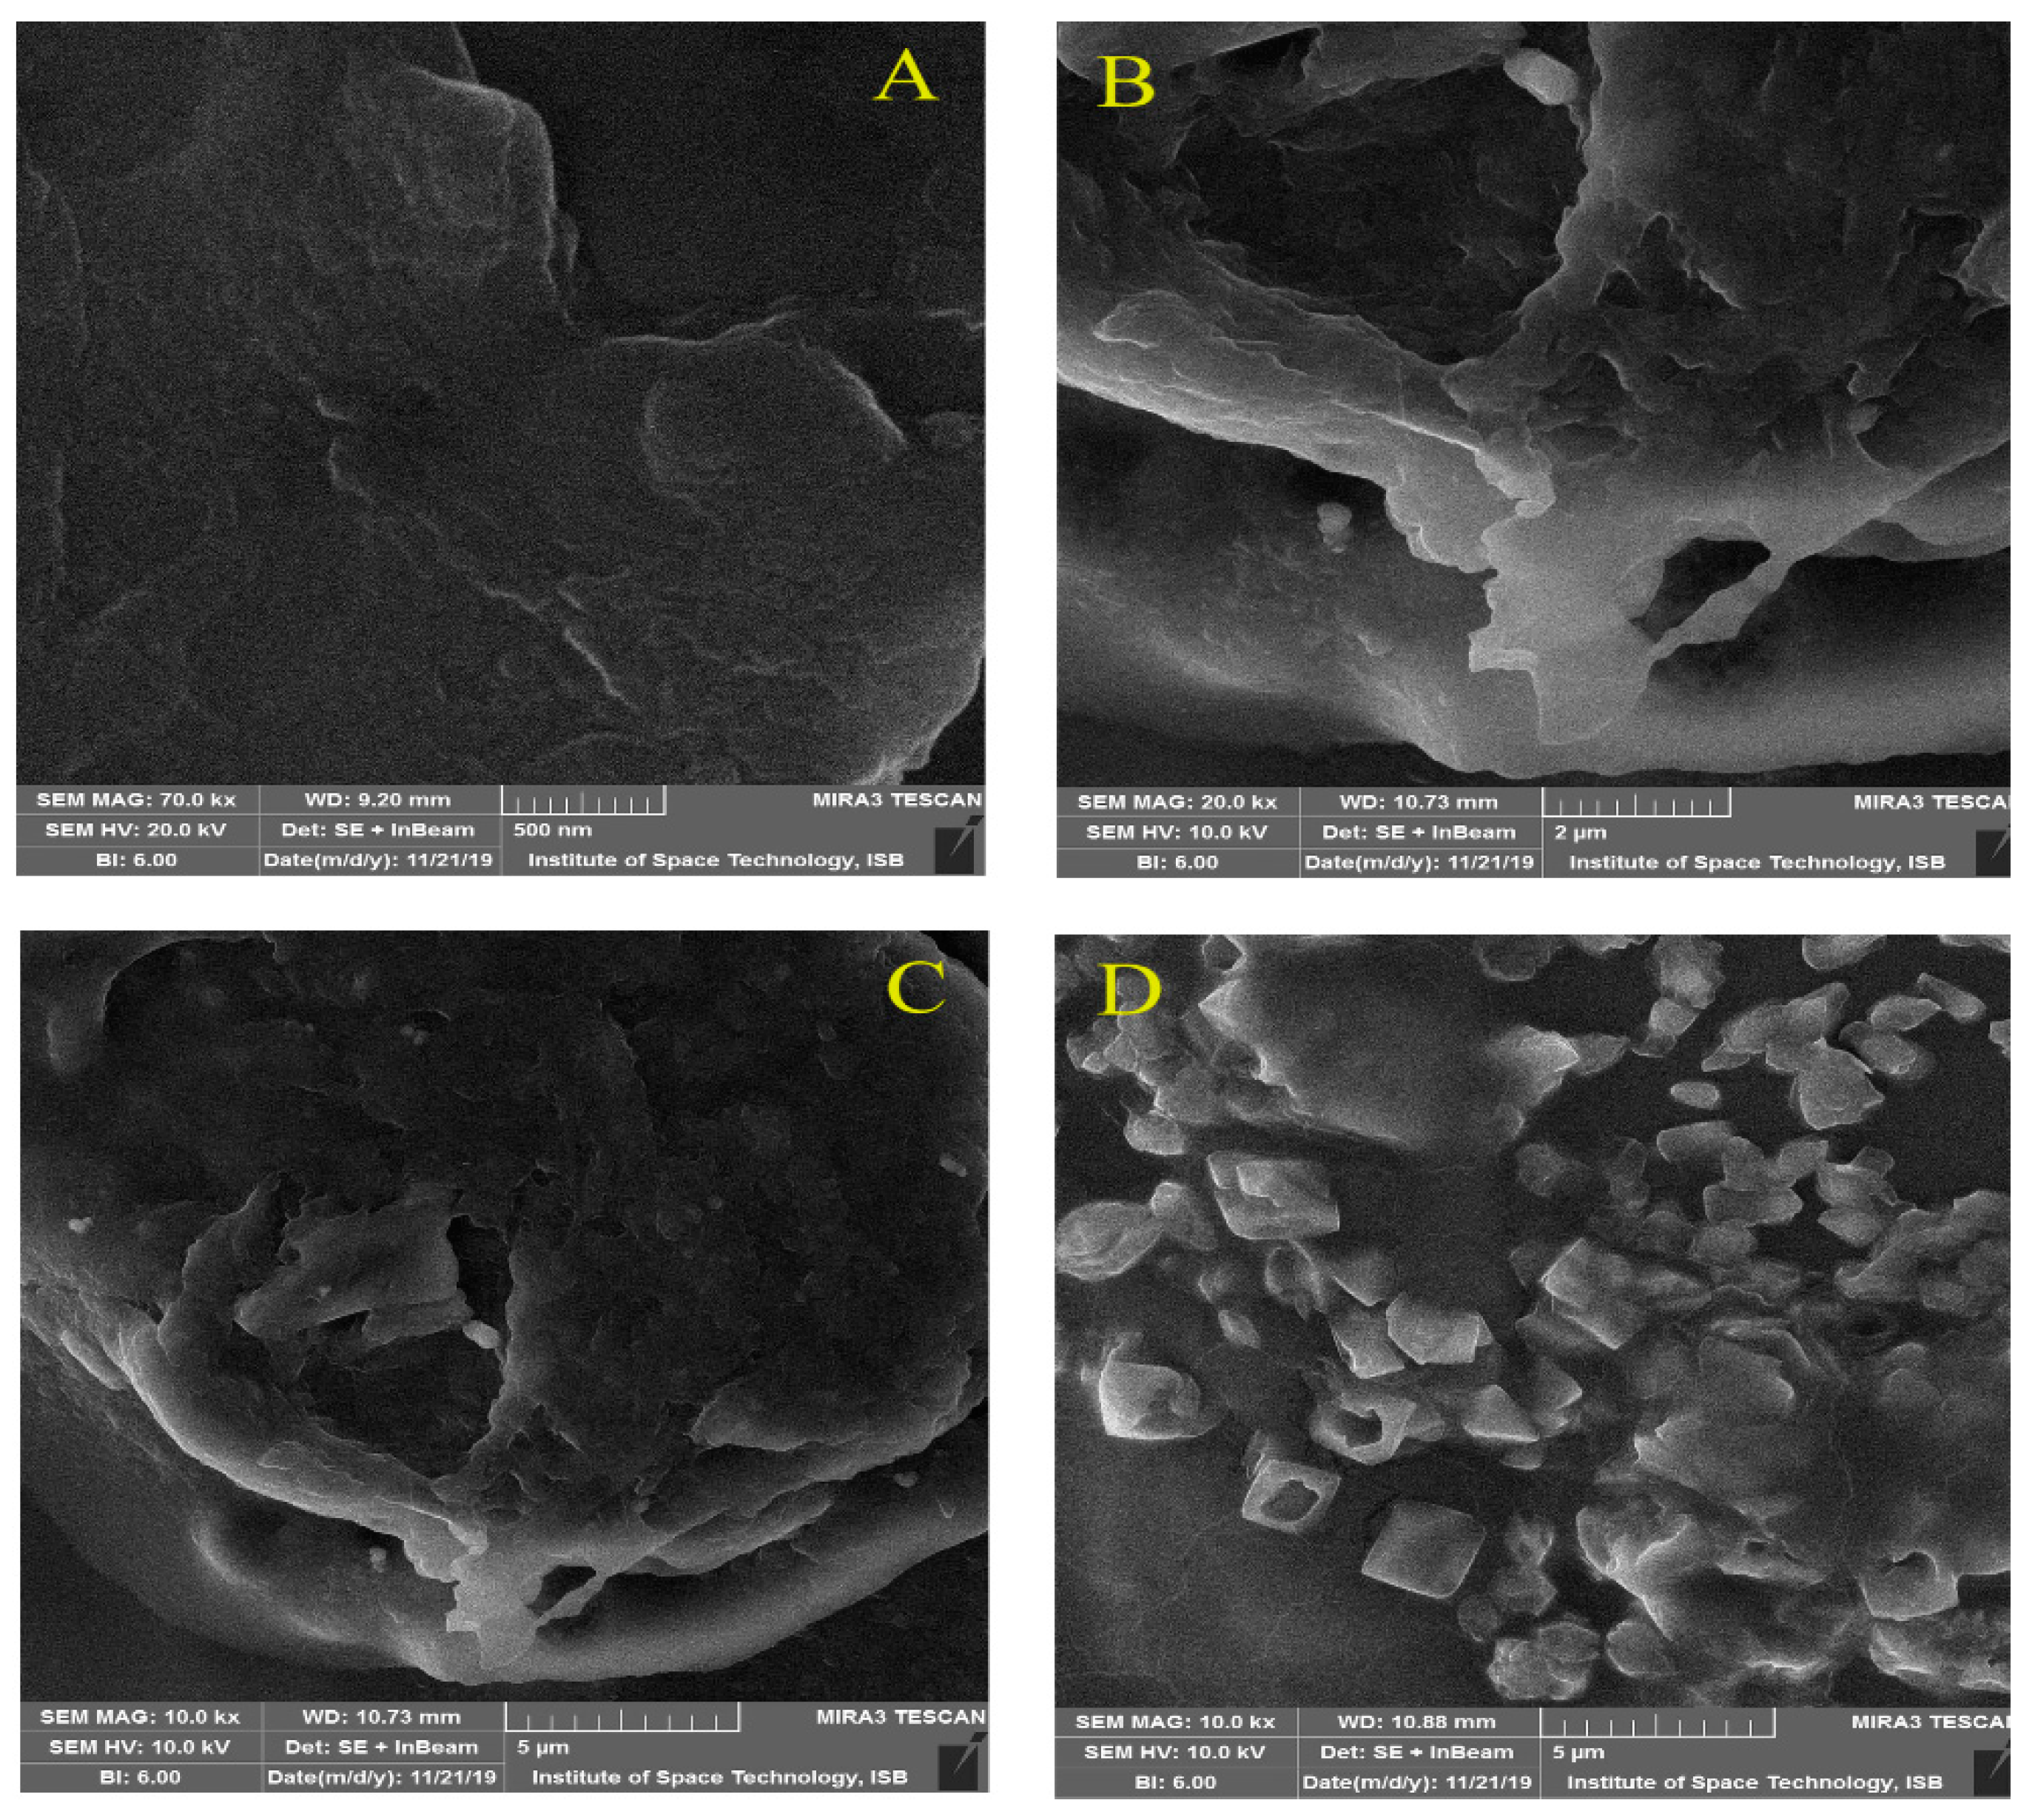
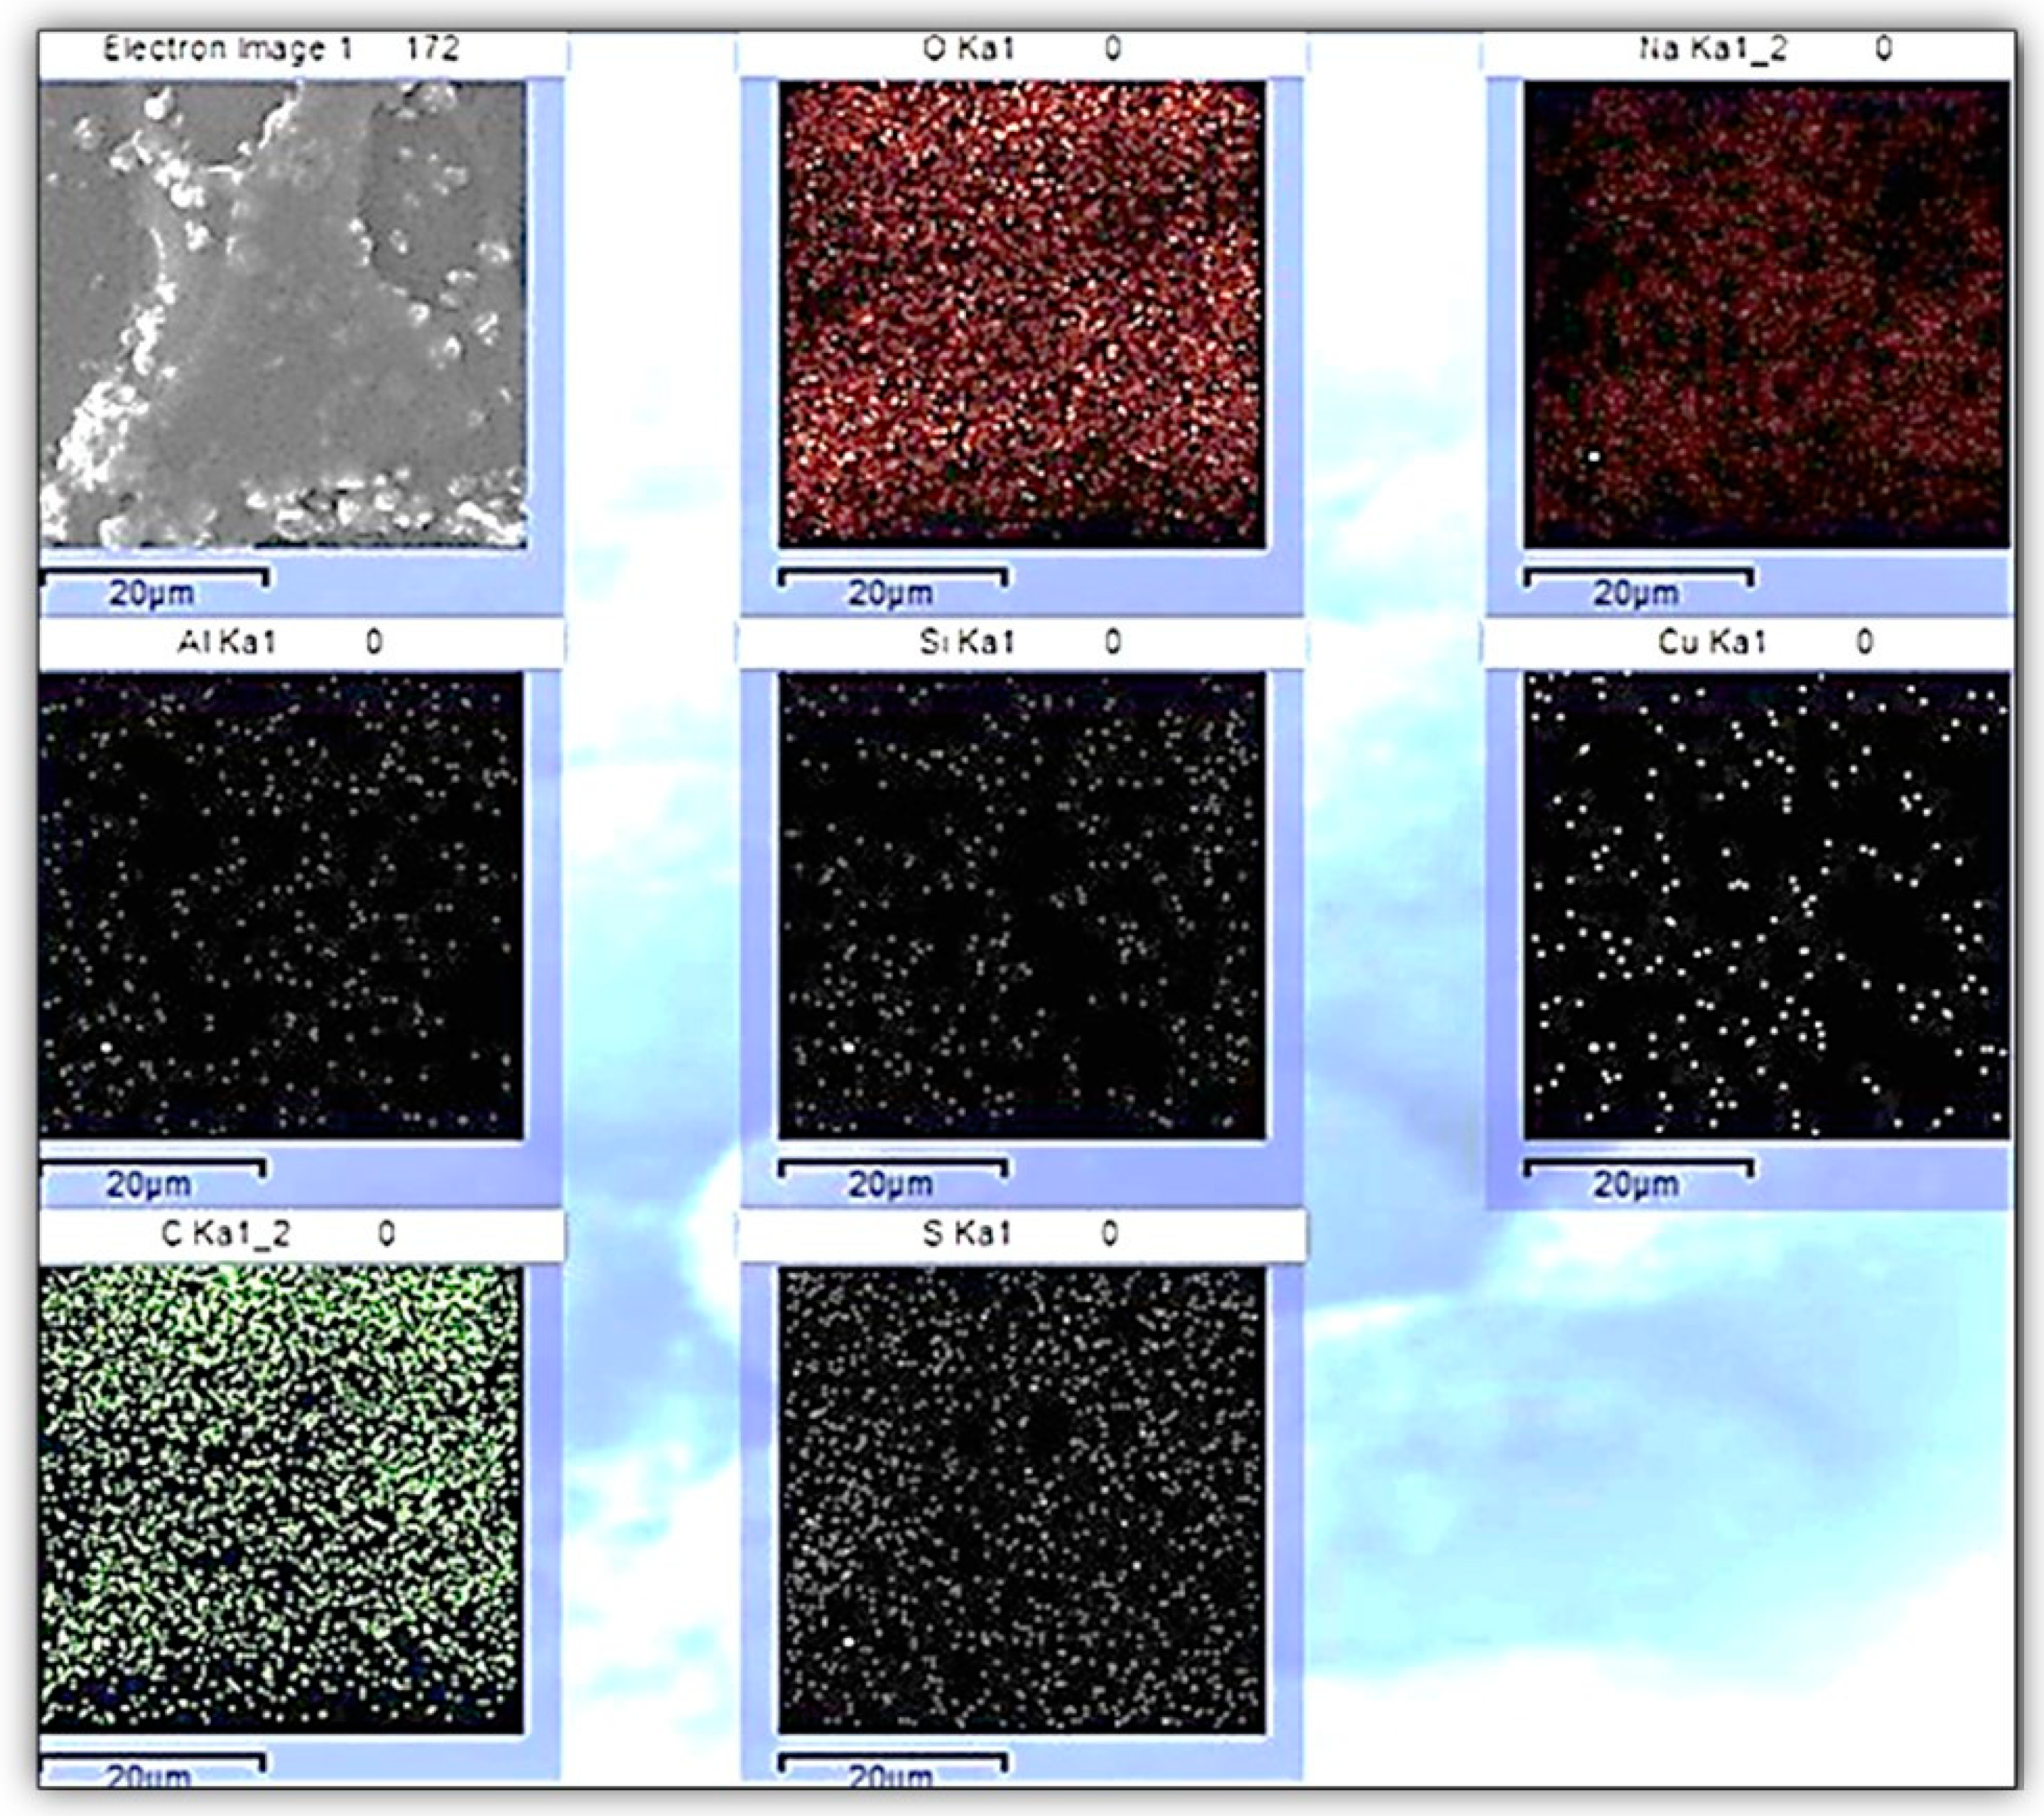
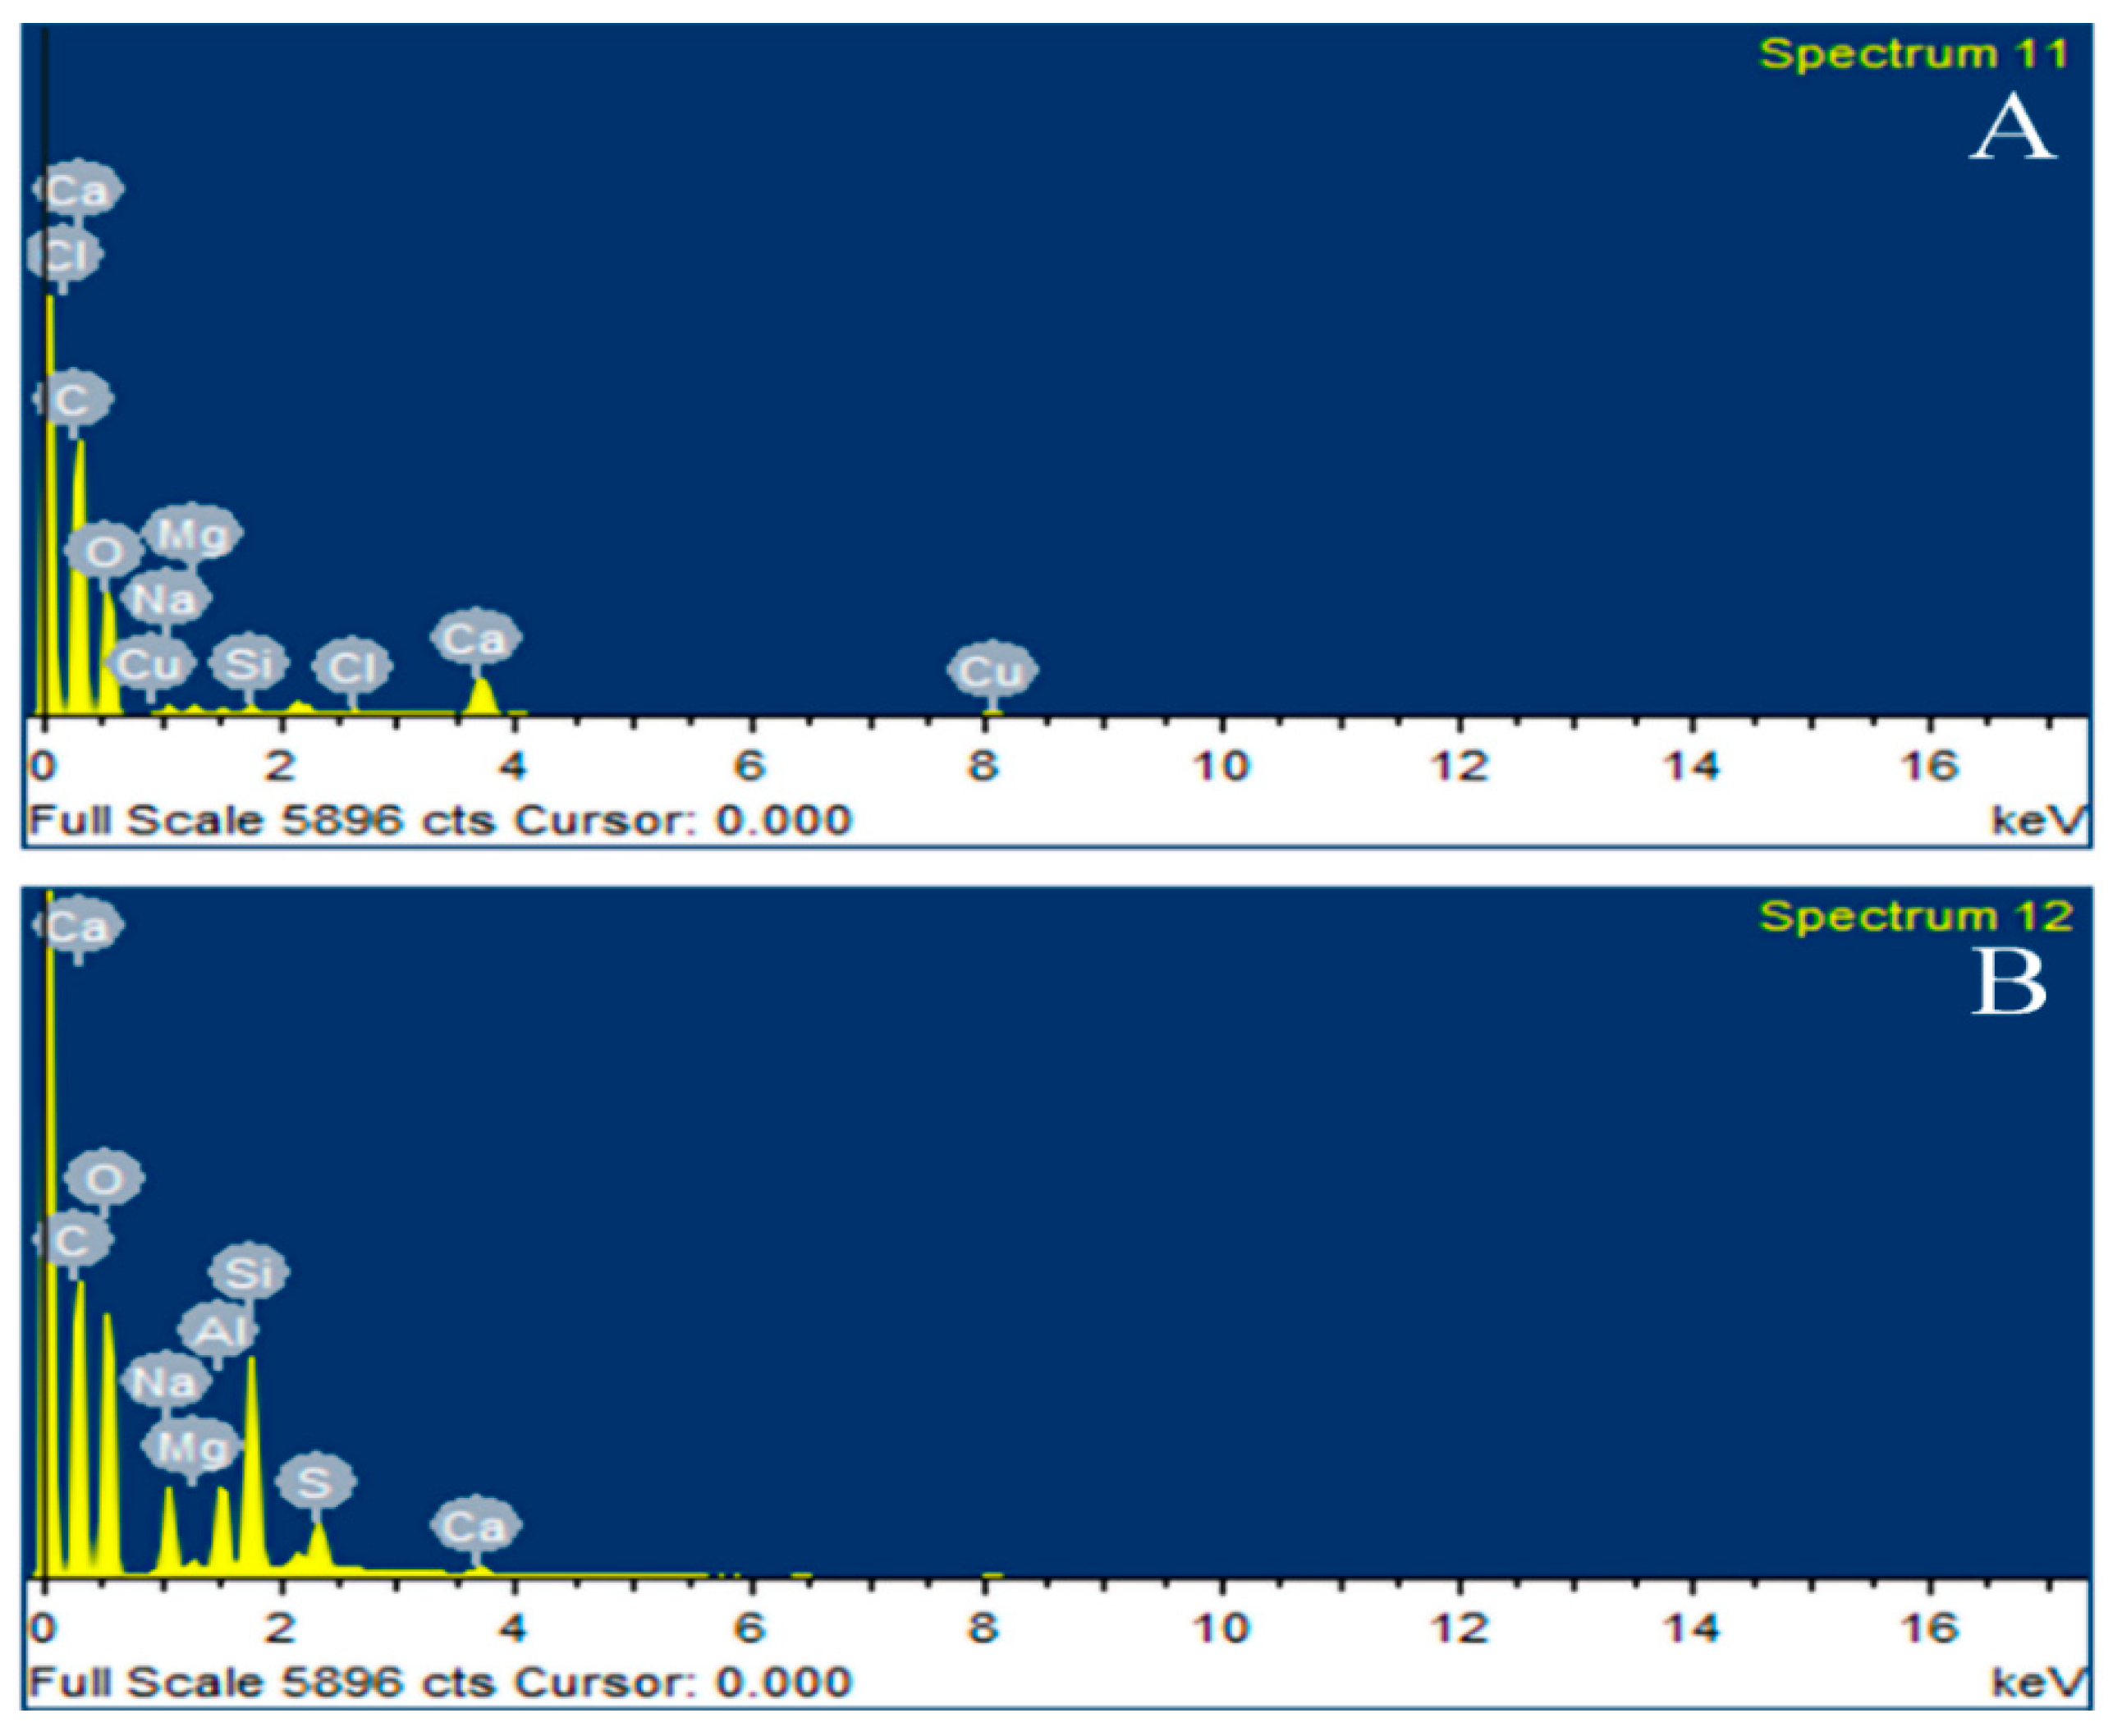
2.3.3. SEM and EDX Analyses
2.4. Swelling Test
2.5. Erosion Test
2.6. Drug Content Uniformity Test
2.7. Calibration Curve Plot
2.8. Ex Vivo Permeation Test
2.8.1. Preparation of Rat Skin
2.8.2. Set Up of Franz Diffusion Cell
2.9. Dissolution Study/Drug Release Behavior
2.10. Statistical Analysis
3. Results
3.1. Thermogravimetric Analysis (TGA)
3.2. X-ray Diffraction Analysis
3.3. SEM Analysis
3.4. EDX Analysis
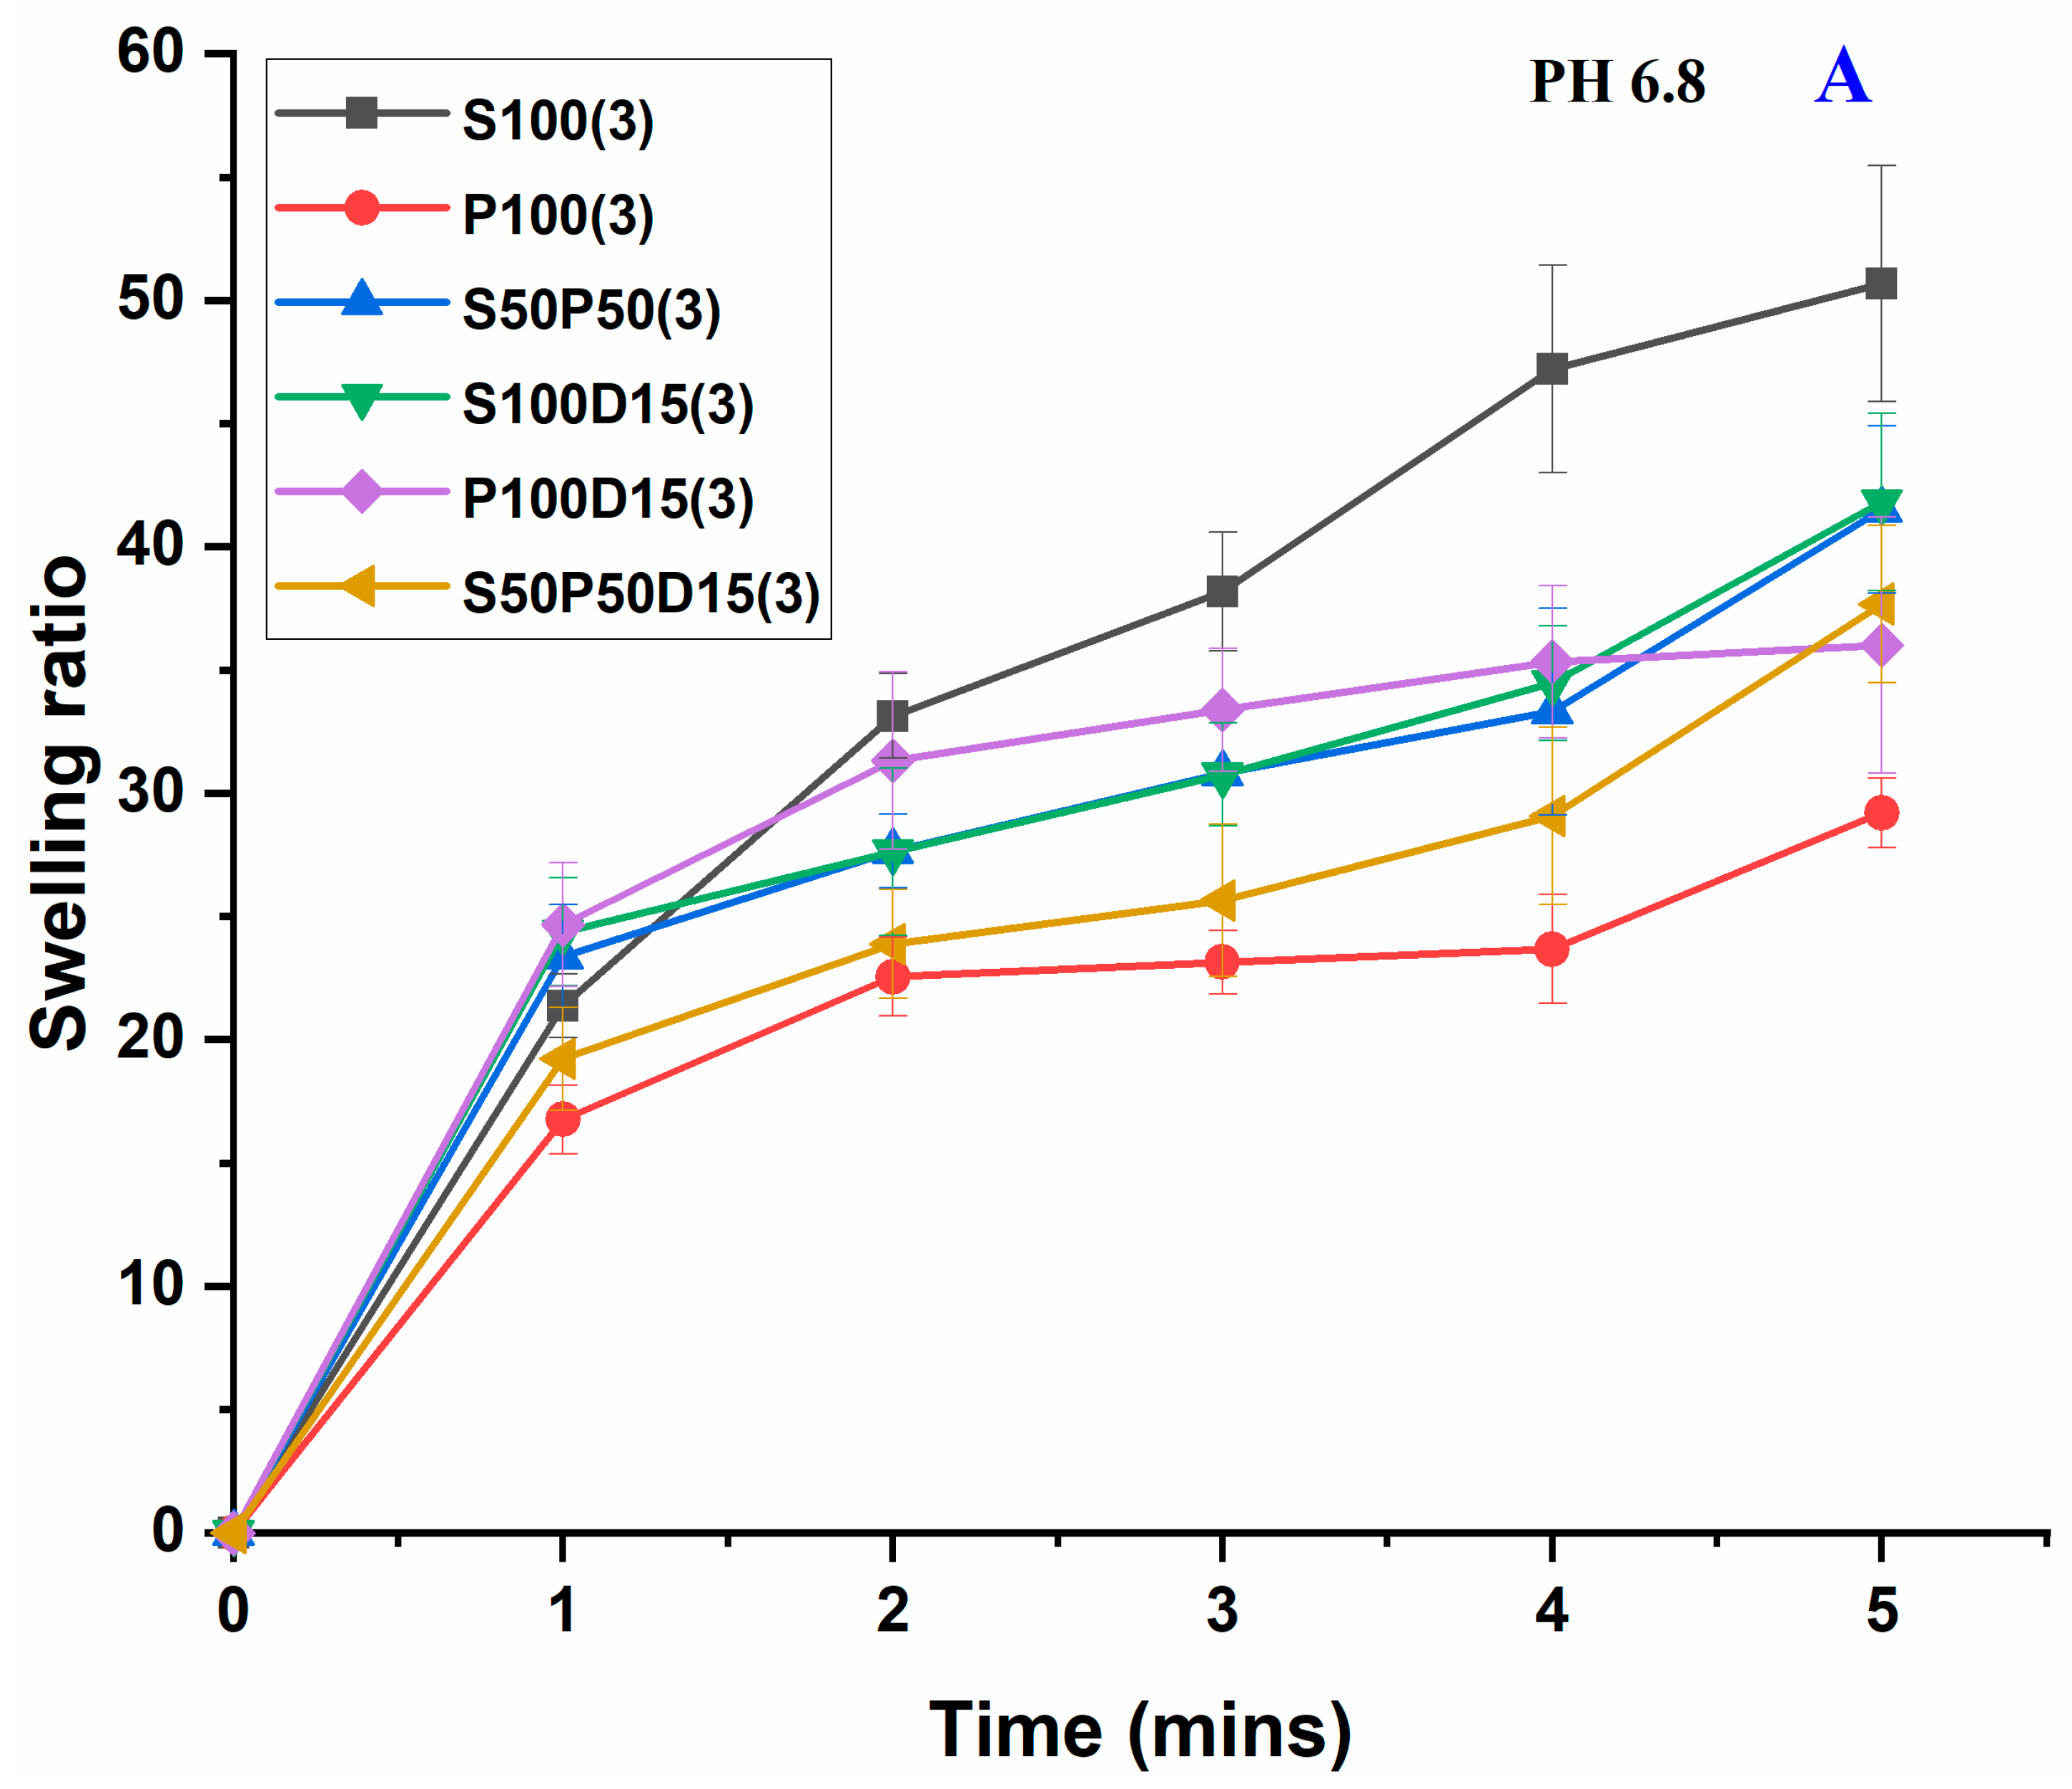
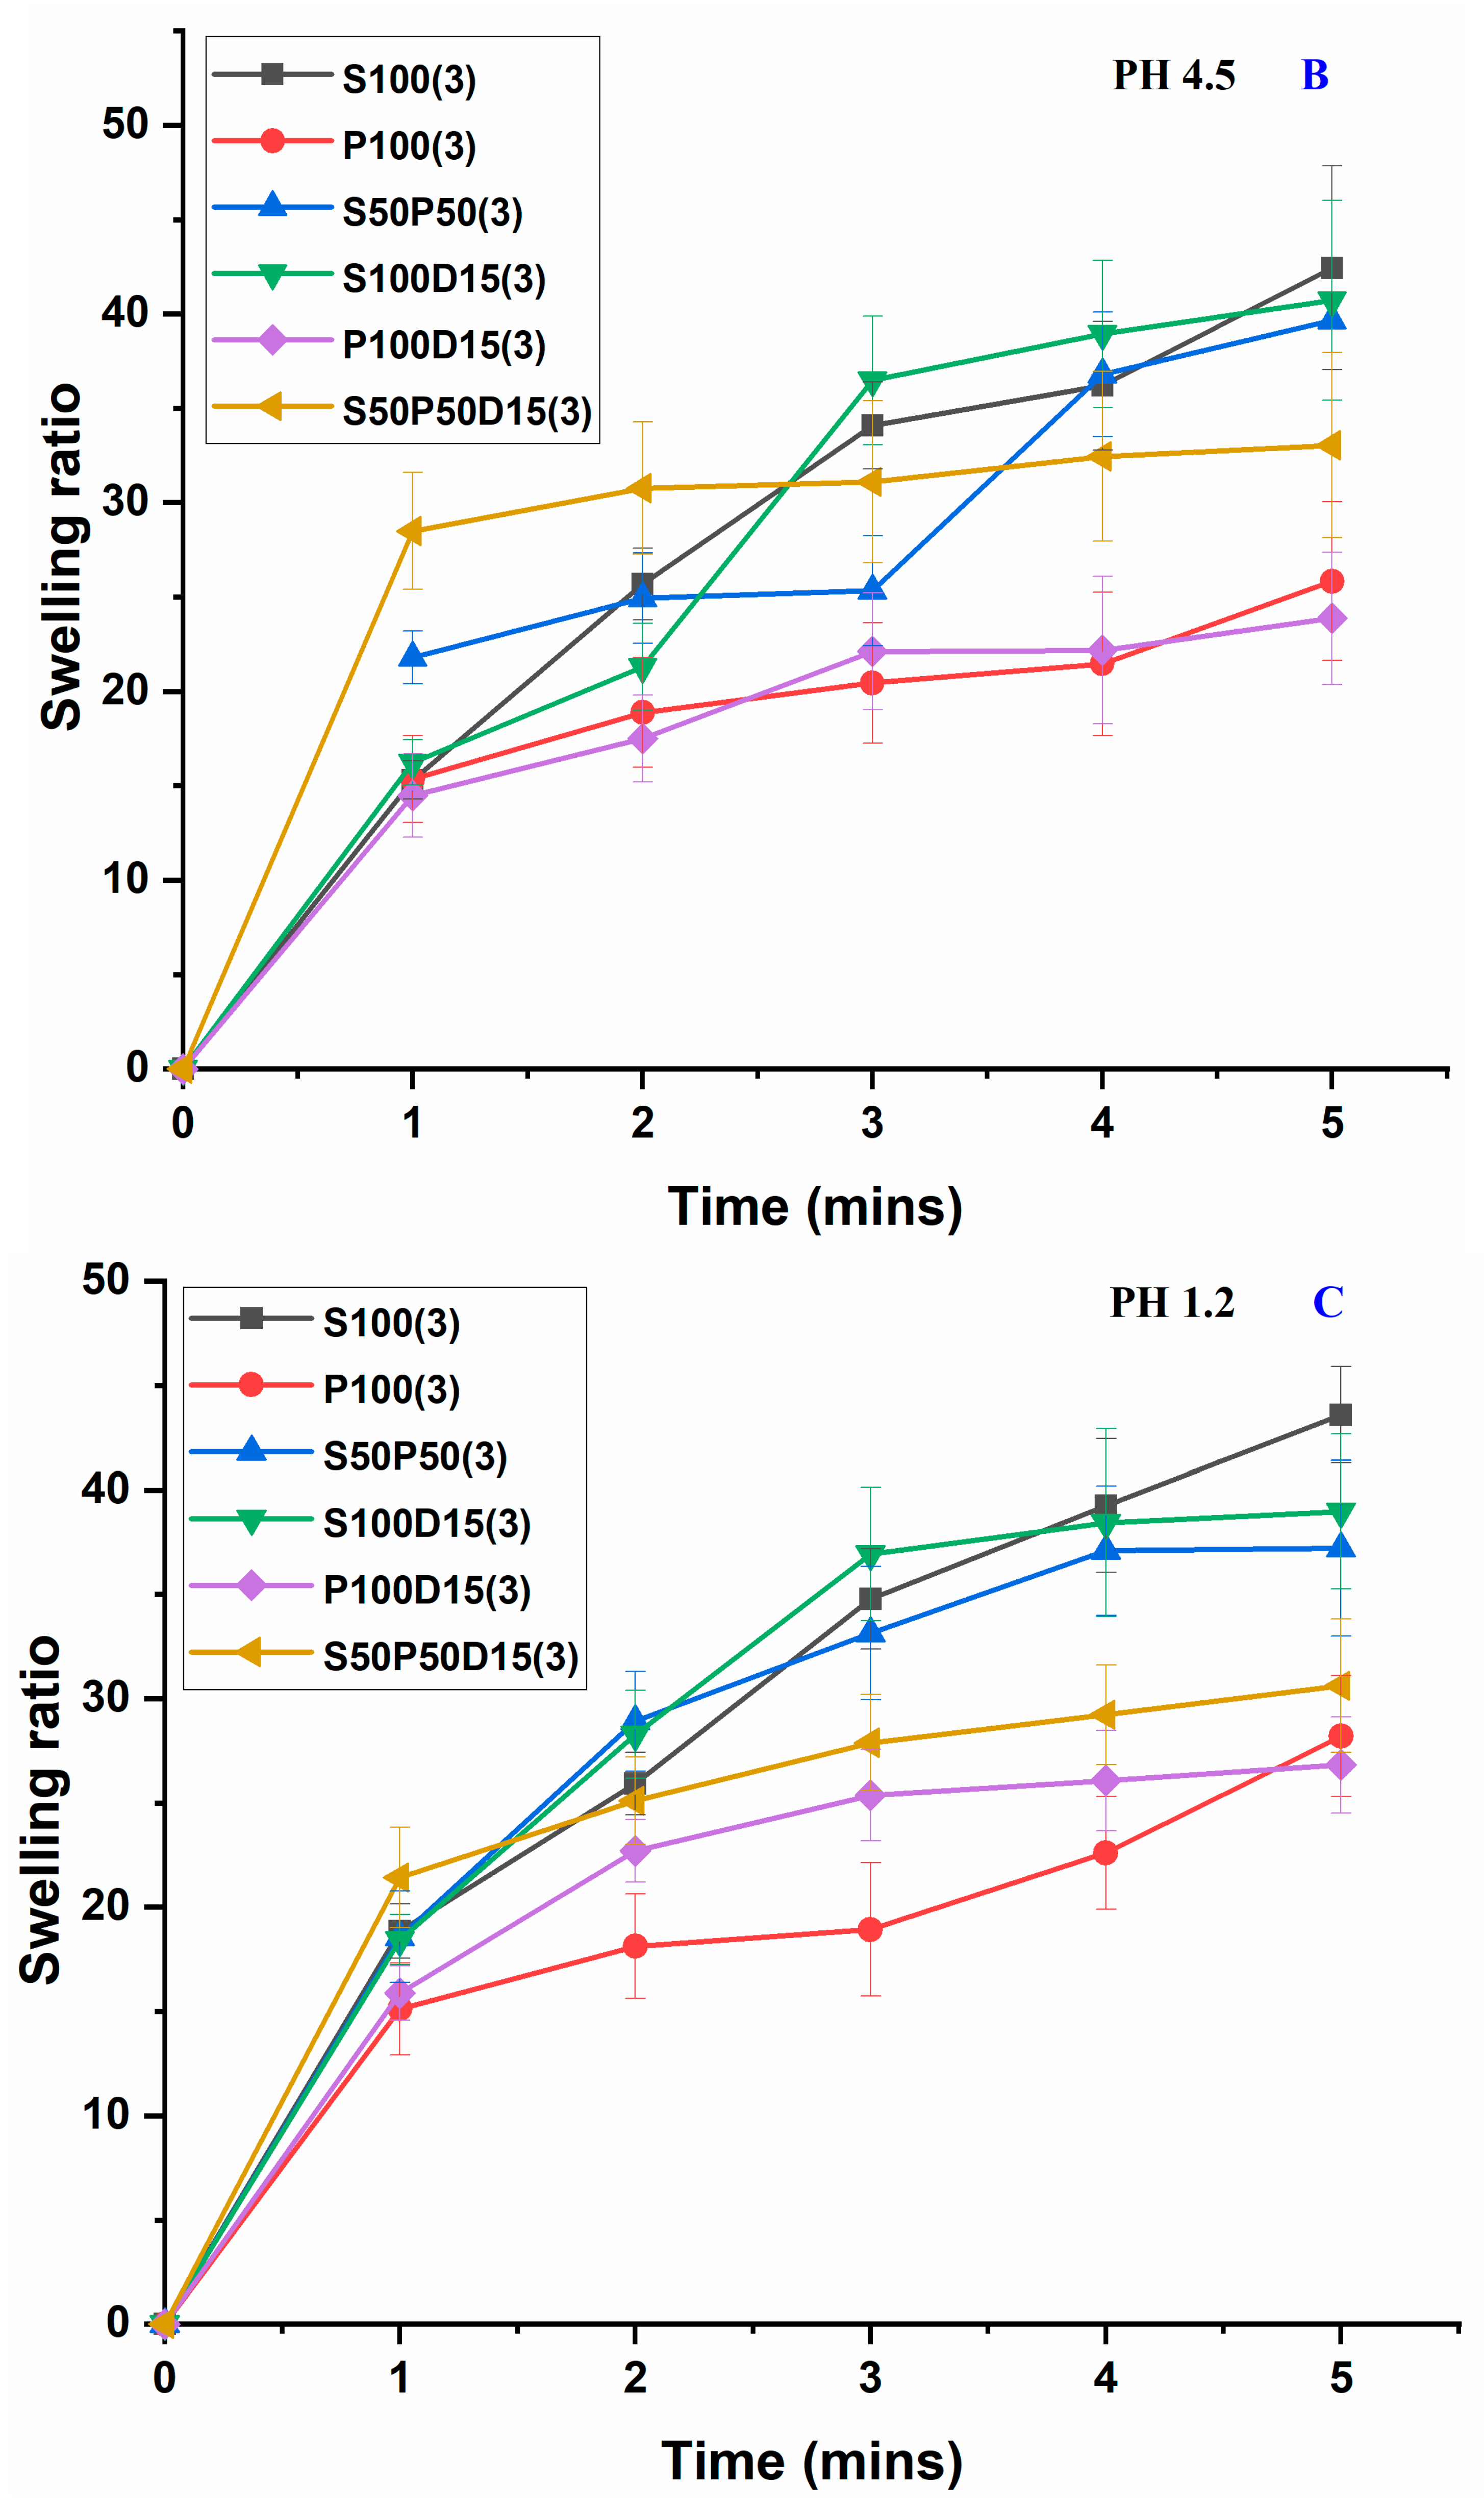
3.5. Swelling Study
3.6. Erosion Studies
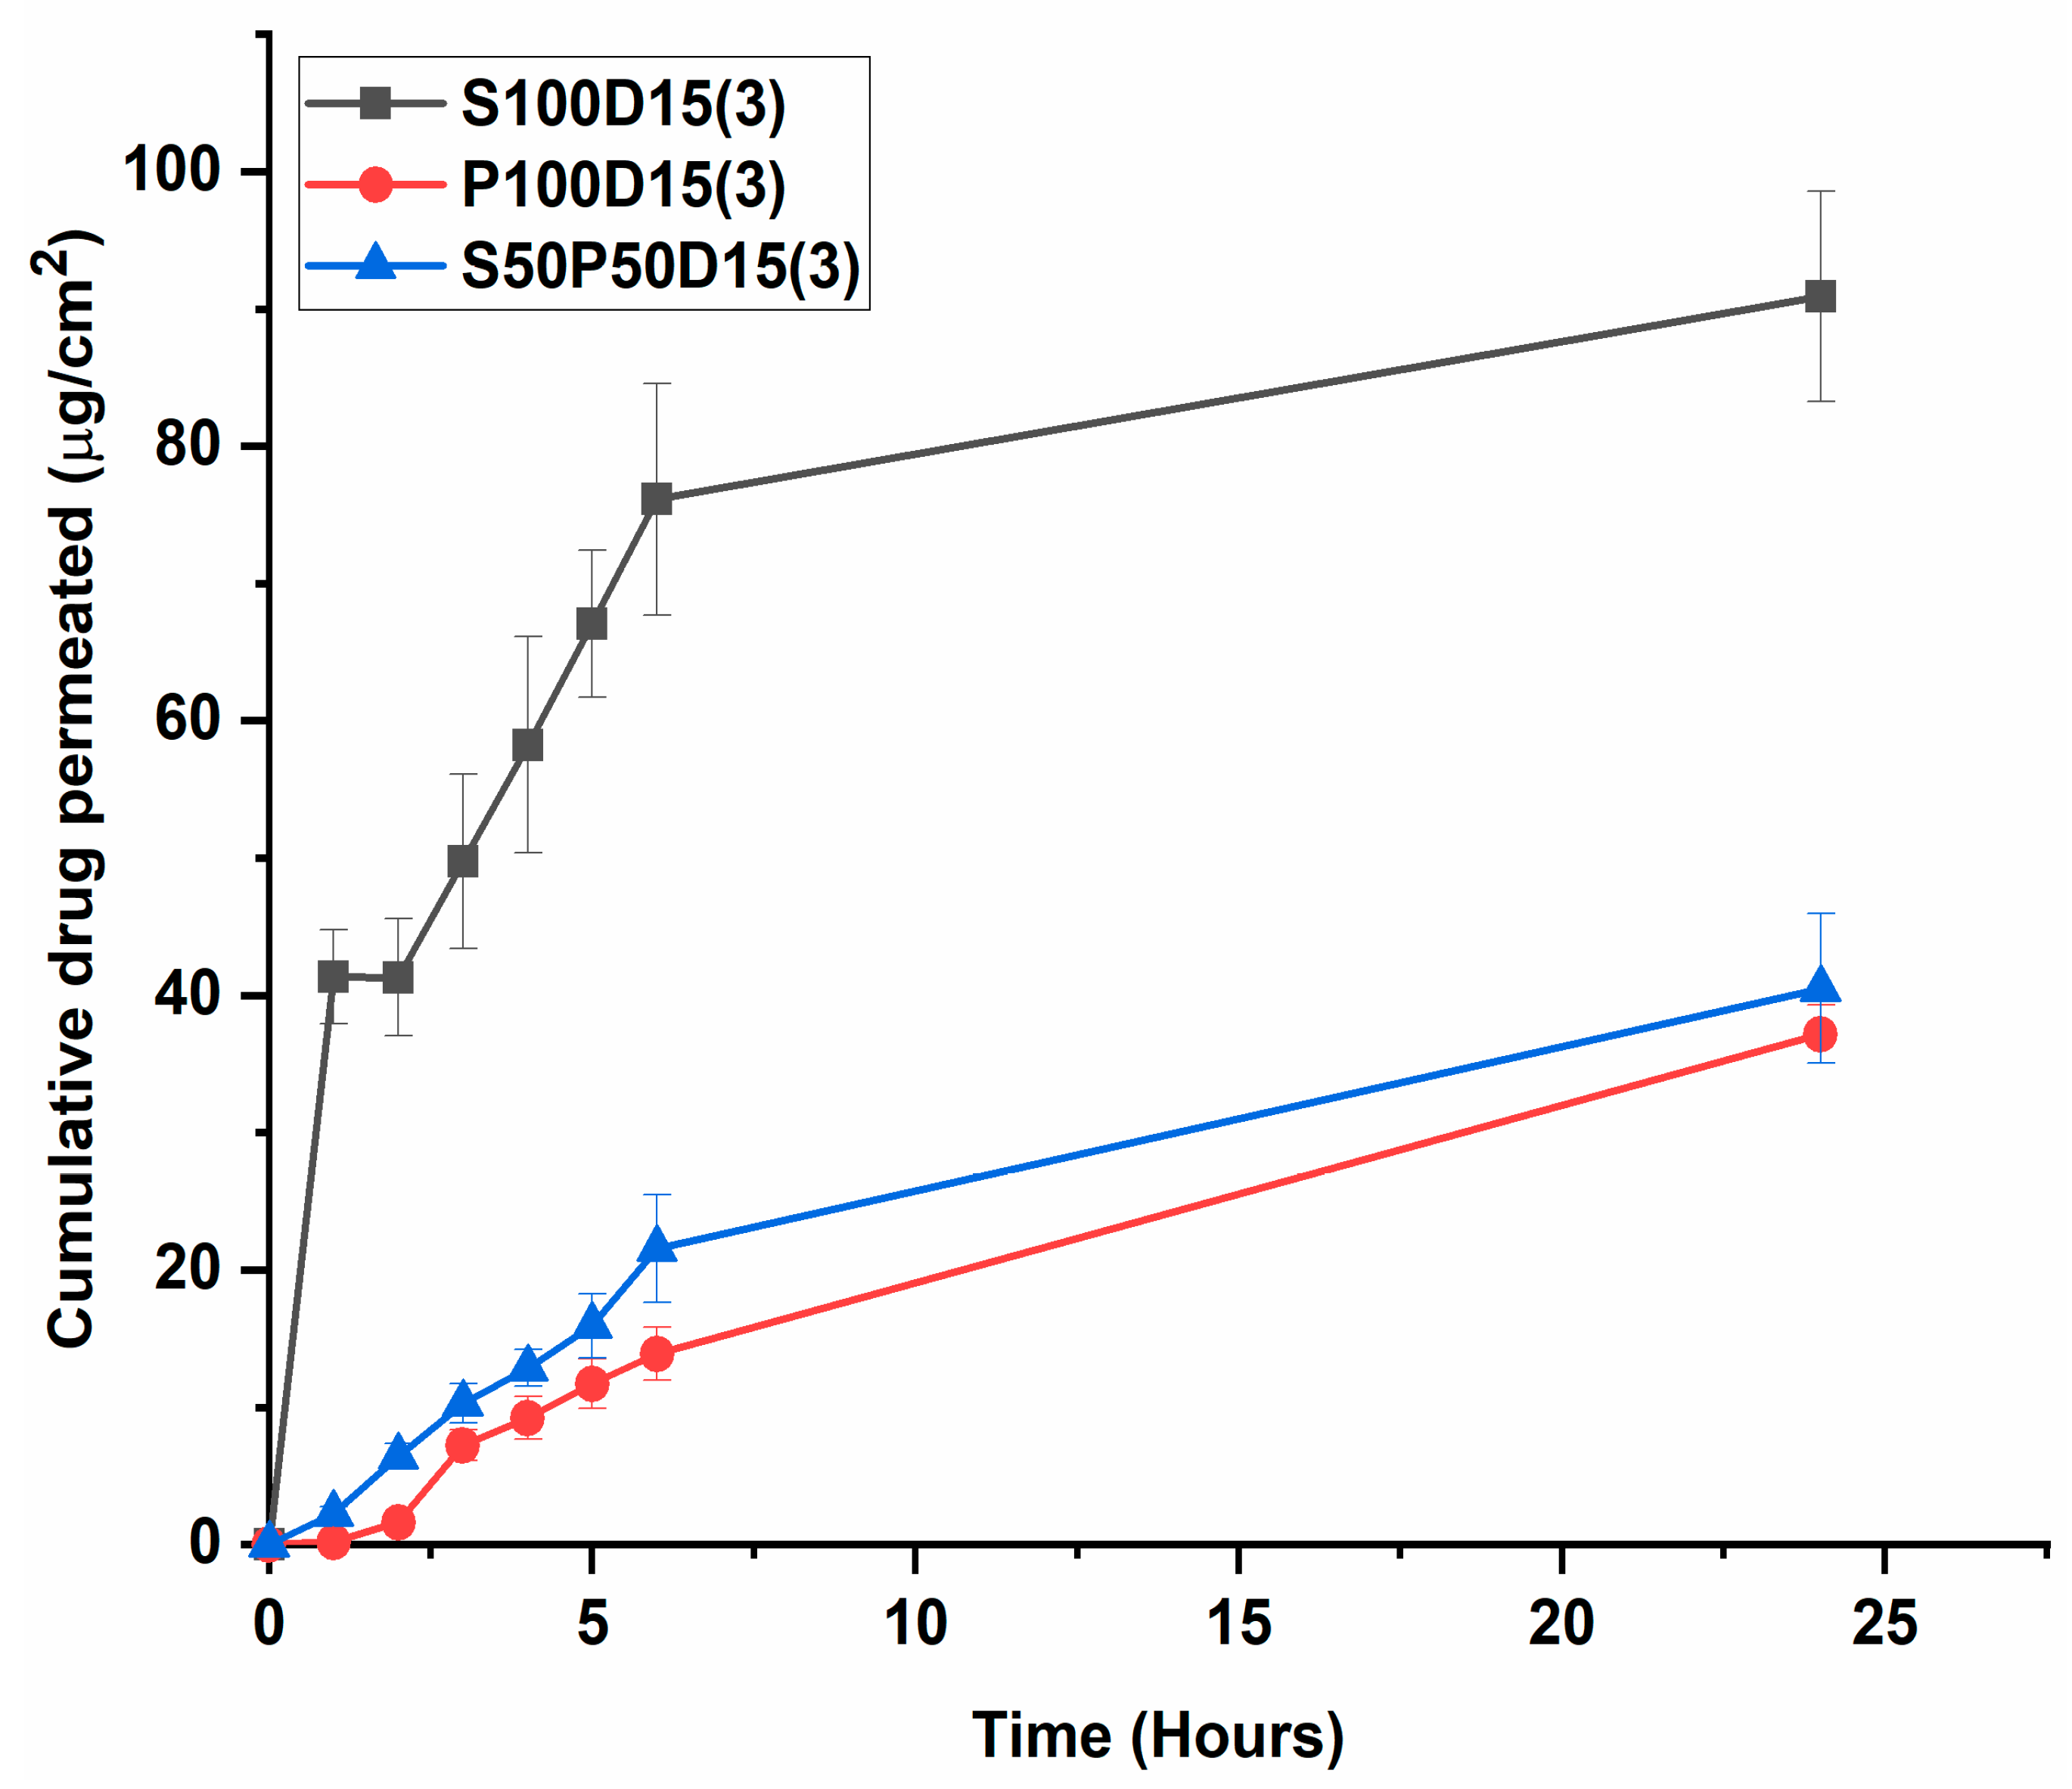
3.7. Drug Permeation Study
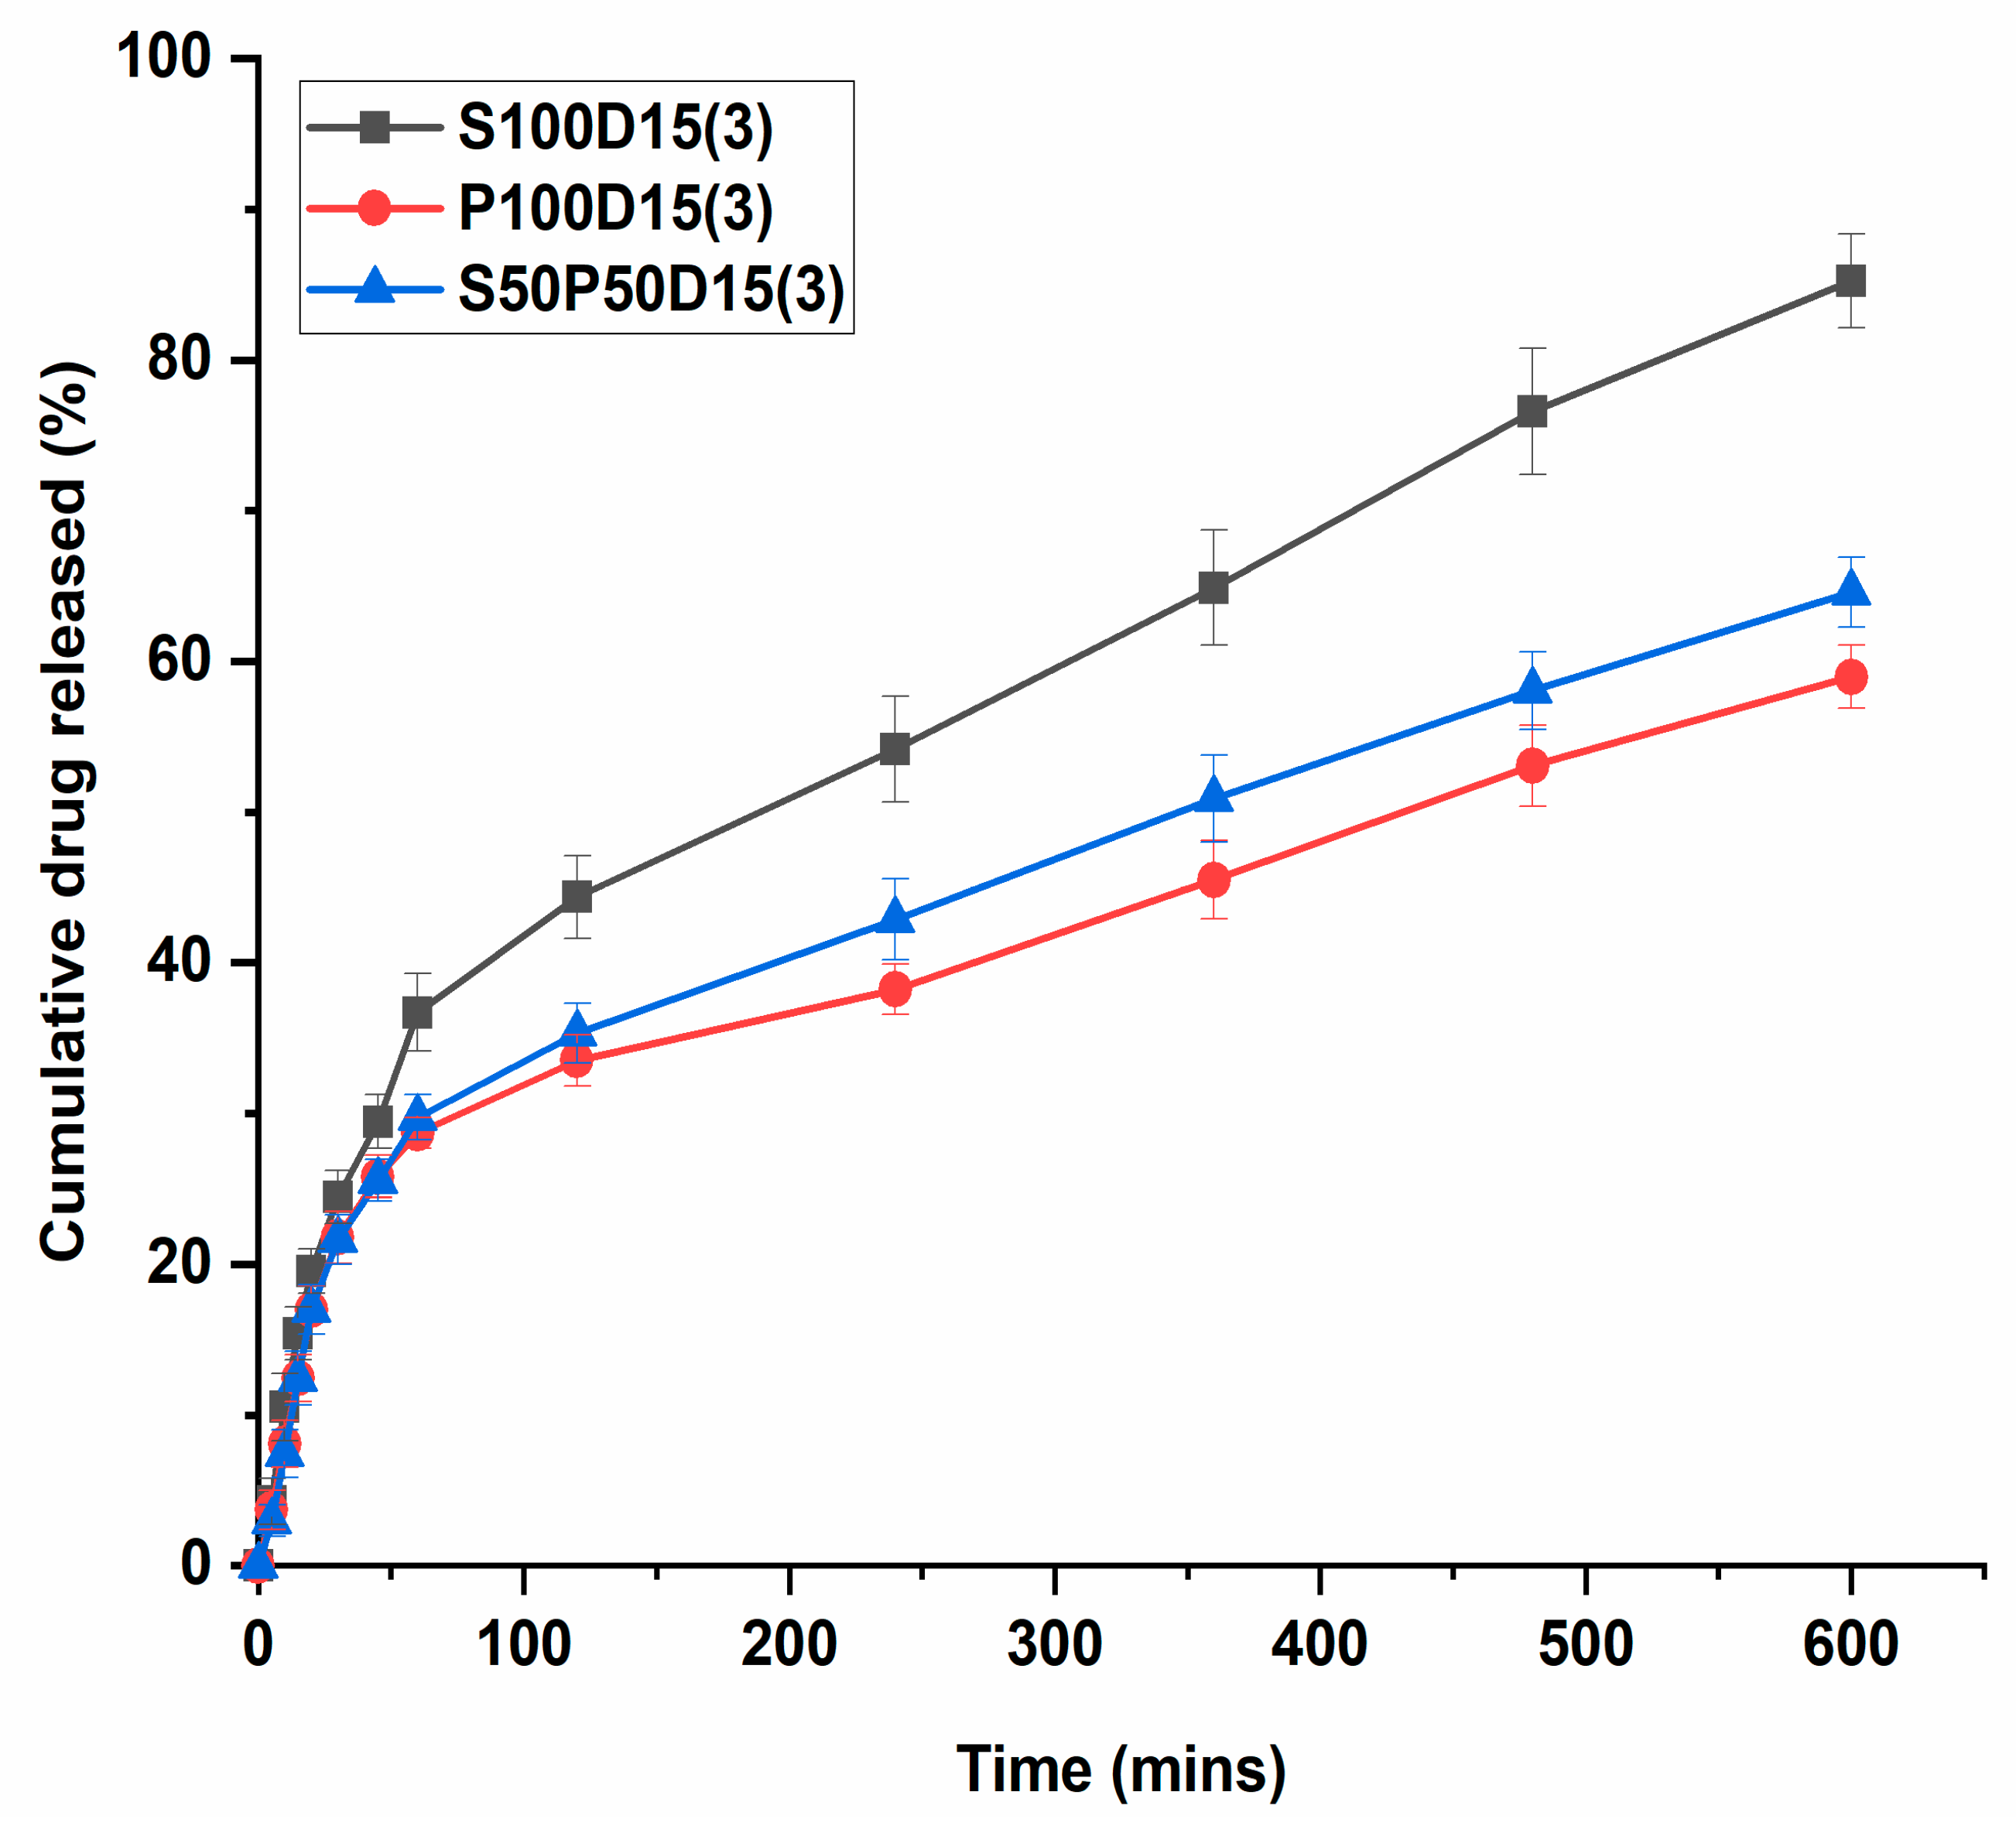
3.8. In Vitro Drug Release Behavior
4. Conclusions
Author Contributions
Funding
Institutional Review Board Statement
Informed Consent Statement
Data Availability Statement
Acknowledgments
Conflicts of Interest
References
- Kamel, S.; Ali, N.; Jahangir, K.; Shah, S.M.; El-Gendy, A.A. Pharmaceutical significance of cellulose: A Review. Express Polym. Lett. 2008, 2, 758–778. [Google Scholar] [CrossRef]
- Chen, Y.; Zhang, Y.; Wang, F.J.; Meng, W.W.; Yang, X.L.; Jiang, J.X.; Tan, H.M.; Zheng, Y.F. Preparation of the porous carboxymethyl chitosan grafted poly (acrylic acid) superabsorbent by solvent precipitation and its application as a hemostatic wound dressing. Mater. Sci. Eng. C 2016, 63, 18–29. [Google Scholar] [CrossRef] [PubMed]
- Alavijeh, M.S.; Chishty, M.; Qaiser, M.Z.; Palmer, A.M. Drug metabolism and pharmacokinetics, the blood-brain barrier, and central nervous system drug discovery. NeuroRx 2005, 2, 554–571. [Google Scholar] [CrossRef] [PubMed] [Green Version]
- Ray, S.; Banerjee, S.; Maiti, S.; Laha, B.; Barik, S.; Sa, B.; Bhattacharyya, U.K. Novel interpenetrating network microspheres of xanthan gum-poly(vinyl alcohol) for the delivery of diclofenac sodium to the intestine—In vitro and in vivo evaluation. Drug Deliv. 2010, 17, 508–519. [Google Scholar] [CrossRef] [Green Version]
- Ferraz, M.P.; Monteiro, F.J.; Manuel, C.M. Hydroxyapatite nanoparticles: A review of preparation methodologies. J. Appl. Biomater. Biomech. 2004, 2, 74–80. [Google Scholar]
- Chan, W.C. Bionanotechnology progress and advances. Biol. Blood Marrow Transpl. 2006, 12, 87–91. [Google Scholar] [CrossRef] [Green Version]
- Menaa, F. When Pharma Meets Nano or The Emerging Era of Nano-Pharmaceutical. Pharm. Anal. Acta 2013, 4, 223. [Google Scholar] [CrossRef] [Green Version]
- Salamanca, C.H.; Barrera-Ocampo, A.; Lasso, J.C.; Camacho, N.; Yarce, C.J. Franz Diffusion Cell Approach for Pre-Formulation Characterisation of Ketoprofen Semi-Solid Dosage Forms. Pharmaceutics 2018, 10, 148. [Google Scholar] [CrossRef] [Green Version]
- Iliescu, R.I.; Andronescu, E.; Voicu, G.; Ficai, A.; Covaliu, C.I. Hybrid materials based on montmorillonite and citostatic drugs. Prep. Charact. Ceftriaxone Sodium Encapsulated Chitosan Nanopart. 2011, 52, 62–68. [Google Scholar]
- Suresh, R.; Borkar, S.N.; Sawant, V.A.; Shende, V.S.; Dimble, S.K. Nanoclay drug delivery system. Int. J. Pharm. Sci. Nanotechnol. 2010, 3, 901–905. [Google Scholar]
- Winey, K.I.; Vaia, R.A. Polymer nanocomposites. MRS Bull. 2007, 32, 314–322. [Google Scholar] [CrossRef] [Green Version]
- Rong, M.Z.; Zhang, M.Q.; Ruan, W.H. Surface modification of nanoscale fillers for improving properties of polymer nanocomposites: A review. Mater. Sci. Technol. 2006, 22, 787–796. [Google Scholar] [CrossRef]
- Jana, S.; Sen, K.K.; Gandhi, A. Alginate Based Nanocarriers for Drug Delivery Applications. Curr. Pharm. Des. 2016, 22, 3399–3410. [Google Scholar] [CrossRef] [PubMed]
- Niculescu, A.G.; Grumezescu, A.M. Applications of Chitosan-Alginate-Based Nanoparticles-An Up-to-Date Review. Nanomaterials 2022, 12, 186. [Google Scholar] [CrossRef]
- Weng, L.; Zhang, X.; Fan, W.; Lu, Y. Development of the inorganic nanoparticles reinforced alginate-based hybrid fiber for wound care and healing. J. Appl. Polym. Sci. 2021, 138, 51228. [Google Scholar] [CrossRef]
- Krebs, M.D.; Salter, E.; Chen, E.; Sutter, K.A.; Alsberg, E. Calcium phosphate-DNA nanoparticle gene delivery from alginate hydrogels induces in vivo osteogenesis. J. Biomed. Mater. Res. A 2010, 92, 1131–1138. [Google Scholar]
- Wang, F.; Yang, S.; Yuan, J.; Gao, Q.; Huang, C. Effective method of chitosan-coated alginate nanoparticles for target drug delivery applications. J. Biomater. Appl. 2016, 31, 3–12. [Google Scholar] [CrossRef]
- Tuğcu-Demiröz, F.; Acartürk, F.; Takka, S.; Konuş-Boyunağa, Ö. Evaluation of alginate based mesalazine tablets for intestinal drug delivery. Eur. J. Pharm. Biopharm. 2007, 67, 491–497. [Google Scholar] [CrossRef]
- Kim, J.O.; Park, J.K.; Kim, J.H.; Jin, S.G.; Yong, C.S.; Li, D.X.; Choi, J.Y.; Woo, J.S.; Yoo, B.K.; Lyoo, W.S.; et al. Development of polyvinyl alcohol–sodium alginate gel-matrix-based wound dressing system containing nitrofurazone. Int. J. Pharm. 2008, 359, 79–86. [Google Scholar] [CrossRef]
- Şanlı, O.; Ay, N.; Işıklan, N. Release characteristics of diclofenac sodium from poly (vinyl alcohol)/sodium alginate and poly (vinyl alcohol)-grafted-poly (acrylamide)/sodium alginate blend beads. Eur. J. Pharm. Biopharm. 2007, 65, 204–214. [Google Scholar] [CrossRef]
- Han, X.; Huo, P.; Ding, Z.; Kumar, P.; Liu, B. Preparation of Lutein-Loaded PVA/Sodium Alginate Nanofibers and Investigation of Its Release Behavior. Pharmaceutics 2019, 11, 449. [Google Scholar] [CrossRef] [PubMed] [Green Version]
- Razzaq, A.; Khan, Z.; Saeed, A.; Shah, K.; Khan, N.; Menaa, B.; Iqbal, H.; Menaa, F. Development of Cephradine-Loaded Gelatin/Polyvinyl Alcohol Electrospun Nanofibers for Effective Diabetic Wound Healing: In Vitro and In Vivo Assessments. Pharmaceutics 2021, 13, 349. [Google Scholar] [CrossRef] [PubMed]
- Khan, B.A.; Ullah, S.; Khan, M.K.; Uzair, B.; Menaa, F.; Braga, V.A. Fabrication, Physical Characterizations, and In Vitro, In Vivo Evaluation of Ginger Extract-Loaded Gelatin/Poly(Vinyl Alcohol) Hydrogel Films Against Burn Wound Healing in Animal Model. AAPS Pharm. Sci. Tech. 2020, 21, 1–10. [Google Scholar] [CrossRef] [PubMed]
- Tewabe, A.; Marew, T.; Birhanu, G. The contribution of nano-based strategies in overcoming ceftriaxone resistance: A literature review. Pharmacol. Res. Perspect. 2021, 9, e00849. [Google Scholar] [CrossRef] [PubMed]
- Alshubaily, F.A.; Al-Zahrani, M.H. Appliance of fungal chitosan/ceftriaxone nano-composite to strengthen and sustain their antimicrobial potentiality against drug resistant bacteria. Int. J. Biol. Macromol. 2019, 135, 1246–1251. [Google Scholar] [CrossRef] [PubMed]
- Khan, Z.U.; Razzaq, A.; Khan, A.; Rehman, N.U.; Khan, H.; Khan, T.; Khan, A.U.; Althobaiti, N.A.; Menaa, F.; Iqbal, H.; et al. Physicochemical Characterizations and Pharmacokinetic Evaluation of Pentazocine Solid Lipid Nanoparticles against Inflammatory Pain Model. Pharmaceutics 2022, 14, 409. [Google Scholar] [CrossRef]
- Wang, X.; Du, Y.; Luo, J.; Lin, B.; Kennedy, J.F. Chitosan/organic rectorite nanocomposite films: Structure, characteristic and drug delivery behaviour. Carbohydr. Polym. 2007, 69, 41–49. [Google Scholar] [CrossRef]
- Iqbal, H.; Khan, B.A.; Khan, Z.U.; Razzaq, A.; Khan, N.U.; Menaa, B.; Menaa, F. Fabrication, physical characterizations and in vitro antibacterial activity of cefadroxil-loaded chitosan/poly(vinyl alcohol) nanofibers against Staphylococcus aureus clinical isolates. Int. J. Biol. Macromol. 2020, 144, 921–931. [Google Scholar] [CrossRef]
- Zafar, N.; Uzair, B.; Niazi, M.B.K.; Menaa, F.; Samin, G.; Khan, B.A.; Iqbal, H.; Menaa, B. Green Synthesis of Ciprofloxacin-Loaded Cerium Oxide/Chitosan Nanocarrier and its Activity Against MRSA-Induced Mastitis. J. Pharm. Sci. 2021, 110, 3471–3483. [Google Scholar] [CrossRef]
- Cao, Z.; Yang, Q.; Fan, C.; Liu, L.; Liao, L. Biocompatible, ionic strength sensitive, double network hydrogel based on chitosan and an oligo (trimethylene carbonate)–poly (ethylene glycol)–oligo (trimethylene carbonate) triblock copolymer. Appl. Polym. Sci. 2015, 132, 1–7. [Google Scholar] [CrossRef]
- Lamoudi, L.; Chaumeil, J.C.; Daoud, K. Swelling, erosion and drug release characteristics of sodium diclofenac from heterogeneous matrix tablets. Drug Deliv. Sci. Technol. 2016, 31, 93–100. [Google Scholar] [CrossRef]
- Ethiraj, R.; Thiruvengadam, E.; Sampath, V.S.; Vahid, A.; Raj, J. Development and Validation of Stability Indicating Spectroscopic Method for Content Analysis of Ceftriaxone Sodium in Pharmaceuticals. Int. Sch. Res. Not. 2014, 2014, 278173. [Google Scholar] [CrossRef] [PubMed]
- Ng, S.F.; Rouse, J.; Sanderson, D.; Eccleston, G. A comparative study of transmembrane diffusion and permeation of ibuprofen across synthetic membranes using Franz diffusion cells. Pharm. Pharmacol. Lett. 2010, 2, 209–223. [Google Scholar] [CrossRef] [PubMed] [Green Version]
- Khan, M.K.; Khan, B.A.; Uzair, B.; Iram Niaz, S.; Khan, H.; Hosny, K.M.; Menaa, F. Development of Chitosan-Based Nanoemulsion Gel Containing Microbial Secondary Metabolite with Effective Antifungal Activity: In vitro and in vivo Characterizations. Int. J. Nanomed. 2021, 16, 8203–8219. [Google Scholar] [CrossRef]
- Soares, J.D.; Santos, J.E.; Chierice, G.O.; Cavalheiro, E.T. Thermal behaviour of alginic acid and its sodium salt. Eclet. Quim. Sao Paulo 2004, 29, 53–56. [Google Scholar]
- Ahmad, M.B.; Gharayebi, Y.; Salit, M.S.; Hussein, M.Z.; Shameli, K. Comparison of in situ polymerization and solution-dispersion techniques in the preparation of polyimide/montmorillonite (MMT) nanocomposites. Int. J. Mol. Sci 2011, 12, 6040–6050. [Google Scholar] [CrossRef] [Green Version]
- Nešić, A.; Onjia, A.; Davidović, S.; Dimitrijević, S.; Errico, M.E.; Santagata, G.; Malinconico, M. Design of pectin-sodium alginate-based films for potential healthcare application: Study of chemico-physical interactions between the components of films and assessment of their antimicrobial activity. Carbohydr. Polym. 2017, 157, 981–990. [Google Scholar] [CrossRef]
- Sabaa, M.W.; Abdallah, H.M.; Mohamed, N.A.; Mohamed, R.R. Synthesis, characterization, and application of biodegradable crosslinked carboxymethyl chitosan/poly (vinyl alcohol) clay nanocomposites. Mater. Sci. Eng. C 2015, 56, 363–373. [Google Scholar] [CrossRef]
- Yadav, M.; Rhee, K.Y. Superabsorbent nanocomposite (alginate-g-PAMPS/MMT) Synthesis, characterization, and swelling behavior. Carbohydr. Polym. 2012, 90, 165–173. [Google Scholar] [CrossRef]
- Navarchian, A.H.; Joulazadeh, M.; Mousazadeh, S. Application of the taguchi approach to investigate the effects of clay content and saponification parameters on the tensile properties of poly (vinyl alcohol)/clay nanocomposites. J. Vinyl Addit. Technol. 2013, 19, 276–284. [Google Scholar] [CrossRef]
- Youdhestar Mahar, F.K.; Das, G.; Tajammul, A.; Ahmed, F.; Khatri, M.; Khan, S.; Khatri, Z. Fabrication of Ceftriaxone-Loaded Cellulose Acetate and Polyvinyl Alcohol Nanofibers and Their Antibacterial Evaluation. Antibiotics 2022, 11, 352. [Google Scholar] [CrossRef] [PubMed]
- Jung, H.M.; Lee, E.M.; Ji, B.C.; Deng, Y.; Yun, J.D.; Yeum, J.H. Poly (vinyl acetate)/poly (vinyl alcohol)/montmorillonite nanocomposite microspheres prepared by suspension polymerization and saponification. Colloid Polym. Sci. 2007, 285, 705–710. [Google Scholar] [CrossRef]
- Calik, M.K.; Ozdemir, M. Synthesis, characterization and, swelling behavior of semi IPN nanocomposite hydrogels of alginate with poly (N isopropylacrylamide) crosslinked by nanoclay. Appl. Polym. Sci. 2016, 133, 5–12. [Google Scholar] [CrossRef]


| # | SA (S) | PVA (P) | CTX Drug (D) | Nanoclay MMT (M) | Glycerol | Code Formulation |
|---|---|---|---|---|---|---|
| 1 | 100 | 0 | 0 | 3 | 50 | S100(3) |
| 2 | 0 | 100 | 0 | 3 | 50 | P100(3) |
| 3 | 50 | 50 | 0 | 3 | 50 | S50P50(3) |
| 4 | 100 | 0 | 15 | 3 | 50 | S100D15(3) |
| 5 | 0 | 100 | 15 | 3 | 50 | P100D15(3) |
| 6 | 50 | 50 | 15 | 3 | 50 | S50P50D15(3) |
| # | Formulation Code SA/PVA Ratio | Mass Loss (%) 120 °C | Mass Loss (%) 200 °C | Mass Loss (%) 400 °C | % Weight Residue at 600 °C |
|---|---|---|---|---|---|
| 1. | S50P50(3) | 18.6 | 34.1 | 79.5 | 16.1 |
| 2. | S100D15(3) | 23.8 | 43.3 | 77.3 | 23.8 |
| 3. | P100D15(3) | 13.0 | 34.5 | 81.0 | 4.02 |
| 4. | S50P50D15(3) | 19.1 | 37.2 | 74.8 | 20.4 |
| Formulation Codes | Erosion (% ± SD) | ||
|---|---|---|---|
| pH 6.8 | pH 4.5 | pH 1.2 | |
| S100(3) | 91.7 ± 0.017 a | 80.1 ± 0.003 b | 77.8 ± 0.015 b |
| P100(3) | 0 d | 58.9 ± 0.002 d | 46.0 ± 0.005 e |
| S50P50(3) | 69.4 ± 0.001 c | 78.1 ± 0.024 b | 73.0 ± 0.0037 c |
| S100D15(3) | 89.0 ± 0.001 a | 82.6 ± 0.001 b | 84.7 ± 0.00 b |
| P100D15(3) | 71.57 ± 0.08 c | 72.6 ± 0.001 c | 59.6 ± 0.014 d |
| S50P50D15(3) | 81.4 ± 0.024 b | 76.2 ± 0.003 c | 72.8 ± 0.026 c |
Publisher’s Note: MDPI stays neutral with regard to jurisdictional claims in published maps and institutional affiliations. |
© 2022 by the authors. Licensee MDPI, Basel, Switzerland. This article is an open access article distributed under the terms and conditions of the Creative Commons Attribution (CC BY) license (https://creativecommons.org/licenses/by/4.0/).
Share and Cite
Bibi, S.; Mir, S.; Rehman, W.; Menaa, F.; Gul, A.; Alaryani, F.S.S.; Alqahtani, A.M.; Haq, S.; Abdellatif, M.H. Synthesis and In Vitro/Ex Vivo Characterizations of Ceftriaxone-Loaded Sodium Alginate/poly(vinyl alcohol) Clay Reinforced Nanocomposites: Possible Applications in Wound Healing. Materials 2022, 15, 3885. https://doi.org/10.3390/ma15113885
Bibi S, Mir S, Rehman W, Menaa F, Gul A, Alaryani FSS, Alqahtani AM, Haq S, Abdellatif MH. Synthesis and In Vitro/Ex Vivo Characterizations of Ceftriaxone-Loaded Sodium Alginate/poly(vinyl alcohol) Clay Reinforced Nanocomposites: Possible Applications in Wound Healing. Materials. 2022; 15(11):3885. https://doi.org/10.3390/ma15113885
Chicago/Turabian StyleBibi, Shabana, Sadullah Mir, Wajid Rehman, Farid Menaa, Alia Gul, Fatima Saad Salem Alaryani, Ali M. Alqahtani, Sirajul Haq, and Magda H. Abdellatif. 2022. "Synthesis and In Vitro/Ex Vivo Characterizations of Ceftriaxone-Loaded Sodium Alginate/poly(vinyl alcohol) Clay Reinforced Nanocomposites: Possible Applications in Wound Healing" Materials 15, no. 11: 3885. https://doi.org/10.3390/ma15113885
APA StyleBibi, S., Mir, S., Rehman, W., Menaa, F., Gul, A., Alaryani, F. S. S., Alqahtani, A. M., Haq, S., & Abdellatif, M. H. (2022). Synthesis and In Vitro/Ex Vivo Characterizations of Ceftriaxone-Loaded Sodium Alginate/poly(vinyl alcohol) Clay Reinforced Nanocomposites: Possible Applications in Wound Healing. Materials, 15(11), 3885. https://doi.org/10.3390/ma15113885