
The Investigation on Mechanical Performances of High-Strength Steel Reinforced Concrete Composite Short Columns under Axial Load

Abstract
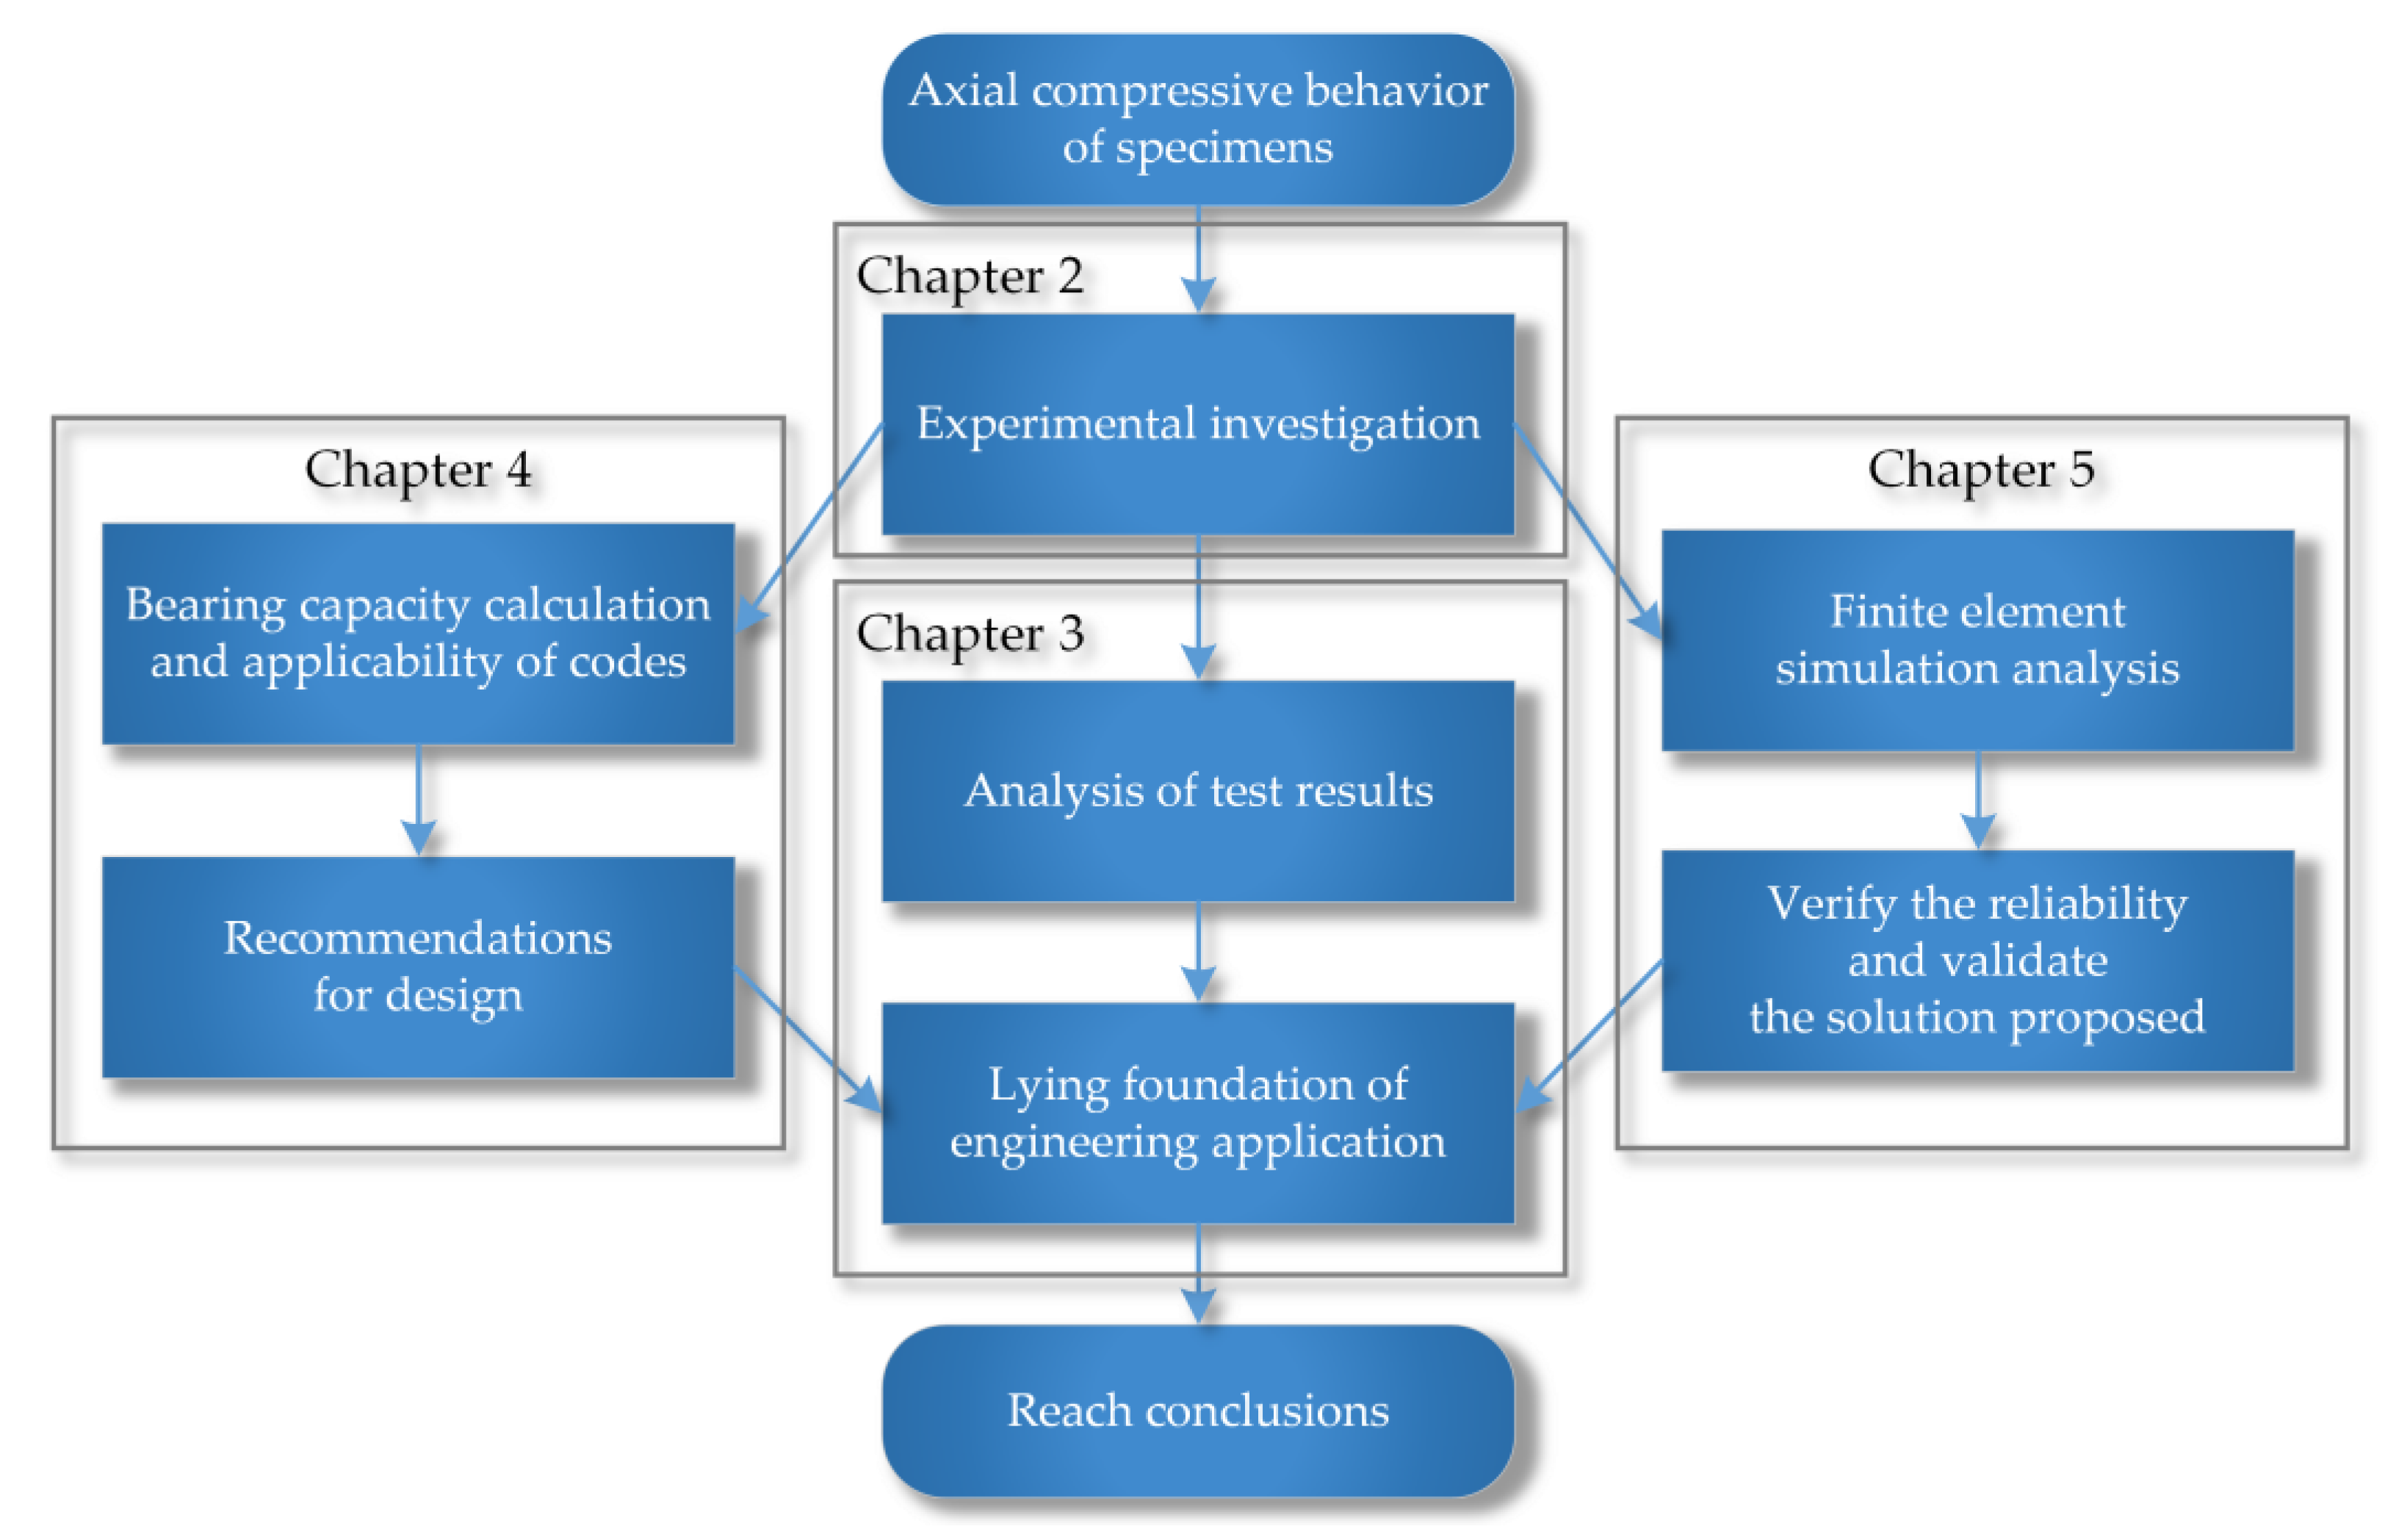
:1. Introduction
2. Experimental Investigation
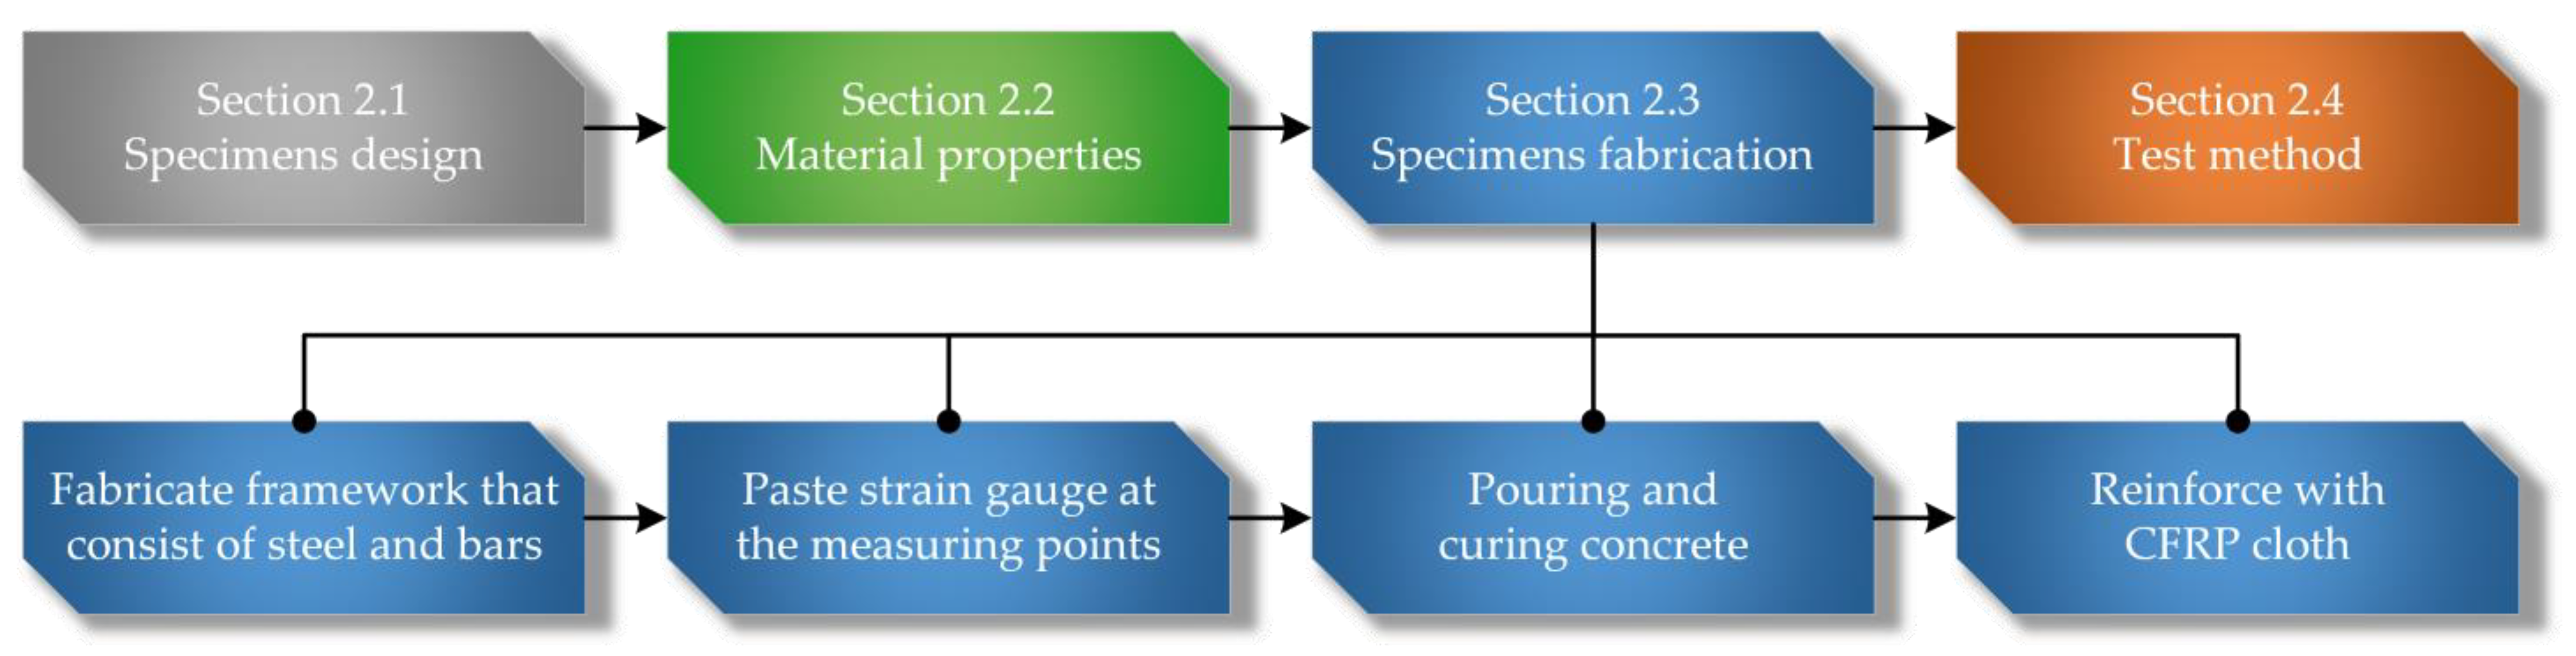
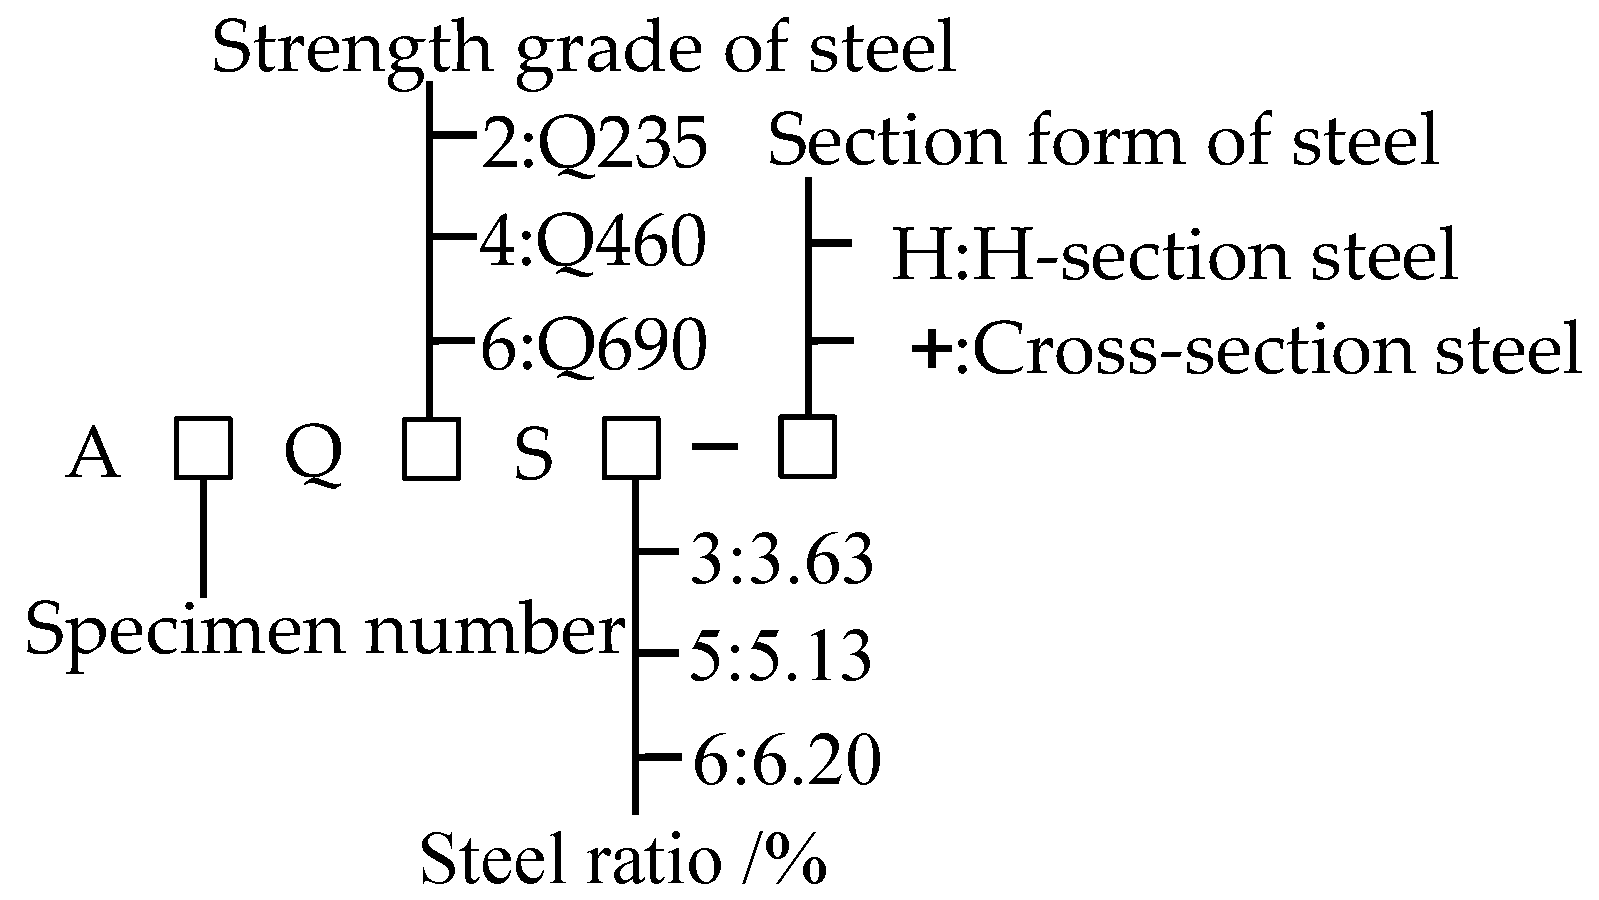
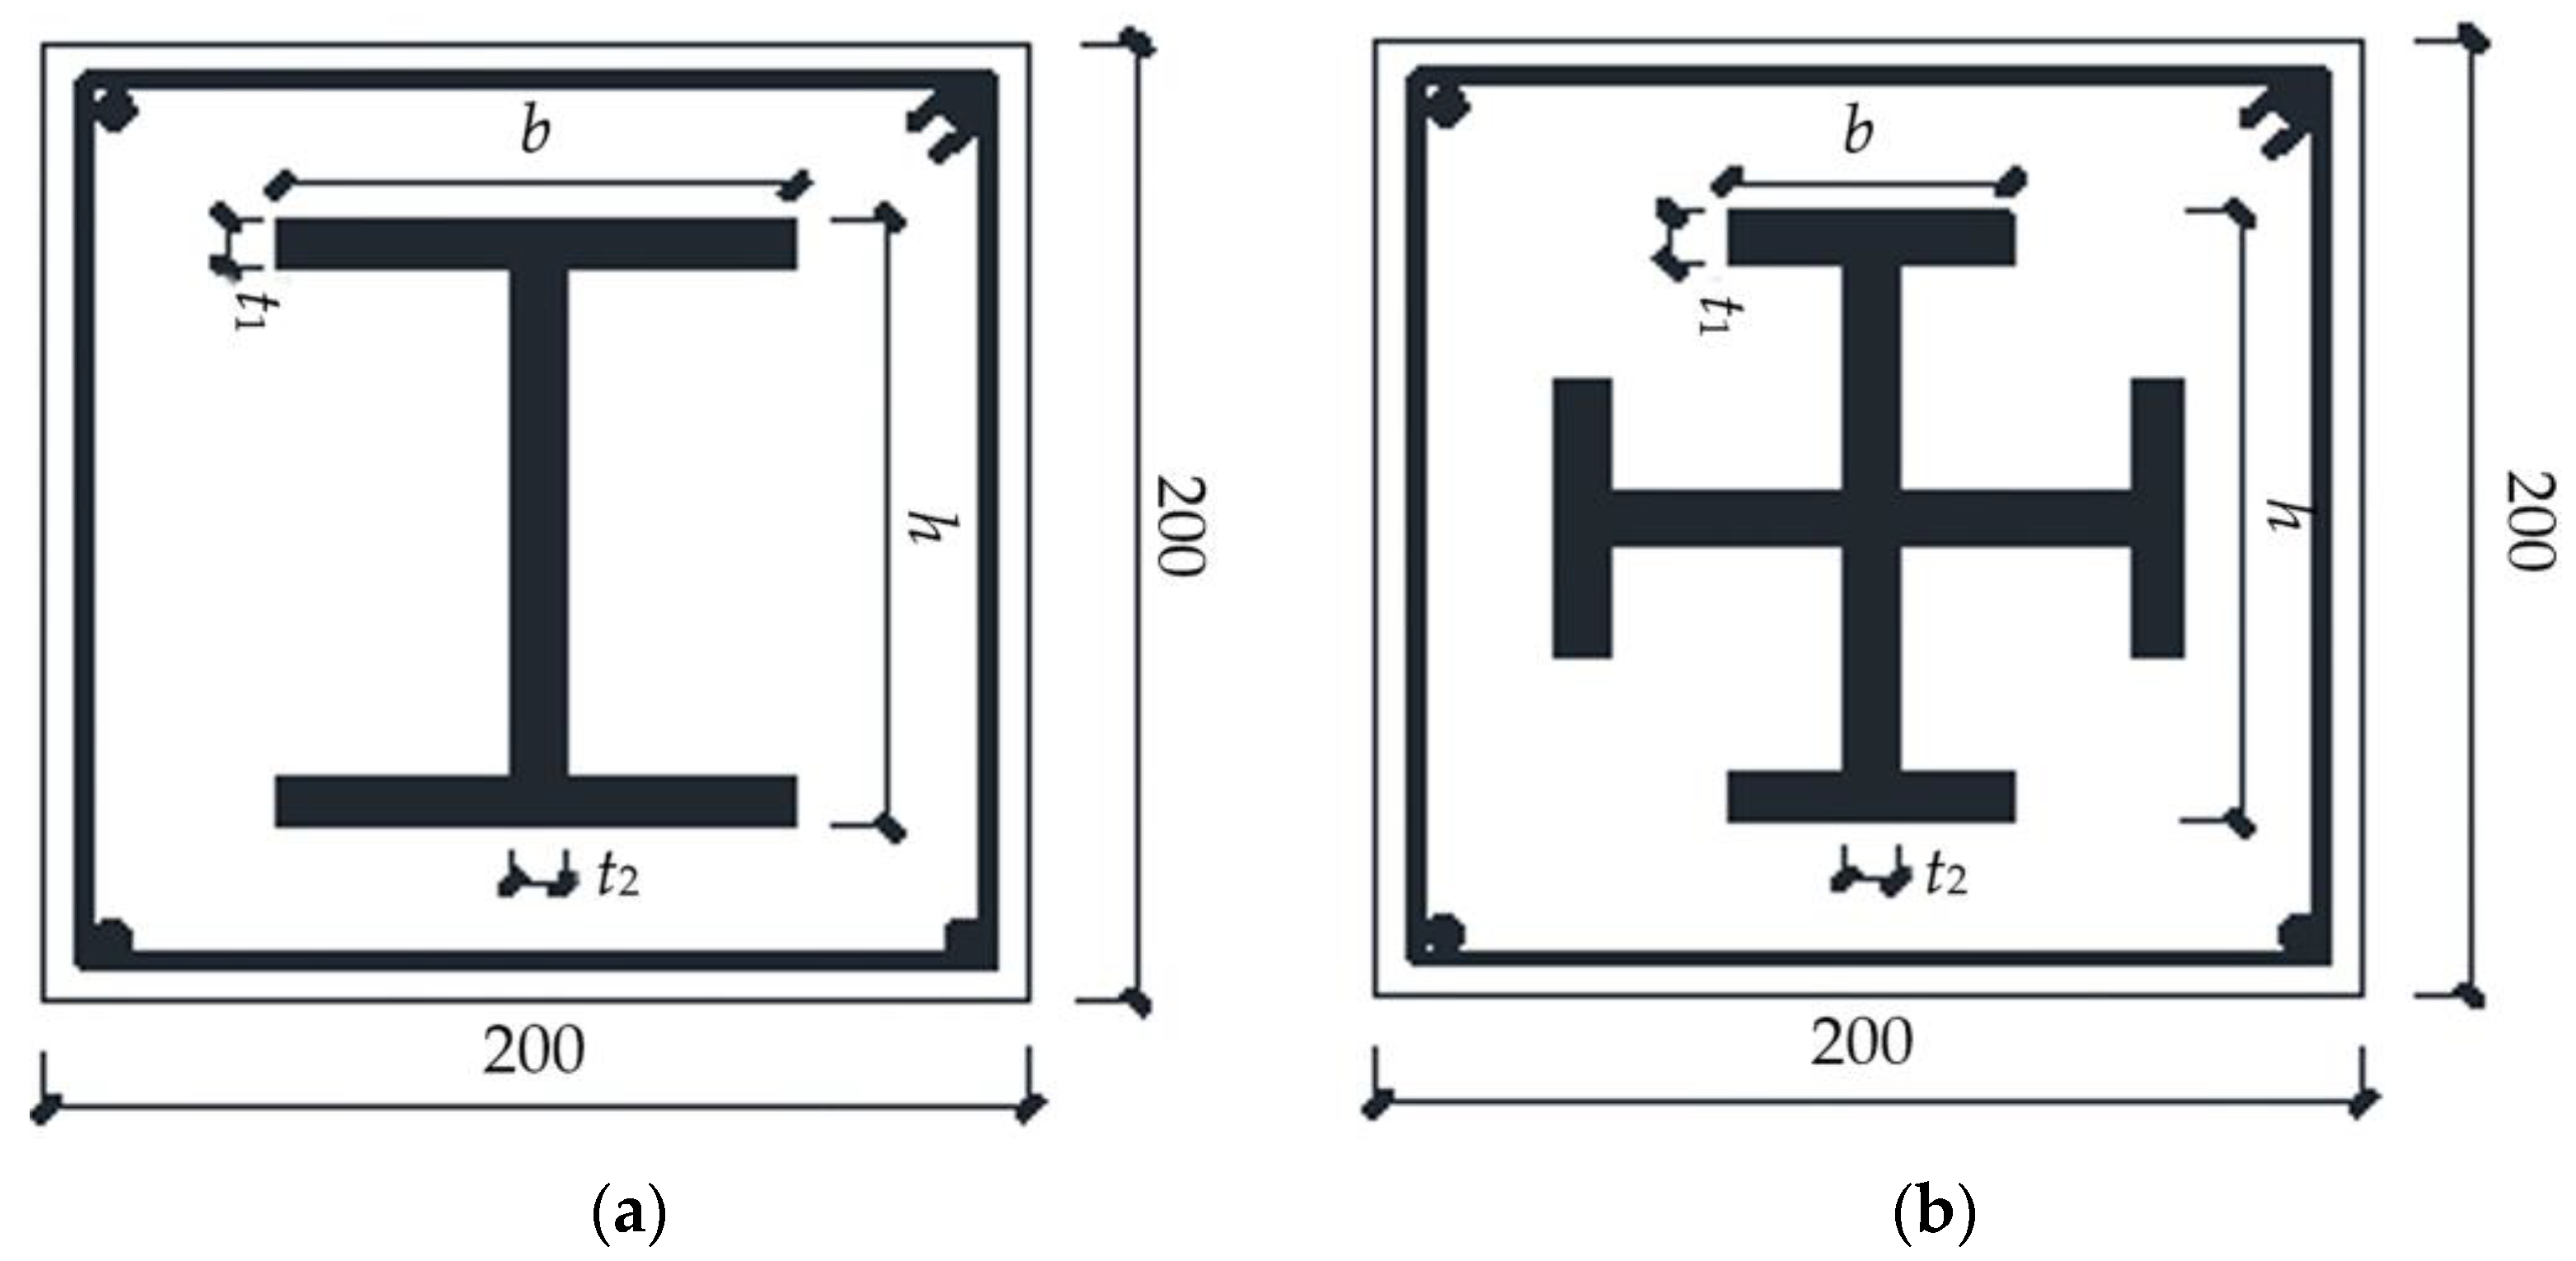
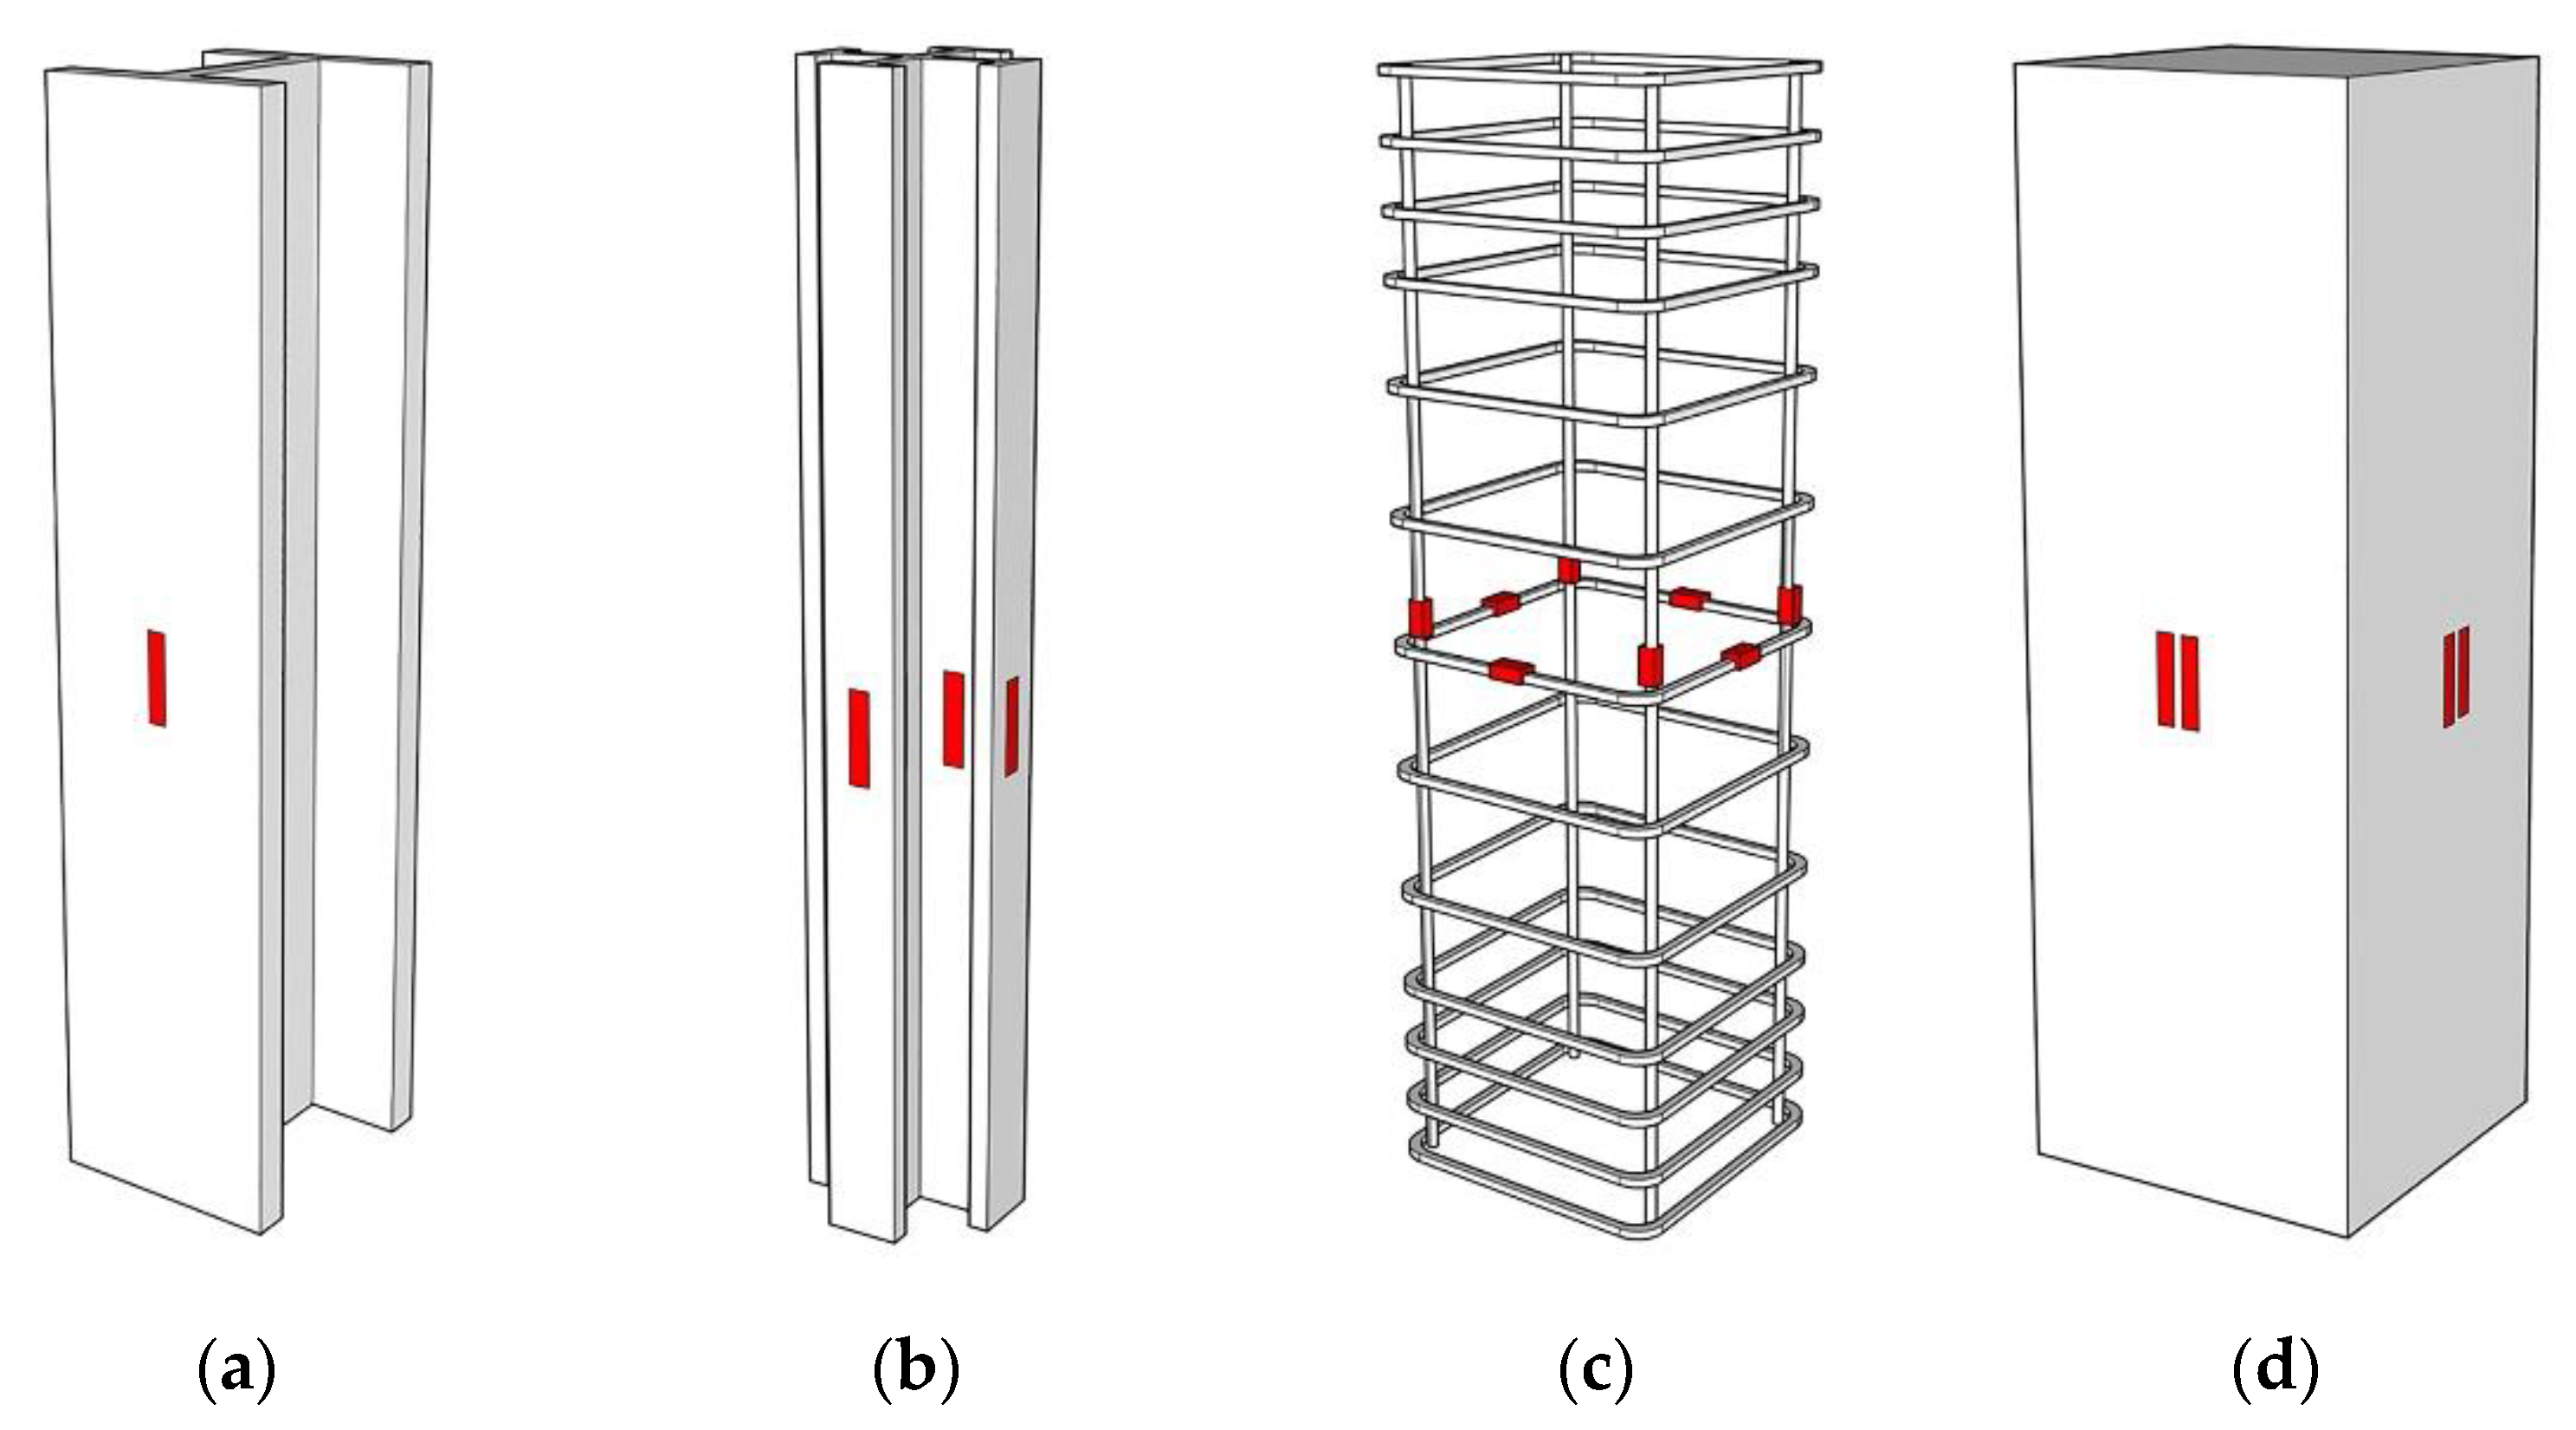
2.1. Test Specimens
2.2. Material Properties
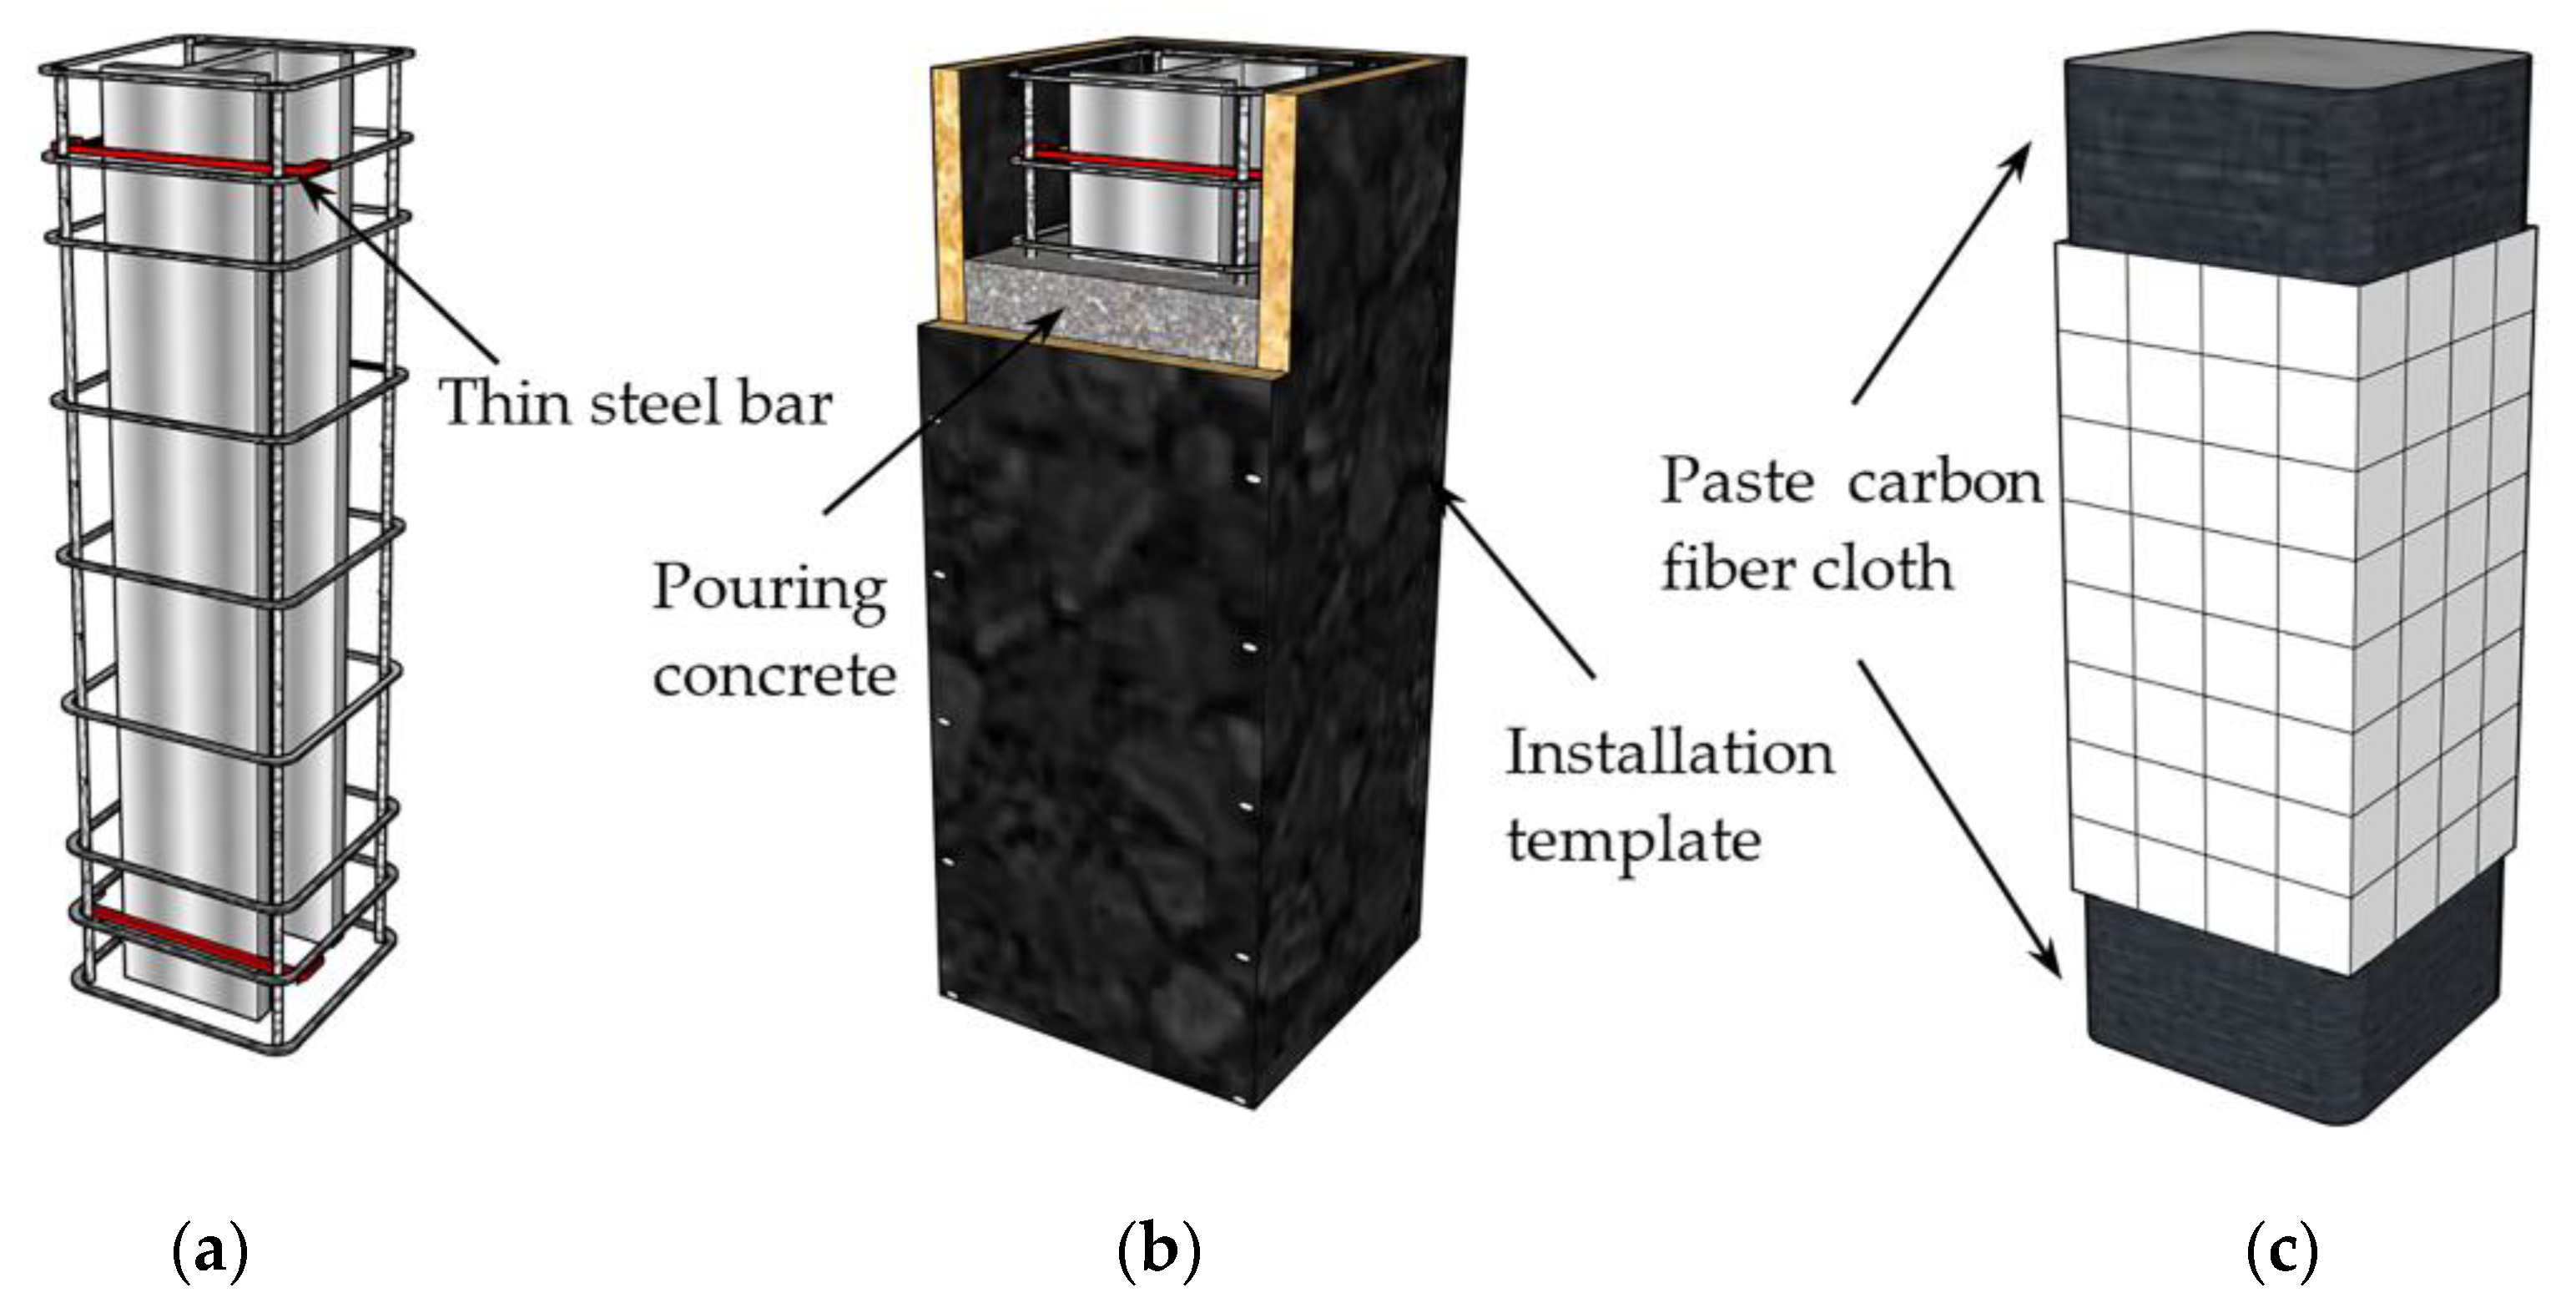
2.3. Process of Specimen Manufacture
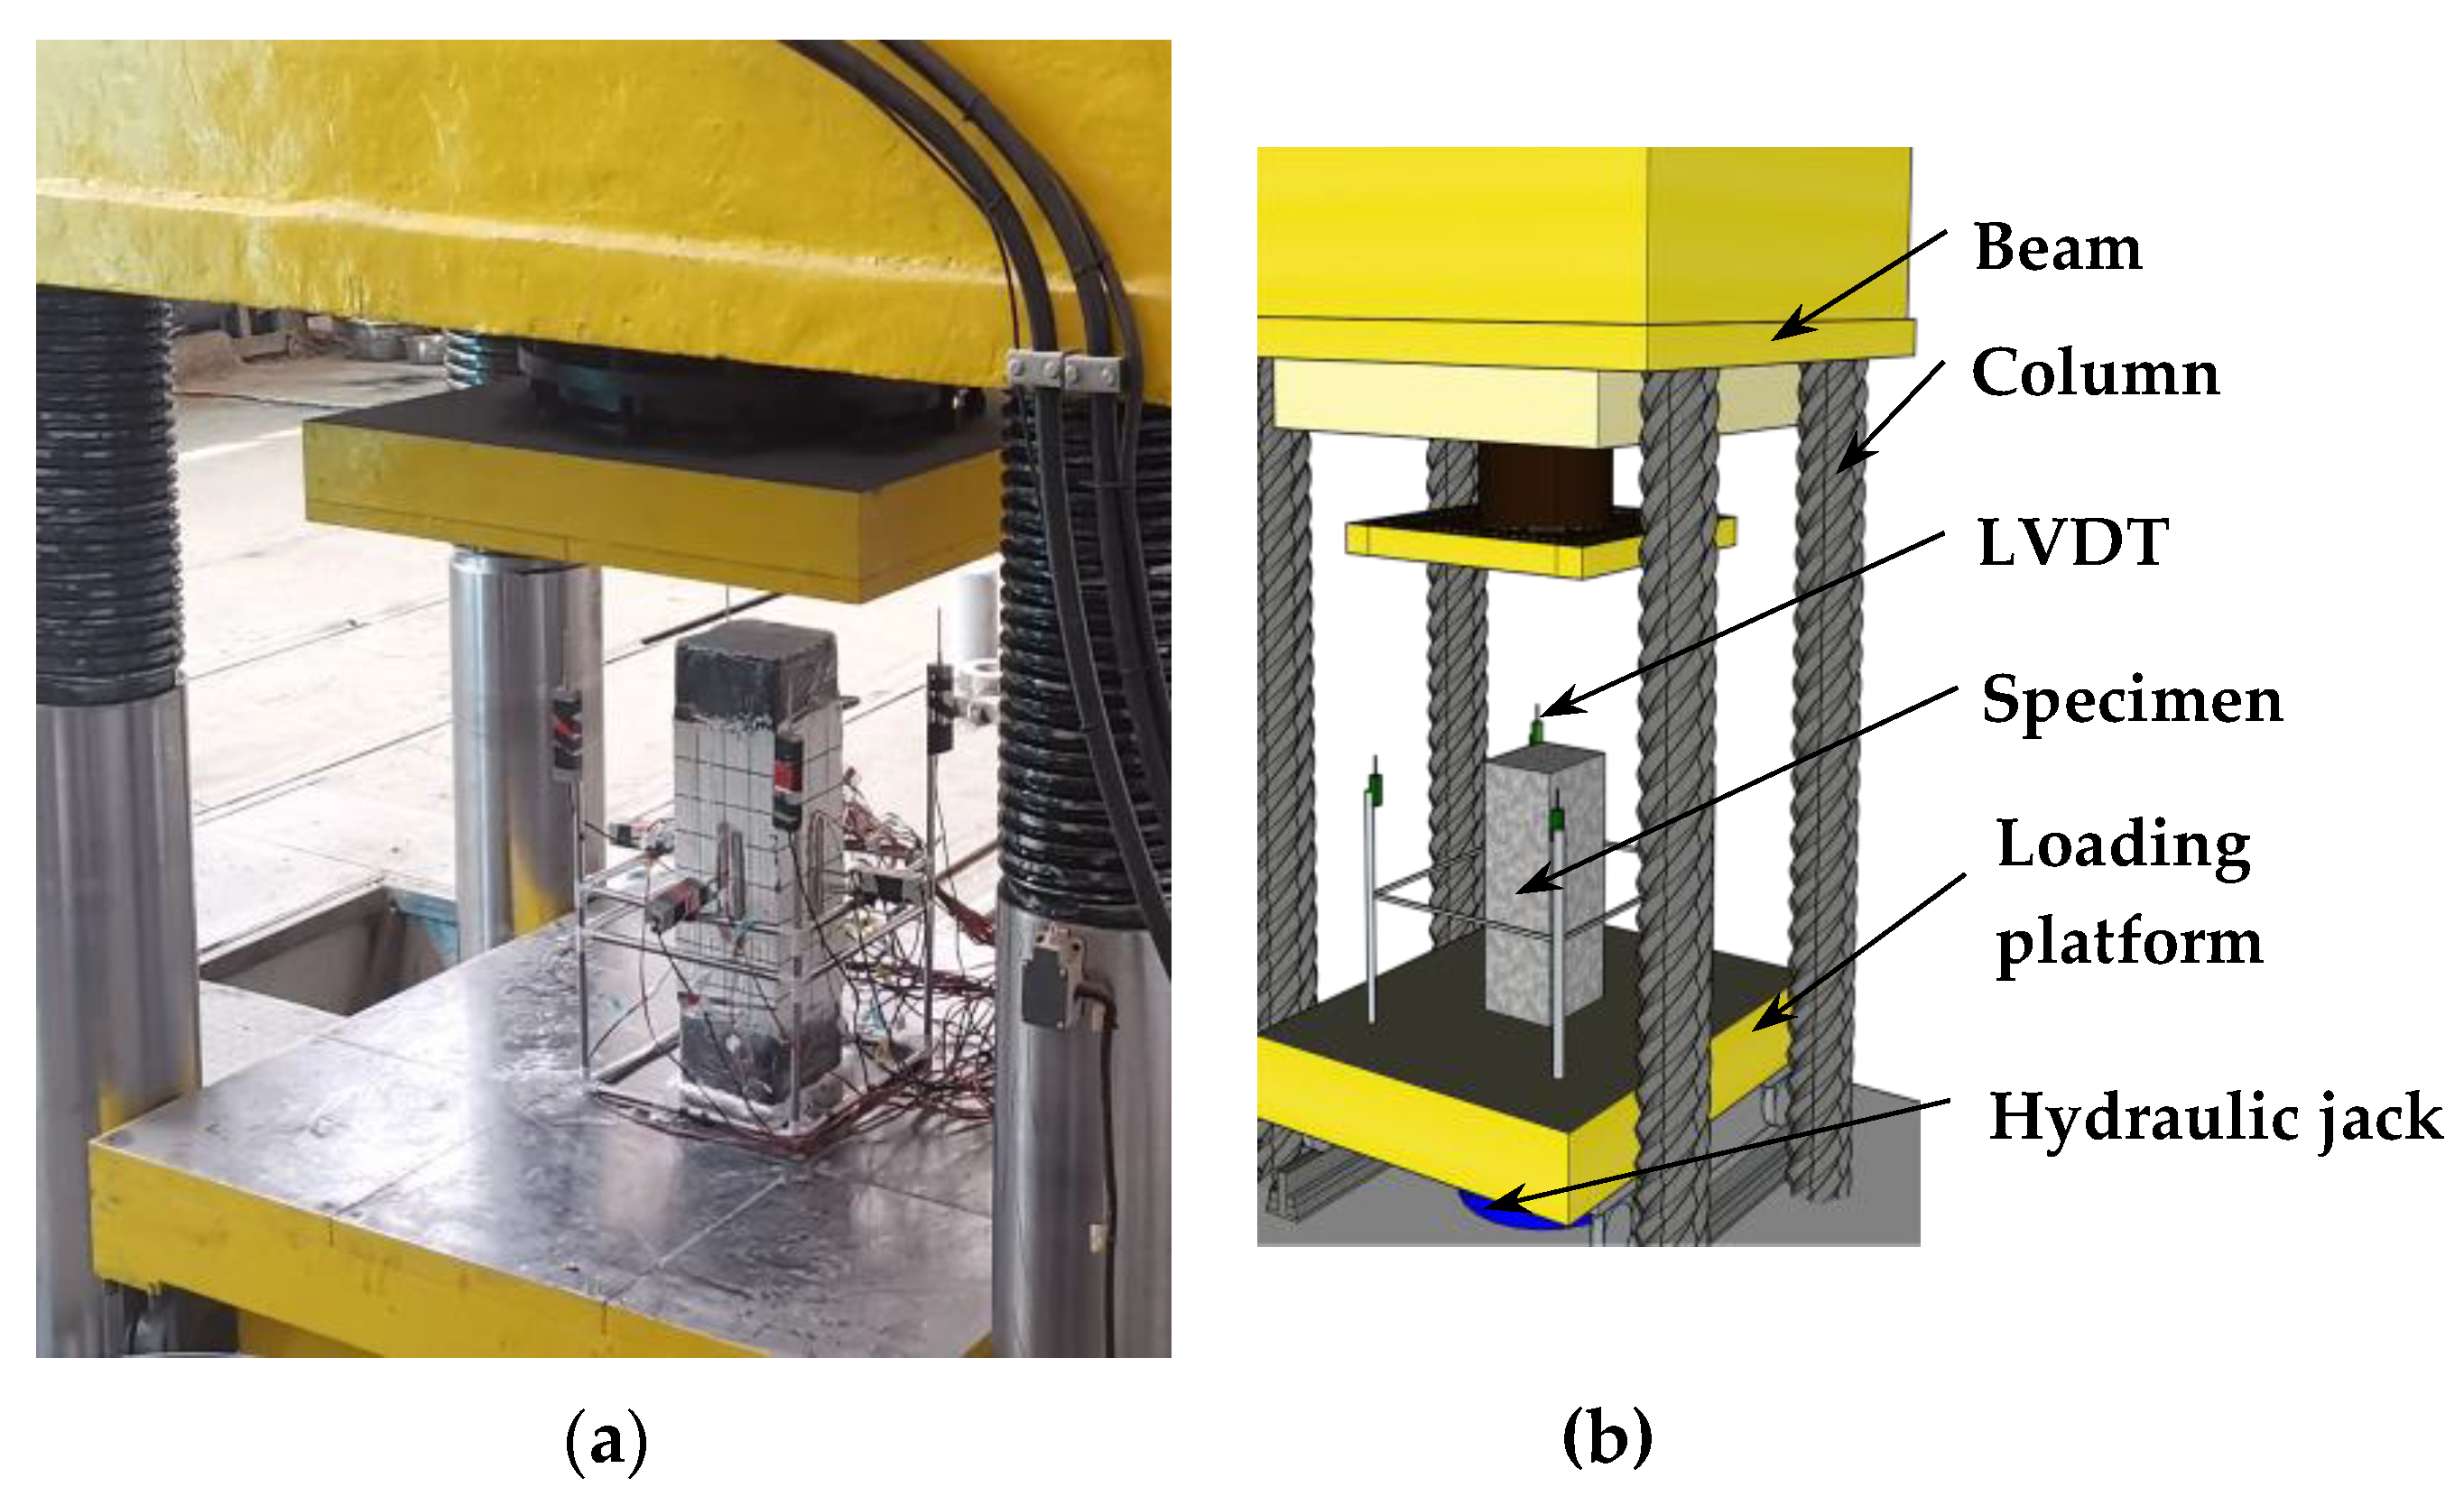
2.4. Test Setup and Procedure
3. Test Results and Analysis
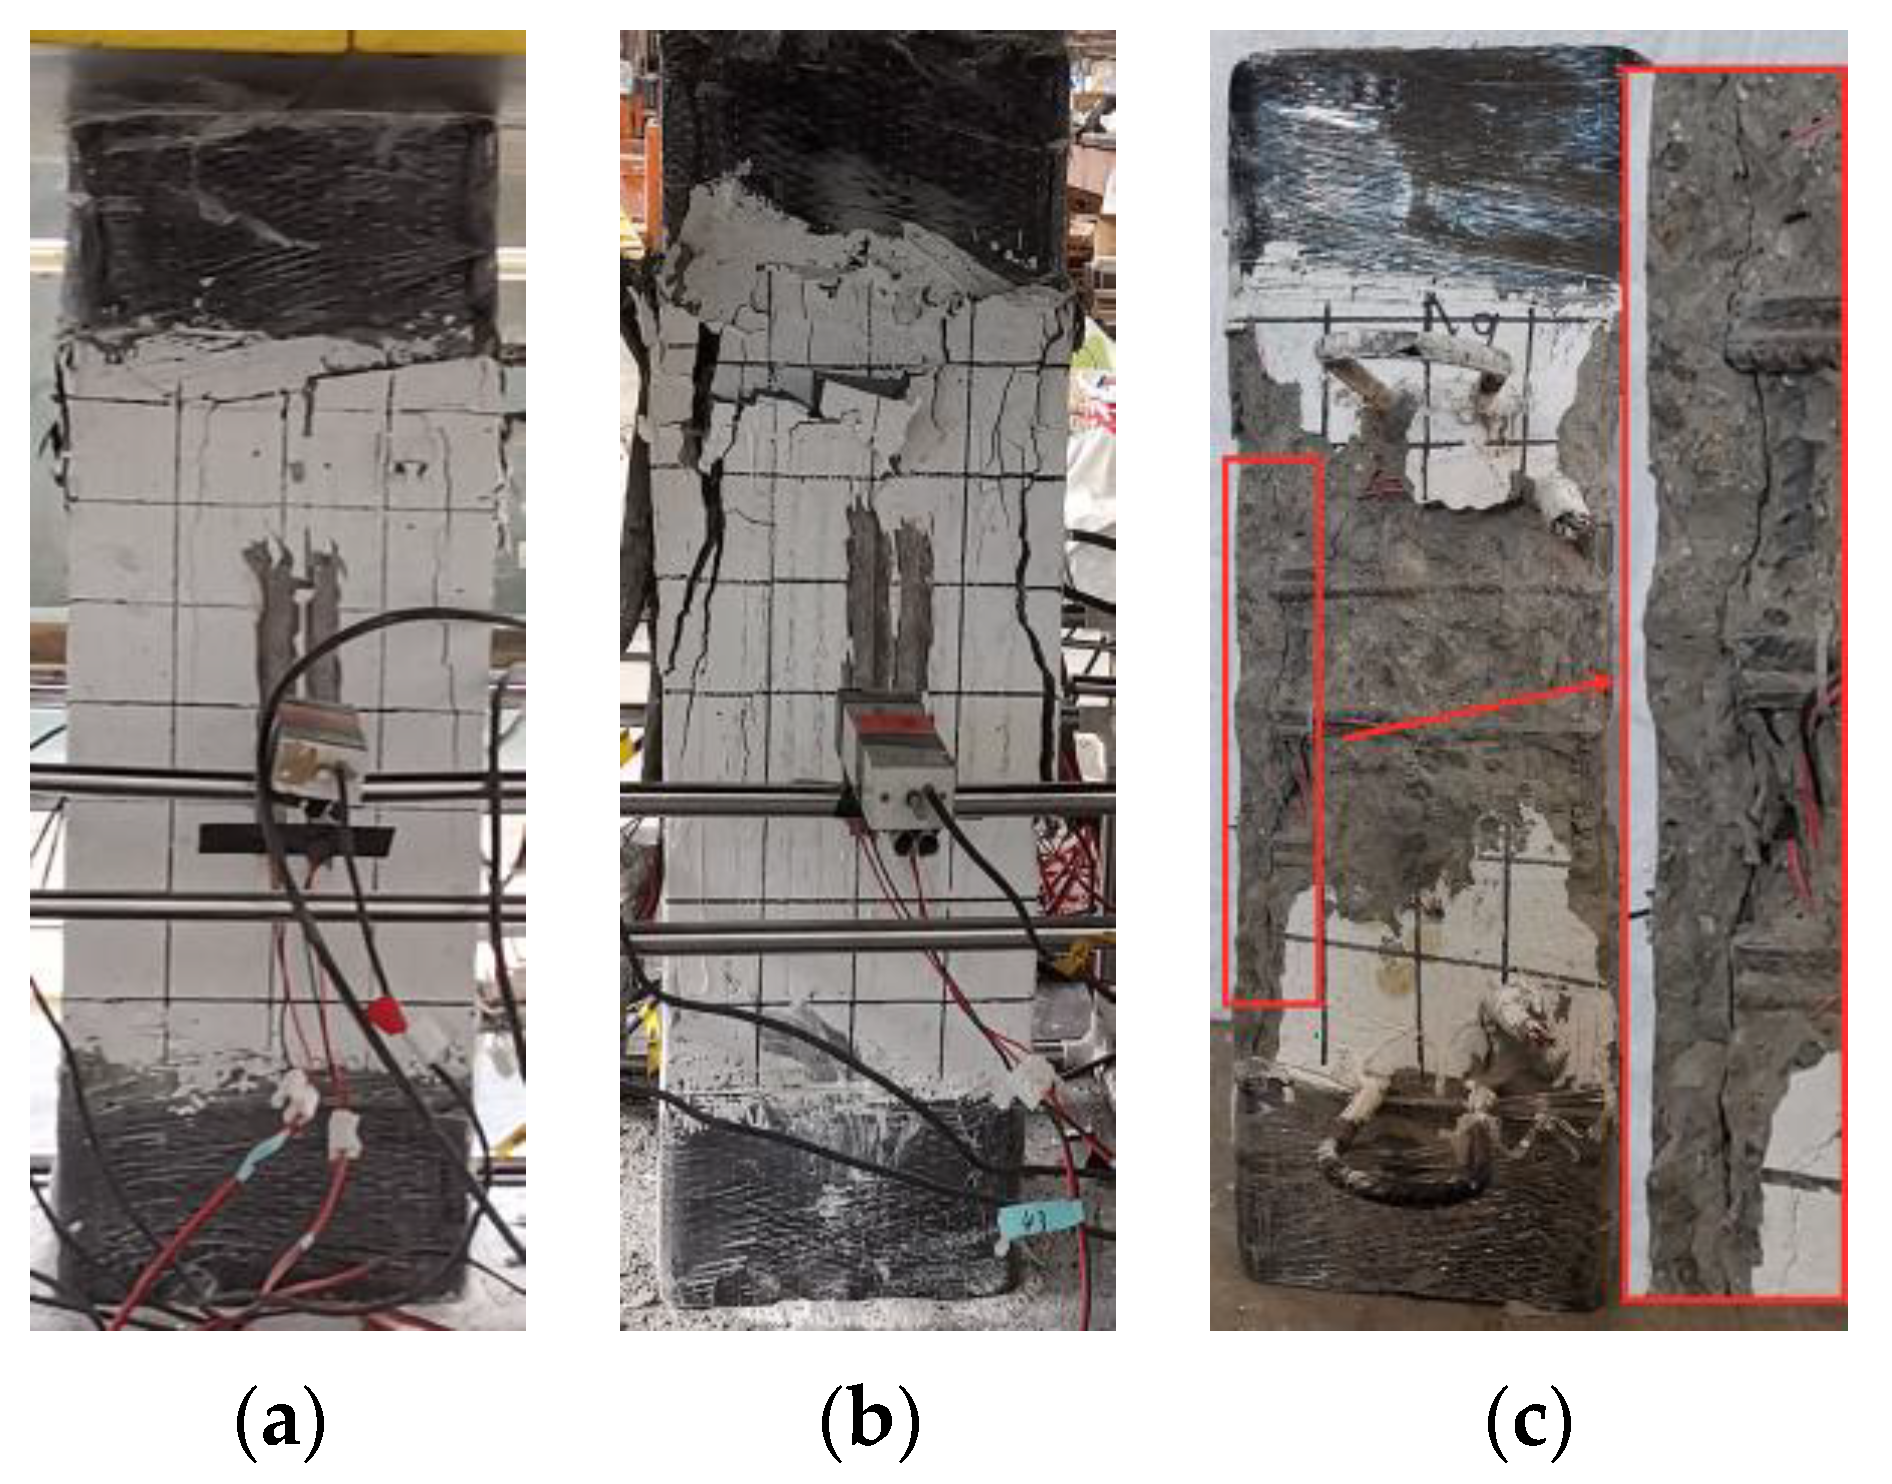
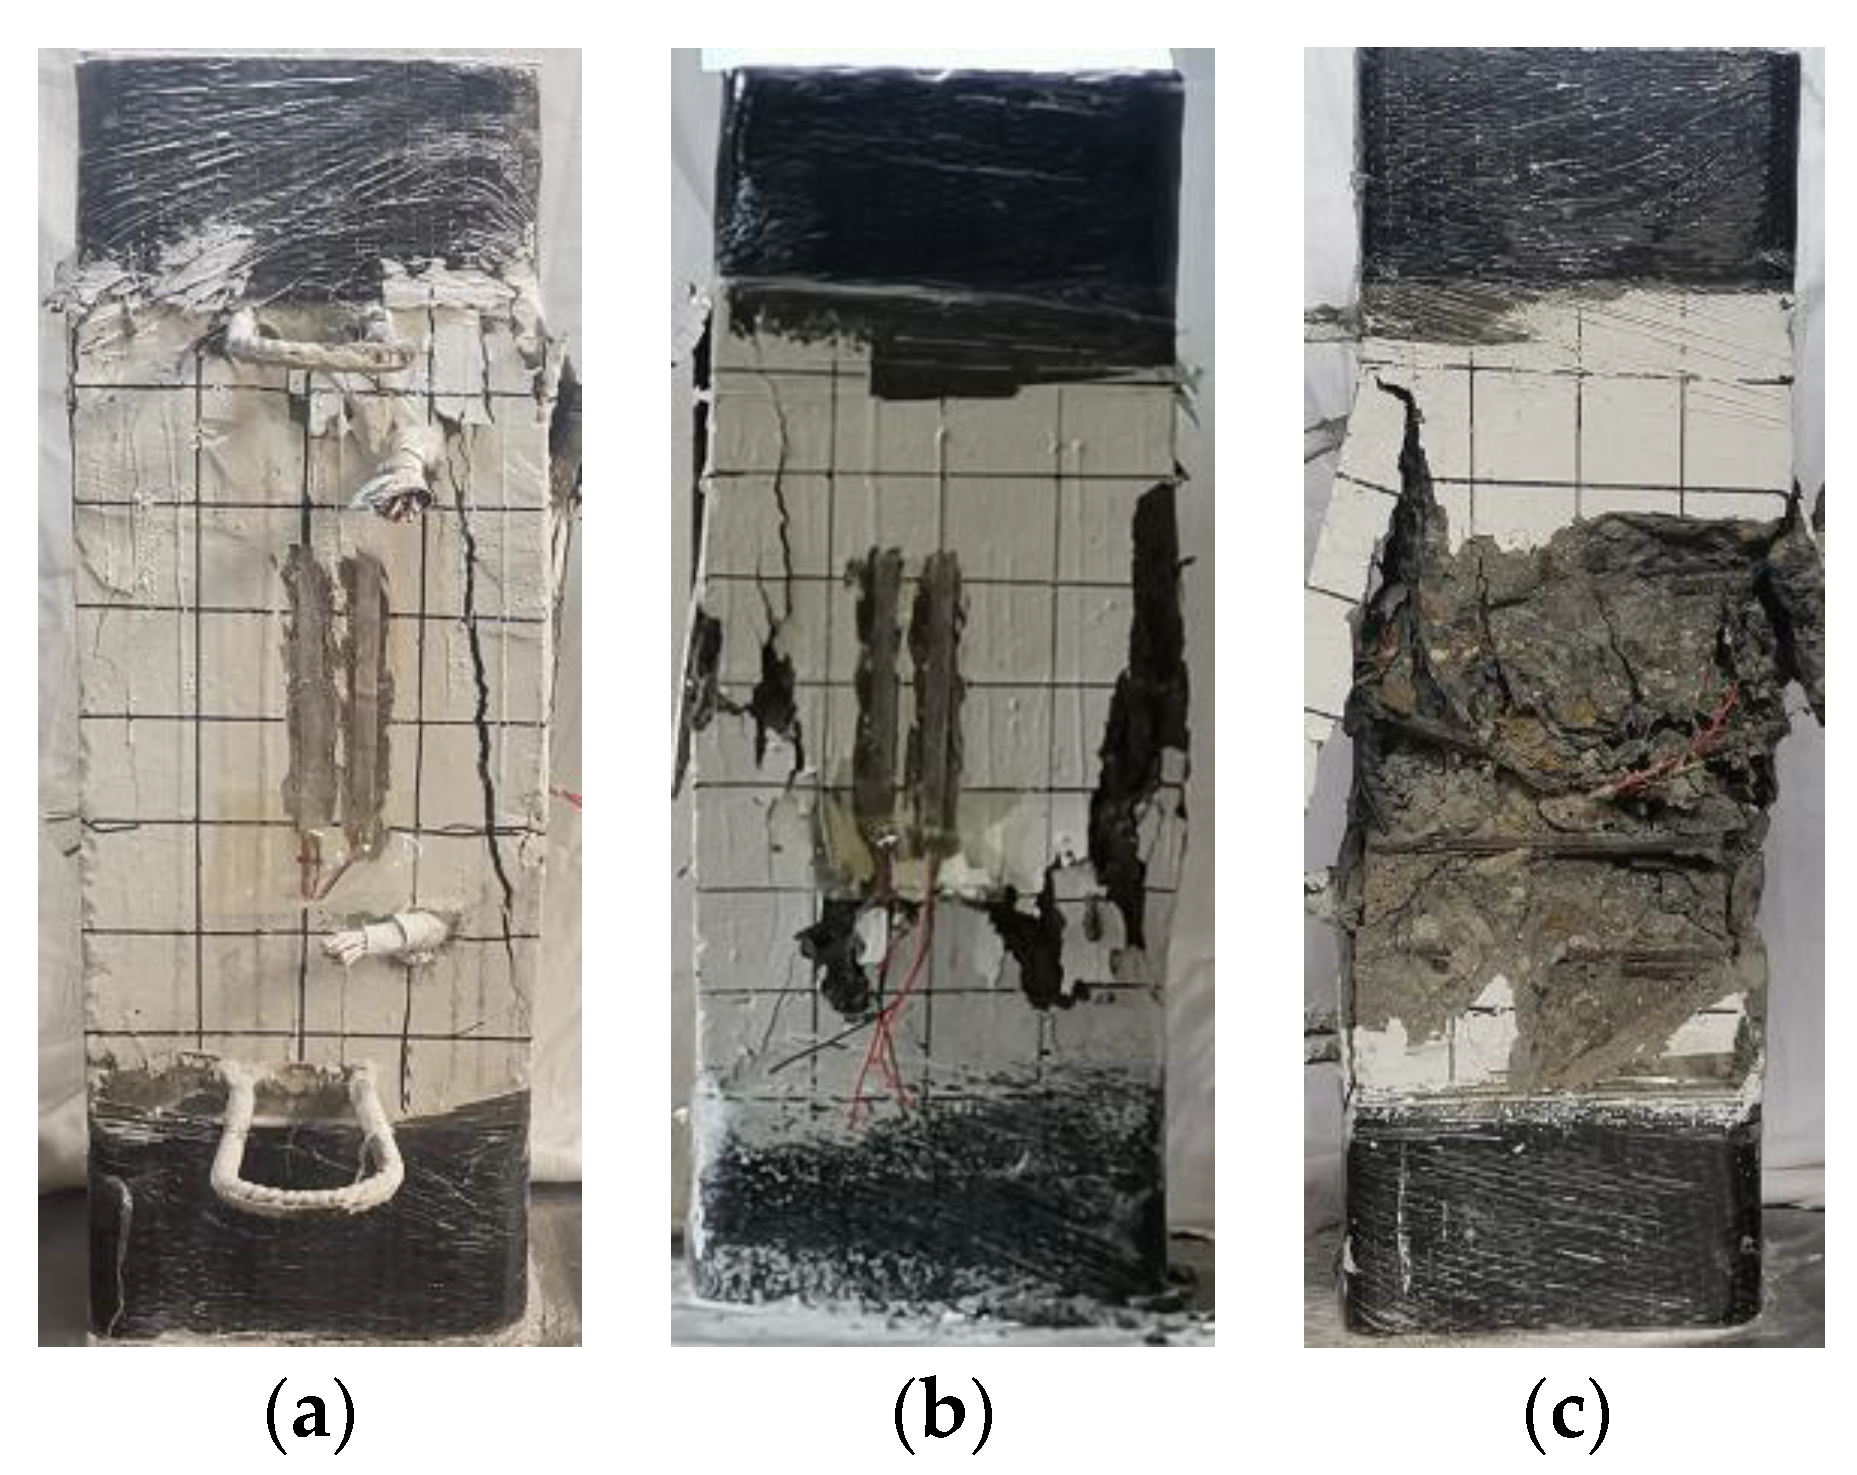
3.1. Failure Phenomenon
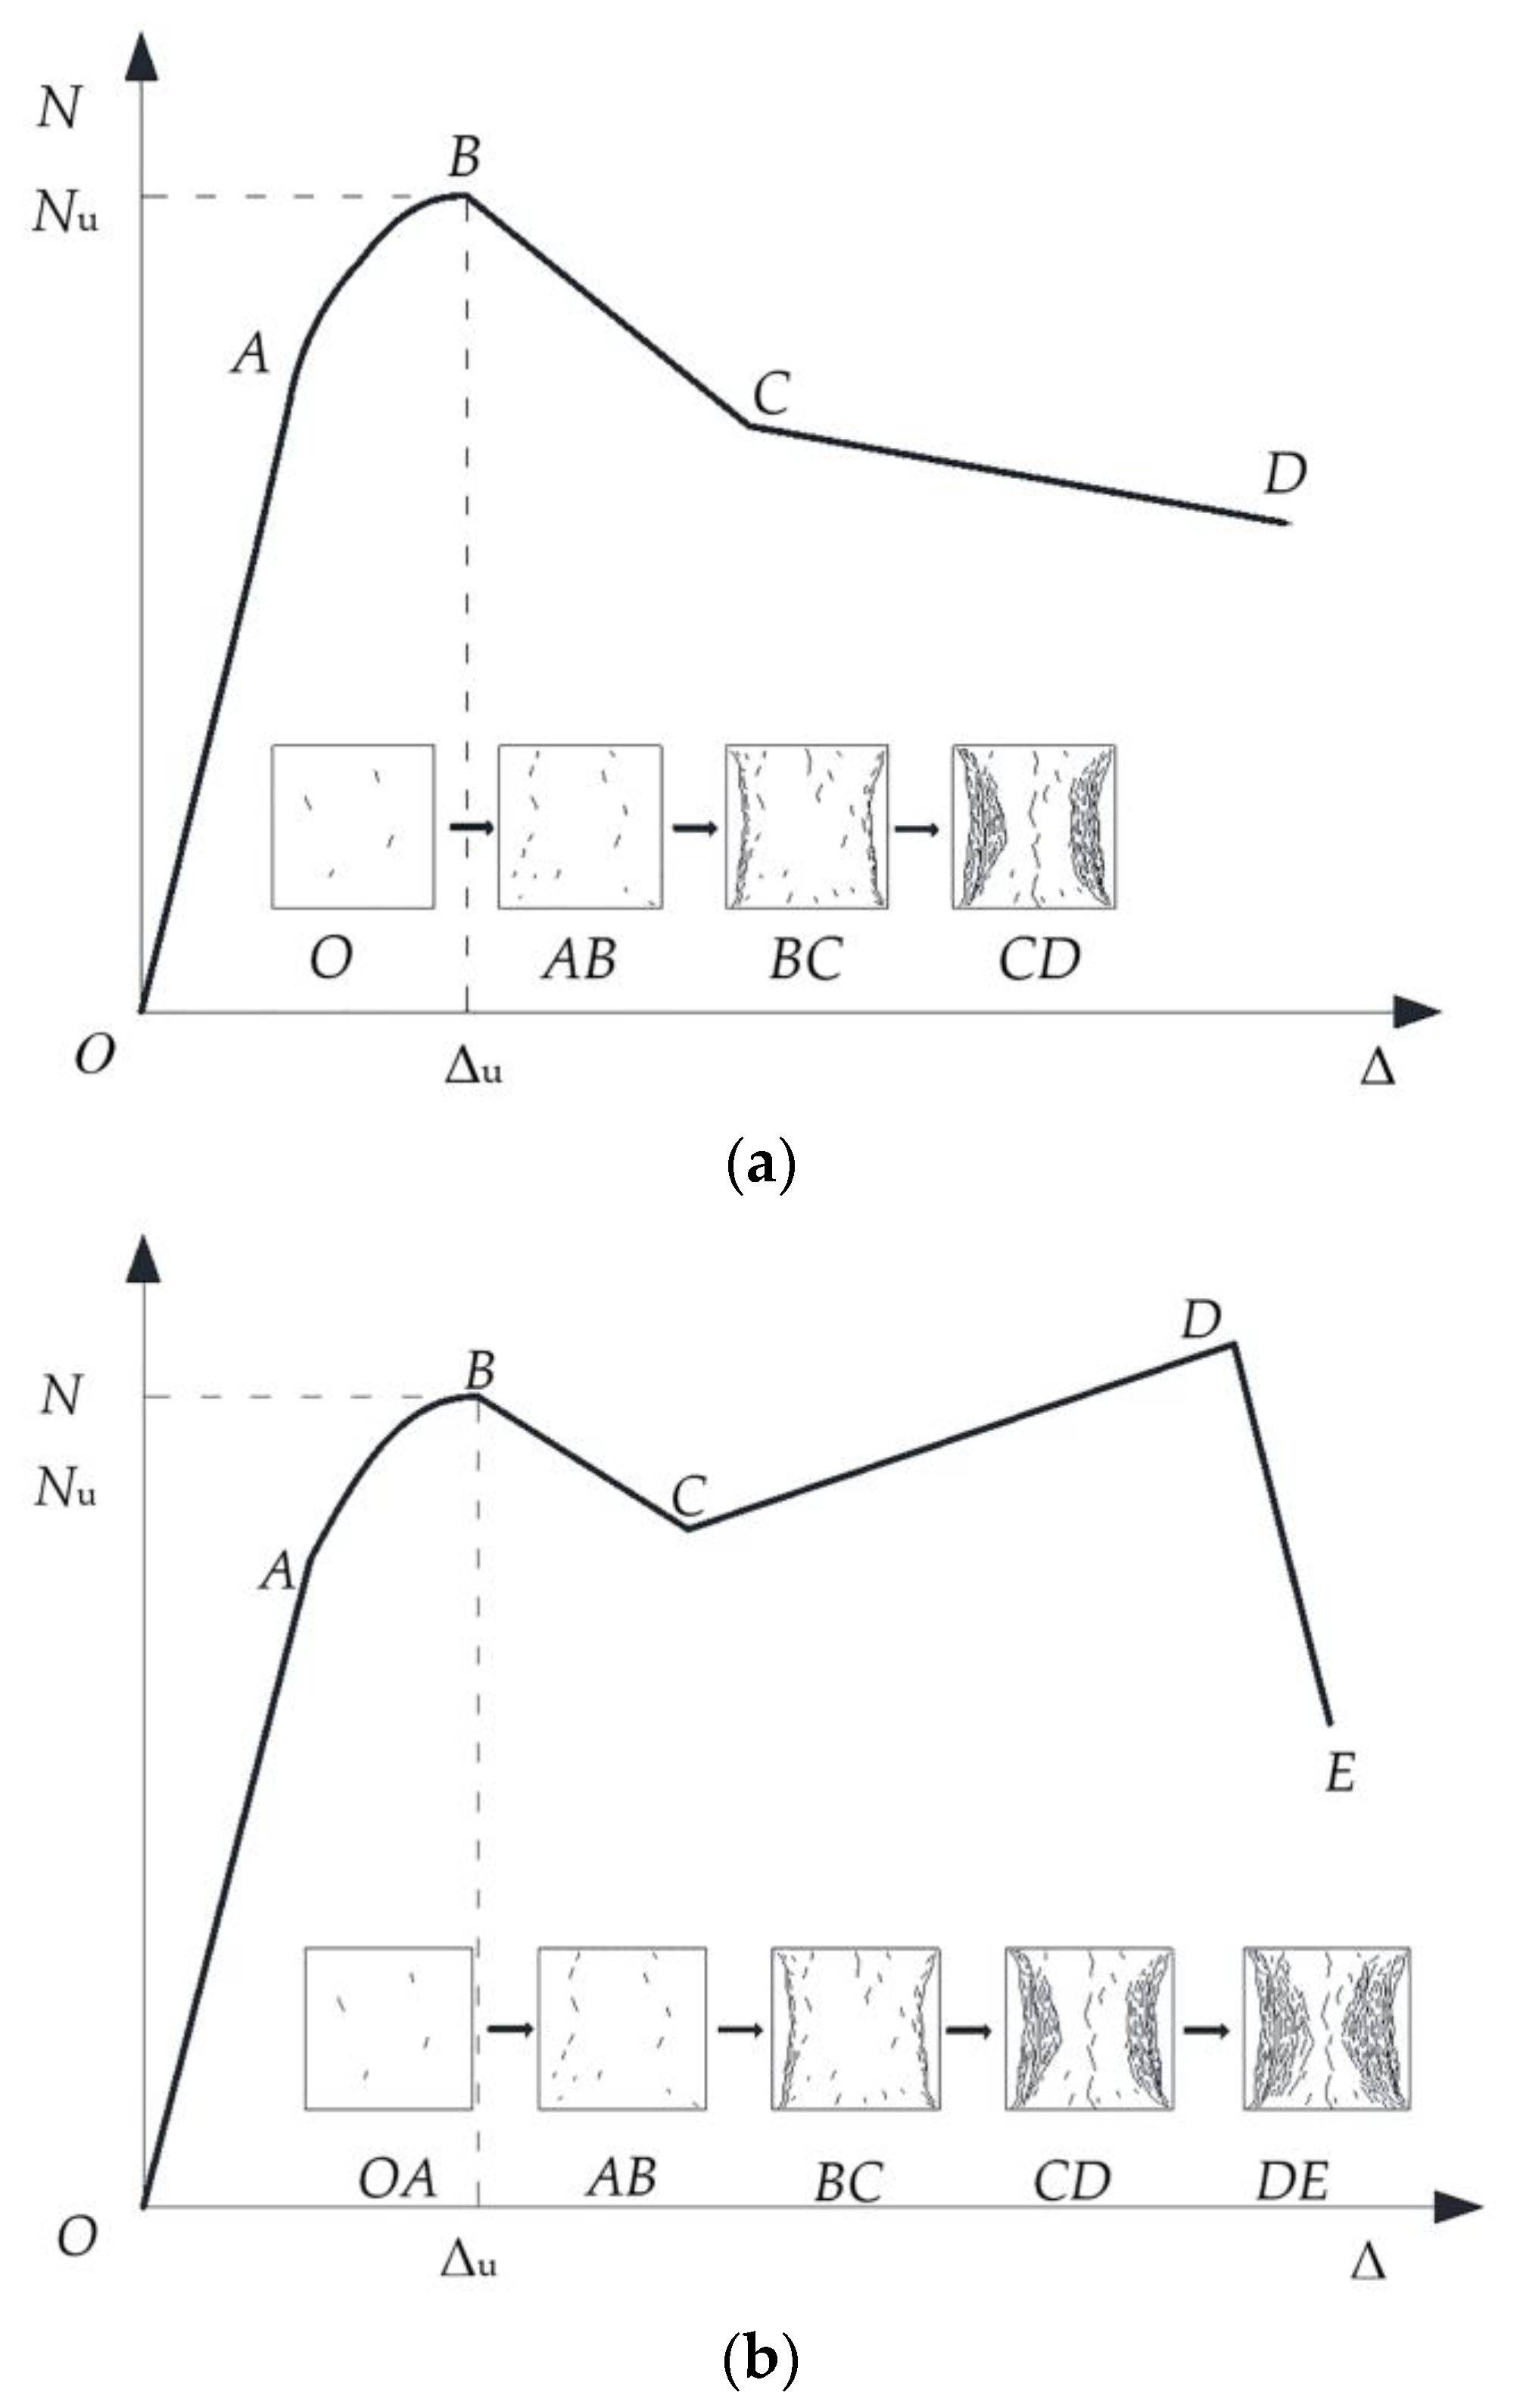
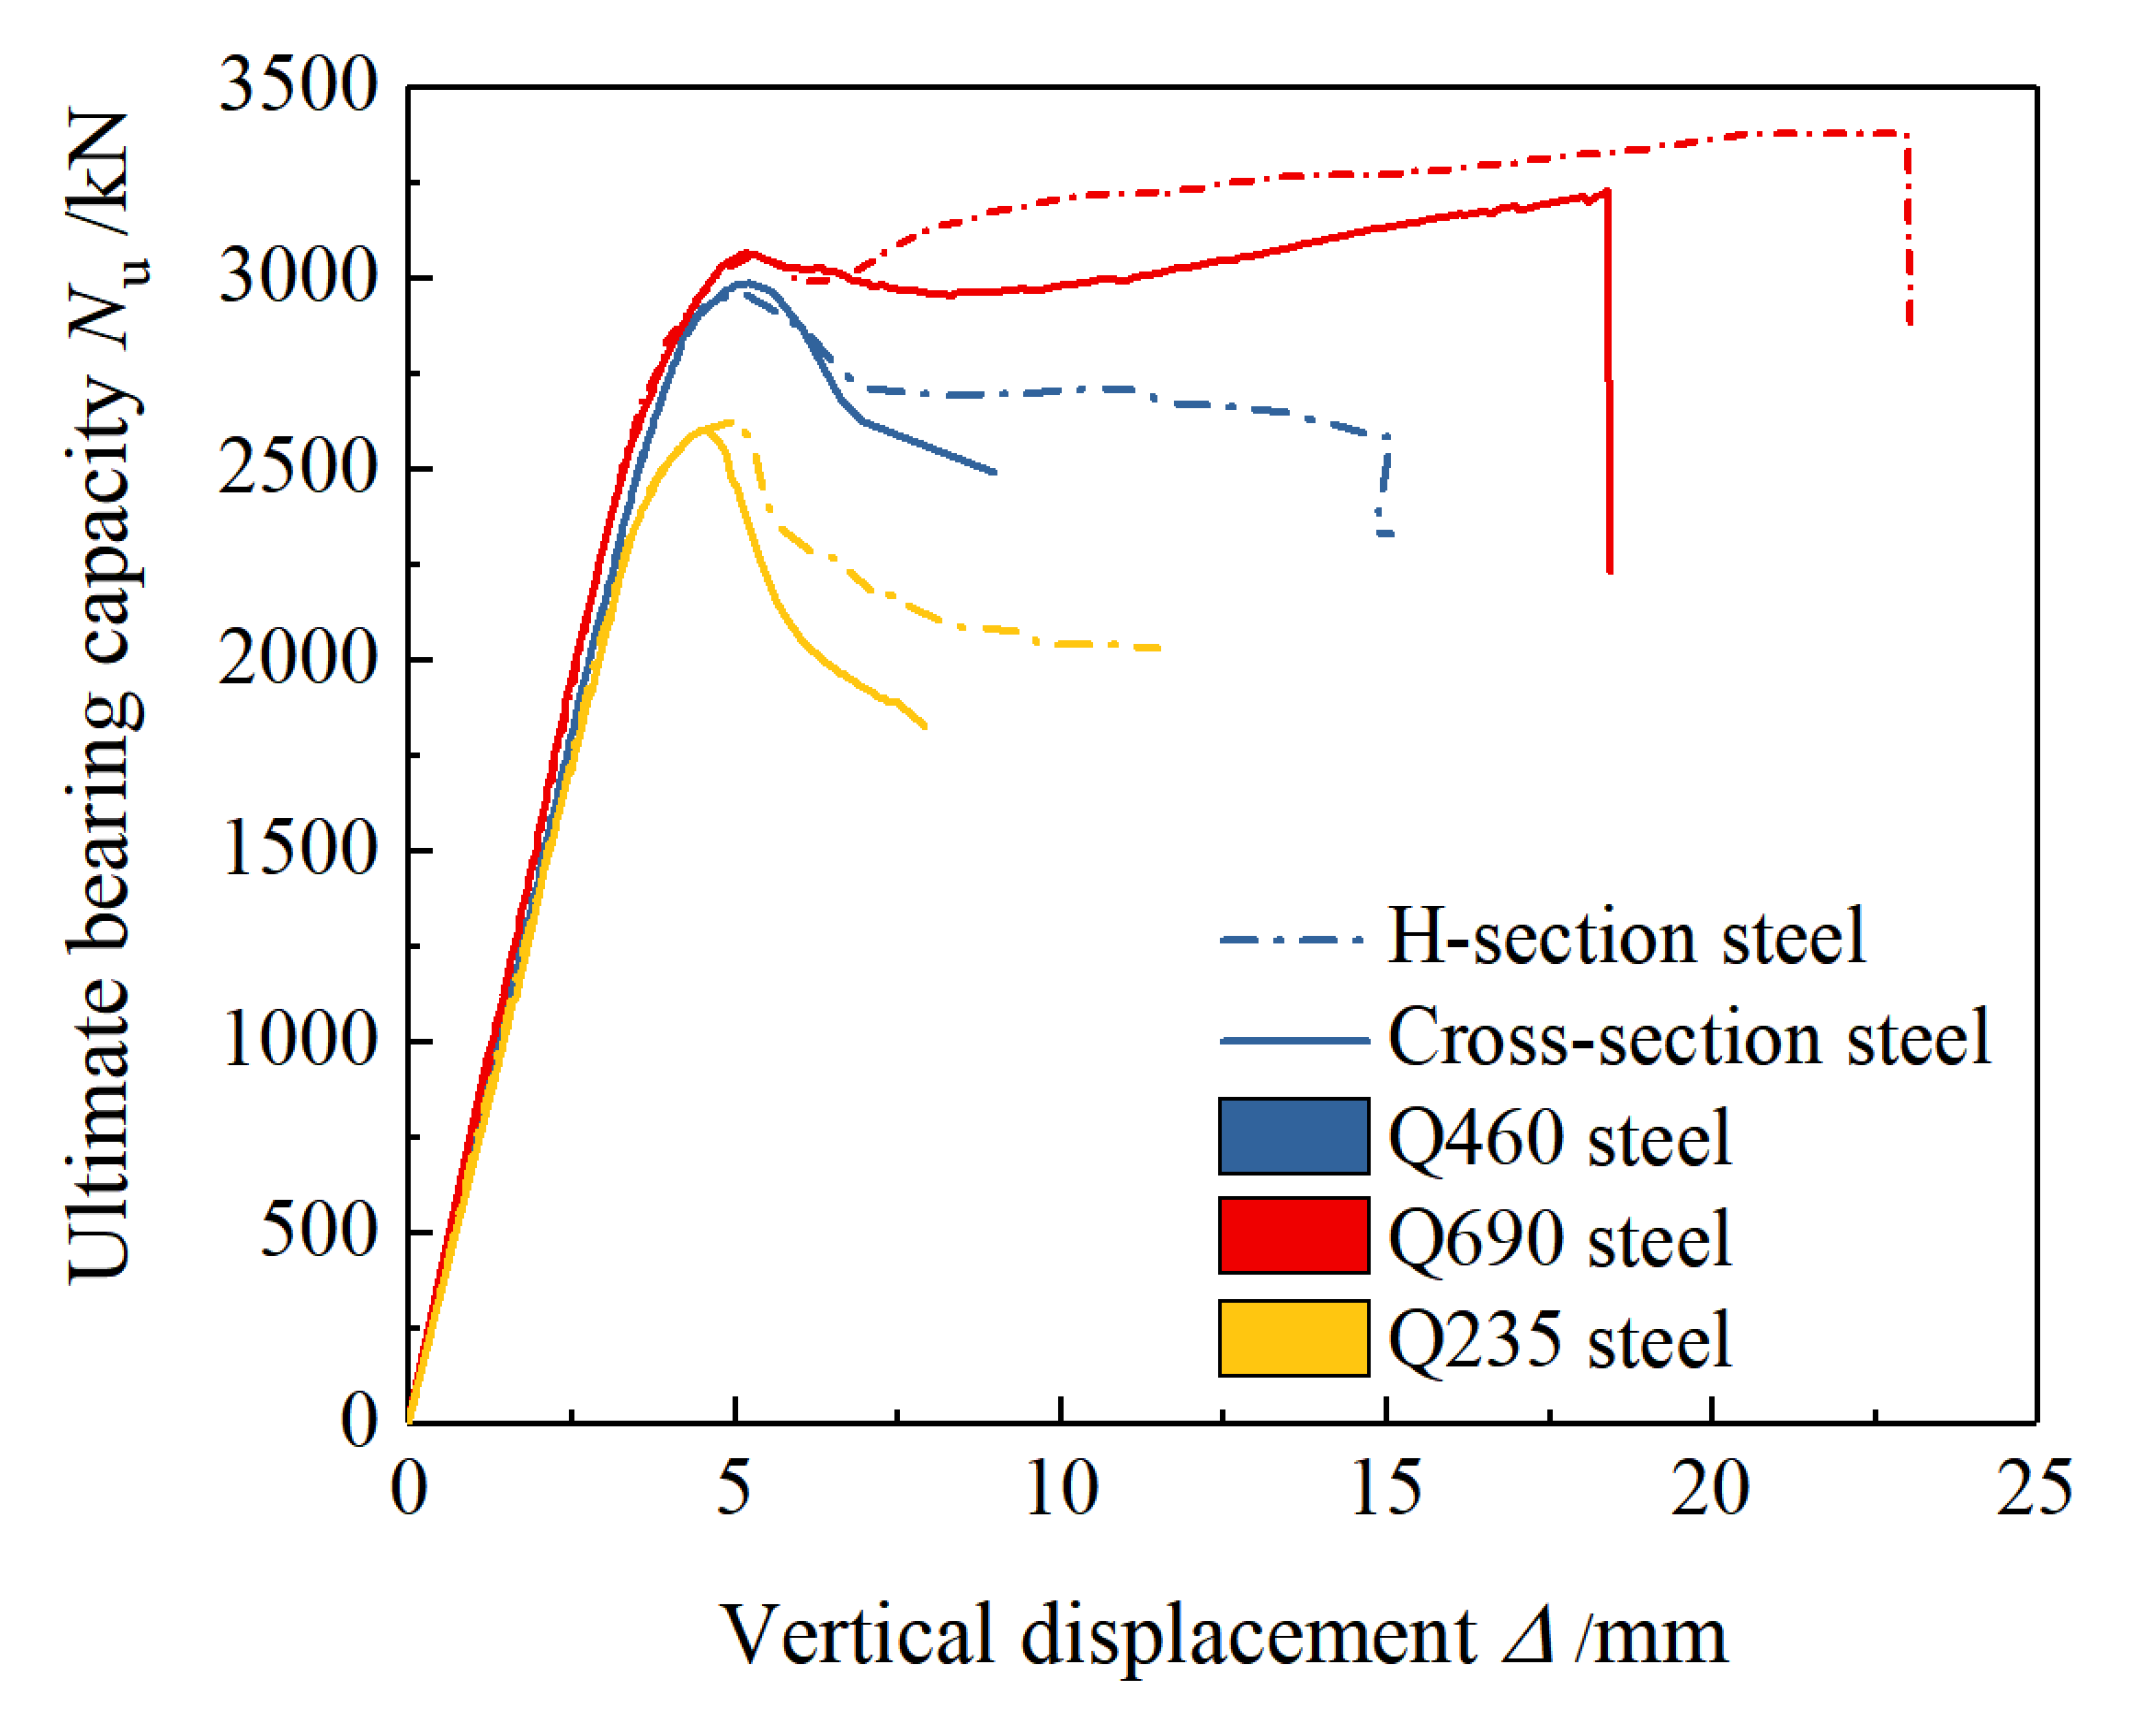
3.2. Load-Displacement Curve
3.3. Ultimate Bearing Capacity
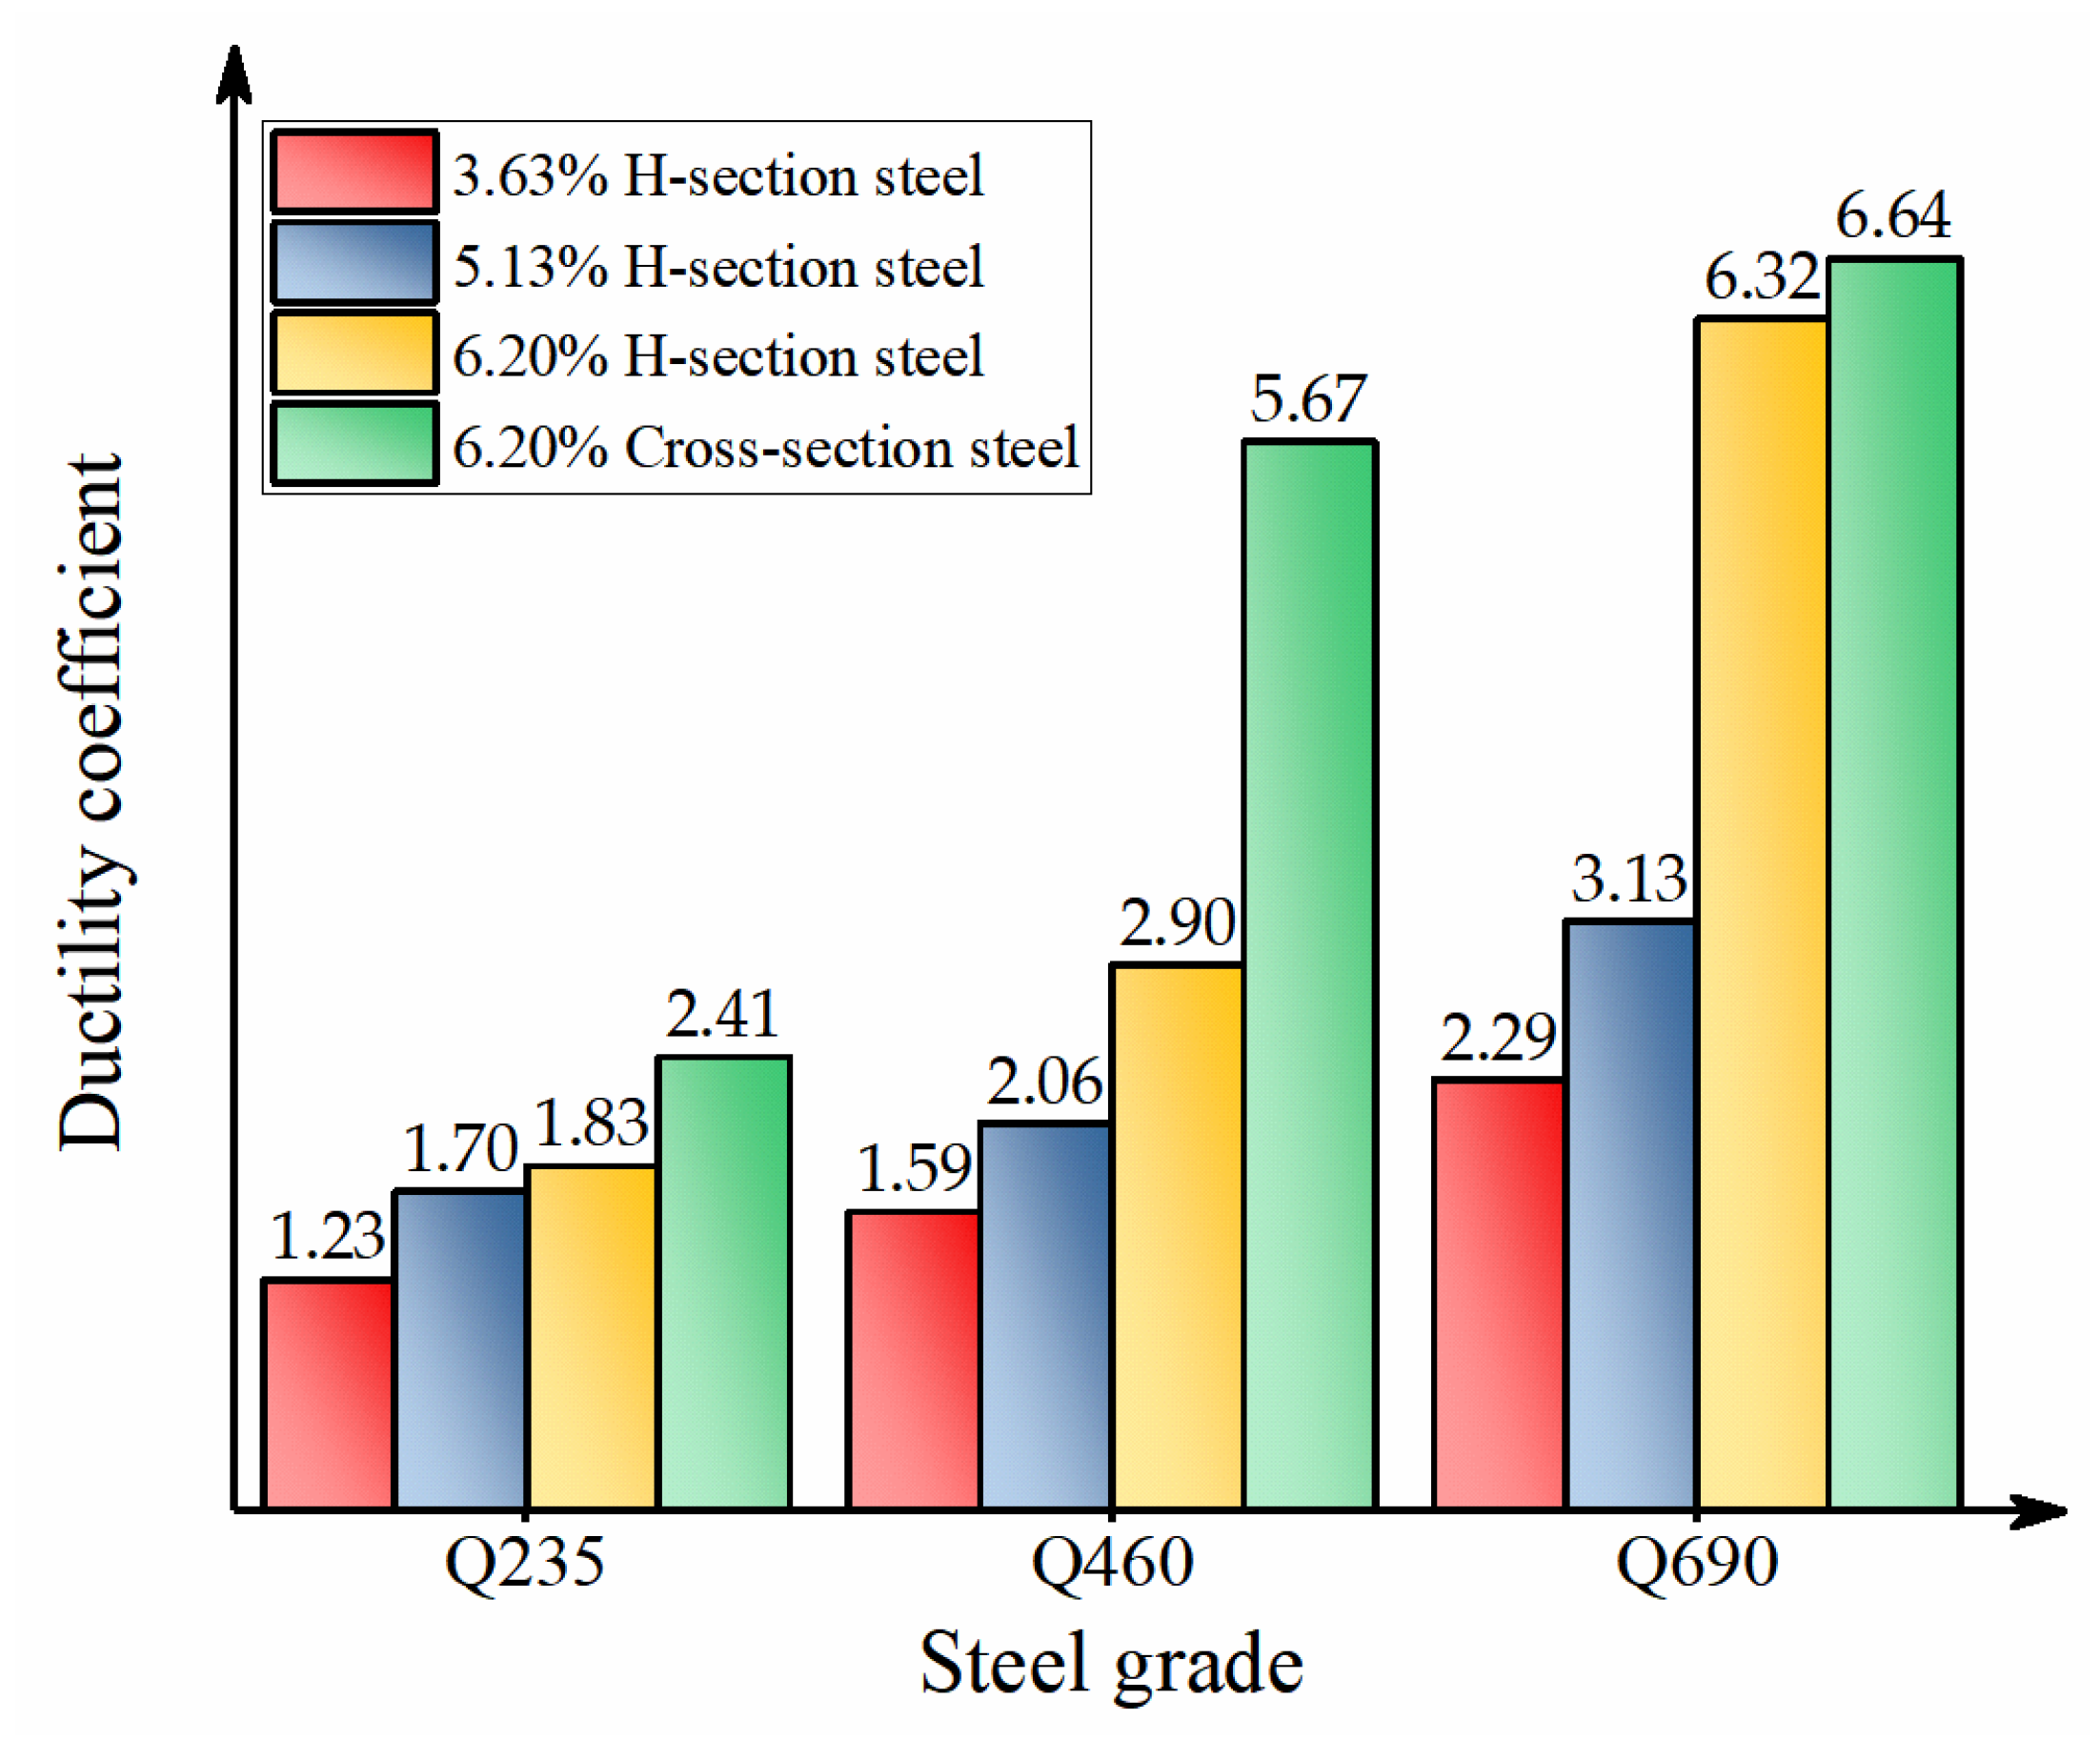
3.4. Ductility Coefficient
4. Calculation and Analysis of Bearing Capacity
4.1. The Calculation Method of Current Specifications
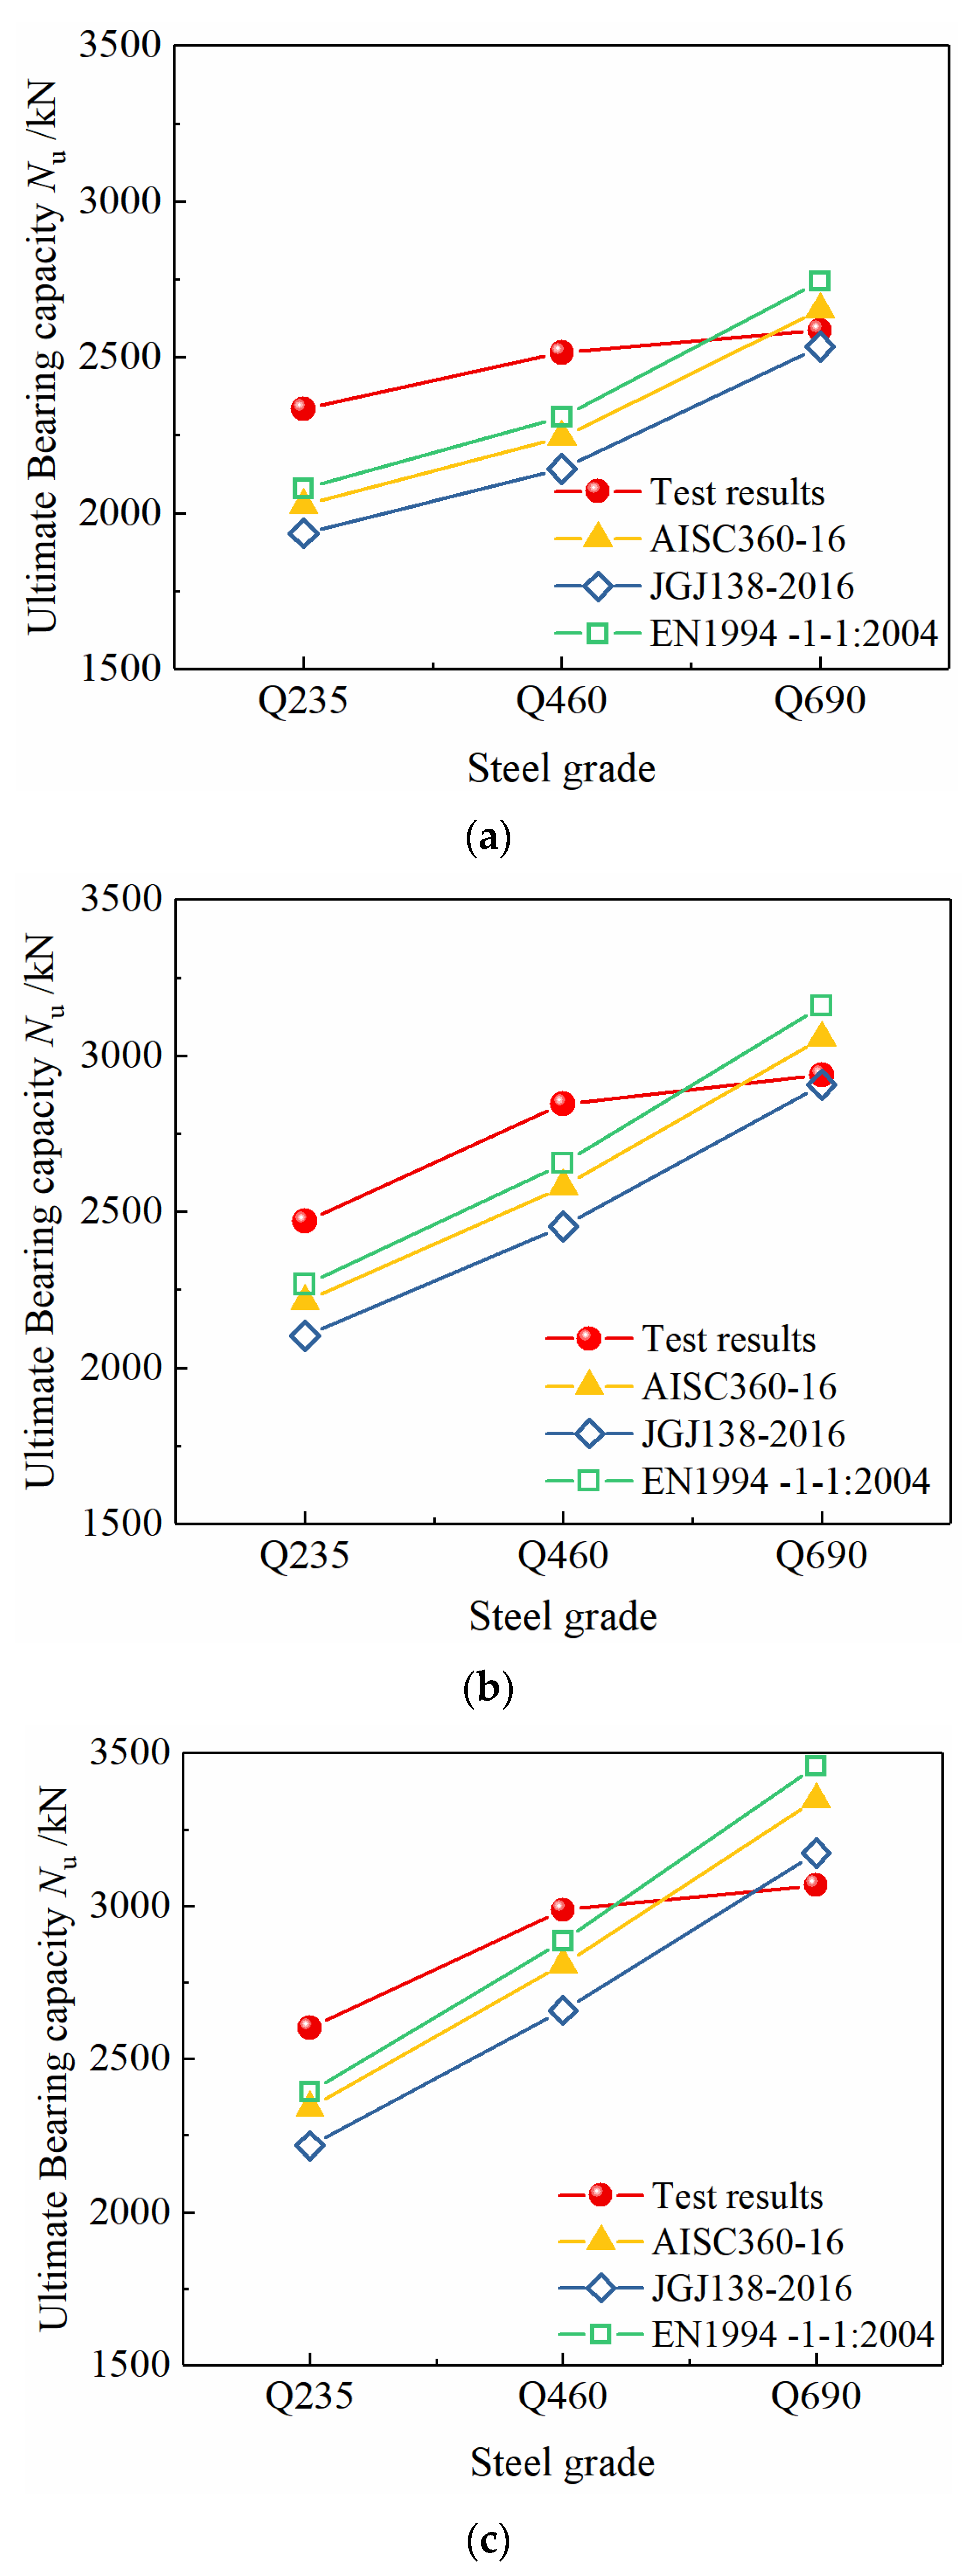
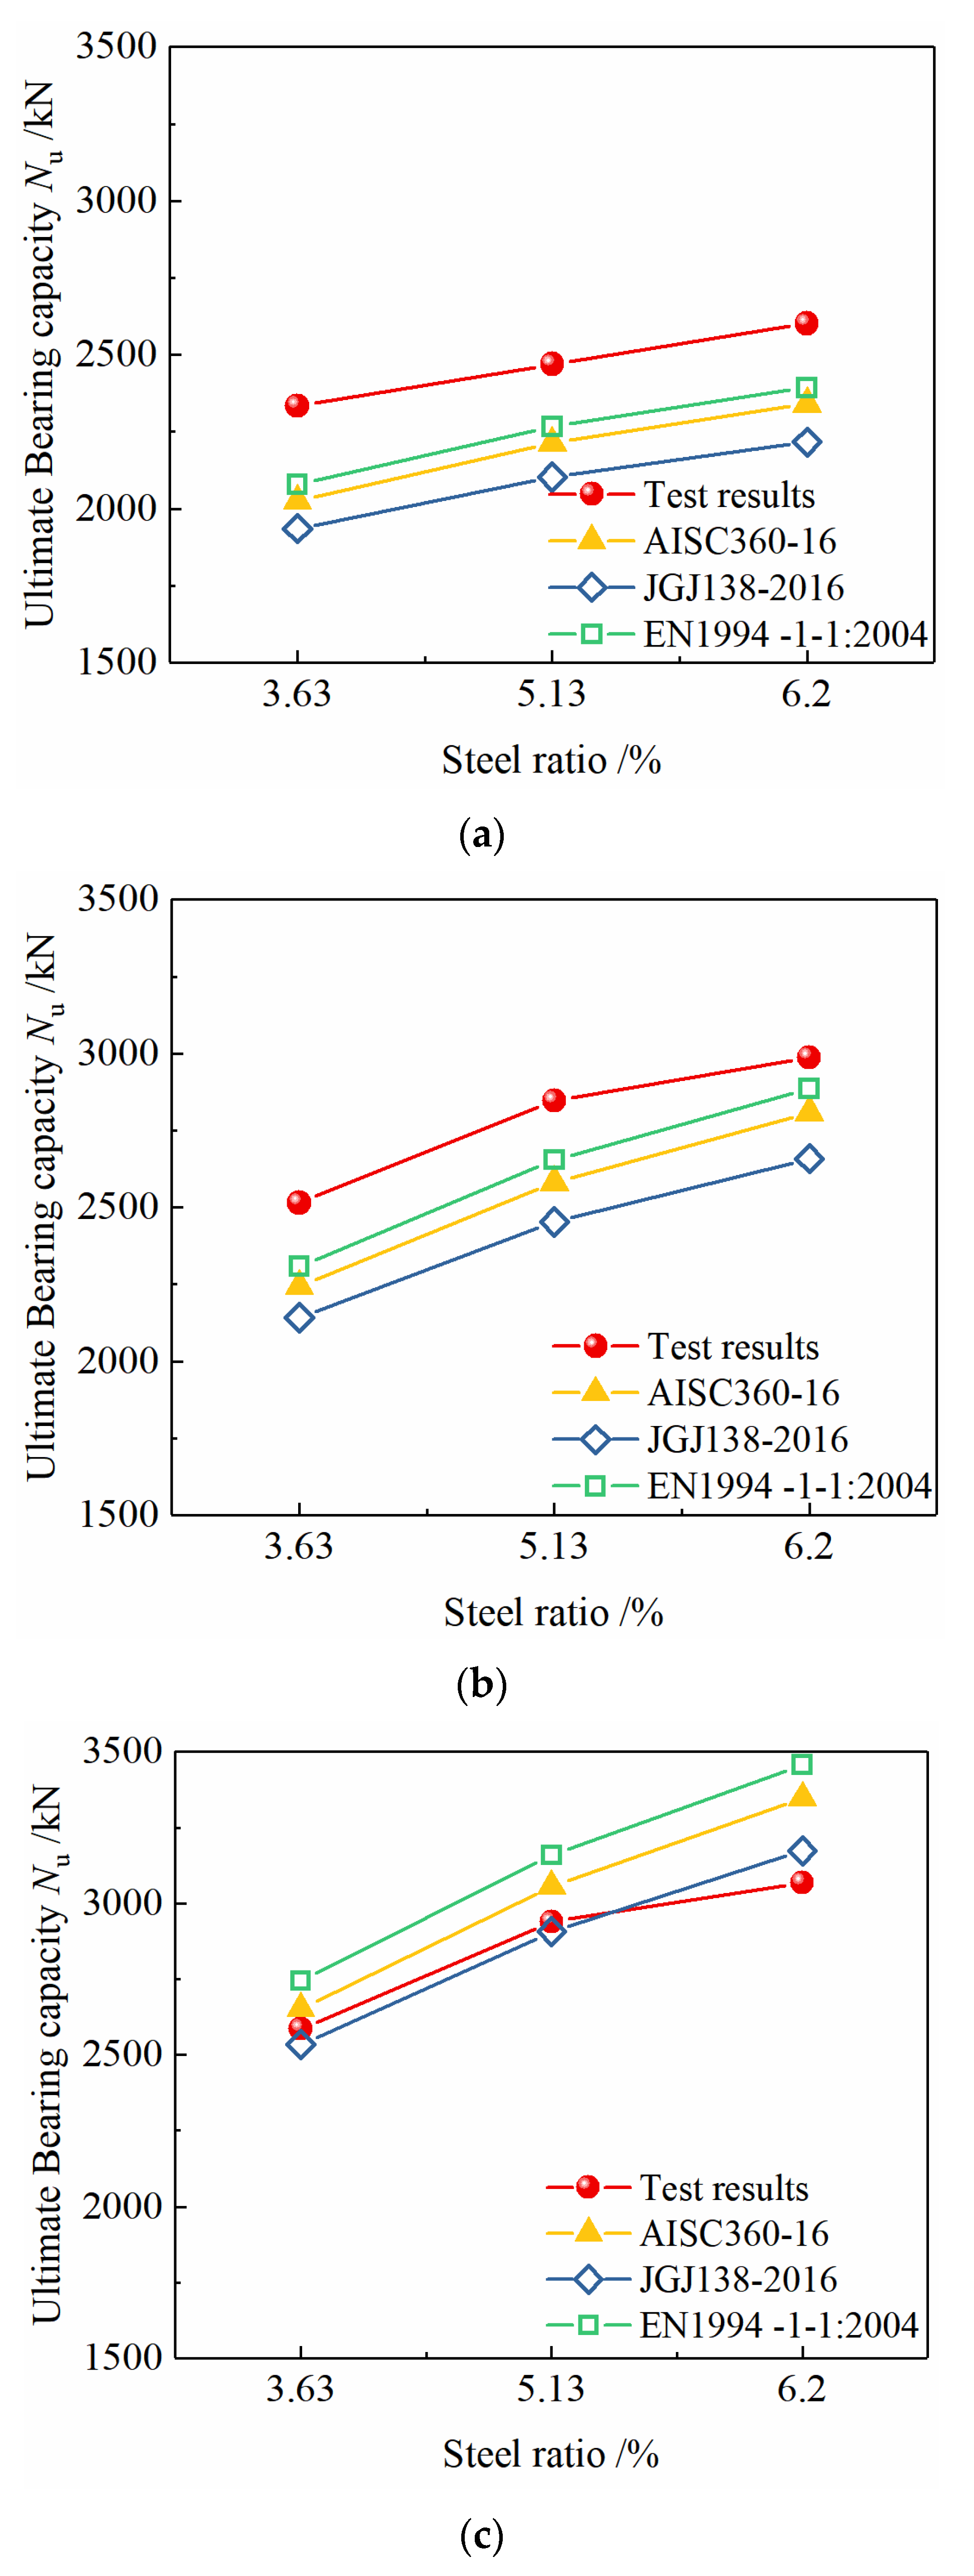
4.2. Comparison of Test Results and Calculation Results
4.3. Design Suggestion
5. Finite Element Analysis
5.1. Model Establishment
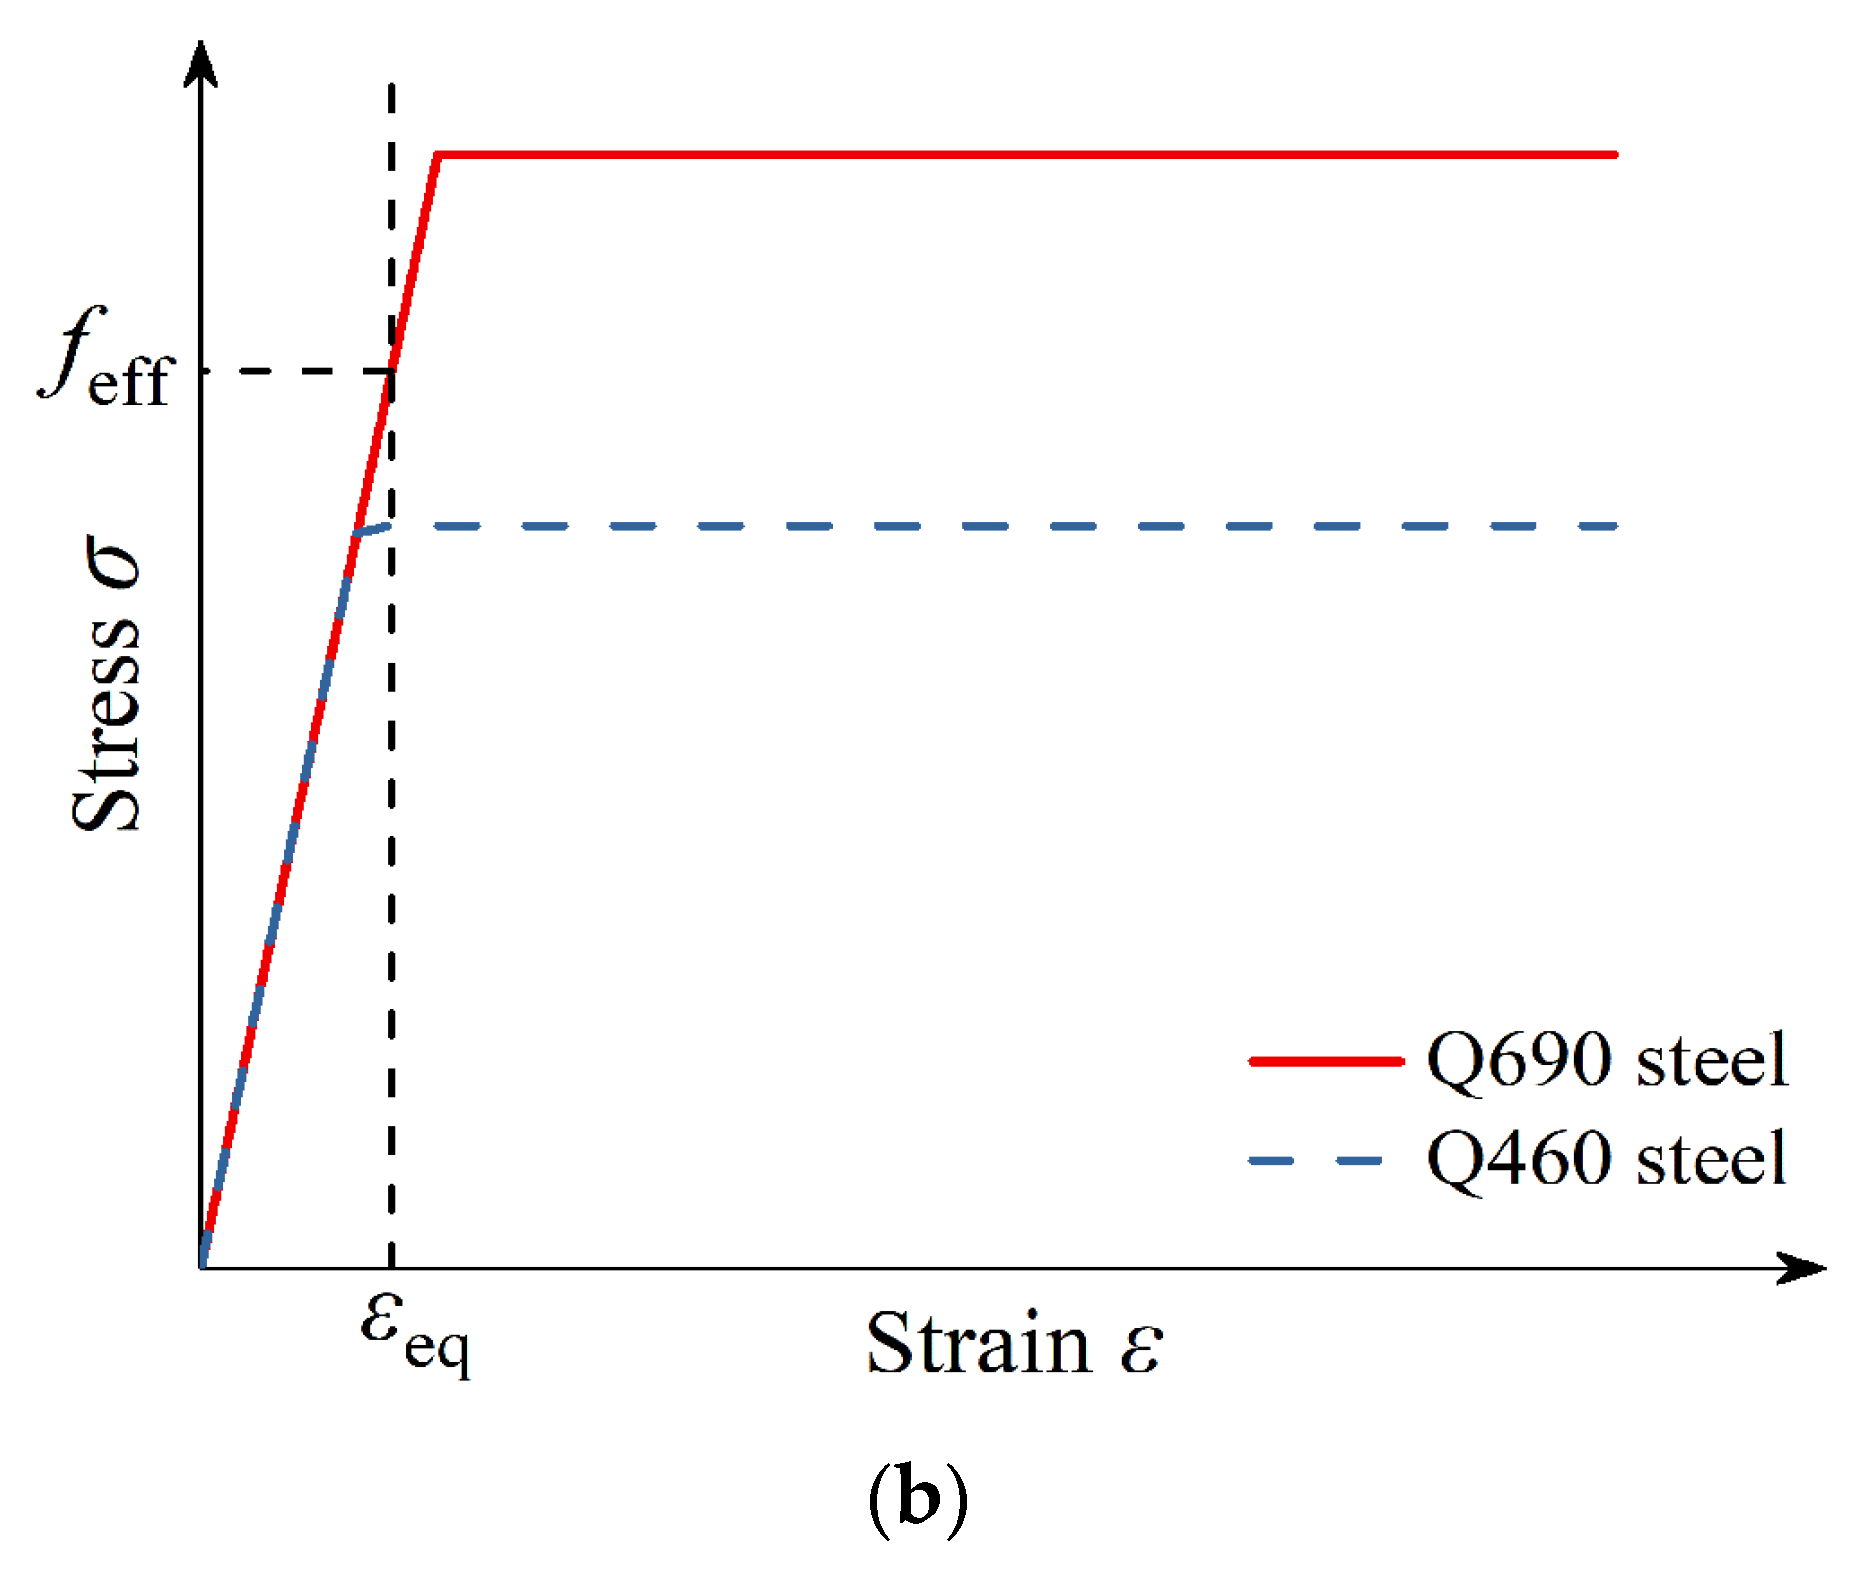
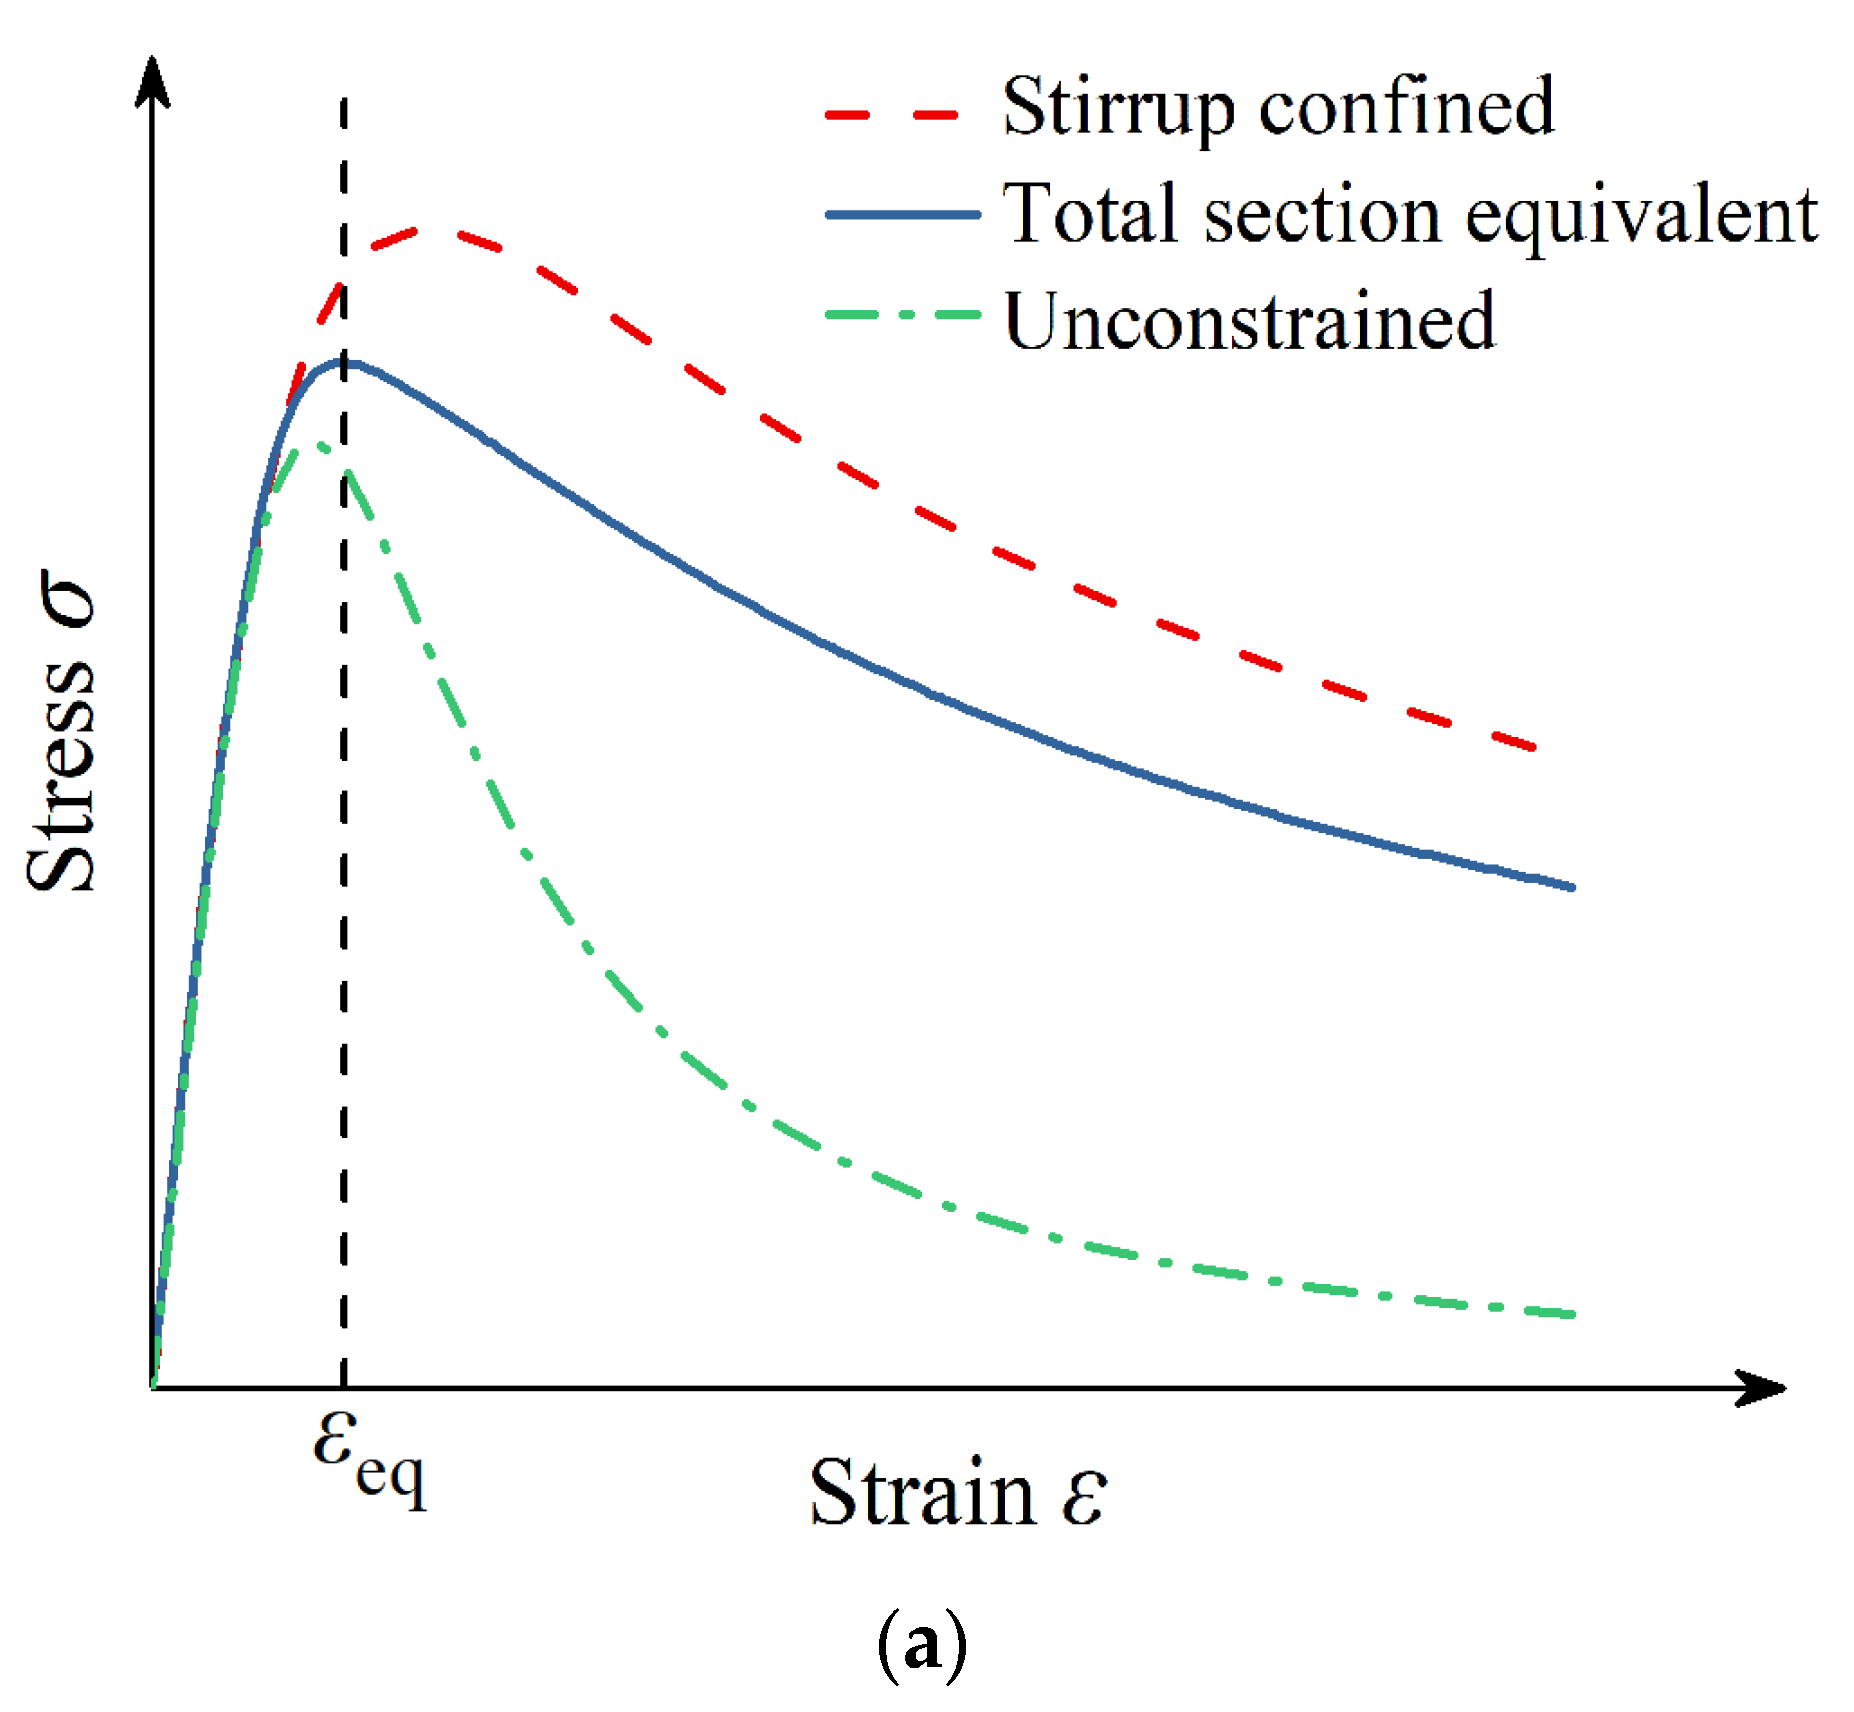
5.2. Definition of Material Properties
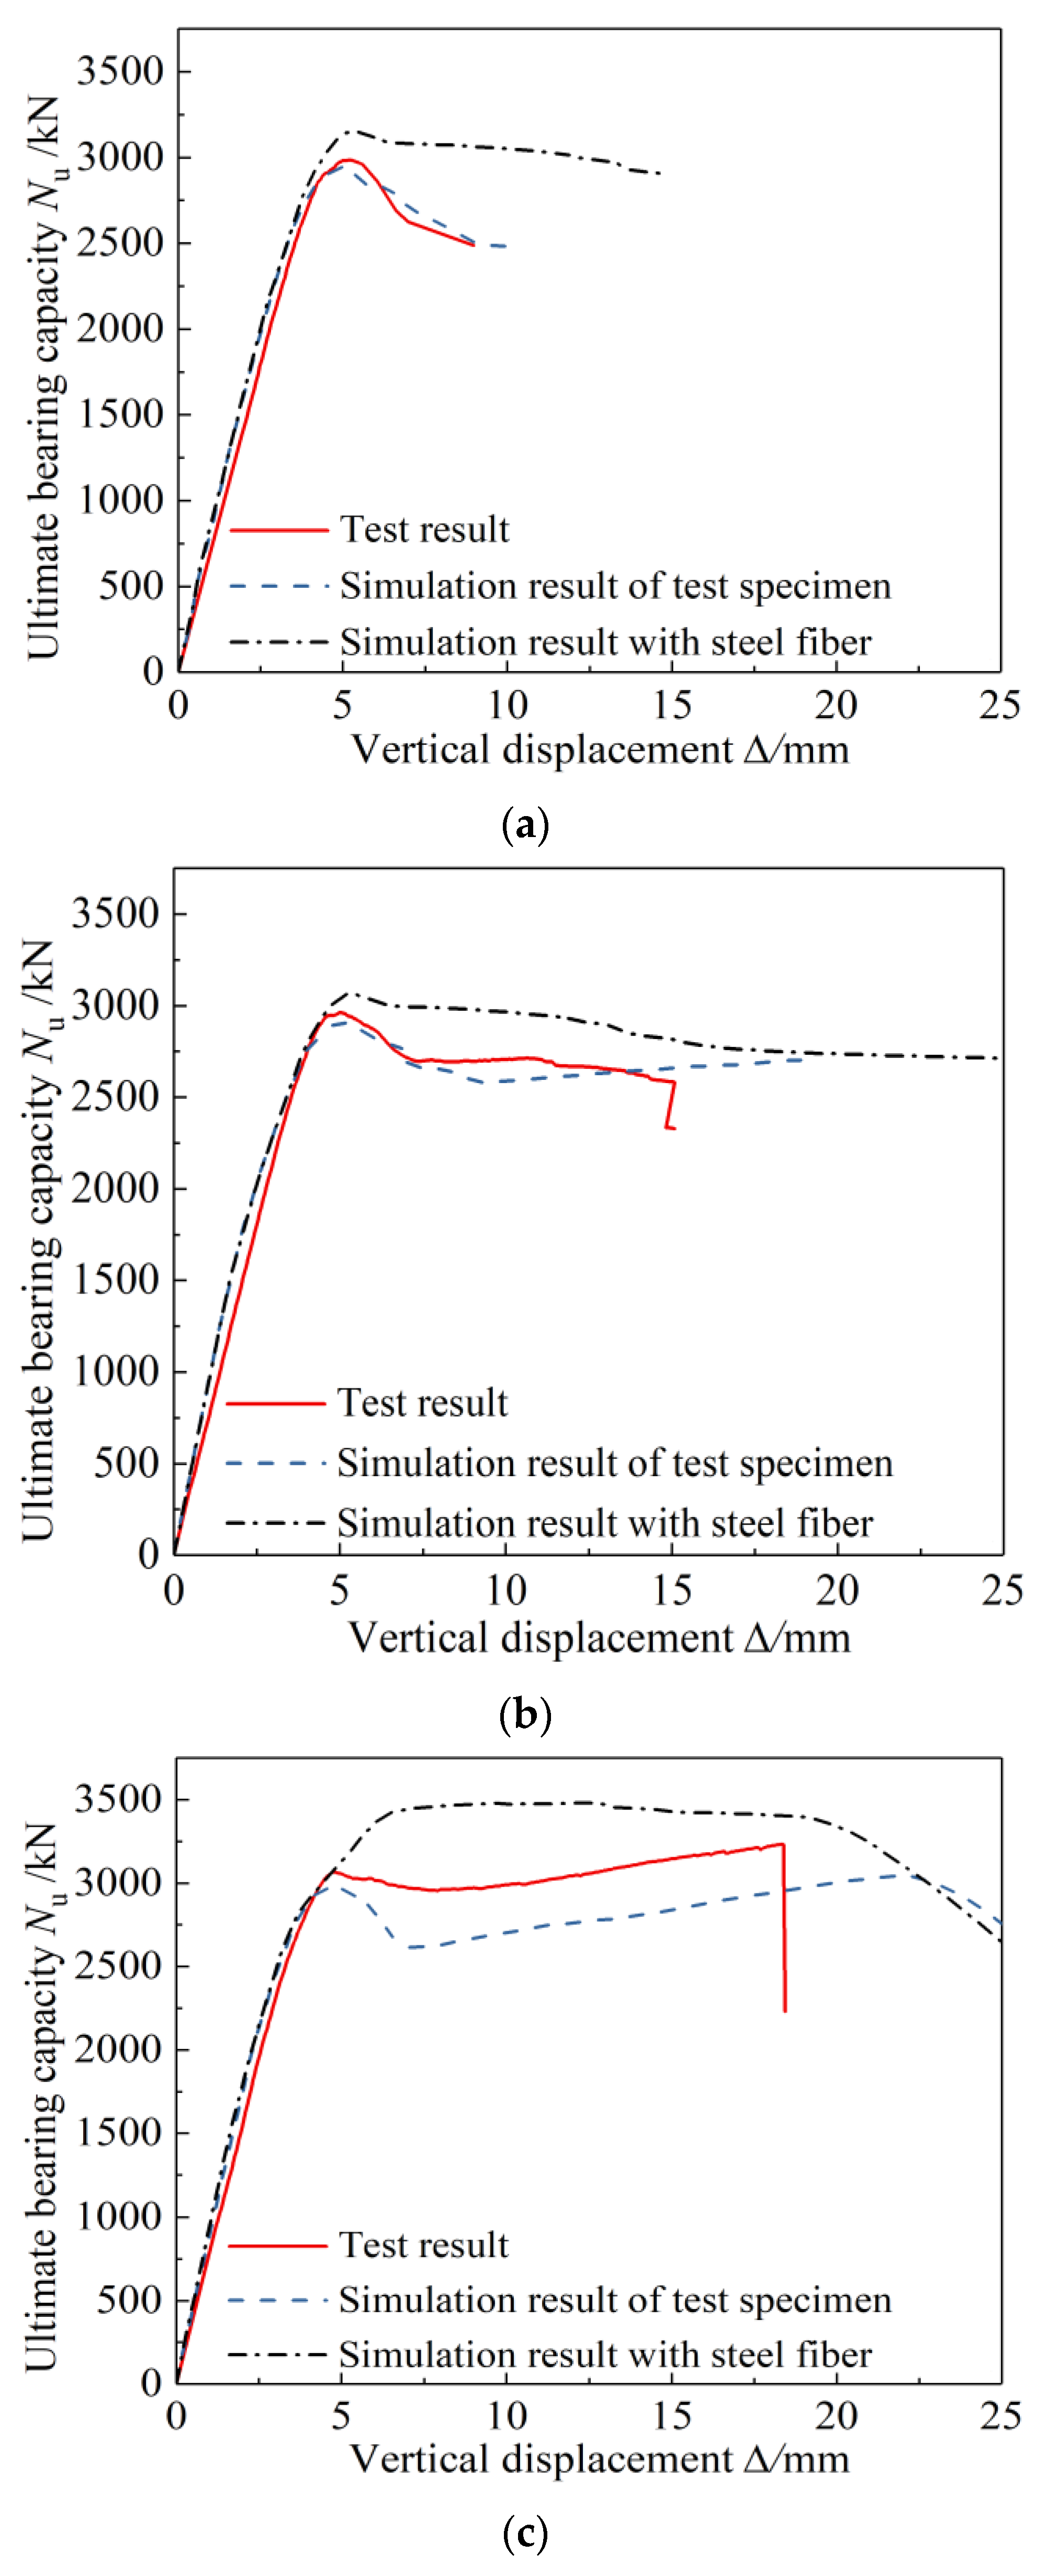
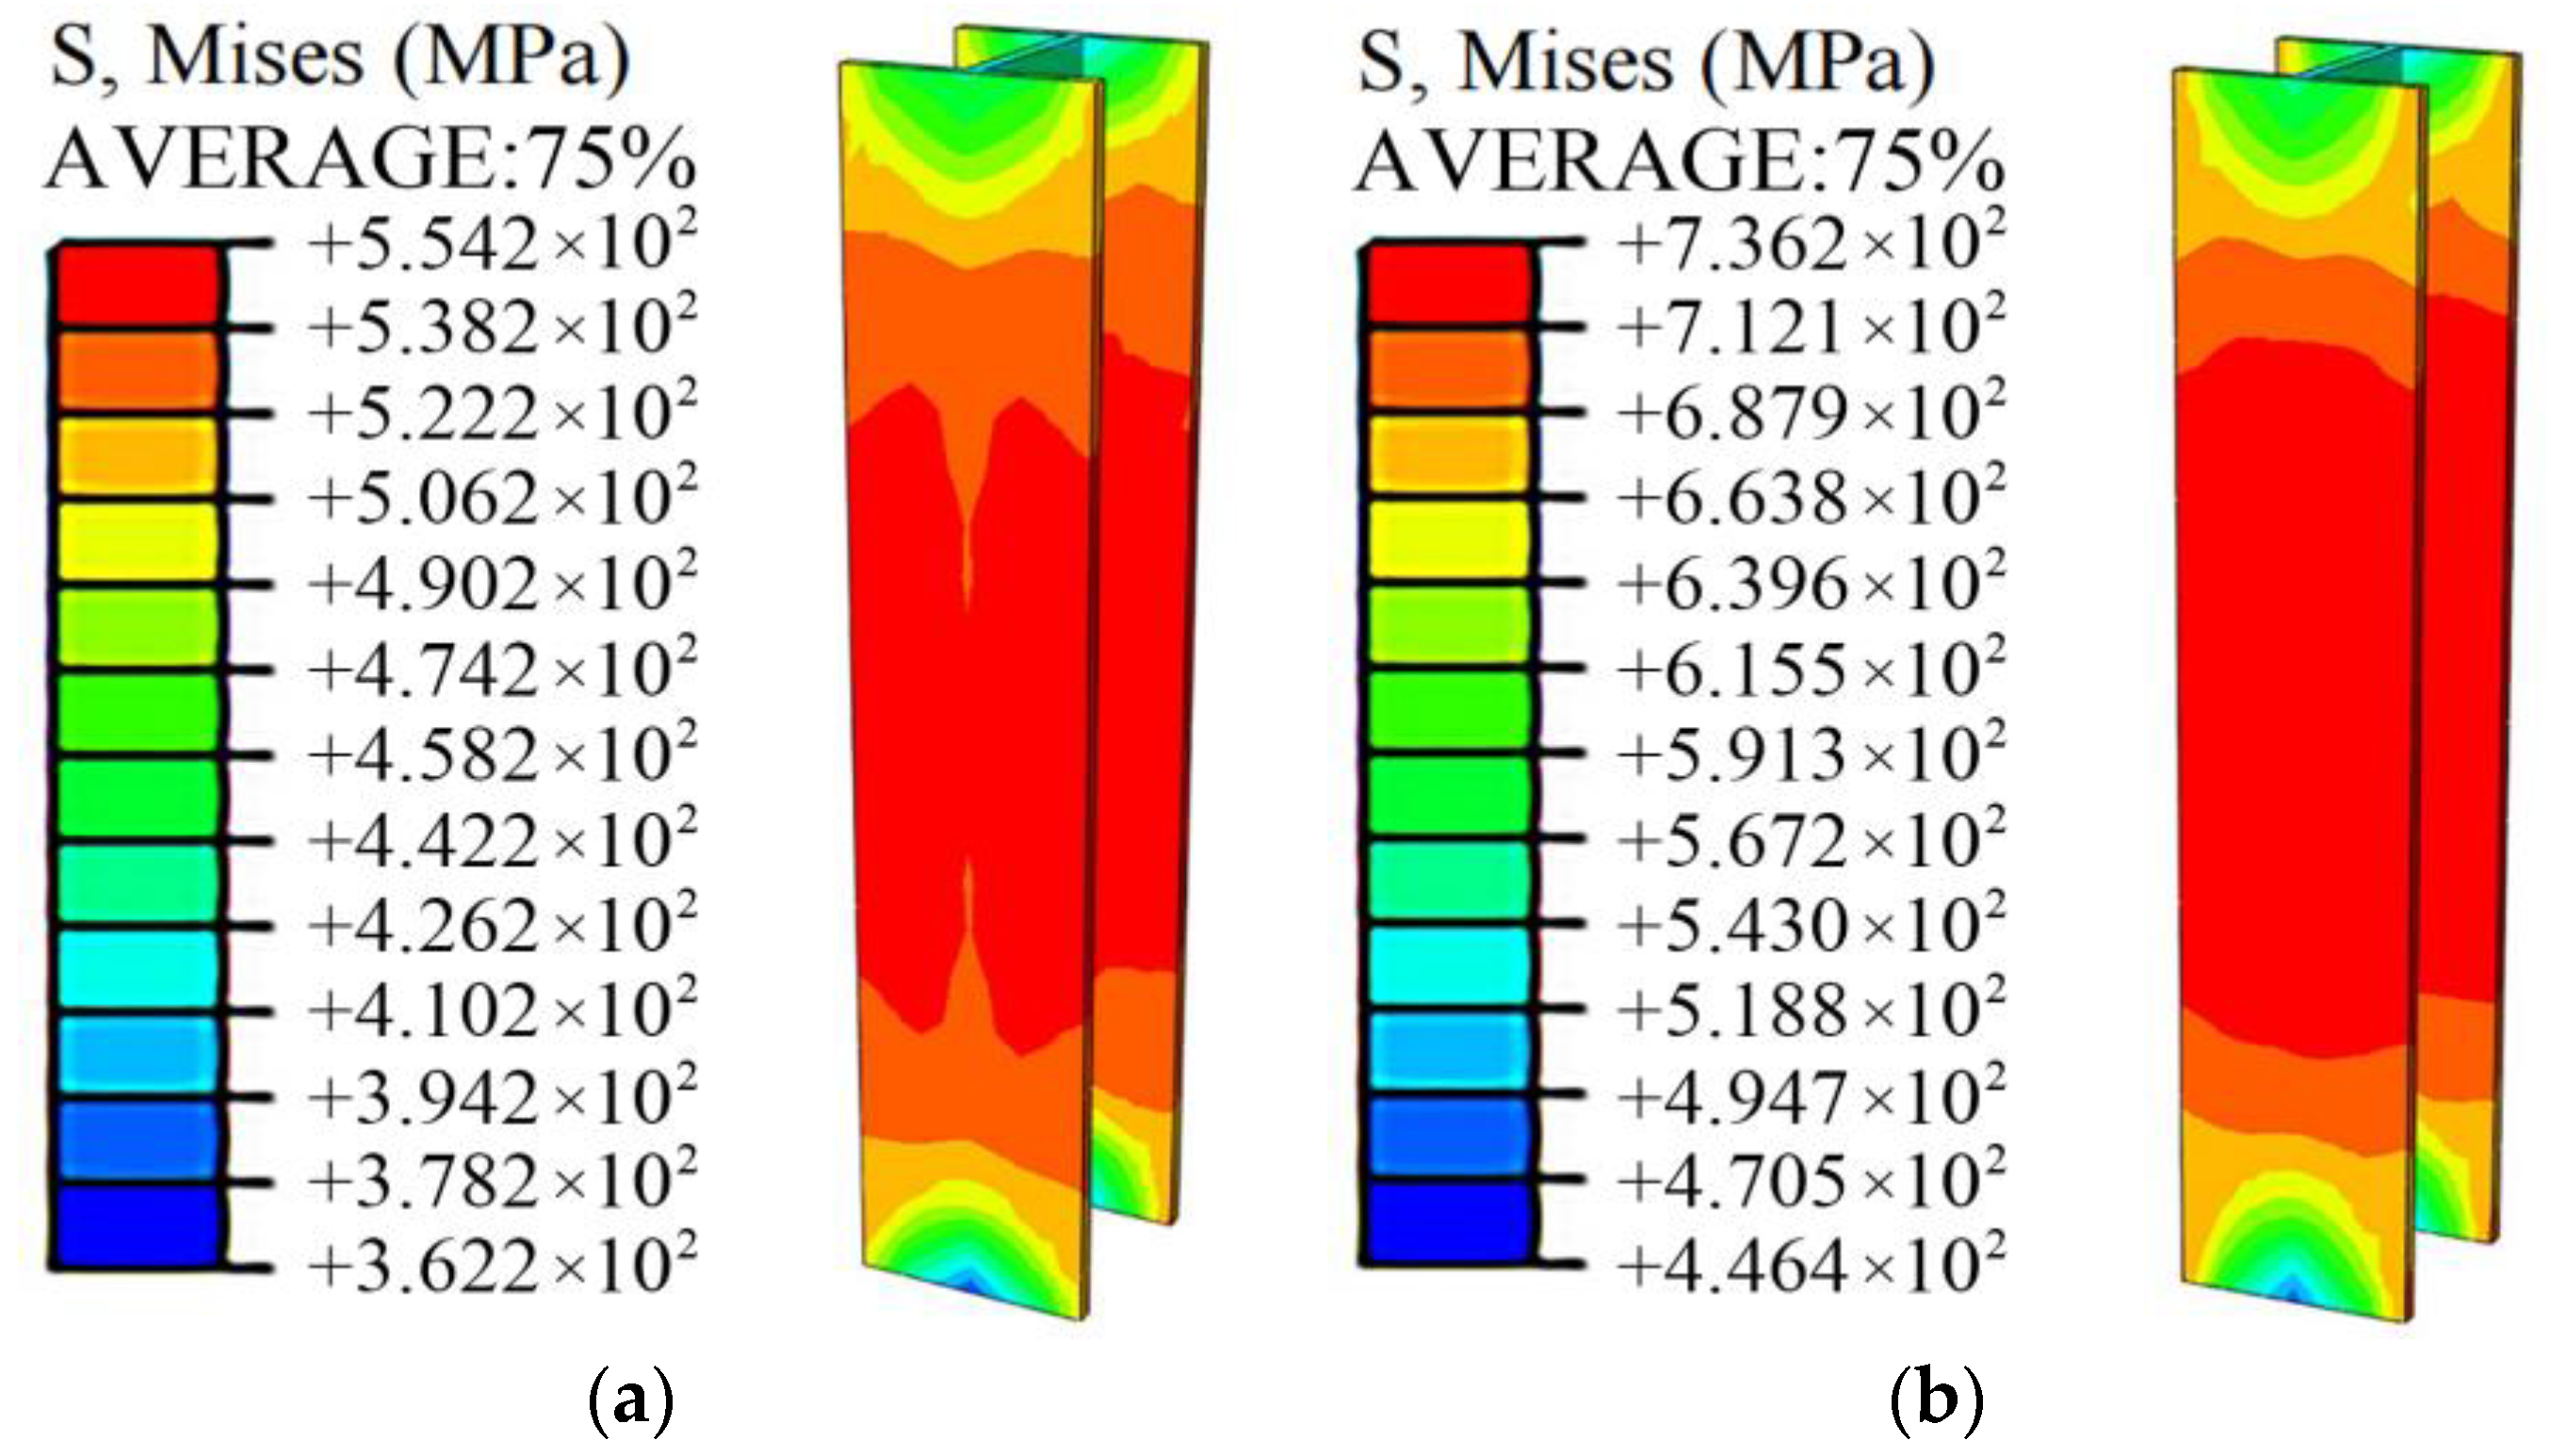
5.3. Analysis Result
6. Conclusions
- (1)
- For the specimens with the same steel ratio, the bearing capacity and ductility of SRC columns increase with the increase of steel strength. Compared with the specimens with Q235 steel, the bearing capacity and the ductility of the specimens equipped with Q460 steel increased by 7.8–15.3%, 21.2–135.3%, respectively; the bearing capacity and the ductility of the specimens equipped with Q690 steel increased by 13.2–24.1%, 84.1–245.4%, respectively.
- (2)
- For the specimens with the same strength grade, the bearing capacity and ductility of SRC columns can be significantly improved by increasing the steel ratio. Compared with the specimens equipped with a 3.63% steel ratio, the bearing capacity and ductility of the specimens equipped with 5.13% steel ratio increased by 5.8–13.6%, 29.6–38.2%, respectively; the bearing capacity and the ductility of the specimens equipped with a 6.20% steel ratio increased by 11.5–18.6%, 48.8–176.0%, respectively.
- (3)
- For the specimens with the same steel ratio, when the form of steel section is transformed from H-section to cross-section, in terms of bearing capacity, the bearing capacity of SRC columns did not change significantly; in terms of ductility, when the steel grade was Q460, the ductility of the specimen equipped with cross-section steel was 95.2% higher than the ductility of the specimen equipped with H section. When the steel grade was Q690, the ductility of the specimens equipped with H-section and cross-section steel were both very excellent.
- (4)
- Comparing the test results with the calculation results of the existing approach, it is found that the existing calculation approach can accurately calculate the axial bearing capacity of SRC columns equipped with Q460 steel, but it is unable to calculate the axial bearing capacity of SRC columns equipped with Q690 steel. Therefore, the method of determining the effective compressive strength of high-strength steel in SRC columns is proposed. The results show that this method can accurately calculate the axial bearing capacity of HSSRC columns and apply the calculation results to engineering applications.
- (5)
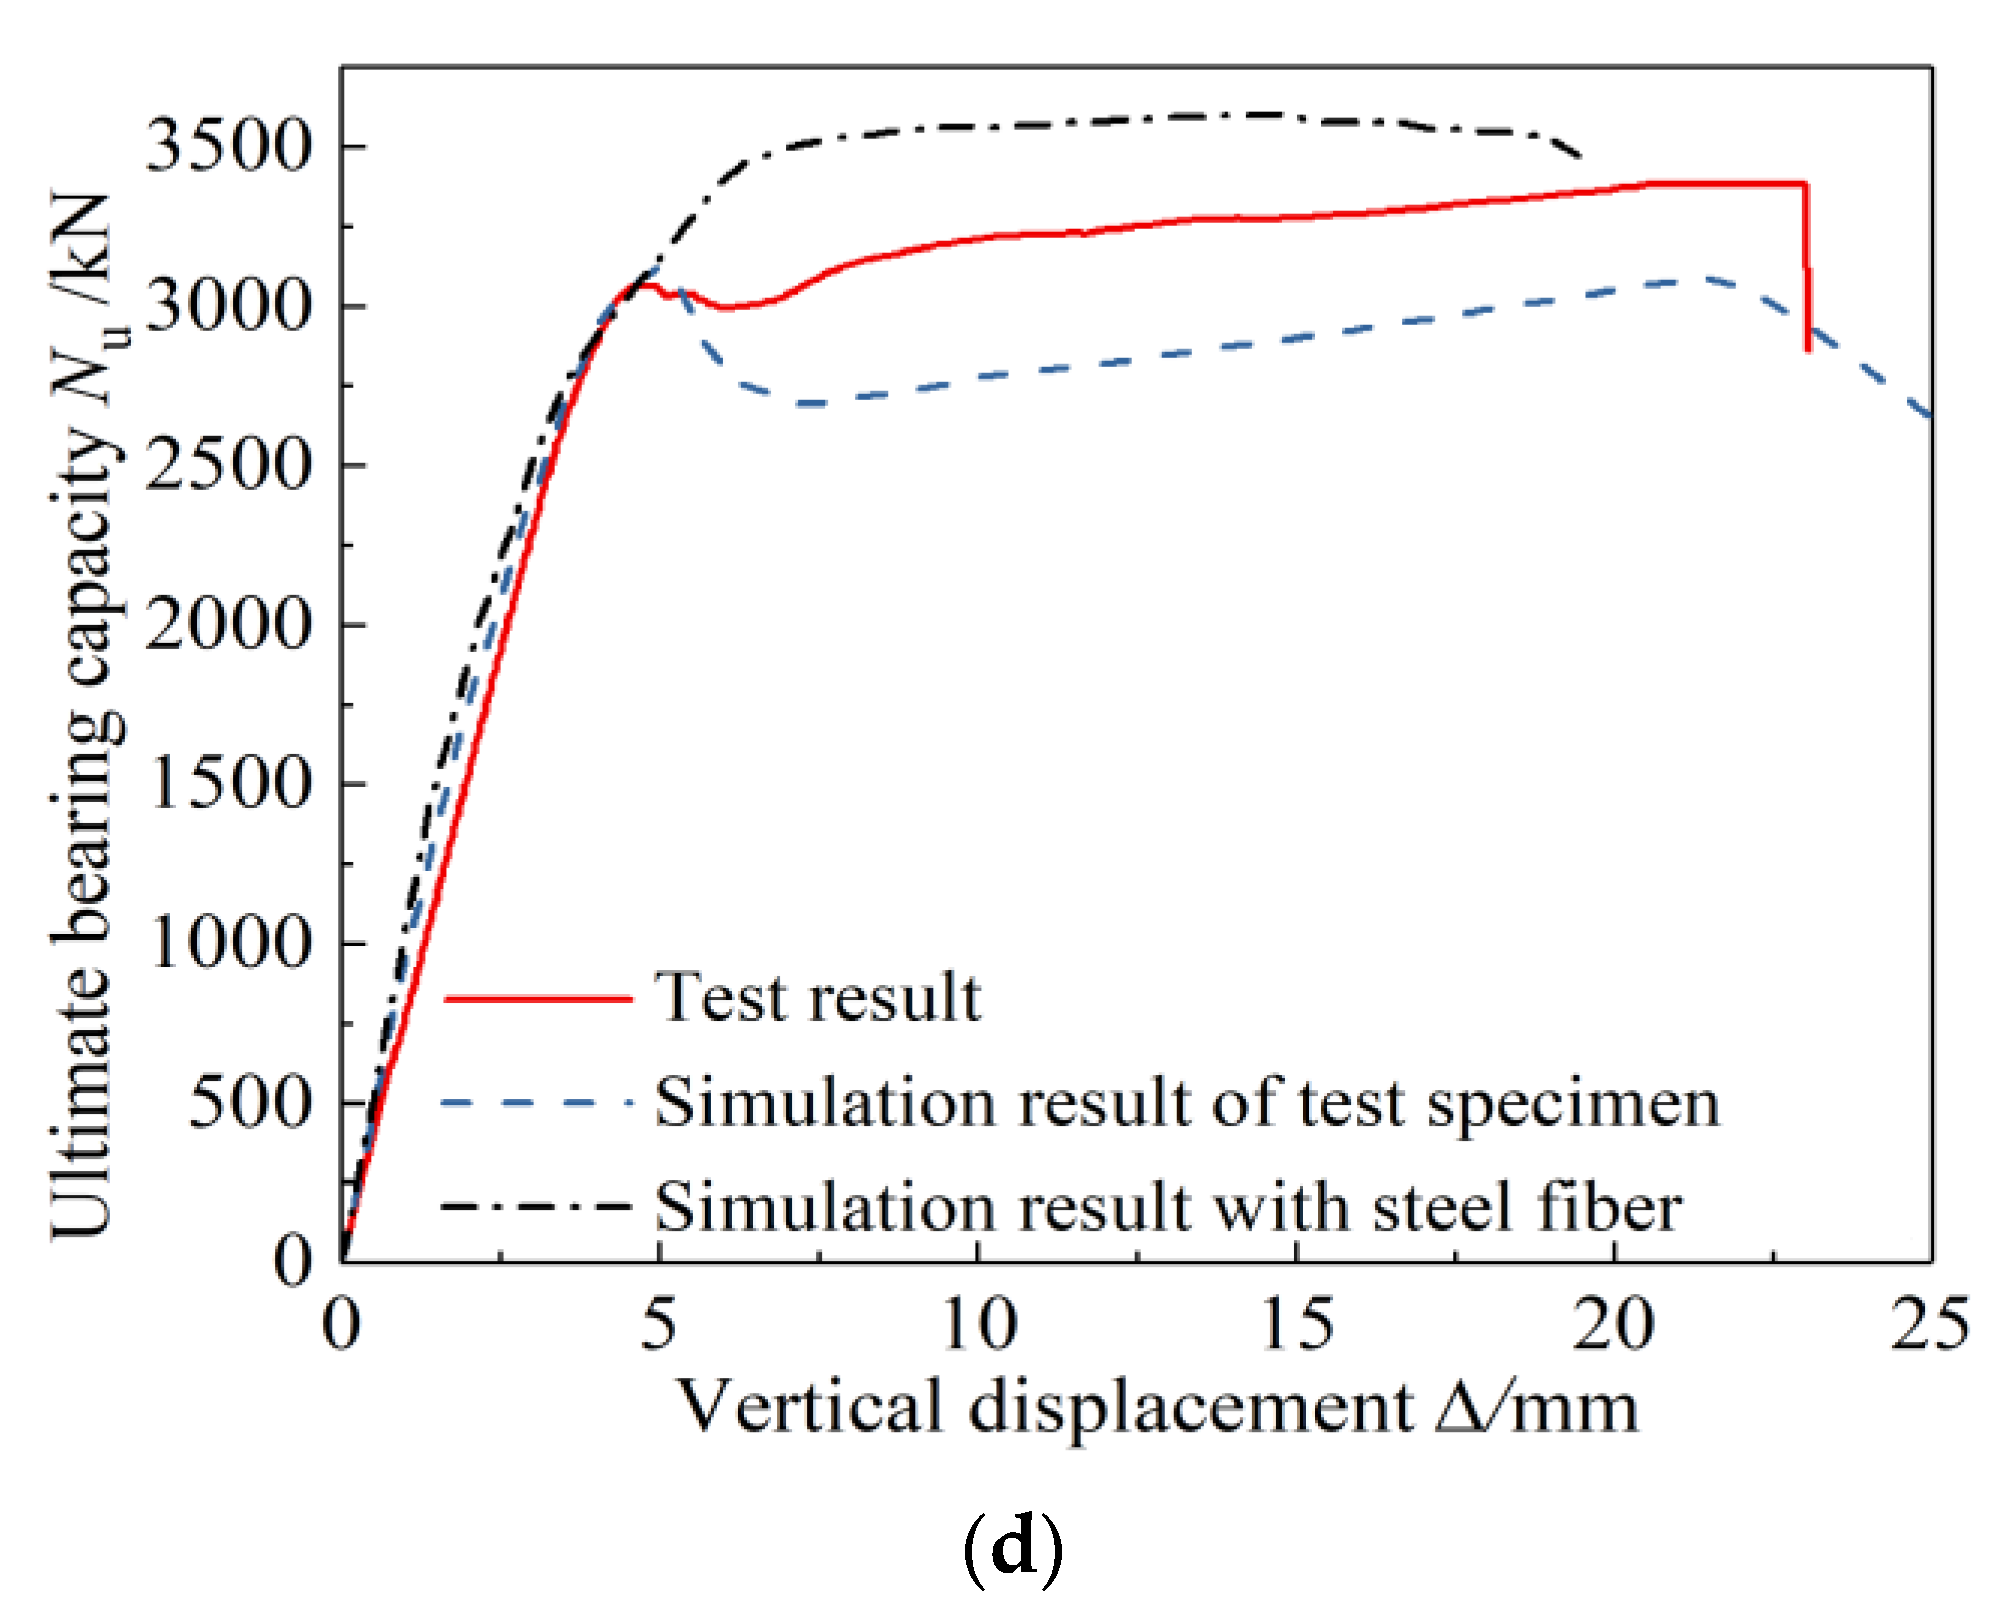
- The simulation results show that the bearing capacity of HSSRC columns with added steel fibers is higher than the HSSRC columns without steel fibers. Therefore, steel fibers are suggested to be incorporated into the HSSRC columns.
7. Research Limitation
- (1)
- The parameters studied in this paper were the influence of the steel grade, the steel ratio, and the section form of the steel. Subsequently, parameters such as slenderness ratio, stirrup form, and concrete strength can be added for the test.
- (2)
- Based on the theoretical analysis, this paper proposed to improve the deformation performance of concrete by steel fibers to make full use of the compression performance of high-strength steel, which is verified by an ABAQUS simulation. The conclusion can be verified by experiments.
Author Contributions
Funding
Institutional Review Board Statement
Informed Consent Statement
Data Availability Statement
Conflicts of Interest
References
- Bin, H.; Wenfu, Z. Local-overall interactive buckling of high strength steel welded I-section columns under axial compression. Thin Wall Struct. 2020, 157, 106964. [Google Scholar]
- Xianlei, C.; Geng, Z.; Zhengyi, K.; Hao, S.; Chao, C.; Zongping, C.; SeungEcok, K. Experimental study on local buckling of 800 MPa HSS welded I-section columns under axial compression. Thin Wall Struct. 2020, 155, 106878. [Google Scholar]
- Jie, W.; Jin, D.; Qian, Z.; Fengjiang, Q. Overall buckling behaviour of Q420-Q960 steel welded H-section axial compression members. Eng. Struct. 2021, 249, 113340. [Google Scholar]
- Gang, S.; Huiyong, B.; Yuanqing, W. Overview of research progress for high strength steel structures. Eng. Plast. Appl. 2013, 30, 1–13. [Google Scholar]
- Ilawe, N.V.; Zimmerman, J.A.; Wong, B.M. Breaking badly: DFT-D2 gives sizeable errors for tensile strengths in Palladium-Hydride solids. J. Chem. Theroy Comput. 2015, 11, 5426–5435. [Google Scholar] [CrossRef]
- Ji, H.; Lee Jong, H.; Park, A.S. Assessing the Influence of van der Waals Corrected Exchange-Correlation Functionals on the Anisotropic Mechanical Properties of Coinage Metals. Phys. Rev. B 2016, 94, 024108. [Google Scholar]
- Junsheng, S.; Junjie, W.; Wenbiao, W.; Zhengfang, D.; Bo, L. Comparative experimental research on seismic performance of rectangular concrete columns reinforced with high strength steel. J. Build. Struct. 2014, 35, 20–27. [Google Scholar]
- Qingxuan, S.; Licheng, M.; Qiuwei, W.; Bin, W.; Kun, Y. Seismic performance of square concrete columns reinforced with grade 600 MPa longitudinal and transverse reinforcement steel under high axial load. Structures 2021, 32, 1955–1970. [Google Scholar]
- Jiabao, Y.; Xinyan, Y.; Yunbiao, L.; Xuchuan, L.; Lingxin, Z. Studies on axial compression behaviors of concrete-filled steel tubular columns at low temperature. J. Build. Struct. 2021, 42, 248–255. [Google Scholar] [CrossRef]
- Lingyue, L.; Jian, C. A new method to calculate axial bearing capacity of composite columns with core of high-strength concrete-filled steel tube. J. South China Univ. Technol. Nat. Sci. Ed. 2010, 38, 26–31. [Google Scholar]
- Guochang, L.; Bowen, C.; Zhijian, Y.; Yaopeng, L.; Yihe, F. Experimental and numerical behavior of eccentrically loaded square concrete-filled steel tubular long columns made of high-strength steel and concrete. Thin Wall Struct. 2021, 159, 107289. [Google Scholar] [CrossRef]
- Jiangang, W.; Xia, L.; Zhichao, L.; Amit, H.V. Experimental behavior and design of high-strength circular concrete-filled steel tube short columns. J. Struct. Eng. 2020, 146, 04019184. [Google Scholar]
- Jian, C.; Xiaofeng, X.; Chun, Y.; Jiangang, H.; Haifeng, C. An Experimental Research on the Composite Column with Core of High-Strength Concrete Filled Steel Tube under Axial Compression Loading. J. South China Univ. Technol. Nat. Sci. Ed. 2022, 30, 81–85. [Google Scholar]
- Yanlei, W.; Yonghua, G.; Qing, S.; Bin, Z. Study on local stability of Q690 high-strength steel tube under axial compression. Chn. J. Civ. Eng. 2013, 46, 1–12. [Google Scholar] [CrossRef]
- Xianlin, W.; Yuqing, L.; Fei, Y.; Yuanchun, L.; Xuefeng, L. Effect of concrete cover on the bond-slip behavior between steel section and concrete in SRC structures. Constr. Build. Mater. 2019, 229, 116855. [Google Scholar]
- Chanchan, Z.; Guangyong, W.; Yinxing, L. Fire performance of restrained steel reinforced concrete columns. J. Build. Struct. 2021, 62, 46–55. [Google Scholar] [CrossRef]
- Qiliang, L.; Xishan, H.; Dong, C. Joints detailed design and engineering application of steel reinforced concrete composite structure. Constr. Technol. 2013, 42, 42–44. [Google Scholar] [CrossRef]
- Shuren, Z. Experimental study on seismic performances of steel reinforced concrete beam-column joints in Yinchuan Green Space Center. Build. Struct. 2021, 51, 44–48. [Google Scholar] [CrossRef]
- Linfei, P.; Huiyi, W.; Tianli, J.; Shen, T. Steel structure desigin of trestle bridge in gas pipeline engineering. Eng. J. Wuhan Univ. 2020, 53, 59–64. [Google Scholar]
- Mingqiang, L.; Fengjuan, D.; Weishan, J. Research on high-strength concrete SRC column. Sci. Tech. Info. 2010, 25, 722. [Google Scholar]
- Chang-Soo, K.; Hong-Gun, P.; Ho-Jun, L.; In-Rak, C.; Kyung-Soo, C. Eccentric axial load test for high-strength composite columns of various sectional configurations. J. Struc. Eng. 2017, 143, 04017075. [Google Scholar]
- Chang-Soo, K.; Hong-Gun, P. Eccentric axial load testing for concrete-encased l-section columns using 800 MPa steel and 100 MPa concrete. J. Struct. Eng. 2012, 138, 1019–1031. [Google Scholar]
- Yangming, G.; Jingfeng, W.; Qihan, S.; Zhaodong, D.; Xingqiao, S. Experimental study on axial compressive performance of HRB635 grade hot-rolled ribbed high-strength reinforced concrete short column. J. Hefei Univ. Technol. Nat. Sci. 2021, 44, 1370–1384. [Google Scholar]
- Yizhu, L.; Shuangyin, C.; Hang, L.; Xiangyong, N.; Denghu, J. Axial compressive behavior of concrete columns with grade 600 MPa reinforcing bars. Eng. Struct. 2018, 172, 497–507. [Google Scholar]
- Yizhu, L. Experimental and theoretical research on mechanical behavior of RC columns with 600MPa reinforcing bars. Southeast Doctoral thesis, Southeast University, Nanjing, China, 2019. [Google Scholar] [CrossRef]
- Khalajestani, M.K.; Parvez, A.; Foster, S.J.; Valipour, H.; McGregor, G. Concentrically and eccentrically loaded high-strength concrete columns with high-strength reinforcement: An experimental study. Eng. Struct. 2021, 248, 113251. [Google Scholar] [CrossRef]
- Yanbo, W.; Ci, S.; Xingyuan, Z.; Guoqiang, L. Experimental research on axial compressive bearing capacity of high-strength concrete filled steel tubular short columns. J. Struc. Eng. 2021, 1–17. [Google Scholar] [CrossRef]
- Yansheng, D.; Dinghui, G.; Zhihua, C.; Zihan, Z.; Xiaodun, W. Behaviors of FRP confined rectangular concrete-filled thin-walled steel tubular stub columns using high-strength materials under axial load. Compos. Struct. 2022, 280, 114915. [Google Scholar] [CrossRef]
- Jiangang, W.; Xia, L.; Zhijing, O.; Baochun, C. Experimental study on axial compressive behavior of circular UHPC filled high-strength steel tube short columns. J. Struct. Eng. 2020, 41, 16–28. [Google Scholar] [CrossRef]
- Yancheng, C.; Meini, S.; Xuerui, C.; Ben, Y. High strength steel square and rectangular tubular stub columns infilled with concrete. J. Constr. Steel Res. 2021, 179, 106536. [Google Scholar] [CrossRef]
- Han, F.; Tak-Ming, C.; Ben, Y. Structural performance of concrete-filled cold-formed high-strength steel octagonal tubular stub columns. Eng. Struct. 2021, 239, 112360. [Google Scholar] [CrossRef]
- Zhu, J.Y.; Chan, T.M. Experimental investigation on octagonal concrete filled steel stub columns under uniaxial compression. J. Constr. Steel Res. 2018, 147, 457–467. [Google Scholar] [CrossRef]
- Ehab, E.; Ben, Y. Eccentrically loaded concrete encased steel composite columns. Thin Wall Struct. 2010, 49, 53–65. [Google Scholar]
- Jun, W.; Wenze, S.; Jinyou, Z.; Yu, S.; Xinran, W. Experimental study on eccentric loaded high strength H-section steel reinforced concrete composite column. J. Struct. Eng. 2021, 1–10. [Google Scholar] [CrossRef]
- Lai, B.; Liew, J.R. Axial-moment interaction of high strength concrete encased steel composite columns: Design recommendation. J. Constr. Steel Res. 2020, 175, 106370. [Google Scholar] [CrossRef]
- Li, S.; Liew, J.R.; Xiong, M.-X.; Lai, B.-L. Experimental investigation on fire resistance of high-strength concrete encased steel composite columns. Fire Safety J. 2021, 121, 103273. [Google Scholar] [CrossRef]
- Li, S.; Liew, J.R.; Xiong, M.-X. Fire performance of composite columns made of high strength steel and concrete. J. Constr. Steel Res. 2021, 181, 106640. [Google Scholar] [CrossRef]
- Yiting, Y.; Zhaoxin, H.; Guoqiang, L.; Chao, G.; Suwen, C. Study on mechanical properties of Q460 high-strength SRC circular column under axial compression. Steel Constr. 2016, 31, 24–31. [Google Scholar]
- Yiting, Y.; Zhaoxin, H.; Chao, G.; Yan, W. Analysis on influencing factors of seismic performance for high-strength steel reinforced concrete columns. Prog. Steel Build. Struct. 2018, 20, 11–21. [Google Scholar]
- ANSI/AISC360-2016. Specification for Structural Steel Buildings; AISC Committee on Specifications: Chicago, IL, USA, 2016. [Google Scholar]
- Eurocode 4: Design of Composite Steel and Concrete Structures Part 1-1: General rules for buildings: EN 1994-1-1:2004; European Committee for Standardization: Brussels, Belgium, 2004.
- JGJ138-2016. Code for Design of Composite Structures; Architecture and Building Press: Beijing, China, 2016. [Google Scholar]
- GB/T228-2010. Chinese Standard for Metallic Materials-Tensile Testing at Ambient Temperature; Architecture and Building Press: Beijing, China, 2010. [Google Scholar]
- GB/T50152-2012. Standard for Test Methods of Concrete Structures; Architecture and Building Press: Beijing, China, 2012. [Google Scholar]
- Duarte, A.P.C.; Silva, B.A.; Silvestre, N.; de Brito, J.; Júlio, E.; Castro, J.M. Experimental study on short rubberized concrete-filled steel tubes under cyclic loading. Compos. Struct. 2016, 136, 394–404. [Google Scholar] [CrossRef]
- Jiuru, T. Seismic Resistance of Joints in Reinforced Concrete Frames; Southeast University Press: Nanjing, China, 1989. [Google Scholar]
- Eurocode 3: Design of steel structures-Part 1-1: General Rules and Rules for Buildings: EN 1993-1-1:2005; European Committee for Standardization: Brussels, Belgium, 2005.
- Shengping, C.; Liang, N.; Yingfa, L.; Xiao, T. Experimental study on the effect of steel fiber on the axial compressive properties of concrete. J. Hubei Univ. Technol. 2020, 35, 97–101. [Google Scholar]
- Liang, N. Research on Uniaxial Compression Performance and Constitutive Relationship of Steel Fiber Reinforced Concrete; Hubei University of Technology: Wuhan, China, 2020. [Google Scholar]
- Xiaofei, W.; Xiaohu, Z.; Pingyang, W.; Licheng Wu Jing, L. Numerical Modeling Method of Steel Fiber Reactive Powder Concrete. J. Build. Struct. 2015, 36, 340–345. [Google Scholar]
- Ehab, E.; Ben, Y. Numerical simulation of concrete encased steel composite columns. J. Constr. Steel Res. 2011, 67, 211–222. [Google Scholar]
- Mander, J.B.; Priestley, M. Theoretical Stress-Strain Model for Confined Concrete. J. Struct. Eng. 1988, 114, 1804–1826. [Google Scholar] [CrossRef] [Green Version]
- Xianzhong, Z.; Fuping, W. Theoretical Study on Confinement Mechanism and Stress-strain Model for Steel Confined Concrete in SRC Columns. Eng. Plast. Appl. 2018, 35, 36–46. [Google Scholar]
- Chengchih, C.; Nanjiao, L. Analytical model for predicting axial capacity and behavior of concrete encased steel composite stub columns. J. Constr. Steel Res. 2006, 62, 424–433. [Google Scholar]
- Junjie, F.; Guansheng, Y. Uniaxial compressive behavior of hook-end steel and macro-polypropylene hybrid fibers reinforced recycled aggregate concrete. Constr. Build. Mater. 2021, 304, 124559. [Google Scholar]
- Langfei, G.; Jianlan, Z.; Yaliang, C. Study on Axial Compression Stress-strain Full Curves of High Strength Steel Fiber Reinforced Concrete. J. Fuzhou Univ. Nat. Sci. Ed. 2005, 4, 501–503. [Google Scholar]
- Xuming, G. Research on the Performance of UHPC with Steel Fiber; HuNan University: Changsha, China, 2013. [Google Scholar]
- Seongcheol, L.; Jounghwan, O. Compressive Behavior of Fiber-Reinforced Concrete with End-Hooked Steel Fibers. Materials 2015, 8, 1442–1458. [Google Scholar]
- Shunbo, Z.; Mingshuang, Z.; Xiaoyan, Z.; Zhenjing, P.; Tinghua, H. Study on Complete Stress-strain Curves of Steel Fiber Reinforced Lightwight Aggregate Concrete under Uniaxial Compression. J. Build. Struct. 2019, 40, 181–190. [Google Scholar]
- Guojie, X.; Chuanlin, W.; Jiamiao, Z.; Zeping, L.; Tengteng, Z.; Yuxuan, Z. Influence of Steel Fiber Shape on the Performance of High-performance Concrete. Acta Mater. Composit. Sin. 2021, 38, 4313–4324. [Google Scholar] [CrossRef]


| Author | Strength/MPa | Type | Number of Specimen | Method | Main Conclusion |
|---|---|---|---|---|---|
| Gu [23] | 459–737 | HSRC | 12 | experiment |
|
| Li [24] | 437–629 | 9 |
| ||
| Li [25] | 437–629 | 9 |
| ||
| Mohsen [26] | 520–670 | 39 |
| ||
| Wang [27] | 522–906 | CFHSST | 13 | experiment |
|
| Du [28] | 724–741 | 10 |
| ||
| Wei [29] | 359–1153 | 15 | experiment and simulation |
| |
| Cai [30] | 629–1022 | 34 |
| ||
| Fang [31] | 760–782 | 15 |
| ||
| Ehab [33] | 275–690 | HSSRC | 54 | simulation |
|
| Wang [34] | 276–774 | 12 | experiment |
| |
| Lai [35] | 590–646 | 12 |
| ||
| Li [36] | 439–888 | 8 |
| ||
| Li [37] | 439–888 | 5 | experiment and simulation |
| |
| Yang [38] | 496–530 | 2 |
| ||
| Yang [39] | 517 | 1 |
|
| Specimen Designation | Steel Grade | Steel Ratio to Concrete | Dimensions of Steel (b × h × t1 × t2) | Stirrups Spacing | Section Form of Steel |
|---|---|---|---|---|---|
| A1Q4S3-H(A1) | Q460 | 3.13% | 100 × 100 × 5 × 5 | 70 | H |
| A2Q4S5-H(A2) | Q460 | 5.13% | 100 × 106 × 8 × 5 | 70 | H |
| A3Q4S6-H(A3) | Q460 | 6.20% | 110 × 106 × 8 × 8 | 70 | H |
| A4Q4S6-+(A4) | Q460 | 6.20% | 50 × 106 × 8 × 5 | 70 | + |
| A5Q6S3-H(A5) | Q690 | 3.13% | 100 × 100 × 5 × 5 | 70 | H |
| A6Q6S5-H(A6) | Q690 | 5.13% | 100 × 106 × 8 × 5 | 70 | H |
| A7Q6S6-H(A7) | Q690 | 6.20% | 100 × 106 × 8 × 8 | 70 | H |
| A8Q6S6-+(A8) | Q690 | 6.20% | 50 × 106 × 8 × 5 | 70 | + |
| A9Q2S3-H(A9) | Q235 | 3.13% | 100 × 100 × 5 × 5 | 70 | H |
| A10Q2S5-H(A10) | Q235 | 5.13% | 100 × 106 × 8 × 5 | 70 | H |
| A11Q2S6-H(A11) | Q235 | 6.20% | 110 × 106 × 8 × 8 | 70 | H |
| A12Q2S6-+(A12) | Q235 | 6.20% | 50 × 106 × 8 × 5 | 70 | + |
| Grade | Yield Strength | Ultimate Strength | Elongation Ratio | ||
|---|---|---|---|---|---|
| fy/MPa | Cv | fu/MPa | Cv | δ/% | |
| Q235 | 291.0 | 5.4% | 453.1 | 4.3% | 32.3% |
| Q460 | 469.1 | 7.9% | 557.3 | 8.3% | 25.0% |
| Q690 | 735.1 | 1.1% | 822.3 | 0.9% | 19.2% |
| HRB400 | 443.2 | 4.5% | 594.9 | 3.7% | 27.8% |
| Specimens | Test Results | Simulation Results | Calculation Results | |||||||||
|---|---|---|---|---|---|---|---|---|---|---|---|---|
| Bearing CapacityNu/kN | Bearing CapacityNa/kN | Simulation Error | AISC360-16 | EN1994-1-1:2004 | JGJ138-2016 | |||||||
| Nuca/kN | Error Rate | Nucc/kN | Error Rate | Nucj/kN | Error Rate | |||||||
| Single | Average | Single | Average | Single | Average | |||||||
| A1Q4S3-H | 2514.0 | 2457.3 | −2.3% | 2241.9 | 12.1% | 9.1% | 2307.8 | 8.9% | 6.15% | 2141.2 | 17.4% | 14.9% |
| A2Q4S5-H | 2845.6 | 2787.9 | −2.0% | 2581.2 | 10.2% | 2654.5 | 7.2% | 2452.2 | 16.0% | |||
| A3Q4S6-H | 2987.5 | 3032.5 | 1.5% | 2807.7 | 6.4% | 2884.7 | 3.6% | 2658.6 | 12.4% | |||
| A4Q4S6-+ | 2961.2 | 3010.4 | 1.7% | 2753.9 | 7.5% | 2822.7 | 4.9% | 2602.8 | 13.8% | |||
| A5Q6S3-H | 2585.6 | 2635.3 | 1.9% | 2651.6 | −2.5% | −5.8% | 2744.6 | −5.8% | −8.9% | 2534.2 | 2.0% | −0.93% |
| A6Q6S5-H | 2938.5 | 2988.1 | 1.7% | 3055.4 | −3.8% | 3159.0 | −7.0% | 2906.2 | 1.1% | |||
| A7Q6S6-H | 3067.7 | 2976.7 | −3.0% | 3346.5 | −8.3% | 3456.8 | −11.3% | 3173.5 | −3.3% | |||
| A8Q6S6-+ | 3060.6 | 3126.5 | 2.2% | 3352.4 | −8.7% | 3455.3 | −11.4% | 3172.2 | −3.5% | |||
| A9Q2S3-H | 2332.9 | 2327.2 | −0.2% | 2025.5 | 15.2% | 12.8% | 2079.0 | 12.2% | 10.2% | 1935.2 | 20.5% | 18.73% |
| A10Q2S5-H | 2468.9 | 2407.1 | −2.5% | 2212.5 | 11.6% | 2266.1 | 9.0% | 2102.6 | 17.4% | |||
| A11Q2S6-H | 2601.0 | 2559.9 | −1.6% | 2339.8 | 11.2% | 2392.9 | 8.7% | 2216.0 | 17.4% | |||
| A12Q2S6-+ | 2623.3 | 2546.3 | −2.9% | 2318.8 | 13.1% | 2367.3 | 10.8% | 2193.0 | 19.6% | |||
| Specimens | Δy/mm | Ey | Δu/mm | Eu | μ |
|---|---|---|---|---|---|
| A1Q4S3-H | 3.70 | 4660.9 | 4.85 | 7415.84 | 1.59 |
| A2Q4S5-H | 3.89 | 5230.2 | 5.96 | 10,790.8 | 2.06 |
| A3Q4S6-H | 4.15 | 6115.6 | 8.35 | 17,757.3 | 2.90 |
| A4Q4S6-+ | 4.16 | 6163.9 | 15.06 | 34,940.8 | 5.67 |
| A5Q6S3-H | 3.76 | 5138.5 | 6.48 | 11,783.1 | 2.29 |
| A6Q6S5-H | 3.97 | 5869.2 | 8.53 | 18,357.5 | 3.13 |
| A7Q6S6-H | 4.16 | 6539.6 | 14.37 | 41,312.8 | 6.32 |
| A8Q6S6-+ | 4.18 | 6637.4 | 13.83 | 44,051.8 | 6.64 |
| A9Q2S3-H | 3.42 | 4017.9 | 3.83 | 4936.8 | 1.23 |
| A10Q2S5-H | 3.58 | 4422.0 | 4.88 | 7526.1 | 1.70 |
| A11Q2S6-H | 3.84 | 5009.8 | 5.51 | 9190.1 | 1.83 |
| A12Q2S6-+ | 3.82 | 5144.2 | 6.81 | 12,382.4. | 2.41 |
| Type | fsf/MPa | ρf/% | df/mm | lf/mm | lf/df |
|---|---|---|---|---|---|
| Flat | 400 | 1.0 | 0.8 | 60 | 75 |
Publisher’s Note: MDPI stays neutral with regard to jurisdictional claims in published maps and institutional affiliations. |
© 2022 by the authors. Licensee MDPI, Basel, Switzerland. This article is an open access article distributed under the terms and conditions of the Creative Commons Attribution (CC BY) license (https://creativecommons.org/licenses/by/4.0/).
Share and Cite
Wang, J.; Wang, X.; Duan, Y.; Su, Y.; Yi, X. The Investigation on Mechanical Performances of High-Strength Steel Reinforced Concrete Composite Short Columns under Axial Load. Materials 2022, 15, 329. https://doi.org/10.3390/ma15010329
Wang J, Wang X, Duan Y, Su Y, Yi X. The Investigation on Mechanical Performances of High-Strength Steel Reinforced Concrete Composite Short Columns under Axial Load. Materials. 2022; 15(1):329. https://doi.org/10.3390/ma15010329
Chicago/Turabian StyleWang, Jun, Xinran Wang, Yuxin Duan, Yu Su, and Xinyu Yi. 2022. "The Investigation on Mechanical Performances of High-Strength Steel Reinforced Concrete Composite Short Columns under Axial Load" Materials 15, no. 1: 329. https://doi.org/10.3390/ma15010329
APA StyleWang, J., Wang, X., Duan, Y., Su, Y., & Yi, X. (2022). The Investigation on Mechanical Performances of High-Strength Steel Reinforced Concrete Composite Short Columns under Axial Load. Materials, 15(1), 329. https://doi.org/10.3390/ma15010329