
Image Analysis of Surface Porosity Mortar Containing Processed Spent Bleaching Earth


 , , ,
, , , 
 , , and
Abstract
1. Introduction
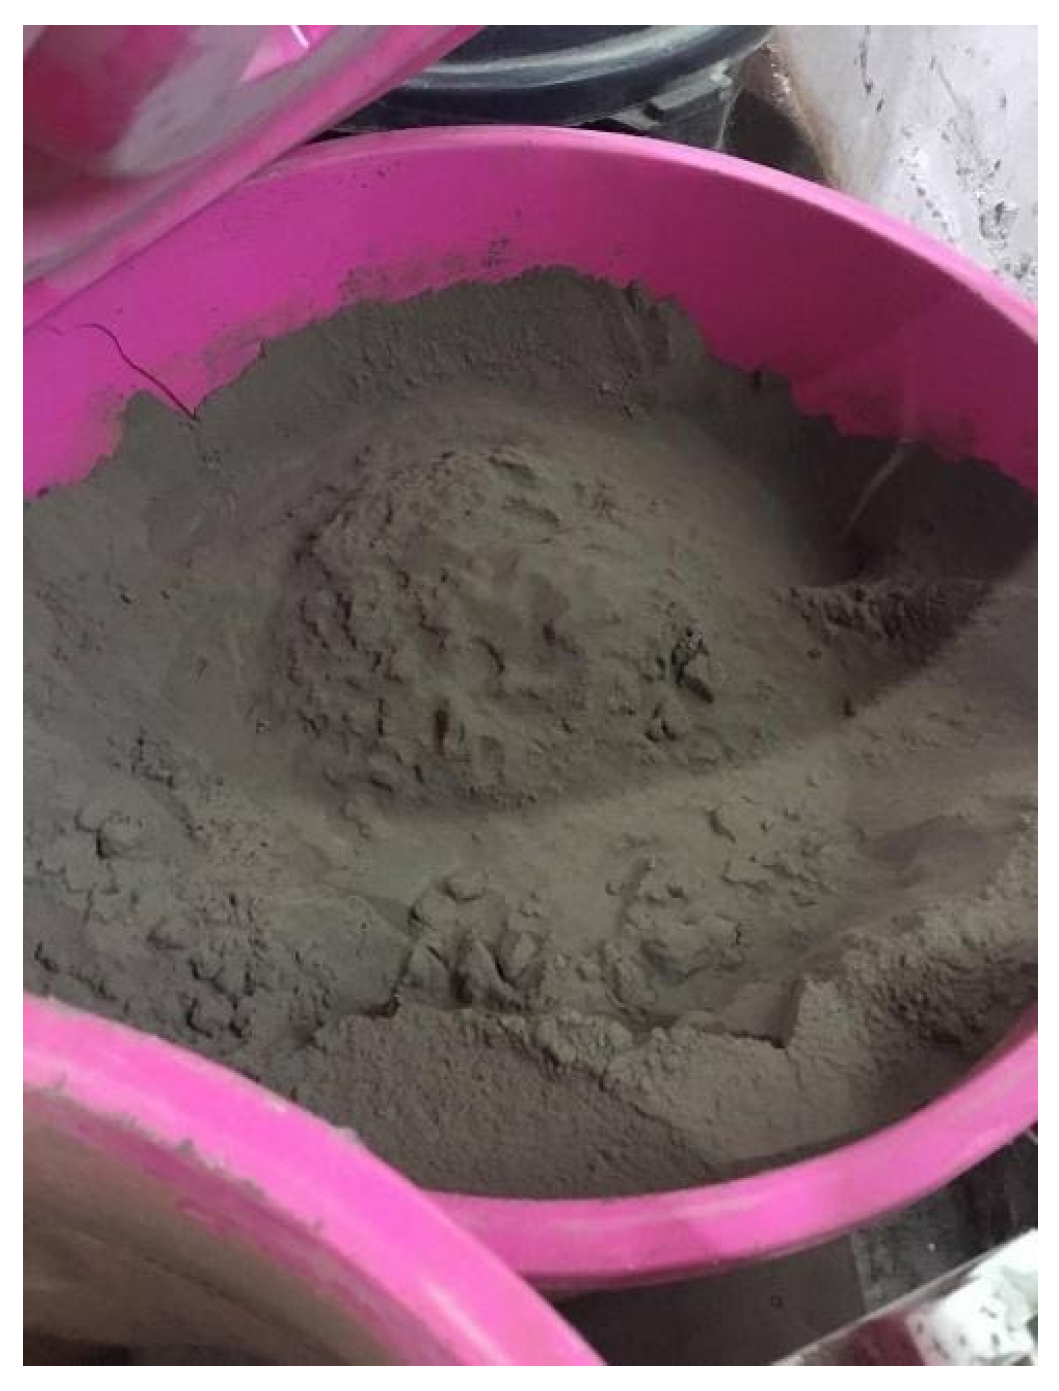
2. Materials and Methods
3. Experimental Work
3.1. Mixing Proportion, Casting, and Curing
3.2. Flow Table Test
3.3. Compressive Strength
3.4. Water Absorption
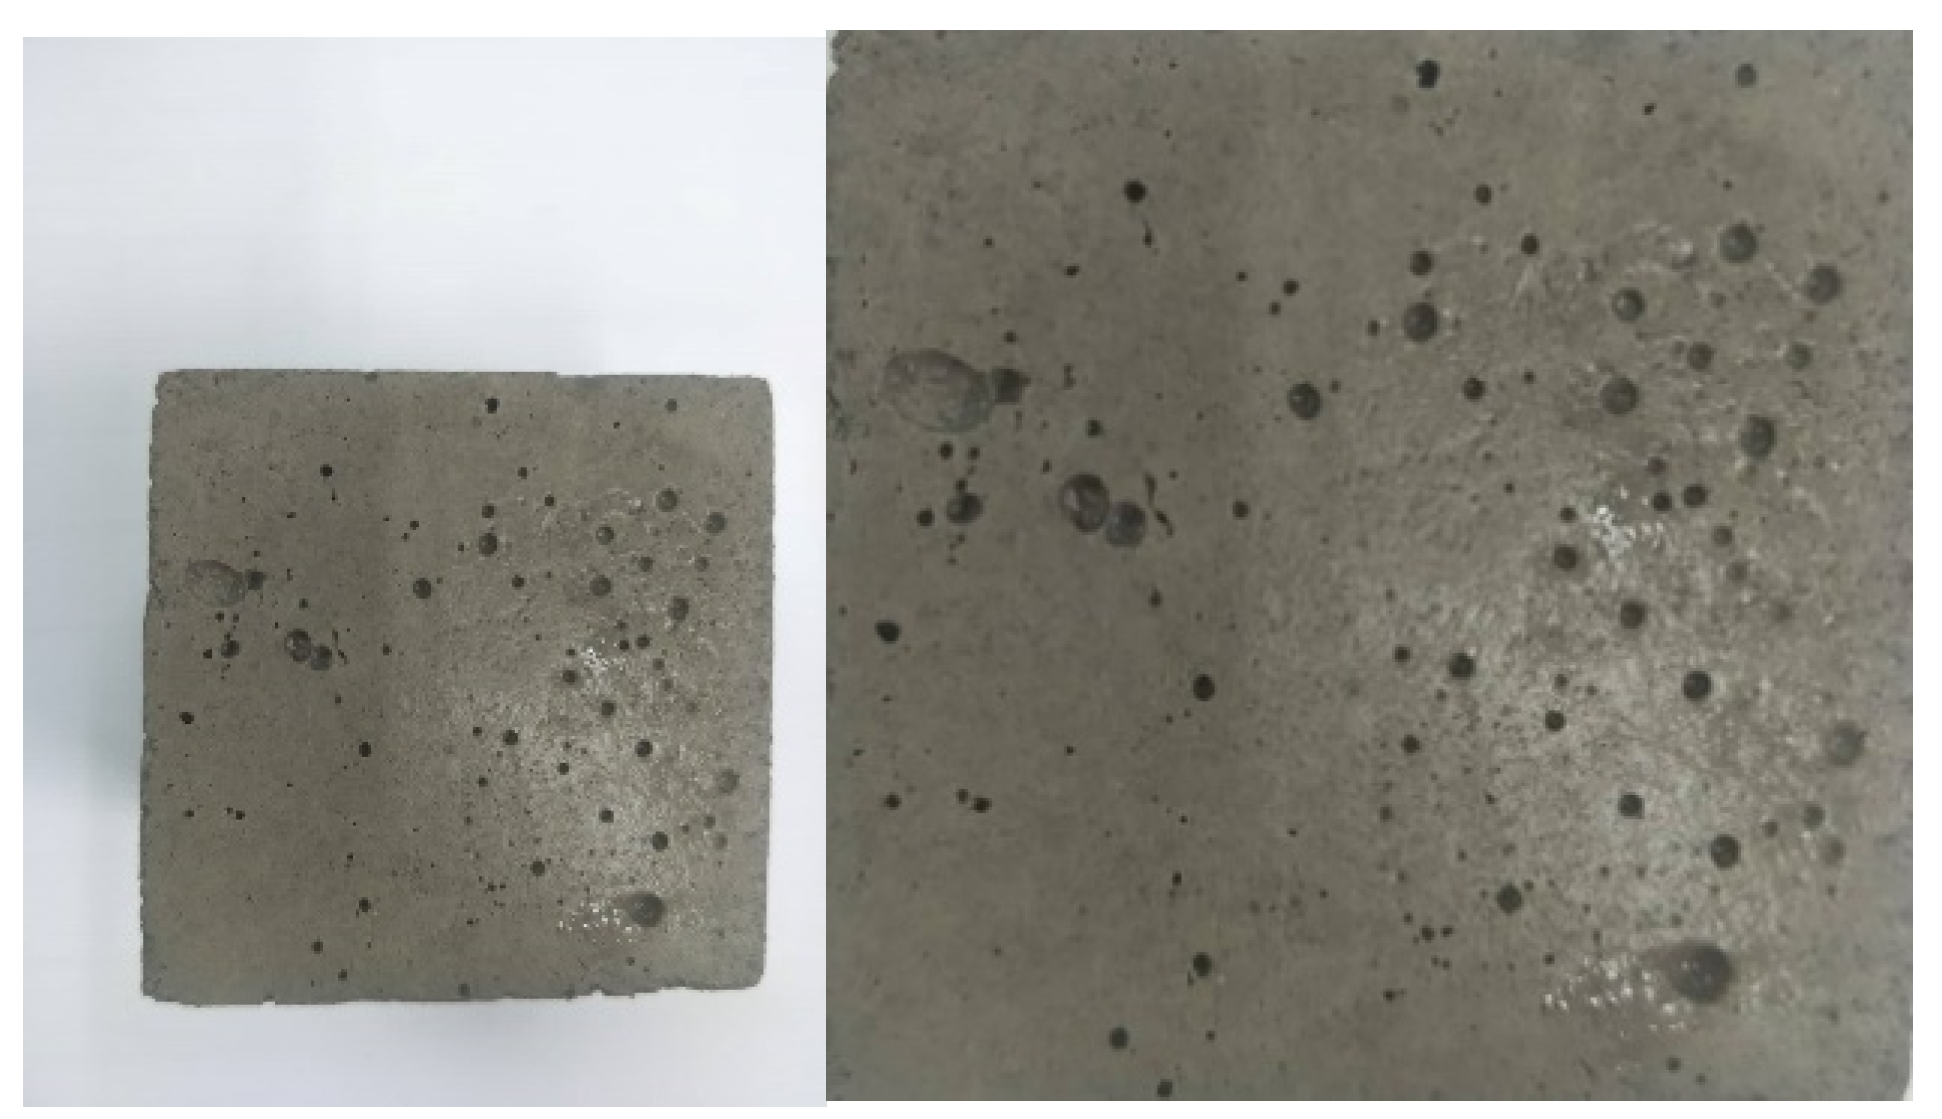
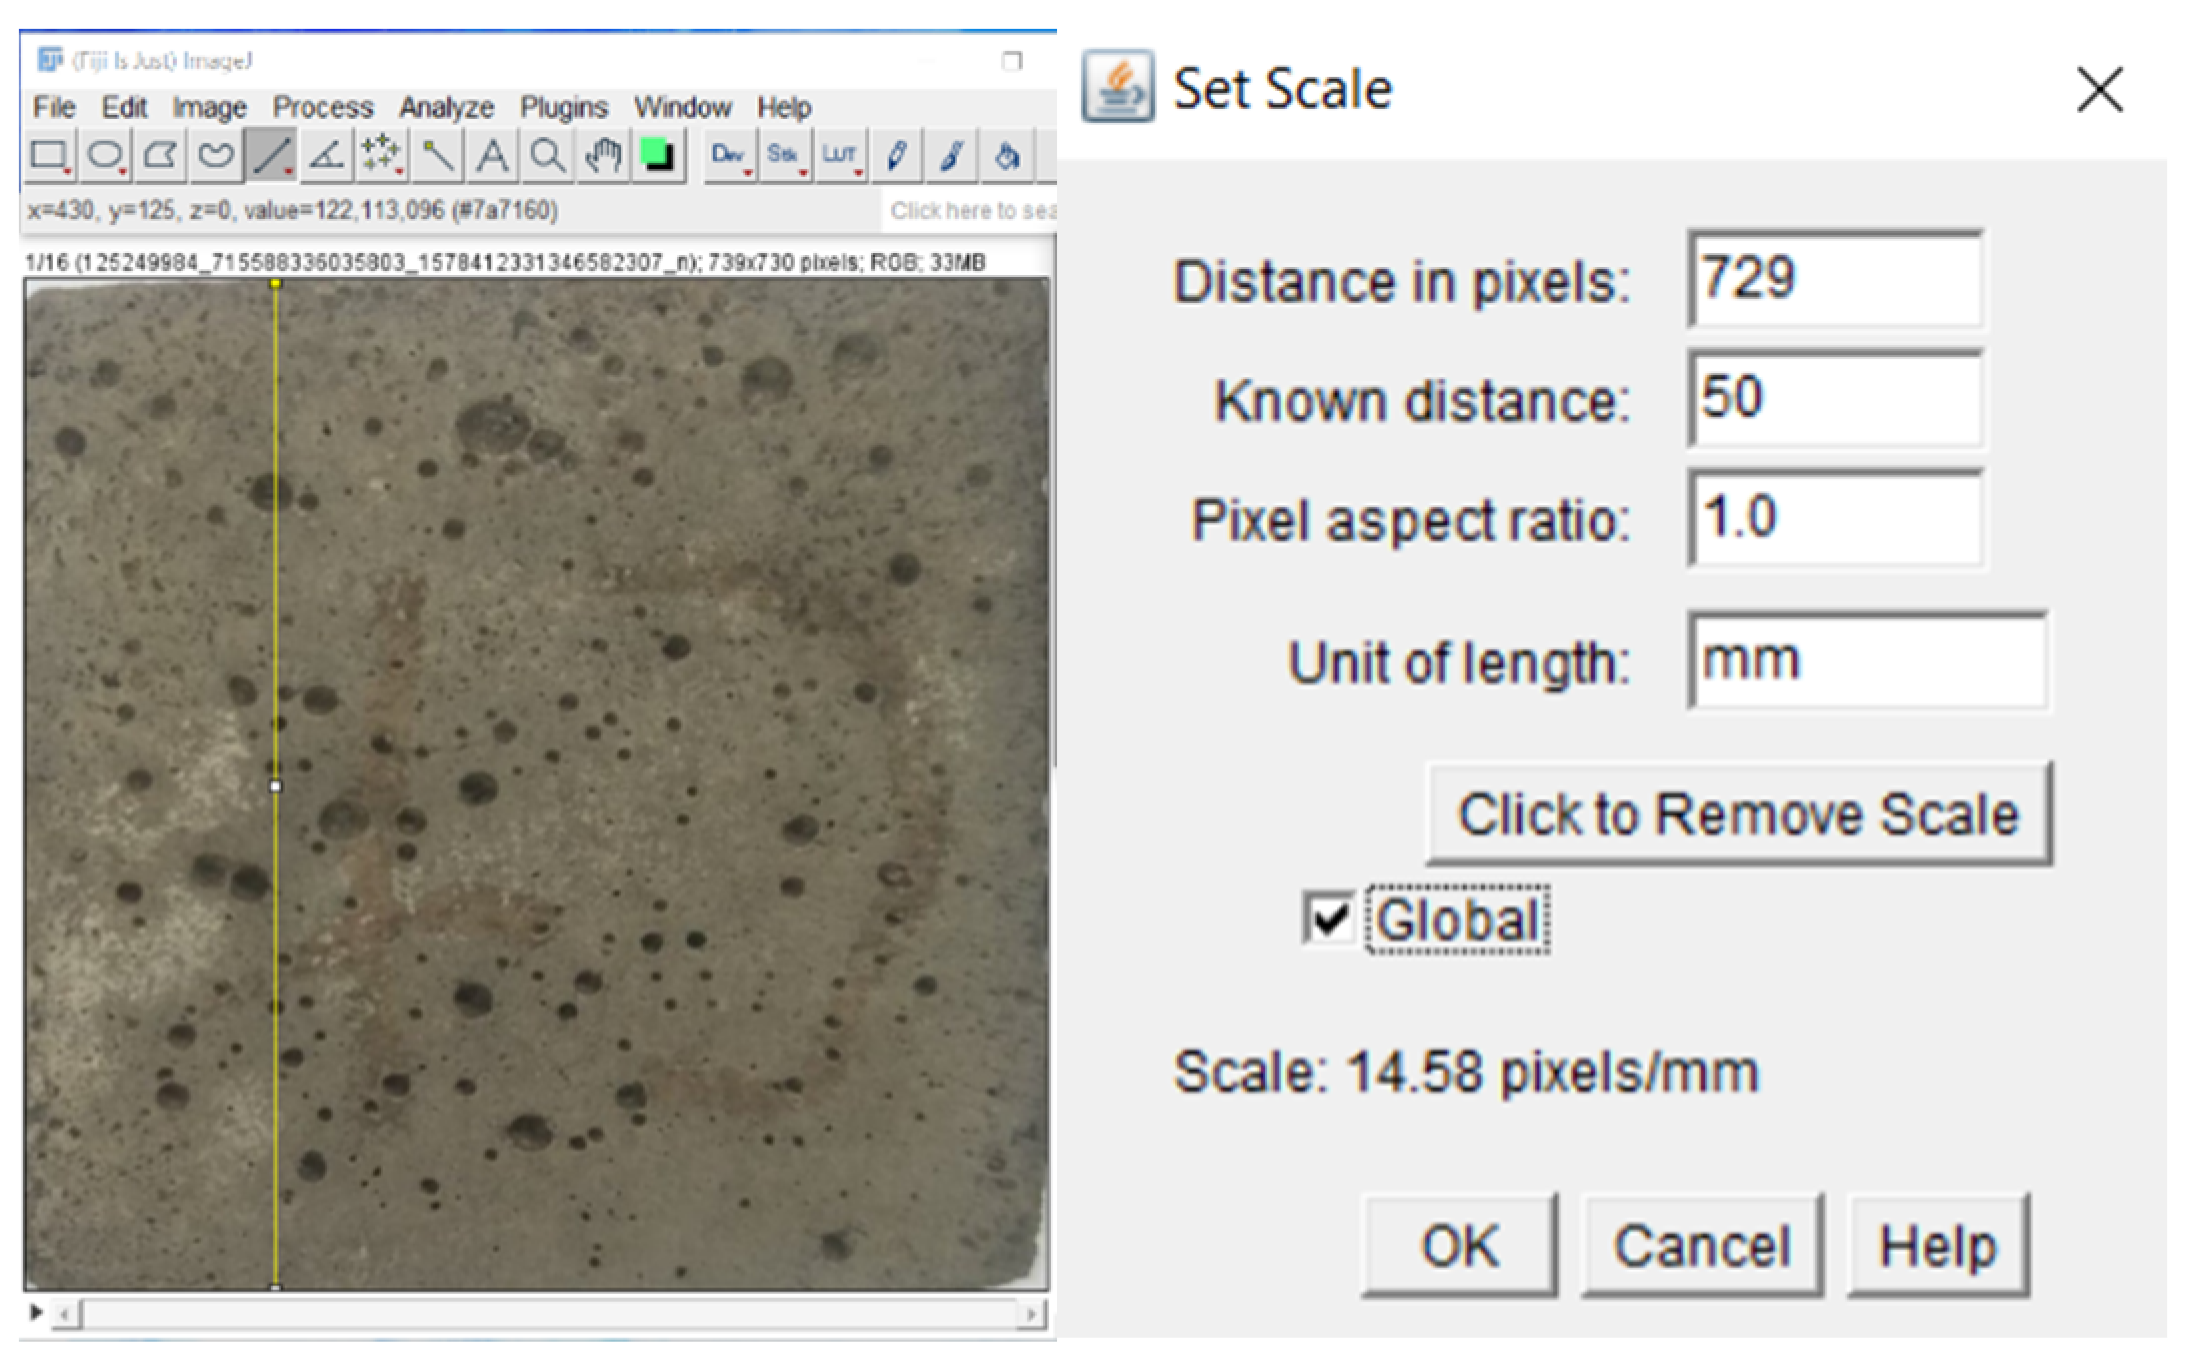
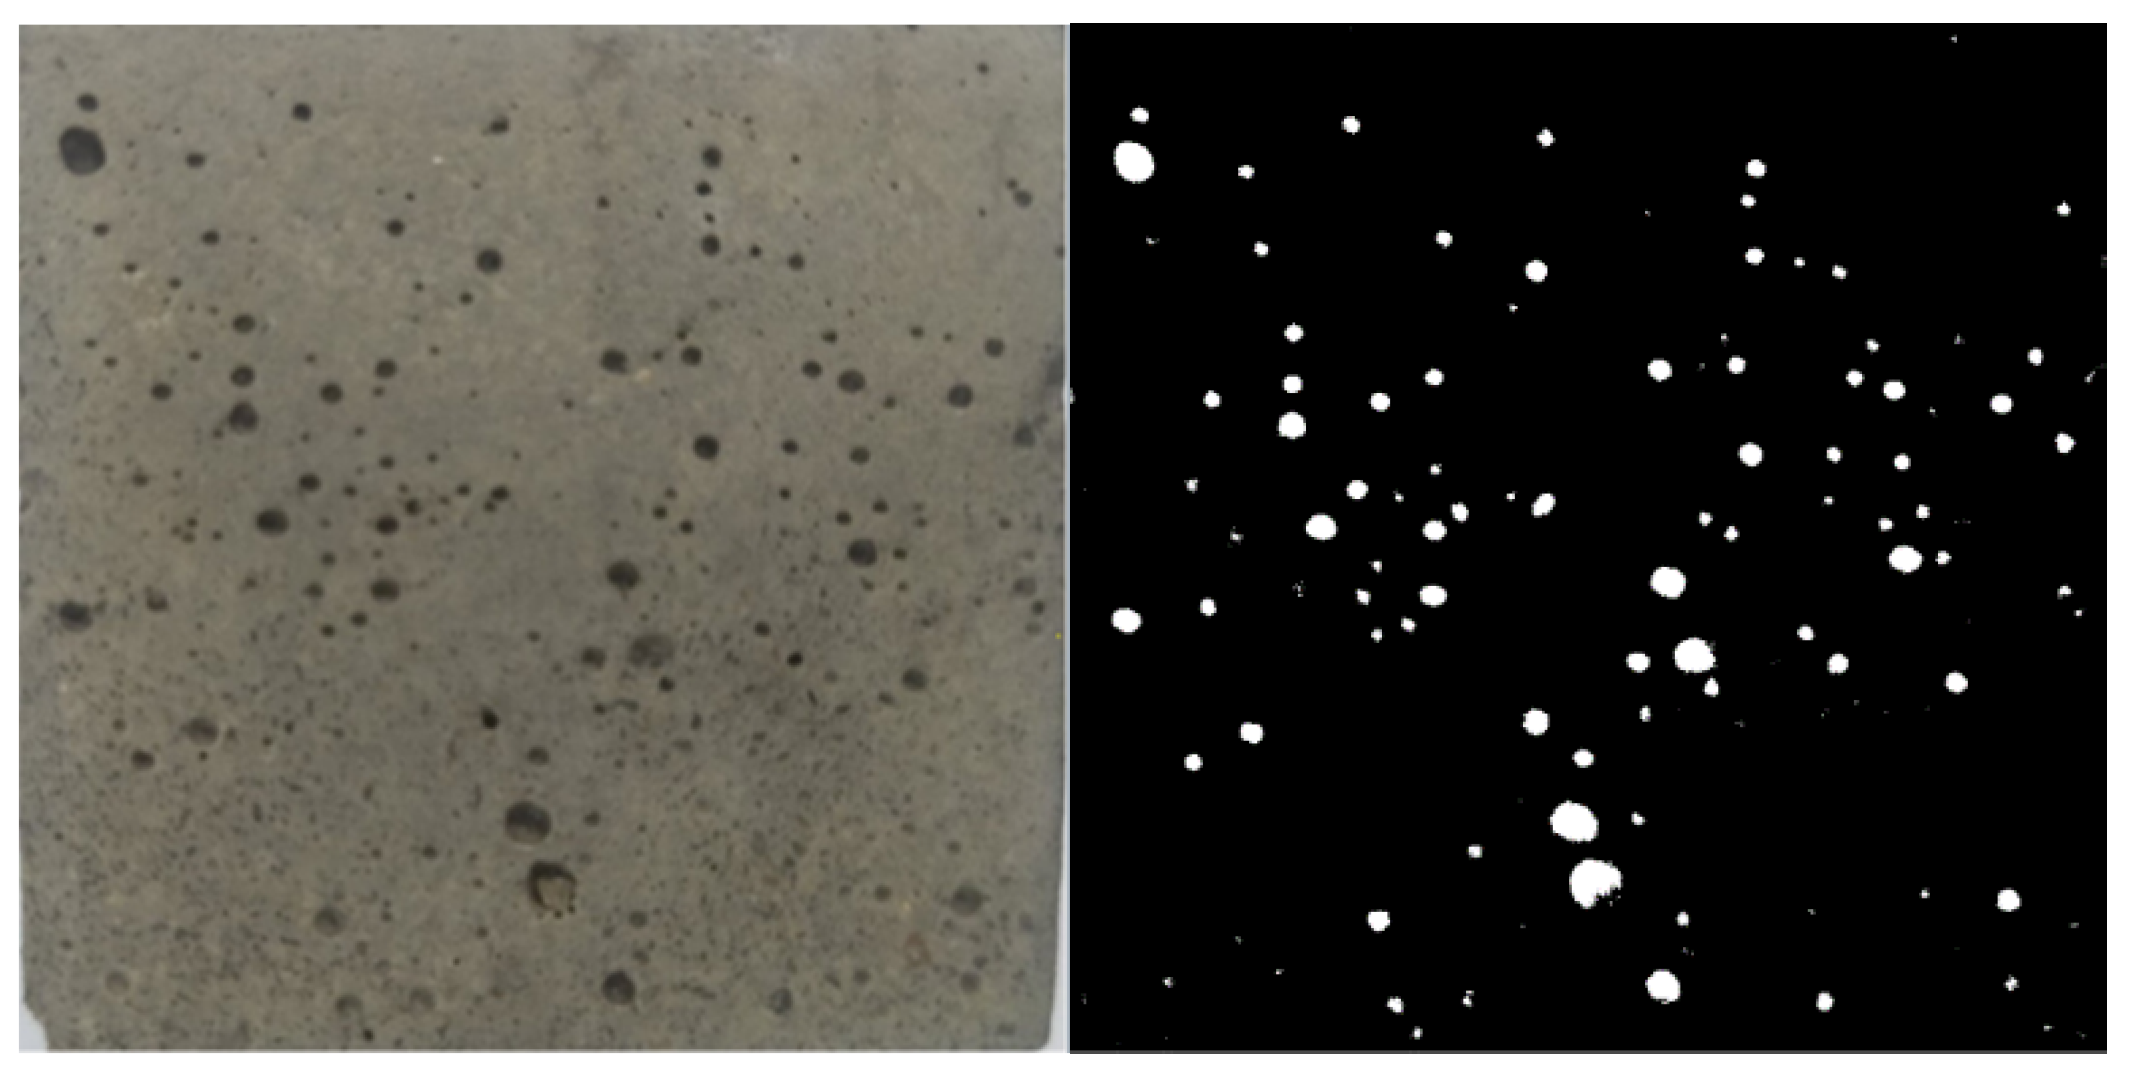
3.5. Surface Porosity
4. Results and Discussion
4.1. Flow Table Test
4.2. Compressive Strength
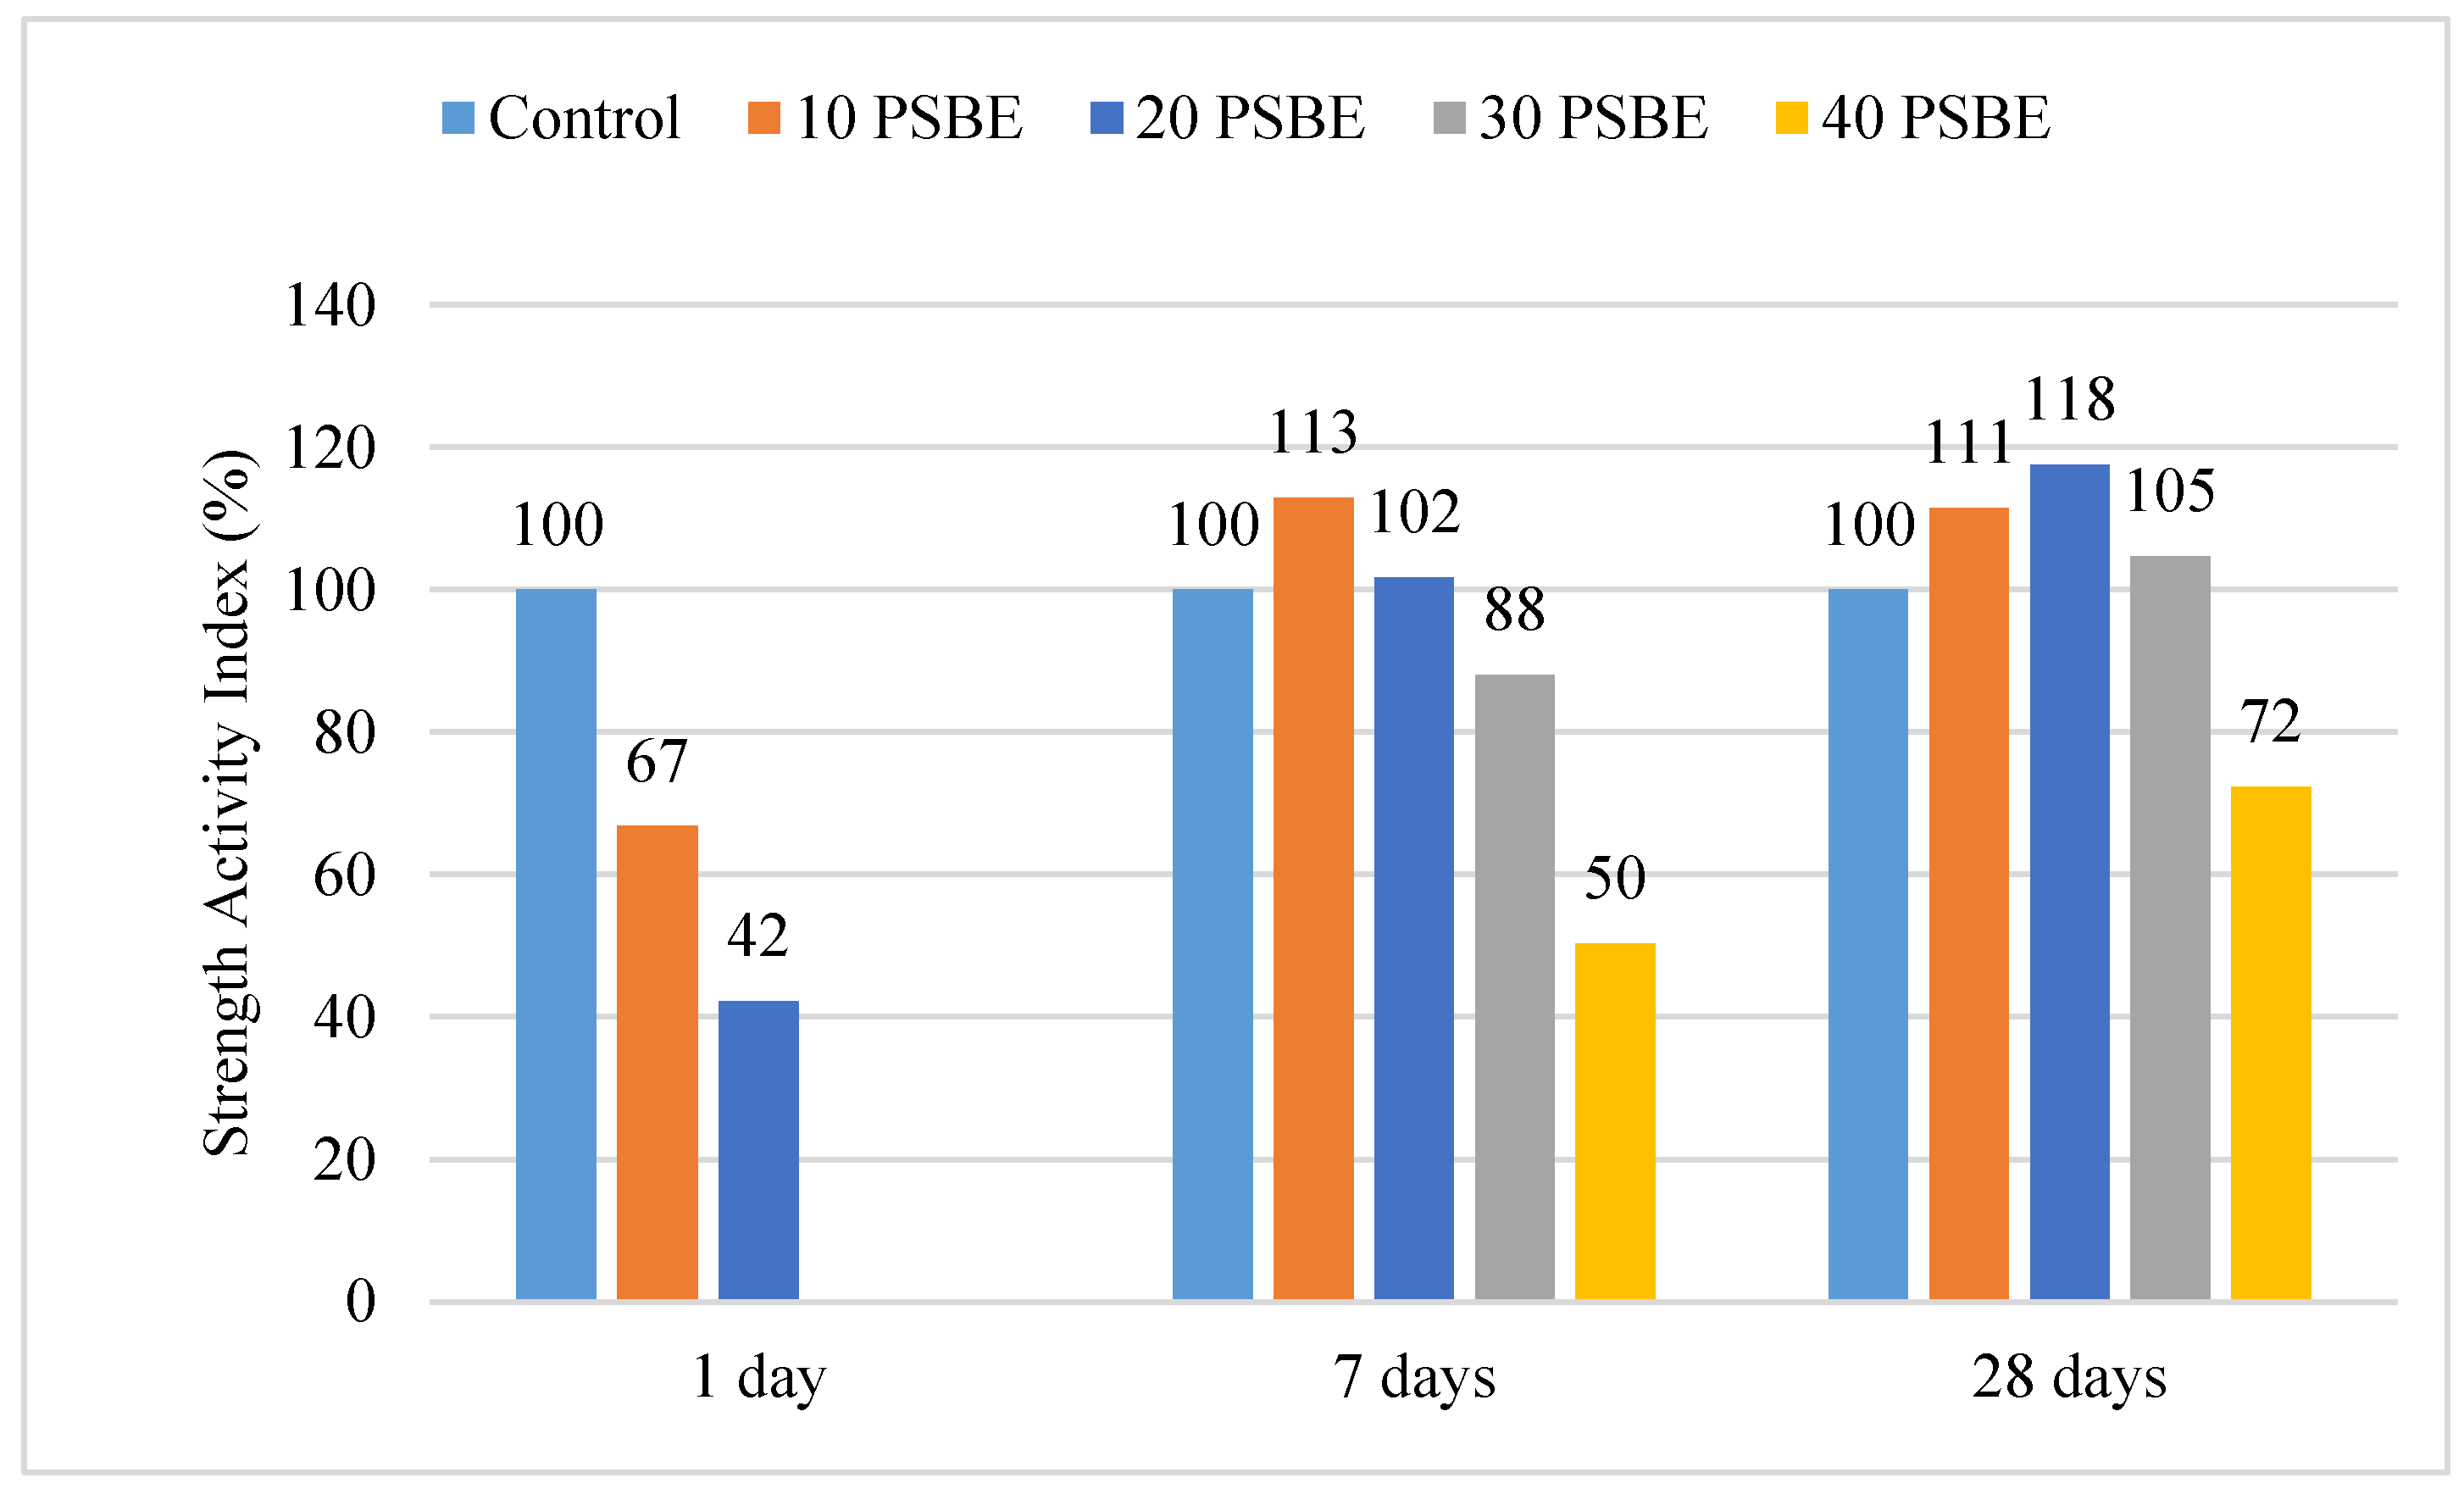
4.3. Compressive Strength Activity Index
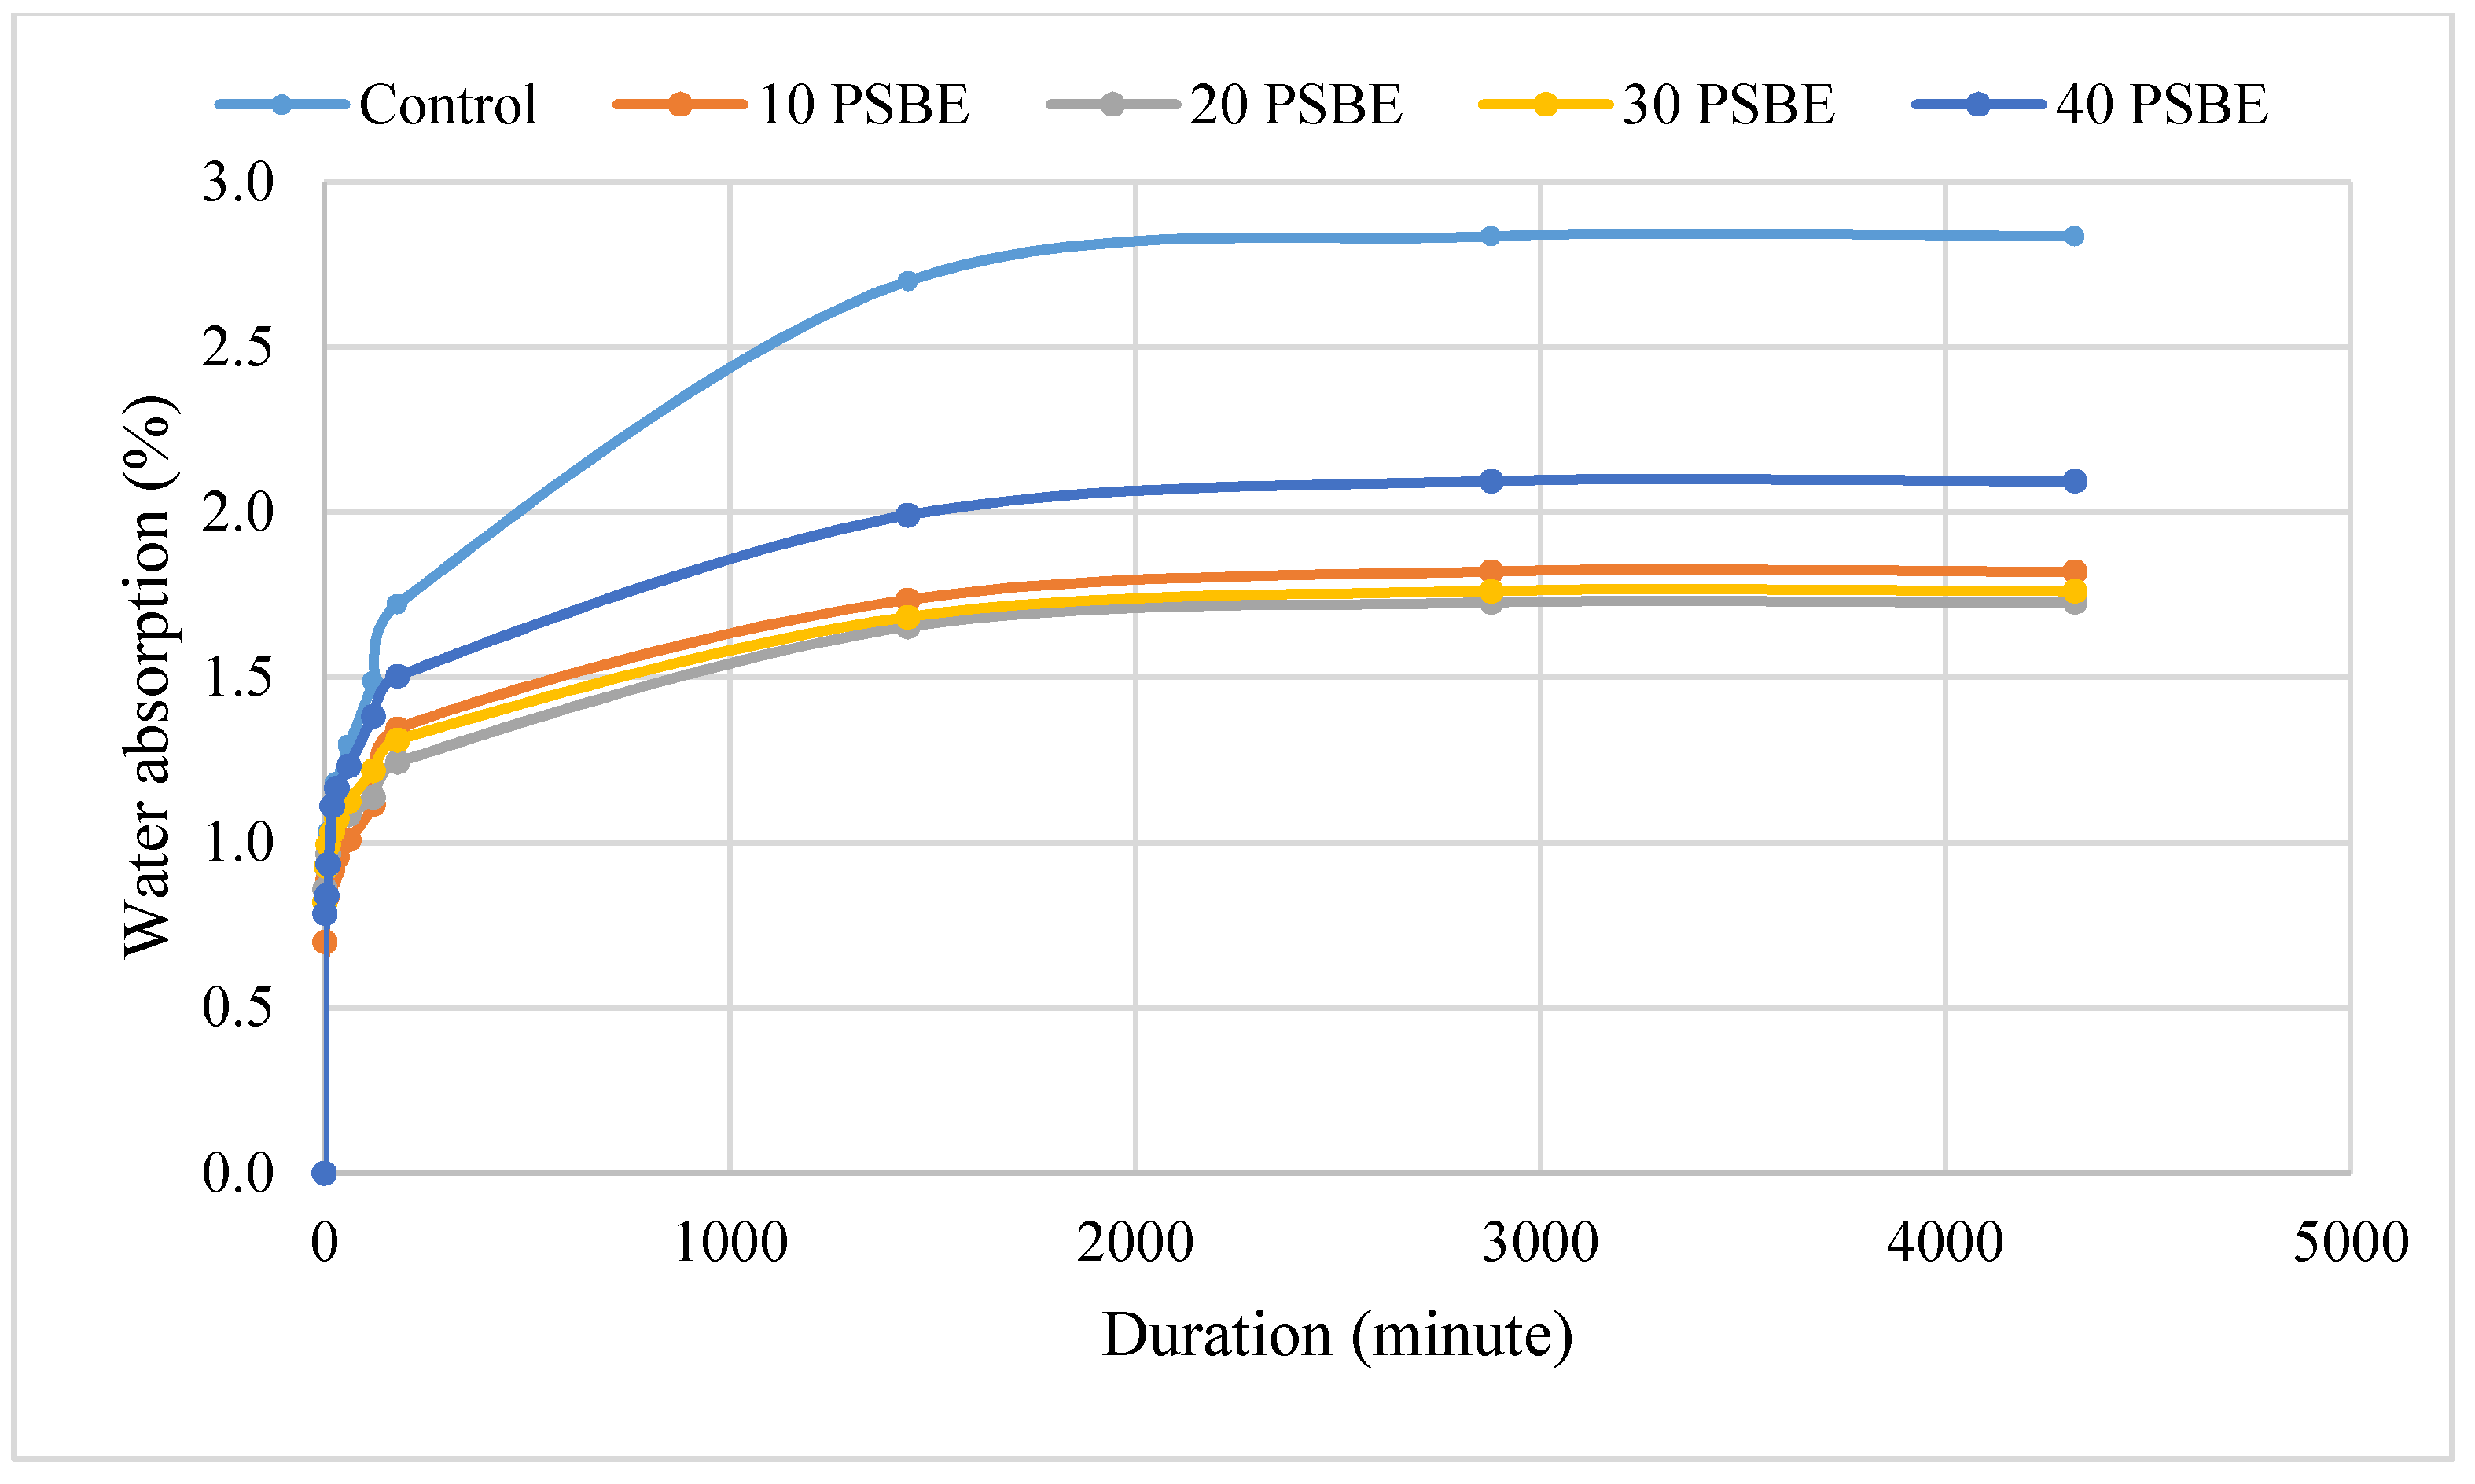
4.4. Water Absorption
4.5. Surface Porosity
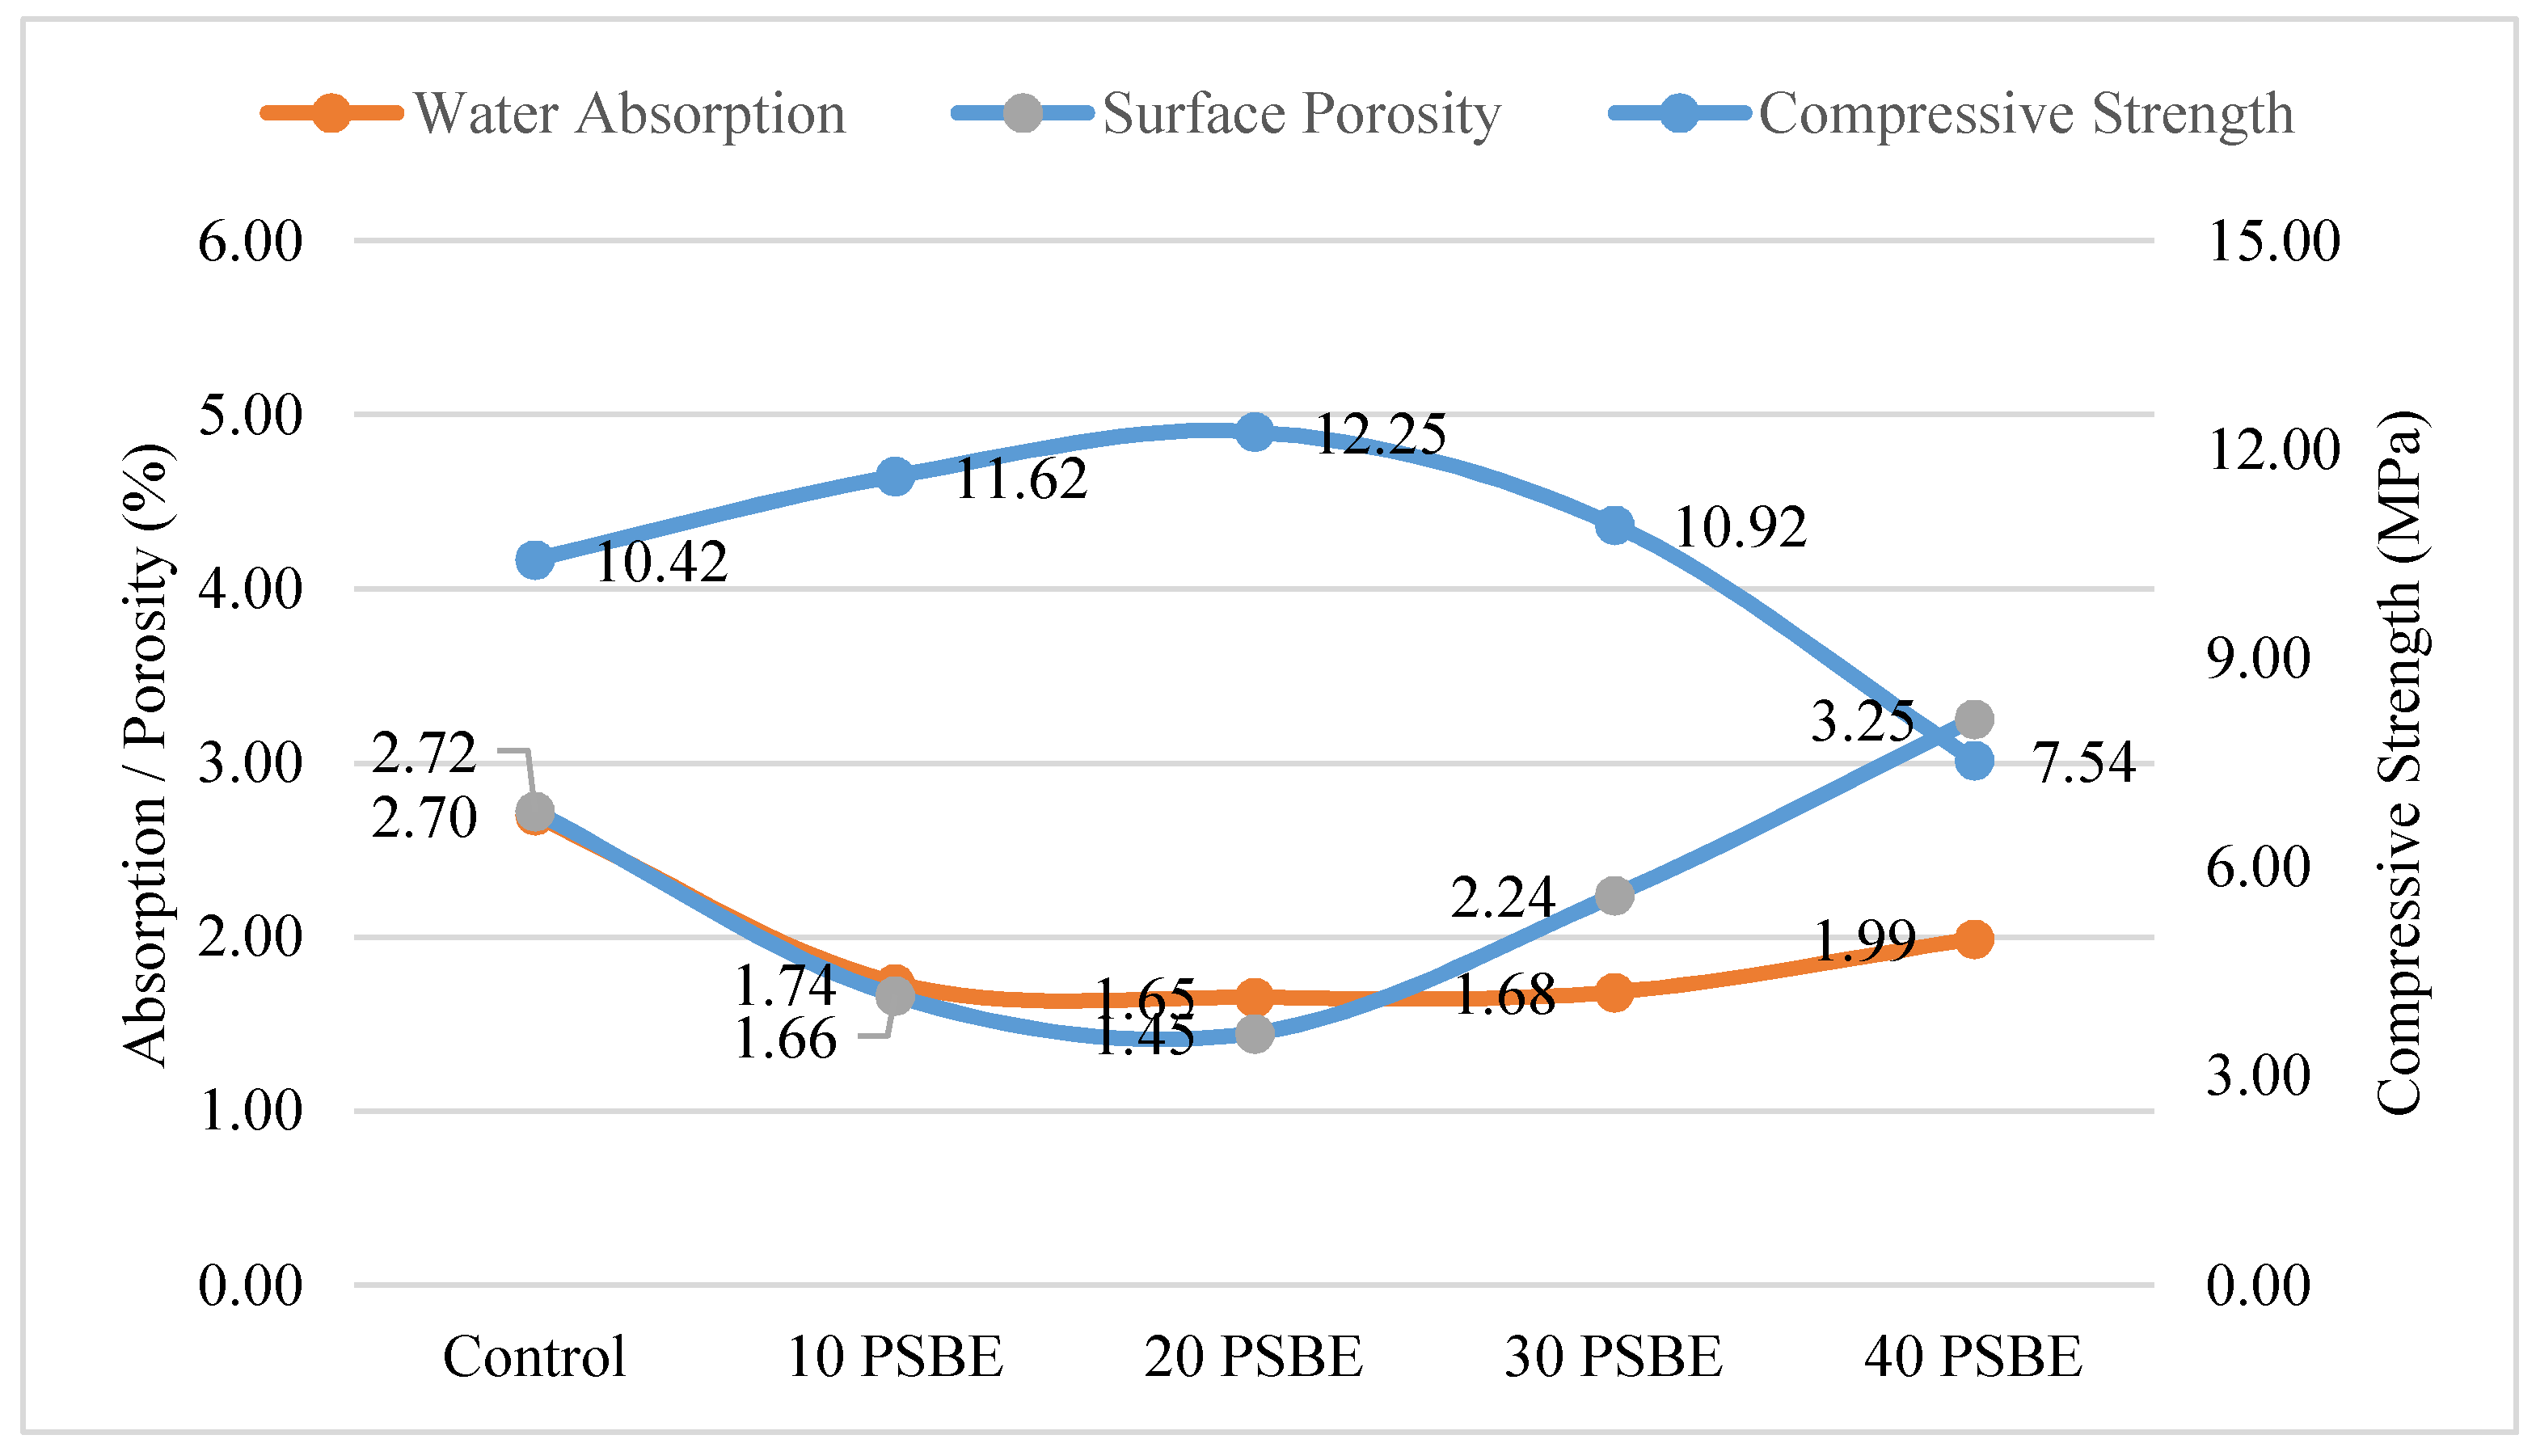
4.6. Correlation of Surface Porosity with Mortar Properties
4.7. Result Discussion
5. Conclusions
6. Codes and Standards
- MS EN 197-1:2014; Cement—Part 1: Composition, Specifications and Conformity Criteria for Common Cements. Department of Standards Malaysia: Selangor, Malaysia, 2014.
- ASTM C618-19; Standard Specification for Coal Fly Ash and Raw or Calcined Natural Pozzolan for Use in Concrete. ASTM International: West Conshohocken, PA, USA, 2019.
- ASTM C1329-05; Standard Specification for Mortar Cement. ASTM International: West Conshohocken, PA, USA, 2005.
- ASTM C1437-15; Standard Test Method for Flow of Hydraulic Cement Mortar. ASTM International: West Conshohocken, PA, USA, 2015.
- BS EN 12390-3:2009; Testing Hardened Concrete—Compressive Strength of Test Specimens. British Standards Institution: London, UK, 2011.
- BS 1881-122:2011; Testing Concrete—Method for Determination of Water Absorption. British Standards Institution: London, UK, 2011.
- ASTM C311/C311M-18; Standard Test Methods for Sampling and Testing Fly Ash or Natural Pozzolans for Use in Portland-Cement Concrete. ASTM International: West Conshohocken, PA, USA, 2018.
Author Contributions
Funding
Institutional Review Board Statement
Informed Consent Statement
Data Availability Statement
Acknowledgments
Conflicts of Interest
References
- Vicente, M.A.; Mínguez, J.; González, D.C. The Use of Computed Tomography to Explore the Microstructure of Materials in Civil Engineering: From Rocks to Concrete. In Computed Tomography—Advanced Applications; IntechOpen: London, UK, 2017. [Google Scholar]
- Chung, S.Y.; Lehmann, C.; Elrahman, M.A.; Stephan, D. Pore characteristics and their effects on the material properties of foamed concrete evaluated using micro-CT images and numerical approaches. Appl. Sci. 2017, 7, 550. [Google Scholar] [CrossRef]
- Liu, B.; Yang, T. Image analysis for detection of bugholes on concrete surface. Constr. Build. Mater. 2017, 137, 432–440. [Google Scholar] [CrossRef]
- Lee, B.Y.; Kim, Y.Y.; Yi, S.T.; Kim, J.K. Automated image processing technique for detecting and analysing concrete surface cracks. Struct. Infrastruct. Eng. 2013, 9, 567–577. [Google Scholar] [CrossRef]
- Pavani, H.P.; Tadepalli, T.; Agrawal, A.K. Estimation of porosity and pore distribution in Hydrated Portland cement at elevated temperatures using synchrotron micro tomography. J. Adv. Concr. Technol. 2019, 17, 34–45. [Google Scholar] [CrossRef]
- Promentilla, M.A.B.; Cortez, S.M.; Papel, R.A.D.C.; Tablada, B.M.; Sugiyama, T. Evaluation of microstructure and transport properties of deteriorated cementitious materials from their X-ray computed tomography (CT) images. Materials 2016, 9, 388. [Google Scholar] [CrossRef]
- Vicente, M.A.; Ruiz, G.; González, D.C.; Mínguez, J.; Tarifa, M.; Zhang, X. CT-Scan study of crack patterns of fiber-reinforced concrete loaded monotonically and under low-cycle fatigue. Int. J. Fatigue 2018, 114, 138–147. [Google Scholar] [CrossRef]
- Ruan, T.; Poursaee, A. Fiber-Distribution Assessment in Steel Fiber–Reinforced UHPC Using Conventional Imaging, X-Ray CT Scan, and Concrete Electrical Conductivity. J. Mater. Civ. Eng. 2019, 31, 04019133. [Google Scholar] [CrossRef]
- Lee, B.Y.; Kang, S.T.; Yun, H.B.; Kim, Y.Y. Improved sectional image analysis technique for evaluating fiber orientations in fiber-reinforced cement-based materials. Materials 2016, 9, 42. [Google Scholar] [CrossRef] [PubMed]
- Szelag, M. Development of cracking patterns in modified cement matrix with microsilica. Materials 2018, 11, 1928. [Google Scholar] [CrossRef] [PubMed]
- San, K.T.; Aung, H.S.N. Impact of Mix Proportions on Plastic Shrinkage Cracking of Concrete Using Photo Processing Method. Univ. Res. J. Sci. Eng. Eng. Educ. (URJSEE) 2019, 01, 38–42. [Google Scholar]
- Rahman, M.; Saifullah, I.; Ghosh, S.K. Detection and Measurements of Cracks in Axially Loaded Tension RC Members by Image Processing Technique. Am. J. Civ. Eng. Archit. 2019, 7, 115–120. [Google Scholar] [CrossRef]
- Valikhani, A.; Jahromi, A.J.; Pouyanfar, S.; Mantawy, I.M.; Azizinamini, A. Machine learning and image processing approaches for estimating concrete surface roughness using basic cameras. Comput. Civ. Infrastruct. Eng. 2021, 36, 213–226. [Google Scholar] [CrossRef]
- Shin, H.K.; Ahn, Y.H.; Lee, S.H.; Kim, H.Y. Digital vision based concrete compressive strength evaluating model using deep convolutional neural network. Comput. Mater. Contin. 2019, 61, 911–928. [Google Scholar] [CrossRef]
- Dogan, G.; Arslan, M.H.; Ceylan, M. Concrete compressive strength detection using image processing based new test method. Meas. J. Int. Meas. Confed. 2017, 109, 137–148. [Google Scholar] [CrossRef]
- Jang, Y.; Ahn, Y.; Kim, H.Y. Estimating Compressive Strength of Concrete Using Deep Convolutional Neural Networks with Digital Microscope Images. J. Comput. Civ. Eng. 2019, 33, 04019018. [Google Scholar] [CrossRef]
- Yao, G.; Wei, F.; Yang, Y.; Sun, Y. Deep-Learning-Based Bughole Detection for Concrete Surface Image. Adv. Civ. Eng. 2019, 2019, 1–12. [Google Scholar] [CrossRef]
- Rahman, I.A.; Rahman, M.A. Effect of Vibrations on Concrete Strength; University of Khartoum: Khartoum, Sudan, 2007. [Google Scholar]
- Liu, B.; Yang, T.; Xie, Y. Factors influencing bugholes on concrete surface analyzed by image processing technology. Constr. Build. Mater. 2017, 153, 897–907. [Google Scholar] [CrossRef]
- Teara, A.; Ing, D.S.; Tam, V.W.Y. The use of waste materials for concrete production in construction applications. IOP Conf. Ser. Mater. Sci. Eng. 2018, 342, 012062. [Google Scholar] [CrossRef]
- Izzat, A.M.; Al Bakri, A.M.M.; Kamarudin, H.; Moga, L.M.; Ruzaidi, G.C.M.; Faheem, M.T.M.; Sandu, A.V. Microstructural analysis of geopolymer and ordinary Portland cement mortar exposed to sulfuric acid. Mater. Plast. 2013, 50, 171–174. [Google Scholar]
- Yahya, Z.; Abdullah, M.M.A.B.; Ramli, N.M.; Burduhos-Nergis, D.D.; Razak, R.A. Influence of Kaolin in Fly Ash Based Geopolymer Concrete: Destructive and Non-Destructive Testing. IOP Conf. Ser. Mater. Sci. Eng. 2018, 374, 012068. [Google Scholar] [CrossRef]
- Abdullah, M.M.A.B.; Hussin, K.; Bnhussain, M.; Ismail, K.N.; Yahya, Z.; Razak, R.A. Fly ash-based geopolymer lightweight concrete using foaming agent. Int. J. Mol. Sci. 2012, 13, 7186–7198. [Google Scholar] [CrossRef]
- Ibrahim, W.M.W.; Al Bakri Abdullah, M.M.; Sandu, A.V.; Hussin, K.; Sandu, I.G.; Ismail, K.N.; Kadir, A.A.; Binhussain, M. Processing and characterization of fly ash-based geopolymer bricks. Rev. Chim. 2014, 65, 1340–1345. [Google Scholar]
- Nergis, D.D.B.; Abdullah, M.M.A.B.; Sandu, A.V.; Vizureanu, P. XRD and TG-DTA study of new alkali activated materials based on fly ash with sand and glass powder. Materials 2020, 13, 343. [Google Scholar] [CrossRef]
- Zailani, W.W.A.; Abdullah, M.M.A.B.; Arshad, M.F.; Razak, R.A.; Tahir, M.F.M.; Zainol, R.R.M.A.; Nabialek, M.; Sandu, A.V.; Wysłocki, J.J.; Błoch, K. Characterisation at the bonding zone between fly ash based geopolymer repair materials (Grm) and ordinary portland cement concrete (opcc). Materials 2021, 14, 56. [Google Scholar] [CrossRef] [PubMed]
- Li, O.H.; Yun-Ming, L.; Cheng-Yong, H.; Bayuaji, R.; Abdullah, M.M.A.B.; Loong, F.K.; Jin, T.S.; Teng, N.H.; Nabiałek, M.; Jeż, B.; et al. Evaluation of the effect of silica fume on amorphous fly ash geopolymers exposed to elevated temperature. Magnetochemistry 2021, 7, 9. [Google Scholar] [CrossRef]
- Jhatial, A.A.; Goh, W.I.; Mohamad, N.; Sohu, S.; Lakhiar, M.T. Utilization of Palm Oil Fuel Ash and Eggshell Powder as Partial Cement Replacement-A Review. Civ. Eng. J. 2018, 4, 1977. [Google Scholar] [CrossRef]
- Mehta, A.; Ashish, D.K. Silica fume and waste glass in cement concrete production: A review. J. Build. Eng. 2019, 29, 100888. [Google Scholar] [CrossRef]
- López, M.; Castro, J.T. Effect of natural pozzolans on porosity and pore connectivity of concrete with time. Rev. Ing. Constr. 2010, 25, 419–431. [Google Scholar] [CrossRef]
- Zareei, S.A.; Ameri, F.; Dorostkar, F.; Ahmadi, M. Rice husk ash as a partial replacement of cement in high strength concrete containing micro silica: Evaluating durability and mechanical properties. Case Stud. Constr. Mater. 2017, 7, 73–81. [Google Scholar] [CrossRef]
- Chouhan, R.K.; Mudgal, M.; Bisarya, A.; Srivastava, A.K. Rice-husk-based superplasticizer to increase performance of fly ash geopolymer concrete. Emerg. Mater. Res. 2018, 7, 169–177. [Google Scholar] [CrossRef]
- Othman, R.; Muthusamy, K.; Ramadhansyah, P.J.; Youventharan, D.; Sulaiman, M.A.; Nadiatul Adilah, A.A.G.; Chong, B.W. Experimental Study on Flexural Behaviour of Reinforced Foamed Concrete Square Hollow Beam. IOP Conf. Ser. Mater. Sci. Eng. 2020, 712, 012046. [Google Scholar] [CrossRef]
- Rahma, A.; Jomaa, H. Modeling the cementitious effect of the Pozzolana on the compressive strength of concrete. Cogent Eng. 2018, 5, 1–13. [Google Scholar] [CrossRef]
- Zhao, S.; Xie, Y.M. Effect of Silica Fume on Workability and Water Impermeability of Concrete. Appl. Mech. Mater. 2012, 238, 157–160. [Google Scholar]
- Tang, V.L.; Nguyen, T.C.; Ngo, X.H.; Dang, V.P.; Bulgakov, B.; Bazhenova, S. Effect of natural pozzolan on strength and temperature distribution of heavyweight concrete at early ages. MATEC Web Conf. 2018, 193, 03024. [Google Scholar] [CrossRef]
- Khan, S.U.; Nuruddin, M.F.; Ayub, T.; Shafiq, N. Effects of different mineral admixtures on the properties of fresh concrete. Sci. World J. 2014, 2014, 1–11. [Google Scholar] [CrossRef] [PubMed]
- Al-Swaidani, A.; Soud, A.; Hammami, A. Improvement of the Early-Age Compressive Strength, Water Permeability, and Sulfuric Acid Resistance of Scoria-Based Mortars/Concrete Using Limestone Filler. Adv. Mater. Sci. Eng. 2017, 2017, 1–17. [Google Scholar] [CrossRef]
- Rokiah, O.; Khairunisa, M.; Youventharan, D.; Arif, S.M. Effect of processed spent bleaching earth content on the compressive strength of foamed concrete. IOP Conf. Ser. Earth Environ. Sci. 2019, 244, 012013. [Google Scholar] [CrossRef]
- Yang, H.S.; Fang, K.H.; Tu, S.J. Pozzolanic Reaction of Supplementary Cementitious Materials and Its Effects on the Strength of Mass Concrete. Adv. Mater. Res. 2010, 168, 505–511. [Google Scholar] [CrossRef]
- Beng Wei, C.; Othman, R.; Yee Ying, C.; Putra Jaya, R.; Shu Ing, D.; Ali Mangi, S. Properties of mortar with fine eggshell powder as partial cement replacement. Mater. Today Proc. 2020, in press. [Google Scholar] [CrossRef]
- Ahmed, A.; Kamau, J.; Pone, J.; Hyndman, F.; Fitriani, H.; Products, N.C. Chemical Reactions in Pozzolanic Concrete. Mod. Approaches Mater. Sci. 2019, 1, 128–133. [Google Scholar] [CrossRef]
- Pachideh, G.; Gholhaki, M. Effect of pozzolanic materials on mechanical properties and water absorption of autoclaved aerated concrete. J. Build. Eng. 2019, 26, 100856. [Google Scholar] [CrossRef]
- De Medeiros-Junior, R.A.; da Munhoz, G.S.; de Medeiros, M.H.F. Correlations between water absorption, electrical resistivity and compressive strength of concrete with different contents of pozzolan. Rev. ALCONPAT 2019, 9, 152–166. [Google Scholar] [CrossRef]
- Erdal, M. Prediction of the compressive strength of vacuum processed concretes using artificial neural network and regression techniques. Sci. Res. Essays 2009, 4, 1057–1065. [Google Scholar]
- Zhang, S.P.; Zong, L. Evaluation of relationship between water absorption and durability of concrete materials. Adv. Mater. Sci. Eng. 2014, 2014, 8. [Google Scholar] [CrossRef]
- Ahmad, A.; Plevris, V.; Waris, M.I. Detection Of Bugholes Using Image Processing Technique In Hybrid Concrete. In Proceedings of the 2nd Conference on Sustainability in Civil Engineering (CSCE’20), Islamabad, Pakistan, 8 August 2020; p. 16. [Google Scholar]


| Tests | Unit | Specification MS EN 197-1: 2014 CEM/B-L 32.5 N | Test Results |
|---|---|---|---|
| Chemical composition | |||
| Sulfate content (SO3) | % | Not more than 3.5 | 2.1 |
| Chloride (Cl−) | % | Not more than 0.10 | 0.01 |
| Physical composition | |||
| Fineness (According to Blaine) | m2/kg | - | 440 |
| Setting time, initial | mins | Not less than 75 | 155 |
| Soundness | mm | Not more than 10 | 0.8 |
| Compressive strength | |||
| (Mortar prism), 7 days | MPa | Not less than 16 | 24.0 |
| 28 days | MPa | 32.5 ≤ x ≤ 52.5 | 35.2 |
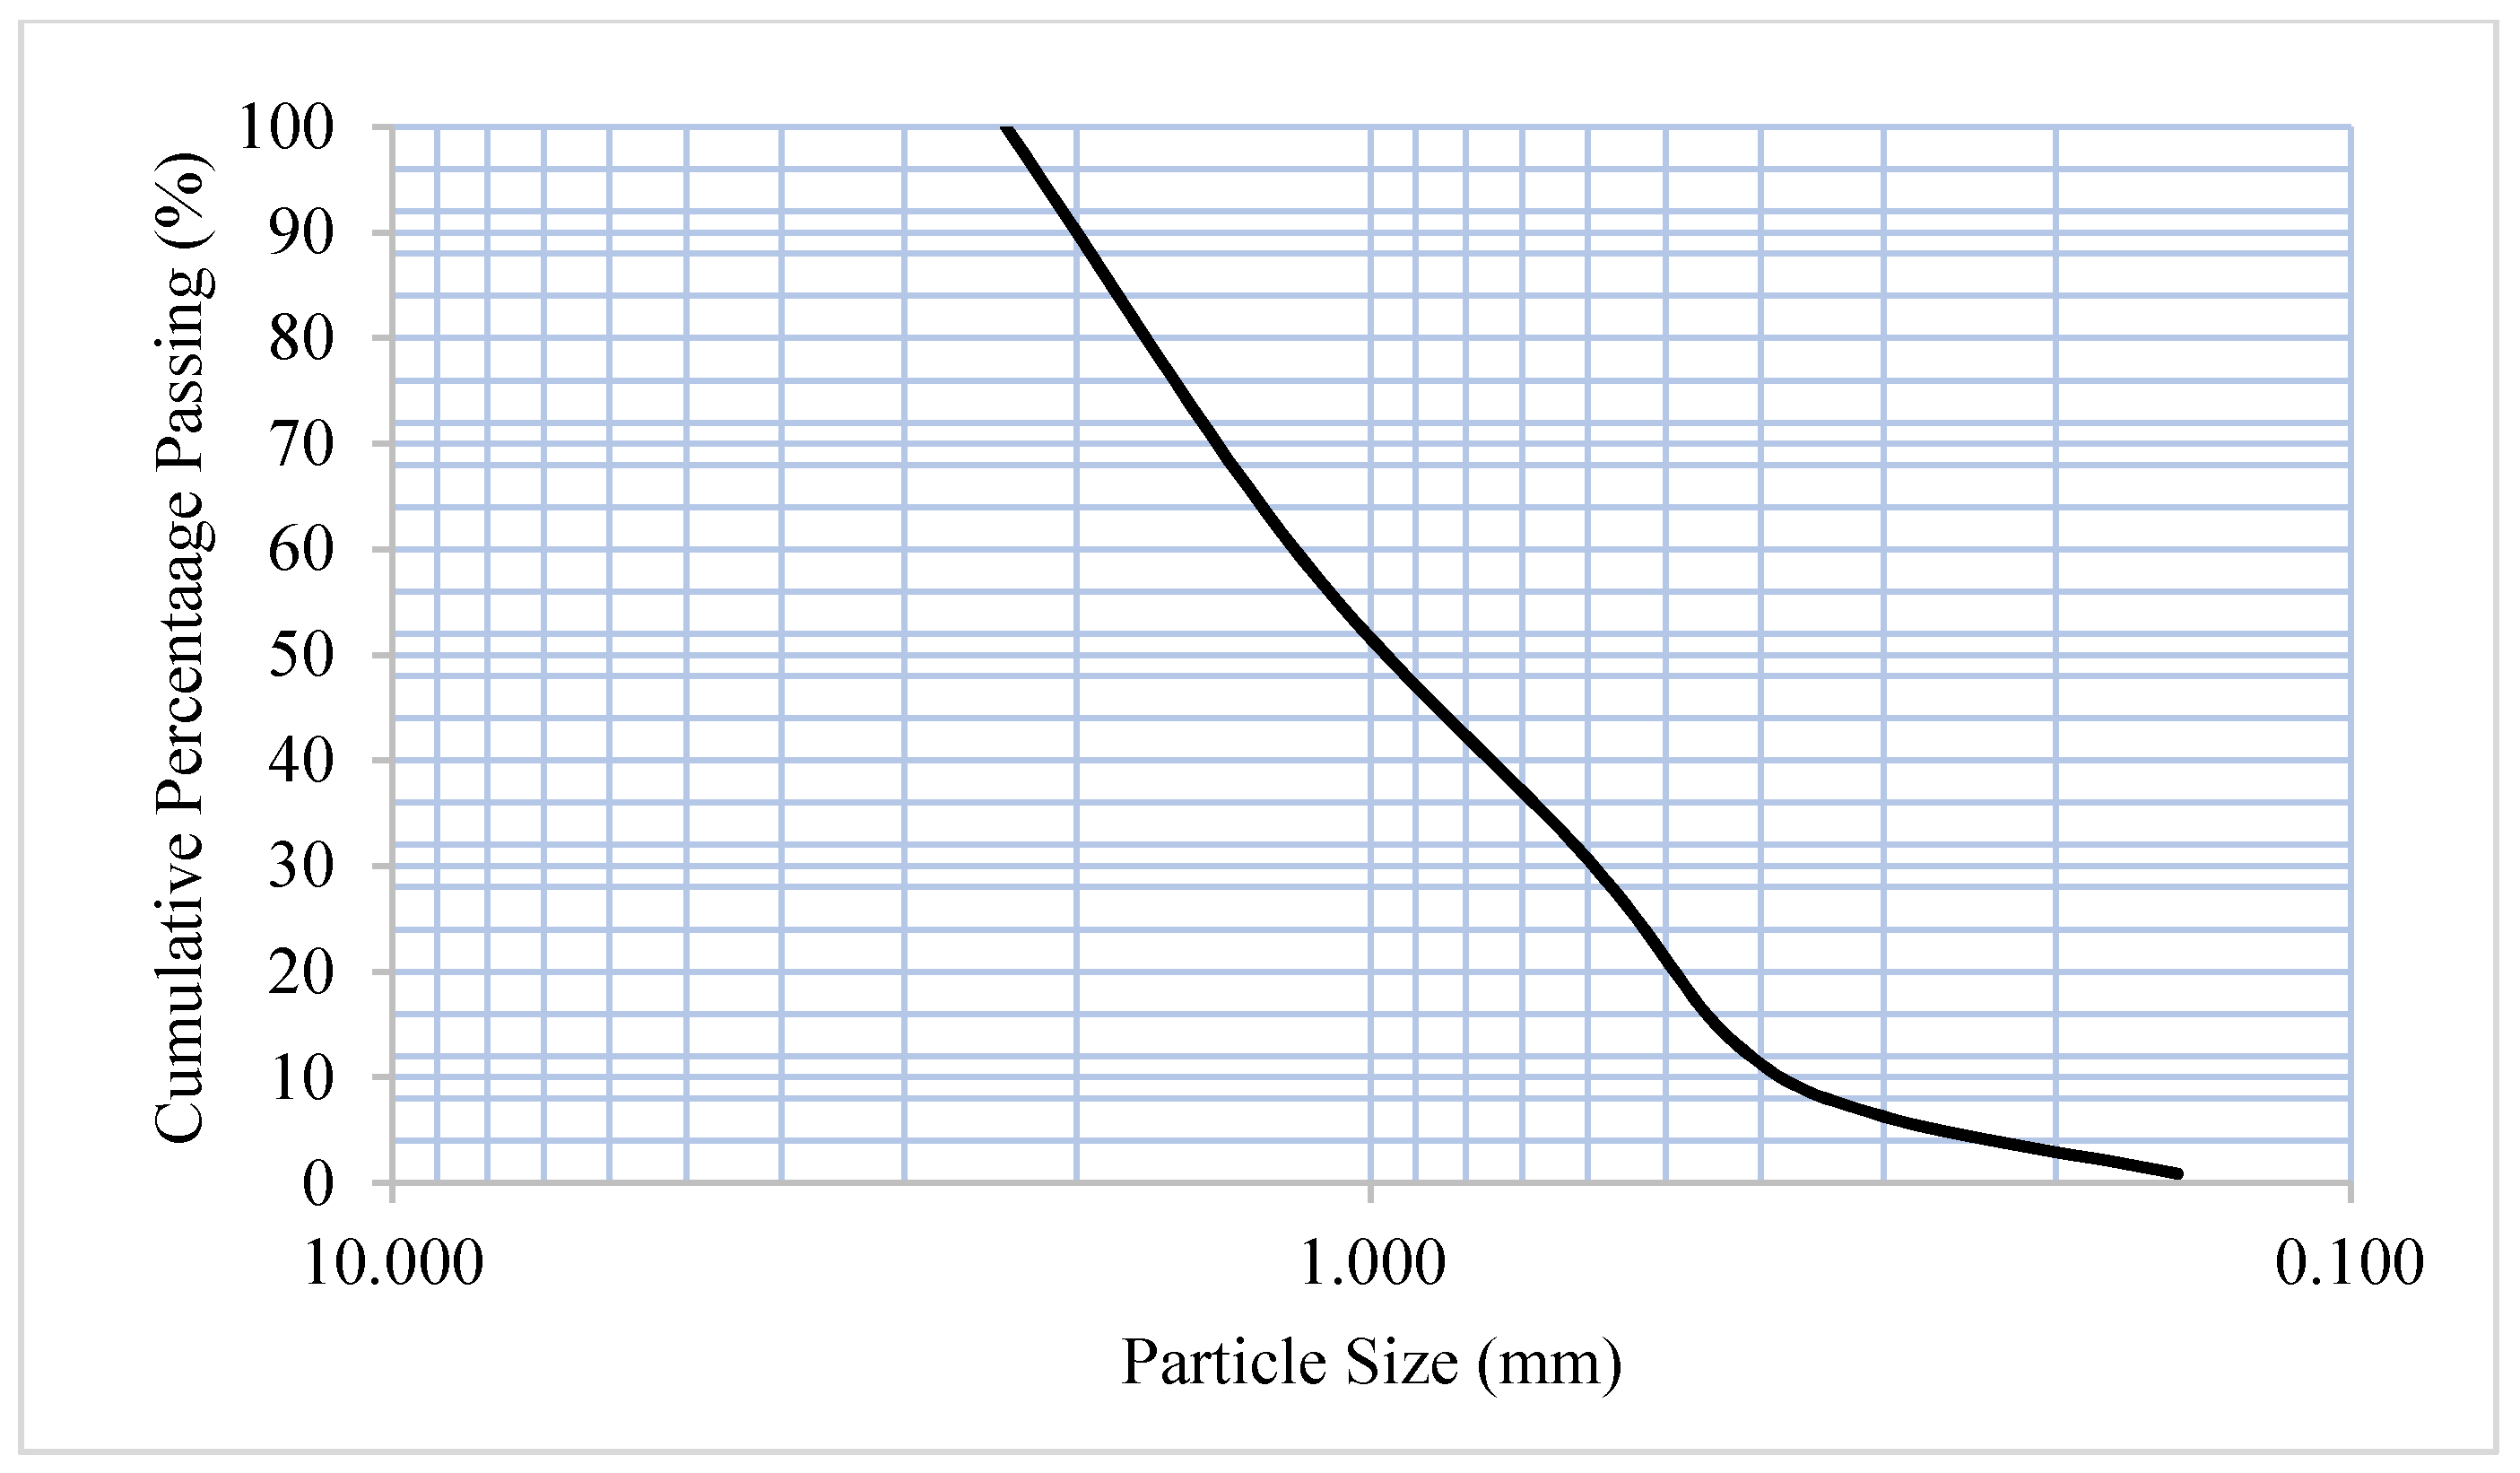
| BS Sieve Size (mm) | Weight of Sieve (g) | Weight of Sieve + Sample (g) | Weight of Sample (g) | Cumulative % | Passing % |
| 2.360 | 256.60 | 260.90 | 4.30 | 0.85 | 99.15 |
| 1.180 | 406.30 | 433.90 | 27.60 | 6.29 | 96.71 |
| 0.600 | 441.80 | 476.90 | 35.10 | 13.21 | 86.88 |
| 0.425 | 434.10 | 522.20 | 88.10 | 30.58 | 69.42 |
| 0.300 | 340.70 | 486.00 | 145.30 | 59.22 | 40.78 |
| 0.150 | 349.10 | 556.00 | 206.90 | 100.00 | 0.00 |
| 0.000 | 352.40 | 352.20 | 0.00 | 100.00 | 0.00 |
| BS Sieve Size (mm) | Weight of Sieve (g) | Weight of Sieve + Sample (g) | Weight of Sample (g) |
|---|---|---|---|
| Silicon dioxide | SiO2 | 55.82 | 16.05 |
| Aluminium oxide | Al2O3 | 13.48 | 3.67 |
| Calcium oxide | CaO | 6.6 | 62.28 |
| Ferrous oxide | Fe2O3 | 8.24 | 3.41 |
| Magnesium oxide | MgO | 5.94 | 0.56 |
| Sodium oxide | Na2O | 0.18 | 0.06 |
| Potassium oxide | K2O | 1.66 | 0.82 |
| Phosphorus pentaoxide | P2O5 | 5.20 | 0.05 |
| Sulpher trioxide | SO3 | 1.05 | 4.10 |
| Titanium oxide | TiO2 | 1.47 | 0.25 |
| Zinc oxide | ZnO | 0.02 | 0.08 |
| Total of SiO2 + Al2O3 + Fe2O3 | 77.54 | - | |
| Mortar Specimen | Flow Table Test (%) | |
|---|---|---|
| Diameter (mm) | Consistency (%) | |
| Control | 255 | 155 |
| 10 PSBE | 250 | 150 |
| 20 PSBE | 240 | 140 |
| 30 PSBE | 195 | 95 |
| 40 PSBE | 205 | 105 |
| Specimen | Compressive Strength (N/mm2) | ||
|---|---|---|---|
| 1 Day | 7 Days | 28 Days | |
| Control | 2.407 | 9.277 | 10.424 |
| 10 PSBE | 1.607 | 10.471 | 11.618 |
| 20 PSBE | 1.016 | 9.436 | 12.254 |
| 30 PSBE | - | 8.169 | 10.917 |
| 40 PSBE | - | 4.665 | 7.537 |
| Slice | Count | Total Area (mm2) | Average Size (mm2) | % Area | Mean |
|---|---|---|---|---|---|
| 1 | 326 | 105.308 | 0.323 | 4.104 | 255 |
| 2 | 164 | 57.484 | 0.351 | 2.24 | 255 |
| 3 | 196 | 60.257 | 0.307 | 2.348 | 255 |
| 4 | 180 | 59.054 | 0.328 | 2.302 | 255 |
| 5 | 215 | 70.854 | 0.33 | 2.761 | 255 |
| 6 | 91 | 13.941 | 0.153 | 0.543 | 255 |
| 7 | 174 | 78.859 | 0.453 | 3.073 | 255 |
| 8 | 320 | 86.43 | 0.27 | 3.368 | 255 |
| 9 | 265 | 80.942 | 0.305 | 3.155 | 255 |
| 10 | 260 | 109.646 | 0.422 | 4.273 | 255 |
| 11 | 232 | 40.376 | 0.174 | 1.574 | 255 |
| 12 | 263 | 67.22 | 0.256 | 2.62 | 255 |
| 13 | 210 | 13.313 | 0.063 | 0.519 | 255 |
| 14 | 286 | 108.647 | 0.38 | 4.234 | 255 |
| 15 | 243 | 83.386 | 0.343 | 3.25 | 255 |
| 16 | 312 | 82.174 | 0.263 | 3.203 | 255 |
| Specimen | Average Surface Porosity (%) |
|---|---|
| Control | 2.723 |
| 10 PSBE | 1.664 |
| 20 PSBE | 1.448 |
| 30 PSBE | 2.240 |
| 40 PSBE | 3.253 |
| Independent Variable | Dependent Variable | Correlation | R2 | Expression |
|---|---|---|---|---|
| Compressive strength | PSBE % | Quadratic | 0.9814 | |
| Water absorption | Quadratic | 0.9021 | ||
| Surface porosity | Linear | 0.8769 |
Publisher’s Note: MDPI stays neutral with regard to jurisdictional claims in published maps and institutional affiliations. |
© 2021 by the authors. Licensee MDPI, Basel, Switzerland. This article is an open access article distributed under the terms and conditions of the Creative Commons Attribution (CC BY) license (http://creativecommons.org/licenses/by/4.0/).
Share and Cite
Wei Chong, B.; Othman, R.; Jaya, R.P.; Shu Ing, D.; Li, X.; Wan Ibrahim, M.H.; Abdullah, M.M.A.B.; Sandu, A.V.; Płoszaj, B.; Szmidla, J.; et al. Image Analysis of Surface Porosity Mortar Containing Processed Spent Bleaching Earth. Materials 2021, 14, 1658. https://doi.org/10.3390/ma14071658
Wei Chong B, Othman R, Jaya RP, Shu Ing D, Li X, Wan Ibrahim MH, Abdullah MMAB, Sandu AV, Płoszaj B, Szmidla J, et al. Image Analysis of Surface Porosity Mortar Containing Processed Spent Bleaching Earth. Materials. 2021; 14(7):1658. https://doi.org/10.3390/ma14071658
Chicago/Turabian StyleWei Chong, Beng, Rokiah Othman, Ramadhansyah Putra Jaya, Doh Shu Ing, Xiaofeng Li, Mohd Haziman Wan Ibrahim, Mohd Mustafa Al Bakri Abdullah, Andrei Victor Sandu, Bartosz Płoszaj, Janusz Szmidla, and et al. 2021. "Image Analysis of Surface Porosity Mortar Containing Processed Spent Bleaching Earth" Materials 14, no. 7: 1658. https://doi.org/10.3390/ma14071658
APA StyleWei Chong, B., Othman, R., Jaya, R. P., Shu Ing, D., Li, X., Wan Ibrahim, M. H., Abdullah, M. M. A. B., Sandu, A. V., Płoszaj, B., Szmidla, J., & Stachowiak, T. (2021). Image Analysis of Surface Porosity Mortar Containing Processed Spent Bleaching Earth. Materials, 14(7), 1658. https://doi.org/10.3390/ma14071658