
Effects of Silicon, Chromium, and Copper on Kinetic Parameters of Precipitation during Tempering of Medium Carbon Steels

 , , ,
, , ,
Abstract
1. Introduction
2. Materials and Methods
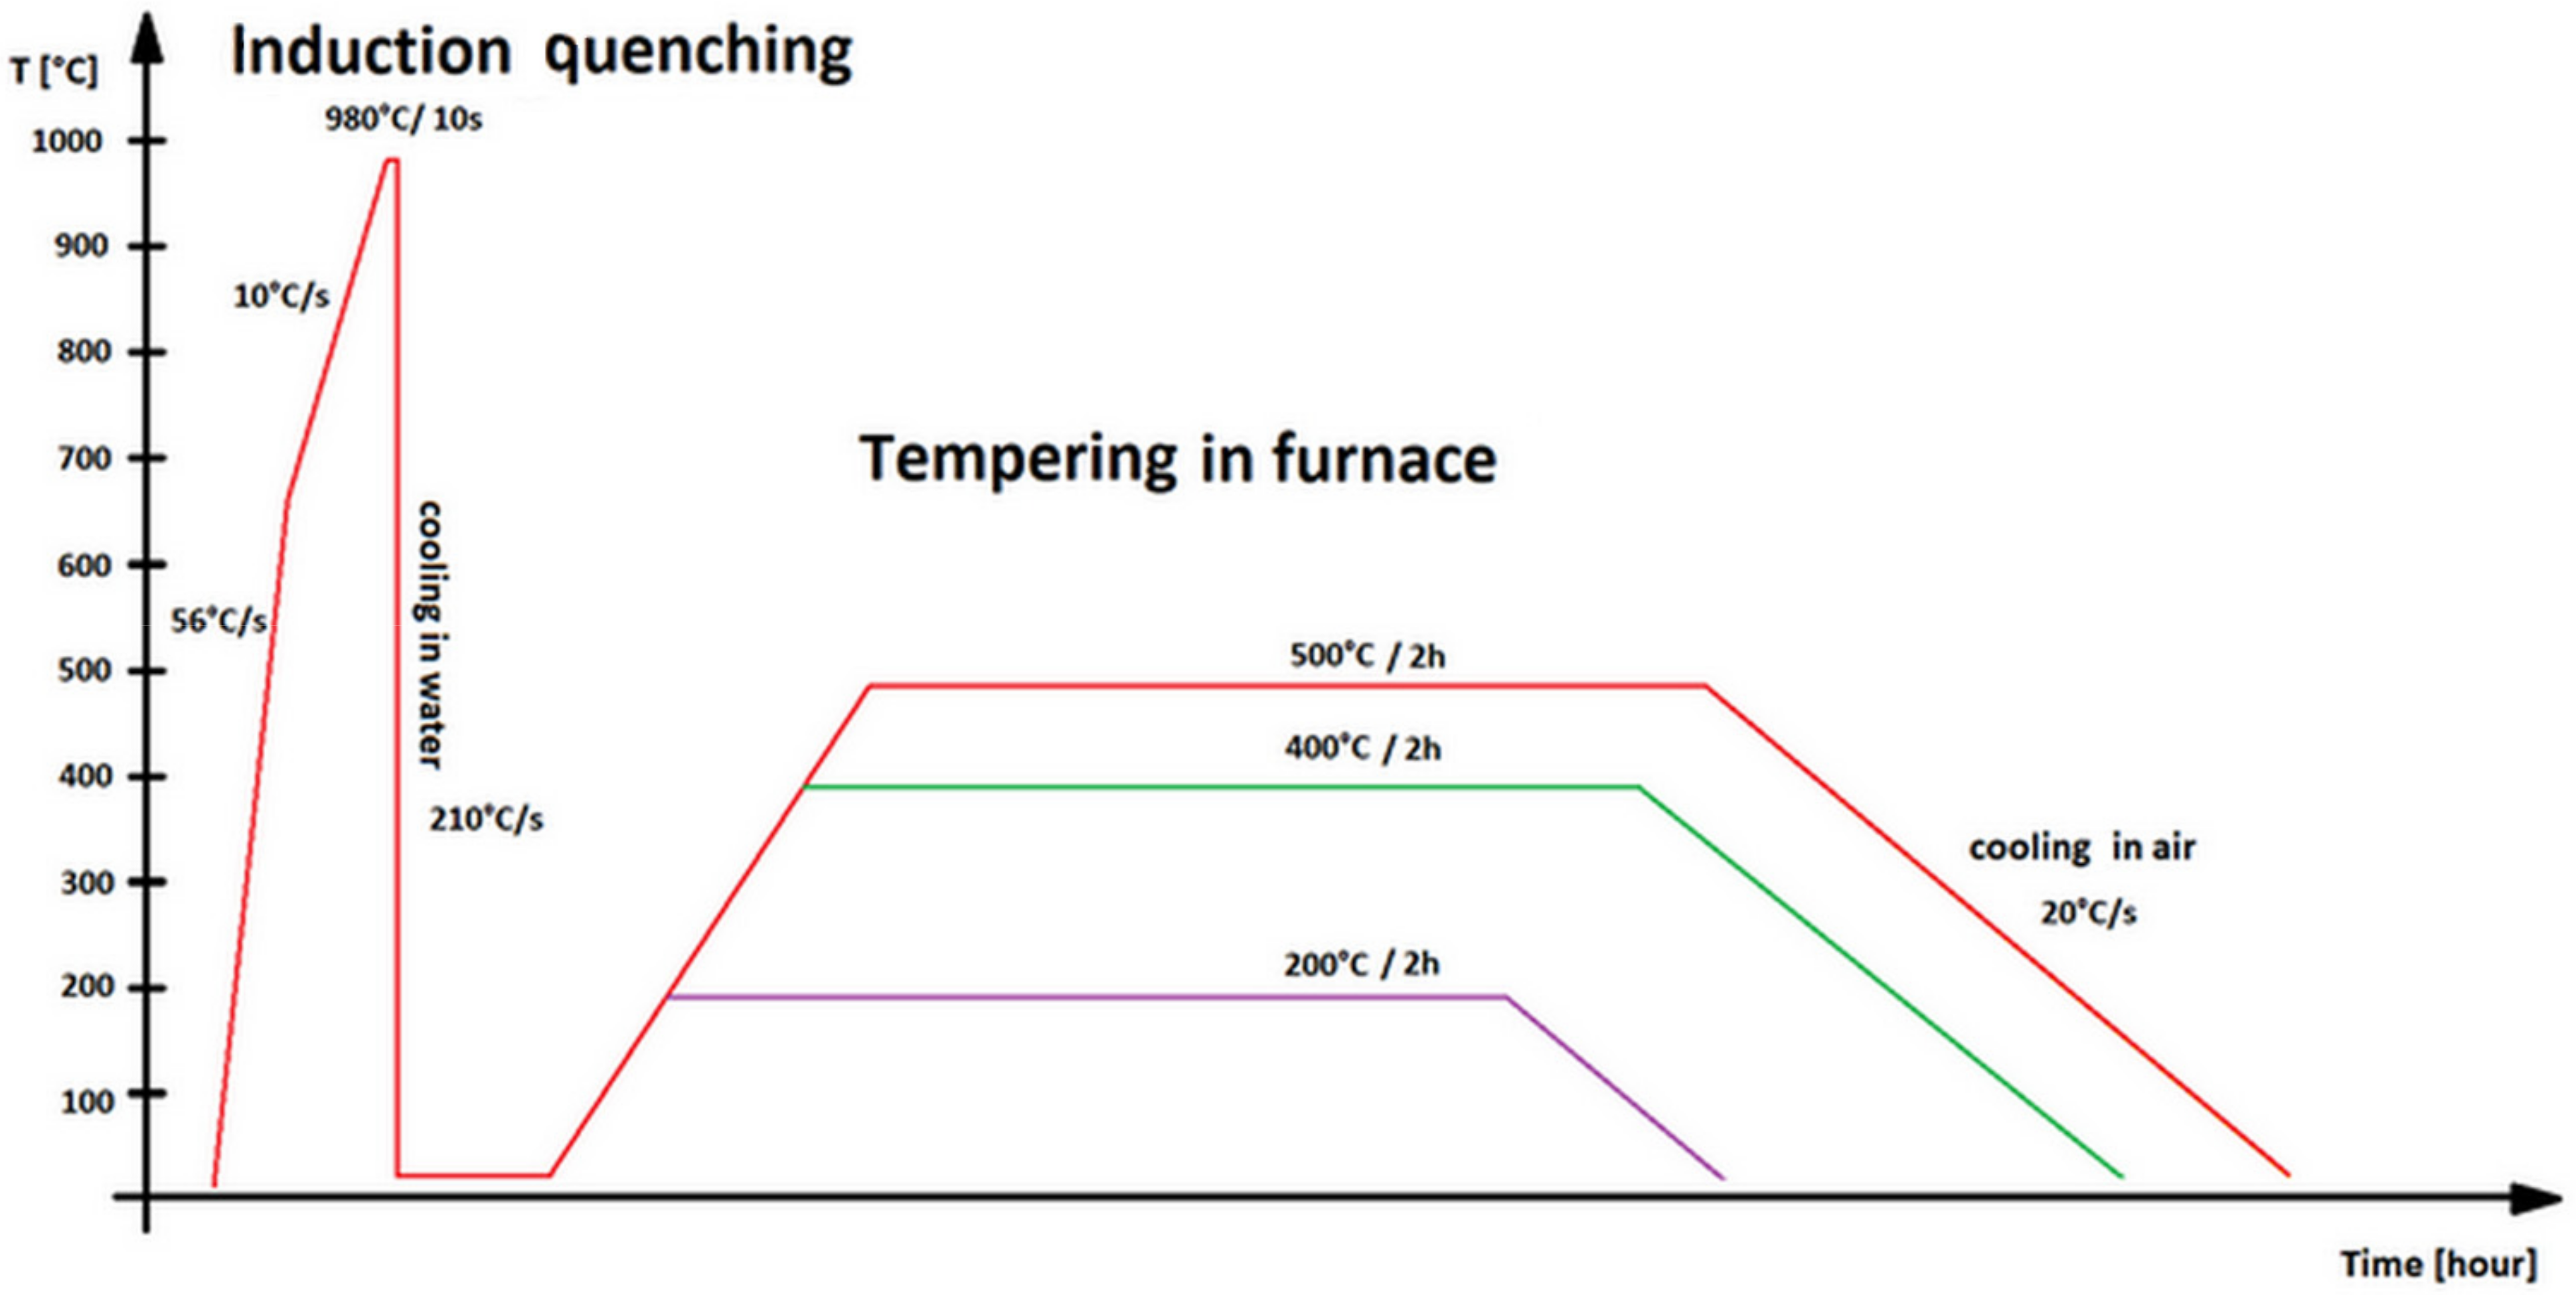
2.1. Materials and Heat Treatment
2.2. XRD Measurement
2.3. TEM Observation
2.4. Dilatometry
2.5. USANS and SANS Measurements
3. Results
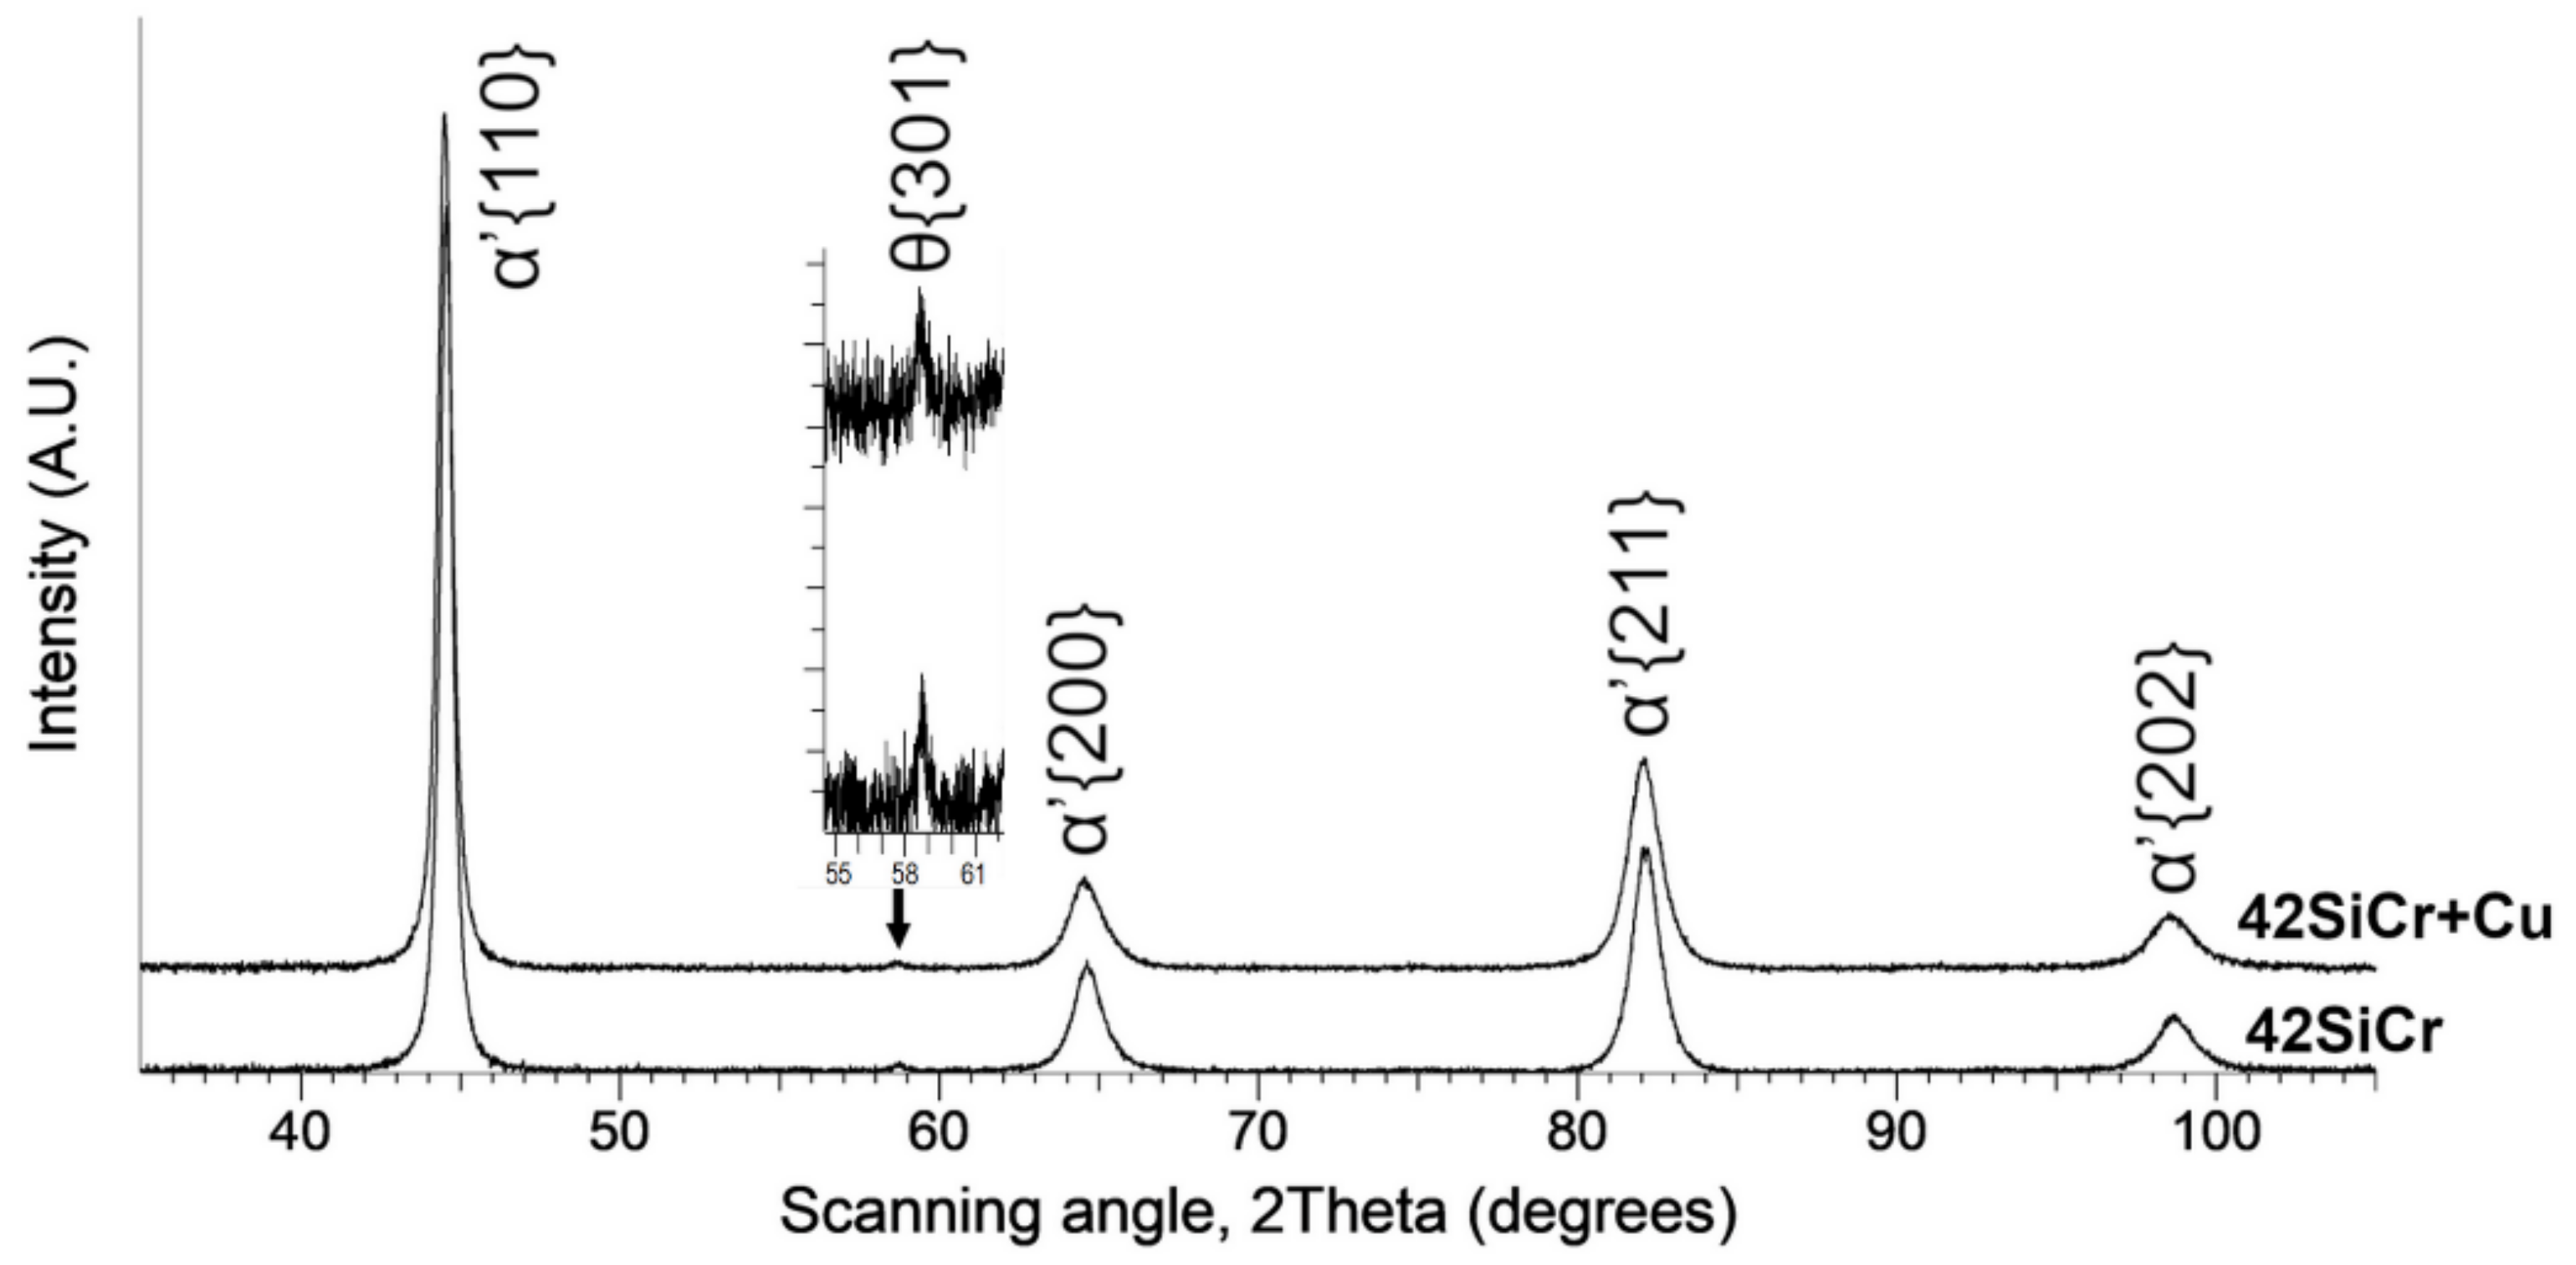
3.1. XRD
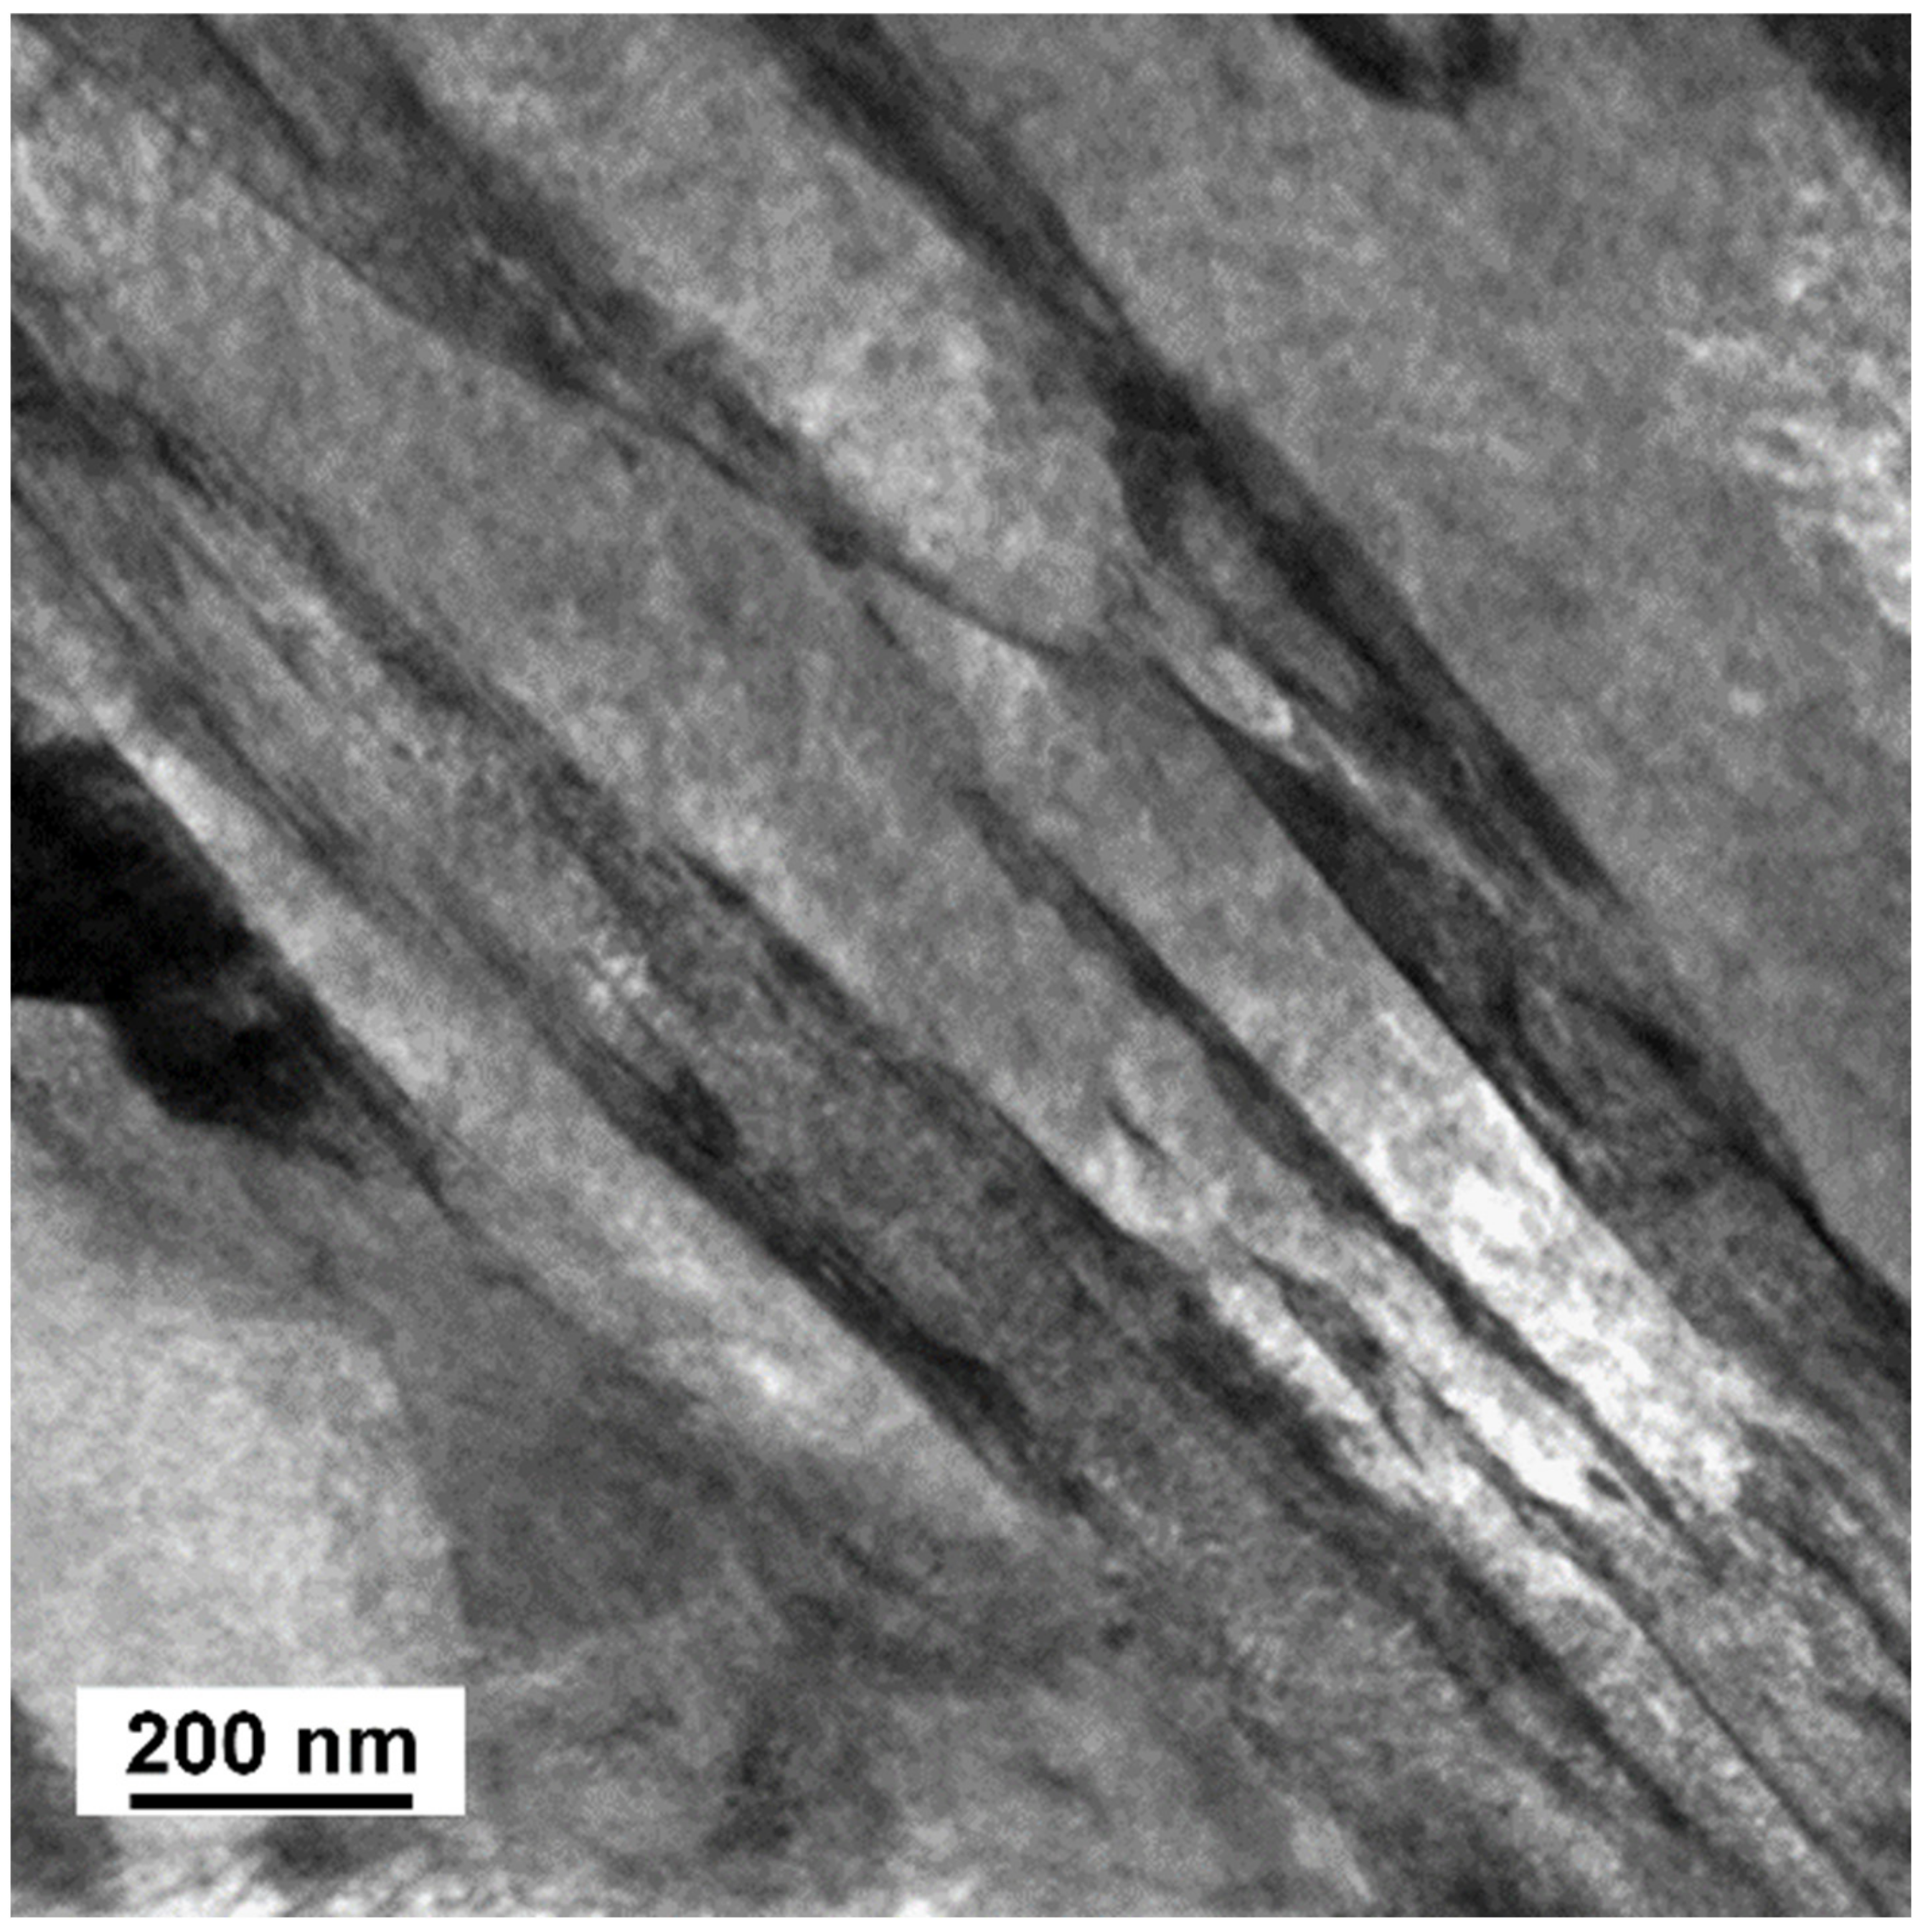
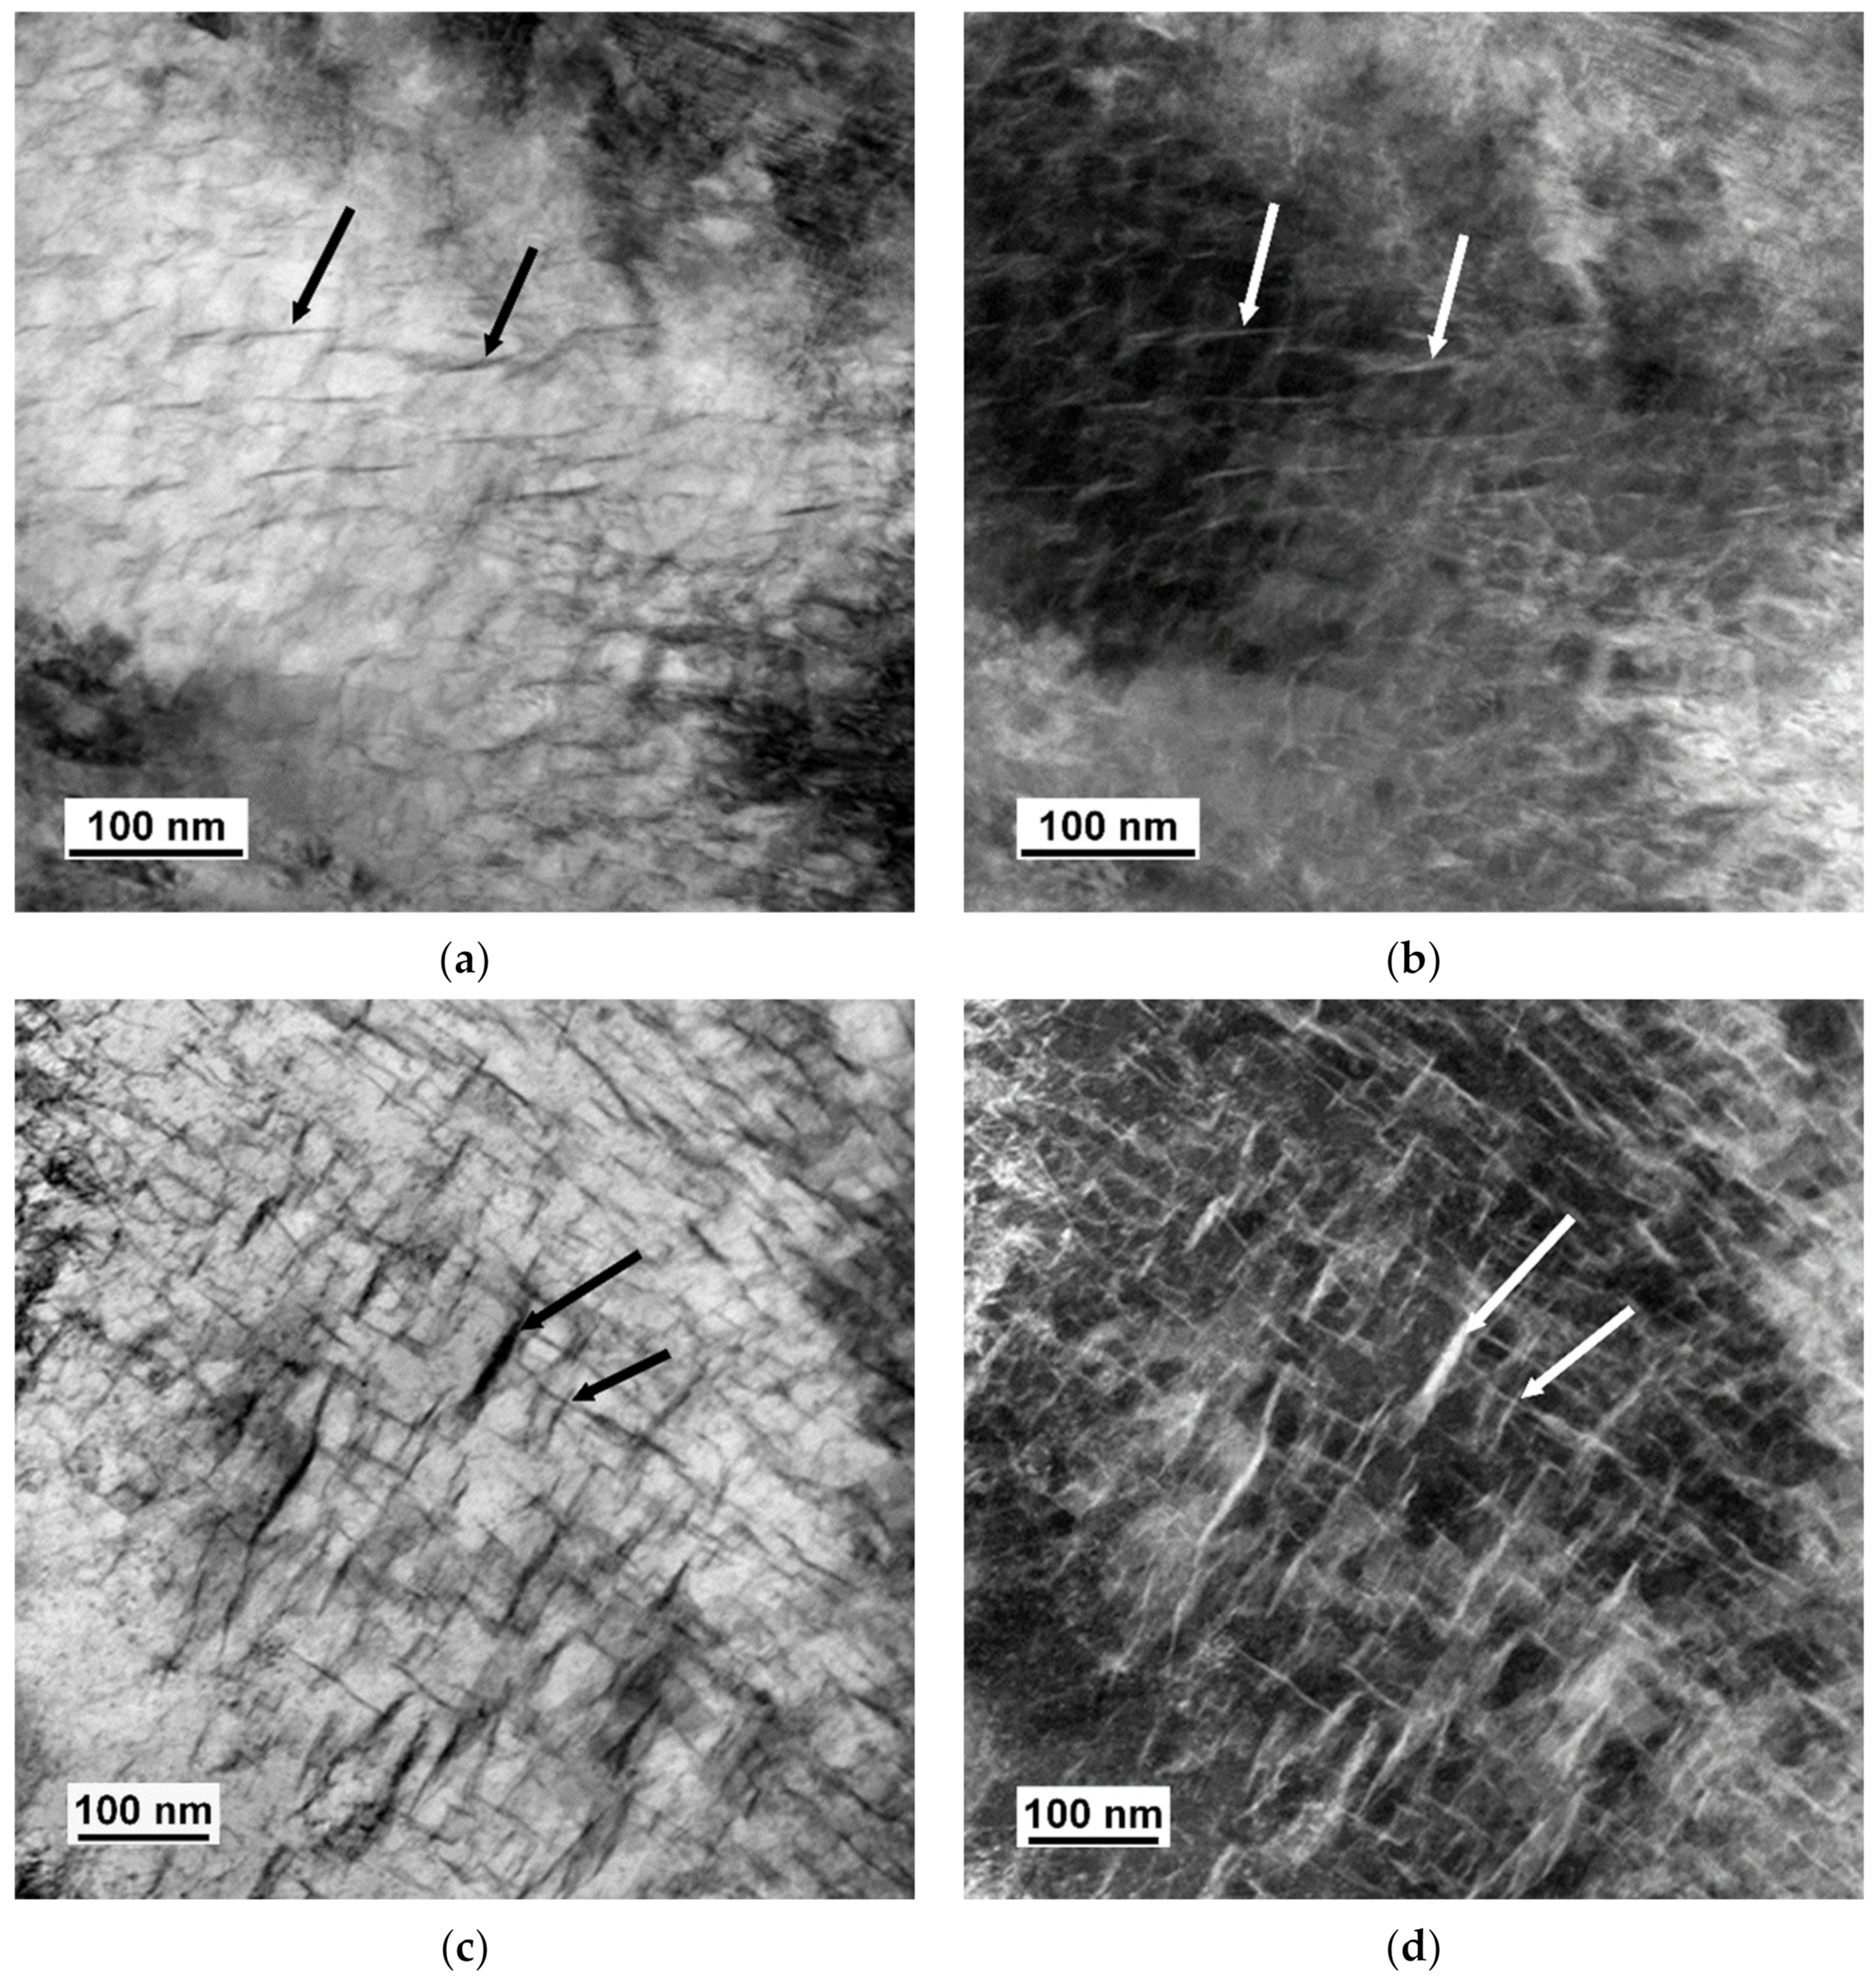
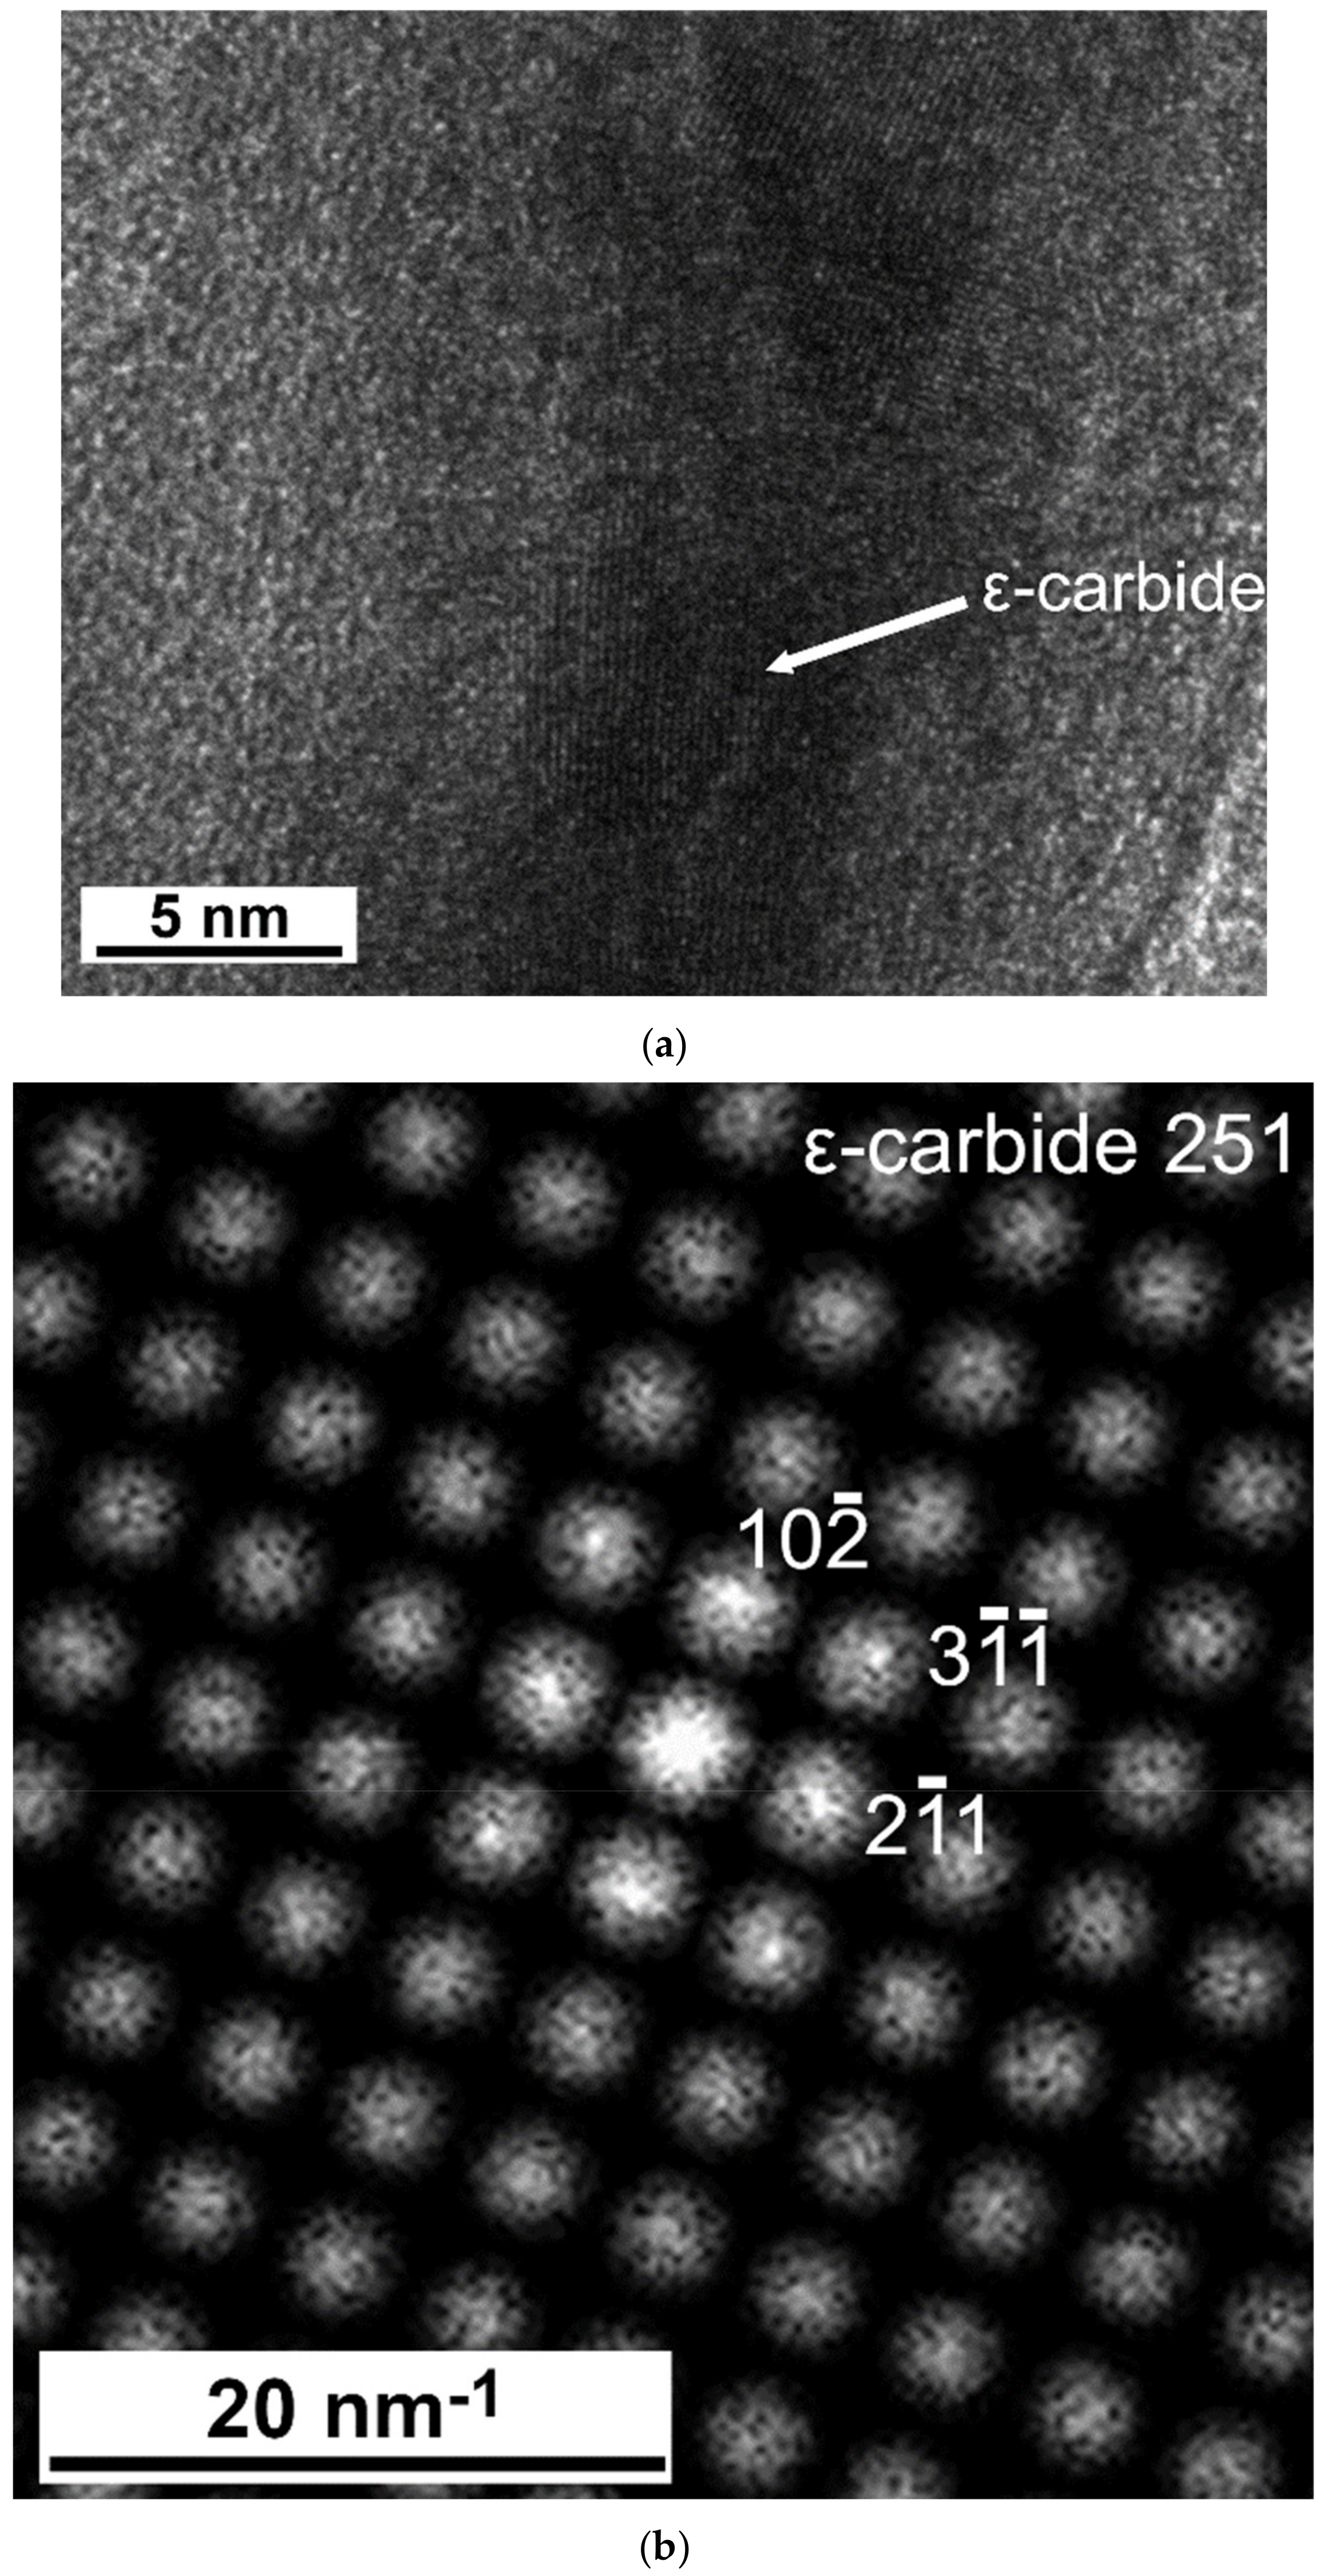
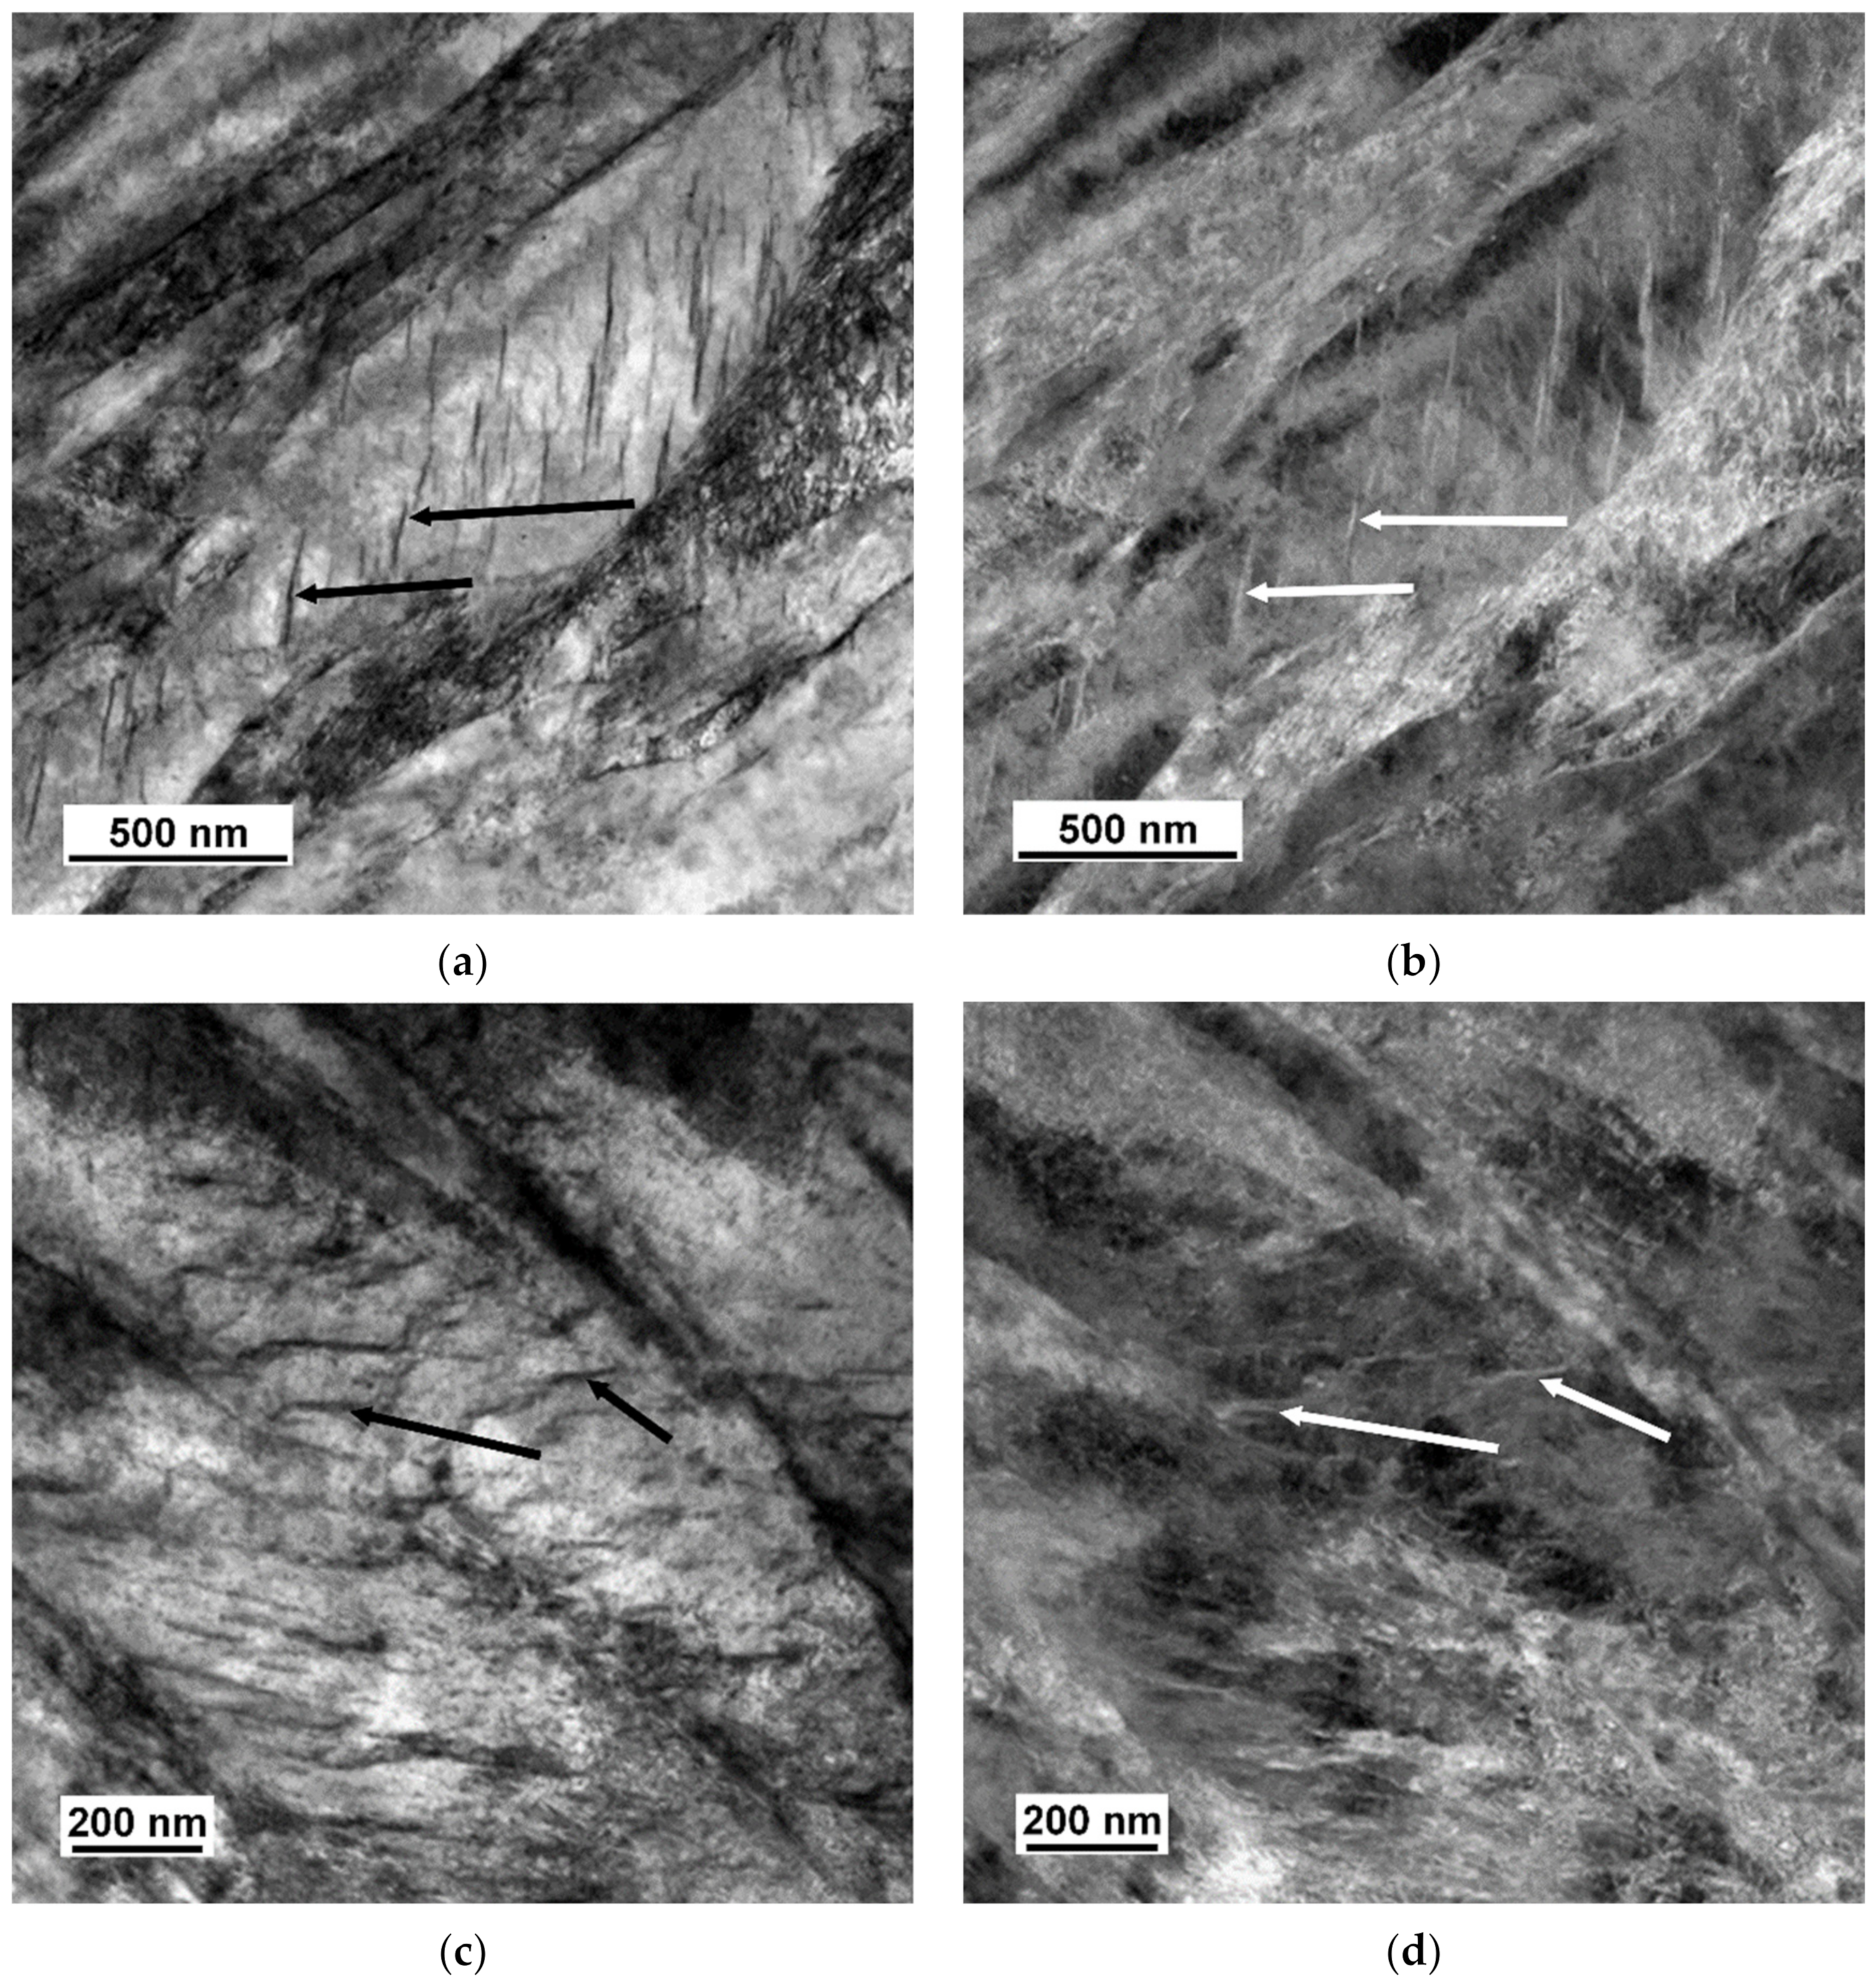
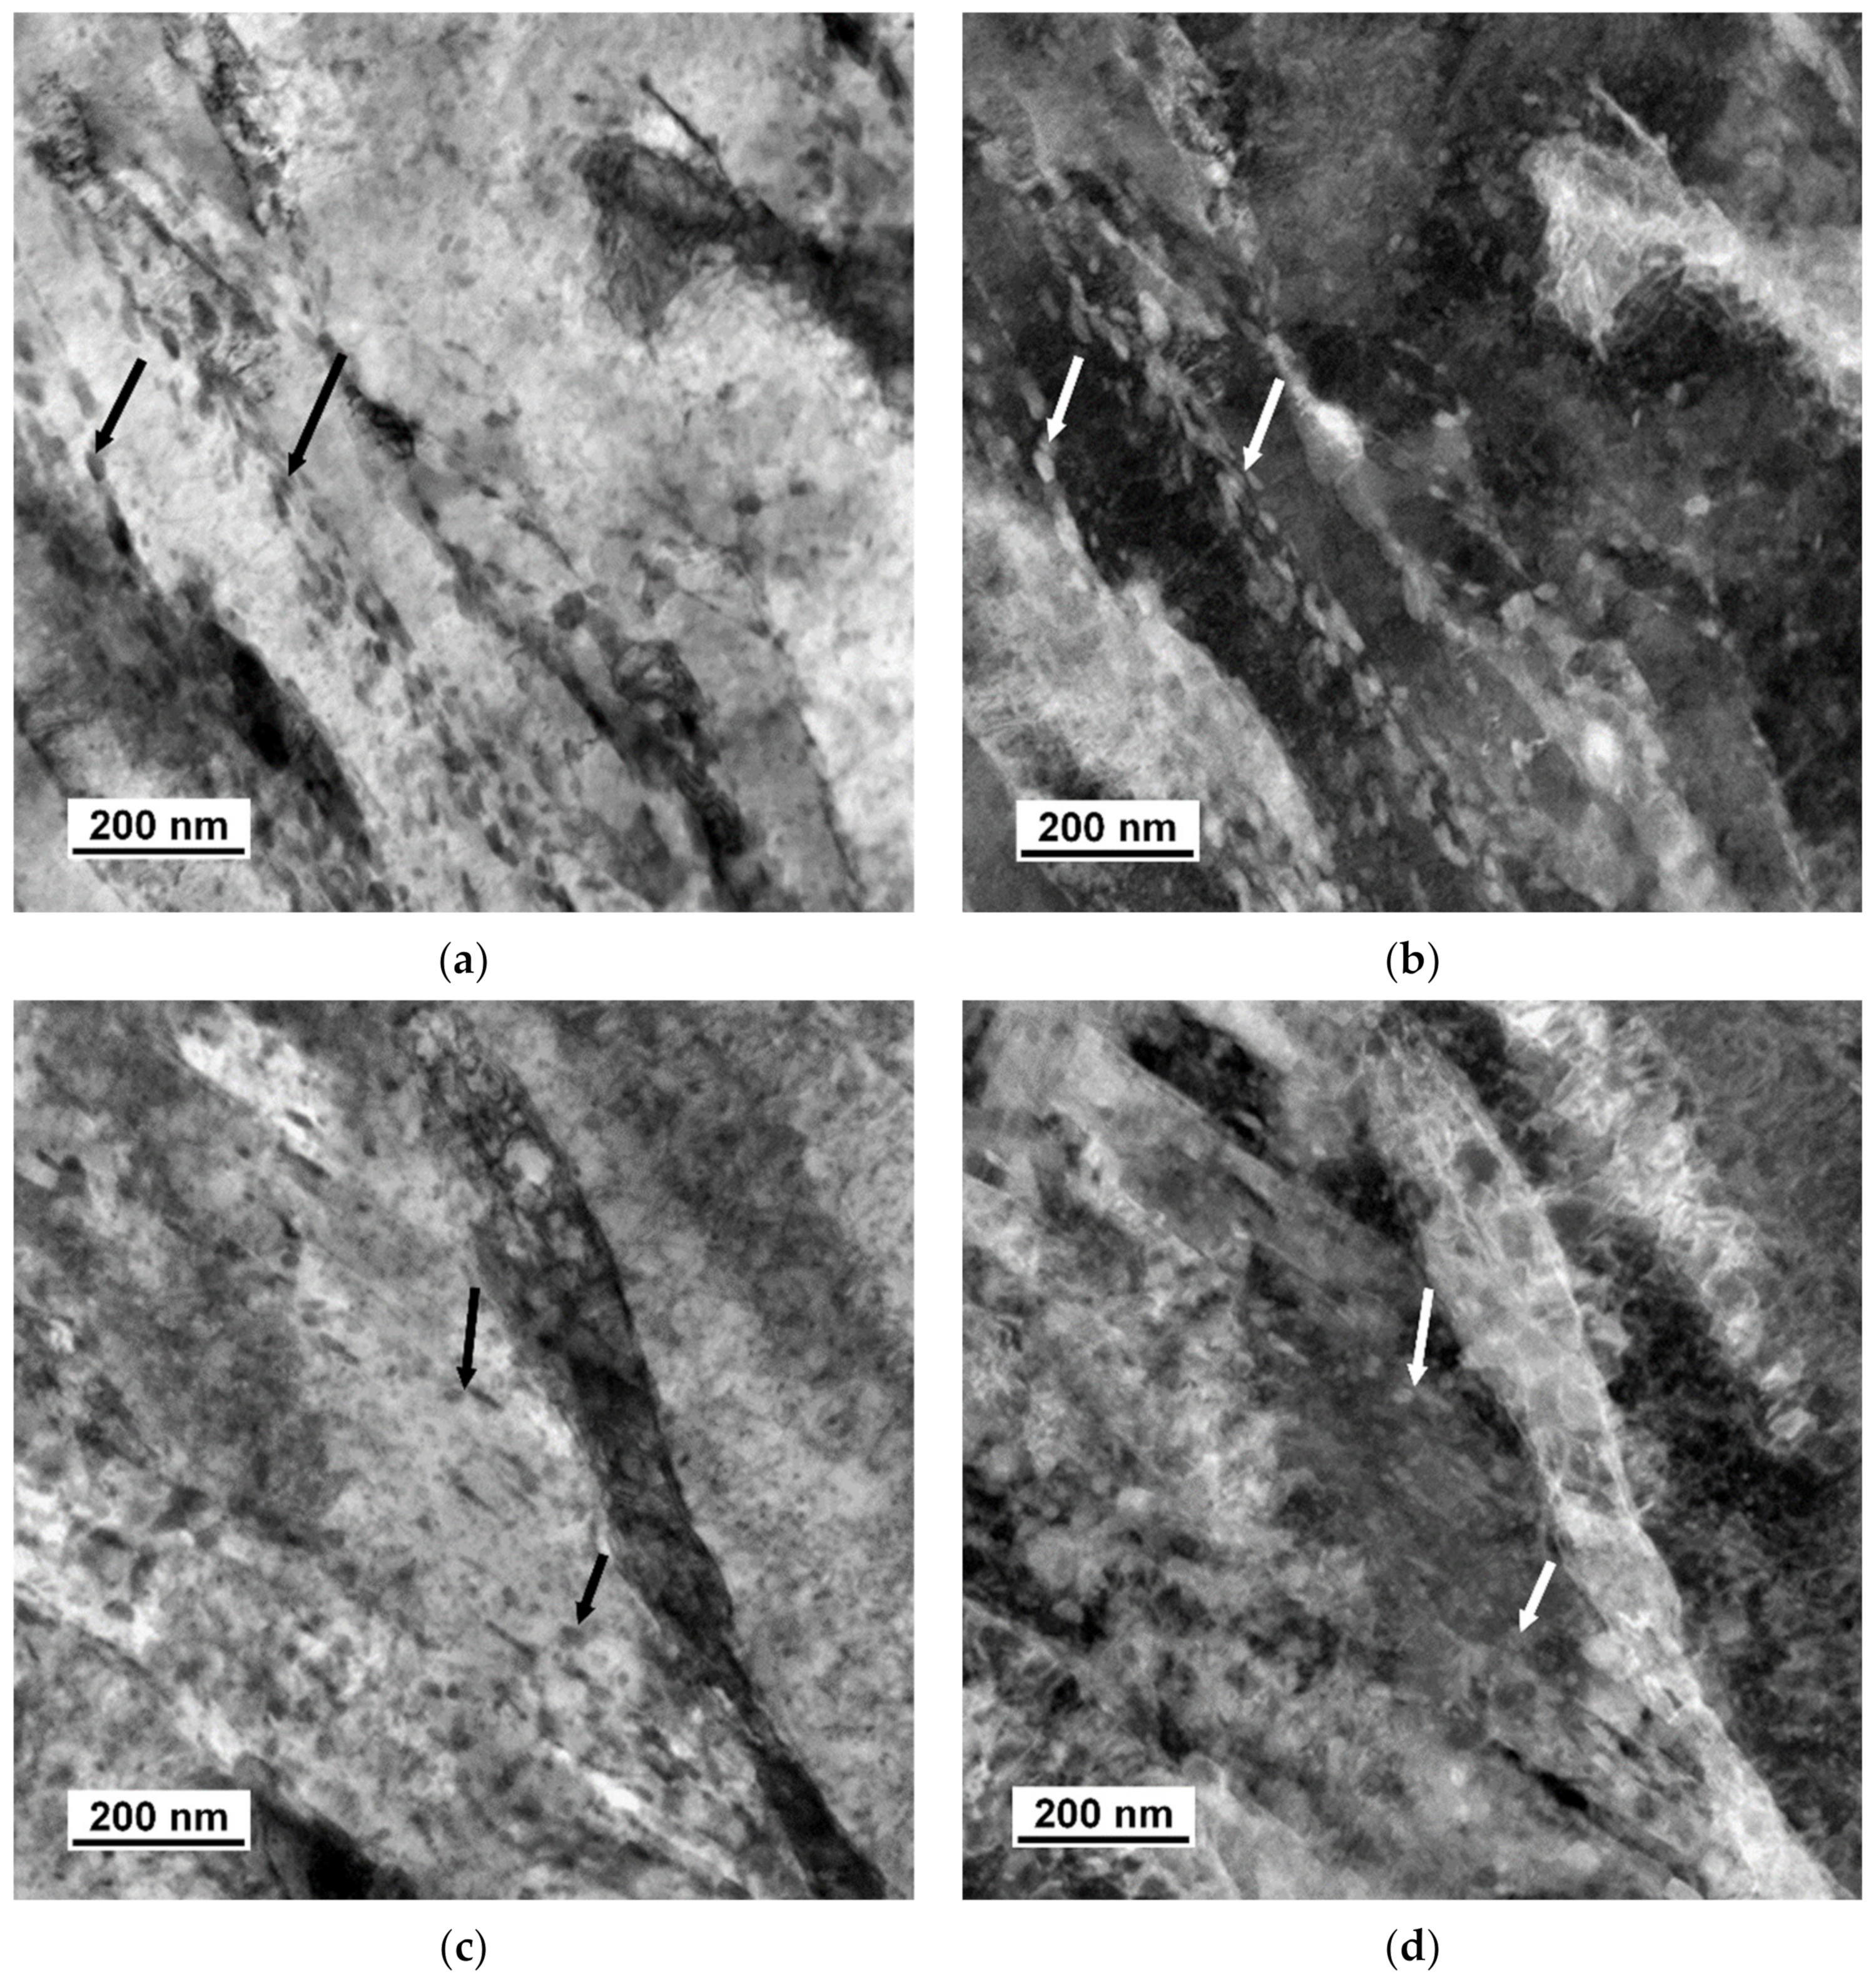
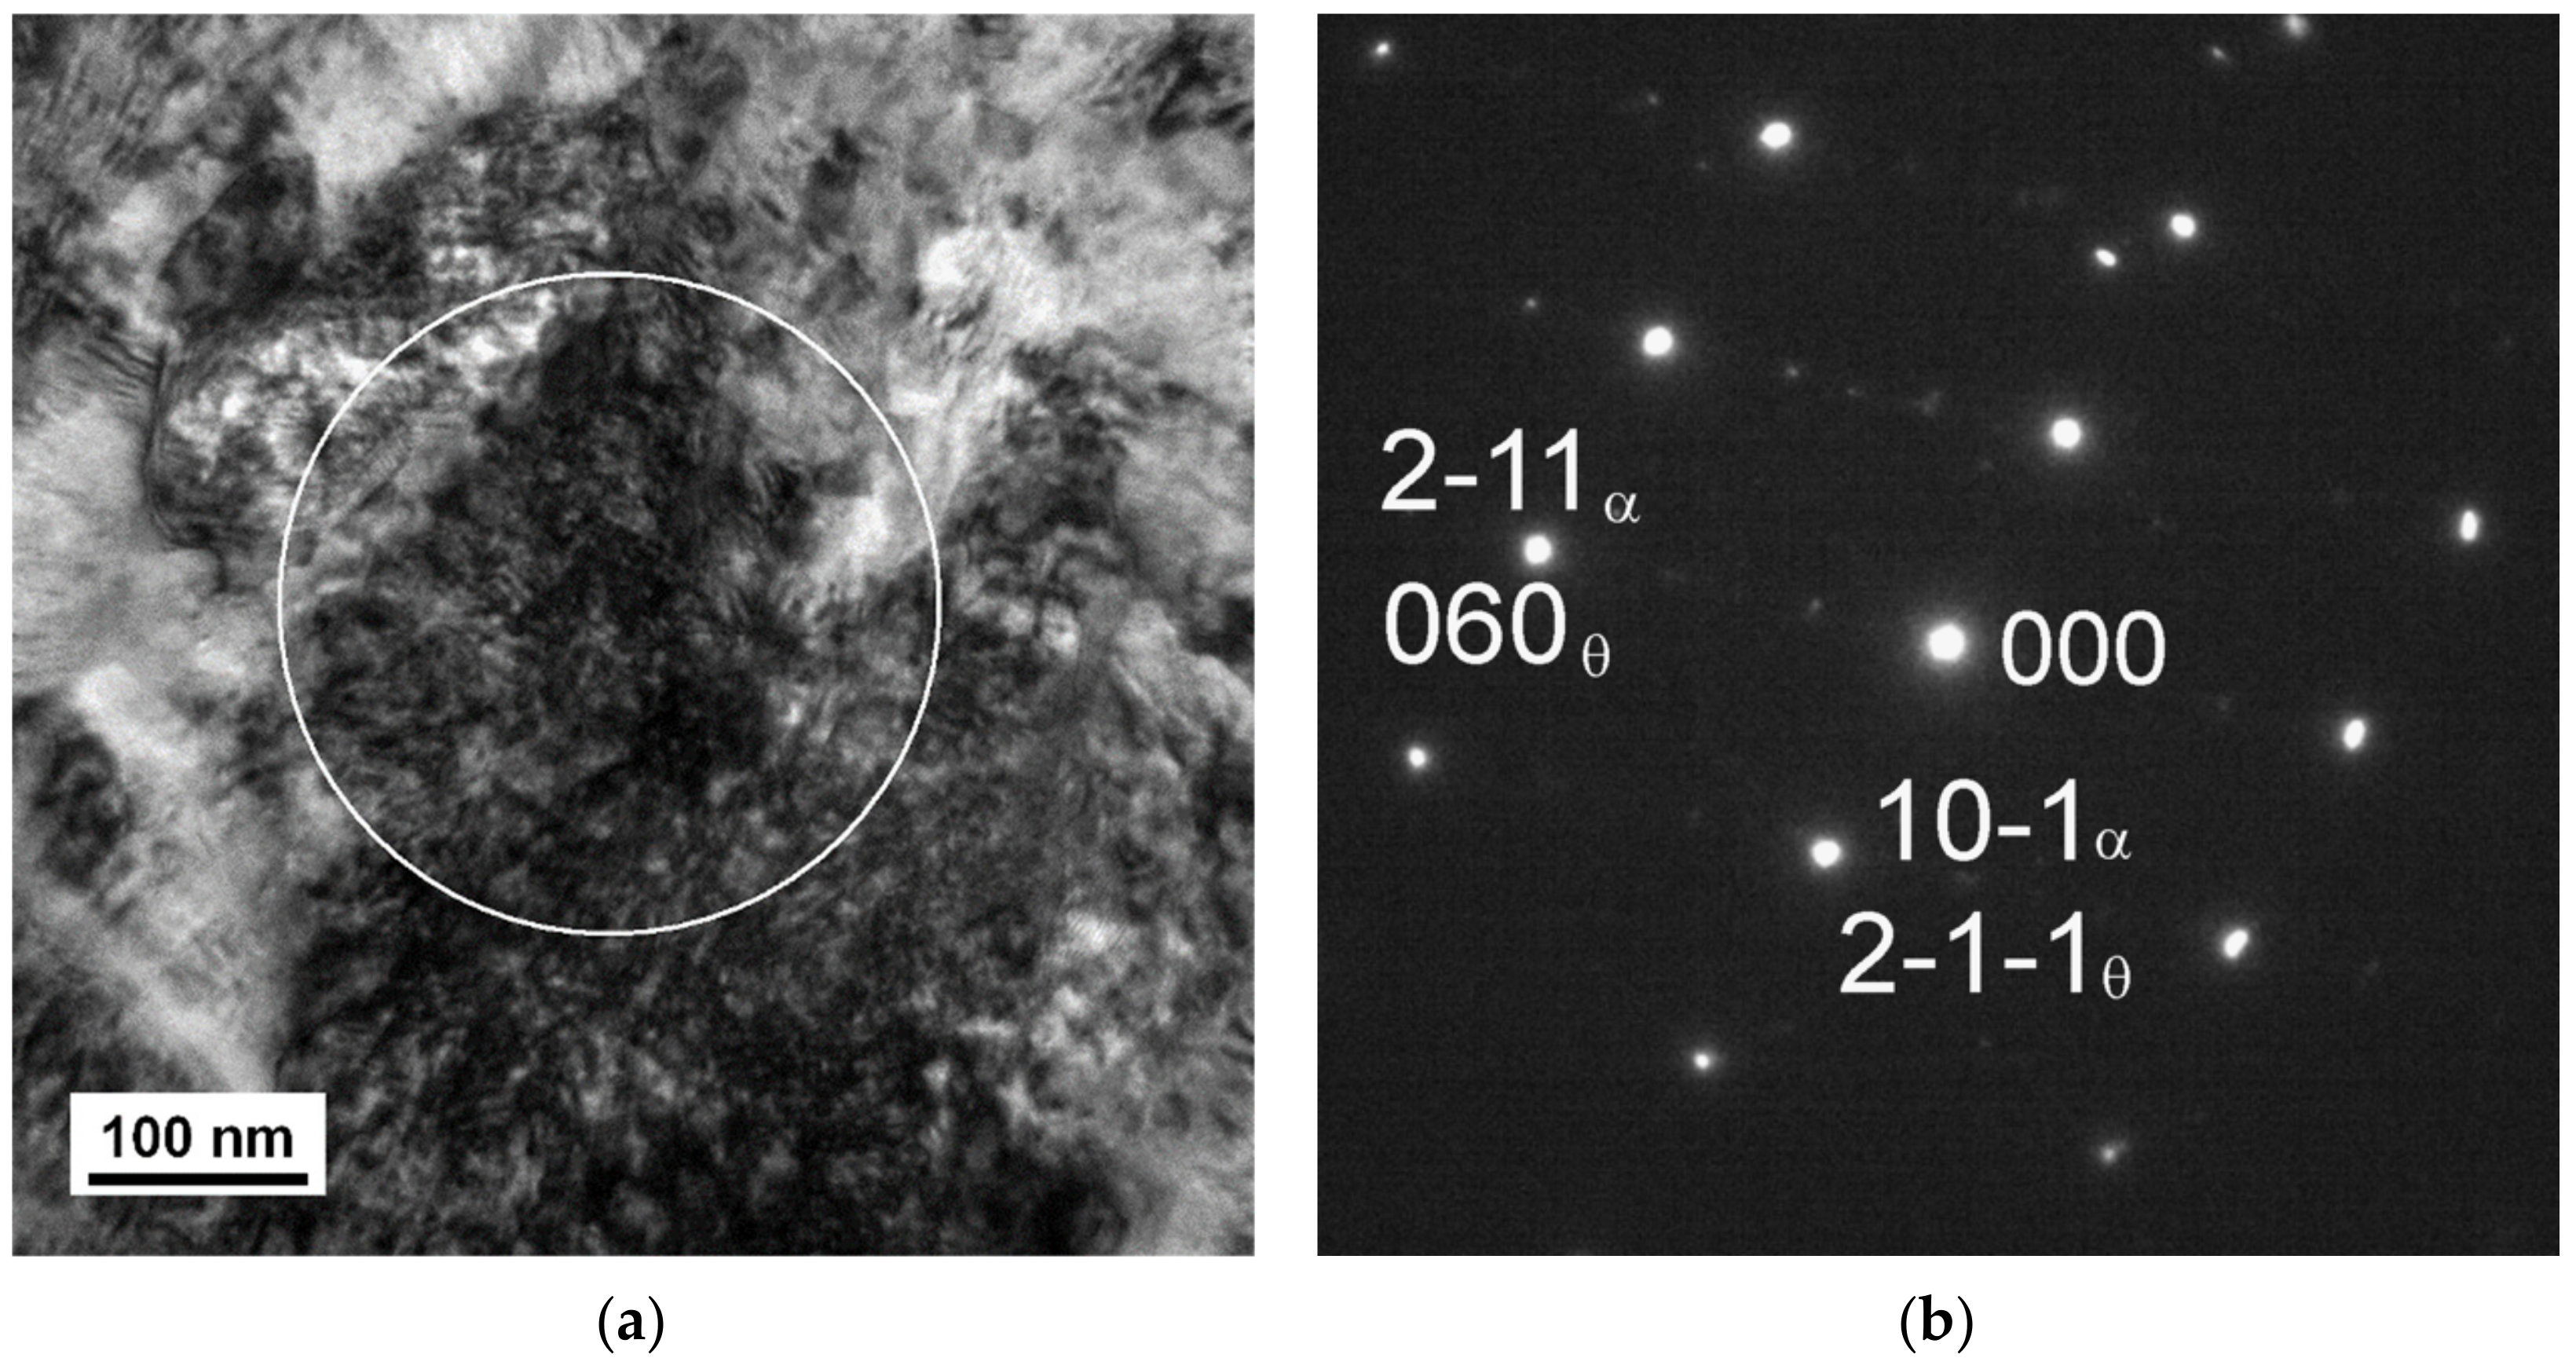
3.2. TEM Analysis
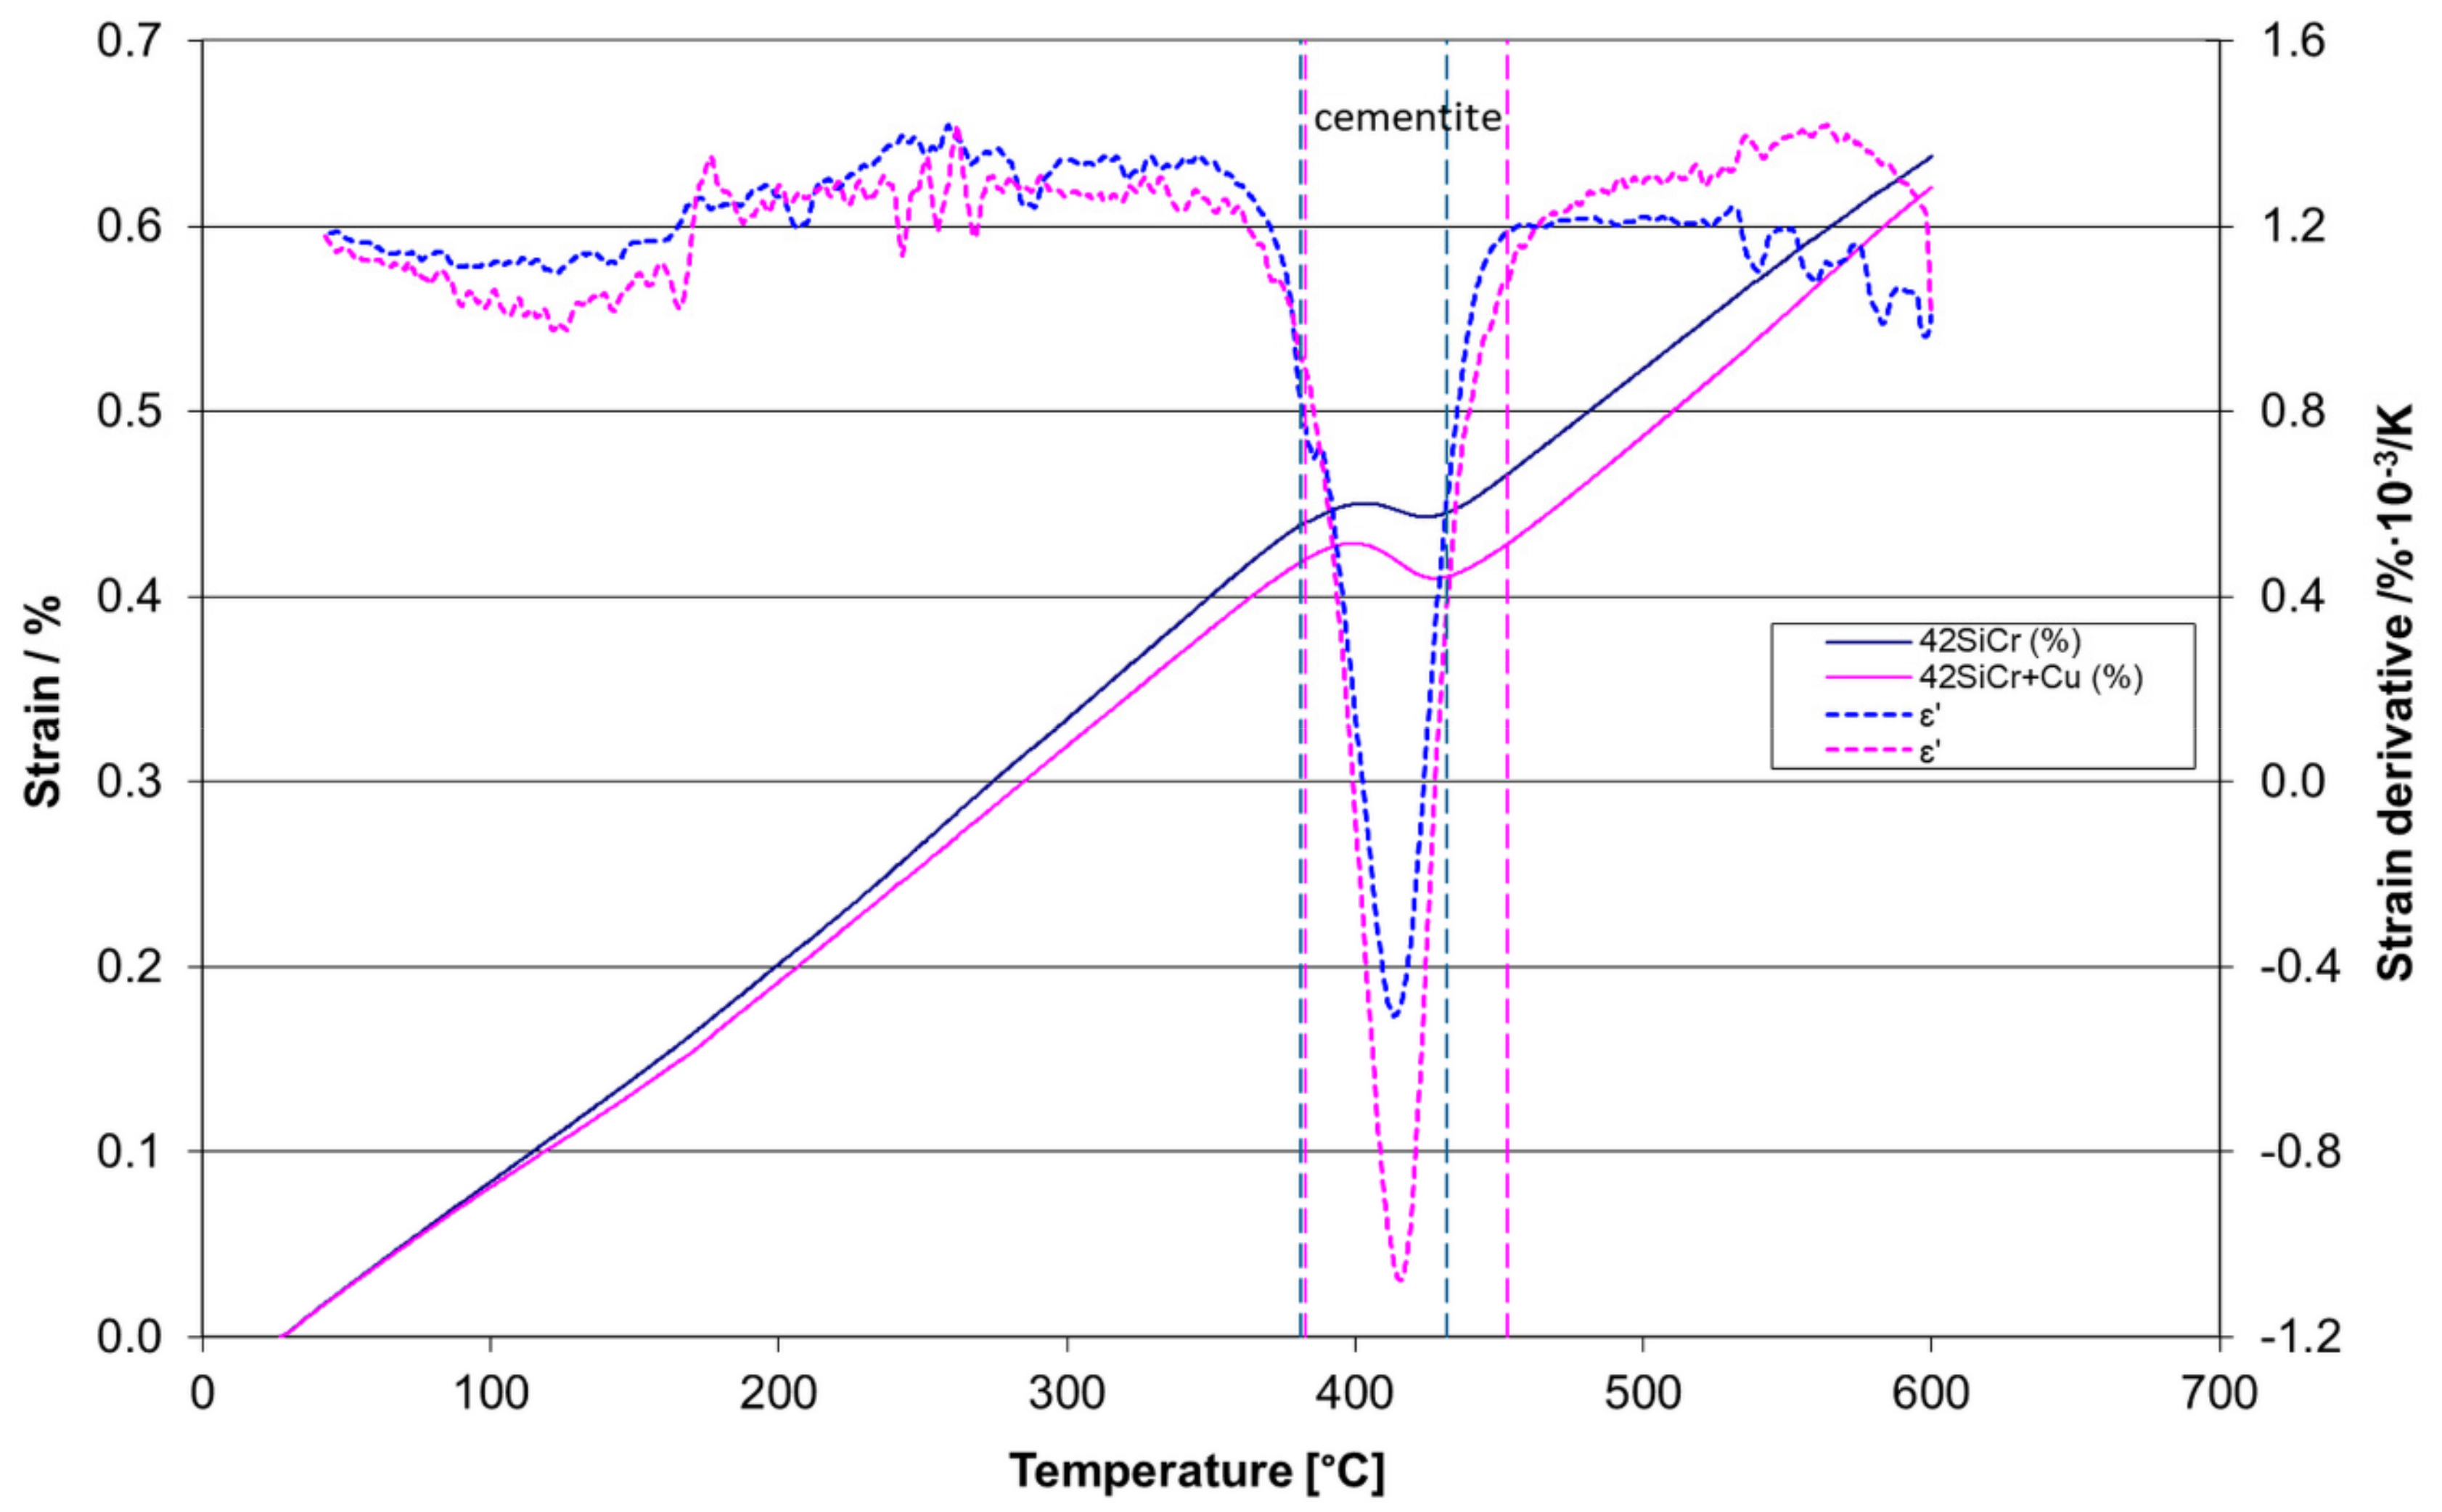
3.3. Dilatometry
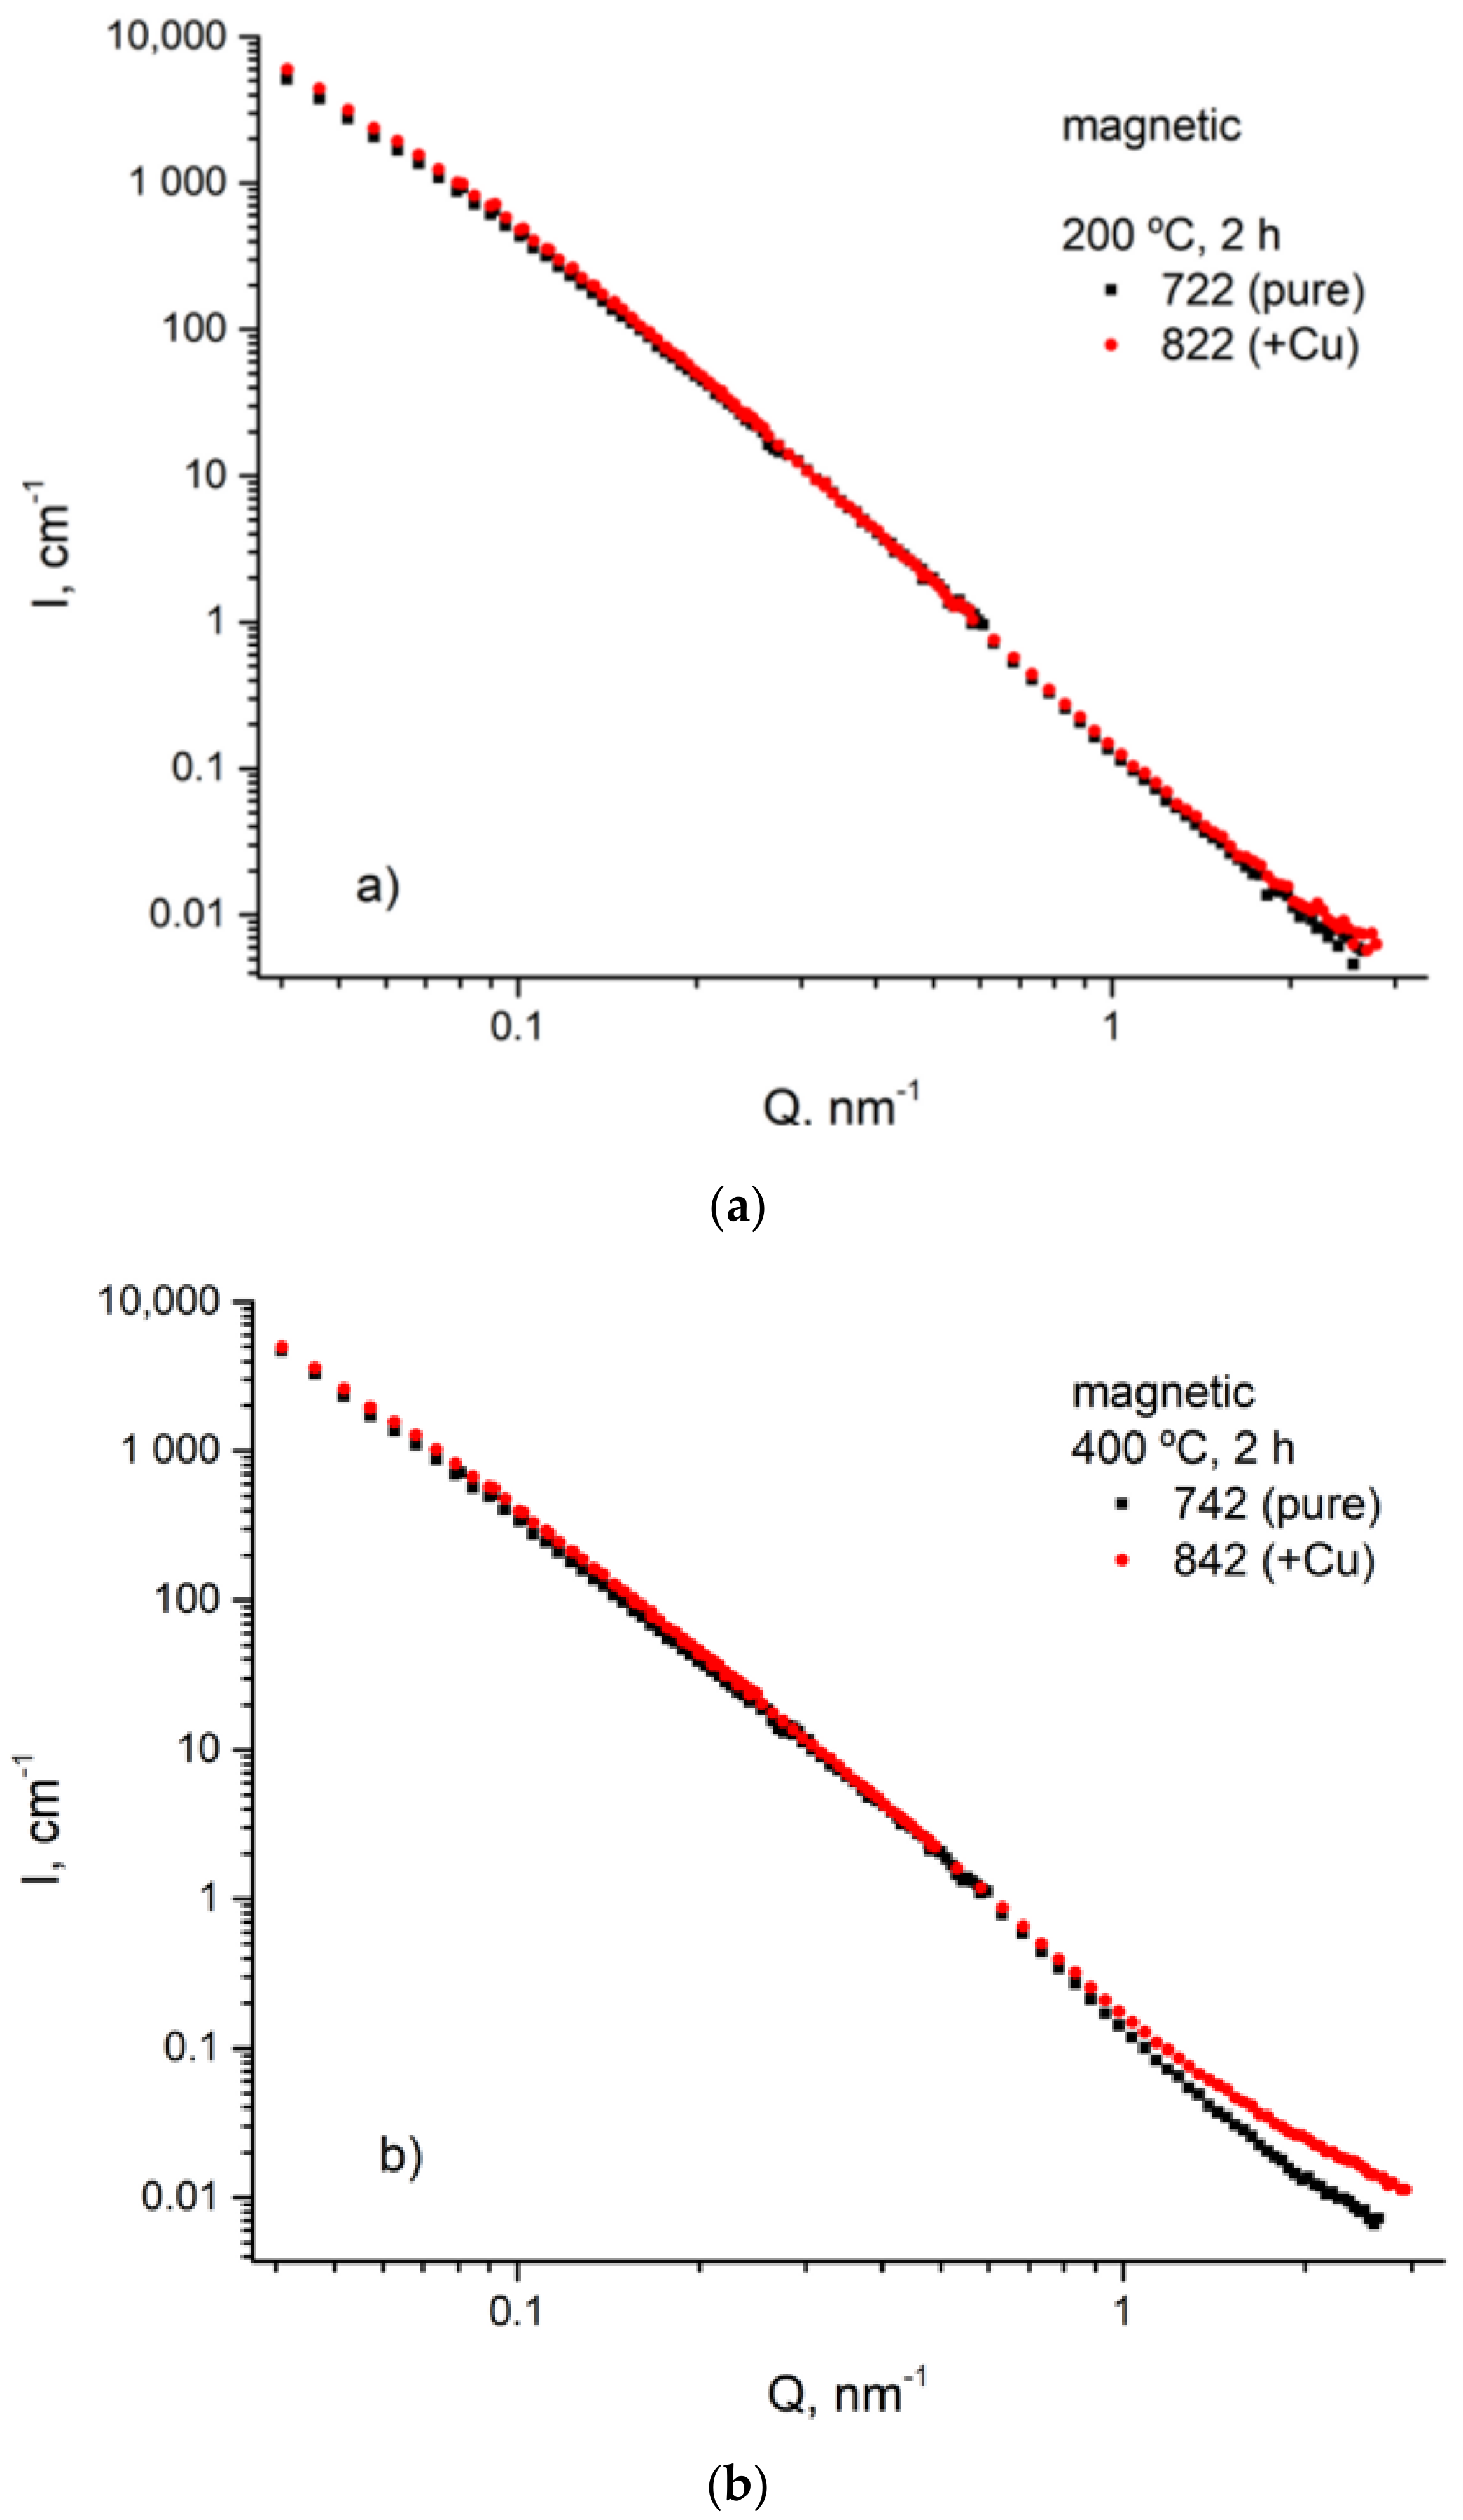
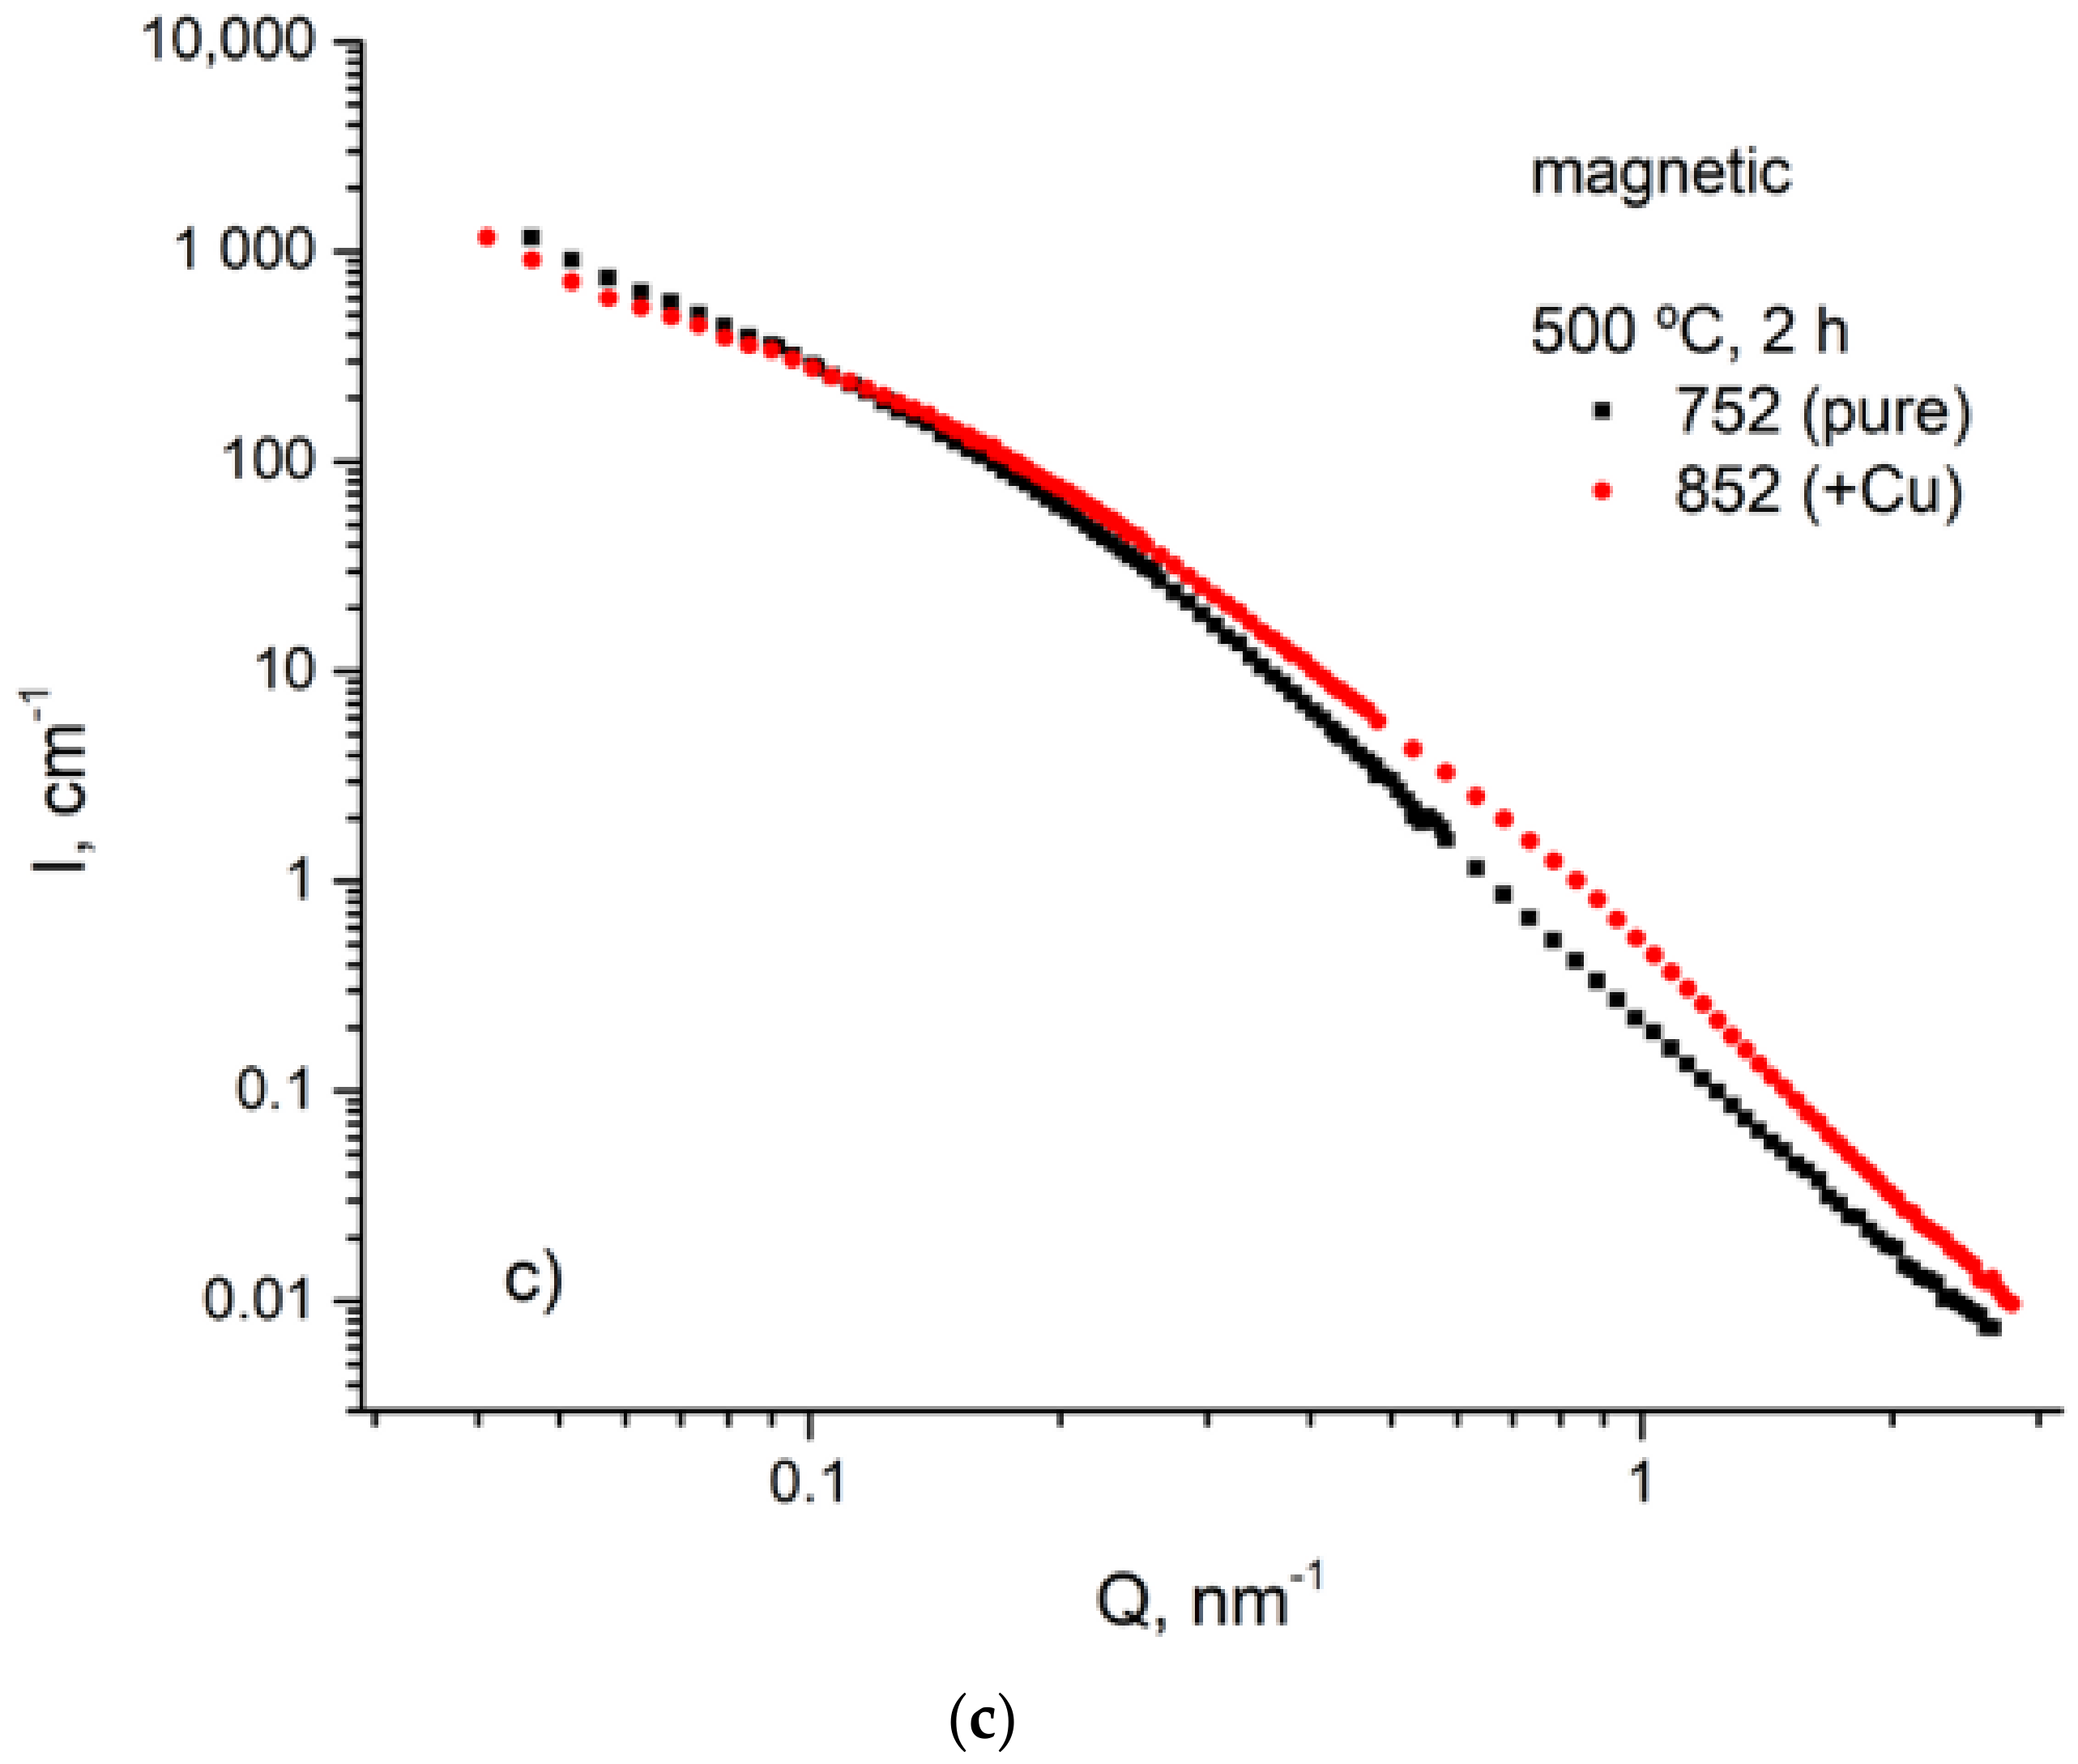
3.4. USANS Analysis
4. Discussion
4.1. Phase and Microstructure Analysis
4.2. Activation Energy of Carbides
4.3. Mechanism of Epsilon-Carbide and Cementite Formation
4.4. Size and Morphology of Carbides
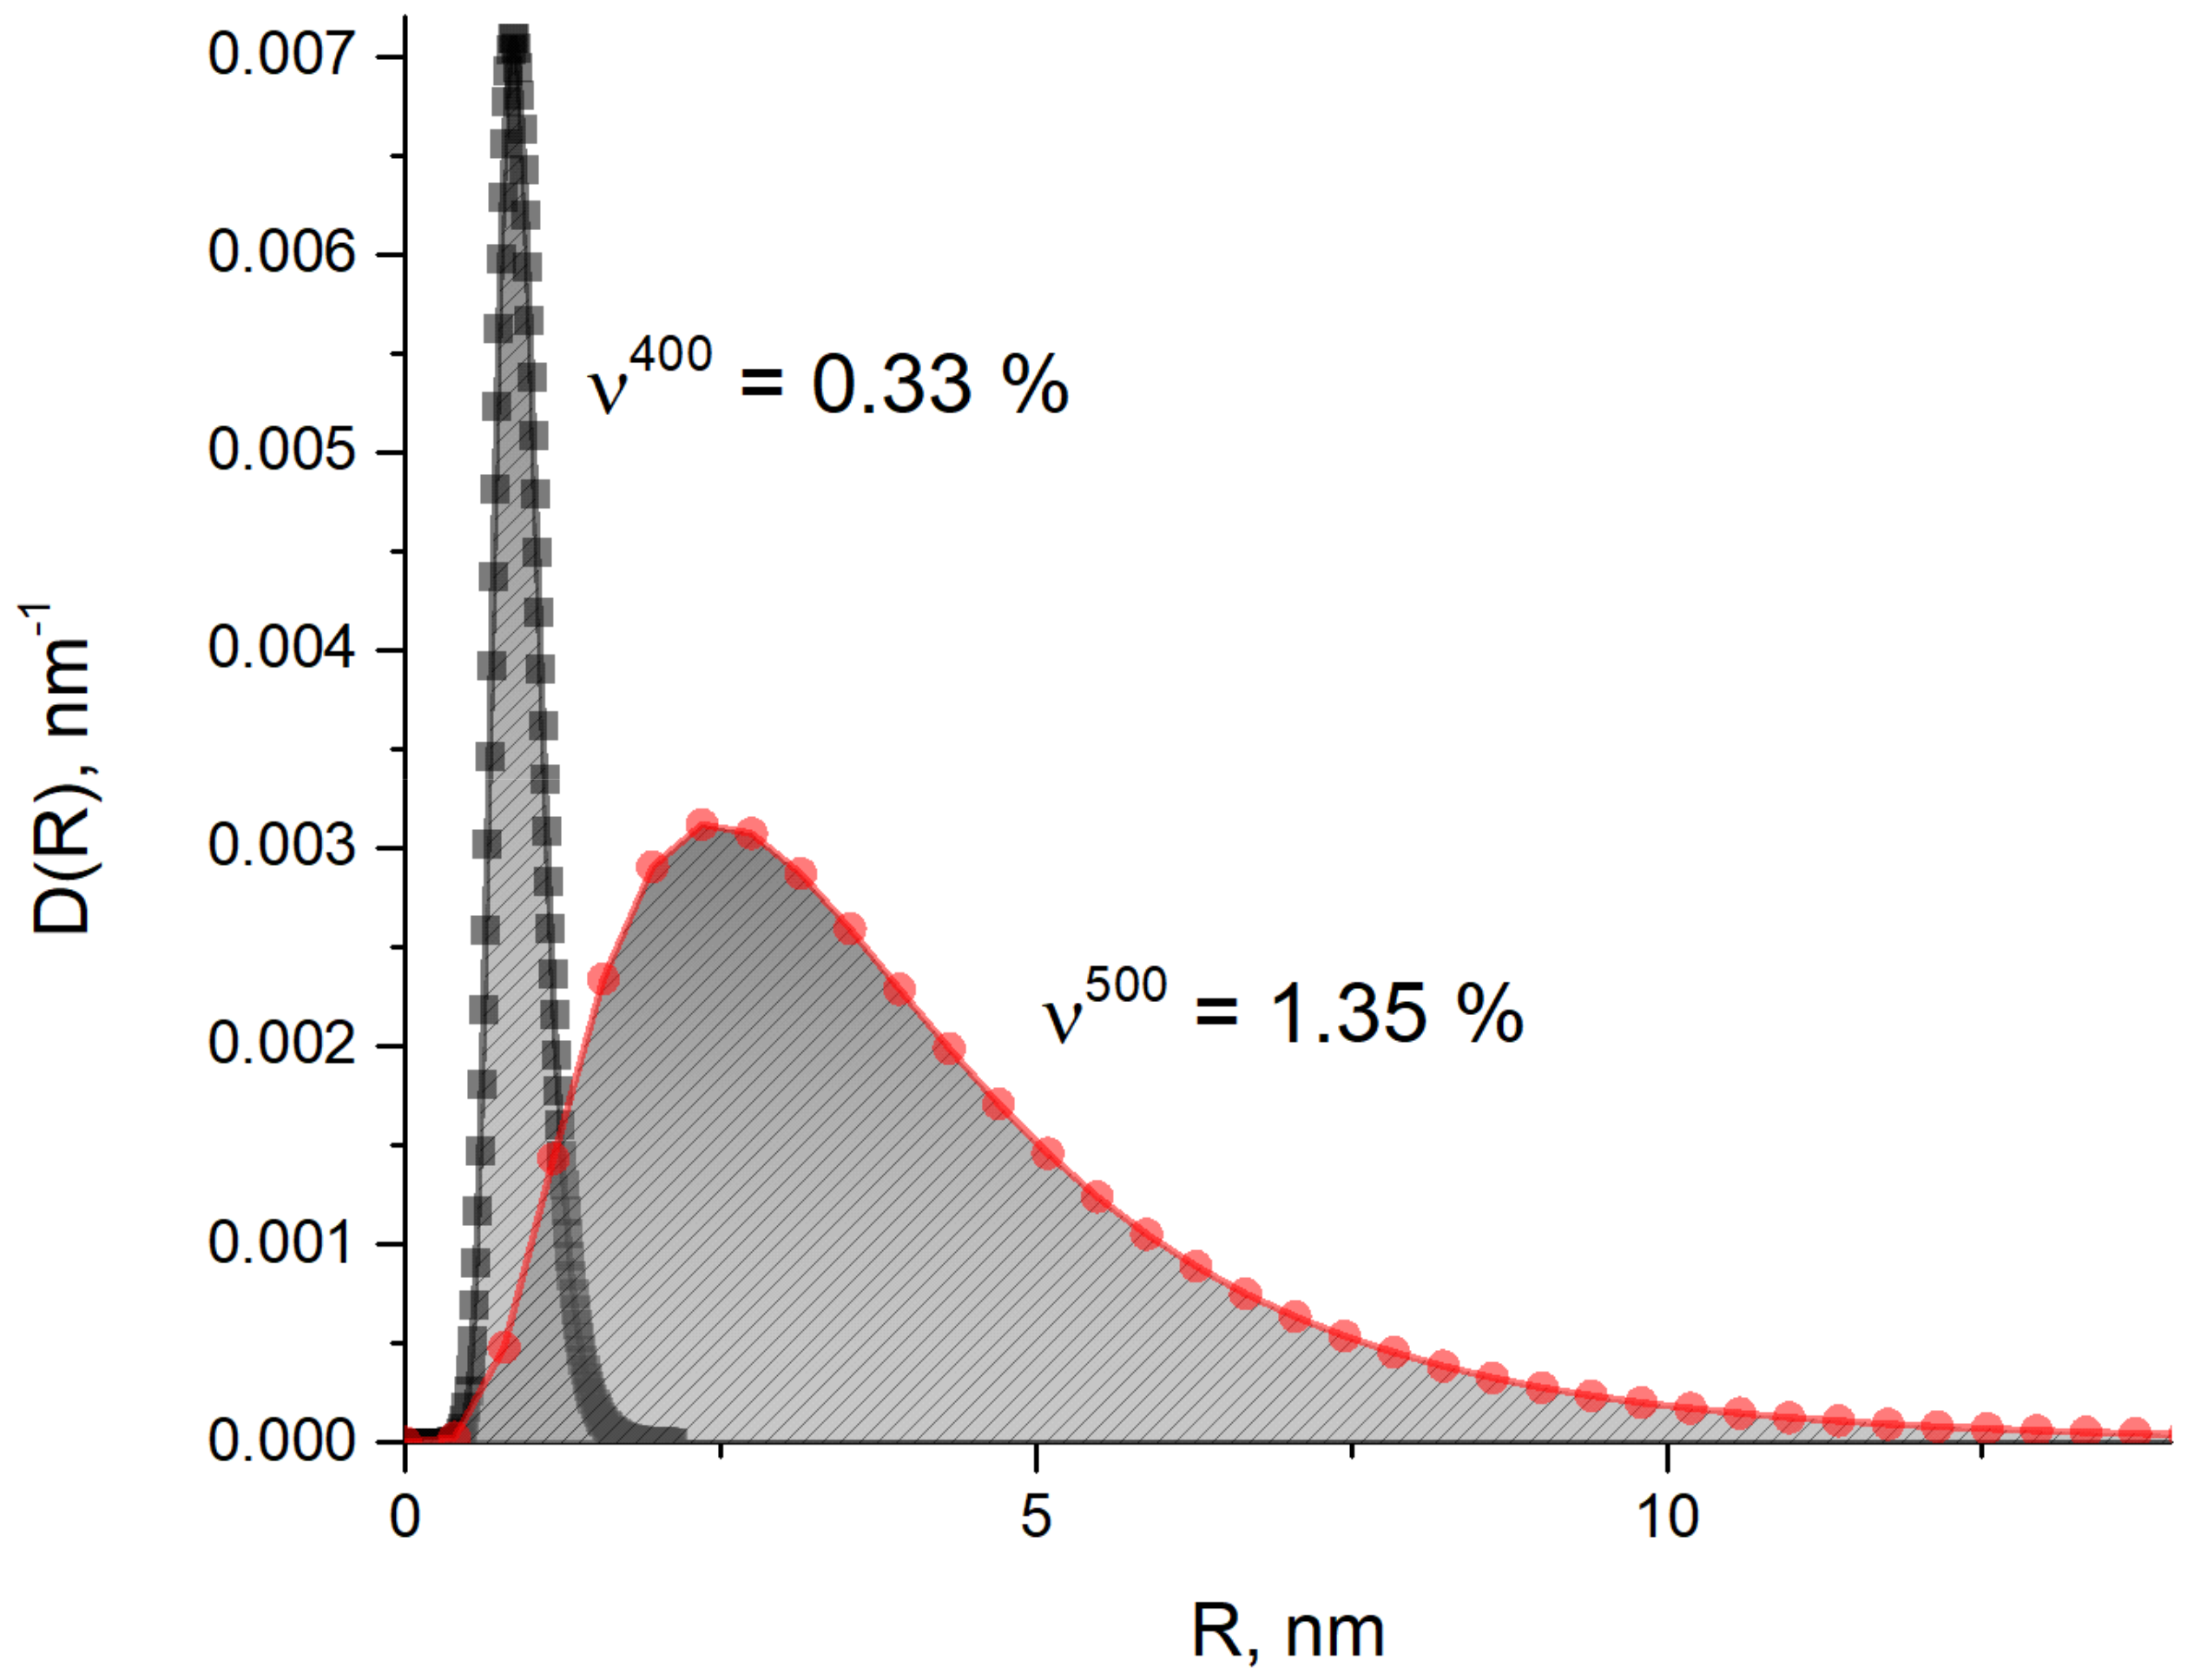
4.5. Size and Morphology of Cu Particles
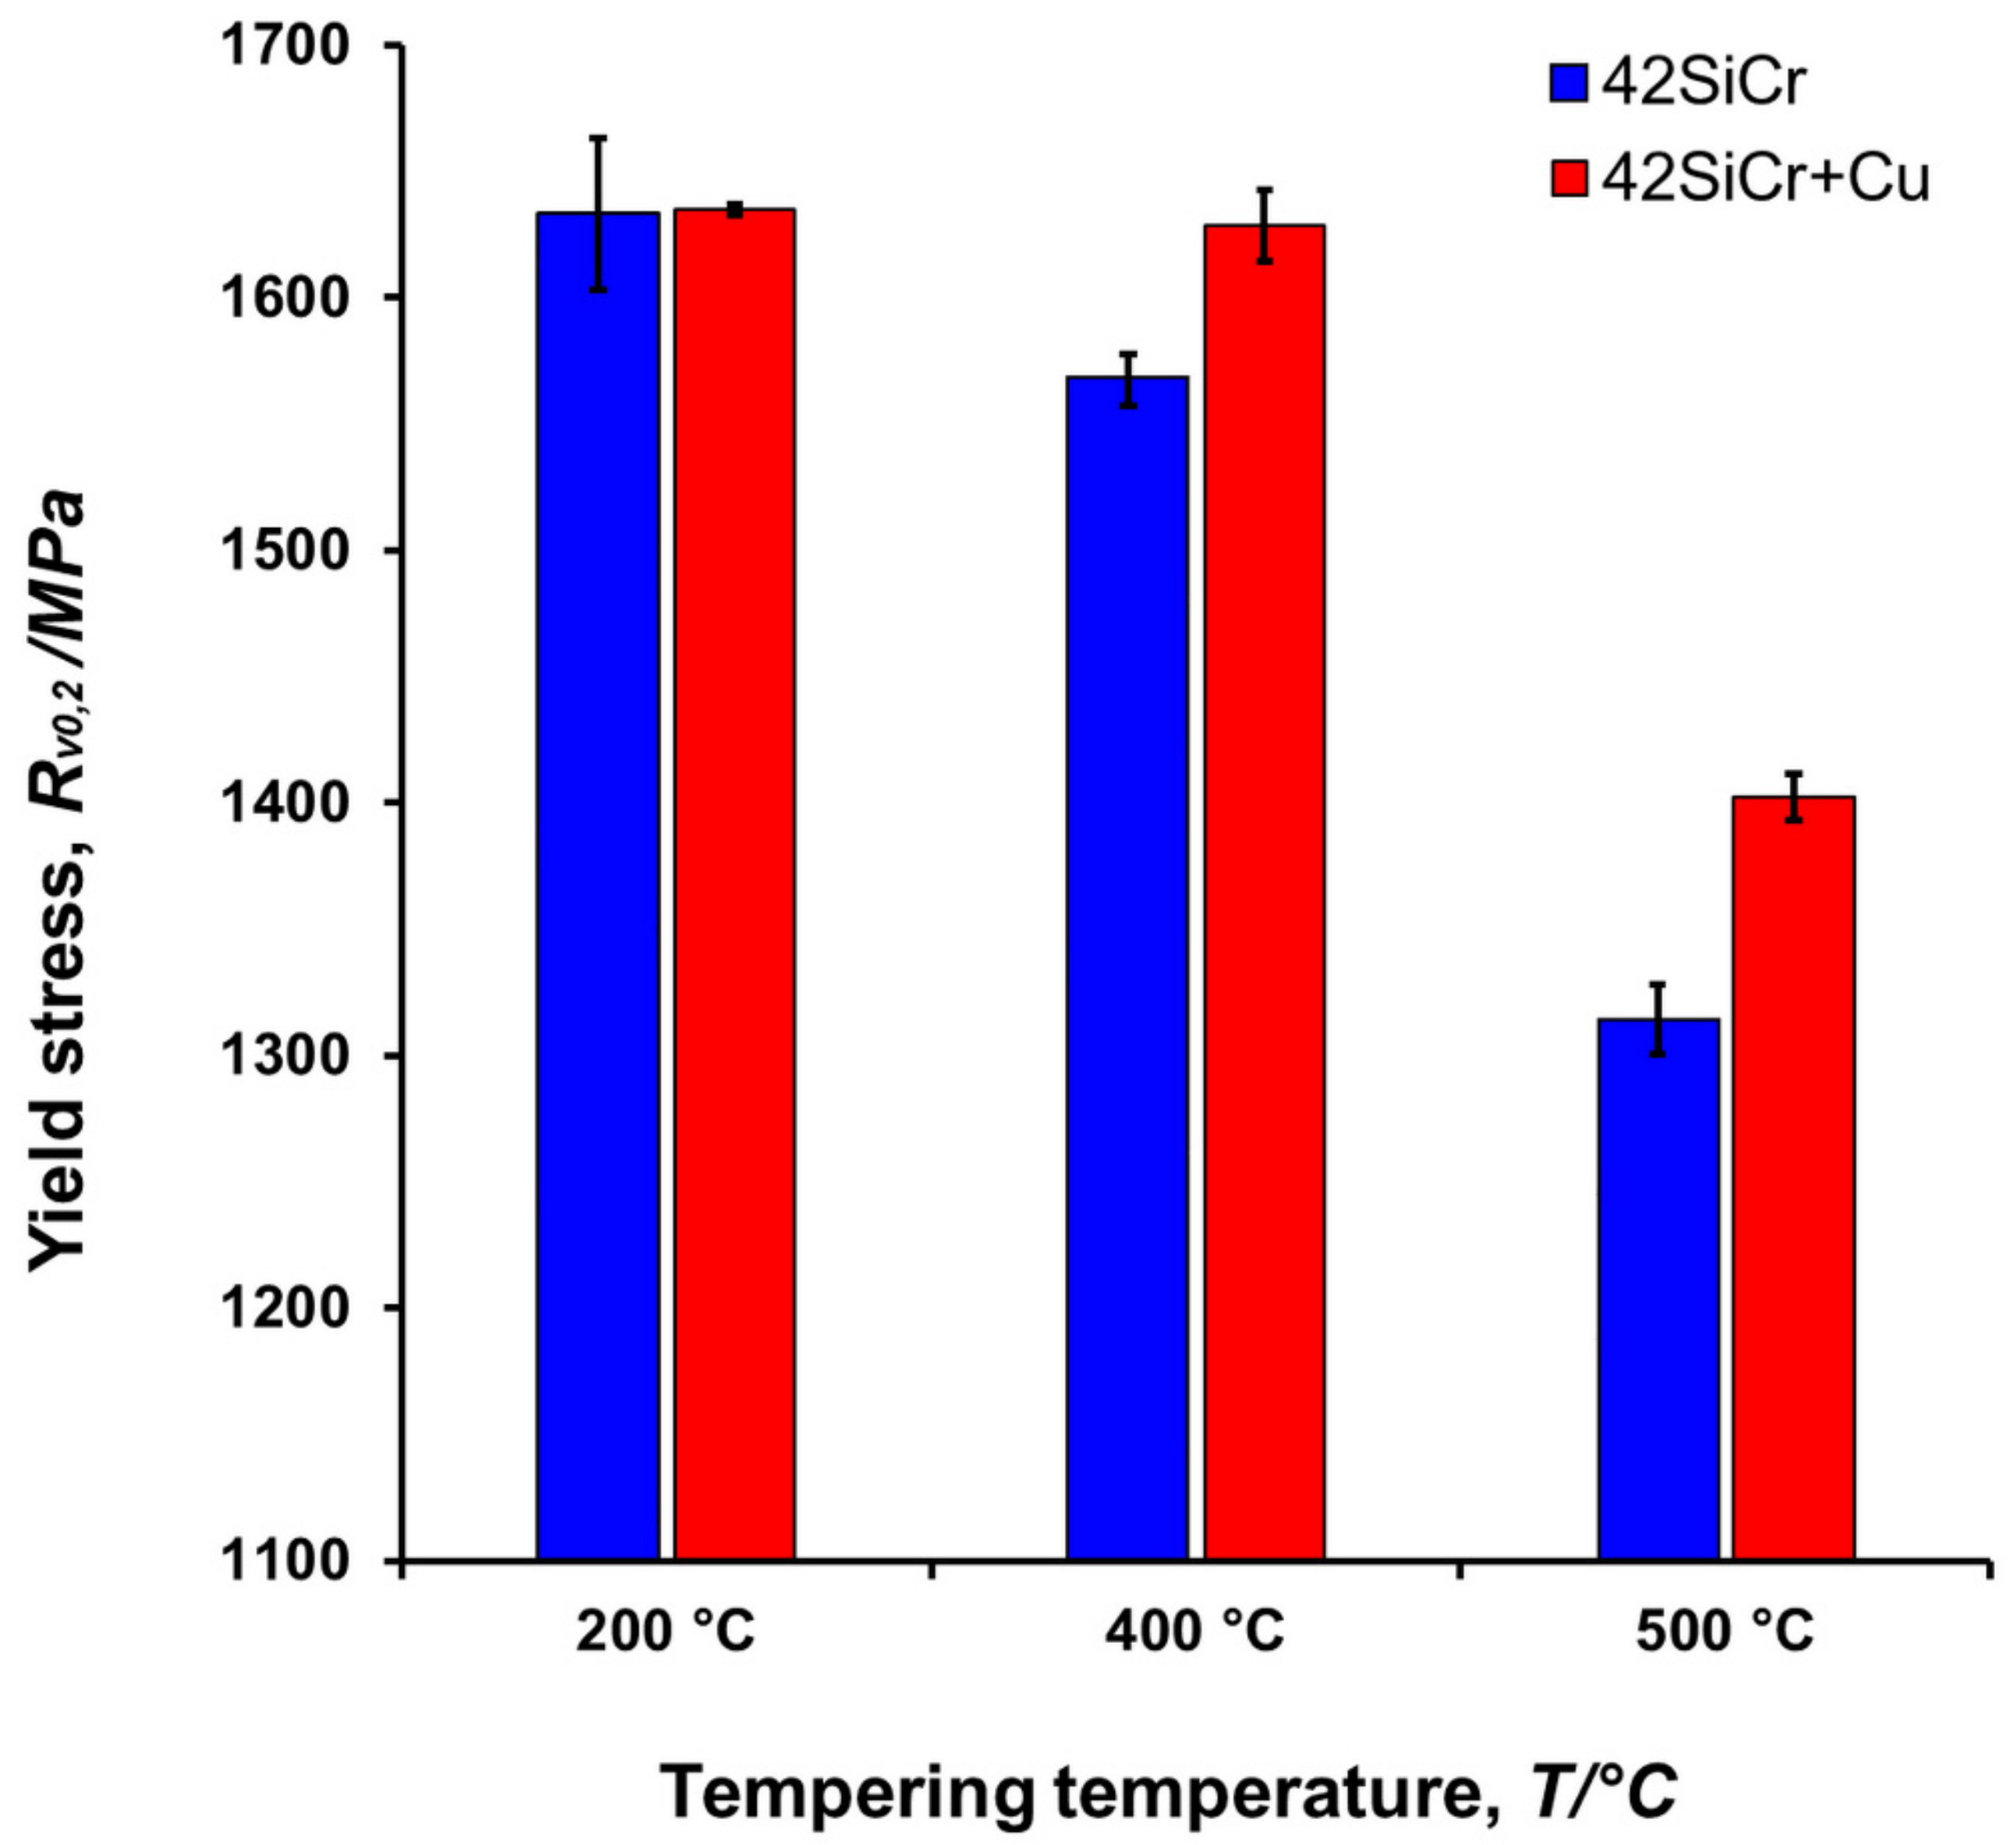
4.6. Yield Stress vs. Cu Precipitation
4.7. General Microstructure Features
5. Conclusions
- An increase in the Si content from 0.03 wt% to 2.40 wt% leads to the significant increase (by 80 kJ/mol) of the activation energy for cementite formation and slight increase of it for ε-carbide formation. The mechanism of copper precipitation is insensitive to Si and Cr increase. On the other hand, Cu addition led to an increase in the strain present in the material. However, this effect decreases with non-isothermal tempering using continuous heating with an increase in heating rate from 0.5K/s.
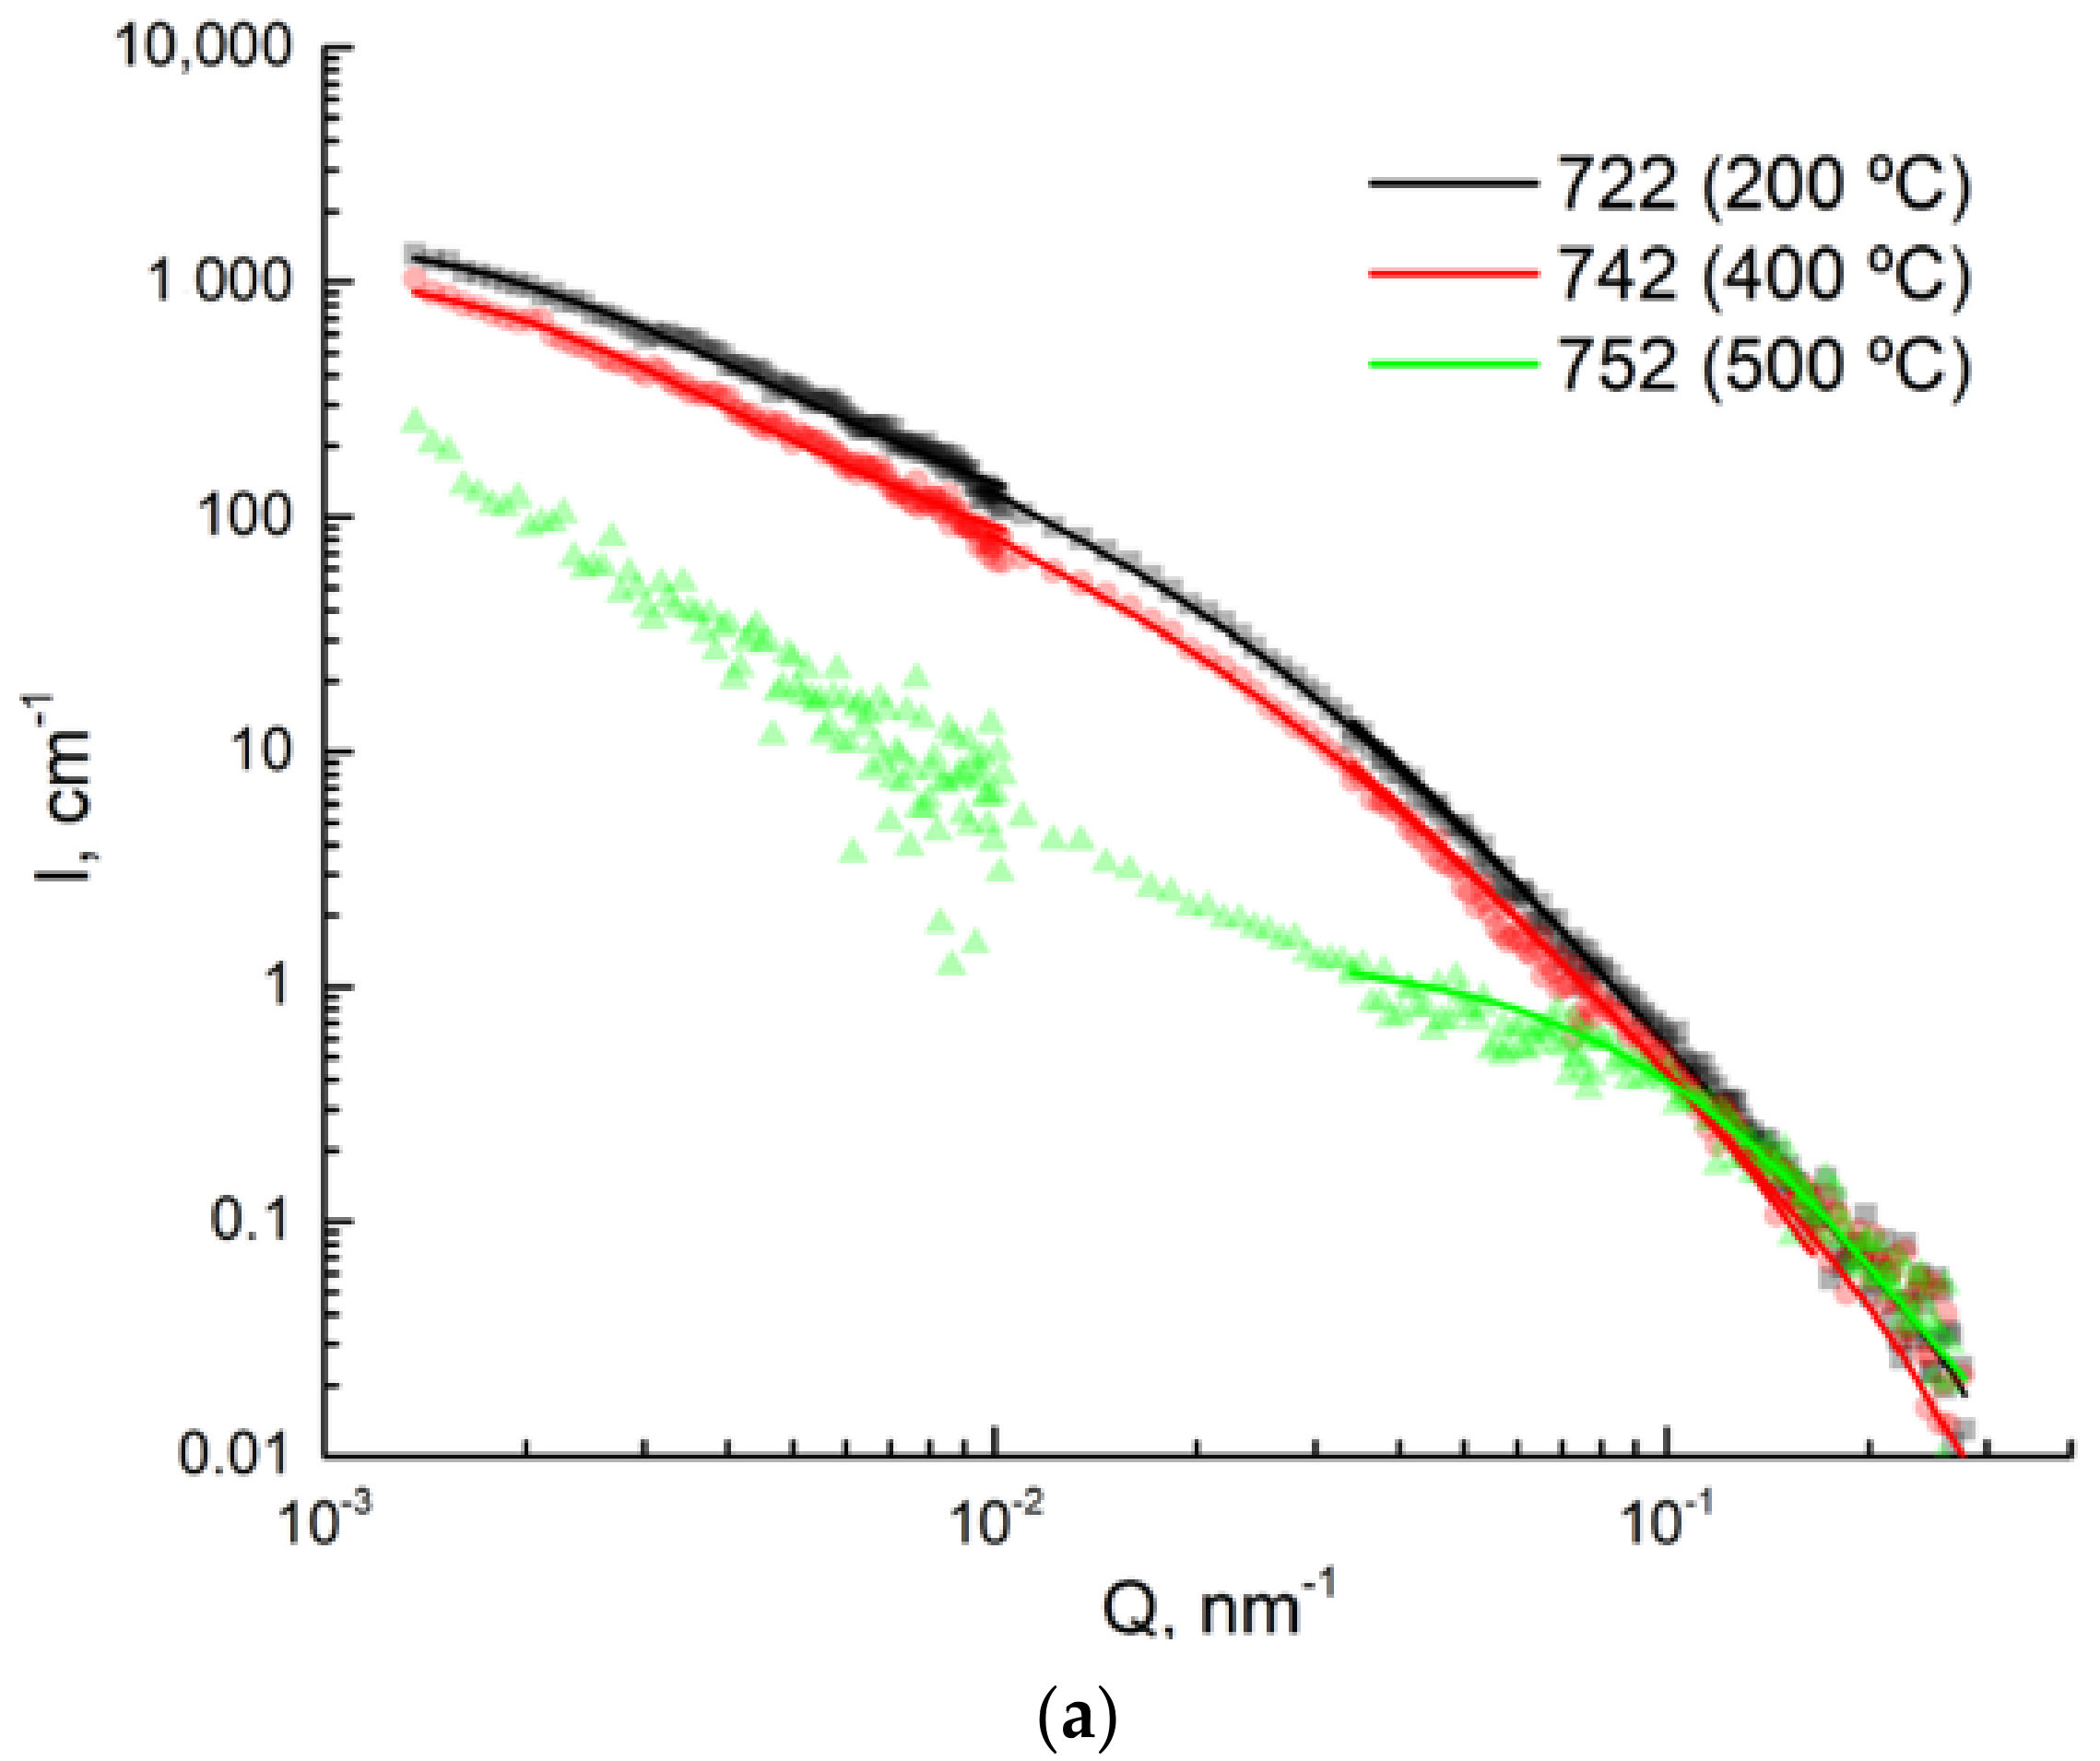
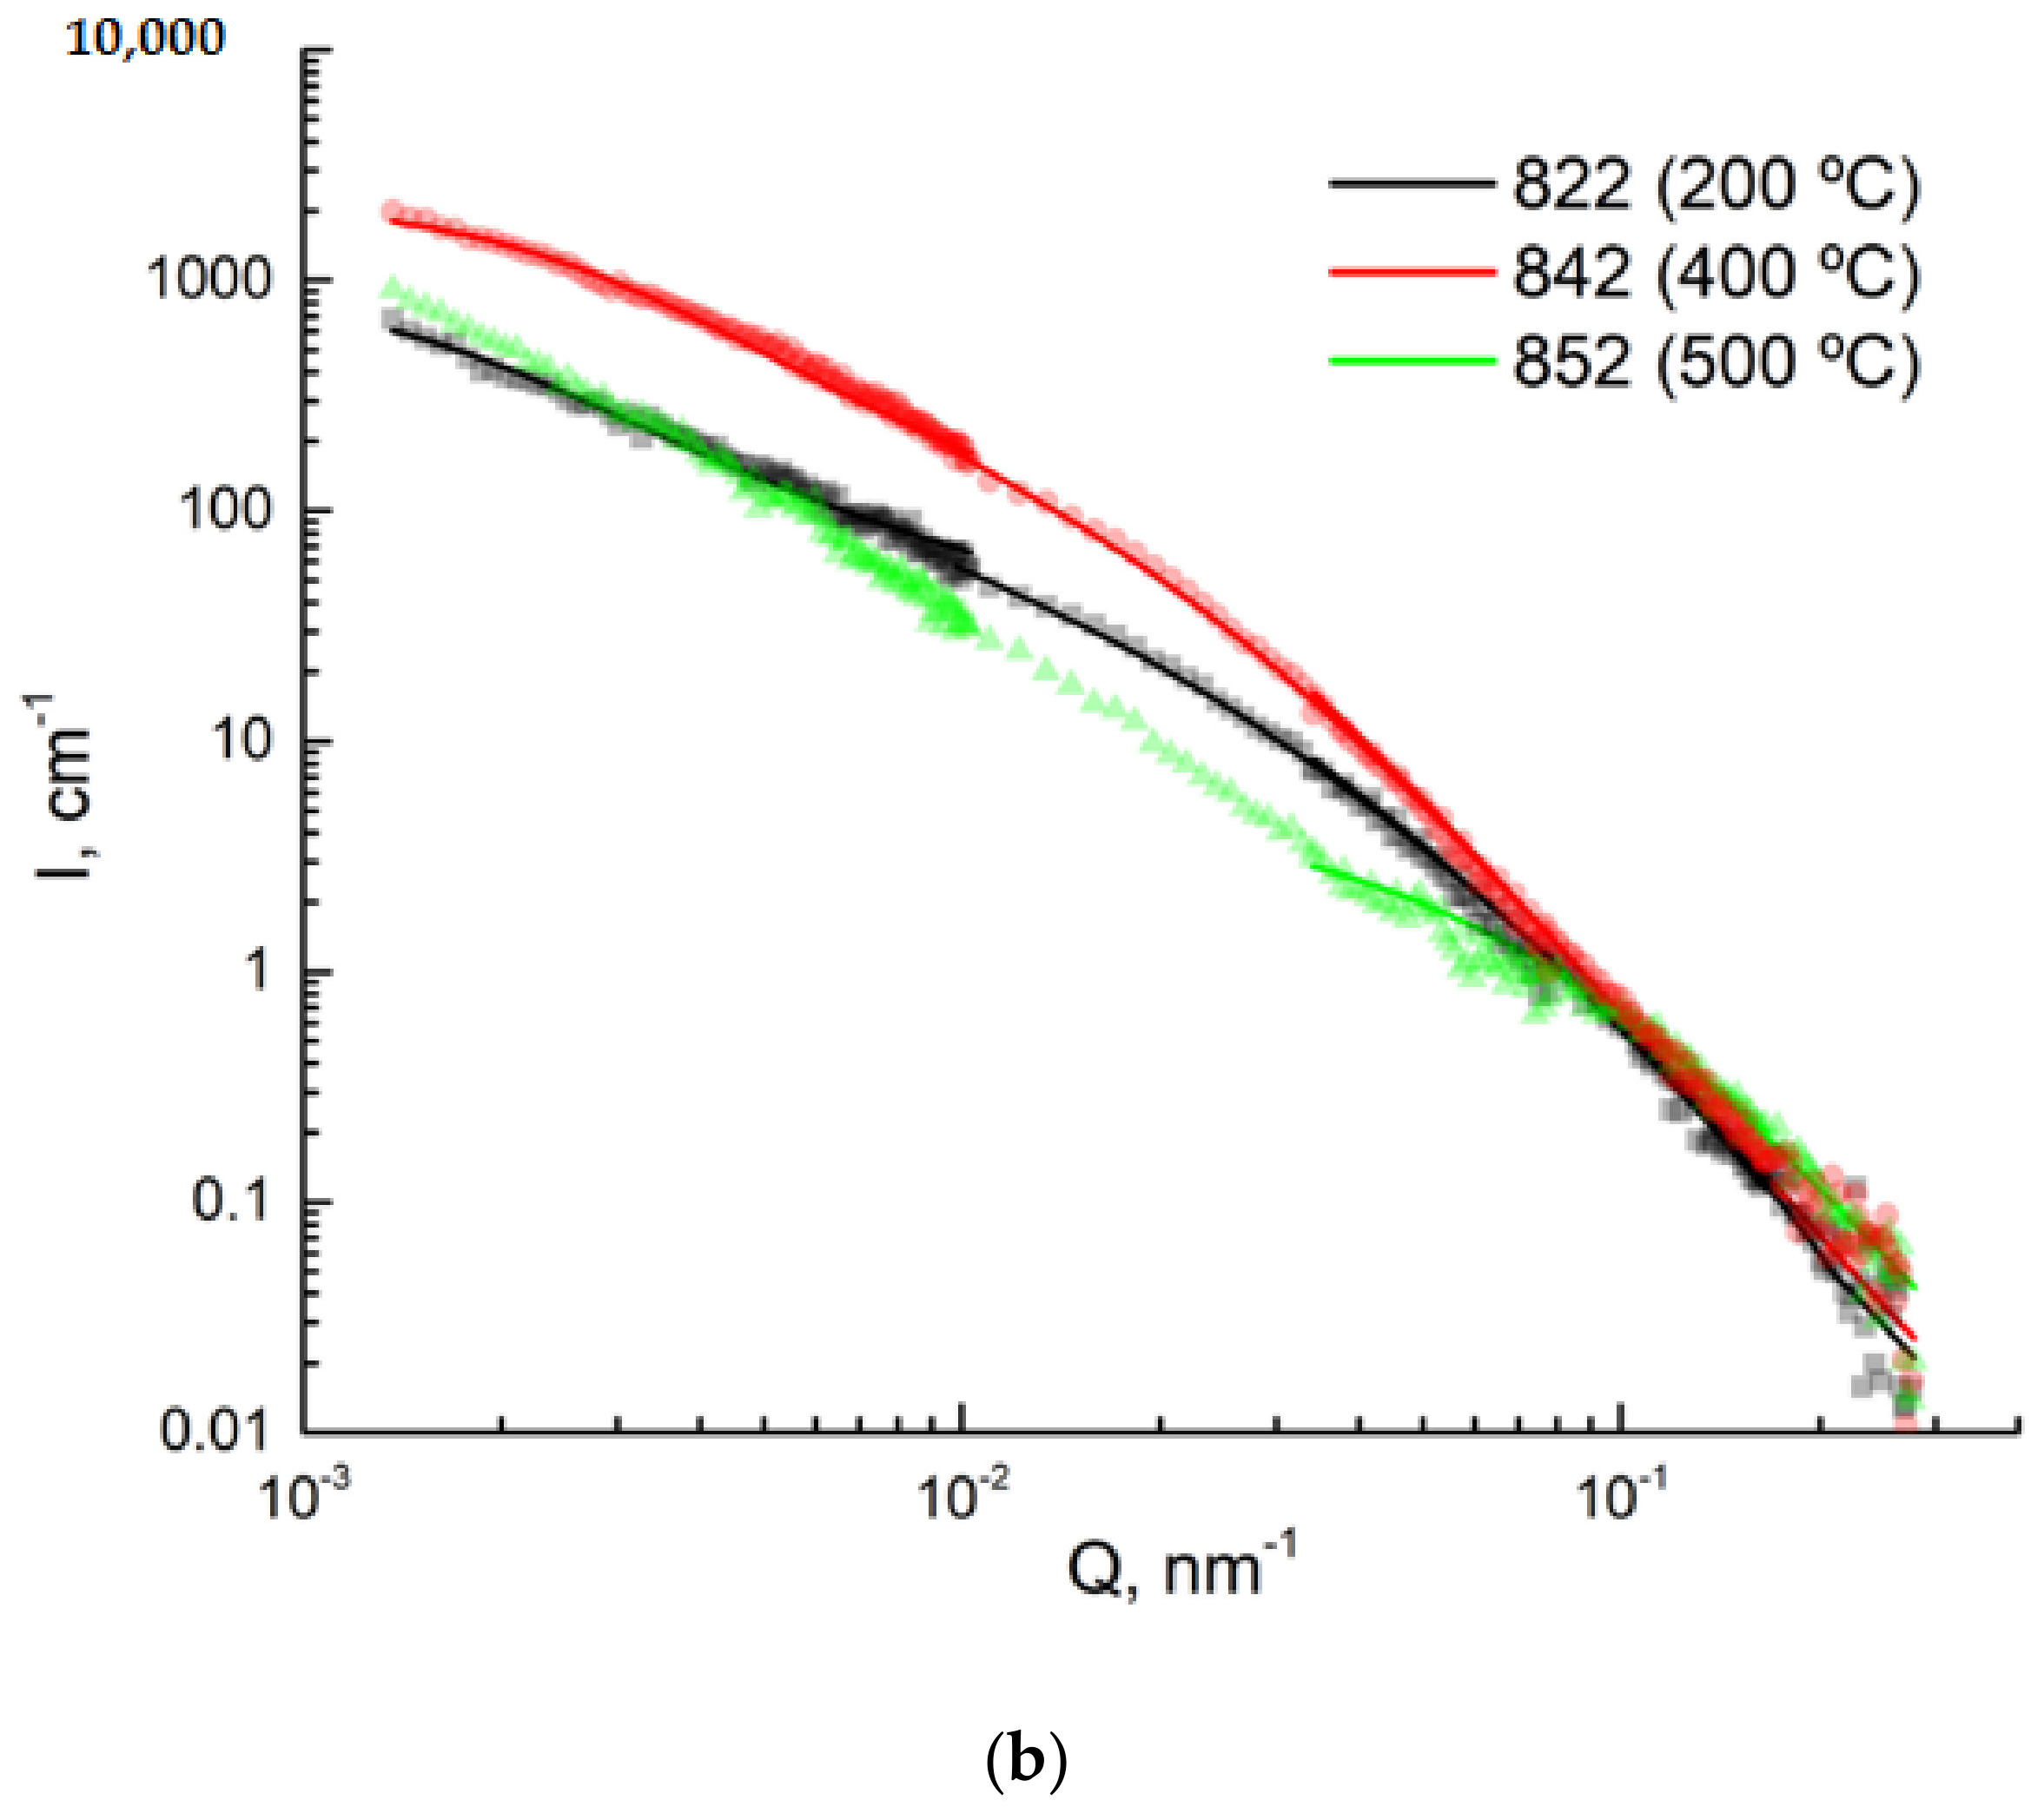
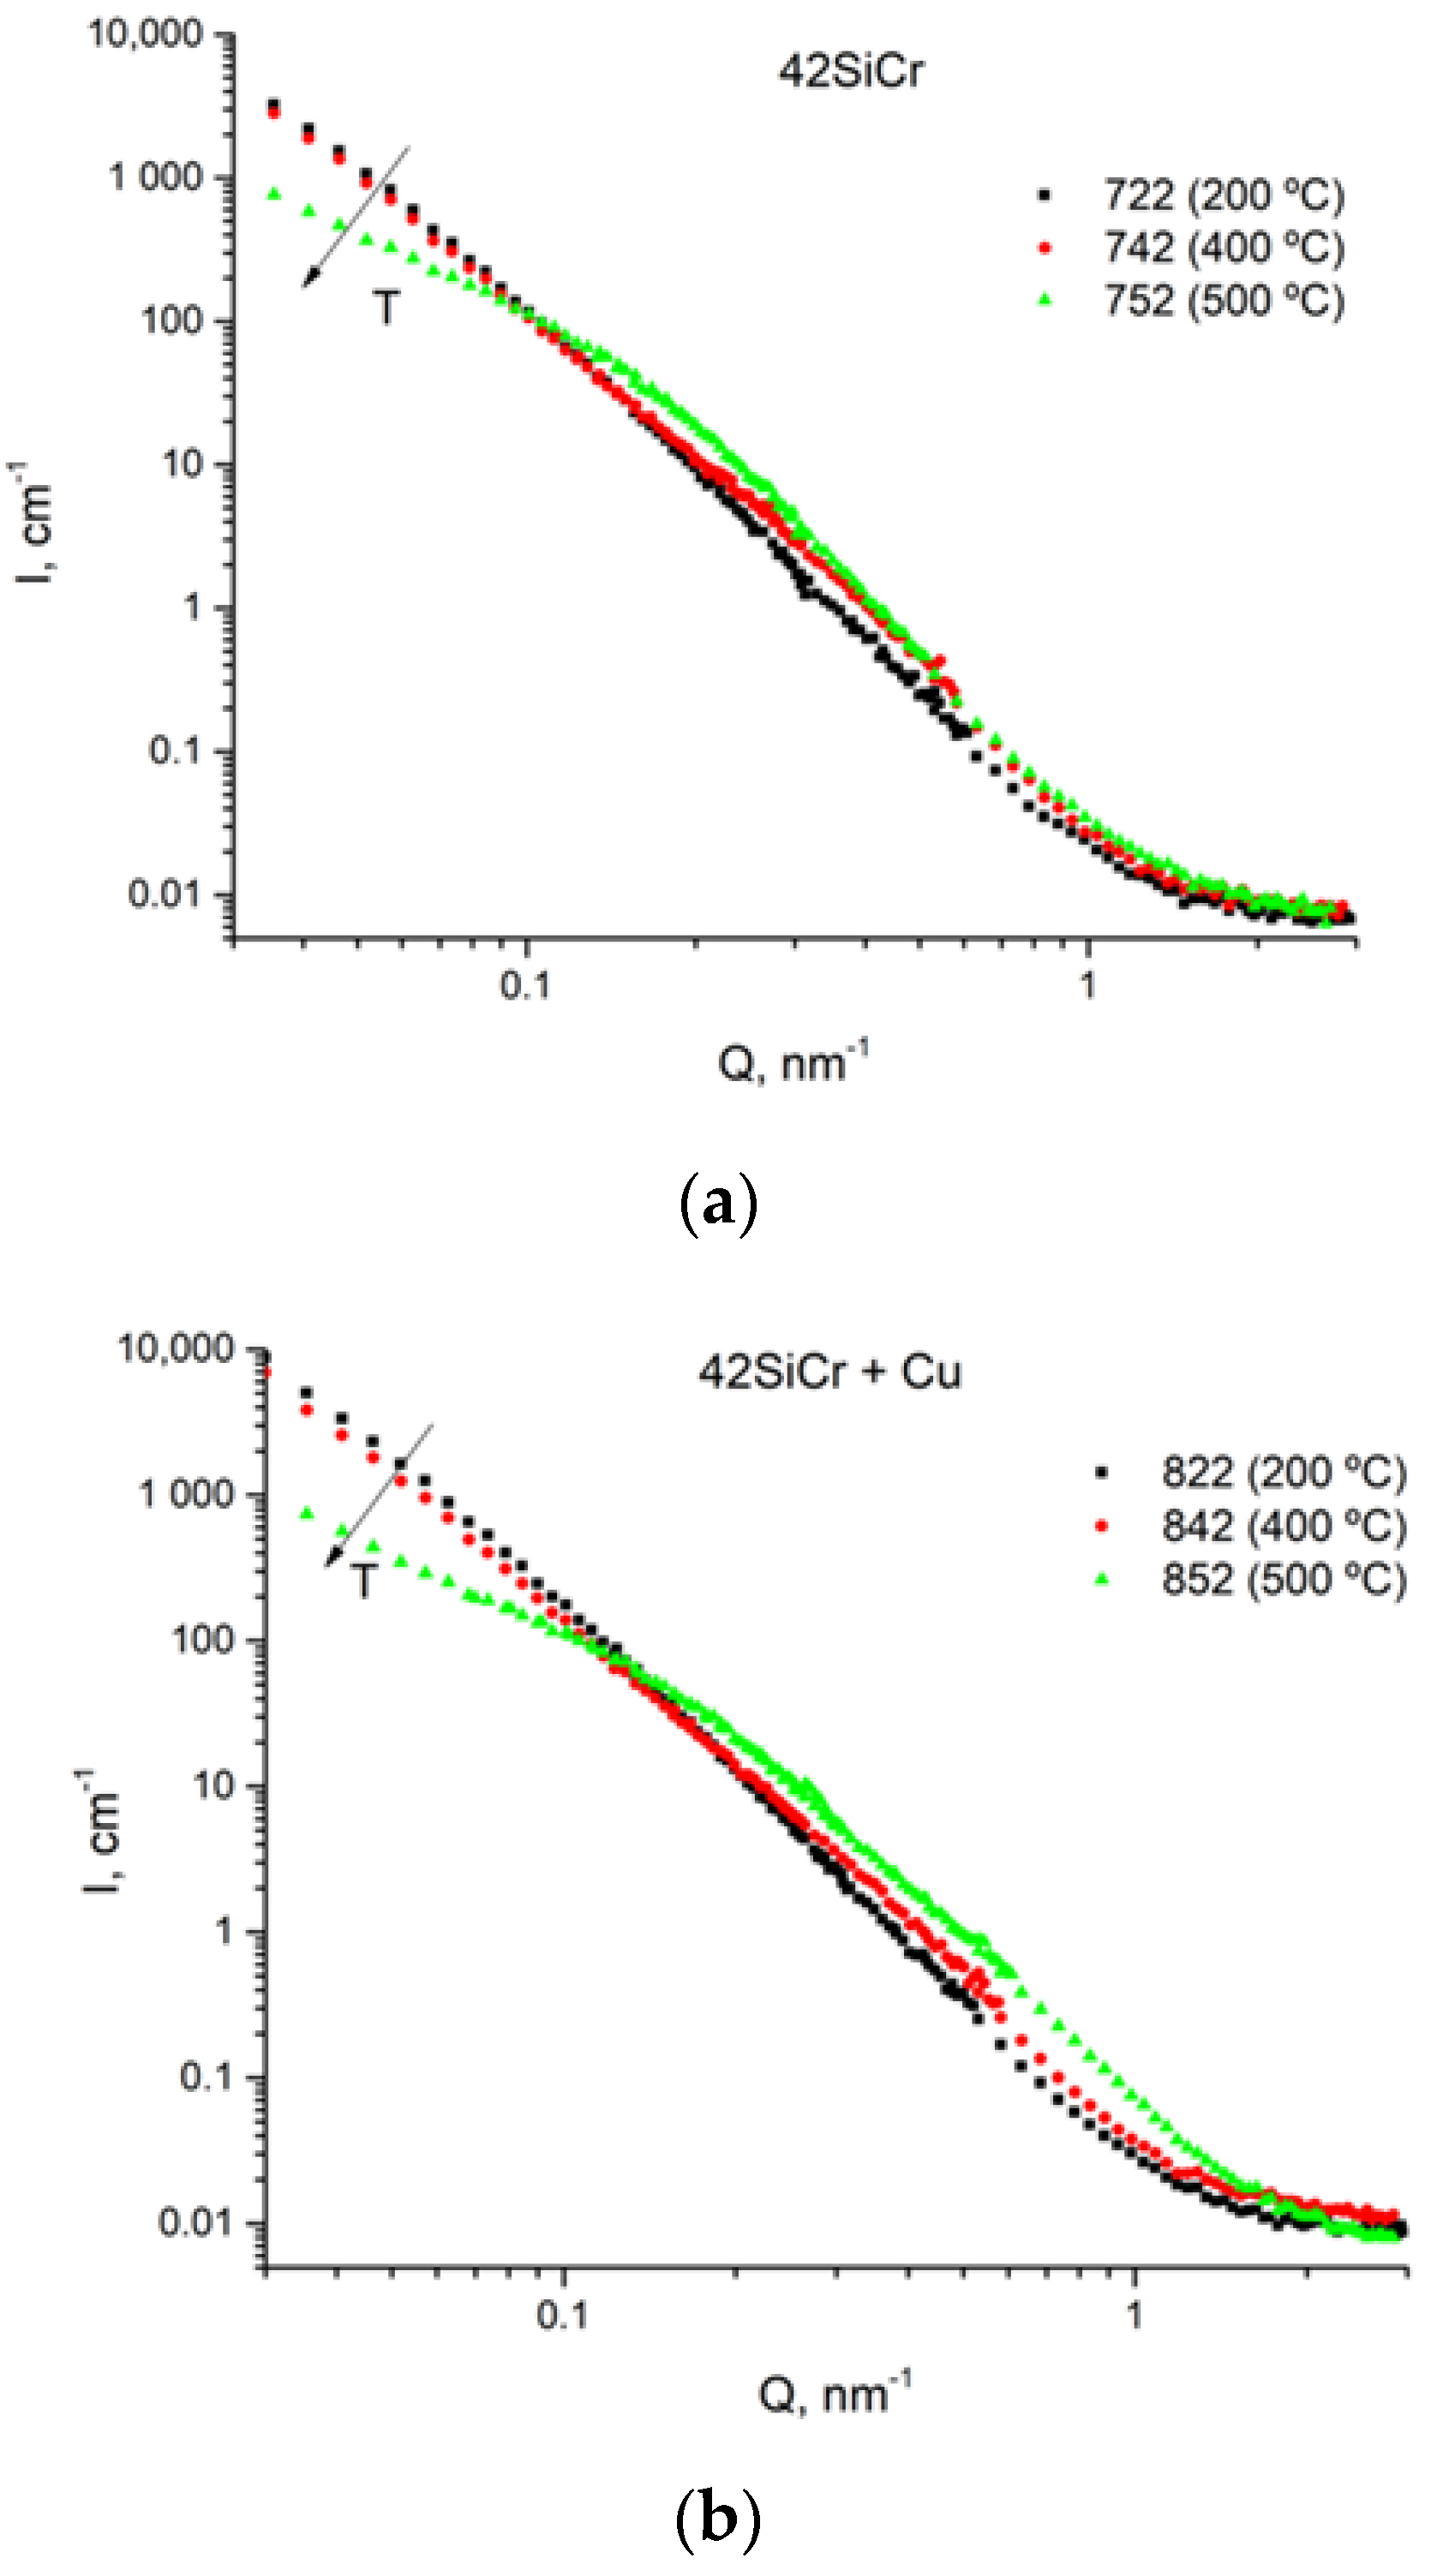
- SANS and USANS were used as complementary methods to electron imaging. Utilizing of magnetic SANS was especially efficient since it provided of size and volume parameters of the fine Cu precipitations.
- The found steep change in the size and volume fraction of copper particles correlates well with the difference in yield strength, RVp0,2 between 42SiCr and 42SiCr + Cu steels tempered at elevated temperatures. This effect can be described using the Russel-Brown model.
- The copper precipitates in 42SiCr + Cu steel tempered at 400 °C and 500 °C are enriched in copper, but they are not pure copper particles.
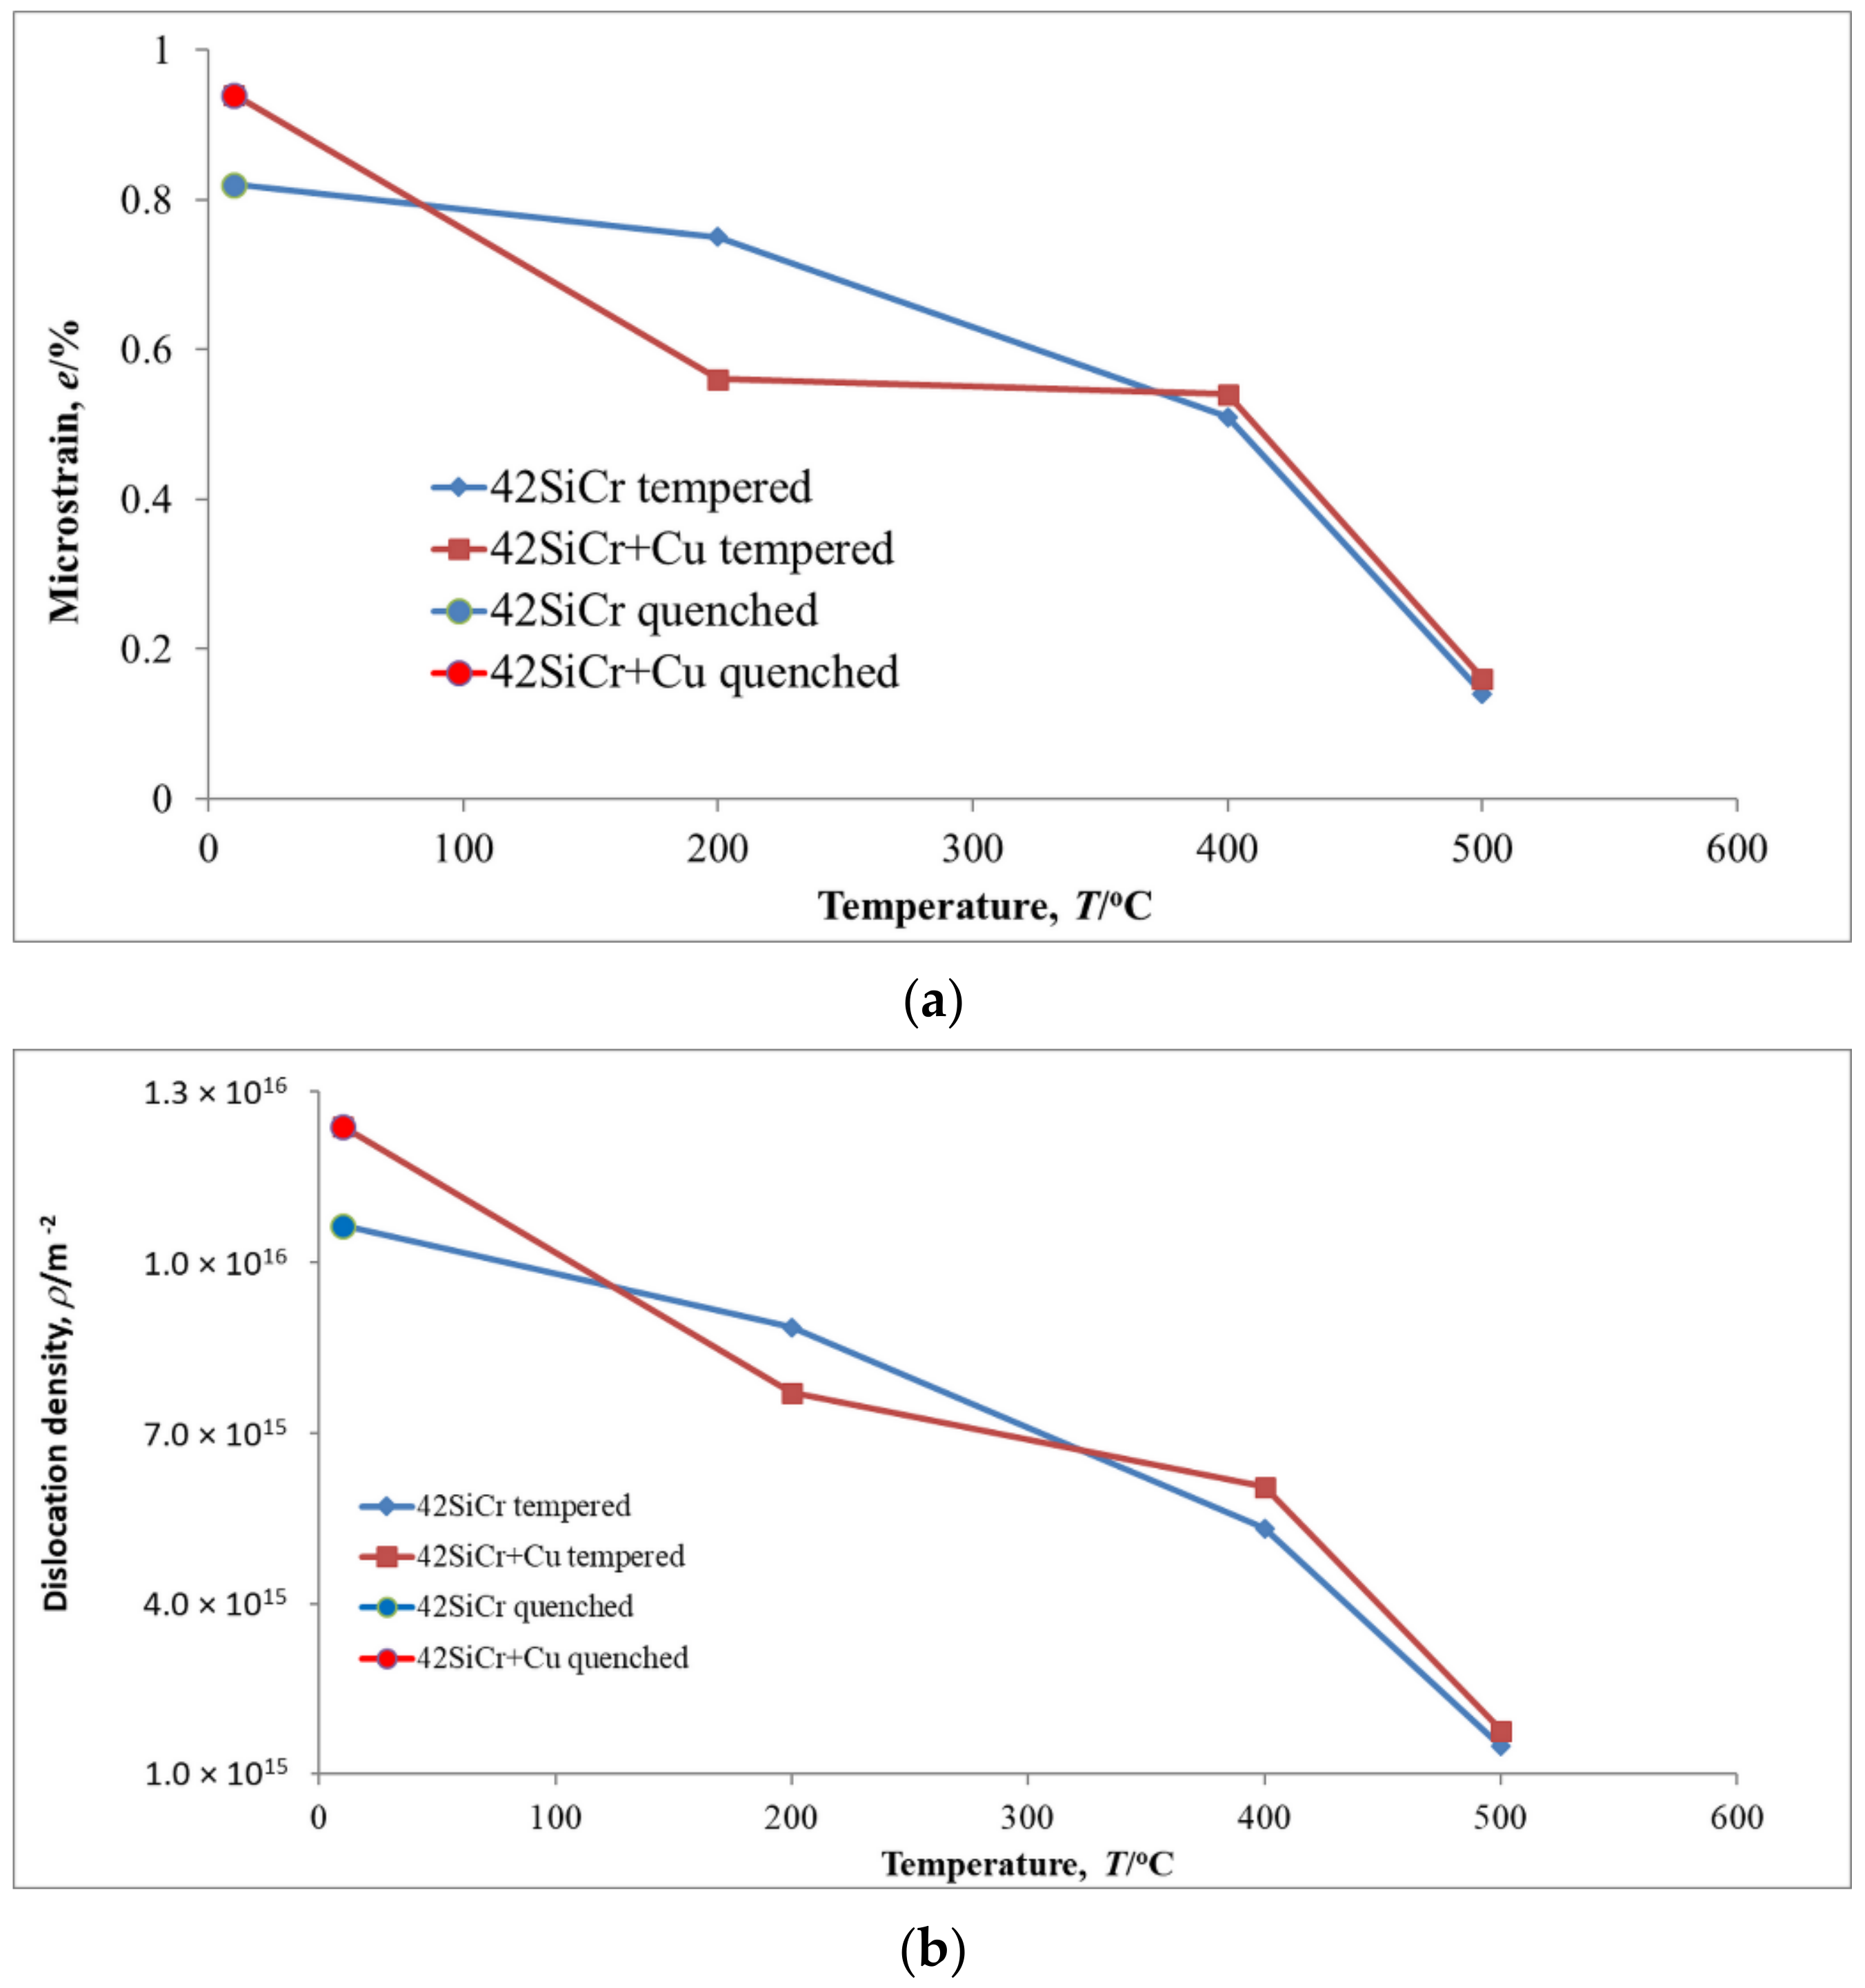
- Many cementite carbides of various shapes formed in both 42SiCr and 42SiCr + Cu steels during tempering between 200 and 500 °C. At the same time, the microstructure of the matrix changed dramatically. The dislocation density and microstrain for 42SiCr and 42SiCr + Cu steels decreased almost 7 to 6 times, respectively, due to tempering in this temperature range, which produced recovered ferrite.
Author Contributions
Funding
Institutional Review Board Statement
Informed Consent Statement
Data Availability Statement
Acknowledgments
Conflicts of Interest
References
- Jirková, H.; Kučerová, L.; Mašek, B. The Effect of Chromium on Microstructure Development During Q-P Process. Mater. Today Proc. 2015, 2, S627–S630. [Google Scholar] [CrossRef]
- Nam, W.J.; Choi, H.C. Effect of Si on mechanical properties of low alloy steels. Mater. Sci. Technol. 1999, 15, 527–530. [Google Scholar] [CrossRef]
- Černý, I.; Mikulová, D.; Sís, J.; Mašek, B.; Jirková, H.; Malina, J. Fatigue properties of a low alloy 42SiCr steel heat treated by quenching and partitioning process. Procedia Eng. 2011, 10, 3310–3315. [Google Scholar] [CrossRef]
- Morra, P.V.; Böttger, A.J.; Mittemeijer, E.J. Decomposition of iron-based martensite: A kinetic analysis by means of differential scanning calorimetry and dilatometry. J. Therm. Anal. Calorim. 2001, 64, 905–914. [Google Scholar] [CrossRef]
- Jung, M.; Lee, S.J.; Lee, Y.K. Microstructural and dilatational changes during tempering and tempering kinetics in martensitic medium-carbon steel. Metall. Mater. Trans. A Phys. Metall. Mater. Sci. 2009, 40, 551–559. [Google Scholar] [CrossRef]
- Primig, S.; Leitner, H. Separation of overlapping retained austenite decomposition and cementite precipitation reactions during tempering of martensitic steel by means of thermal analysis. Thermochim. Acta 2011, 526, 111–117. [Google Scholar] [CrossRef]
- Jung, J.-G.; Jung, M.; Lee, S.-M.; Shin, E.; Shin, H.-C.; Lee, Y.-K. Cu precipitation kinetics during martensite tempering in a medium C steel. J. Alloys Compd. 2013, 553, 299–307. [Google Scholar] [CrossRef]
- Jung, J.-G.; Jung, M.; Kang, S.; Lee, Y.-K. Precipitation behaviors of carbides and Cu during continuous heating for tempering in Cu-bearing medium C martensitic steel. J. Mater. Sci. 2014, 49, 2204–2212. [Google Scholar] [CrossRef]
- Wu, Y.X.; Sun, W.W.; Gao, X.; Styles, M.J.; Arlazarov, A.; Hutchinson, C.R. The effect of alloying elements on cementite coarsening during martensite tempering. Acta Mater. 2020, 183, 418–437. [Google Scholar] [CrossRef]
- Klemm-Toole, J.; Benz, J.; Vieira, I.; Clarke, A.J.; Thompson, S.W.; Findley, K.O. Strengthening mechanisms influenced by silicon content in high temperature tempered martensite and bainite. Mater. Sci. Eng. A 2020, 786, 139419. [Google Scholar] [CrossRef]
- Peng, J.; Li, K.; Peng, J.; Pei, J.; Zhou, C. The effect of pre-strain on tensile behaviour of 316L austenitic stainless steel. Mater. Sci. Technol. 2018, 34, 547–560. [Google Scholar] [CrossRef]
- Leiva, J.A.V.; Morales, E.V.; Villar-Cociña, E.; Donis, C.A.; Bott, I.D.S. Kinetic parameters during the tempering of low-alloy steel through the non-isothermal dilatometry. J. Mater. Sci. 2010, 45, 418–428. [Google Scholar] [CrossRef]
- Strunz, P.; Saroun, J.; Mikula, P.; Lukás, P.; Eichhorn, F. Double-Bent-Crystal Small-Angle Neutron Scattering Setting and its Applications. J. Appl. Crystallogr. 1997, 30, 844–848. [Google Scholar] [CrossRef]
- Keiderling, U.; Wiedenmann, A. New SANS instrument at the BER II reactor in Berlin, Germany. Phys. B Condens. Matter 1995, 213–214, 895–897. [Google Scholar] [CrossRef]
- Wiedenmann, A. Small Angle Neutron Scattering Investigations of Magnetic Nanostructures. In Neutron Scattering from Magnetic Materials; Chatterji, T., Ed.; Elsevier: Amsterdam, The Netherlands, 2006; pp. 473–520. [Google Scholar] [CrossRef]
- Keiderling, U. The new “BerSANS-PC” software for reduction and treatment of small angle neutron scattering data. Appl. Phys. A Mater. Sci. Process. 2002, 74, s1455–s1457. [Google Scholar] [CrossRef]
- Šaroun, J. Evaluation of double-crystal SANS data influenced by multiple scattering. J. Appl. Crystallogr. 2000, 33, 824–828. [Google Scholar] [CrossRef]
- Ishida, K. Calculation of the effect of alloying elements on the Ms temperature in steels. J. Alloys Compd. 1995, 220, 126–131. [Google Scholar] [CrossRef]
- Thompson, S.W. Structural characteristics of transition-iron-carbide precipitates formed during the first stage of tempering in 4340 steel. Mater. Charact. 2015, 106, 452–462. [Google Scholar] [CrossRef]
- He, S.M.; van Dijk, N.H.; Paladugu, M.; Schut, H.; Kohlbrecher, J.; Tichelaar, F.D.; van der Zwaag, S. In situ determination of aging precipitation in deformed Fe-Cu and Fe-Cu-B-N alloys by time-resolved small-angle neutron scattering. Phys. Rev. B 2010, 82, 174111. [Google Scholar] [CrossRef]
- Osamura, K.; Okuda, H.; Takashima, M.; Asano, K.; Furusaka, M. Small-Angle Neutron Scattering Study of Phase Decomposition in Fe-Cu Binary Alloy. Mater. Trans. JIM 1993, 34, 305–311. [Google Scholar] [CrossRef]
- Breßler, I.; Kohlbrecher, J.; Thünemann, A.F. SASfit: A tool for small-angle scattering data analysis using a library of analytical expressions. J. Appl. Crystallogr. 2015, 48, 1587–1598. [Google Scholar] [CrossRef]
- Breßler, I.; Kohlbrecher, J.; Thünemann, A.F. SASfit: A comprehensive tool for small-angle scattering data analysis. arXiv 2015, (preprint). arXiv:1506.02958. [Google Scholar]
- Cohen, M. Self-Diffusion during Plastic Deformation. Trans. Japan Inst. Met. 1970, 11, 145–151. [Google Scholar] [CrossRef][Green Version]
- Buffington, F.S.; Hirano, K.; Cohen, M. Self diffusion in iron. Acta Metall. 1961, 9, 434–439. [Google Scholar] [CrossRef]
- Vasilyev, A.A.; Sokolov, S.F.; Kolbasnikov, N.G.; Sokolov, D.F. Effect of alloying on the self-diffusion activation energy in γ-iron. Phys. Solid State 2011, 53, 2194–2200. [Google Scholar] [CrossRef]
- Dlouhy, J.; Podany, P.; Dzugan, J. Strengthening from Cu Addition in 0.2C-(1-2)Mn Steels during Tempering. Materials 2019, 12, 247. [Google Scholar] [CrossRef] [PubMed]
- Solt, G.; Frisius, F.; Waeber, W.B.; Tipping, P. Irradiation induced precipitation in model alloys with systematic variation of Cu, Ni and P content: A small angle neutron scattering study. In Effects of Radiation on Materials: Sixteenth International Symposium, 2nd ed.; Kumar, A., Gelles, R.D., Nanstadt, R., Little, T., Eds.; ASTM International: Philadelphia, PA, USA, 1993; pp. 444–461. [Google Scholar]
- Isheim, D.; Gagliano, M.S.; Fine, M.E.; Seidman, D.N. Interfacial segregation at Cu-rich precipitates in a high-strength low-carbon steel studied on a sub-nanometer scale. Acta Mater. 2006, 54, 841–849. [Google Scholar] [CrossRef]
- Kozeschnik, E. Thermodynamic prediction of the equilibrium chemical composition of critical nuclei: Bcc Cu precipitation in α-Fe. Scr. Mater. 2008, 59, 1018–1021. [Google Scholar] [CrossRef]
- Zmeko, J. New Designed Spring Steel with High Strength Values. Bachelor’s Thesis, University of West Bohemia, Pilsen, Czech Republic, 2019. [Google Scholar]
- Russell, K.C.; Brown, L. A dispersion strengthening model based on differing elastic moduli applied to the iron-copper system. Acta Metall. 1972, 20, 969–974. [Google Scholar] [CrossRef]
- Takeuchi, T.; Kuramoto, A.; Kameda, J.; Toyama, T.; Nagai, Y.; Hasegawa, M.; Ohkubo, T.; Yoshiie, T.; Nishiyama, Y.; Onizawa, K. Effects of chemical composition and dose on microstructure evolution and hardening of neutron-irradiated reactor pressure vessel steels. J. Nucl. Mater. 2010, 402, 93–101. [Google Scholar] [CrossRef]


| Steel | C | Si | Mn | P | S | Cr | Mo | Ni | Cu | Ti | V | Fe |
|---|---|---|---|---|---|---|---|---|---|---|---|---|
| 42SiCr | 0.39 | 2.02 | 0.65 | 0.011 | 0.003 | 1.21 | 0.03 | 0.07 | 0.09 | 0.004 | 0.012 | bal. |
| 42SiCr + Cu | 0.41 | 2.40 | 0.65 | 0.011 | 0.003 | 1.34 | 0.03 | 0.07 | 1.50 | 0.004 | 0.012 | bal. |
| β (K/s) | 42SiCr | 42SiCr + Cu | Steel without Cu [7,8] | Steel with Cu [7,8] |
|---|---|---|---|---|
| 0.003 | 126 °C | 125 °C | - | - |
| 0.01 | 121 °C | 125 °C | - | - |
| 0.05 | 142 °C | 145 °C | - | - |
| 0.1 | no observed | 131 °C | 151 °C | 144 °C |
| β (K/s) | 42SiCr | 42SiCr + Cu | Steel without Cu [7,8] | Steel with Cu [7,8] |
|---|---|---|---|---|
| 0.003 | 414 °C | 414 °C | - | - |
| 0.01 | 426 °C | 427 °C | - | - |
| 0.05 | 452 °C | 453 °C | - | - |
| 0.1 | 456 °C | 461 °C | 300 °C | 337 °C |
| 0.5 | 481 °C | 484 °C | 325 °C | 345 °C |
| 1 | 493 °C | 497 °C | 328 °C | 352 °C |
| 10 | 529 °C | 539 °C | 355 °C | 391 °C |
| 50 | 571 °C | 574 °C | 390 °C | 416 °C |
| Stage | Activation Energy, E (kJ/mol) 42SiCr Steel | Activation Energy, E (kJ/mol) 42SiCr + Cu Steel | Activation Energy, E (kJ/mol) Steel without Cu [7,8] | Activation Energy, E (kJ/mol) Steel with Cu [7,8] |
|---|---|---|---|---|
| I | 125 | 136 | 120 | 111 |
| II | 288 | 280 | 206 | 225 |
| Stage | Frequency Factor, K0 (s−1) 42SiCr Steel | Frequency Factor, K0 (s−1) 42SiCr + Cu Steel | Frequency Factor, K0 (s−1) Steel without Cu [8] | Frequency Factor, K0(s−1) Steel with Cu [8] |
|---|---|---|---|---|
| I | 1.78 × 10¹³ | 7.18 × 10¹⁴ | 4.85 × 10¹⁰ | 9.11 × 10¹² |
| II | 2.25 × 10¹⁸ | 4.79 × 10¹⁷ | 3.60 × 10¹⁷ | 6.11 × 10¹⁸ |
| Sample No. | Sample Type | Tempering Temperature | <R>, nm | σ |
|---|---|---|---|---|
| 722 | 42SiCr | 200 °C | 109 ± 3 | 0.71 |
| 742 | 42SiCr | 400 °C | 108 ± 3 | 0.86 |
| 752 | 42SiCr | 500 °C | 18.8 ± 1.1 | 0.42 |
| 822 | 42SiCr + Cu | 200 °C | 82 ± 3 | 0.78 |
| 842 | 42SiCr + Cu | 400 °C | 117 ± 4 | 0.70 |
| 852 | 42SiCr + Cu | 500 °C | 23.1 ± 1.4 | 0.63 |
| T, °C | µ, nm | σ, nm | <R>V, nm | ν, % | |
|---|---|---|---|---|---|
| 842–742 | 400 | 0.78 | 0.21 | 0.79 | 0.33 |
| 852–752 | 500 | 1.22 | 0.59 | 4.10 | 1.35 |
Publisher’s Note: MDPI stays neutral with regard to jurisdictional claims in published maps and institutional affiliations. |
© 2021 by the authors. Licensee MDPI, Basel, Switzerland. This article is an open access article distributed under the terms and conditions of the Creative Commons Attribution (CC BY) license (http://creativecommons.org/licenses/by/4.0/).
Share and Cite
Gokhman, A.; Nový, Z.; Salvetr, P.; Ryukhtin, V.; Strunz, P.; Motyčka, P.; Zmeko, J.; Kotous, J. Effects of Silicon, Chromium, and Copper on Kinetic Parameters of Precipitation during Tempering of Medium Carbon Steels. Materials 2021, 14, 1445. https://doi.org/10.3390/ma14061445
Gokhman A, Nový Z, Salvetr P, Ryukhtin V, Strunz P, Motyčka P, Zmeko J, Kotous J. Effects of Silicon, Chromium, and Copper on Kinetic Parameters of Precipitation during Tempering of Medium Carbon Steels. Materials. 2021; 14(6):1445. https://doi.org/10.3390/ma14061445
Chicago/Turabian StyleGokhman, Aleksandr, Zbyšek Nový, Pavel Salvetr, Vasyl Ryukhtin, Pavel Strunz, Petr Motyčka, Jan Zmeko, and Jakub Kotous. 2021. "Effects of Silicon, Chromium, and Copper on Kinetic Parameters of Precipitation during Tempering of Medium Carbon Steels" Materials 14, no. 6: 1445. https://doi.org/10.3390/ma14061445
APA StyleGokhman, A., Nový, Z., Salvetr, P., Ryukhtin, V., Strunz, P., Motyčka, P., Zmeko, J., & Kotous, J. (2021). Effects of Silicon, Chromium, and Copper on Kinetic Parameters of Precipitation during Tempering of Medium Carbon Steels. Materials, 14(6), 1445. https://doi.org/10.3390/ma14061445