
Improvement of Corrosion Resistance of TiO2 Layers in Strong Acidic Solutions by Anodizing and Thermal Oxidation Treatment


Abstract
:1. Introduction
2. Experimental Methods
2.1. Substrate Preparation
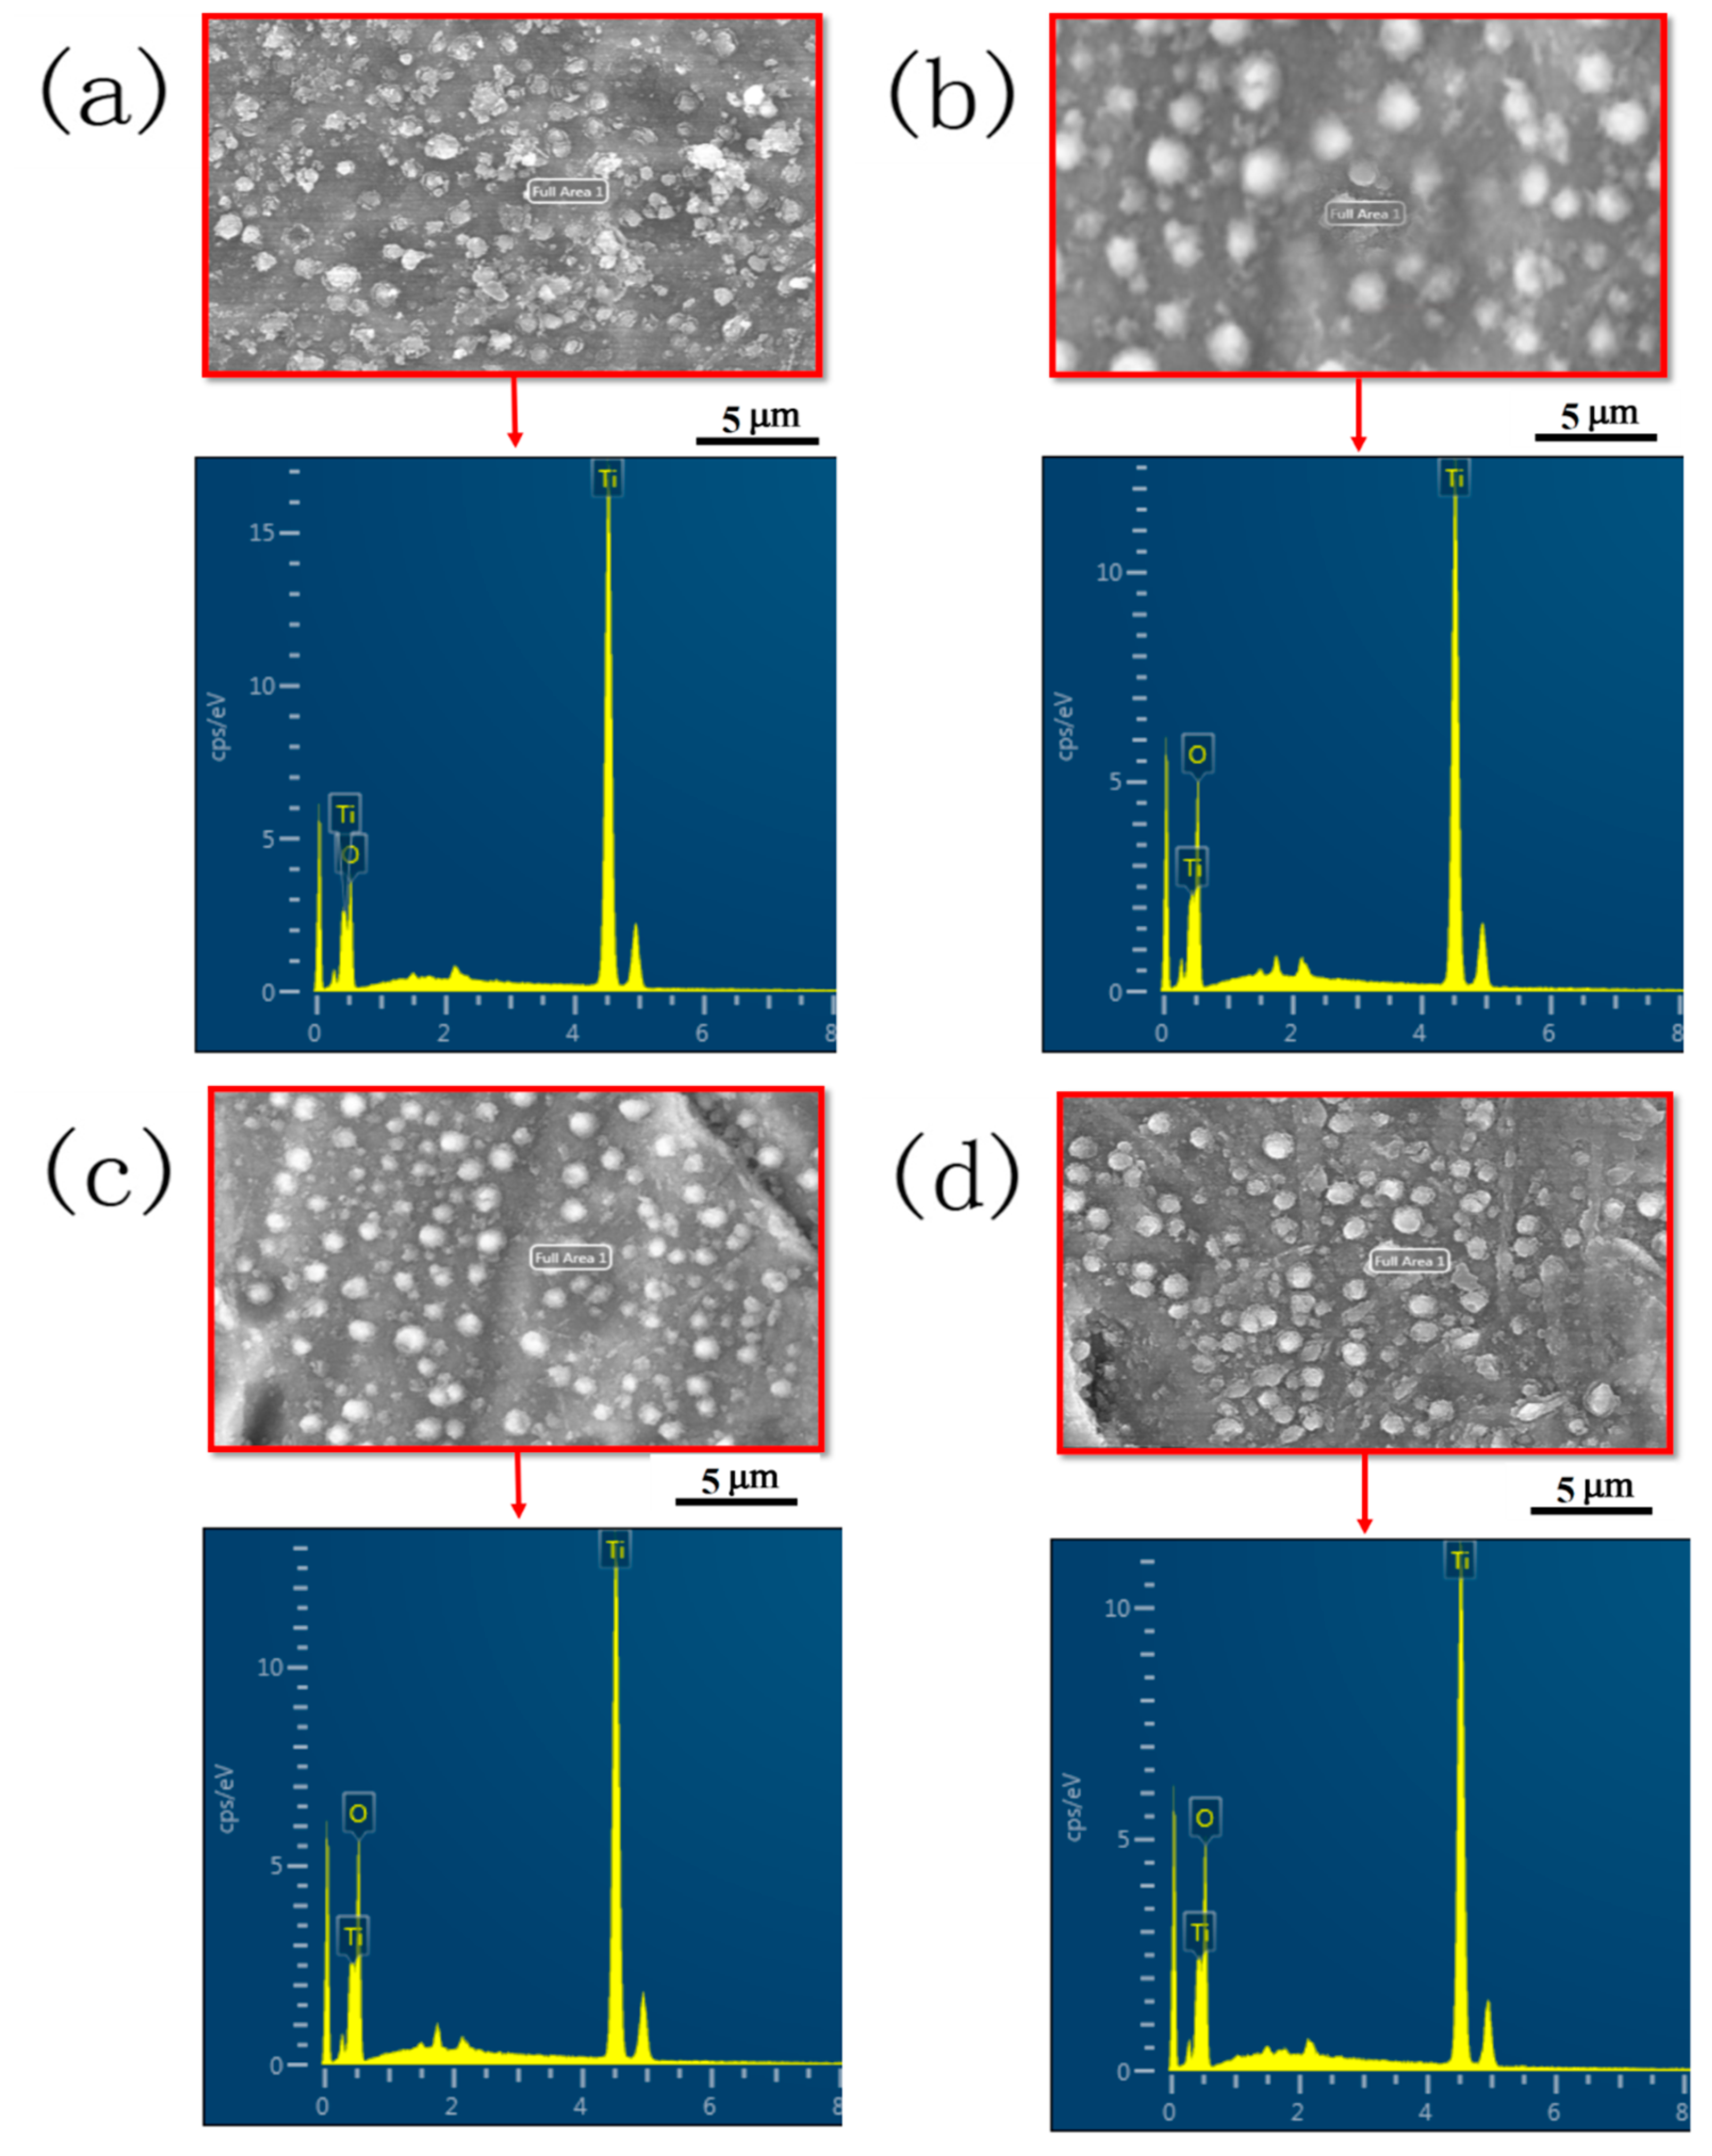
2.2. Composition and Microstructure Characterization
2.3. Electrochemical Measurements
3. Results and Discussion
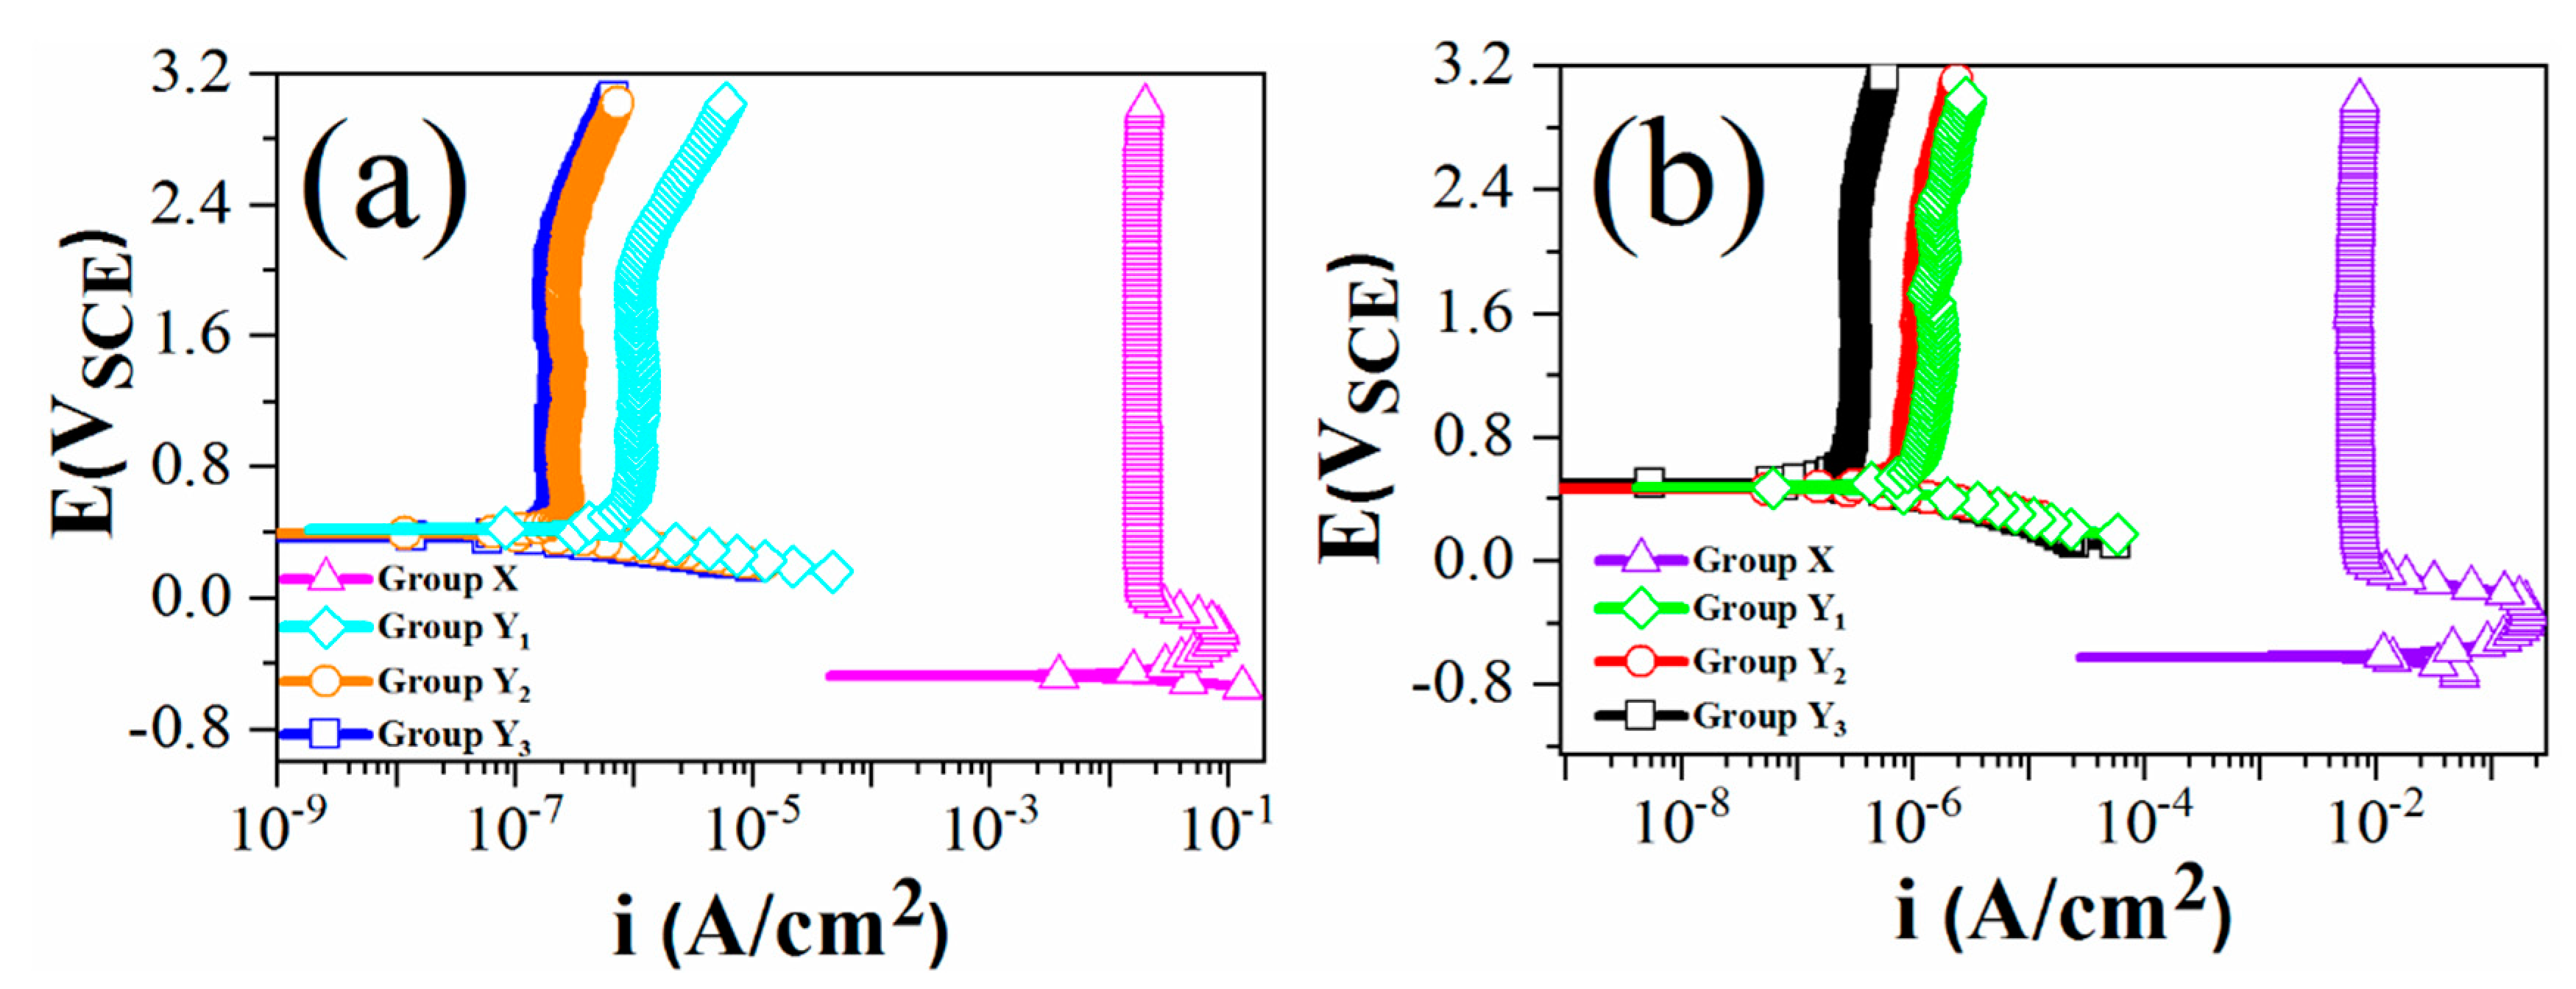
3.1. Potentiodynamic Scan
3.2. Electrochemical Impedance Spectroscopy
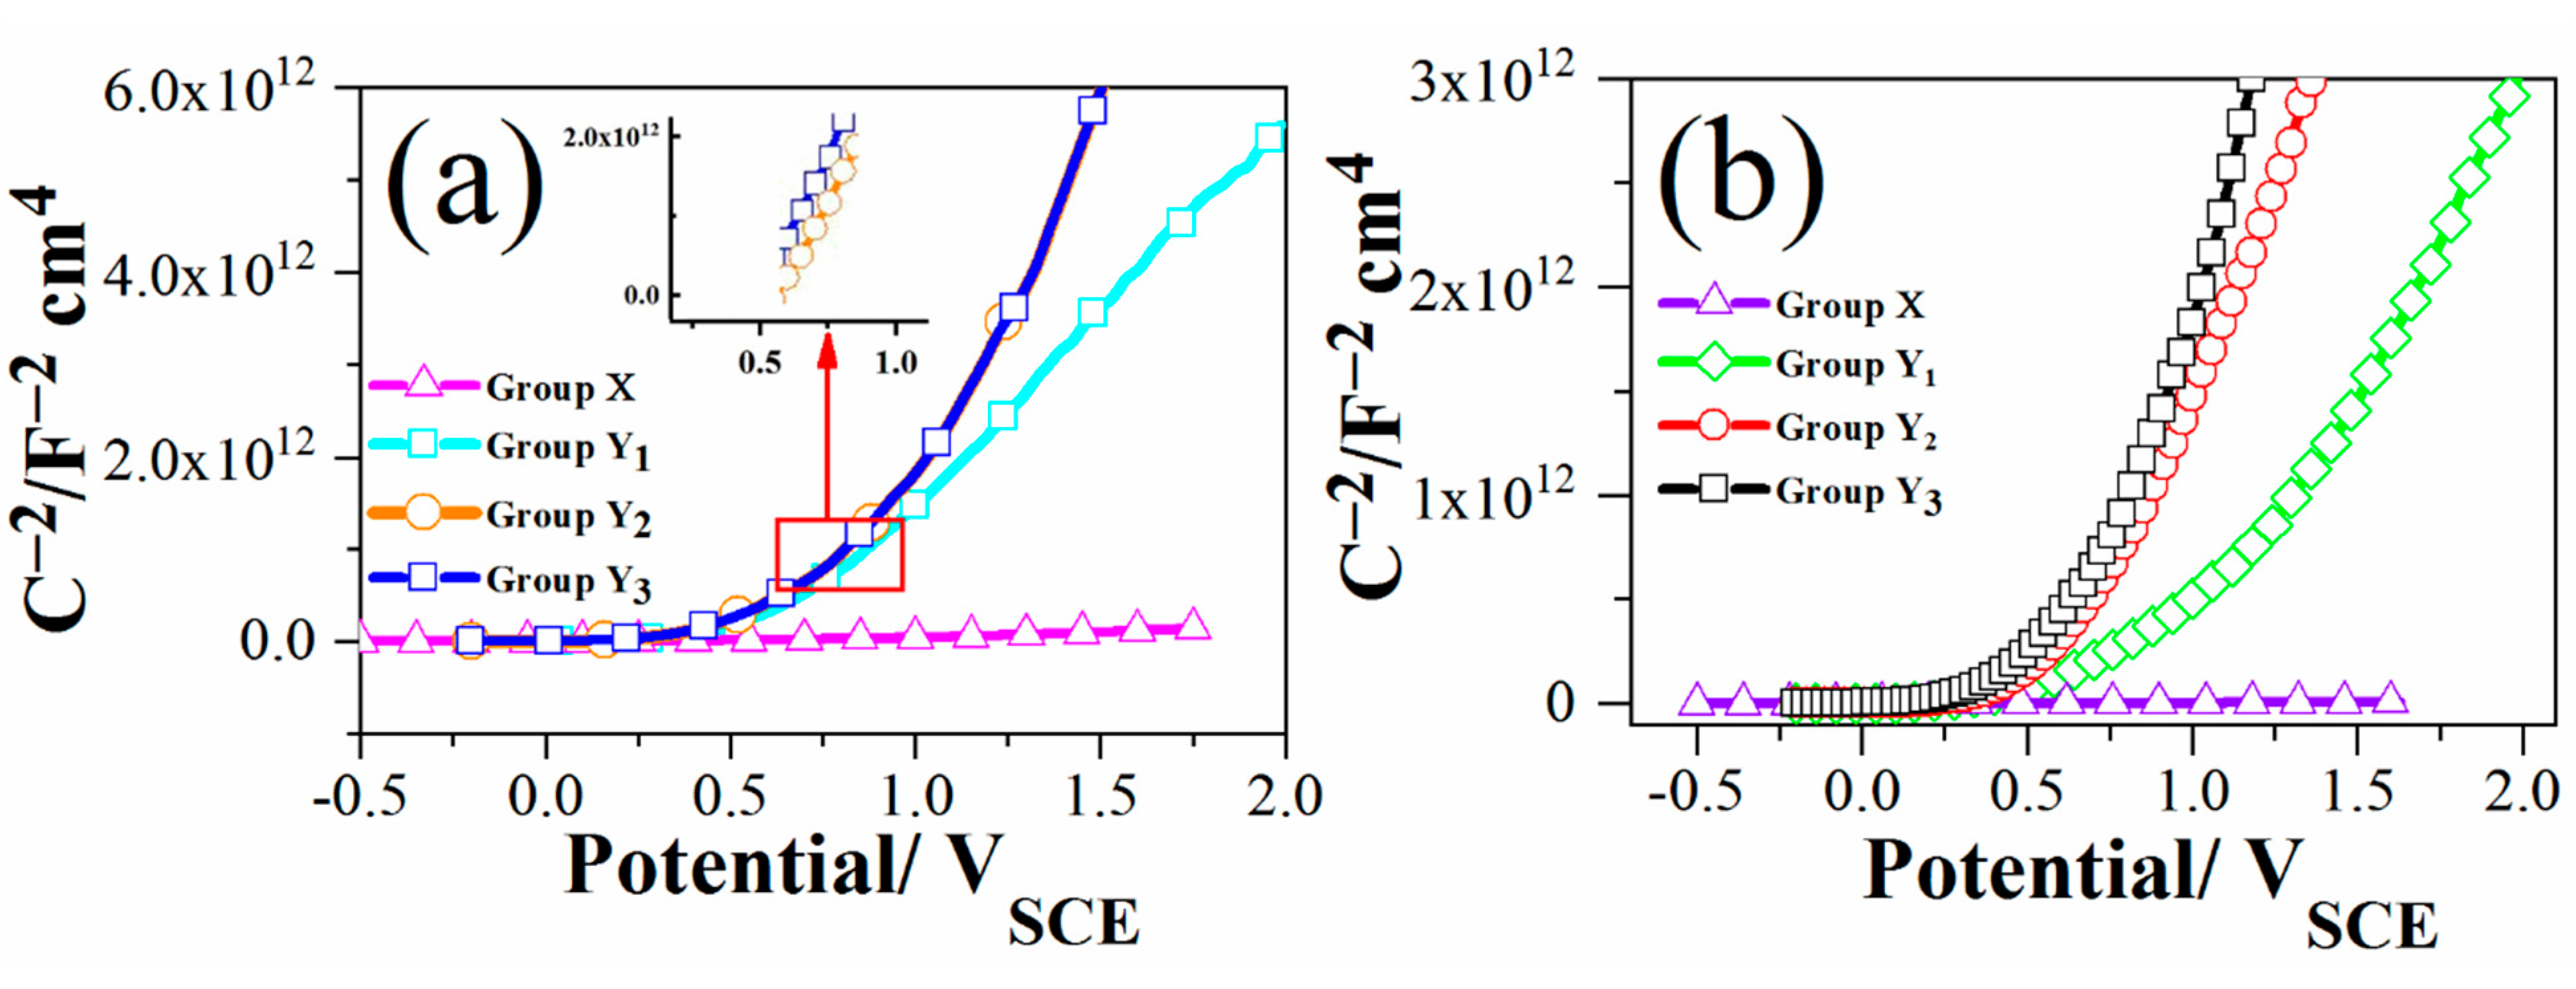
3.3. Mott–Schottky Analysis
4. Conclusions
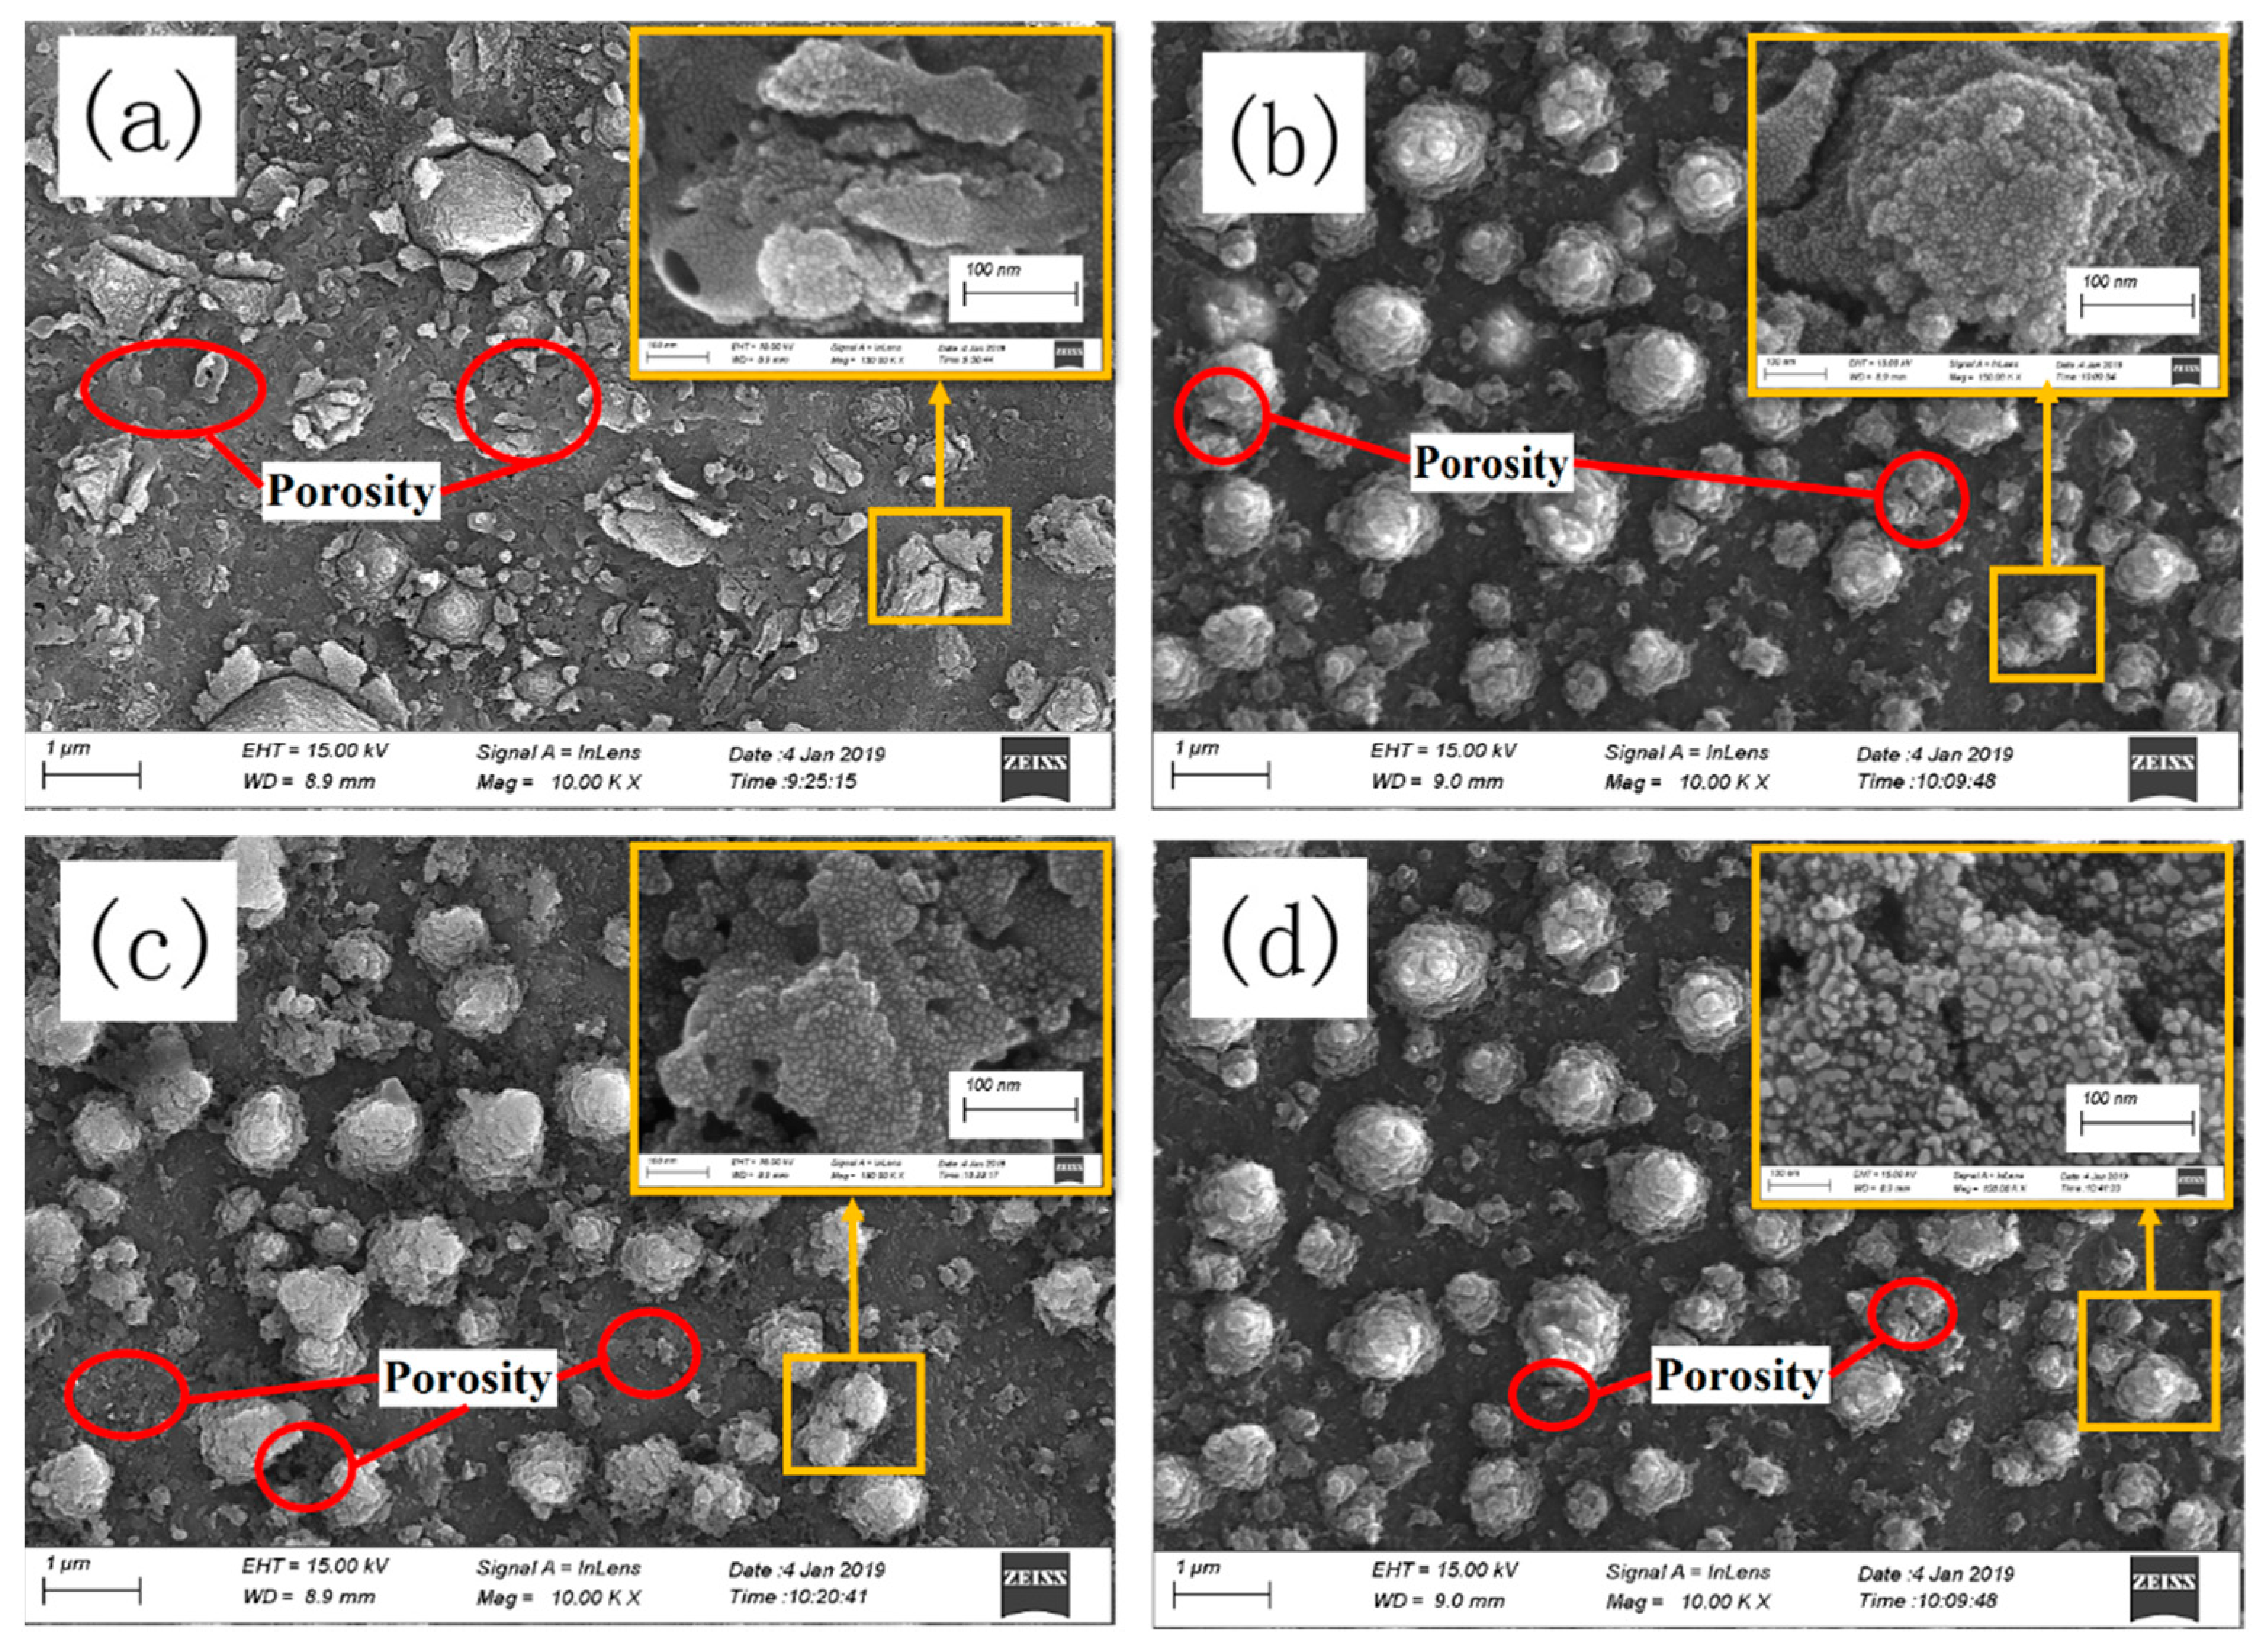
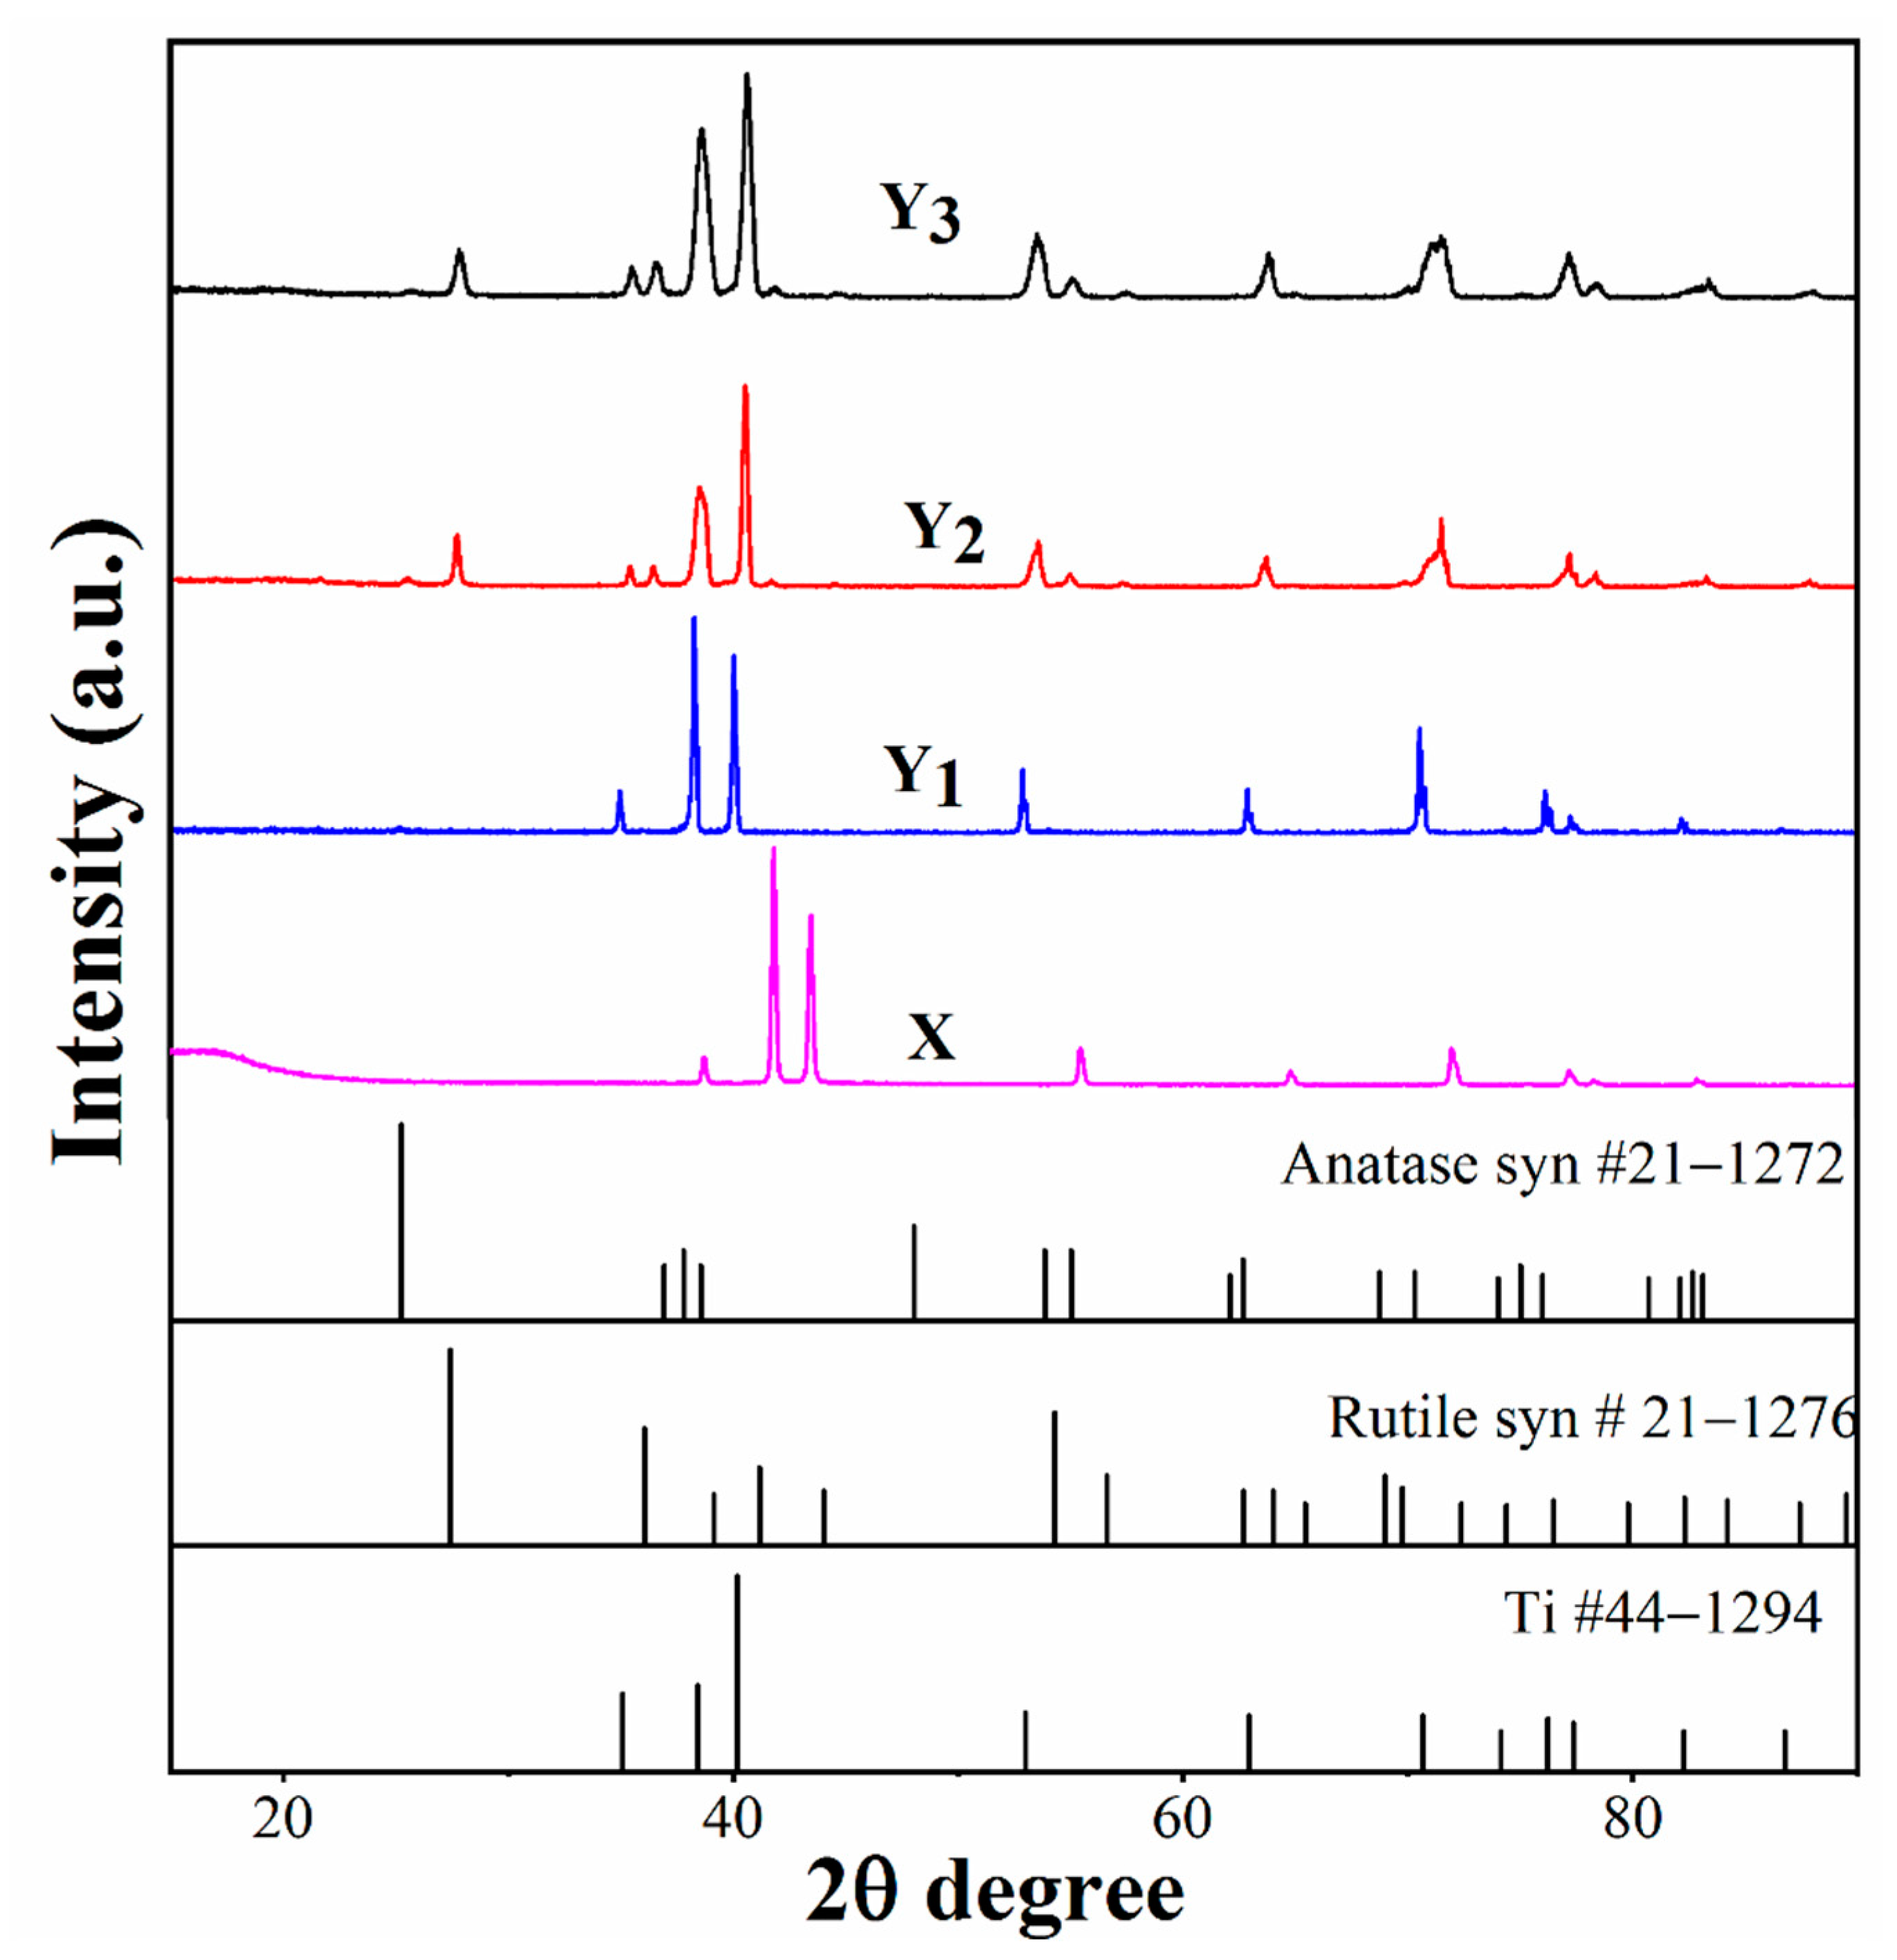
- XRD results show that a rutile/anatase duplex structure was formed after oxidation at 600 °C, and the amount of anatase phase increased with decreased crystalline size, as the treatment time was prolonged from 3 to 9 h.
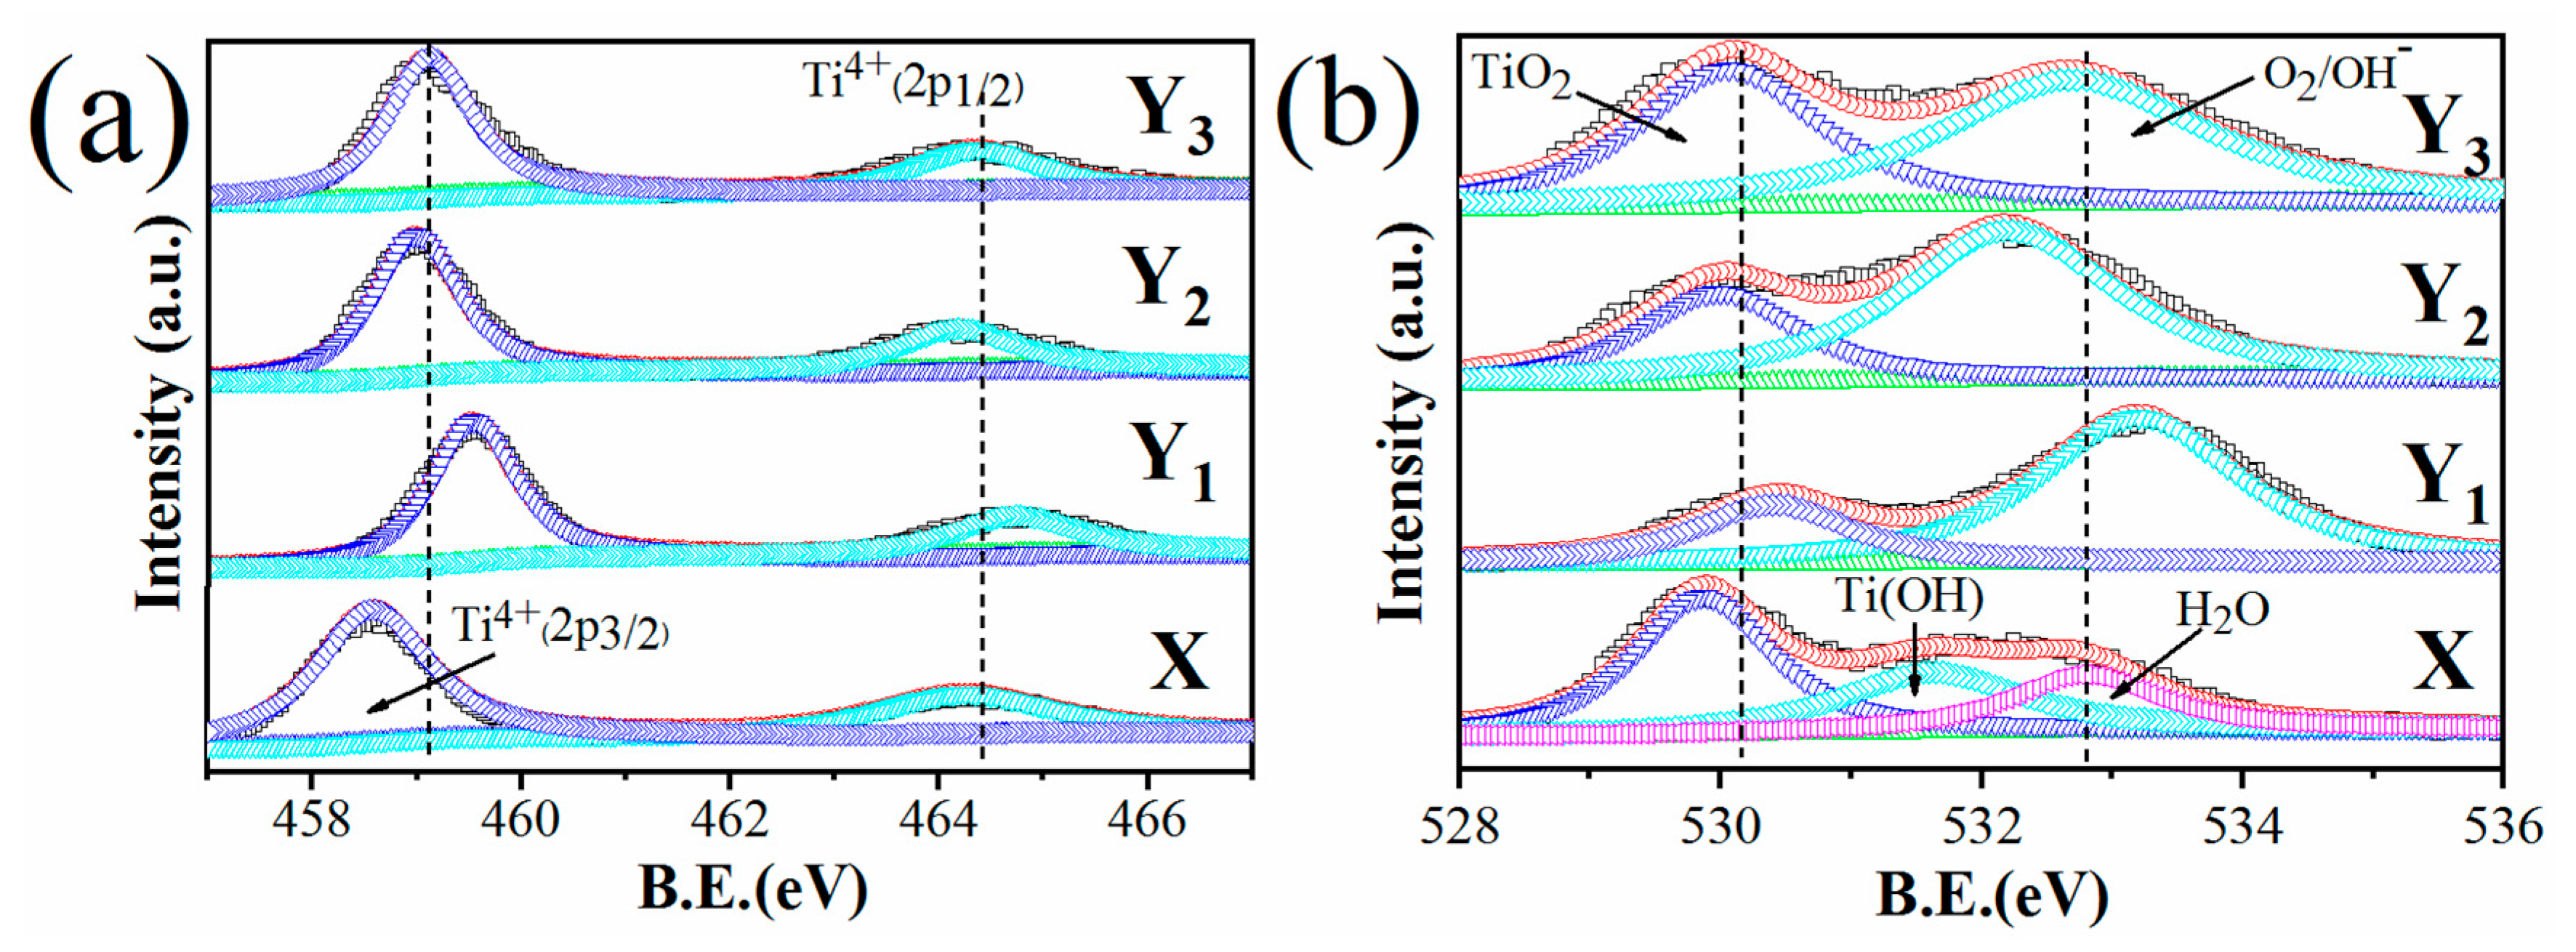
- XPS analysis indicates that as the thermal oxidation time increased, more Ti vacancies were present in the titanium oxide films, with decreased donor concentration. Longer thermal oxidation promotes the formation of hydroxides of titanium on the surface, which is helpful to improve the passive ability of the film.
- The anodized and thermally oxidized Ti samples showed relatively high corrosion resistance in 4 M HCl and 4 M H2SO4 solutions at 100 ± 5 °C. The passive current density values of the thermally oxidized samples were five orders of magnitude under the testing condition compared with that of the anodized sample. With the prolonged oxidation time, the passive current density decreased further to some extent.
Author Contributions
Funding
Institutional Review Board Statement
Informed Consent Statement
Data Availability Statement
Conflicts of Interest
References
- Pang, J.; Blackwood, D.J. Corrosion of titanium alloys in high temperature near anaerobic seawater. Corros. Sci. 2016, 105, 17–24. [Google Scholar] [CrossRef]
- He, X.; Noël, J.J.; Shoesmith, D.W. Temperature Dependence of Crevice Corrosion Initiation on Titanium Grade-2. J. Electrochem. Soc. 2002, 149, B440–B449. [Google Scholar] [CrossRef]
- Güleryüz, H.; Çimenoǧlu, H. Effect of thermal oxidation on corrosion and corrosion-wear behaviour of a Ti-6Al-4V alloy. Biomaterials 2004, 25, 3325–3333. [Google Scholar] [CrossRef]
- Liu, L.; Xu, J.; Xie, Z.-H.; Munroe, P. The roles of passive layers in regulating the electrochemical behavior of Ti5Si3-based nanocomposite films. J. Mater. Chem. A 2013, 1, 2064–2078. [Google Scholar] [CrossRef]
- Regonini, D.; Bowen, C.R.; Jaroenworaluck, A.; Stevens, R. A review of growth mechanism, structure and crystallinity of anodized TiO2 nanotubes. Mater. Sci. Eng. R 2013, 74, 377–406. [Google Scholar] [CrossRef] [Green Version]
- Liu, J.; Alfantazi, A.; Asselin, E. Applied Surface Science A new method to improve the corrosion resistance of titanium for hydrometallurgical applications. Appl. Surf. Sci. 2015, 332, 480–487. [Google Scholar] [CrossRef]
- Roach, M.; Williamson, R.; Blakely, I.; Didier, L. Tuning anatase and rutile phase ratios and nanoscale surface features by anodization processing onto titanium substrate surfaces. Mater. Sci. Eng. C 2016, 58, 213–223. [Google Scholar] [CrossRef] [PubMed]
- Simka, W.; Sadkowski, A.; Warczak, M.; Iwaniak, A.; Dercz, G.; Michalska, J.; Maciej, A. Characterization of passive films formed on titanium during anodic oxidation. Electrochim. Acta 2011, 56, 8962–8968. [Google Scholar] [CrossRef]
- Grotberg, J.; Hamlekhan, A.; Butt, A.; Patel, S.; Royhman, D. Thermally oxidized titania nanotubes enhance the corrosion resistance of Ti6Al4V. Mater. Sci. Eng. C 2016, 59, 677–689. [Google Scholar] [CrossRef]
- Göttlicher, M.; Rohnke, M.; Kunz, A.; Thomas, J.; Henning, R.A.; Leichtweiß, T.; Gemming, T.; Janek, J. Anodization of titanium in radio frequency oxygen discharge—Microstructure, kinetics & transport mechanism. Solid State Ionics 2016, 290, 130–139. [Google Scholar]
- Capek, D.; Gigandet, M.-P.; Masmoudi, M.; Wery, M.; Banakh, O. Long-time anodisation of titanium in sulphuric acid. Surf. Coat. Technol. 2008, 202, 1379–1384. [Google Scholar] [CrossRef]
- Sul, Y.T.; Johansson, C.B.; Jeong, Y.; Albrektsson, T. The electrochemical oxide growth behaviour on titanium in acid and alkaline electrolytes. Med. Eng. Phys. 2001, 23, 329–346. [Google Scholar] [CrossRef]
- Kumar, S.; Narayanan, T.S.N.S.; Raman, S.G.S.; Seshadri, S.K. Thermal oxidation of CP-Ti: Evaluation of characteristics and corrosion resistance as a function of treatment time. Mater. Sci. Eng. C 2009, 29, 1942–1949. [Google Scholar] [CrossRef]
- Velasco-velez, J.J.; Davaasuren, B.; Scherzer, M.; Cap, S.; Willinger, M.; Guo, J. Surface Science Exploring the incorporation of nitrogen in titanium and its in fl uence on the electrochemical corrosion resistance in acidic media. Surf. Sci. 2016, 650, 272–278. [Google Scholar] [CrossRef] [Green Version]
- Satko, D.P.; Shaffer, J.B.; Tiley, J.S.; Semiatin, S.L.; Pilchak, A.L.; Kalidindi, S.R.; Kosaka, Y.; Glavicic, M.G.; Salem, A.A. Effect of microstructure on oxygen rich layer evolution and its impact on fatigue life during high-temperature application of α/β titanium. Acta Mater. 2016, 107, 377–389. [Google Scholar] [CrossRef] [Green Version]
- Minhas, B.; Dino, S.; Qian, H.; Zuo, Y. An approach for high stability TiO2 in strong acid environments at high temperature. Surf. Coatings Technol. 2020, 395, 125932. [Google Scholar] [CrossRef]
- Varghese, O.K. Crystallization and high-temperature structural stability of titanium oxide nanotube arrays. J. Mater. Res. 2003, 18, 156–165. [Google Scholar] [CrossRef]
- Chen, Z.; Zhou, K. Surface morphology, phase structure and property evolution of anodized titanium during water vapor exposure. Surf. Coatings Technol. 2015, 263, 61–65. [Google Scholar] [CrossRef]
- Dabir, F.; Sarraf-mamoory, R.; Loeblein, M.; Hon, S.; Hang, E.; Teo, T. Effect of annealing temperature on physical properties of nanostructured TiN/3DG composite. JMADE 2016, 90, 524–531. [Google Scholar] [CrossRef]
- Nowotny, M.K.; Sheppard, L.R.; Bak, T.; Nowotny, J. Defect Chemistry of Titanium Dioxide. Application of Defect Engineering in Processing of TiO2-Based Photocatalysts. J. Phys. Chem. C 2008, 112, 5275–5300. [Google Scholar] [CrossRef]
- Lubas, M.; Sitarz, M.; Jasinski, J.J.; Jelen, P.; Klita, L.; Podsiad, P.; Jasinski, J. Fabrication and characterization of oxygen - Diffused titanium using spectroscopy method, Spectrochim. Acta Part A Mol. Biomol. Spectrosc. 2014, 133, 883–886. [Google Scholar] [CrossRef]
- Nishikawa, H.; Ihara, T.; Kasuya, N.; Kobayashi, Y.; Takahashi, S. Thermally-induced activation of titanium dioxide and its application to the oxidation of gaseous toluene. Appl. Surf. Sci. 2019, 479, 1105–1109. [Google Scholar] [CrossRef]
- Zhang, L.; Miller, B.K.; Crozier, P.A. Atomic Level In Situ Observation of Surface Amorphization in Anatase Nanocrystals During Light Irradiation in Water Vapor. Nano Lett. 2013, 13, 679–684. [Google Scholar] [CrossRef]
- Vaughan, J.; Alfantazi, A. Corrosion of Titanium and Its Alloys in Sulfuric Acid in the Presence of Chlorides. J. Electrochem. Soc. 2006, 153, B6–B12. [Google Scholar] [CrossRef]
- Nishimura, R.; Shirono, J.; Jonokuchi, A. Hydrogen-induced cracking of pure titanium in sulphuric acid and hydrochloric acid solutions using constant load method. Corros. Sci. 2008, 50, 2691–2697. [Google Scholar] [CrossRef]
- Hamadou, L.; Aïnouche, L.; Kadri, A.; Yahia, S.A.A.; Benbrahim, N. Electrochimica Acta Electrochemical impedance spectroscopy study of thermally grown oxides exhibiting constant phase element behaviour. Electrochim. Acta 2013, 113, 99–108. [Google Scholar] [CrossRef]
- Heakal, F.E.-T.; Ghoneim, A.A.; Hassan, H.H.; Abdelghani, E.; Amin, M.A. Electrochemical behaviour of Ti–6Al–4V alloy and Ti in azide and halide solutions. Corros. Sci. 2011, 53, 2728–2737. [Google Scholar] [CrossRef]
- Frers, S.E.; Stefenel, M.M.; Mayer, C.; Chierchie, T. AC-Impedance measurements on aluminium in chloride containing solutions and below the pitting potential. J. Appl. Electrochem. 1990, 20, 996–999. [Google Scholar] [CrossRef]
- Potucek, R.K.; Rateick, R.G., Jr.; Birss, V.I. Impedance Characterization of Anodic Barrier Al Oxide Film Beneath Porous Oxide Layer. J. Electrochem. Soc. 2006, 153, B304–B310. [Google Scholar] [CrossRef]
- Hsu, C.; Mansfeld, F. Technical note: Concerning the conversion of the constant phase element parameter Y0 into a capacitance. Corrosion 2001, 57, 747–748. [Google Scholar] [CrossRef]
- Blackwood, D. Influence of the space-charge region on electrochemical impedance measurements on passive oxide films on tita-nium. Electrochim. Acta 2000, 46, 563–569. [Google Scholar] [CrossRef]


| Group Name | Treatment Condition |
|---|---|
| X | Anodized |
| Y1 | Anodized+ thermal oxidation (3 h) at 600 °C |
| Y2 | Anodized+ thermal oxidation (6 h) at 600 °C |
| Y3 | Anodized+ thermal oxidation (9 h) at 600 °C |
| Samples | Ecorr (VSCE) | Icorr (µA/cm2) |
|---|---|---|
| X (HCl) | −0.70 | 121 × 103 |
| Y1 (HCl) | 0.41 | 0.76 |
| Y2 (HCl) | 0.38 | 0.29 |
| Y3 (HCl) | 0.36 | 0.26 |
| X (H2SO4) | −0.62 | 51 × 103 |
| Y1 (H2SO4) | 0.47 | 1.38 |
| Y2 (H2SO4) | 0.46 | 1.17 |
| Y3 (H2SO4) | 0.49 | 0.10 |
| Samples | 4 M HCl | 4 M H2SO4 | ||||||
|---|---|---|---|---|---|---|---|---|
| X | Y1 | Y2 | Y3 | X | Y1 | Y2 | Y3 | |
| Rs (Ω cm2) | 0.8 | 4.6 | 2.6 | 3.1 | 0.7 | 3.54 | 2.6 | 3.3 |
| Q1-Yo (Ω sn cm−2) | 0.002 | 1.0 × 10⁻⁵ | 2.7 × 10⁻⁵ | 9.3 × 10⁻⁶ | 0.002 | 1.58 × 10⁻⁵ | 1.88 × 10⁻⁵ | 6.9 × 10⁻⁶ |
| Q1-n | 1 | 0.81 | 0.75 | 0.74 | 1 | 0.76 | 0.72 | 0.76 |
| R1 (Ω cm2) | 0.53 | 80.1 | 79.1 | 85 | 0.63 | 70.5 | 80 | 75.5 |
| C1 (F cm−2) | - | 1.89 × 10⁻⁶ | 3.54 × 10⁻⁶ | 7.61 × 10⁻⁷ | - | 2.12 × 10⁻⁶ | 1.4 × 10⁻⁶ | 7.41 × 10⁻⁷ |
| Q2-Yo (Ω sn cm−2) | 0.1 | 2.34 × 10⁻⁵ | 6.3 × 10⁻⁵ | 4.9 × 10⁻⁶ | 0.1 | 3.25 × 10⁻⁵ | 6.3 × 10⁻⁶ | 5.1 × 10⁻⁶ |
| Q2-n | 0.8 | 0.82 | 0.86 | 0.83 | 0.77 | 0.80 | 0.85 | 0.85 |
| R2 (Ω cm2) | 3.5 | 5.8 × 10⁵ | 1.2 × 10⁶ | 1.4 × 10⁶ | 0.66 | 1.17 × 10⁵ | 1.8 × 10⁵ | 2.1 × 10⁵ |
| C2 (F cm−2) | - | 5.12 × 10⁻⁵ | 7.6 × 10⁻⁵ | 7.16 × 10⁻⁶ | - | 4.53 × 10⁻⁵ | 1.1 × 10⁻⁵ | 5.5 × 10⁻⁶ |
| δ (nm) | 136 | 800 | 980 | - | 154 | 1100 | 1270 | |
| Samples | EFB (VSCE) | ND (cm−3) |
|---|---|---|
| Y1 (HCl) | 0.47 | 1.66 × 10¹⁹ |
| Y2 (HCl) | 0.6 | 4.1 × 10¹⁷ |
| Y3 (HCl) | 0.6 | 4.0 × 10¹⁷ |
| Y1 (H2SO4) | 0.19 | 4.4 × 10²⁰ |
| Y2 (H2SO4) | 0.5 | 1.01 × 10¹⁸ |
| Y3 (H2SO4) | 0.4 | 2.0 × 10¹⁷ |
Publisher’s Note: MDPI stays neutral with regard to jurisdictional claims in published maps and institutional affiliations. |
© 2021 by the authors. Licensee MDPI, Basel, Switzerland. This article is an open access article distributed under the terms and conditions of the Creative Commons Attribution (CC BY) license (http://creativecommons.org/licenses/by/4.0/).
Share and Cite
Minhas, B.; Dino, S.; Zuo, Y.; Qian, H.; Zhao, X. Improvement of Corrosion Resistance of TiO2 Layers in Strong Acidic Solutions by Anodizing and Thermal Oxidation Treatment. Materials 2021, 14, 1188. https://doi.org/10.3390/ma14051188
Minhas B, Dino S, Zuo Y, Qian H, Zhao X. Improvement of Corrosion Resistance of TiO2 Layers in Strong Acidic Solutions by Anodizing and Thermal Oxidation Treatment. Materials. 2021; 14(5):1188. https://doi.org/10.3390/ma14051188
Chicago/Turabian StyleMinhas, Badar, Sahib Dino, Yu Zuo, Hongchang Qian, and Xuhui Zhao. 2021. "Improvement of Corrosion Resistance of TiO2 Layers in Strong Acidic Solutions by Anodizing and Thermal Oxidation Treatment" Materials 14, no. 5: 1188. https://doi.org/10.3390/ma14051188
APA StyleMinhas, B., Dino, S., Zuo, Y., Qian, H., & Zhao, X. (2021). Improvement of Corrosion Resistance of TiO2 Layers in Strong Acidic Solutions by Anodizing and Thermal Oxidation Treatment. Materials, 14(5), 1188. https://doi.org/10.3390/ma14051188