Article

Energy Transfer Studies in Tb3+-Yb3+ Co-Doped Phosphate Glasses

by
Hadil Benrejeb
1,2,*,
Kevin Soler-Carracedo
3,
Antonio Diego Lozano-Gorrín
4,5,
Sana Hraiech
2 and
Inocencio Rafael Martin
3,5
1
Chemistry Department, Faculty of Sciences of Bizerte, Carthage University, Tunis 7021, Tunisia
2
Physical Chemistry Laboratory of Mineral Materials and Their Applications, National Center of Research in Materials Science, B.P. 73, Tunis 8027, Tunisia
3
Physics Department, University of La Laguna, E-38200 San Cristóbal de La Laguna, Santa Cruz de Tenerife, Spain
4
Chemistry Department, University of La Laguna, E-38200 San Cristóbal de La Laguna, Santa Cruz de Tenerife, Spain
5
Institute of Materials and Nanotechnology (IMN), University of La Laguna, E-38200 San Cristóbal de La Laguna, Santa Cruz de Tenerife, Spain
*
Author to whom correspondence should be addressed.
Materials 2021, 14(22), 6782; https://doi.org/10.3390/ma14226782
Submission received: 6 October 2021 / Revised: 27 October 2021 / Accepted: 3 November 2021 / Published: 10 November 2021
(This article belongs to the Section Advanced and Functional Ceramics and Glasses)

Abstract

:
Detailed optical properties of Tb3+-Yb3+ co-doped phosphate glasses were performed based on their emission spectra and decay measurements. Under blue excitation of Tb3+ at 488 nm, the intensity of Yb3+ emissions gradually enhanced upon increasing the Yb3+ content until 1 mol% indicated an energy transfer from Tb3+ to Yb3+. Otherwise, under near infrared excitation of Yb3+ at 980 nm, these glasses exhibit intense green luminescence, which led to cooperative sensitization of the 5D4 level of Tb3+ ions. A cooperative energy transfer mechanism was proposed on the basis of the study on the influence of Yb3+ concentration on up-conversion emission intensity, as well as the dependence of this up-conversion intensity on near infrared excitation power. Moreover, the temporal evolution of the up-conversion emissions have been studied, which was in positive agreement with a theoretical model of cooperative up-conversion luminescence that showed a temporal emission curve with rise and decay times of the involved levels.

1. Introduction

Over the past few decades, great attention has been given to synthesize new luminescent materials activated by lanthanide ions, which allows for efficient energy conversion in different materials. These include down-conversion and up-conversion processes [1,2,3,4] in order to provide a wide range of applications, such as in white light-emitting diodes, displays, medical imaging, infrared lasers, optical telecommunication, solar cells, and fiber amplifiers [5,6,7]. The down-conversion that was predicted by Dexter [8] in the 1950s, converts one ultraviolet visible photon into two near infrared photons [9,10]. Numerous works devoted to down-conversion processes have been reported, such as Ce3+-Yb3+, Nd3+-Yb3+ [11], Pr3+-Yb3+ [12], and Tb3+-Yb3+ [13]. In these systems the trivalent Yb3+ ions act as an energy acceptor in order to emit near infrared photons and achieve spectral conversion due to their electronic configuration. These ions have a simple energy level scheme that consists of a broad absorption of 2F7/22F5/2 transition in the near infrared range [9,13,14]. Among lanthanide ions, Tb3+ is an attractive activator ion, as it can absorb high energy photons and transmit energy to two Yb3+ ions. Moreover, the Tb3+ ions can be excited by a cooperative energy transfer from two Yb3+ ions [15,16], and realizing an up-conversion process that involves two photons from the near infrared range that are then converted to a photon with a higher energy.
The choice of host material is also important for the efficiency of the energy transfer process. The phosphate glass is an attractive host material because of its low melting temperature and excellent chemical stability, as well as its high ultraviolet transmission and allowance of a high concentration of rare earth ions doping; as such, it could be an excellent down- and up- conversion luminescence matrix material. Therefore, the present work focuses on the energy transfer processes between Yb3+ and Tb3+ analyzing on the photoluminescence and the temporal luminescence curves in order to identify the involved mechanisms.

2. Experimental

Phosphate glasses samples were prepared by a conventional melt-quenching method with the following compositions: (37.5–x) P2O5-40Na2O3-18ZnO-2Al2O3-2.5Tb2O3-xYb2O3 (in mol%, x = 0.1, 0.5, 1, 2 and 3). The stoichiometric chemicals were mixed homogeneously using a mortar and melted in a platinum crucible at 1400 °C for 3 h. The glasses obtained were annealed at 200 °C for 12 h and slowly cooled down to room temperature.
The emission spectra were obtained by exciting the sample with light from a 300 W Xe arc lamp passed through a 0.25 Spex 1681 monochromator (SR-500i-B2-R, Andor Technology, Belfast, UK) with a R928 model for the visible Hamamatsu photomultiplier (Hamamatsu Photonics, Hamamatsu City, Japan) and a R406 model for the near infrared. All spectra were corrected for the instrumental response. Up-conversion spectra were obtained by exciting the samples with a continuous diode laser at 980 nm. The intensity decay measurements were obtained by exciting with a 10 ns pulsed optical parametric oscillator laser (EKSPLA/NT342/3/UVE, EKSPL, Vilnius, Lithuania) and the emission was focused into the entrance of a monochromator, which was coupled to a photomultiplier (a R928 Hamamatsu in the visible range) and a digital oscilloscope (the LeCroy Wave Surfer 424 was used as a detection system, A TEKTRONIX-2430A, Tektronix, Beaverton, OR, USA).

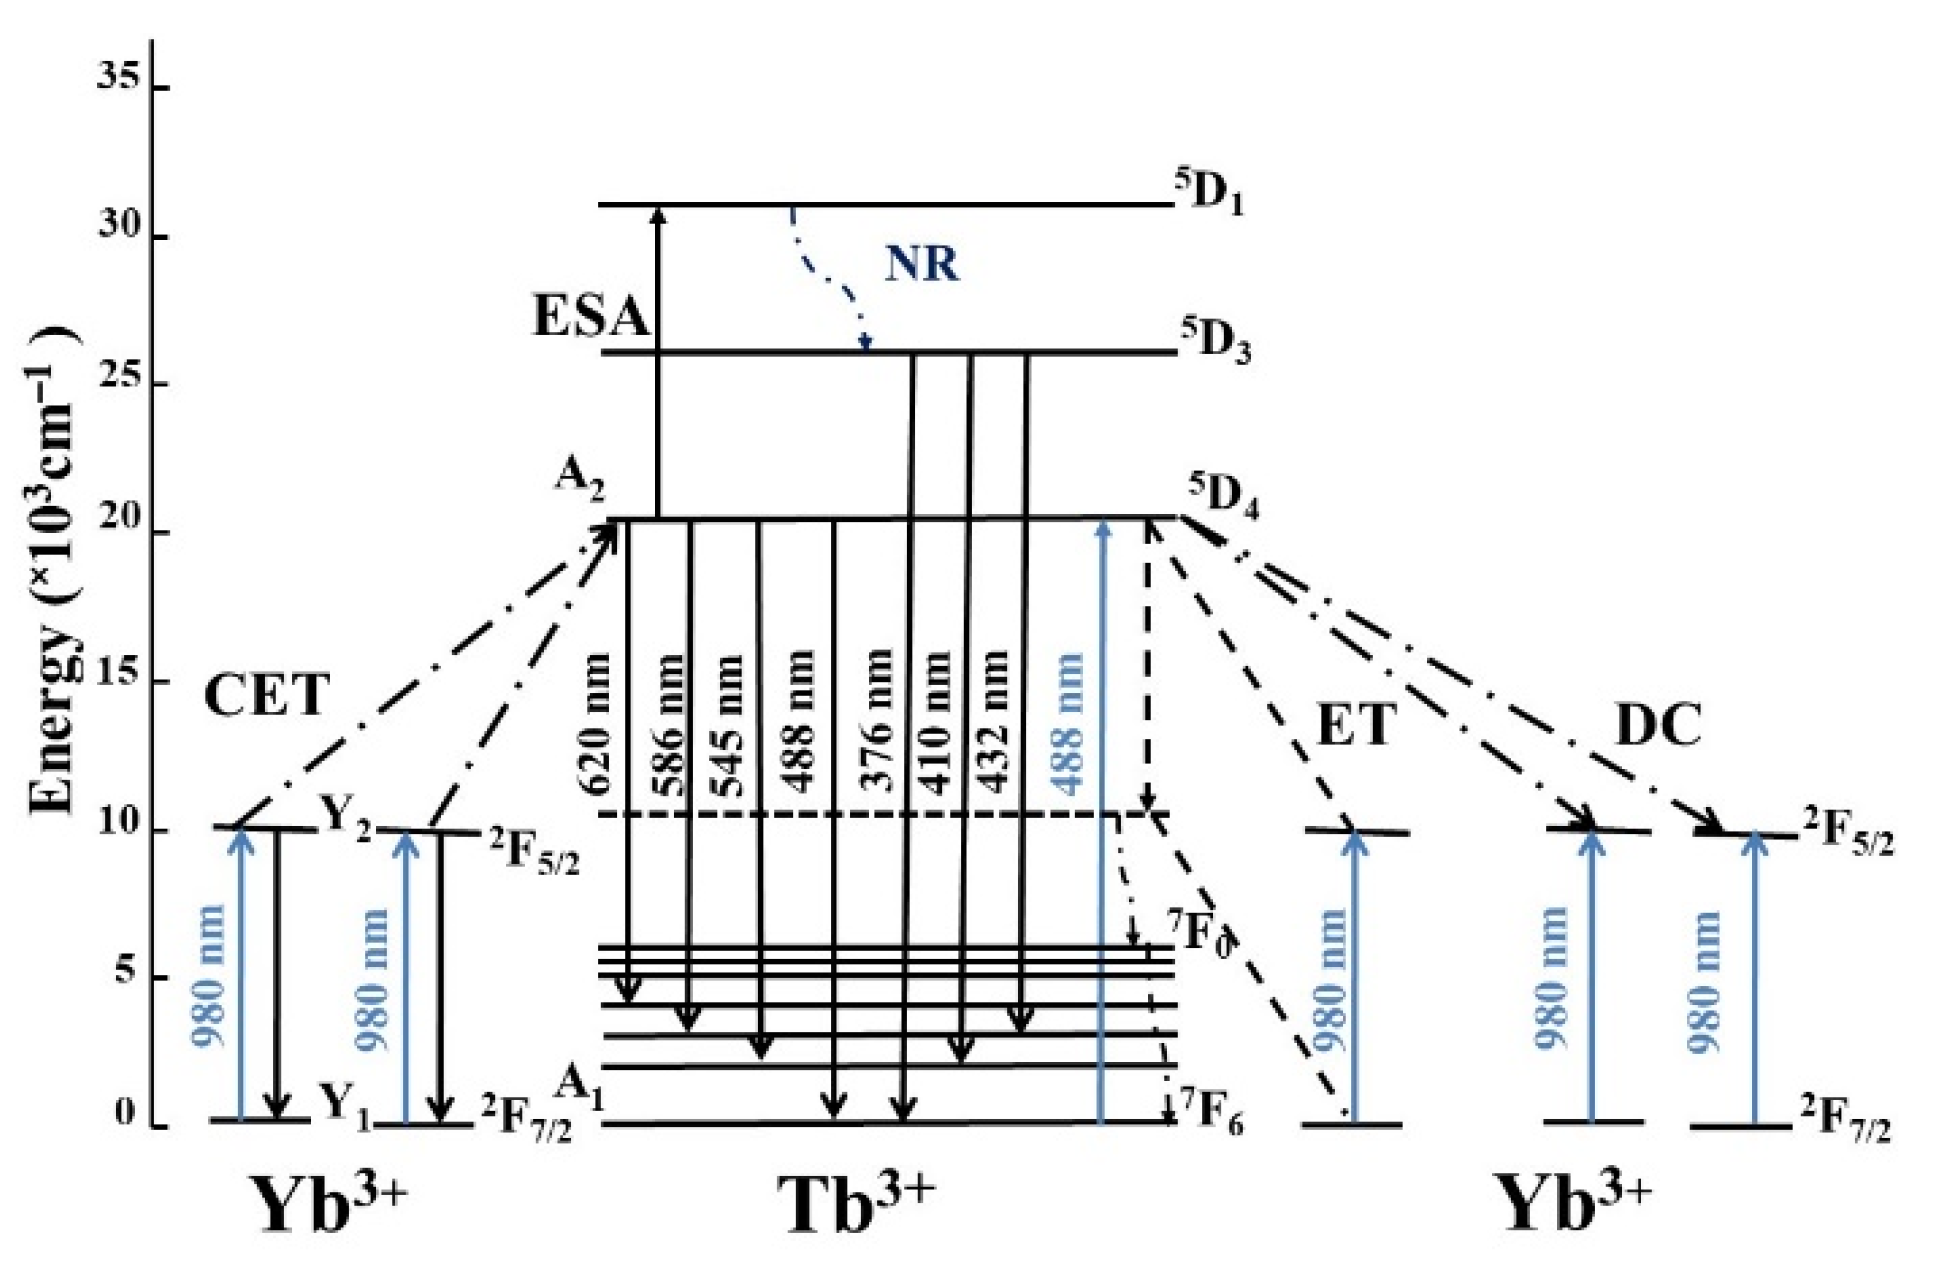
3. Theoretical Introduction for the Cooperative Up-Conversion

At present, there are many studies on Tb3+-Yb3+ ions co-doped up-conversion materials in which ones the energy can be transferred from a pair of interacting Yb3+ ions to an acceptor Tb3+ ion. In this up-conversion process, initially two Yb3+ ions are excited from the ground 2F7/2 level to an excited 2F5/2 state, then this pair of excited Yb3+ ions transfers their energy to a Tb3+ ion in order to populate the 5D4 level [17]. This cooperative up-conversion energy transfer process (CET) is showed schematically in Figure 1.
The cooperative energy transfer process from Yb3+ to Tb3+ can be analyzed in the framework of a rate equation model. In the case of rapid migration among donors, the dynamics of the up-conversion processes produced by cooperative transfer can be described using the following rate equation model [15]:
dY 2 dt = σ Φ Y 1 1 τ D Y 2 WY 2 2 A 1
dA 2 dt = 1 τ A A 2 + WY 2 2 A 1
where Yi and Ai represent the populations of the ith level for the donors (Yb3+) and acceptors (Tb3+), respectively, σ is the absorption cross section of excited ions (donor), Φ is the incident pumping flux, W is the cooperative energy transfer rate, and τD and τA are the donors and acceptors lifetimes, respectively.
If the ground state depopulation and the transfer term were neglected in Equation (1), then in the steady state condition the population A2 can be expressed as:
A 2 = τ A τ D 2 W ( σ Φ ) 2 C A C D 2
where CD and CA correspond to the donor and acceptor concentrations, respectively. According to Equation (3), it is remarkable that the intensity of the up-conversion emission is proportional to the quadratic donor concentration and the pump intensity.
After pulsed excitation at t = 0, the temporal evolution of the up-conversion emission can be described using Equations (1) and (2), and the solution is:
A 2 ( t ) = WC A Y 2 ( 0 ) 2 1 τ A 2 τ D [ exp ( 2 t / τ D ) exp ( t / τ A ) ]
where Y2(0) is the initial population of excited donor ions. It can be noted that the shape of the transient A2(t) (given by Equation (4)) shows a curve with a rise time τD/2 and a decay time τA.

4. Results and Discussion

4.1. Energy Transfer from Tb3+ to Yb3+

4.1.1. Luminescence Spectra

The emission spectra were measured under excitation at 488 nm in 2.5Tb3+-xYb3+ co-doped phosphate glasses (see Figure 2). It was noticed that the emission spectra showed intense bands in the visible and near infrared ranges at 545, 586, 620, and 980 nm, which were generated by the transitions 5D47F5, 7F4, and 7F3 of Tb3+, and 2F5/22F7/2 of Yb3+, respectively. It was noteworthy that the intensity of Yb3+ emissions gradually enhanced up on increasing the Yb3+ content [18]. This result indicated the presence of energy transfer processes; therefore, a portion of Tb3+ ions transferred their energy in order to excite Yb3+ ions [13,19]. The Tb3+ ions were considered as sensitizer by absorbing visible photons and transferring their energy to Yb3+ (which acted as activators). Moreover, with higher Yb3+ concentrations that exceeded 1 mol%, it was observed that the near infrared emission intensity reduced significantly. This quenching effect will be analyzed in the following section.

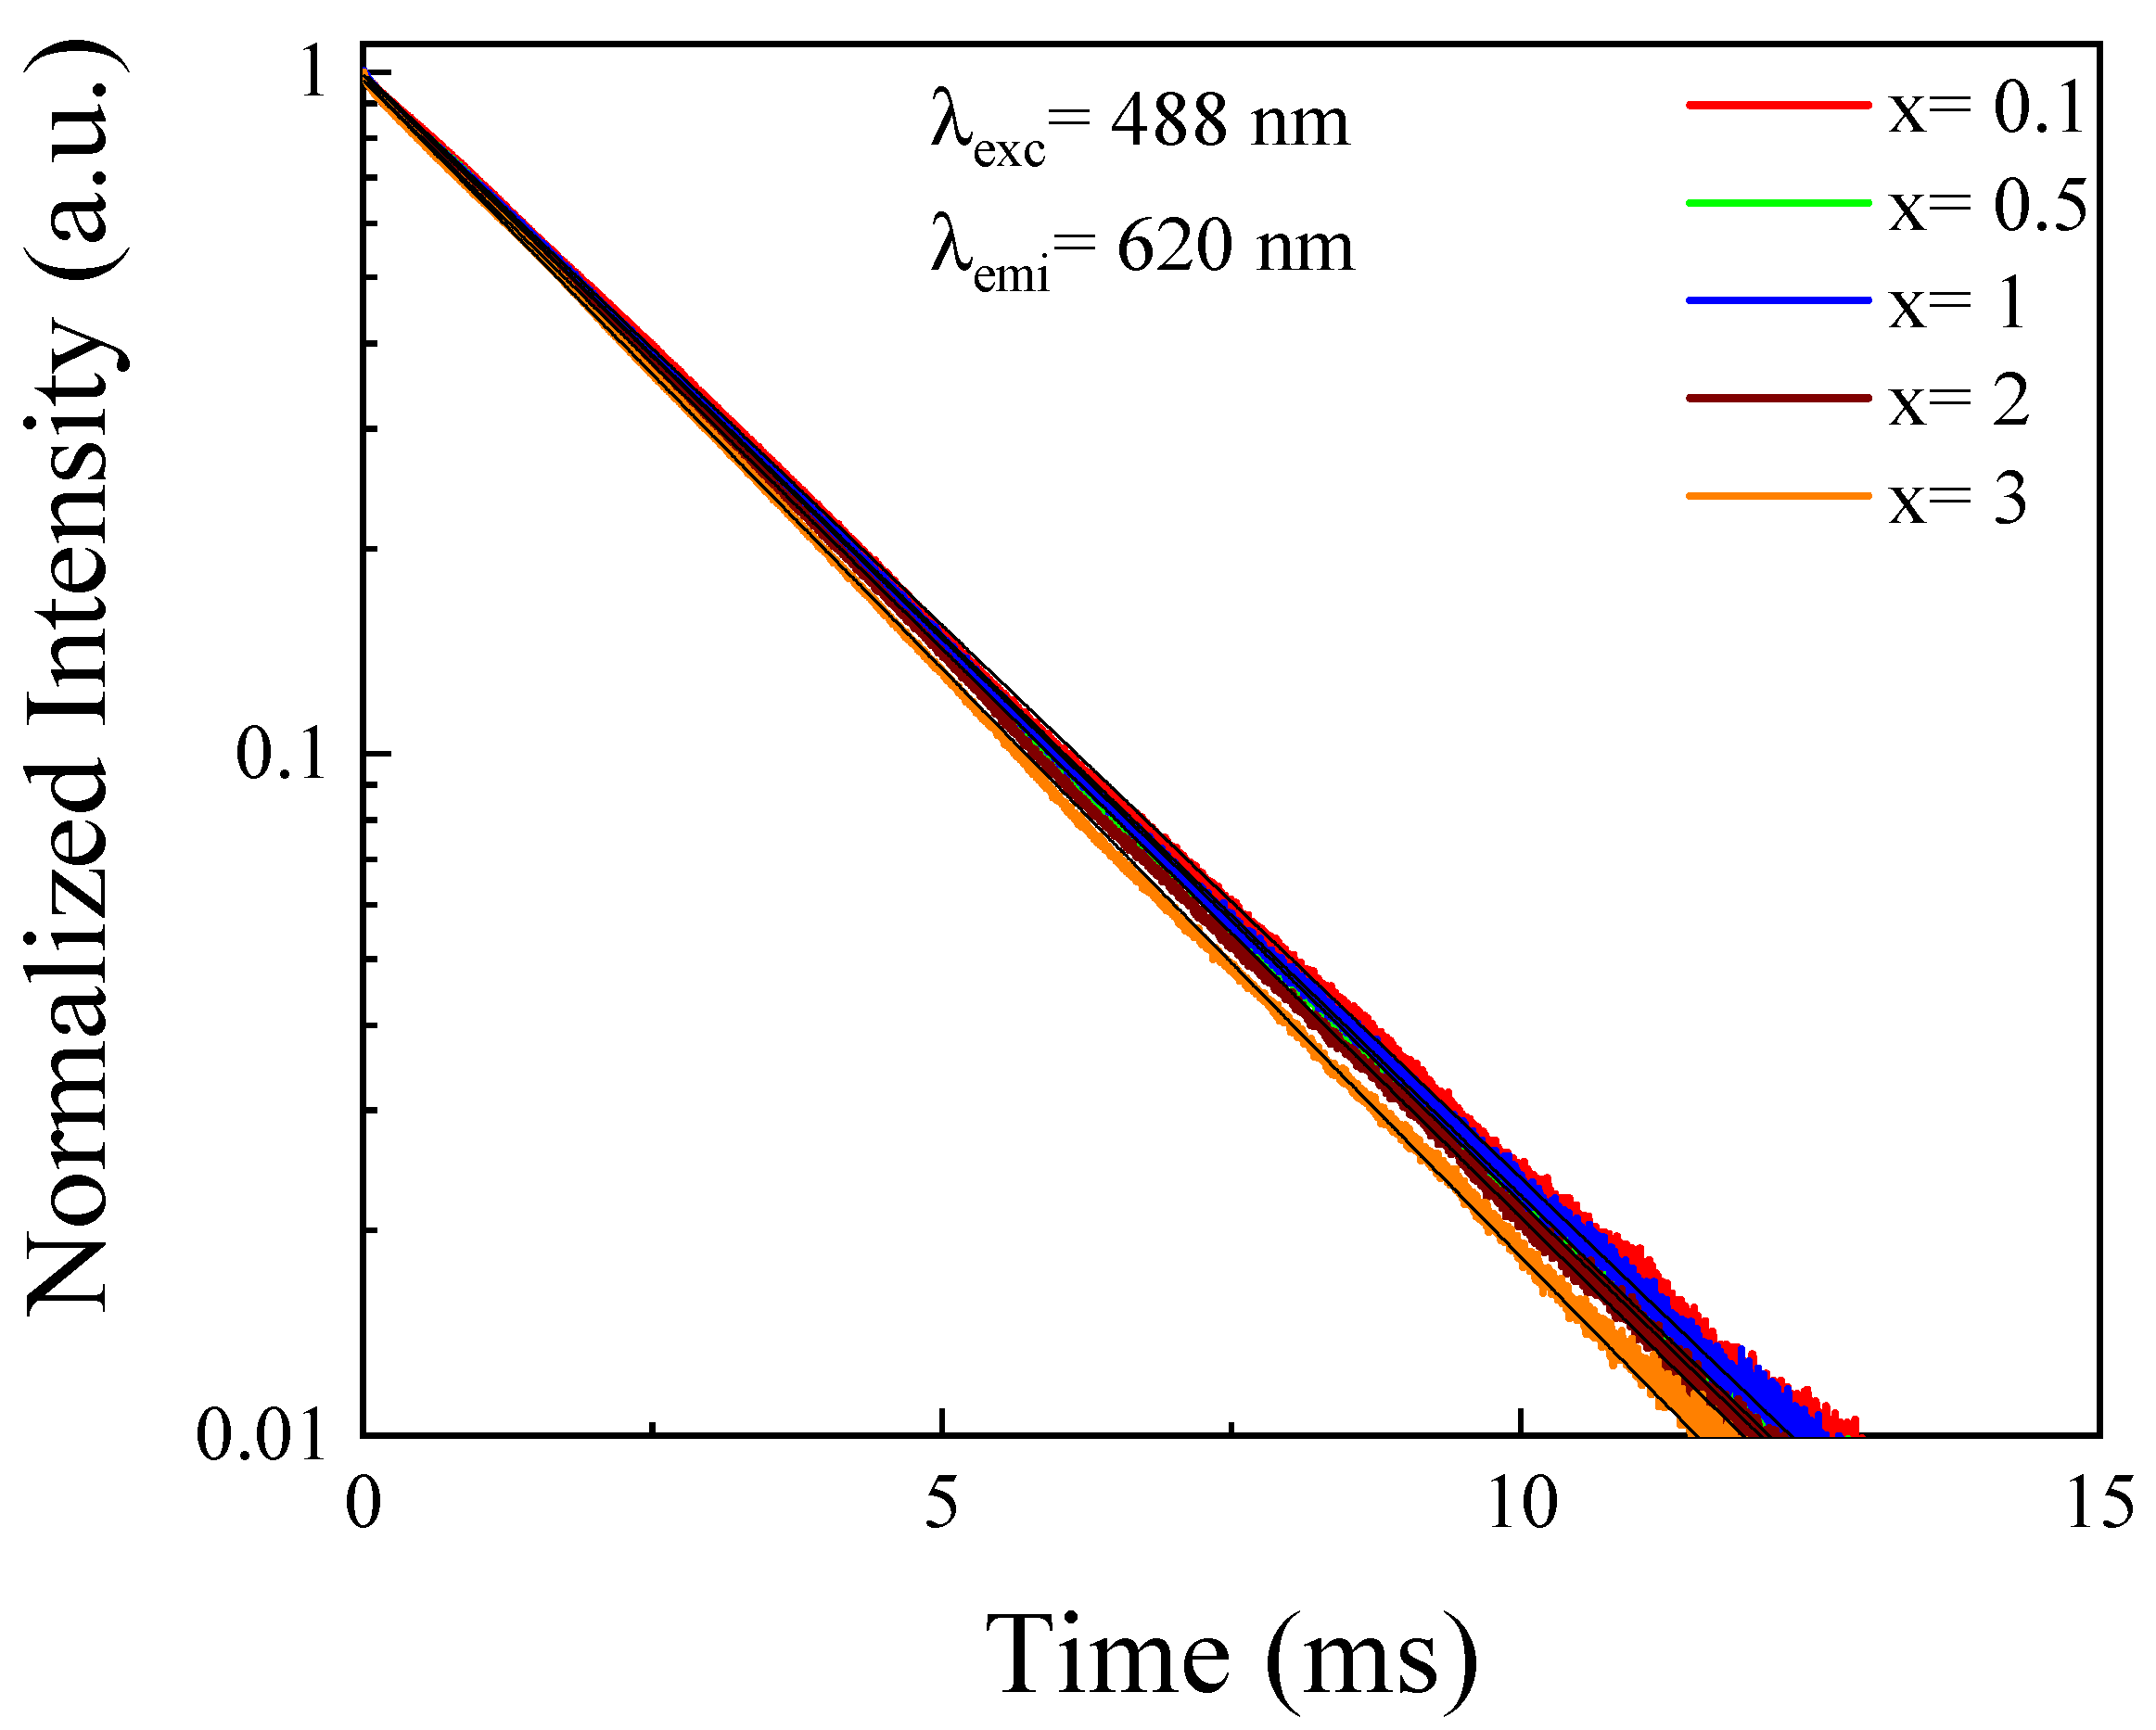
4.1.2. Luminescence Decays

To gain further insight in the energy transfer processes between Tb3+ and Yb3+, the Tb3+ decay curves were obtained exciting at 488 nm and detecting the emission at 620 nm corresponding to 5D4 levels in phosphate glasses co-doped with different Yb3+ concentrations. The results were obtained and shown in Figure 3. It was observed that the lifetime of the 5D4 level weakly decreased (from 2.7 ms to 2.6 ms) with the increasing of Yb3+ concentration doping. Therefore, the Tb3+:5D4 level can be partially depopulated through the energy transfer process due to the increasing of Yb3+ acceptor ions [20]. This result could explain the increase of the Yb3+ emission obtained in Figure 2.
Figure 4 exhibited the decay curves of Yb3+:2F5/2 levels in the 2.5Tb3+-xYb3+ co-doped phosphate glasses under direct excitation of this level under 980 nm. The decay curves are nonexponential and they can be fitted to the parent model [21] as shown:
I ( t ) = I ( 0 ) Exp [ t / τ Q ( t / τ ) 3 S Wt ]
where I(0) is the intensity at time t = 0, Q is the energy transfer parameter (between donor and acceptor), and W depends on the transfer among donors (migration). When the Yb3+ concentration was increased, the decay curves were faster due to an increase of the W parameter, indicating that the migration among Yb3+ ions gained in importance. The decay curves for the samples co-doped with 0.1 and 3 mol% were well fitted to the parent model, considering an interaction character dipole–dipole (S = 6) with values of W = 0 and 0.37 ms−1, respectively. This energy migration process explained the decrease obtained in the Yb3+ emission shown in Figure 2, when the concentration was higher than 1 mol% [20]. However, the main objective in our work was to fit the temporal up-conversion curves, and for this reason the decay curves shown in Figure 4 were fit to exponential. The obtained lifetimes decreased from 1.2 ms to 0.9 ms with the Yb3+ concentration; as such, this effect confirmed the previous result of energy migration. An excited Yb3+ ion transferred its energy to another non-excited Yb3+ ion, and finally, this energy could be transferred to a trap, or Tb3+ ions, at lower levels.
To get more information about the energy transfer mechanism from Tb3+ to Yb3+, the excitation power measurements for 2.5 Tb3+-1Yb3+ co-doped phosphate glass were performed and shown in Figure 5. The slope value for Tb3+:5D47F5 emission is 1.0, exhibiting a linear relationship between the intensity of Tb3+ luminescence and excitation power. However, according to the power dependence property for the luminescence of Yb3+, the slope value for Yb3+:2F5/22F7/2 was 0.83. Duan et al. developed a Quantum Cutting (QC) model using rate equations in order to explain the sublinear slopes [9]. The slope of Yb3+ intensity power dependence was between 0.5 and 1, which indicated the coexistence of two different energy transfer mechanisms in Tb3+-Yb3+ co-doped phosphate glass, such as one photon process where the Yb3+ emission intensity exhibited a linear relation with the excitation power (theory slope of 1.0). This mechanism consists of our system being excited to the 5D4 level transfer of its energy (ET) to one Yb3+ ions by means of a virtual level (Figure 1). From this state, the system relaxed to lower states of Tb3+ ions [20]. The second mechanism required a two photons process (theory slope of 0.5), considering that the energy of Tb3+ transition (5D47F5) is approximately twice to Yb3+ transition (2F5/22F7/2). Then the Tb3+ ion excited to 5D4 level could transfer the energy to two Yb3+ ions via down-conversion process (DC) emitting two 980 near infrared photons (Figure 1).

4.2. Cooperative Energy Transfer from Yb3+ to Tb3+

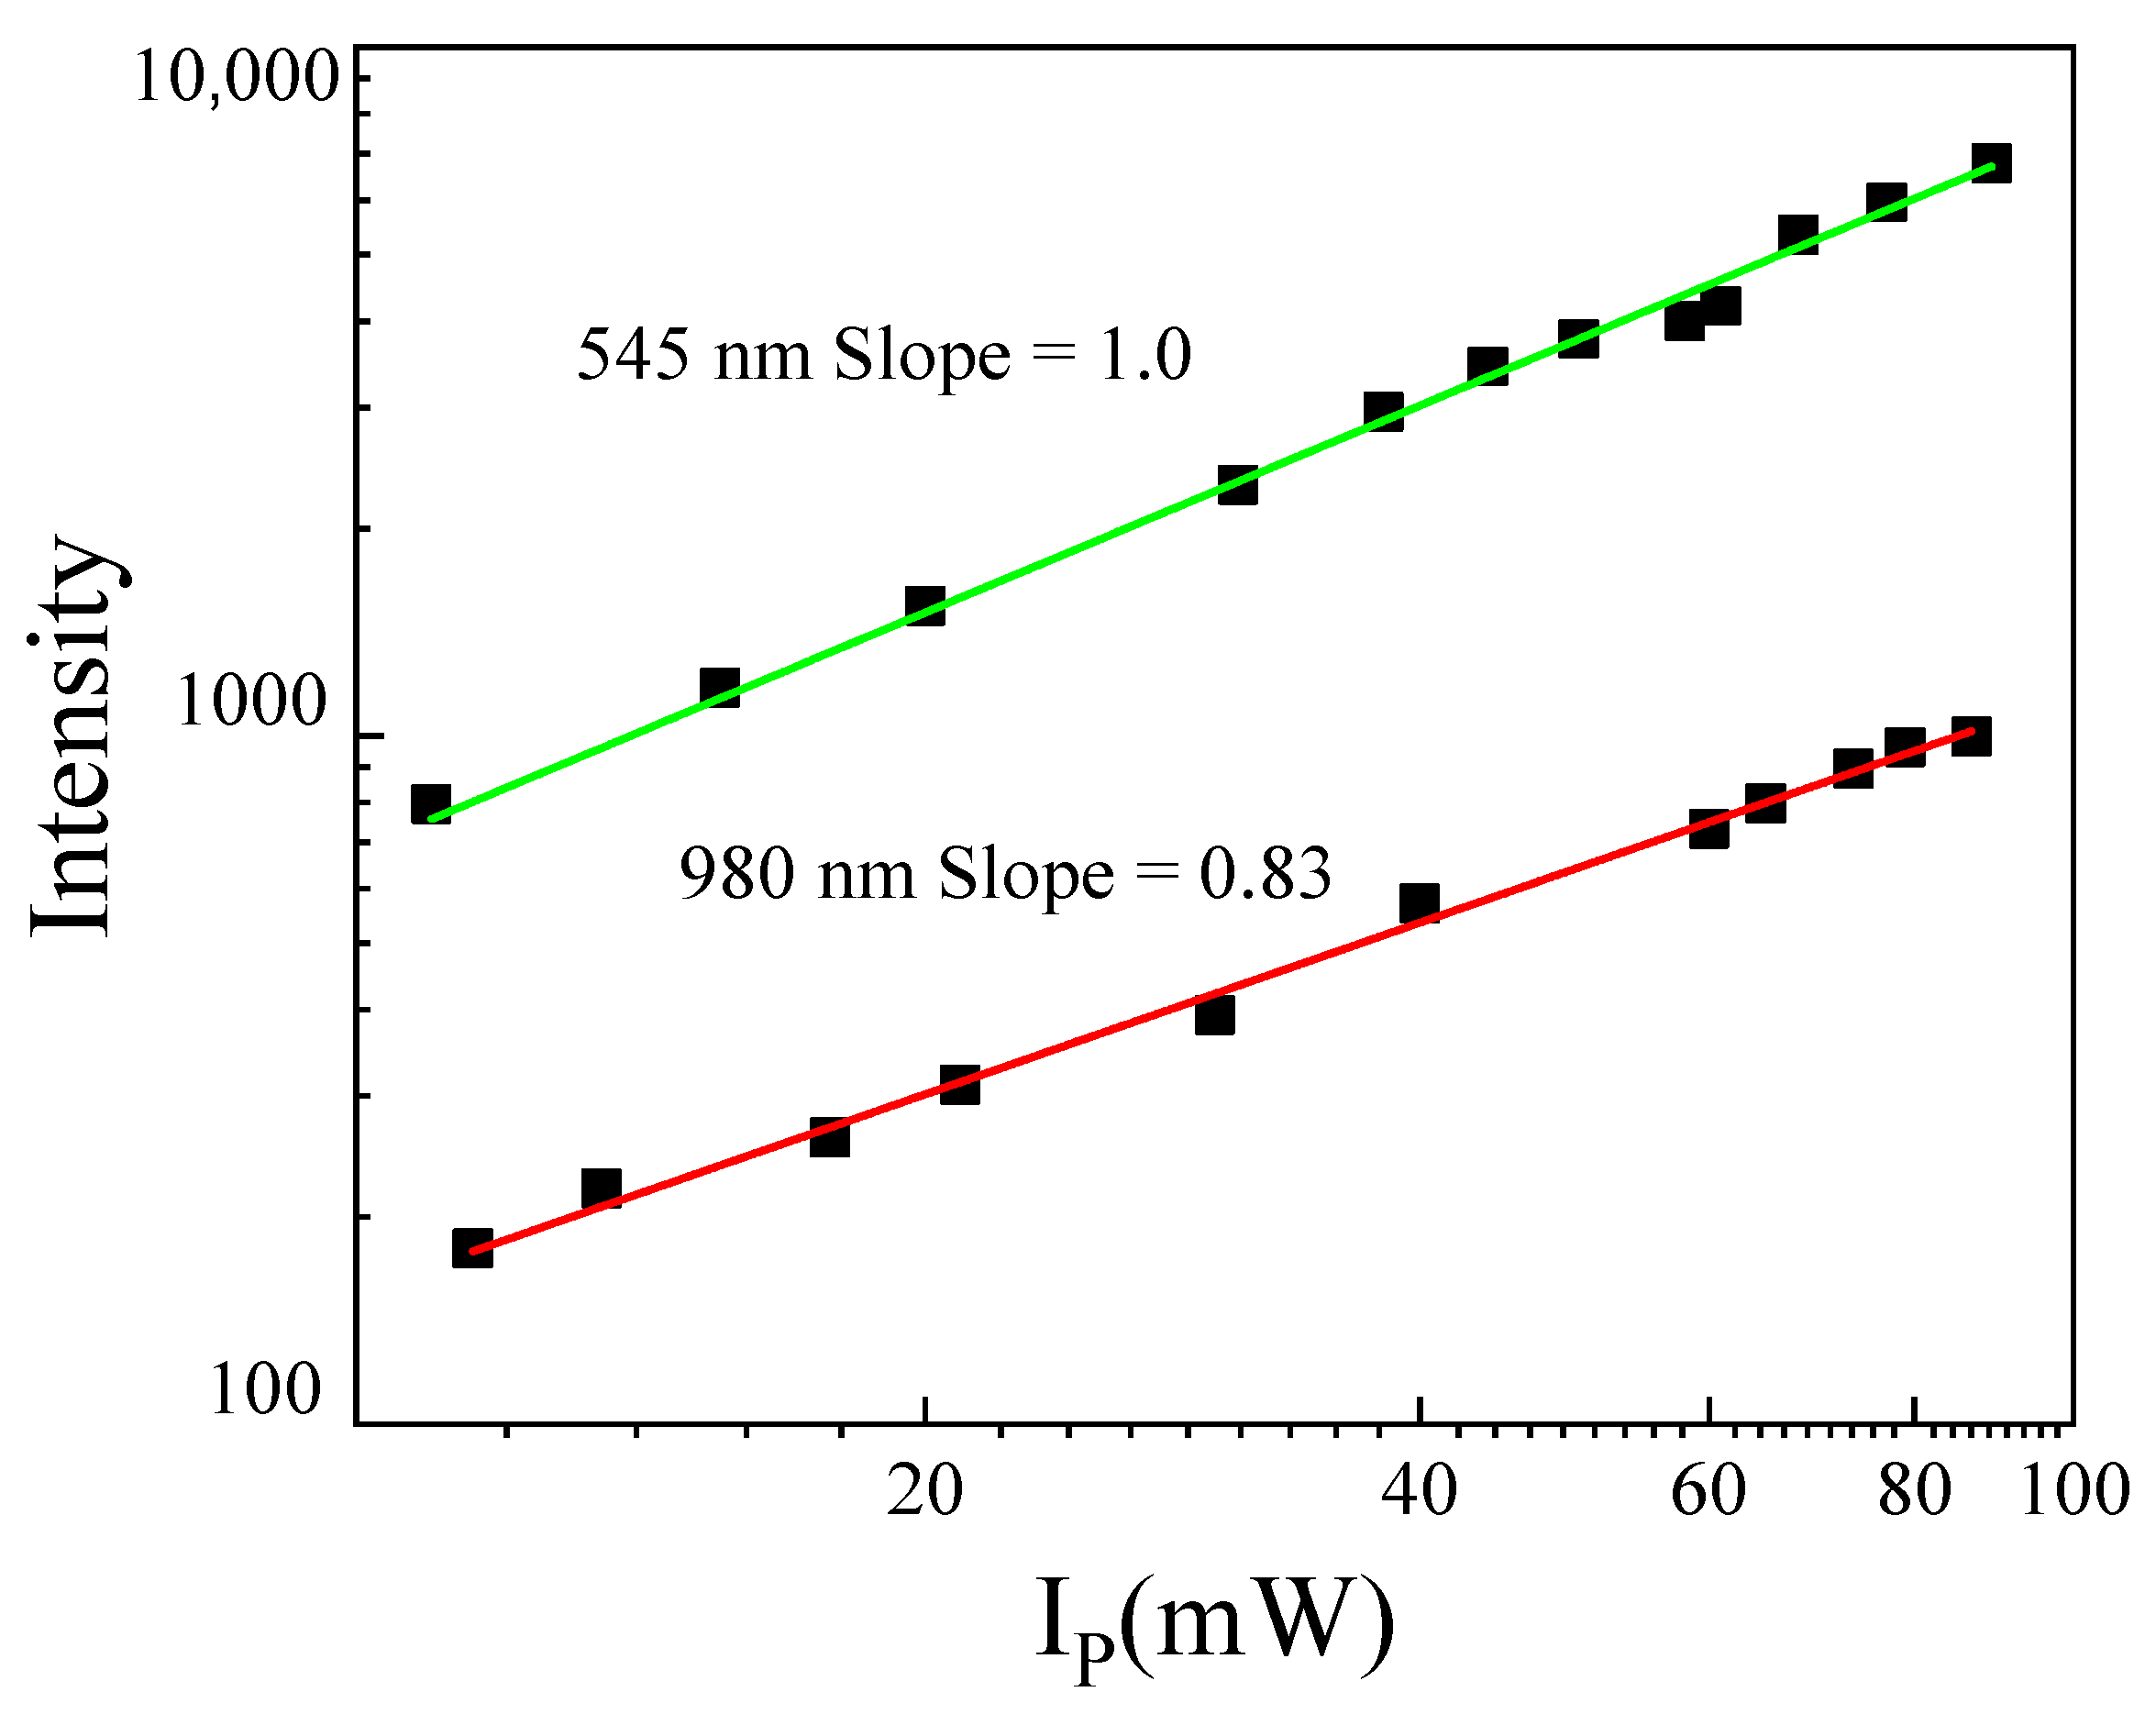
4.2.1. Up-Conversion Luminescence Spectra

Figure 6 illustrated the emission spectra of 2.5Tb3+-xYb3+ co-doped phosphate glasses under excitation at 980 nm. The visible emission showed luminescence bands associated with the f–f electronic transitions of Tb3+ ions. It is interesting to note the presence of four peaks at 488, 545, 586, and 620 nm due to radiative relaxation 5D4 energy level to the 7F6, 7F5, 7F4, and 7F3, respectively. Surprisingly, with high Yb3+ concentration the emission spectra occurred not only from the 5D4, but also from other levels such as 5D3. As such, weak bands were detected centered at 376, 410, and 432 nm, resulting from 5D37F6, 7F5, and 7F4 transitions, respectively. It is noteworthy that these transitions were rarely observed under 980 nm excitation. Therefore, this result confirmed the existence of energy transfer from Yb3+ to Tb3+ via an up-conversion process [22,23].
In order to analyze the up-conversion mechanism, Figure 7a showed the luminescence intensity of the Tb3+ ions as a function of Yb3+ concentration. As can be seen, this luminescence increased with the Yb3+ concentration. Therefore, the energy transfer efficiency from Yb3+ ions to Tb3+ions increased with the increasing of Yb3+ ion content. If this up-conversion process is produced by a cooperative mechanism, then the relation between the up-conversion emission intensity, A2, and the donor concentration is determined by the following condition:
A 2 C D P
where P is the power of the curve with a value of 2, according to Equation (3). Experimentally it is obtained as a value of P = 1.92, which is close to the expected value. It confirmed that the intensity of up-conversion emission was proportional to the quadratic donor concentration, as predicted in Equation (3) (indicating a two photon up-conversion mechanism produced by cooperative transfer).
In order to get deeper insight into the energy transfer mechanism involved in the up-conversion process, Figure 7b exhibited the dependence of the up-conversion luminescence intensity on near infrared excitation power for 2.5Tb3+-3Yb3+ co-doped phosphate glass. It is noteworthy that according to Equation (3), the relation between the up-conversion emission intensity, A2, and the pump power intensity can be expressed by the following condition:
A 2 Φ B
Therefore, the slope obtained by fitting the experimental data was B = 1.5, which was close to the expected value of 2, confirming the expected quadratic dependence on the pump intensity mentioned in Equation (3) that indicated that a two photon up-conversion mechanism was involved [17].

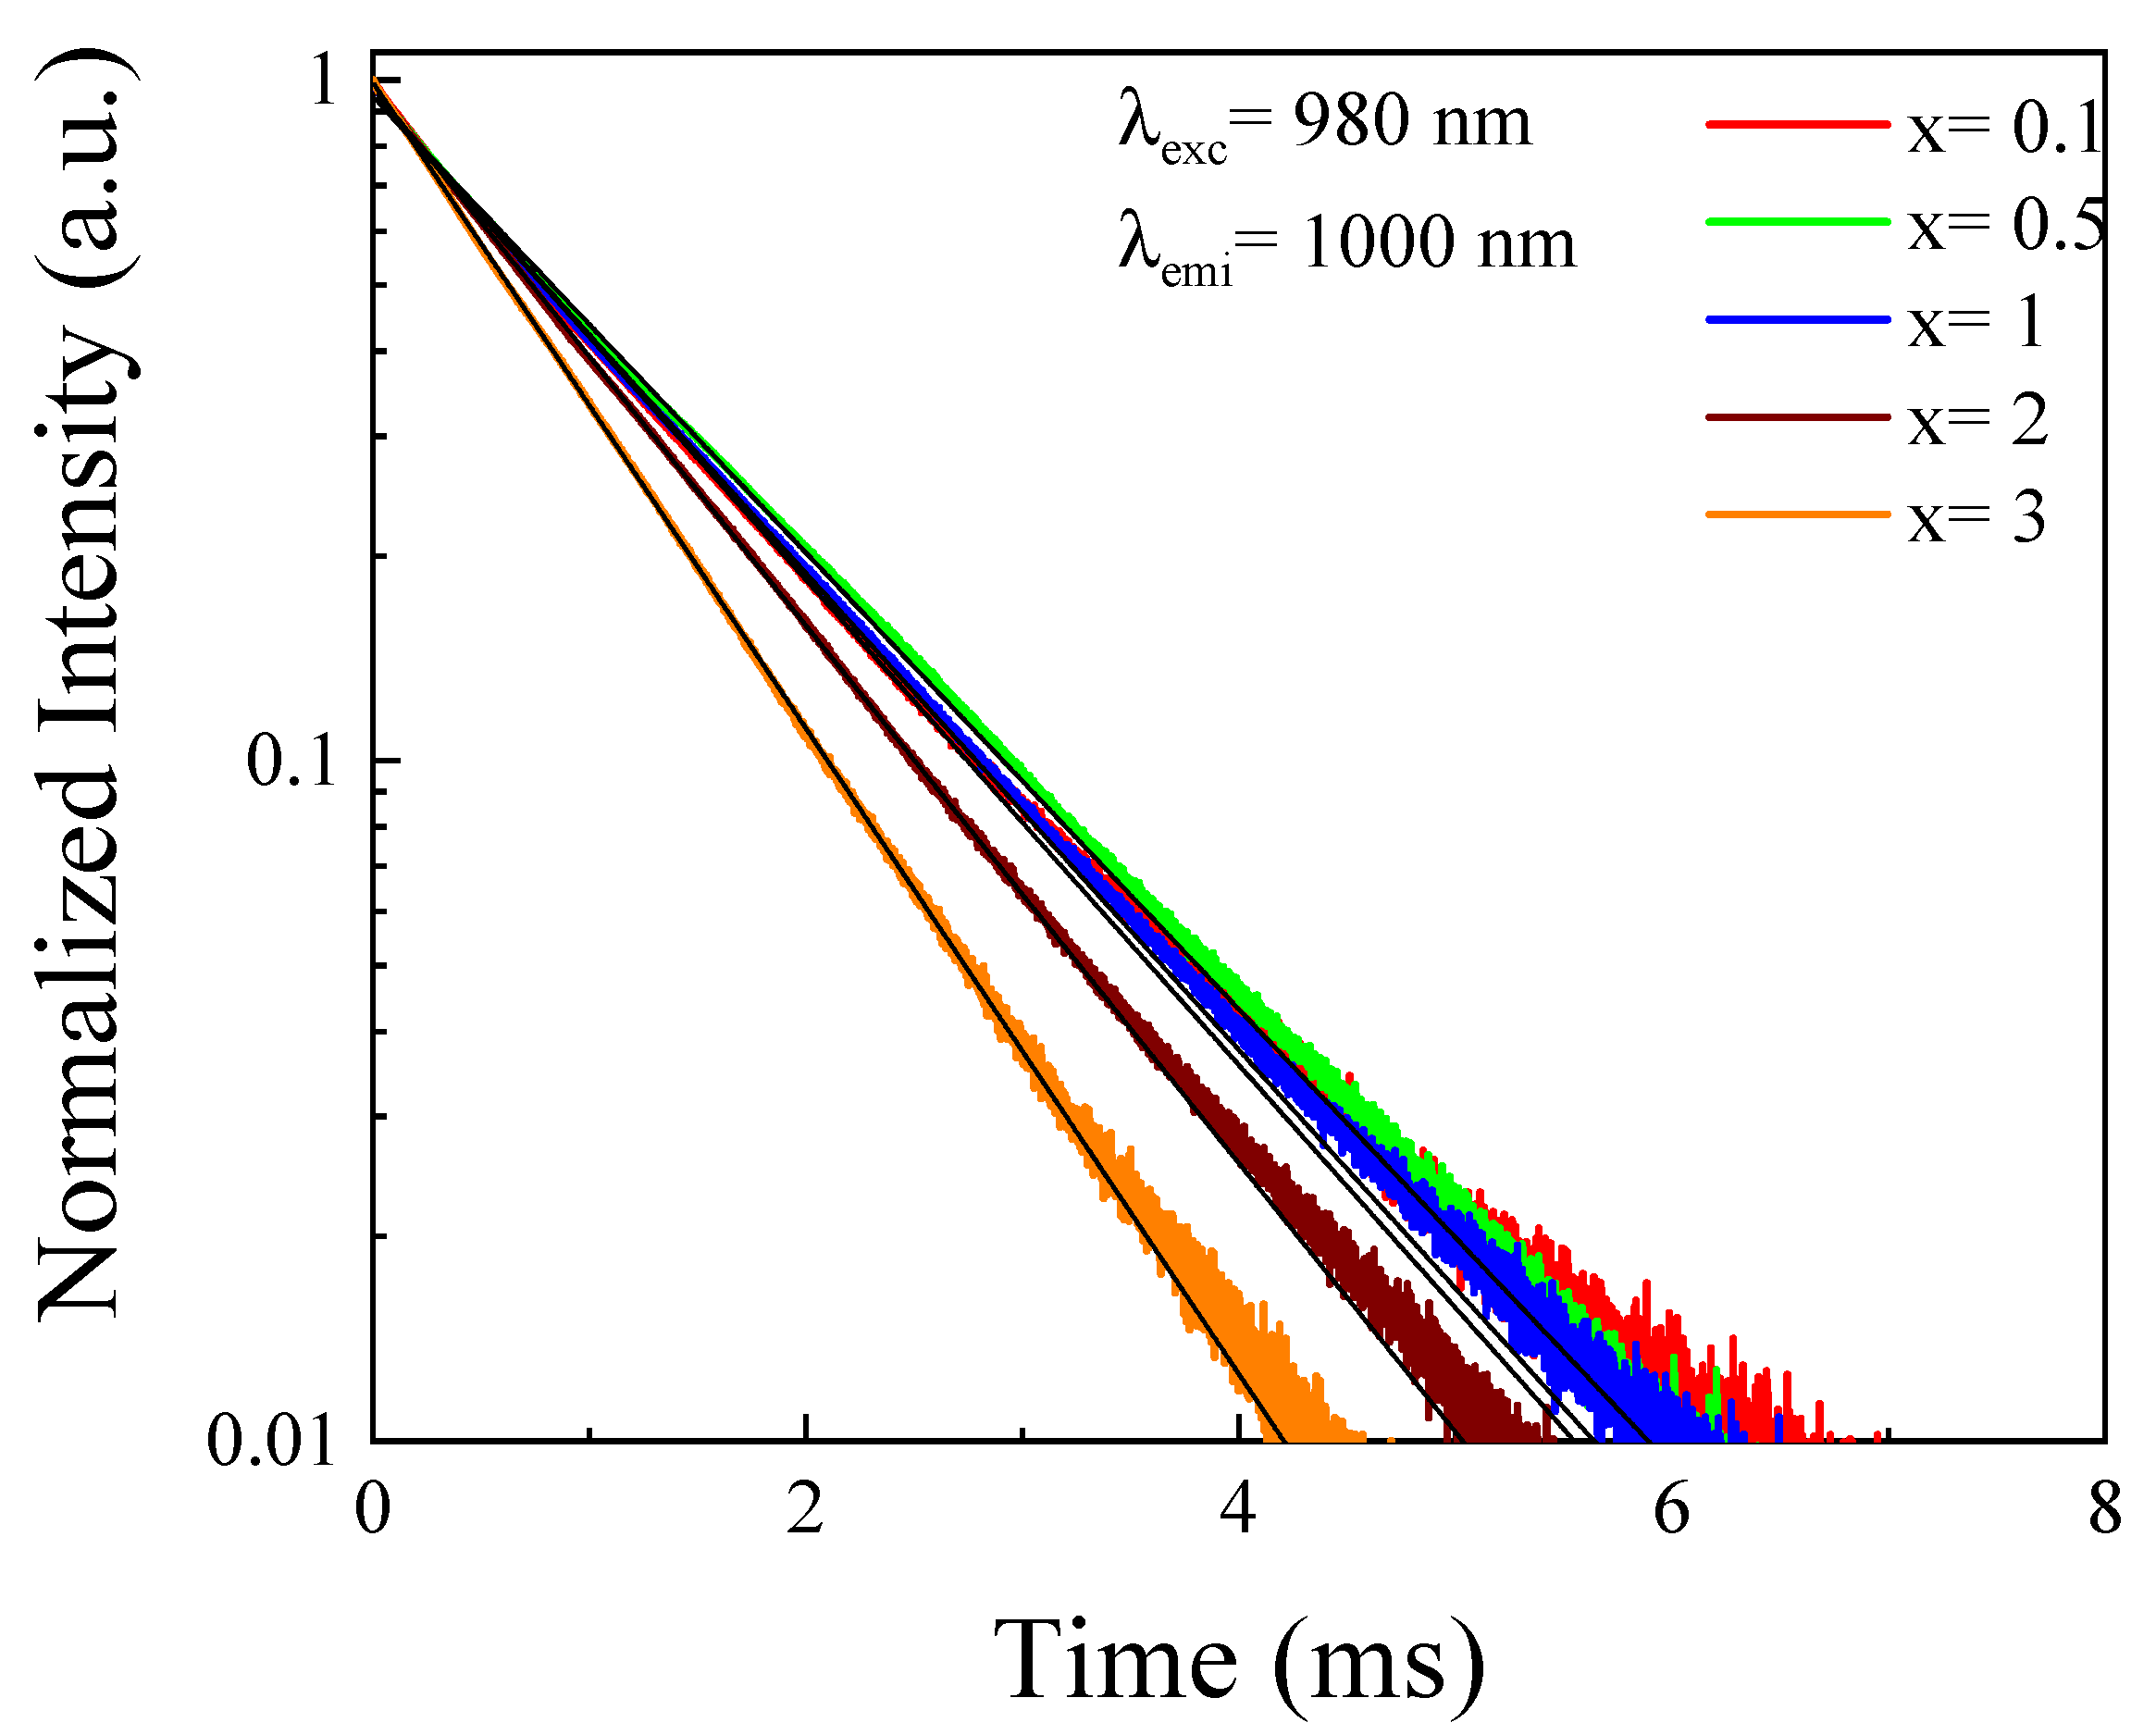
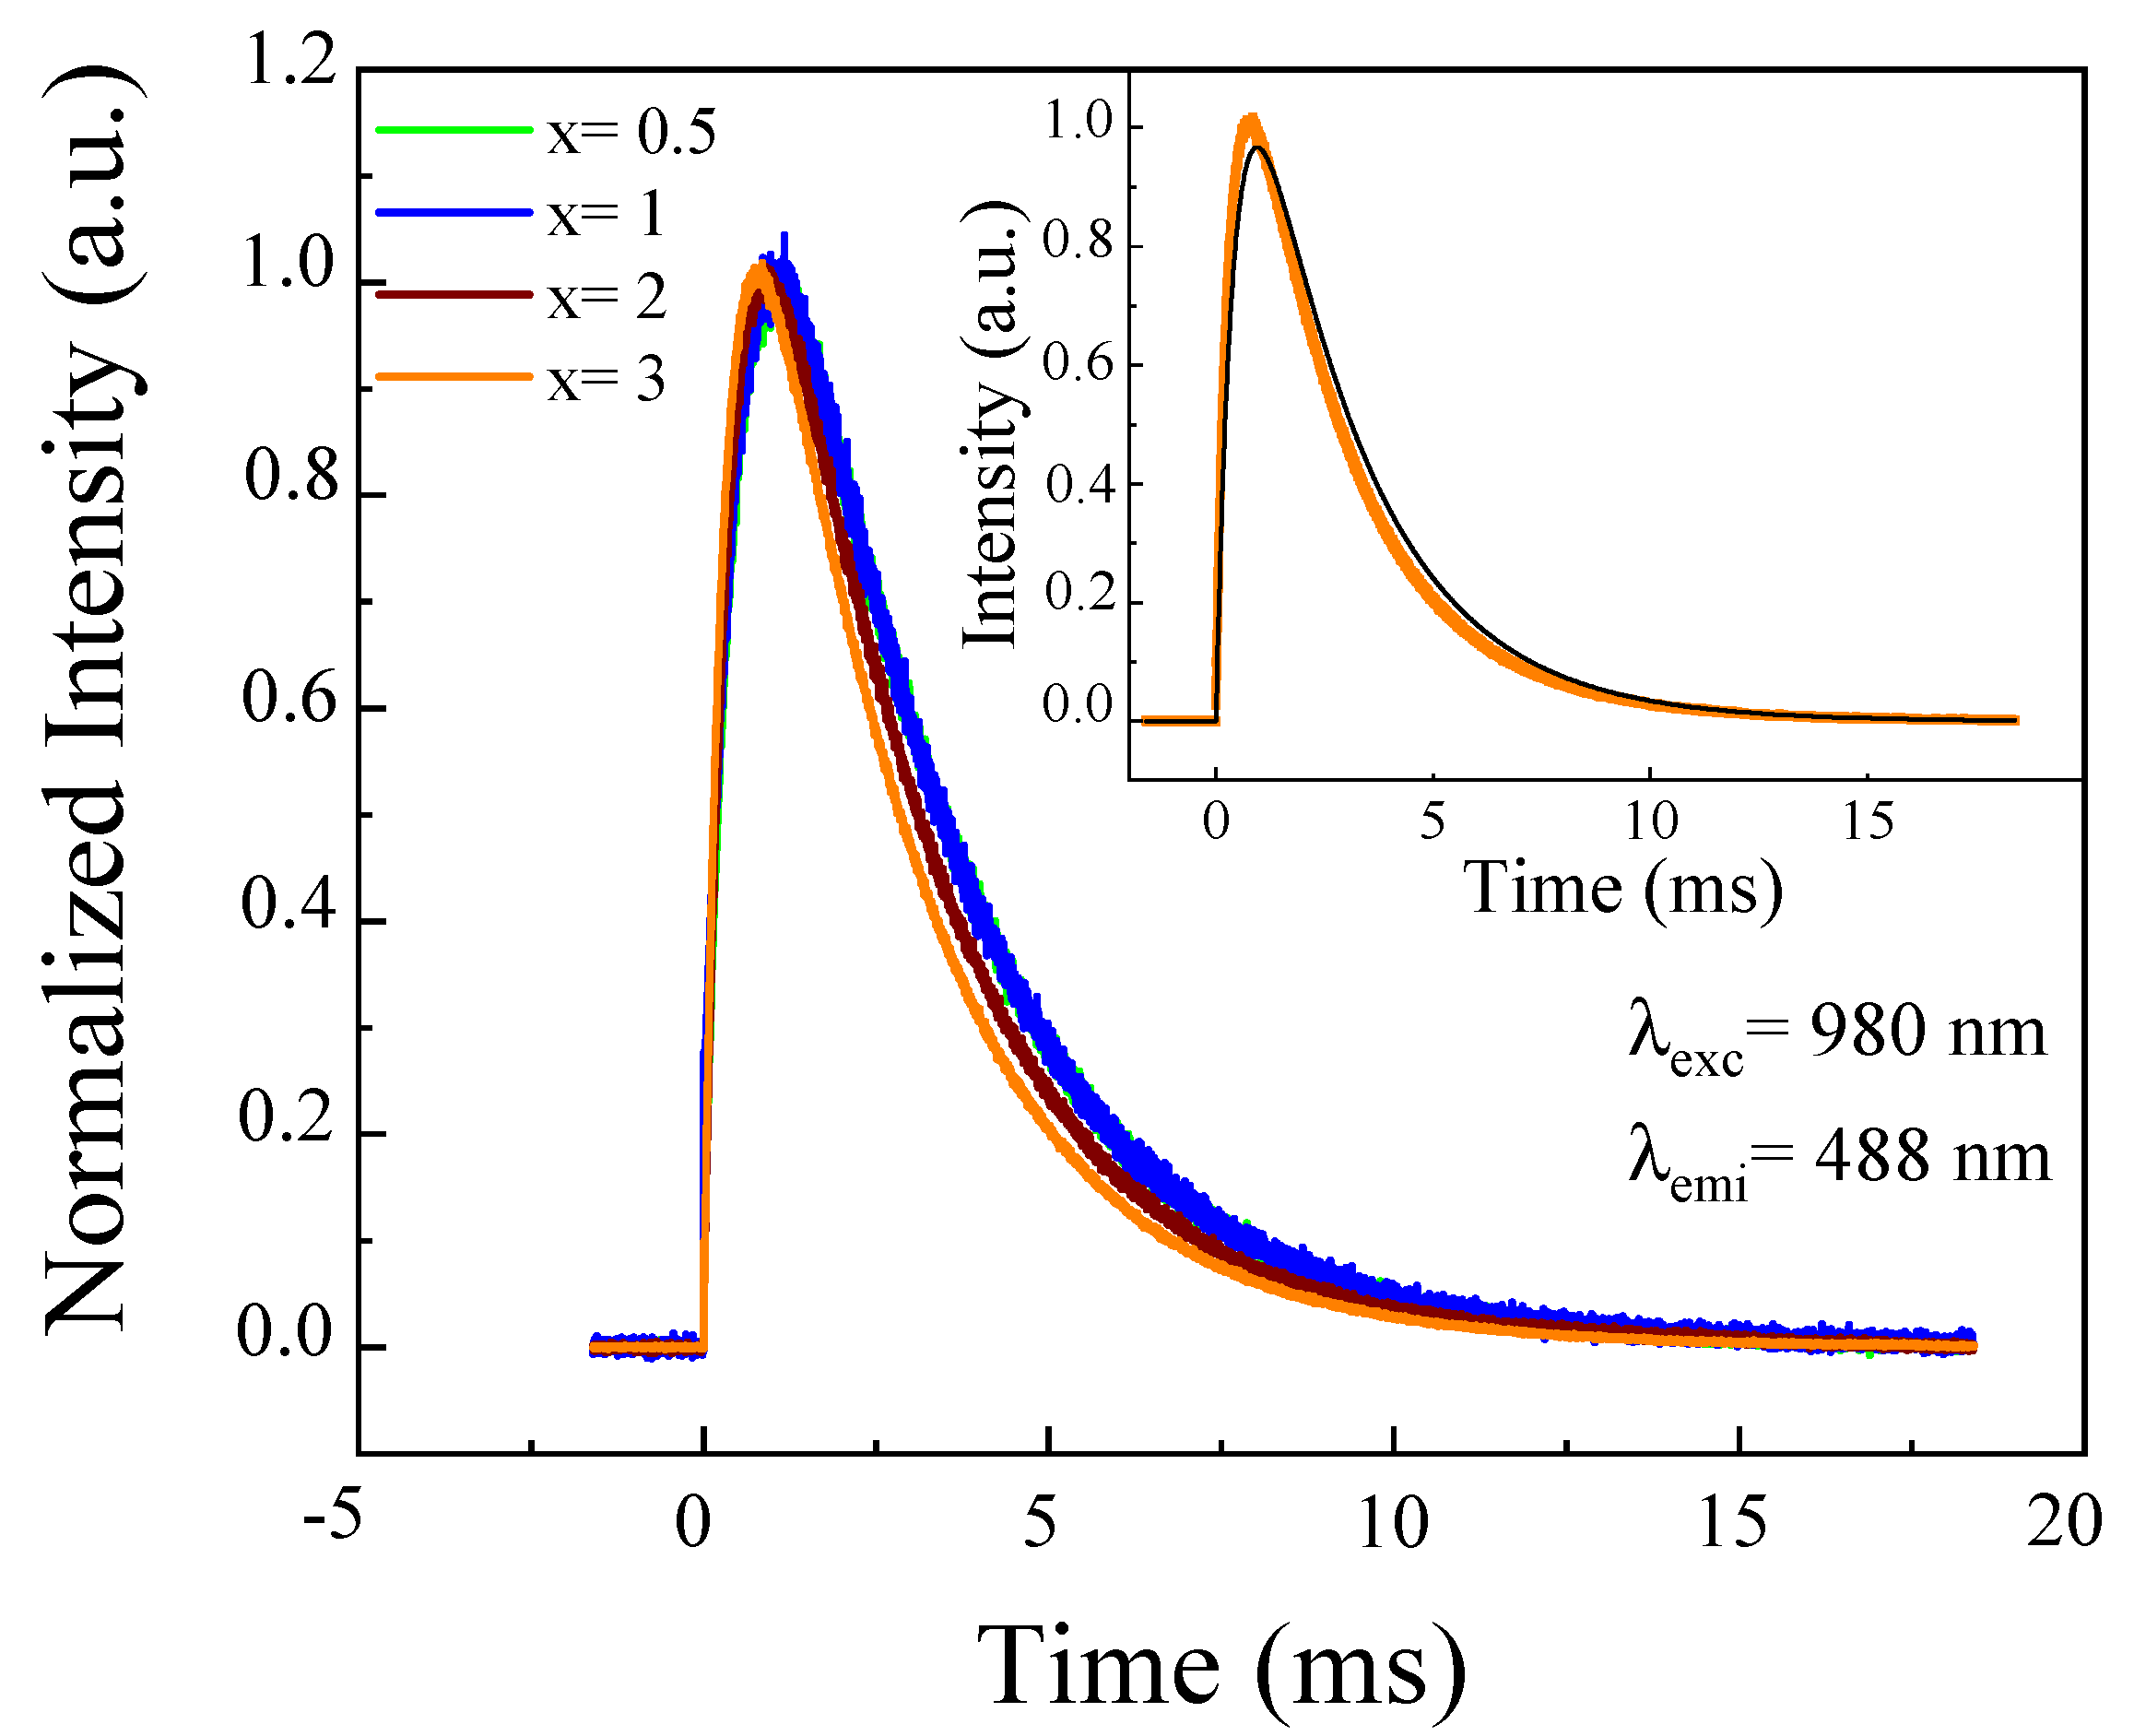
4.2.2. Temporal Evolution of the Up-Conversion Emission

The temporal evolution of the up-conversion emission was measured under direct excitation at 980 nm and detected at 488 nm (Figure 8). It can be seen that the temporal evolution of the Tb3+ up-conversion emission after excitation of Yb3+ ions showed a rise and decay of time. It was noticed that with the increasing of Yb3+ ions content, the rise time was fast, due to the short lifetime of the Yb3+ ions. The experimental results can be fitted to Equation (4), as exampled in the inset showing the fitting to the 2.5Tb3+-3Yb3+ sample. From this fitting, the pre-exponential factor WC A Y 2 ( 0 ) 2 1 τ A 2 τ D was estimated to be −1.7. This negative value was due to the donor lifetime τD = 0.9 ms being lower than the acceptor lifetime (τA = 2.6 ms). These values were consistent with the previous results for this sample of the Yb3+ and Tb3+ lifetimes of 0.9 ms and 2.6 ms, respectively. This result confirmed the cooperative energy transfer (CET) from a pair of Yb3+ ions to a Tb3+ ion.
In summary, the proposed scheme of the energy transfer mechanism (Yb3+→Tb3+) is presented in Figure 1. The 5D4 level could be populated through the CET from Yb3+ according to the following equation:
2 × Yb3+ (2F5/2) + Tb3+ (7F6)→2 × Yb3+ (2F7/2) + Tb3+ (5D4)
Moreover, the 5D4 state can be excited to 5D1 level via an energy transfer from a third excited Yb3+ ion located in close proximity to a pair of interacting Yb3+ ions [17]. Then, the 5D1 rapidly relaxes to the 5D3, from which the weak emission bands are obtained, shown in Figure 6.

5. Conclusions

A series of 2.5Tb3+-xYb3+ co-doped phosphate glasses were prepared in order to obtain energy conversion via down- and up-conversion processes between visible and near infrared radiation. The emission spectra under excitation at 488 nm showed an increasing of Yb3+ emission intensity that confirmed the existence of energy transfer from Tb3+ to Yb3+. However, when Yb3+ concentration exceeded 1 mol%, the near infrared emission intensity began to reduce. The concentration quenching of Yb3+ became a serious problem to limit the energy transfer, which can be explained by the energy migration between Yb3+ ions. This energy can be transferred to a trap or to lower levels of Tb3+ ions. Alternatively, the up-conversion emission spectra were obtained under 980 nm excitation. It was observed that the emission intensity corresponding to the Tb3+ ions transitions 5D47FJ increased, as Yb3+ concentration increased, confirming a cooperative energy transfer from two excited Yb3+ ions to a Tb3+ ion. This result was supported by the influence of Yb3+ concentration on up-conversion emission intensity, as well as the dependence of up-conversion luminescence intensity on near infrared excitation power. The temporal evolution of the Tb3+ up-conversion emission showed a rise time τD/2 and a decay time τA, which was in good agreement with the theoretical model. Consequently, the level 5D4 was populated by cooperative energy transfer process from a pair of Yb3+ ions.

Author Contributions

Writing, H.B. and I.R.M.; formal analysis, H.B. and I.R.M.; data curation, K.S.-C.; software, K.S.-C.; investigation, A.D.L.-G.; resources, A.D.L.-G.; supervision, S.H.; methodology, S.H.; visualization, I.R.M. All authors have read and agreed to the published version of the manuscript.

Funding

This research was funded by the Ministerio de Ciencia e Innovación of Spain (MICIIN) under the National Program of Sciences and Technological Materials (PID2019-106383GB-C44 and PID2019- 107335RA-I00) and Gobierno de Canarias (ProID2020010067) and EU-FEDER funds.

Institutional Review Board Statement

Not applicable.

Informed Consent Statement

Not applicable.

Data Availability Statement

The data presented in this study are available on request from the corresponding author.

Acknowledgments

This work is supported by the Ministry of Higher Education and Scientific Research of Tunisia and by the Ministerio de Ciencia e Innovación of Spain (MICIIN) under the National Program of Sciences and Technological Materials (PID2019-106383GB-C44 and PID2019-107335RA-I00) and Gobierno de Canarias (ProID2020010067) and EU-FEDER funds.

Conflicts of Interest

The authors declare no conflict of interest.

References

  1. Huang, X. Broadband dye-sensitized upconversion: A promising new platform for future solar upconverter design. J. Alloy. Compd. 2017, 690, 356–359. [Google Scholar] [CrossRef]
  2. Dieke, G.H.; Satten, R.A. Spectra and Energy Levels of Rare Earth Ions in Crystals. Am. J. Phys. 1970, 38, 399–400. [Google Scholar] [CrossRef]
  3. Soltani, I.; Hraiech, S.; Horchani-Naifer, K.; Férid, M. Effects of silver nanoparticles on the enhancement of up conversion and infrared emission in Er3+/Yb3+ co-doped phosphate glasses. Opt. Mater. 2018, 77, 161–169. [Google Scholar] [CrossRef]
  4. Benrejeb, H.; Soler-Carracedo, K.; Hraiech, S.; Martin, I. Photoluminescence and energy transfer studies in Ce3+-Sm3+ co-doped phosphate glasses. J. Lumin. 2022, 241, 118471. [Google Scholar] [CrossRef]
  5. Xu, Y.; Zhang, X.; Dai, S.; Fan, B.; Ma, H.; Adam, J.-L.; Ren, J.; Chen, G. Efficient Near-Infrared Down-Conversion in Pr3+–Yb3+ Codoped Glasses and Glass Ceramics Containing LaF3 Nanocrystals. J. Phys. Chem. C 2011, 115, 13056–13062. [Google Scholar] [CrossRef]
  6. Jha, A.; Richards, B.D.O.; Jose, G.; Fernandez, T.T.; Hill, C.J.; Lousteau, J.; Joshi, P. Review on structural, thermal, optical and spectroscopic properties of tellurium oxide based glasses for fibre optic and waveguide applications. Int. Mater. Rev. 2012, 57, 357–382. [Google Scholar] [CrossRef]
  7. Li, J.; Zhang, T.; Zhu, G.; Hairong, Z. Up-conversion photoluminescence emissions of CaMoO4: Pr3+/Yb3+ powder. J. Rare Earths 2017, 35, 645–651. [Google Scholar] [CrossRef]
  8. Strümpel, C.; McCann, M.; Beaucarne, G.; Arkhipov, V.; Slaoui, A.; Švrček, V.; del Cañizo, C.; Tobias, I. Modifying the solar spectrum to enhance silicon solar cell efficiency—An overview of available materials. Sol. Energy Mater. Sol. Cells 2007, 91, 238–249. [Google Scholar] [CrossRef]
  9. Duan, Q.; Qin, F.; Zhang, Z.; Cao, W. Quantum cutting mechanism in NaYF4:Tb3+, Yb3+. Opt. Lett. 2012, 37, 521–523. [Google Scholar] [CrossRef]
  10. Duan, Q.; Qin, F.; Wang, D.; Xu, W.; Cheng, J.; Zhang, Z.; Cao, W. Quantum cutting mechanism in Tb3+-Yb3+ co-doped oxyfluoride glass. J. Appl. Phys. 2011, 110, 113503. [Google Scholar] [CrossRef] [Green Version]
  11. Meijer, J.-M.; Aarts, L.; van der Ende, B.; Vlugt, T.J.H.; Meijerink, A. Downconversion for solar cells inYF3:Nd3+, Yb3+. Phys. Rev. B 2010, 81. [Google Scholar] [CrossRef]
  12. Deng, K.; Wei, X.; Wang, X.; Chen, Y.; Yin, M. Near-infrared quantum cutting via resonant energy transfer from Pr3+ to Yb3+ in LaF3. Appl. Phys. A 2011, 102, 555–558. [Google Scholar] [CrossRef]
  13. Liu, X.; Ye, S.; Qiao, Y.; Dong, G.; Zhu, B.; Chen, D.; Lakshminarayana, G.; Qiu, J. Cooperative downconversion and near-infrared luminescence of Tb3+–Yb3+ codoped lanthanum borogermanate glasses. Appl. Phys. A 2009, 96, 51–55. [Google Scholar] [CrossRef]
  14. Li, G.; Zhang, C.; Song, P.; Zhu, P.; Zhu, K.; He, J. Luminescence properties in Tb3+/Yb3+ codoped phosphate glasses for solar cells. J. Alloy. Compd. 2016, 662, 89–93. [Google Scholar] [CrossRef]
  15. Martin, I.R.; Yanes, A.C.; Méndez-Ramos, J.; Torres, M.E.; Rodríguez, V.D. Cooperative energy transfer in Yb3+–Tb3+ codoped silica sol-gel glasses. J. Appl. Phys. 2001, 89, 2520–2524. [Google Scholar] [CrossRef]
  16. Dos Santos, J.; Zanuto, V.; Soares, A.; Savi, E.; Nunes, L.; Baesso, M.; Catunda, T. Evaluating the link between blue-green luminescence and cross-relaxation processes in Tb3+-doped glasses. J. Lumin. 2021, 240, 118430. [Google Scholar] [CrossRef]
  17. Puchalska, M.; Zych, E.; Watras, A. Cooperative up-conversion processes in SrAl4O7:Yb and SrAl4O7:Yb,Tb and their dependence on charge compensation by Na. J. Lumin. 2017, 183, 185–192. [Google Scholar] [CrossRef]
  18. Grzyb, T.; Gruszeczka, A.; Wiglusz, R.J.; Lis, S. The effects of down- and up-conversion on dual-mode green luminescence from Yb3+- and Tb3+-doped LaPO4 nanocrystals. J. Mater. Chem. C 2013, 1, 5410–5418. [Google Scholar] [CrossRef]
  19. Huang, X.; Yu, D.C.; Zhang, Q.Y. Enhanced near-infrared quantum cutting in GdBO3:Tb3+,Yb3+ phosphors by Ce3+ codoping. J. Appl. Phys. 2009, 106, 113521. [Google Scholar] [CrossRef]
  20. Terra, I.; Borrero-González, L.; Figueredo, T.; Almeida, J.; Hernandes, A.; Nunes, L.; Malta, O. Down-conversion process in Tb3+–Yb3+ co-doped Calibo glasses. J. Lumin. 2012, 132, 1678–1682. [Google Scholar] [CrossRef]
  21. Parent, C.; Lurin, C.; Le Flem, G.; Hagenmuller, P. Nd3+ → Yb3+ energy transfer in glasses with composition close to LiLnP4O12 metaphosphate (Ln = La, Nd, Yb). J. Lumin. 1986, 36, 49–55. [Google Scholar] [CrossRef]
  22. Kochanowicz, M.; Dorosz, D.; Zmojda, J.; Dorosz, J.; Pisarska, J.; Pisarski, W. Up-conversion luminescence of Tb3+ ions in germanate glasses under diode-laser excitation of Yb3+. Opt. Mater. Express 2014, 4, 1050–1056. [Google Scholar] [CrossRef]
  23. Puchalska, M.; Zych, E.; Sobczyk, M.; Watras, A.; Dereń, P. Cooperative energy transfer in Yb3+–Tb3+ co-doped CaAl4O7 upconverting phosphor. Mater. Chem. Phys. 2015, 156, 220–226. [Google Scholar] [CrossRef]
Figure 1. Energy level diagram of Yb3+ and Tb3+ ions co-doped phosphate glass showing the possible mechanism of energy transfer processes.
Materials 14 06782 g001
Figure 2. Emission spectra of 2.5Tb3+-xYb3+ co-doped phosphate glasses normalized to 5D47F5 peak.
Materials 14 06782 g002
Figure 3. Decay curves of Tb3+ in 2.5Tb3+-xYb3+ co-doped phosphate glasses.
Materials 14 06782 g003
Figure 4. Decay curves of Yb3+ in 2.5Tb3+-xYb3+ co-doped phosphate glasses.
Materials 14 06782 g004
Figure 5. Plot of the Tb3+and Yb3+ emission intensity as a function of pumping power (Ip) at 488 nm obtained in 2.5Tb3+-1Yb3+ co-doped phosphate glass.
Materials 14 06782 g005
Figure 6. Emission spectra of 2.5Tb3+-xYb3+ co-doped phosphate glasses.
Materials 14 06782 g006
Figure 7. Tb3+ emission intensity as a function of Yb3+ concentration fitted to Equation (3) (solid line) (a). Plot of the 5D47F5 emission intensity as a function of pumping power (Ip) at 980 nm obtained in a 2.5Tb3+-3Yb3+ co-doped phosphate glass (b).
Materials 14 06782 g007
Figure 8. Temporal evolution of Tb3+ emissions at 488 nm obtained under excitation at 980 nm in 2.5Tb3+-xYb3+ co-doped phosphate glasses. The inset shows the fit of the decay curve for 2.5Tb3+-3Yb3+ co-doped phosphate glass to Equation (4).
Materials 14 06782 g008
Publisher’s Note: MDPI stays neutral with regard to jurisdictional claims in published maps and institutional affiliations.

