3.1. SEM-EDX
Both electrodes are coated with FTO from one side, and the front electrode has an additional TiO
2 layer. This could be confirmed with the SEM-EDX. For both samples, a surface with predominantly glass components could be detected.
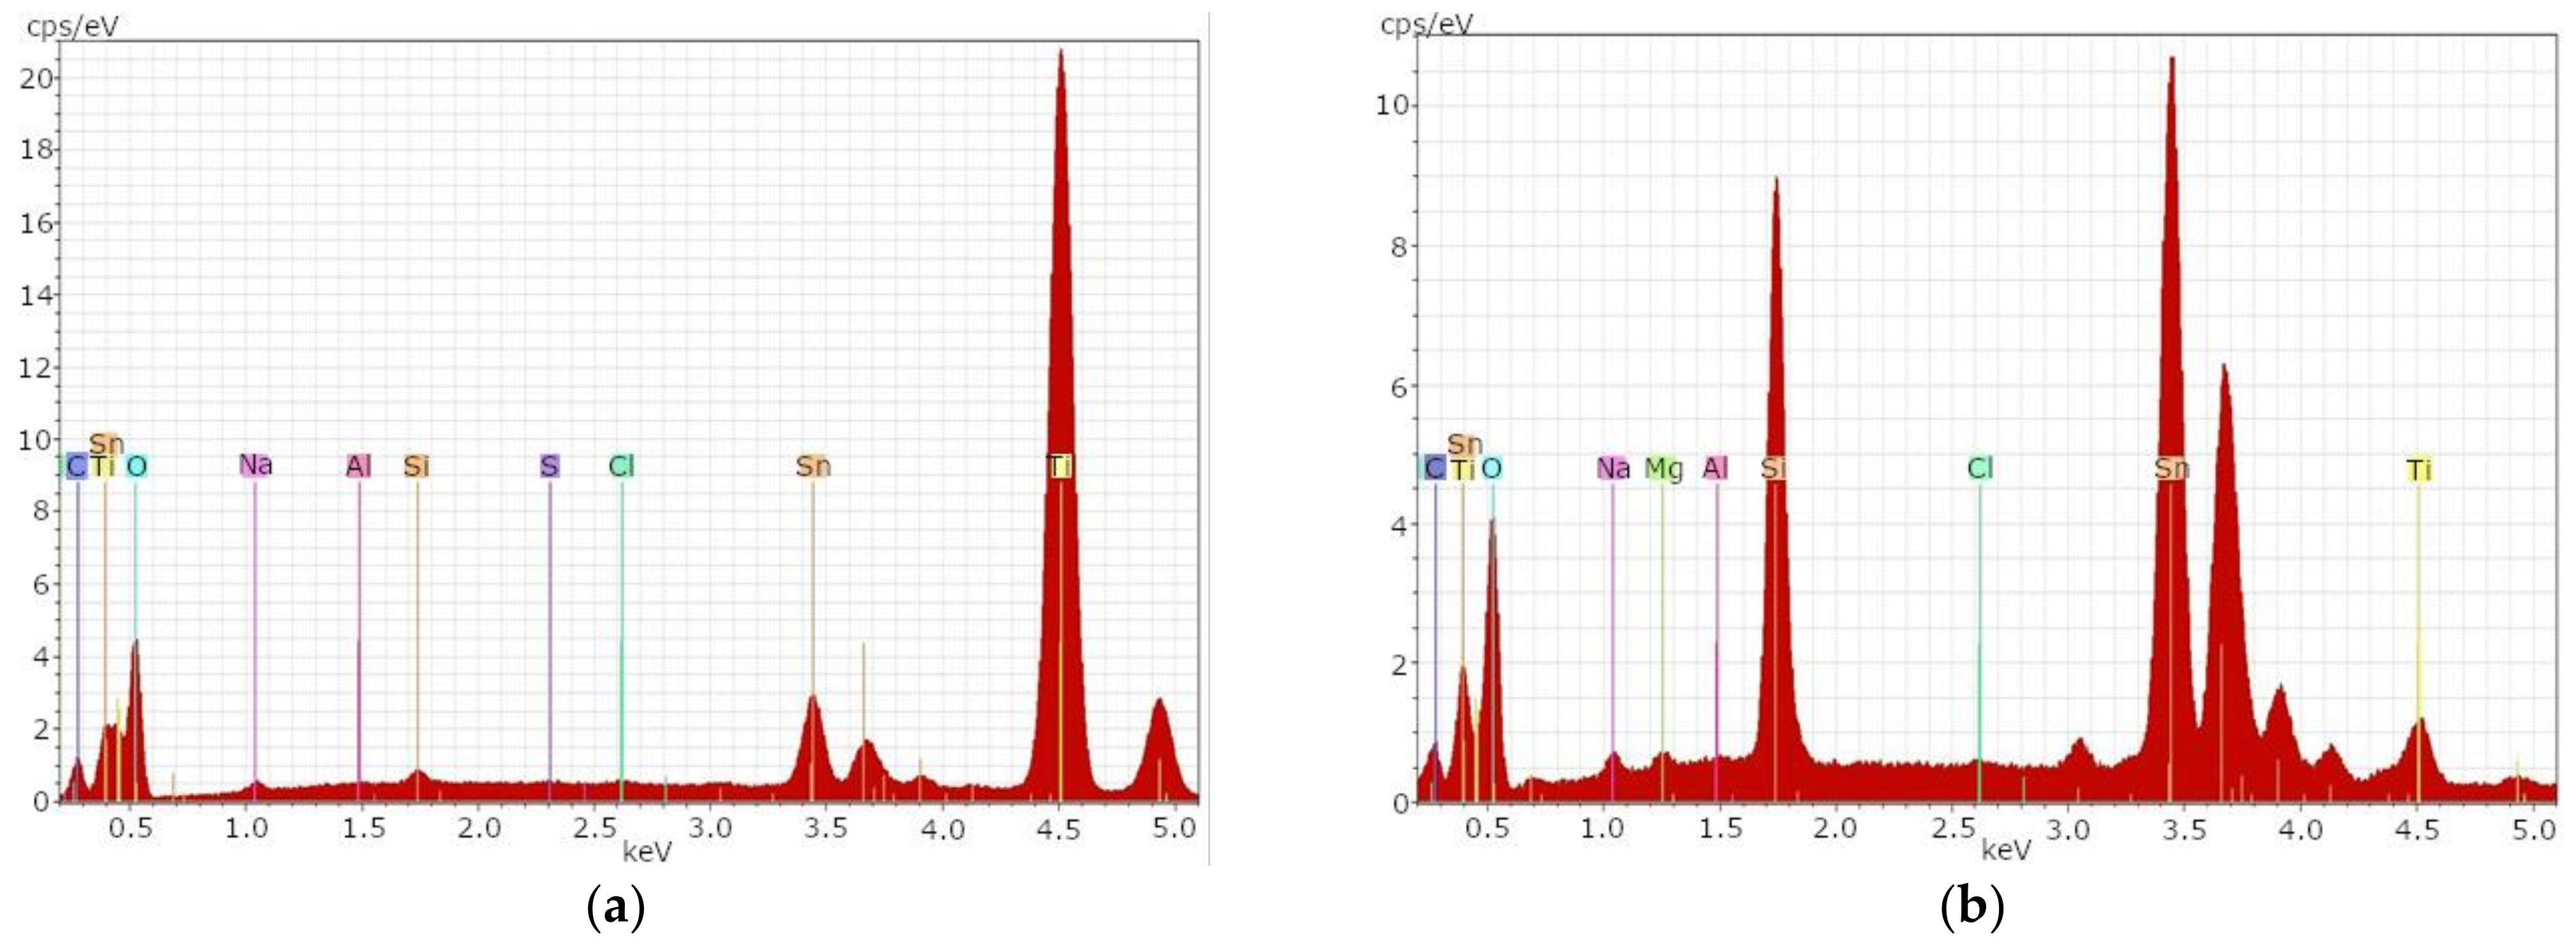
Figure 1a shows the EDX spectrum of sample t1A. While C, Sn, Ti, O, Na and Si, as well as Al, indicate the glass components in the deeper layers, Ti and Sn are the front layers indicating TiO
2 and FTO.
In
Figure 1 and
Figure 2, the
x-axis shows the energy of the X-rays emitted by the electrons jumping to a lower energy level. In this way, conclusions can be drawn about the elements of the sample. The
y-axis shows the number of photons per second and electron volt (cps/eV).
Very high concentrations of the element titanium and low concentrations of the element tin were detected on the surface of sample t1A. Typical glass components could only be detected in low concentrations.
Figure 1b shows the same sample after the etching process.
After the etching process, a significant decrease of the element titanium and a significant increase of the element tin could be determined. Elements typical for glass could be determined in significantly higher concentrations after the etching process. This indicates that the TiO2 layer on the glass surface can be removed with an etching process.
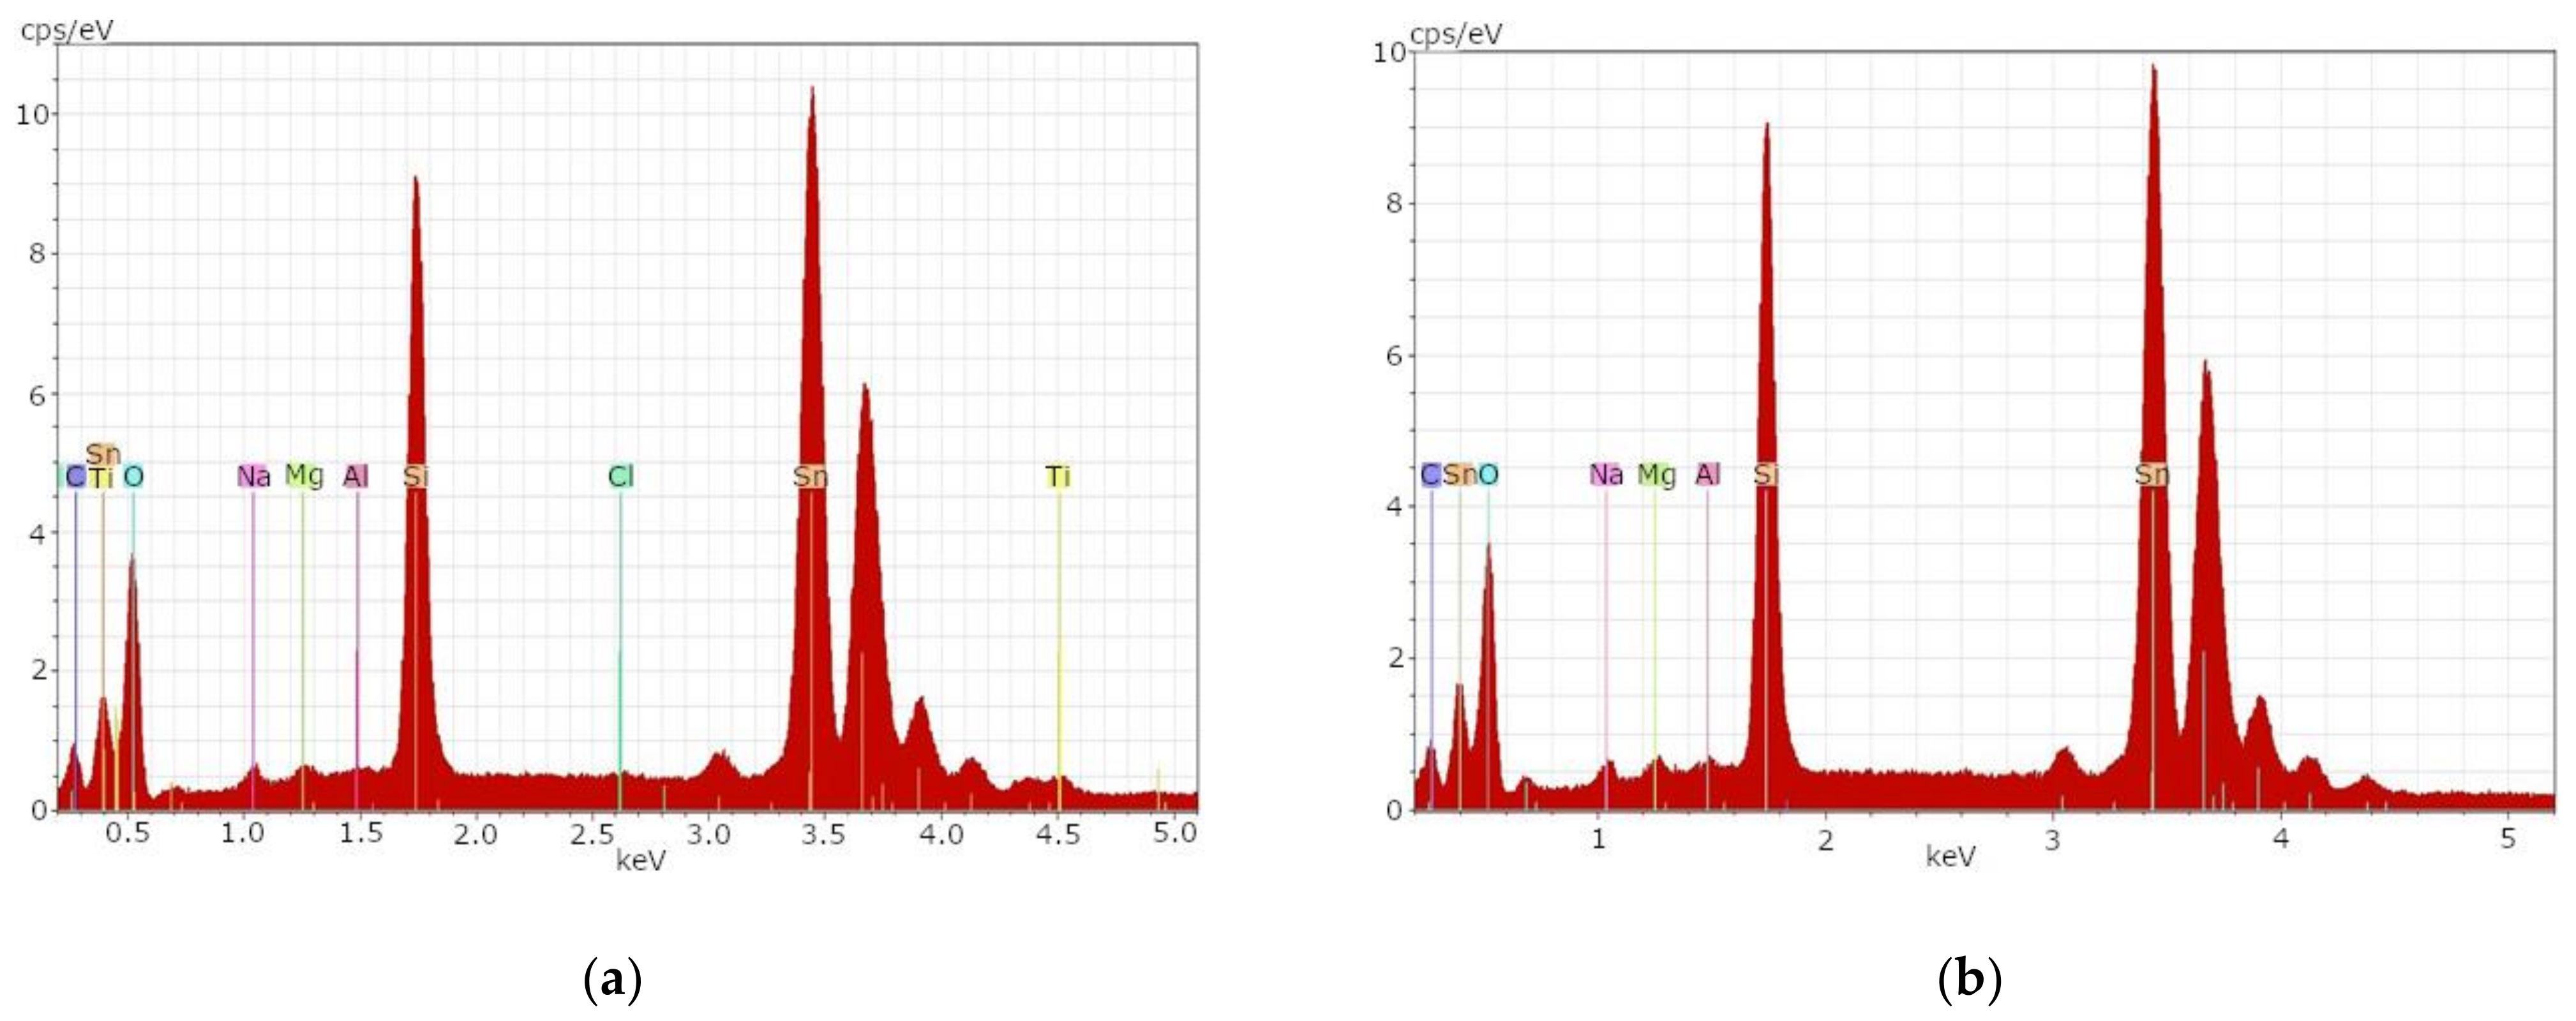
Figure 2a shows the EDX spectrum of sample t1B before the etching process. High concentrations of the element tin as well as elevated glass-typical elements could be determined. The glass-typical elements can be seen in the left part of
Figure 2a.
After the first 10 min etch with a mixture of hydrofluoric acid and sulfuric acid (1:1), sample t1B showed no differences from
Figure 2a. Therefore, a second etch with concentrated hydrofluoric acid was subsequently performed for one minute. The result can be seen in
Figure 2b. After both etching processes, an almost unchanged state of the glass surface with high concentrations of tin and elevated concentrations of glass-typical elements could be determined.
Table 5 provides an overview of the elements detected in the SEM-EDX analysis.
Even after the etching processes, Sn could still be measured for both samples. This indicates incomplete removal of the layers present on the glass surface. However, TiO
2 can be removed with acid. This suggests that valuable FTO-coated glass or TiO
2 could be recovered through a chemical recycling process. Rather than recycling the glass, the FTO-coated glasses could be used in a remanufacturing process for new DSSCs [
49]. The FTO layer is resilient and cannot be removed by the described etching process. If the FTO layer needs to be removed, e.g., for a possible recycling process, sulfuric acid or hydroiodic acid is required [
50,
51].
3.2. ICP-OES
In
Table 6. The results of the ICP-EOS are shown. In the right column, values of a patent glass especially for photovoltaic usage are shown for comparison. Significant differences are in the values of Al
2O
3. Sample t1A has significantly higher values than t1B. The patent glass recommends even higher values and shows typical refining agents such as sulfates, chloride, Sb
2O
3, As
2O
3 and SnO
2 [
52]. Aluminum oxide can increase the viscosity of the glass as well as its chemical resistance [
53]. CaO is also used in glass production to increase viscosity and improve chemical resistance [
54]. Therefore, it is possible that either AlO
3 or CaO is used in production due to price advantages of the materials.
To reach highest efficiencies in photovoltaic applications, the Fe
2O
3 part in the glass should be as small as possible because the light transmission through the glass is reduced by iron. Fe
2O
3 absorbs photons of the UV spectrum, which reduces the efficiency of the module [
52]. For c-Si PV, even small amounts of Fe
2O
3, such as 1% in the front glass, reduce the efficiency by about 9.8% [
55]. The glass thickness also influences the transmission rate (thin glasses usually have higher transmission values) [
56].
However, maximizing transmission and thus efficiency shortens the lifetime of the entire c-Si PV system for conventional photovoltaic applications, which are usually laminated with ethylene-vinyl acetate (EVA) foil. The UV light is responsible for degradation of the foil and semiconductor material, which leads to efficiency losses or failure of the module [
57]. Therefore it is necessary to balance photovoltaic efficiency and degradation by incorporating the right amount of Fe
2O
3 into the cover glass [
56]. This is also important for DSSCs due to aging processes inflicted by thermal stress and UV light [
58]. For a gel electrolyte DSSCs, thermal stress is less relevant because it exhibits higher thermal- and photostability, compared to liquid electrolyte DSSCs [
59]. An optimal cover glass for DSSCs must be matched to the dye used and the specific absorption spectrum.
In the case of anthocyanin, the absorption spectrum has maxima at 465–560 nm and 265–275 nm [
60]. Light with a wavelength of more than 560 nm would only heat up the DSSCs’ thermal stress. Light in the ultraviolet range would lead to faster degradation of the DSSC. Therefore, it is a balancing act between more efficiency and higher life expectancy of the DSSCs. A cover glass that reflects or filters unnecessary wavelengths could improve longevity without reducing the DSSCs’ efficiency. However, the absorption spectrum of anthocyanins can be modified by adjusting the pH of the dye [
61]. The efficiency increases at lower pH values. Junger et al. lowered the pH value from 2.3 to 1.1 and observed that the efficiency could be doubled in this way [
62]. In addition, copigmentation with caffeine can improve the efficiency of anthocyanin-based DSSCs and the original pH (2.3) can be maintained as the range of maximum efficiency is shifted from lower (1.1) to higher (2.3) pH values [
63]. Furthermore, a bathochromic shift of the anthocyanin spectrum can be observed when the dye is applied to TiO
2. The absorption maximum of the spectrum then shifts to higher wavelengths and lower light intensities [
8]. This indicates that the appropriate adjustment of cover glass and dye absorption spectrum has several configuration options. In addition, different dyes are combined to improve the absorption spectra and thus the energy conversion efficiency. For example, Bashar et al. combined dyes from beetroot (80%) and spinach (20%) and significantly improved the energy conversion efficiency from 0.56% (beetroot) and 0.49% (spinach) to 0.99% (combination of dyes) [
64]. This shows that, in addition to matching the cover glass to the absorption spectra, co-sensitized DSSCs can be built from a variety of dyes to improve their power-conversion efficiency.
3.5. Industrial Scale-Up and Volume Estimation
The DSSC market is growing [
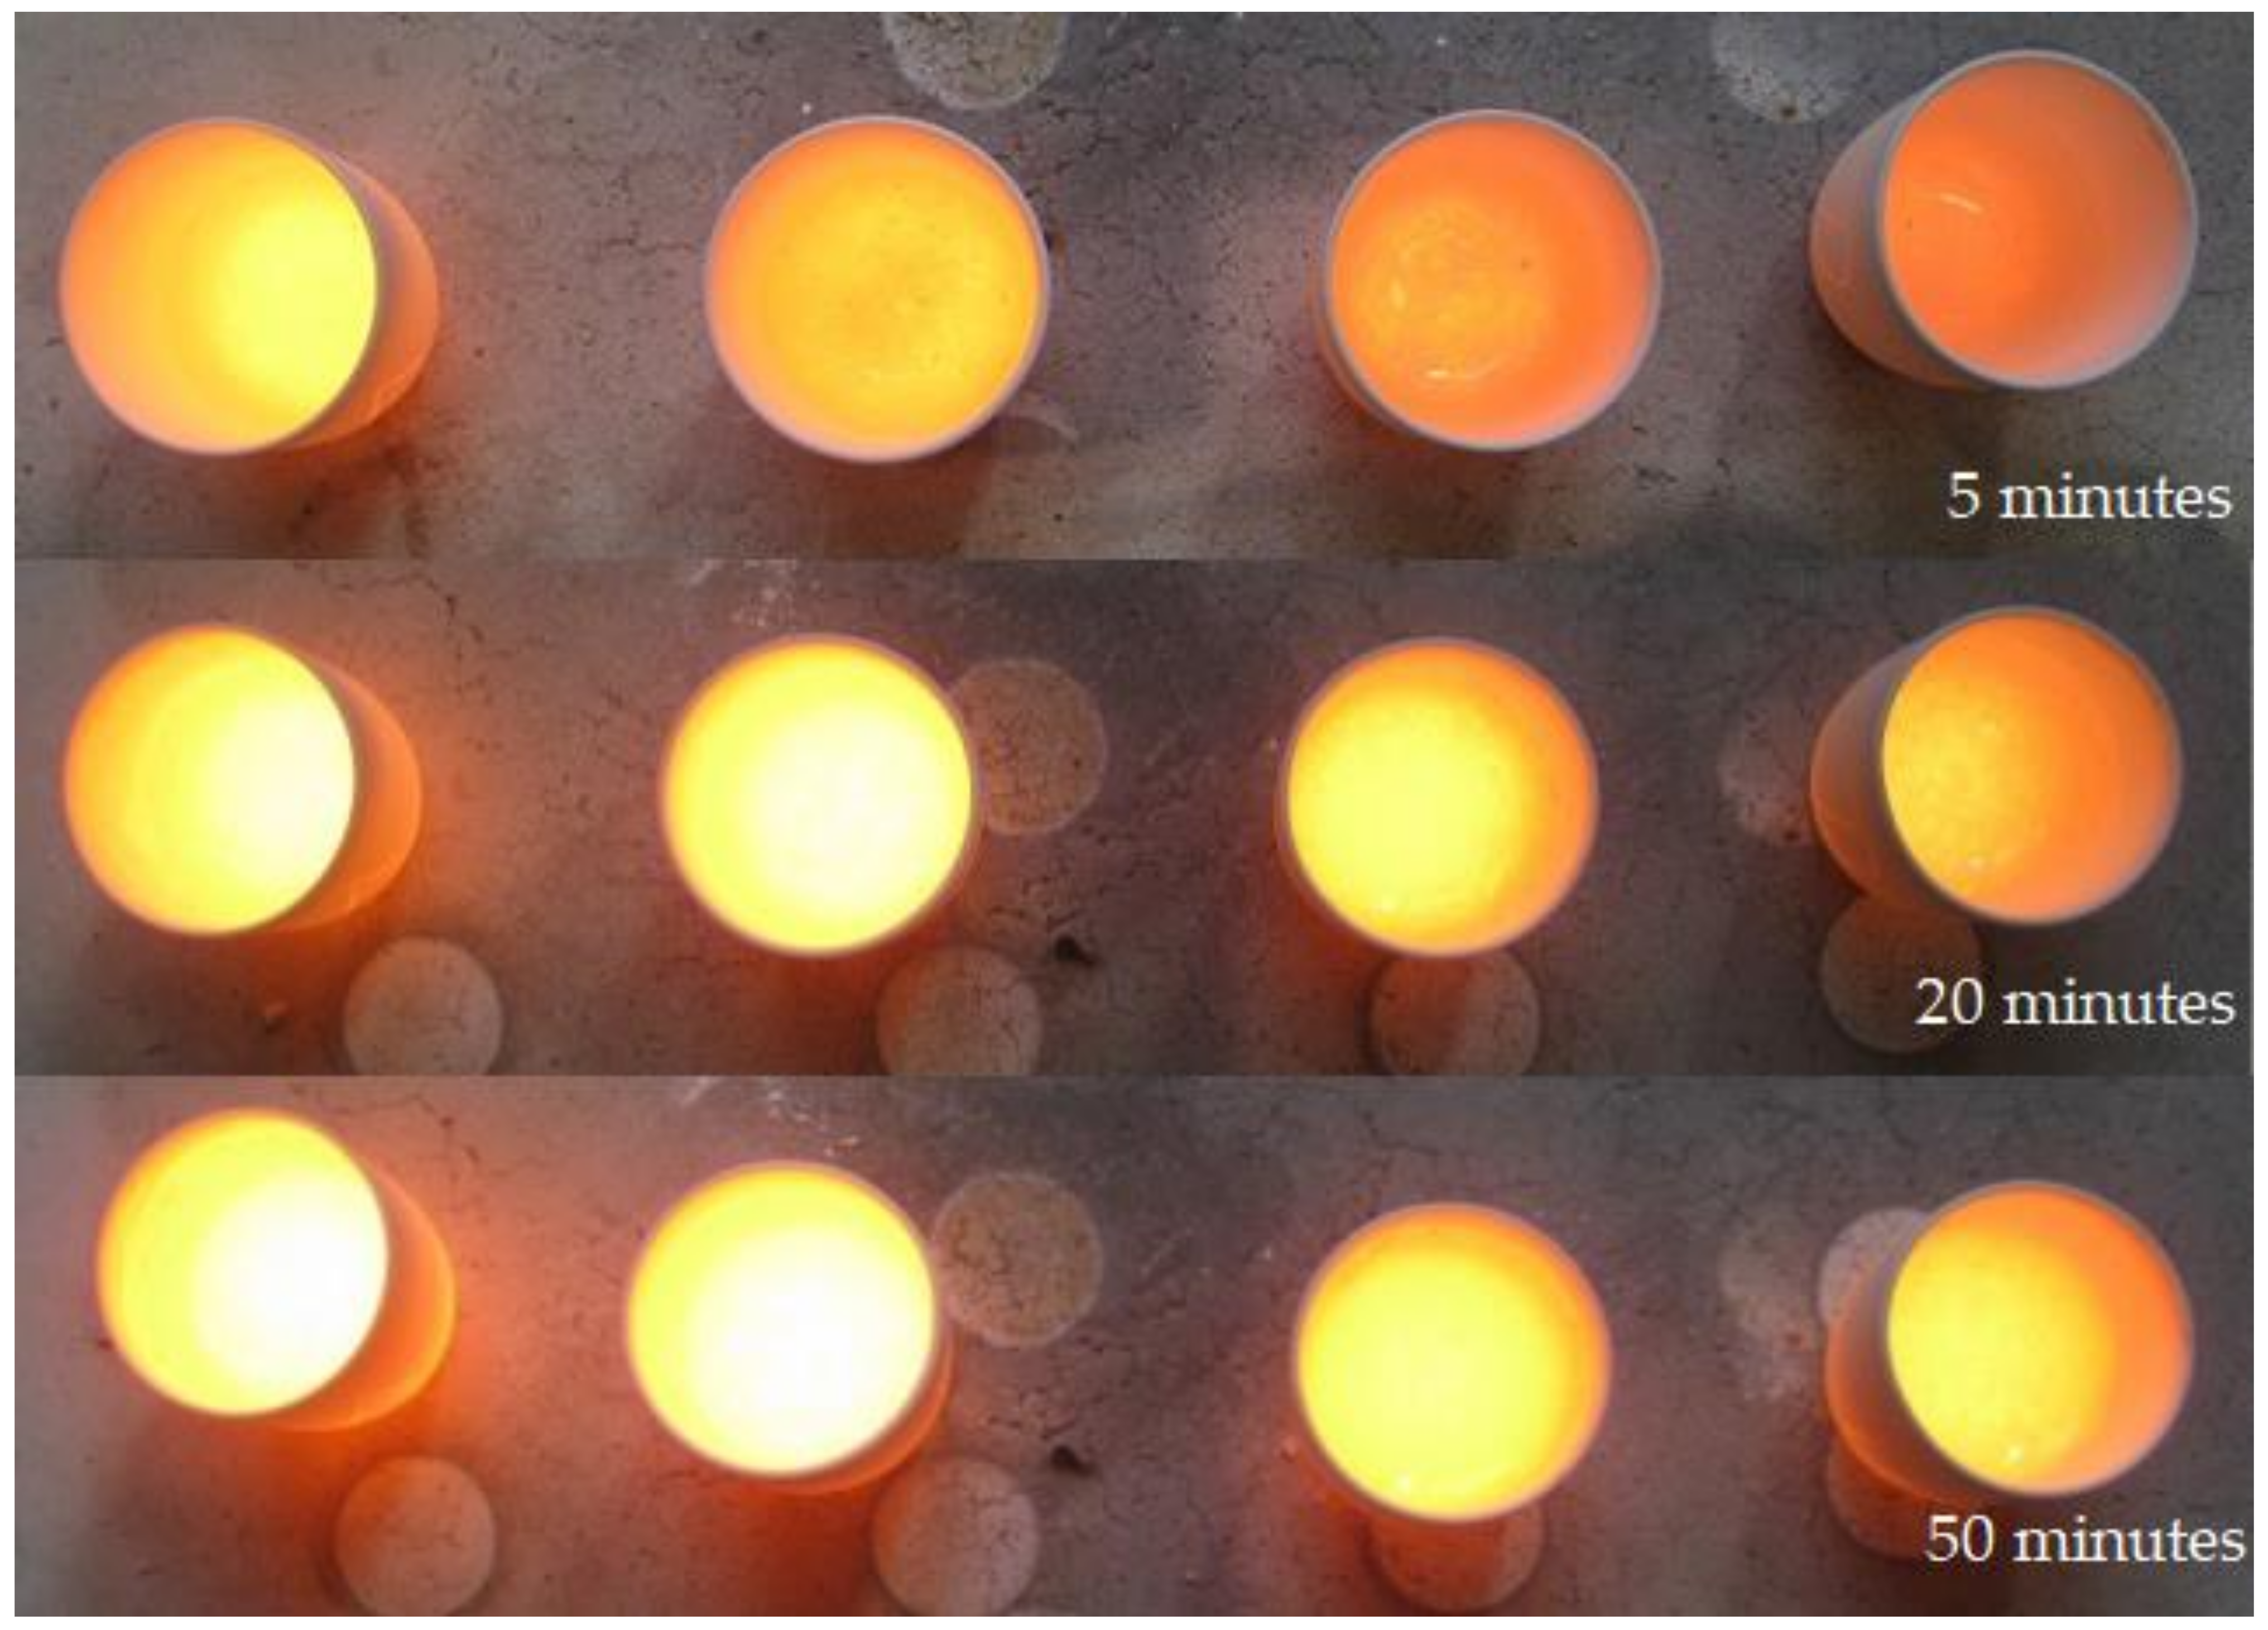
7]. For this reason, an increasing amount of DSSC materials will require proper recycling processes in the future. The previous melting experiment shows that at least non-toxic glass-based DSSCs have high potential for glass recycling. To better understand the amount and composition of material that could enter recycling facilities, it is estimated what a ton of DSSC material consists of. For recycling plants, it is necessary to know the composition of the batch in order to properly adjust the recycling processes.
Table 7 shows an estimate of how much material of what type could accrue in recycling facilities in the future due to DSSC waste. The first column shows the material for our non-toxic DSSCs. Column two shows an estimate from Parisi et al., who did a life cycle assessment for DSSCs [
41]. The glass thickness and the side lengths were determined with a caliper gauge. The diameter of the glass plates is 7 cm
2, and the thickness is 0.1 cm. The TiO
2 layer is about 6–10 μm thick and is applied to about 6 cm
2. The FTO layer is very thin and invisible; in this case, we estimated that the layer is about 10 nm thick and is applied to the entire surface of the glass, i.e., 7 cm
2 each for the front and counter electrode. Two drops of the commercial liquid electrolyte are used for a typical DSSC without PEO. Each drop has a volume of about 20–25 μL. Although the electrolyte evaporates over time and not much of it would remain in a final recycling process, we listed it because residual chemicals could still interfere with the recycling process. We have estimated a thickness of 2 µm for the graphite layer. During the dyeing process, a monomolecular dye layer adheres to the TiO
2 layer. After the useful life of a DSSC, the organic dye is decomposed by light or completely degraded in a final composting process before recycling. No gel electrolyte or sealing was considered for the basic DSSCs.
The following material densities were used for the calculation of the material mass:
FTO/SnO
2 6.99 g/cm
3 [
68] for thin films; the density of FTO is close to the density of SnO2 [
69],
Electrolyte: iodine/potassium iodide 1.12 g/cm
3 [
70],
Graphite 2.26 g/cm
3 [
71].
The volumes were multiplied by the densities and scaled up to one ton of material. The results can be seen in
Table 7.
Both estimates are similar to each other. According to our estimate, the electrolyte volume is more than twice as large. More efficient production processes could probably reduce this amount. In the estimate of Parisi et al. a toxic ruthenium dye is used. This material hinders the recycling process and would poison the material cycle. Therefore, such modules require an additional recycling step in which the toxic dye is separated from the glass material [
42]. DSSCs with organic dyes, on the other hand, could be used directly in glass recycling after a natural weathering process.
TiO
2 is commonly used for the construction of DSSCs and represents the best compromise between sustainability and high efficiency [
72]. This material is quite safe and abundant [
73,
74]. In France, however, TiO
2 has been banned from foods because studies suggest that TiO
2 nanoparticles may cause health problems in rats [
75]. Due to its white color, TiO
2 is often used in food as food additive E 171. TiO
2 is already used in a variety of applications, especially in the construction sector [
76]. TiO
2 is, moreover, already a component of glass and could be used in glass recycling. However, recovery in a separation process before recycling could be advantageous, e.g., reusing it directly for the production of new DSSCs.
No platinum, silver or thermoplastic is used in our basic DSSCs. In the future, however, foils or films to prevent glass breakage or metal elements to improve conductivity may be required. However, there are also metal-free solutions, such as carbon nanotubes, to improve conductivity [
15]. Thermoplastics can be used as sealants to prevent electrolyte leakage, solvent evaporation and electrolyte corrosion [
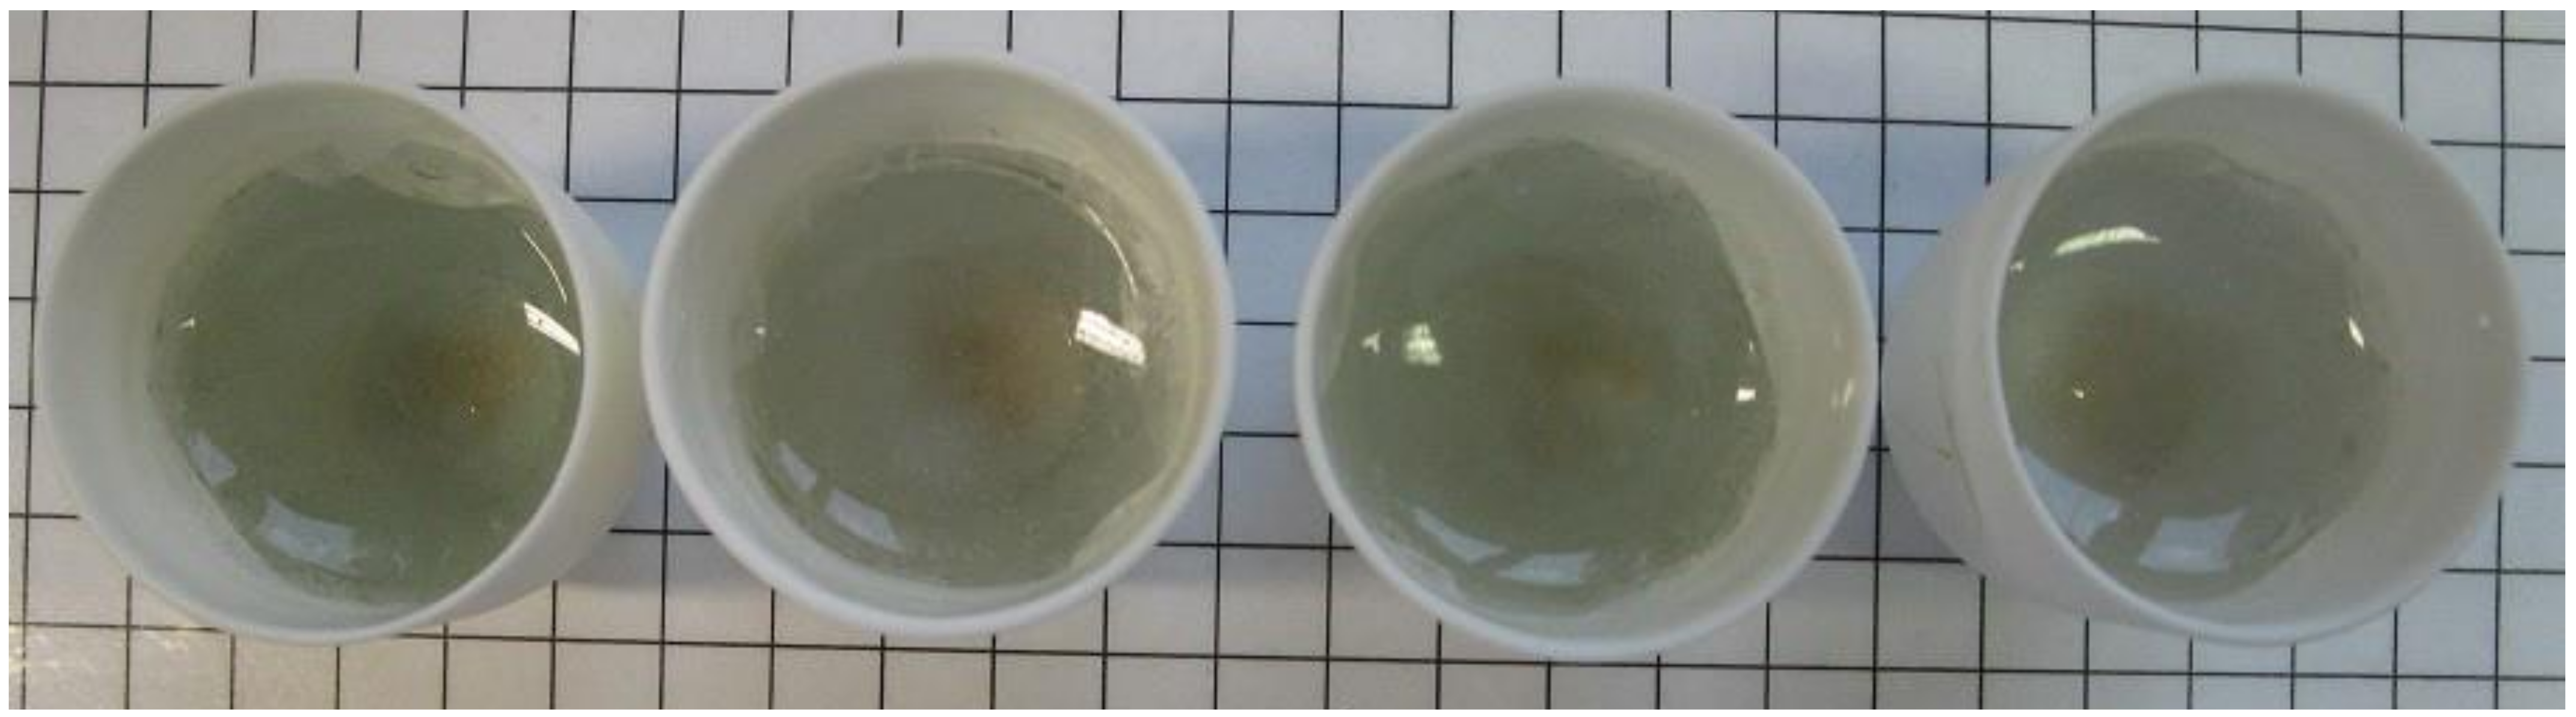
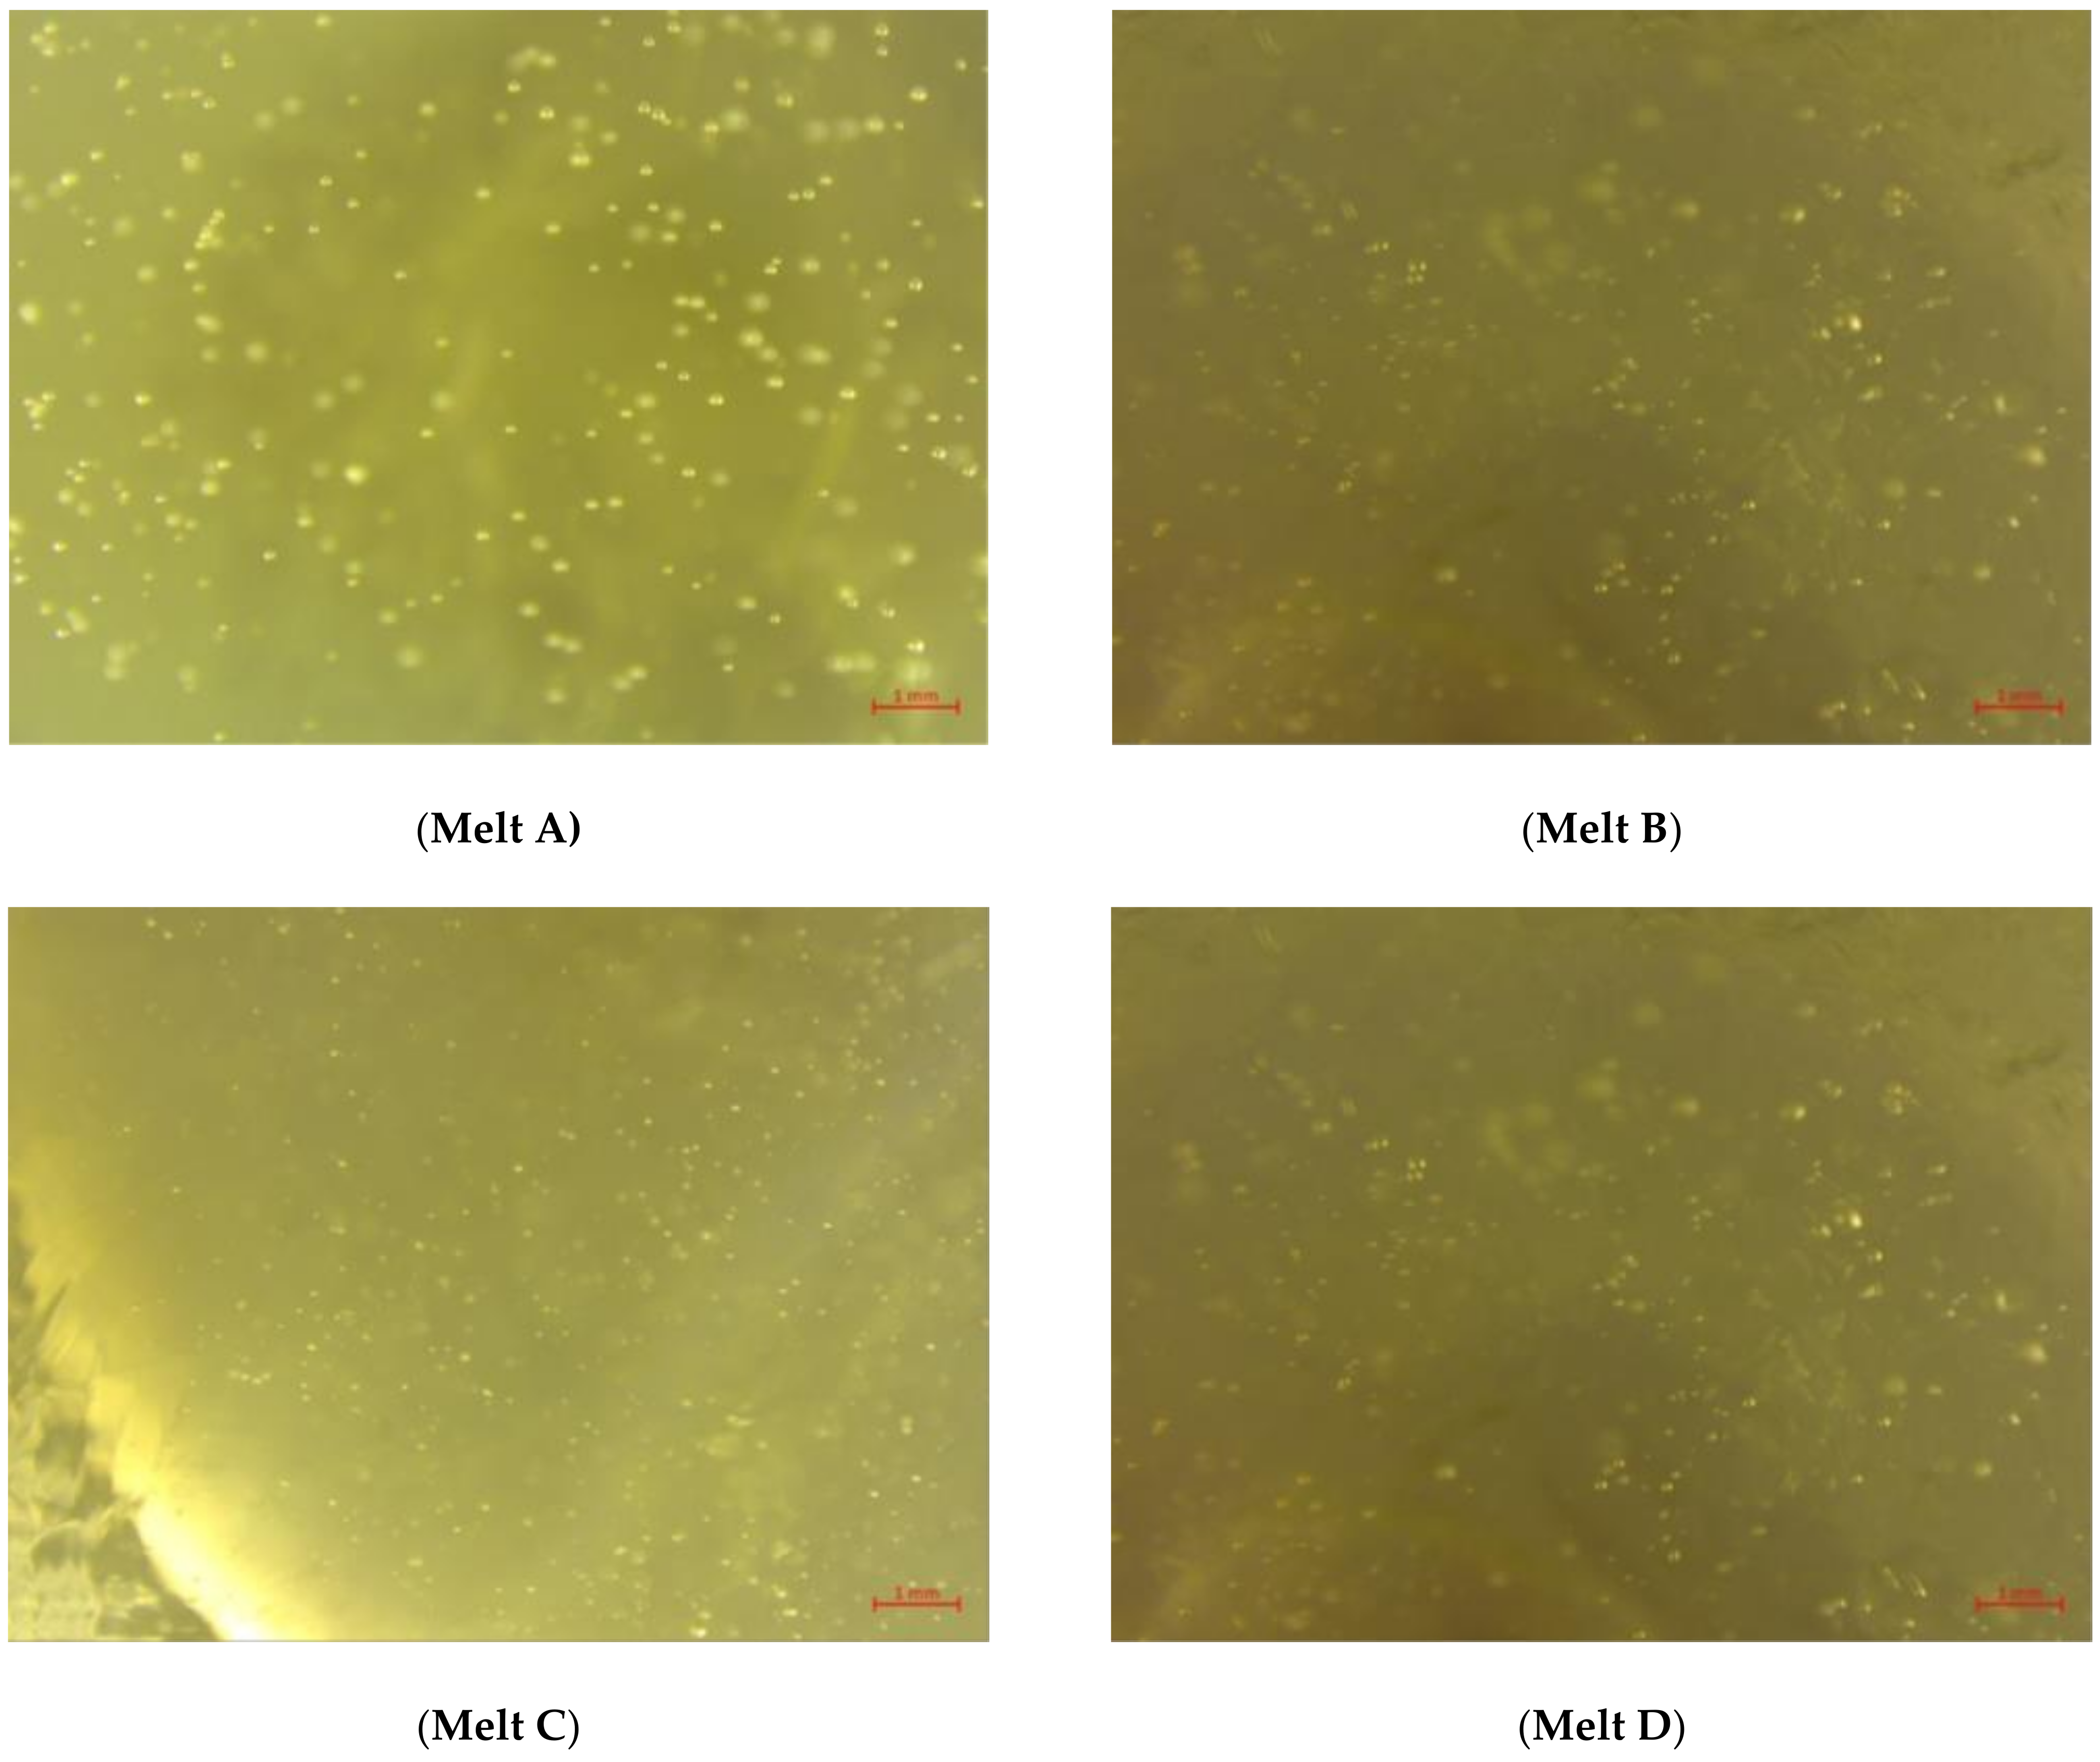
77]. As applied with the thermoplastic PEO to the DSSCs in this manuscript, melt C and D.
Since more and more photovoltaic modules already have to be recycled, there is experience of what problems arise in the process. This knowledge can be used to develop more sustainable DSSCs. DSSCs have some components, such as the glass or a protective film, that are also found in current c-Si PV modules [
44].
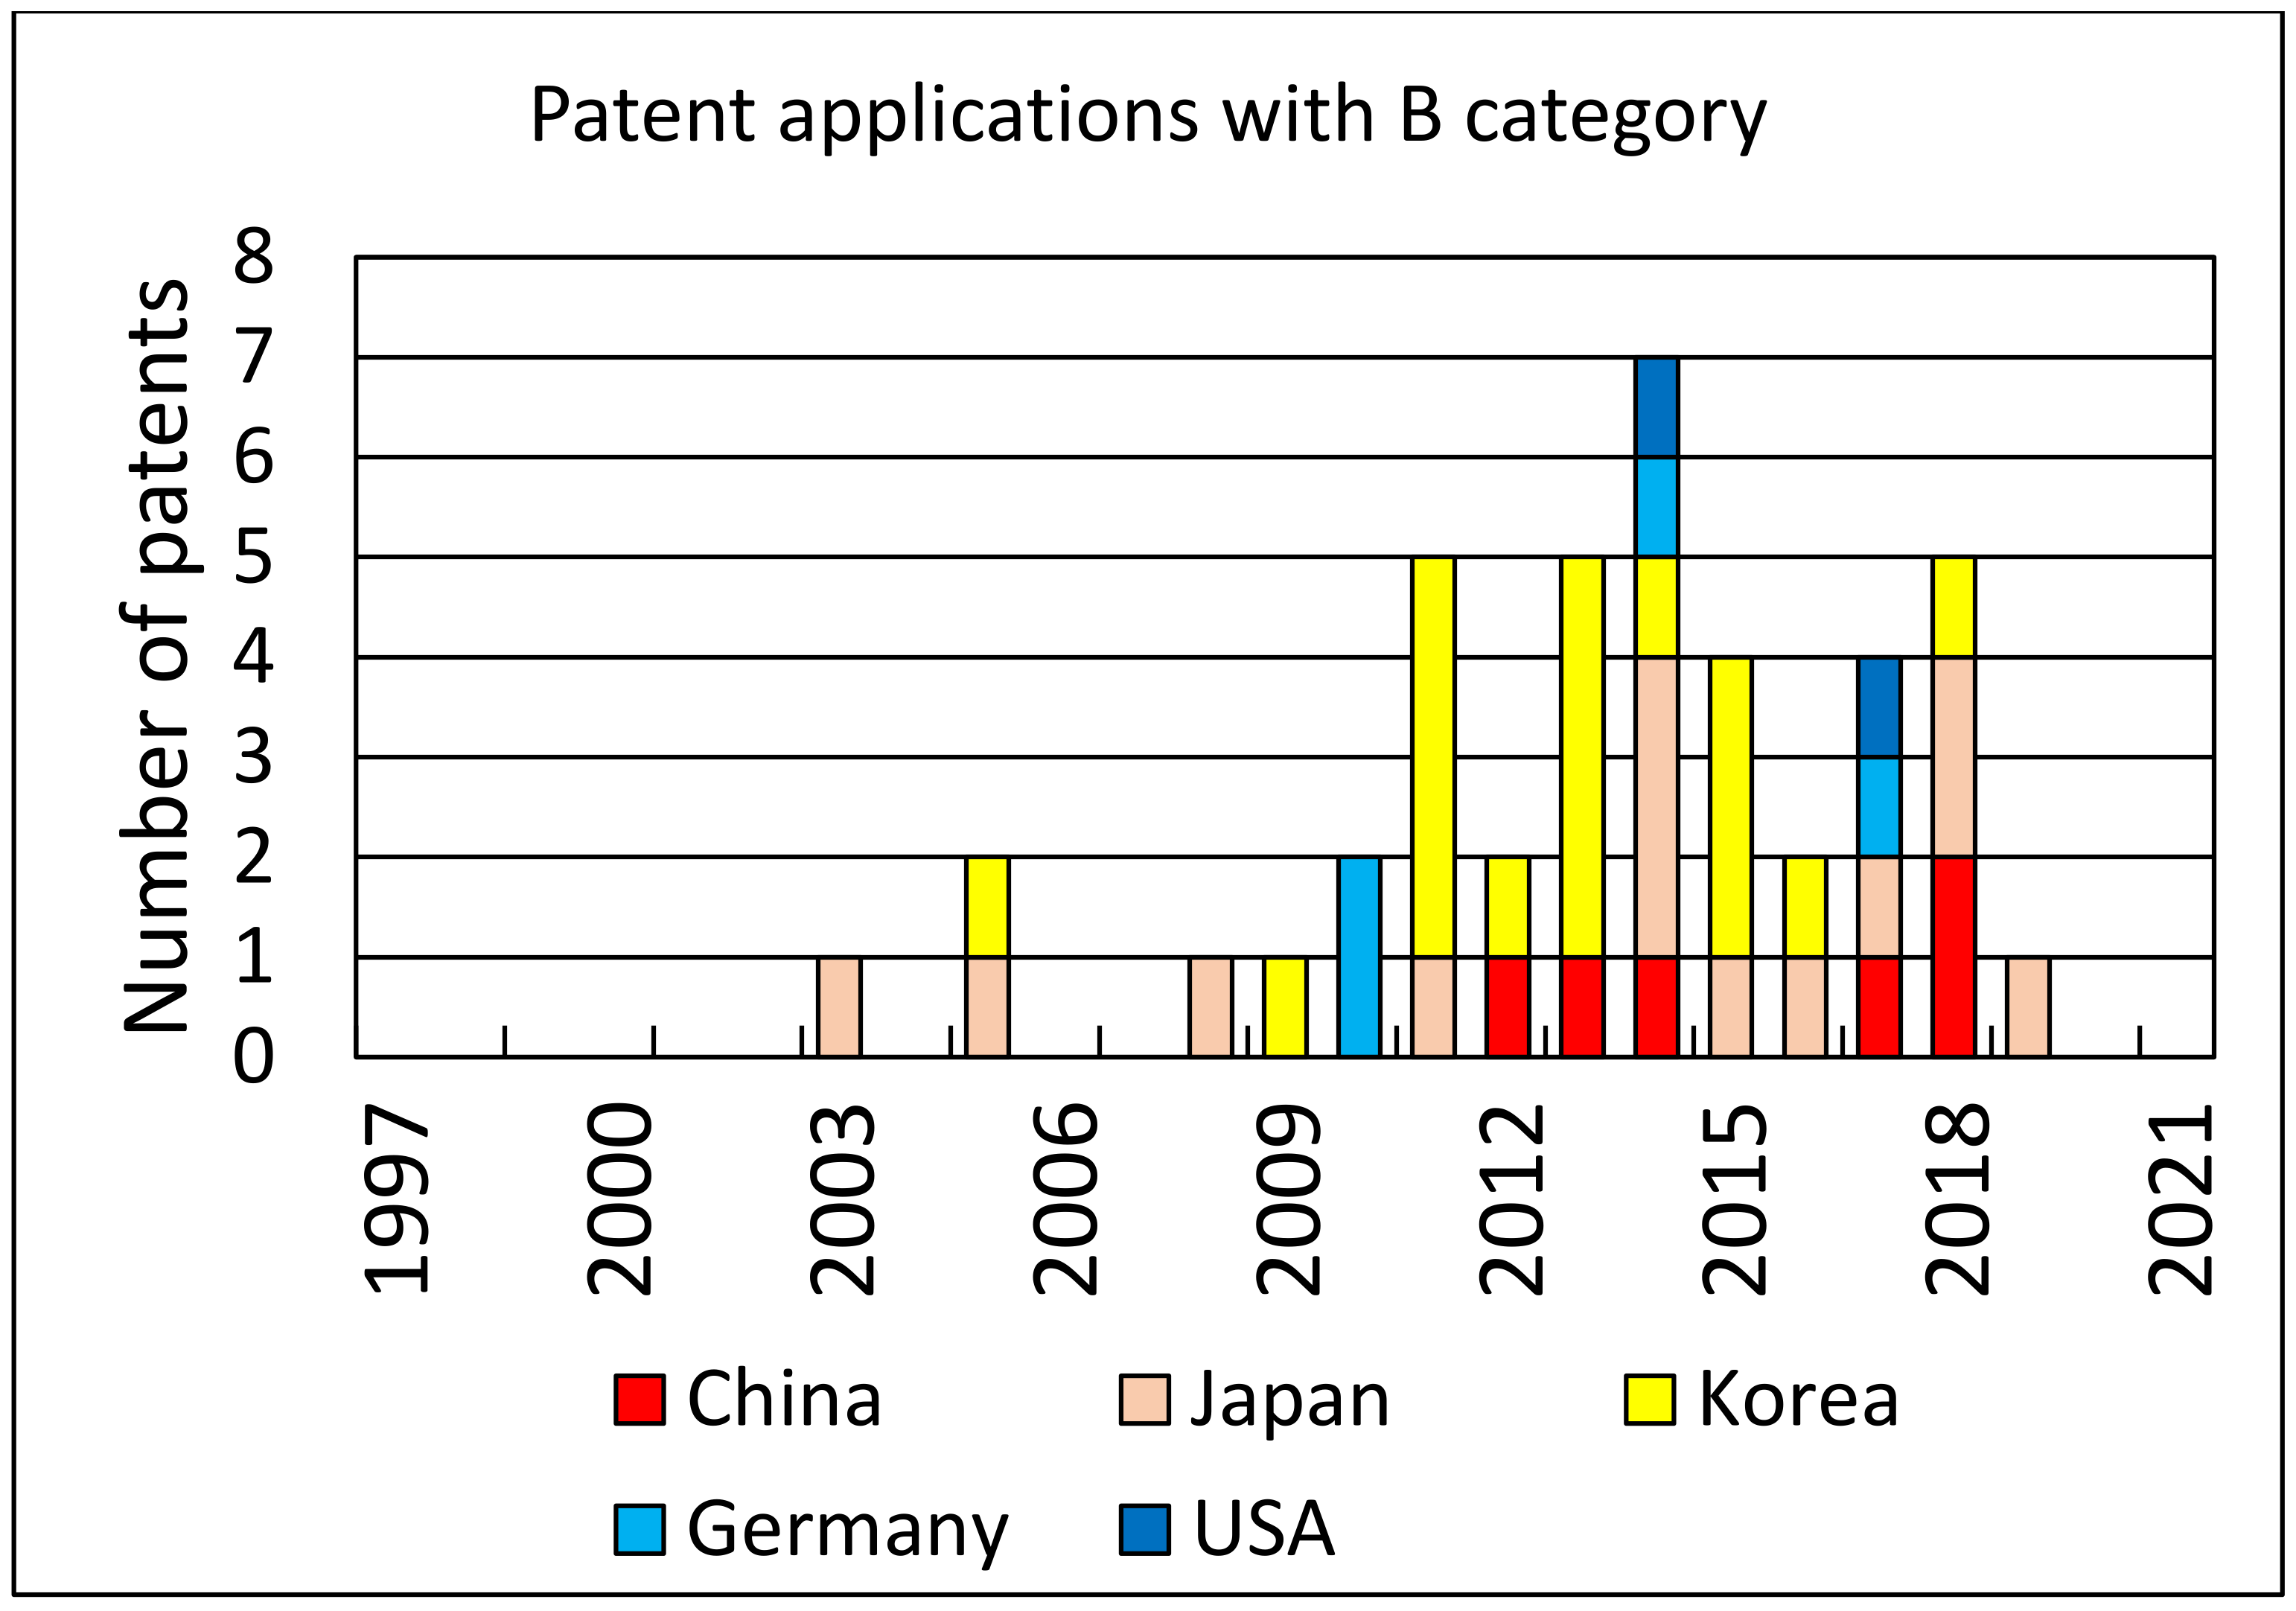
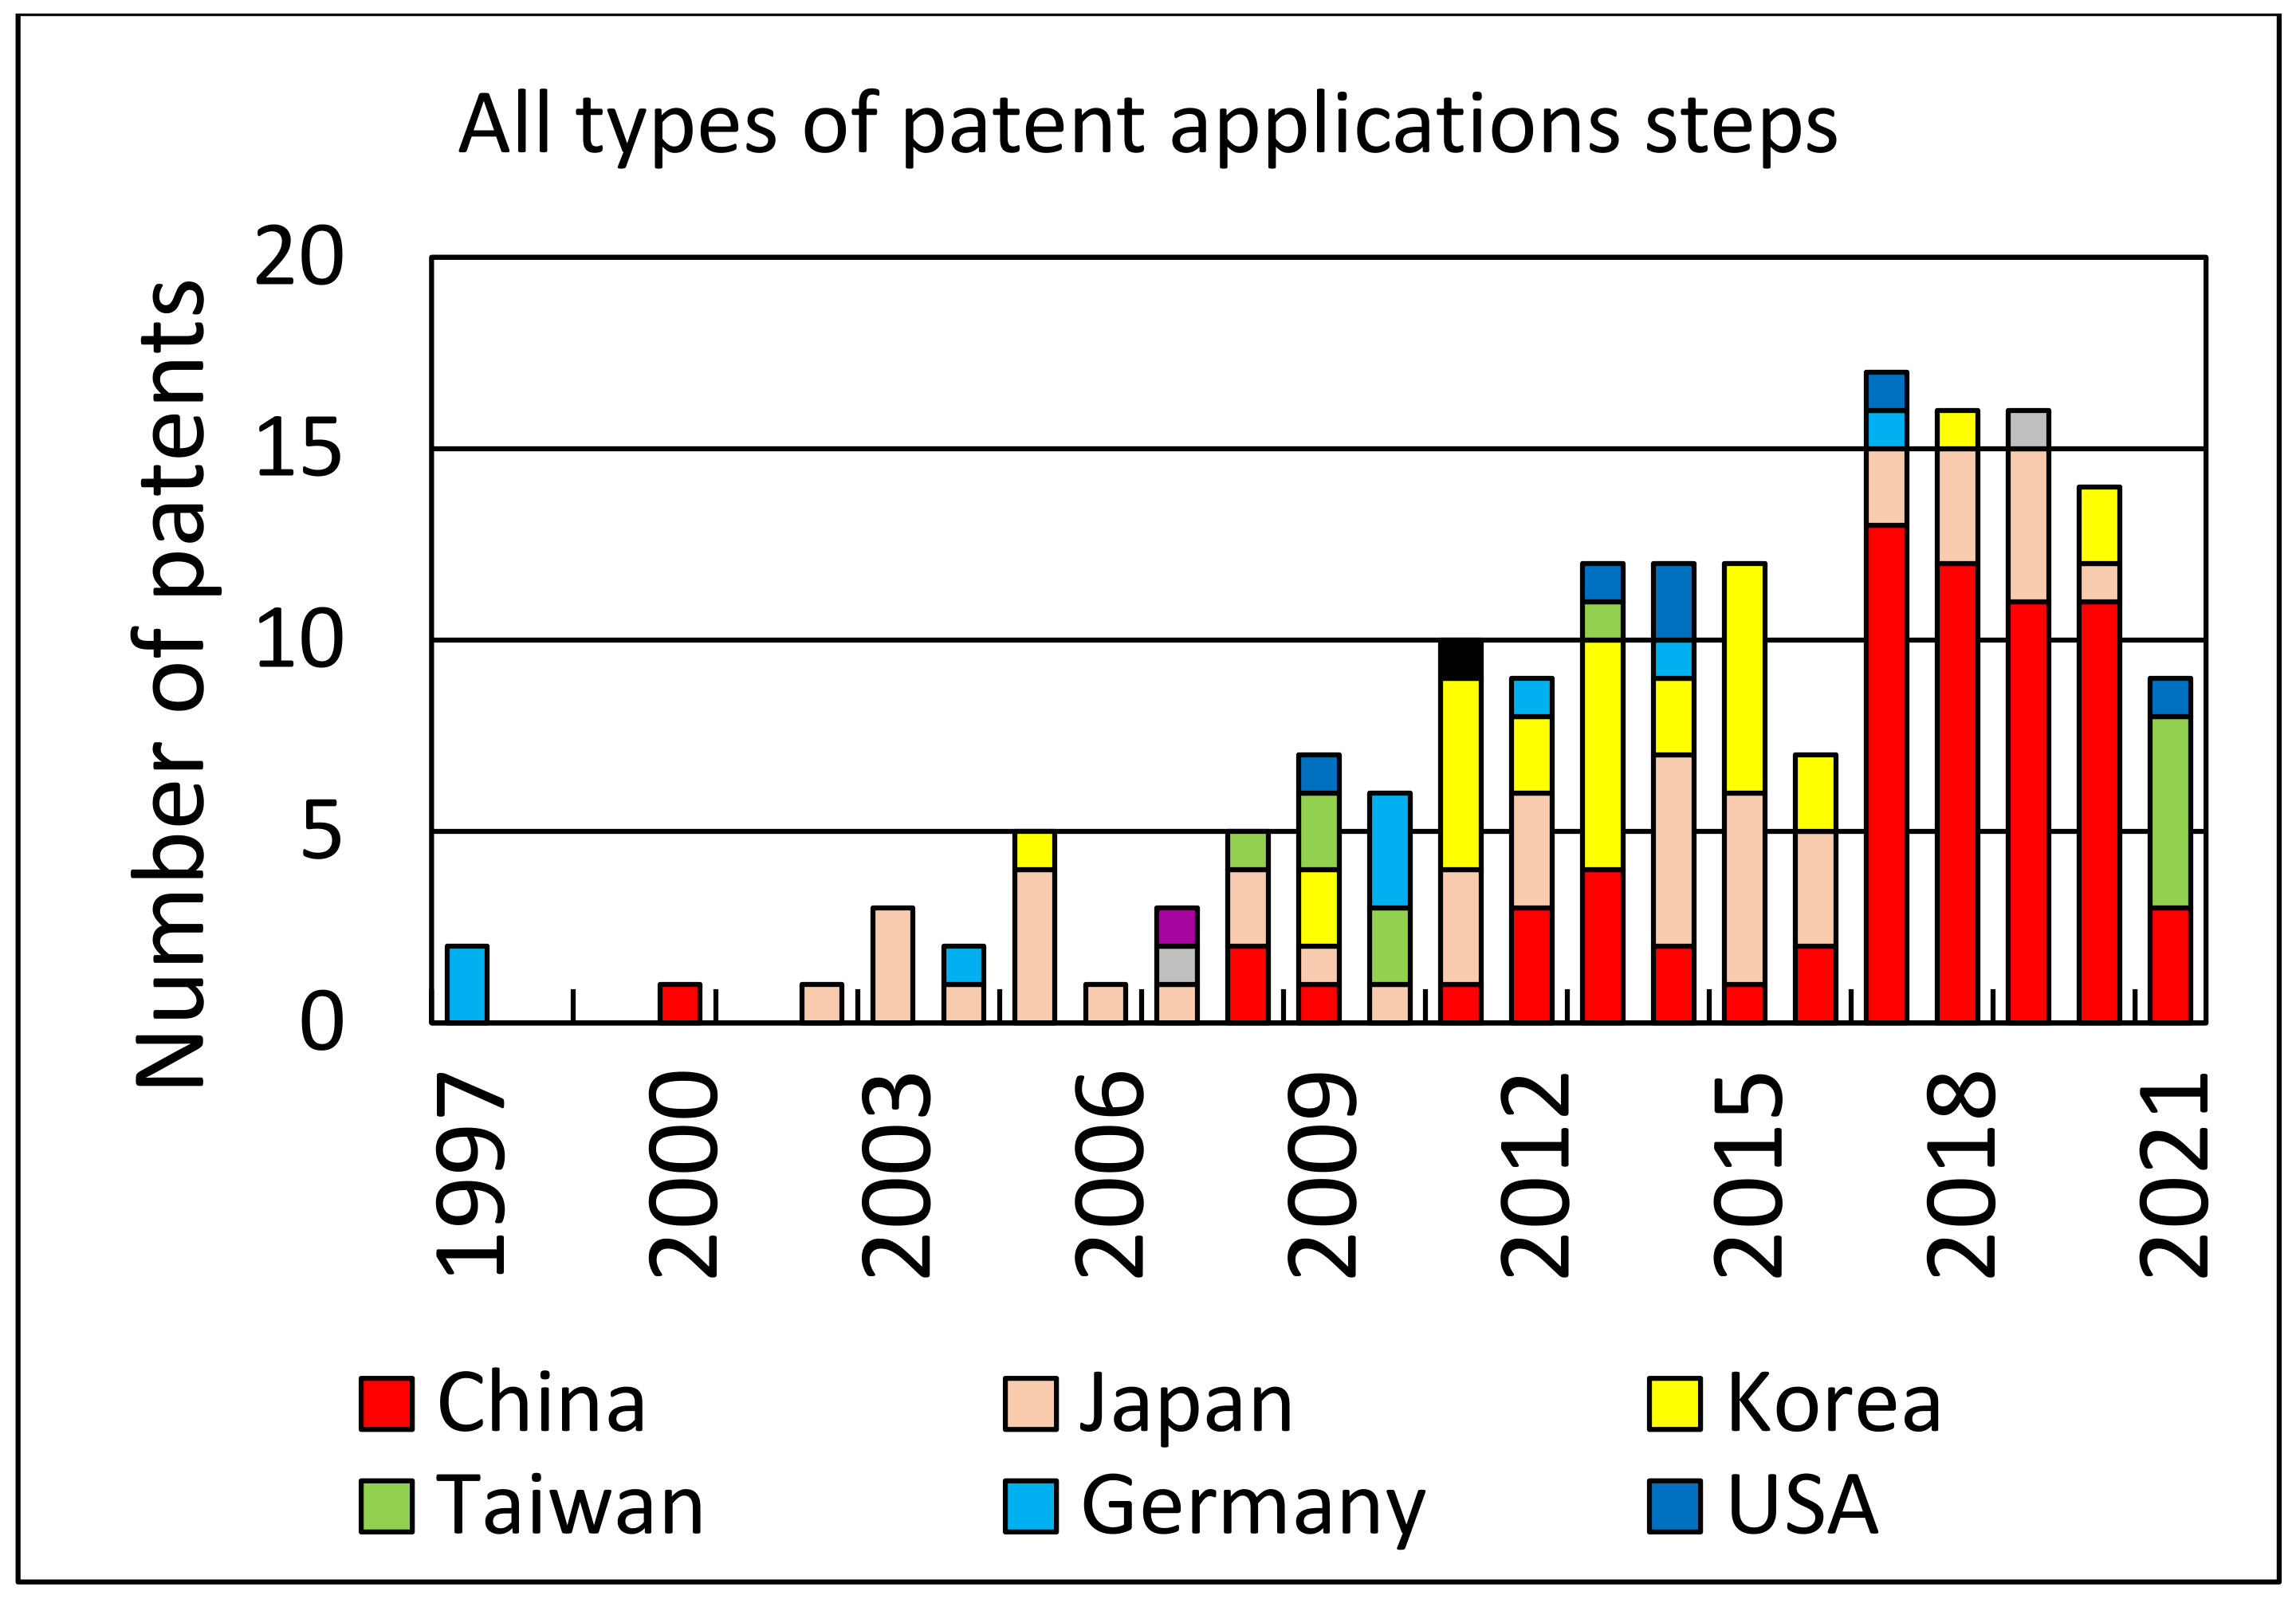
An analysis of patent applications and the number of patents granted over the years can provide some measure of the interest in the topic of photovoltaic cell recycling. Using Web of Science resources and the Derwent Innovations Index database, where we searched patent titles with the keywords “solar cell recycling”, we found 170 patents with all categories of patent approval levels. For approved patents (at least category B), we found 25 cases. Both search results are shown in the form of diagrams in
Figure 6 and
Figure 7, respectively.
The predominant technological recycling methods found in the descriptions of the patents are as follows: removal of electrodes from solar cells, separation of anti-reflective layers, recycling of electronic chips, reuse of electrically conductive glass substrates, recovery of atomic elements including silver and indium, removal of aluminum layers, melting of tempered glass material, and recycling of crystalline silicon, among others.
Overall, it has not yet been possible to recover high-quality materials from the c-SI PV module using a conventional glass recycling process [
78]. Due to the shredding of the modules, the materials are mixed and are difficult to separate by type.
In c-Si PV, EVA foil complicates the recycling process. One solution could be the use of polyvinyl butyral (PVB) foil, which is also used in safety glass and for which mechanical and chemical recycling processes exist [
79,
80]. There is also a patent that describes a method of separating the laminated film from the glass [
81]. This patent is not for c-Si PV but for laminated safety glass. However, it could also be a model for recycling c-Si PV modules using a similar process. An example of a photovoltaic application with PVB film is Trosifol Solar [
82]. They already use PVB film in their photovoltaic modules. For recycling reasons, we recommend the use of PVB in future DSSC applications, if a film has to be used at all.
The metal elements platinum and silver hinder the glass recycling process. So far, the high-grade, low-iron glass from c-Si PV modules can only be used in a downcycling process because during the recycling process the cullet is contaminated with iron parts [
78].
In addition, there is the contamination by film residues and the silicon wafers. The EOL-Cycle research project shows that an optimized recycling concept with more complex and numerous cleaning and sorting steps enables the recovery of high-quality materials. However, it was not yet possible to achieve a sufficient degree of purity for the production of flat glass [
83]. Furthermore, there is the additional technical effort, which has a negative impact on the economic efficiency of the process. Other problems with c-SI PV recycling are the fluctuating composition of the PV modules and the use of materials that are not pure, such as the use of different polymers [
83].
A company from Japan is successfully using an automated system in which the glass is separated from other components with a highly heated knife [
84]. With such advanced recycling processes, a downcycling process, at least for the glass, can be avoided.
By learning from the difficulties of recycling conventional PV technologies, DSSCs can be made more suitable for future recycling. At least 70% of the environmental impact of a product is determined in the design phase of the product. Therefore, it is reasonable to invest effort into reducing the environmental impact of a product already in the design phase [
85]. By using recycled material or closing material loops for DSSCs, the energy requirement for production can be reduced. The production of TCO glass in particular is energy-intensive, and it would be beneficial to reuse the glass for constructing new DSSCs [
86]. Considering the global climate crisis and resource scarcity, sustainability should be given the same importance as efficiency and stability in DSSC research [
13,
44]. In the development of DSSC for the mass market, recycling must already be taken into account in the design phase.


 ,
, 


