Article

The Influence of the Thickness of Compact TiO2 Electron Transport Layer on the Performance of Planar CH3NH3PbI3 Perovskite Solar Cells

by
Andrzej Sławek
1,2,
Zbigniew Starowicz
1 and
Marek Lipiński
1,*
1
Institute of Metallurgy and Materials Science, Polish Academy of Sciences, ul. Reymonta 25, 30-059 Kraków, Poland
2
Academic Centre for Materials and Nanotechnology, AGH University of Science and Technology, al. Mickiewicza 30, 30-059 Kraków, Poland
*
Author to whom correspondence should be addressed.
Materials 2021, 14(12), 3295; https://doi.org/10.3390/ma14123295
Submission received: 21 May 2021 / Revised: 6 June 2021 / Accepted: 9 June 2021 / Published: 14 June 2021
(This article belongs to the Special Issue Emerging Photovoltaic Materials and Solar Cells)

Abstract

:
In recent years, lead halide perovskites have attracted considerable attention from the scientific community due to their exceptional properties and fast-growing enhancement for solar energy harvesting efficiency. One of the fundamental aspects of the architecture of perovskite-based solar cells (PSCs) is the electron transport layer (ETL), which also acts as a barrier for holes. In this work, the influence of compact TiO2 ETL on the performance of planar heterojunction solar cells based on CH3NH3PbI3 perovskite was investigated. ETLs were deposited on fluorine-doped tin oxide (FTO) substrates from a titanium diisopropoxide bis(acetylacetonate) precursor solution using the spin-coating method with changing precursor concentration and centrifugation speed. It was found that the thickness and continuity of ETLs, investigated between 0 and 124 nm, strongly affect the photovoltaic performance of PSCs, in particular short-circuit current density (JSC). Optical and topographic properties of the compact TiO2 layers were investigated as well.

1. Introduction

One of the most reasonable responses for growing global electricity demands, respecting the need to protect the natural environment, is harnessing solar energy by means of photovoltaic devices. Besides the commonly used mature wafer-based silicon technology, the new branch of perovskite-based solar cells is very promising due to the high performance and potentially low costs of production. Since the first report in 2009 by Miyasaka’s group [1], the efficiency has advanced from 3.8% to more than 25% [2]. Perovskite solar cell (PSC) technology evolved at first from titania-based dye-sensitized solar cells [3] and spread later into different architectures [4]: regular n–i–p with and without a mesoporous TiO2 layer or inverted p–i–n (Figure 1). Although slightly higher efficiencies are obtained with mesoporous titania scaffolds [5], planar structures without them are more prospective from an industrial point of view. After it was proved that perovskites, unlike organic absorbers, generally have a long carrier diffusion length (a few hundreds of nanometers) [6], mesoporous TiO2 was able to be omitted, allowing for the processing of whole solar cells below 200 °C. High efficiency of 21.6% for the planar n–i–p structure has been reported by Jiang et al. [7], while other authors have claimed an even higher value of 23.7% [8]. In general, the PSC structure is composed of a perovskite absorber layer placed between a selective transport layer for holes (HTL) and electrons (ETL). For the p–i–n structure, the most commonly used HTLs are PEDOT:PSS [9] and NiOx [10], while the ETL, mostly PCBM [11], is placed on top of the HTL and perovskite. On the other hand, in the most common n–i–p architecture, titanium dioxide is predominantly used as an ETL followed by a perovskite absorber and Spiro-OMeTAD as the HTL. Although significant progress in PSCs was enabled by engineering the perovskite composition [12,13] and microstructures [14,15], achieving high power conversion efficiency is not possible without optimizing other cell components.
The ETL in PSCs transports electrons generated from the perovskite layer [16]. It also serves as a blocking layer to hinder direct contact between the holes and FTO [17]. Hence, the layer should be pinhole free to prevent the recombination of electrons and holes at the front electrodes. Compatible energy levels support the fast injection of photogenerated electrons from perovskites and low-voltage losses. It also acts as a window layer for the perovskites; thus, a bandgap above 3 eV is necessary. The layer should electrically be as thin as possible to provide fast electron transport and low resistive losses. The titanium-oxide-based ETL is also a crucial investigation area reported in a number of studies [18,19,20,21,22]. The titanium dioxide blocking layer can be deposited by various methods: atomic layer deposition (ALD) [23], magnetron sputtering [24], spray pyrolysis [25], electrochemical deposition [26] and spin coating, where the latter is most commonly used. Due to the relatively high surface roughness of the FTO electrode, typically ca. 20 nm (Rq), the deposition methods can be divided into methods supporting a perfectly conformal morphology, such as ALD or sputtering, and methods resulting in fewer conformal layers such as spin coating. Spin-coated compact TiO2 layers more easily fill the troughs of the rough surface than the peaks. The optimal thickness of c-TiO2 is a minimal one that supports the blocking properties at the peaks. Literature reports have announced a variety of titanium precursors and deposition conditions; however, the optimal thickness is rather rarely given explicitly. Additionally, each precursor may require different thicknesses to reach the highest cell performances, as discussed in [27], the reason being that there are intrinsic differences in material properties in comparison to the morphological aspects. For instance, Qin et al. compared three different titanium precursors: tetrabutyl titanate, titanium diisopropoxide bis(acetylacetonate), titanium isopropoxide and solvents [28], concluding the first as the best. However, the thicknesses of compared layers differed considerably. Furthermore, the confrontation of ETLs was conducted in the presence of mesoporous TiO2, which could slightly disrupt the thickness effects, and the surface roughness of FTO used in these studies was approximately two times lower than commonly used.
It is known that ETLs (TiO2 or SnO2) should be uniform, pinhole free and completely cover the surface of FTO. Therefore, the optimal thickness depends on the deposition technique and post-treatment of these layers. Many authors have reported thin ETLs in the range of 20–30 nm. For example, Xiao et al. [29] applied a 30 nm thick layer of TiO2 for the planar n–i–p structure and obtained a power conversion efficiency of 13.9%. Saliba et al. [4] used 20–30 nm thick SnO2 (instead of TiO2) in the planar regular structure (n–i–p) and a 20–30 nm compact TiO2 layer for the mesostructure for high-efficiency solar cells with a PCE ≥20%. On the other hand, Sun et al. [30] obtained the greatest efficiency (PCE of 18.32%) for much thicker layers of 152 nm. In this case, the TiO2 layer was additionally treated with TiCl4. However, for the ALD layer deposition technique, the thickness of the layers could be much lower. Lu et al. [31] showed that the optimal thickness for the ALD technique is considerably smaller and equal to 10 nm (PCE of 13.6%). This suggests that the ETL may be very thin but must also be of good quality.
Considering the ETL is an important part of PSCs, in this work, we emphasize its impact on perovskite solar cell parameters. The regular planar n–i–p architecture of PCSs was studied, i.e., glass/FTO/c-TiO2/MAPbI3/Spiro-OMeTAD/Au. In this report, we deposited ETLs using a titanium diisopropoxide bis(acetylacetonate) (Ti(acac)2OiPr2) precursor solution in 1-BuOH. This set was chosen because its good performance matches the preparation simplicity and good storage stability. This stability is important in the case of experimental repeatability, as it was already reported for precursor solutions undergoing aging processes [27,32]. Thoroughly differing thicknesses of the compact TiO2 layer were the key features enabling careful investigation of the properties of c-TiO2 and their influence on the performance of PSCs. Complex studies enabled a better understanding of the observed effects.

2. Materials and Methods

All reagents were used without purification: titanium diisopropoxide bis(acetylacetonate) (Ti(acac)2OiPr2) (75 wt % in isopropanol, Sigma-Aldrich); 1-butanol (1-BuOH) (99.5%, Chempur); chlorobenzene (CB) (99.5%, Chempur); acetonitrile (99.8%, Sigma Aldrich); PbI2 (99.99%, TCI); methylammonium iodide (MAI) (>99.99%, Greatcell Solar Materials); γ-butyrolactone (GBL) (≥99%, Sigma-Aldrich, St. Louis, MO, USA); dimethyl sulfoxide (DMSO) (99.9%, Sigma-Aldrich, St. Louis, MO, USA); N2,N2,N2′,N2′,N7,N7,N7′,N7′-octakis(4-methoxyphenyl)-9,9′-spirobi [9H-fluorene]-2,2′,7,7′-tetramine (Spiro-OMeTAD) (99%, Sigma-Aldrich, St. Louis, MO, USA); 4-tert-butylpyridine (TBP) (98%, Sigma Aldrich); bis(trifluoromethane)sulfonimide lithium salt (LiTFSI) (99%, Sigma-Aldrich, St. Louis, MO, USA).

2.1. Preparation of Compact TiO2 Layers

For the electron transport layer (ETM), we used compact TiO2 (c-TiO2) layers of different thicknesses. They were deposited either on square (2 cm × 2 cm) FTO glass substrates (Sigma-Aldrich, St. Louis, MO, USA, ~7 Ω/sq) or on a (100) polished silicon wafer. FTO glass plates were washed by dipping in hot 2% (v/v) Hellmanex® III (Hellma Analytics, Müllheim, Germany) solution in deionized (DI) H2O in an ultrasonic cleaner for 5 min. After that, they were dipped in hot DI H2O and again in isopropanol in an ultrasonic cleaner for 5 min. Finally, the plates were submerged in DI H2O and dried. Silicon wafers were cleaned successively with acetone and isopropanol and rinsed with deionized water. Just before applying compact TiO2 layers, FTO glass plates and Si wafers were additionally treated with O2 plasma (Harrick Plasma, Ithaca, NY, USA) for 15 min (MID).
The c-TiO2 precursors were prepared by mixing 75 wt % Ti(acac)2OiPr2 in isopropanol (IPA) with 1-BuOH. Zero, 0.243, 0.486, 0.729, 1.214, 1.821 and 2.428 g of 75 wt % Ti(acac)2OiPr2 was added to a volumetric flask and filled to 5 mL with 1-BuOH to make a 0, 0.1, 0.2, 0.3, 0.5, 0.75 and 1 M (mole/dm3) solution. A 70 µL volume of precursor solution was spread on cleaned FTO/Si plates and spin coated at 2000, 3000 or 4000 revolutions per minute (RPM) for 15 s. They were then preheated at 200 °C for 10 min in an oven and calcined at 500 °C for 30 min in a tube furnace in the presence of air.

2.2. Fabrication of Solar Cells

Deposition of lead iodide (MAPbI3) and the hole transport layer (HTL) was performed in a nitrogen-filled glove box (MBRAUN, Garching, Germany). A ca. 1 M methylammonium MAPbI3 precursor was prepared by dissolving 0.461 g (1 mmol) of PbI2 and 0.159 g (1 mmol) of MAI in 700 µL of GBL and 300 µL of DMSO at room temperature (RT) at ca. 28–30 °C. The solution was stirred with a magnetic stirrer for ca. 3 h and then filtered through a syringe filter of a 0.45 μm membrane pore size. Prior to deposition of the precursor, FTO/c-TiO2 substrates were cleaned in O2 plasma for 30 min (MID). A 70 µL volume of the MAPbI3 precursor was spread on the FTO/c-TiO2 plate by two-step spin coating: 1000 RPM (200 RPM/s ramp) for 10 s and immediately 5000 RPM (1333 RPM/s ramp) for 20 s. Between 16 and 18 s of 5000 RPM spinning, 200 µL of toluene antisolvent was added. The spin-coating program is presented in Figure S1 of the Supporting Information. After deposition of MAPbI3, each sample was annealed at 100 °C on a hot plate for 10 min and cooled down to RT.
To deposit the hole transport layer (HTL), we used a stock solution of doped Spiro-OMeTAD in CB. A 0.368 g (0.3 mol) amount of Spiro-OMeTAD was dissolved in 5 mL of CB and doped with 148 μL (1.01 mol) of TBP and 83 μL of LiTFSI (0.15 mol) stock solution (520 mg/mL in acetonitrile). A 70 µL volume of the Spiro-OMeTAD solution was spread on the MAPbI3 perovskite layer and spin coated at 4000 RPM for 30 s. After that, the samples were taken out of the glove box, masked and coated with gold by thermal evaporation. Au electrodes had a surface of 0.25 cm2 and a thickness of approximately 120 nm.

2.3. Apparatus Used in Measurements

Photovoltaic performance measurements were carried out by I–V curve tracing using a Photo Emission Tech AAA class solar simulator under standard test conditions. The microstructural and surface investigations were performed using Innova multimode atomic force microscopy and scanning electron microscopy (tabletop TM3030, Hitachi High-Tech, Tokio, Japan). The optical characterization was based on ellipsometry (SE800 PV, SENTECH Instruments, Berlin, Germany, range = 300–980 nm, incident angle = 70°) and UV–vis–NIR spectroscopy (Lambda 950S, Perkin Elmer, Waltham, MA, USA, range = 300–850 nm).

3. Results and Discussion

3.1. Fabrication of c-TiO2 Thin Layers by Spin Coating

Spin coating is a common technique used for the deposition of thin films on solid substrates. The main advantage of this process is the ability to quickly and easily produce very fine and uniform coatings in the thickness range of micrometer to nanometer [33]. The thickness of the layer depends on many factors and can be described by the model of Mayerhofer [34]:
d = ( 1 ρ 0 ρ ) · ( 3 η · m 2 ρ 0 ω 2 ) 1 3
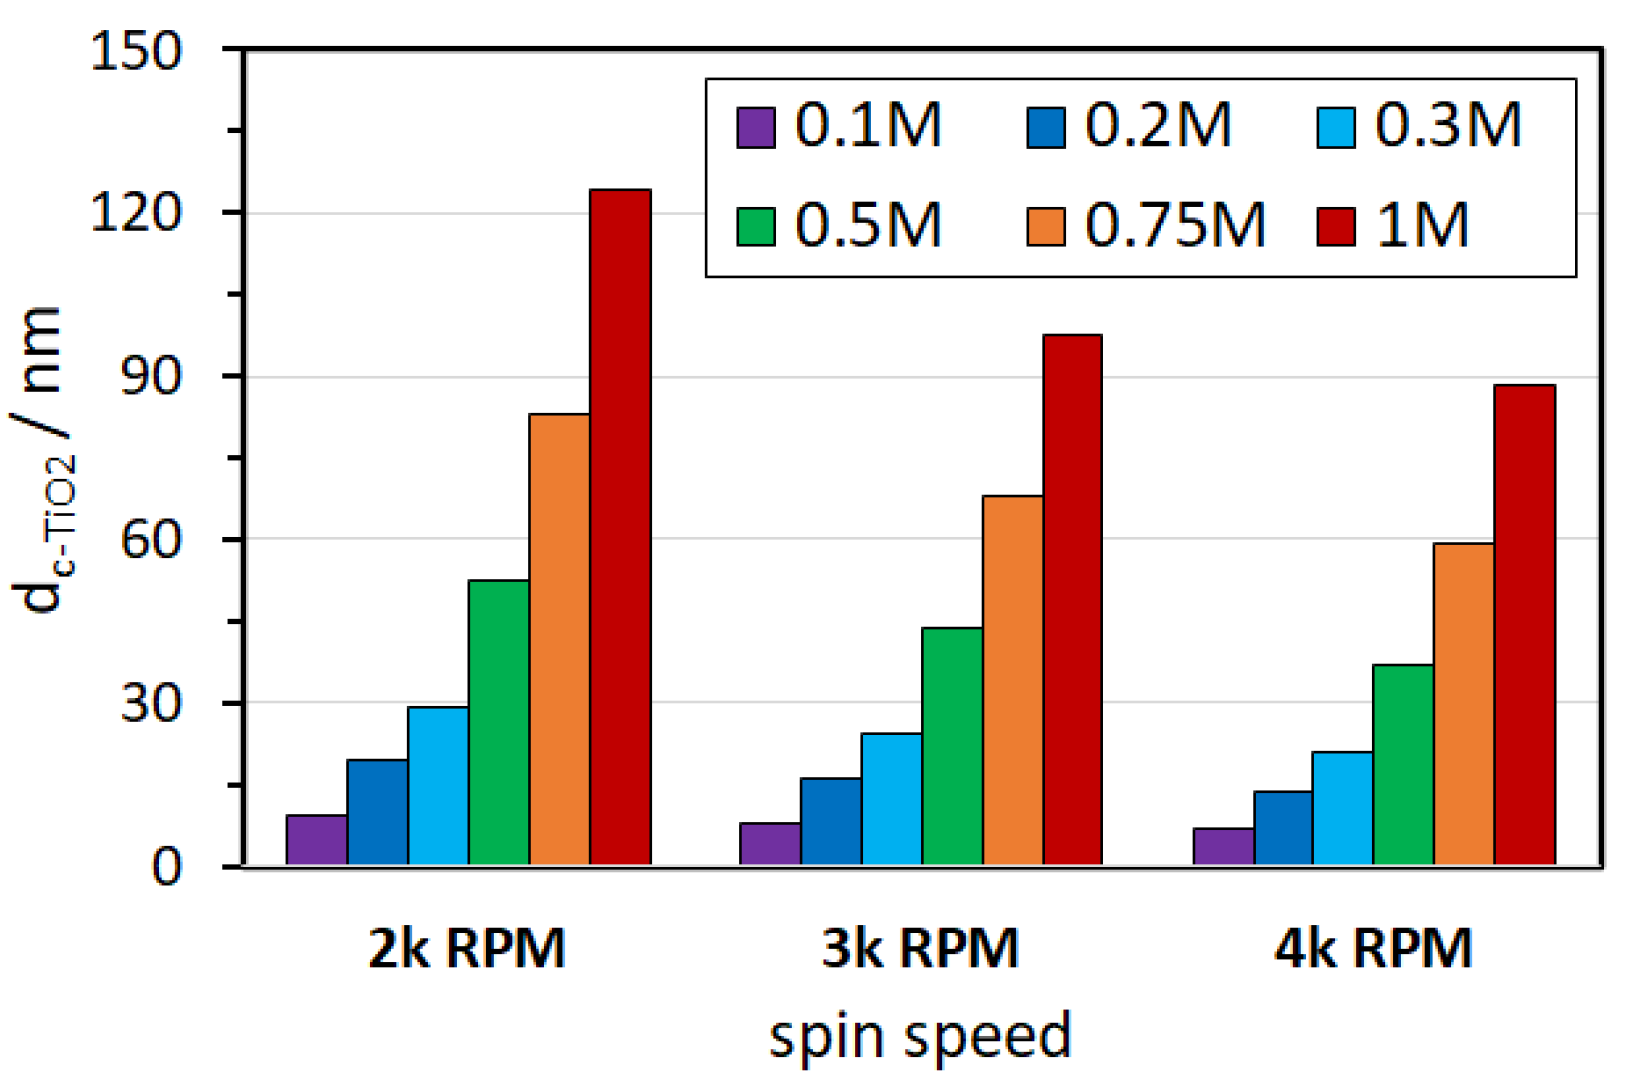
where d is the thickness, ρ is the density of the solution, ρ0 is the density of the solvent, η is the viscosity of the solution, m is the rate of evaporation and ω is the angular speed. In practice, the thickness of films deposited from solutions is controlled by the spinning speed (related to angular velocity) and concentration of the desired substance (related to viscosity). In this work, we coated glass/FTO substrates using a solution of titanium diisopropoxide bis(acetylacetonate) (Ti(acac)2OiPr2) in 1-butanol (1-BuOH) and annealed it at 200 and 500 °C. A commercially available 75% solution of Ti(acac)2OiPr2 in isopropanol mixes with 1-BuOH in any ratio, forming clear mixtures that do not age quickly (no rapid hydrolysis process). In this work, we investigate a series of 19 devices with a thickness of c-TiO2 layers ranging from 0 to 124 nm, which were deposited by the spin-coating method with varying centrifugation speed and concentration of the precursor. The layer thickness was associated with the nominal thickness of polished Si determined from ellipsometry. Figure 2 shows the dependence of the thickness of the c-TiO2 layer on the centrifugation speed for solutions of different concentrations. It can be seen that the precursor concentration has a major influence on the thickness of the c-TiO2 film. Generally, the c-TiO2 layer formed at 2000 RPM can be thinned by 13–21% using 3000 RPM or by 26–31% using 4000 RPM. The full set of ellipsometry data is available in Table S1 in the Supporting Information.
Figure 1 shows schemes of the three most common architectures of PCSs: planar regular (n-i-p), mesoporous (n-i-p) and planar inverted (p-i-n) [35]. Because this publication focuses on the compact (or blocking) TiO2 layer, we used the simple planar regular (n-i-p) architecture of the glass/FTO/c-TiO2/MAPbI3/Spiro-OMeTAD/Au configuration with no mesoporous scaffold. Herein, for the most part, the light reaches the perovskite absorber through the glass substrate, FTO and electron transport layer (ETL), c-TiO2. Light nonabsorbed during the first pass (λ > 600 nm) is mostly backscattered from the gold electrode, as it results from its complex refractive index [36].

3.2. Optical Absorption

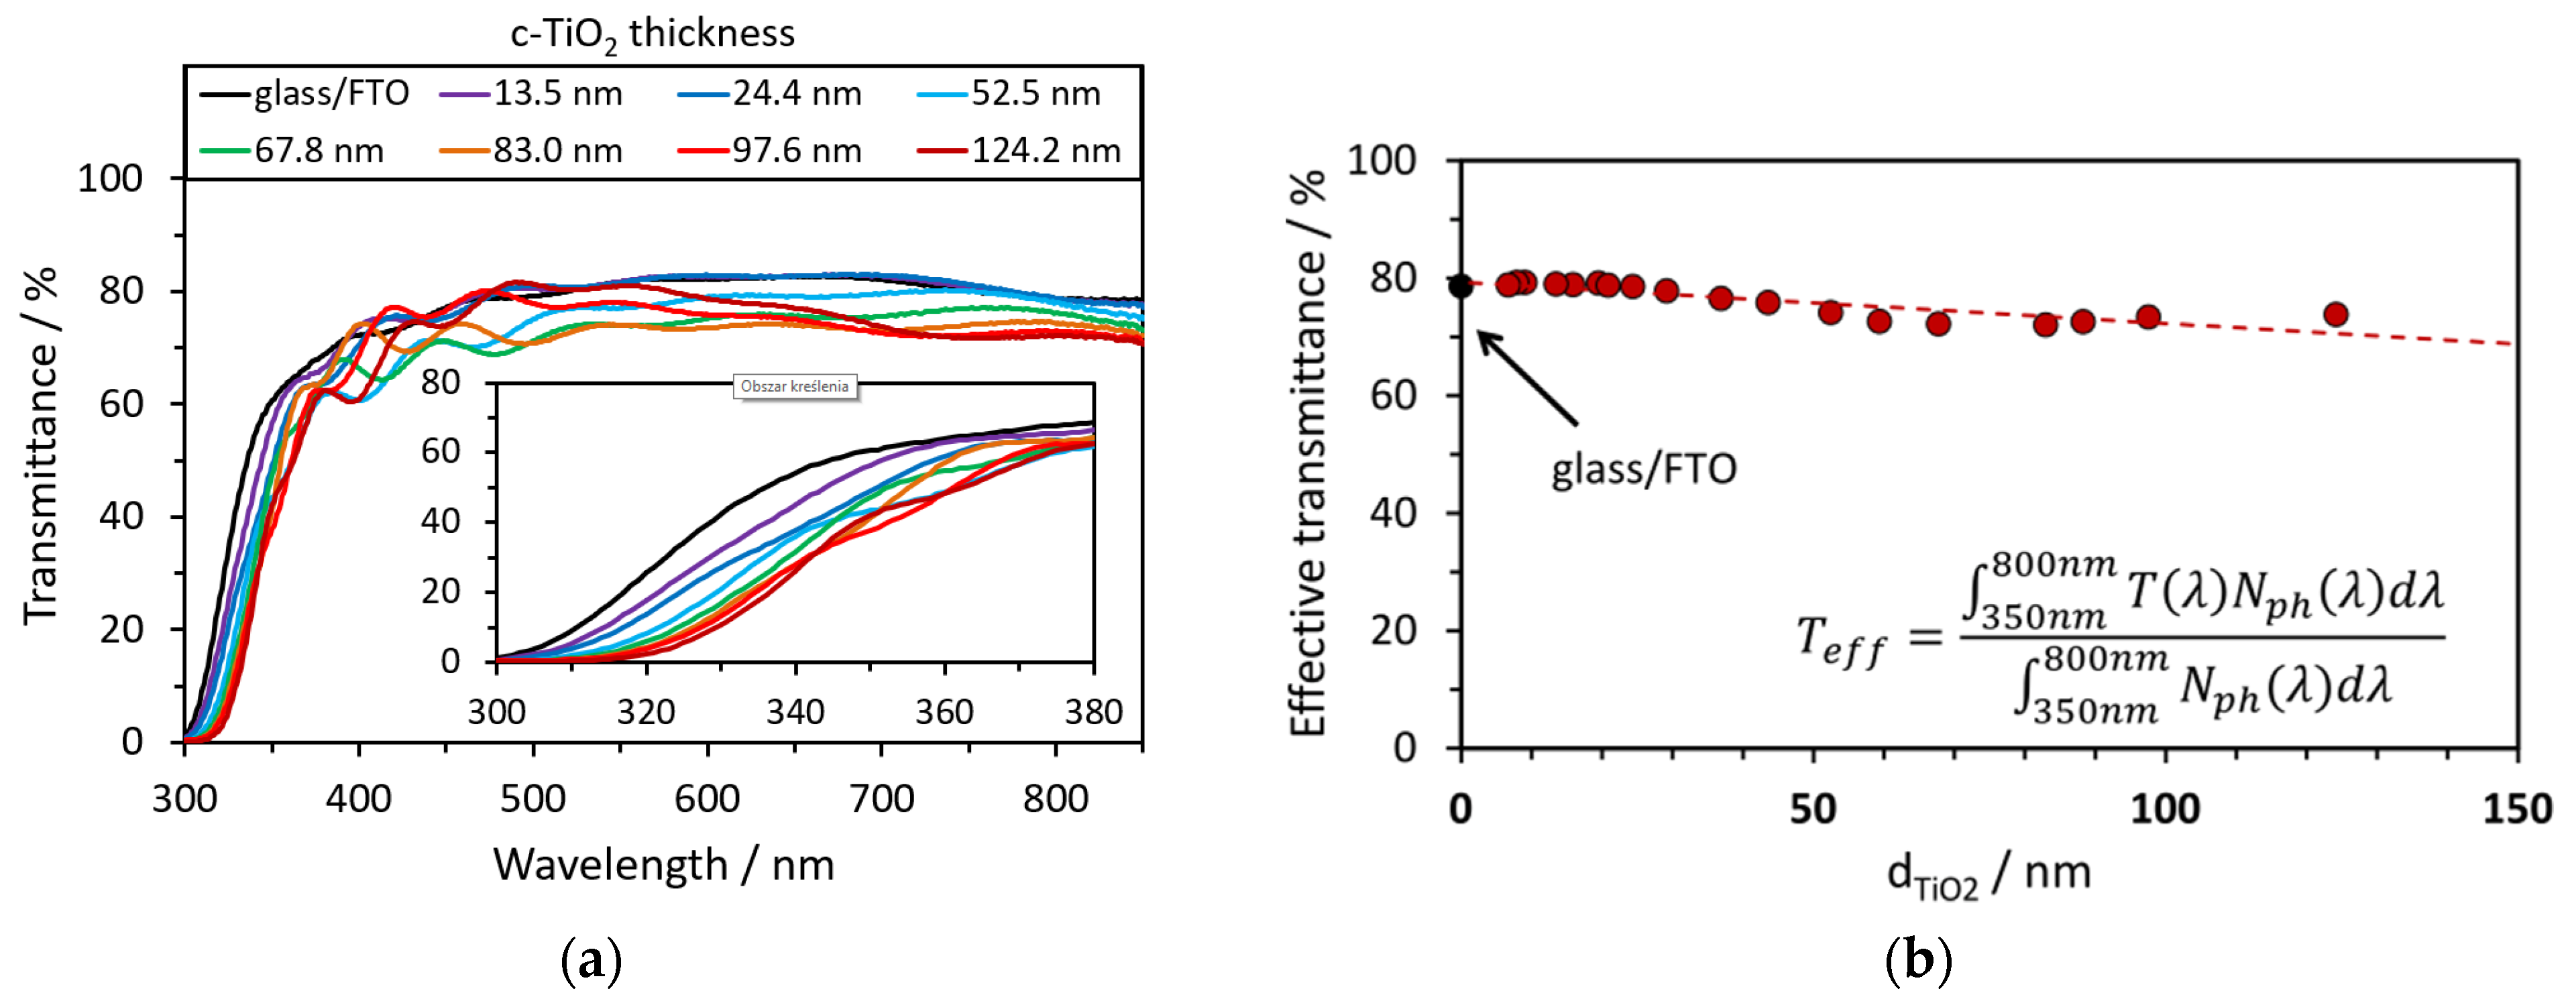
The power conversion efficiency (PCE) of PSC strongly depends on the photocurrent, which, in turn, is directly proportional to the number of absorbed photons. It is well known that MAPbI3 perovskite is an excellent absorber in the 300–800 nm wavelength range [37]. The onset photon absorption energy of polar MAPbI3 perovskite is about 1.5 eV (≈827 nm), which is close to its electronic bandgap value of 1.55 eV (≈800 nm) [38]. It shows a higher quantum yield in the blue/green region and a lower yield in the red/infrared [39,40]. For this reason, the ETL material should be as transparent as possible in a wide range of spectra. The thickness of the c-TiO2 layer clearly affects the optical transmission of perovskite, which is shown in Figure 3. The used glass/FTO substrate absorbs or reflects some of the light, ca. 20% between 450 and 850 nm, and much more in the near-ultraviolet range (300–350 nm). c-TiO2 layers less than ca. 30 nm hardly affect the transmittance of glass/FTO, except for some absorption below ca. 380 nm, which is characteristic of anatase [41]. The effective transmittance of the samples slowly decreases as the thickness of the c-TiO2 layer increases (Figure 3b). It is worth noting that for all samples, one can observe multiple maxima and minima above the absorption edge in the transmittance spectra (ca. >360 nm), which are especially pronounced for c-TiO2 layers thicker than 24.4 nm. This is due to the interference effect resulting from the two interface boundaries, c-TiO2/FTO and the FTO/glass substrate, which suggests that the surface and interface of these bilayers are rather optically smooth [42]. The transmittance data around the absorption band edge follow the clear trend of edge red shift with TiO2 layer thickness. Thus, taking into account the bandgap of the anatase TiO2 layer on FTO, it should be attributed to parasitic light absorption in TiO2. UV–vis–NIR spectra for all the studied samples are available in the Supporting Information (Figure S2).

3.3. Atomic Force Microscopy

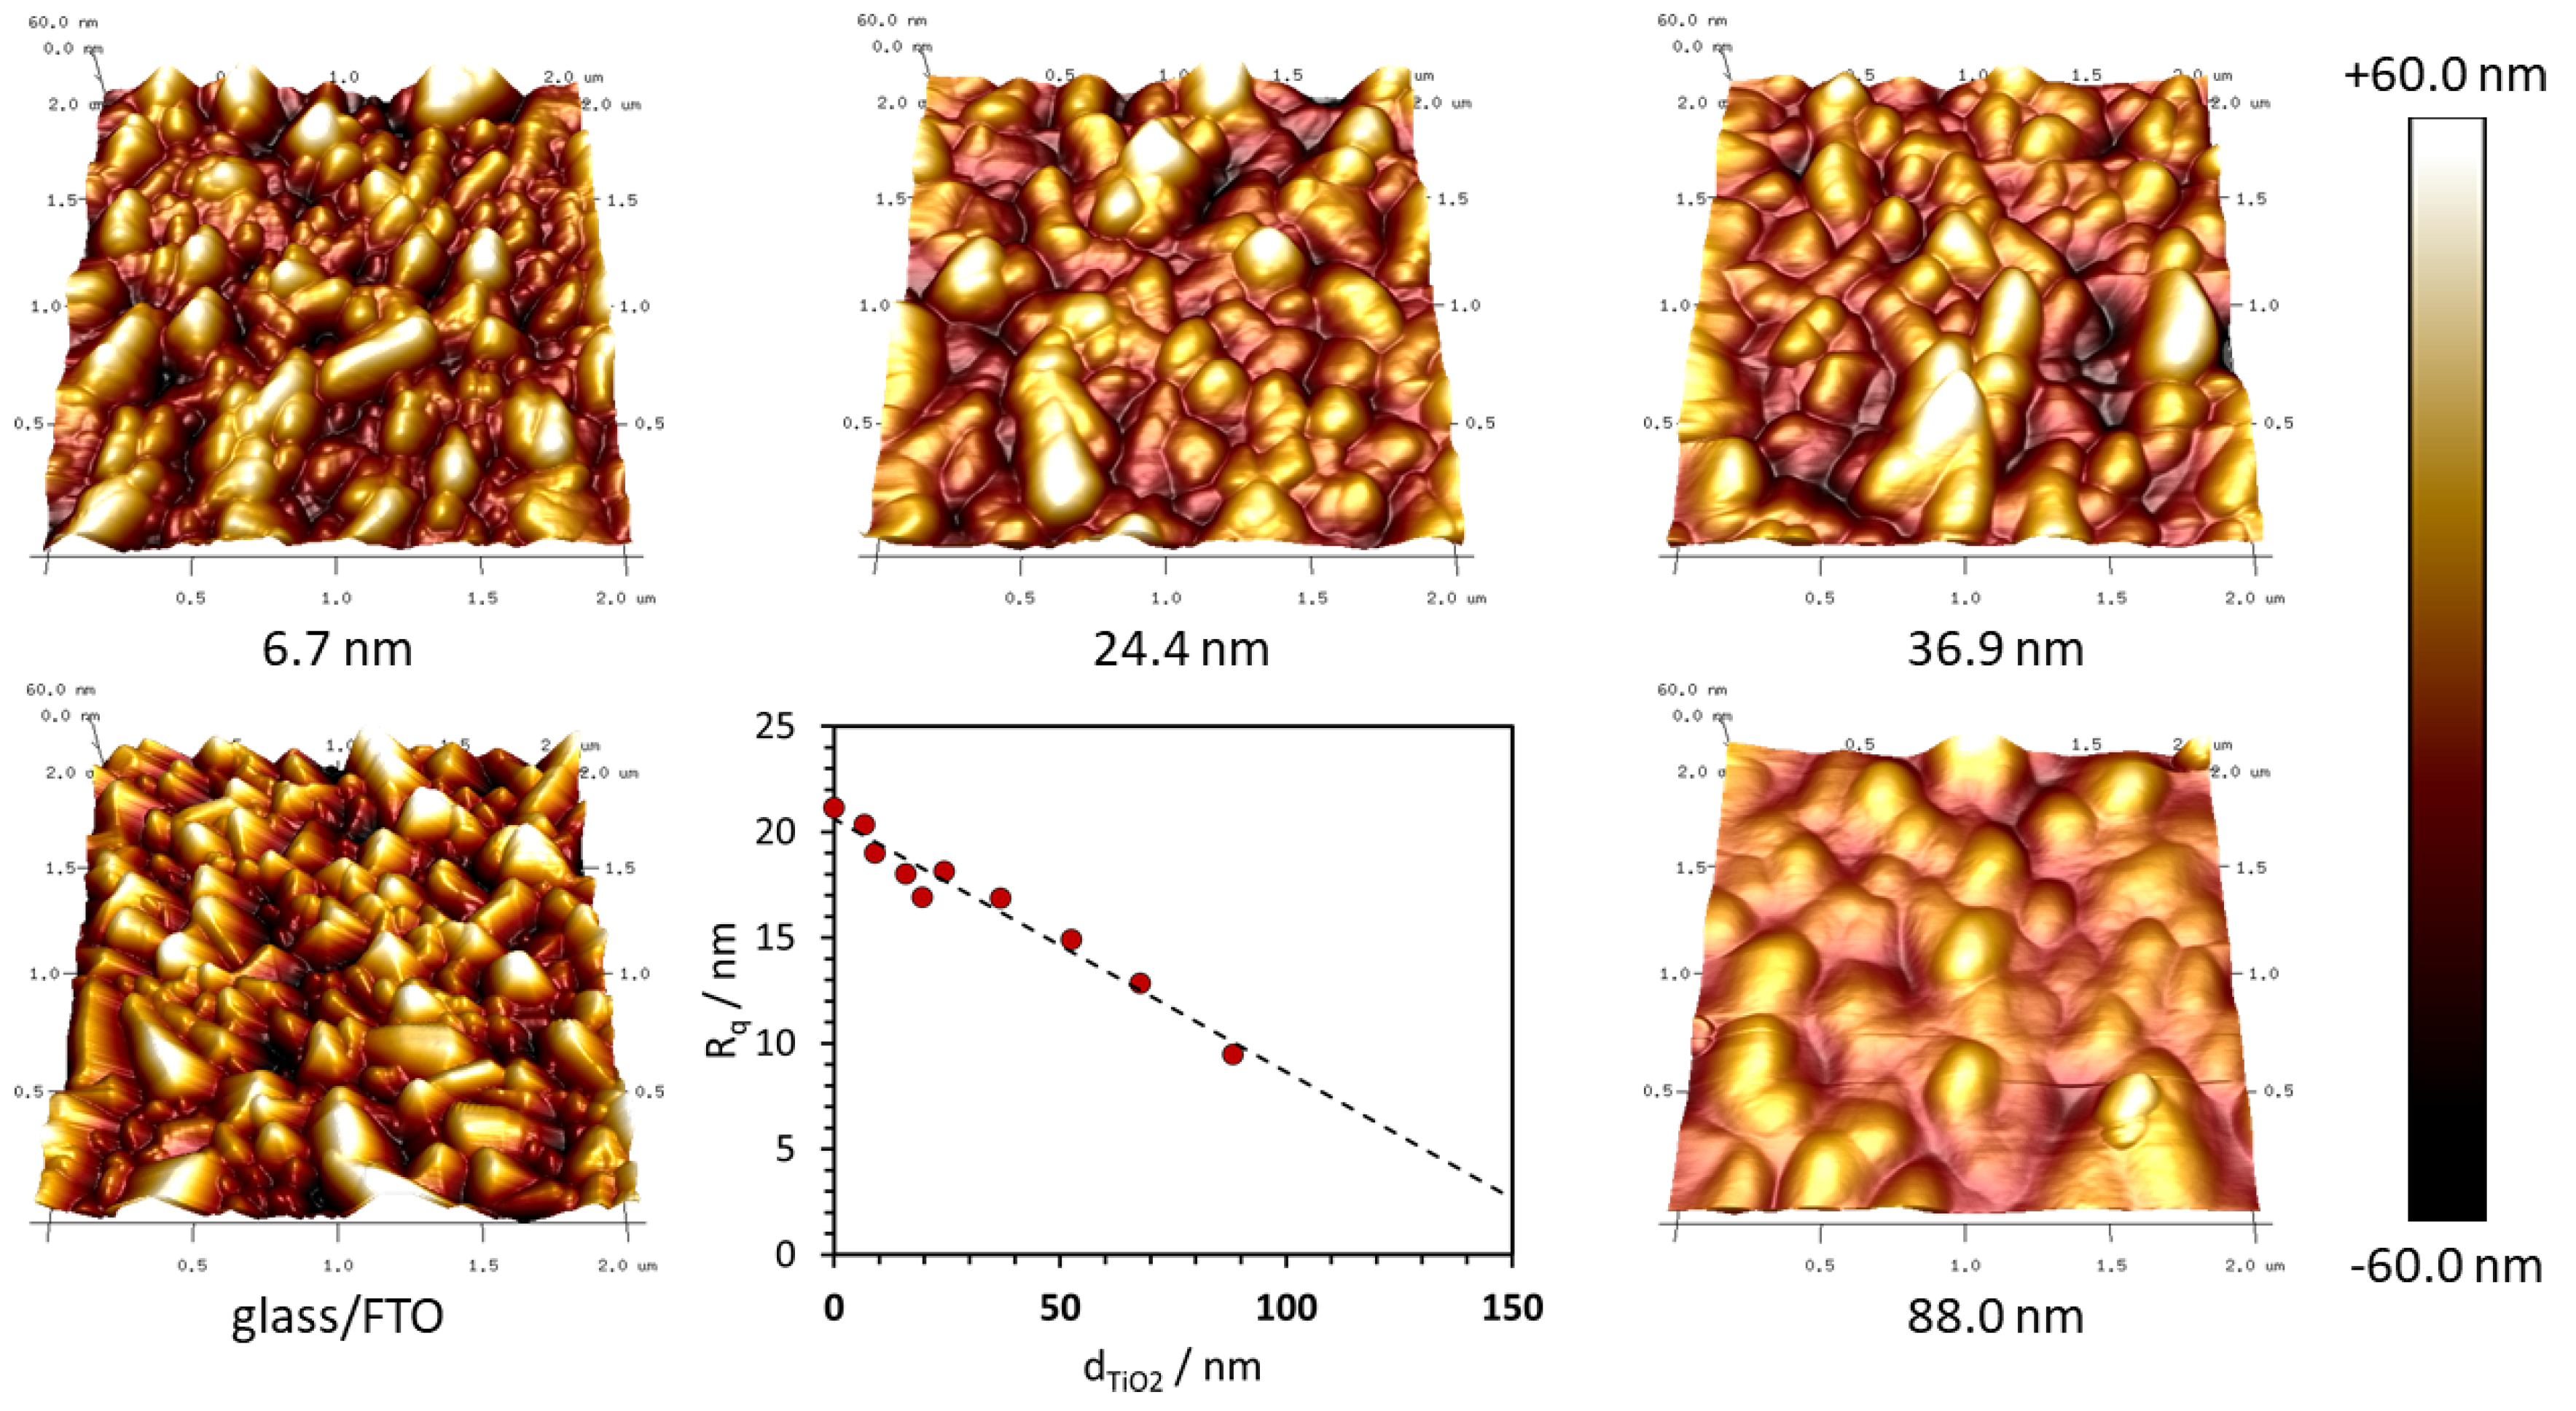
Figure 4 shows that the used glass/FTO substrate exhibits a roughness of ca. 21 nm that decreases linearly with the increasing thickness of c-TiO2, down to ca. 9.5 nm for the 88.3 nm thick layer. The topography of the FTO surface shows sharp tops and mild depressions resulting from the columnar grain structure of this material. Based on the AFM profiles, it should be emphasized that even thin c-TiO2 layers, e.g., 6.7 nm, dull the sharp peaks effectively, while the thicker layers smooth the entire surface. Due to the right viscosity of the 1-butanol-based titanium diisopropoxide bis(acetylacetonate) sol, the layer shows more conformal growth than other sols such as ethanol-based titanium ethoxide [27]. So far, there is a significant divergence of optimal thickness according to the deposition method: ~10–15 nm for ALD and 50–60 nm for spin coating. The enhanced conformality is the key feature that allows the thinning of the blocking layer. Although the roughness of TiO2 could also affect the crystallization of MAPbI3, SEM images show a similar microstructure of perovskite films deposited on the substrates with different c-TiO2 thicknesses (Figure S3).

3.4. Current–Voltage (I-V) Characteristics of Solar Cells

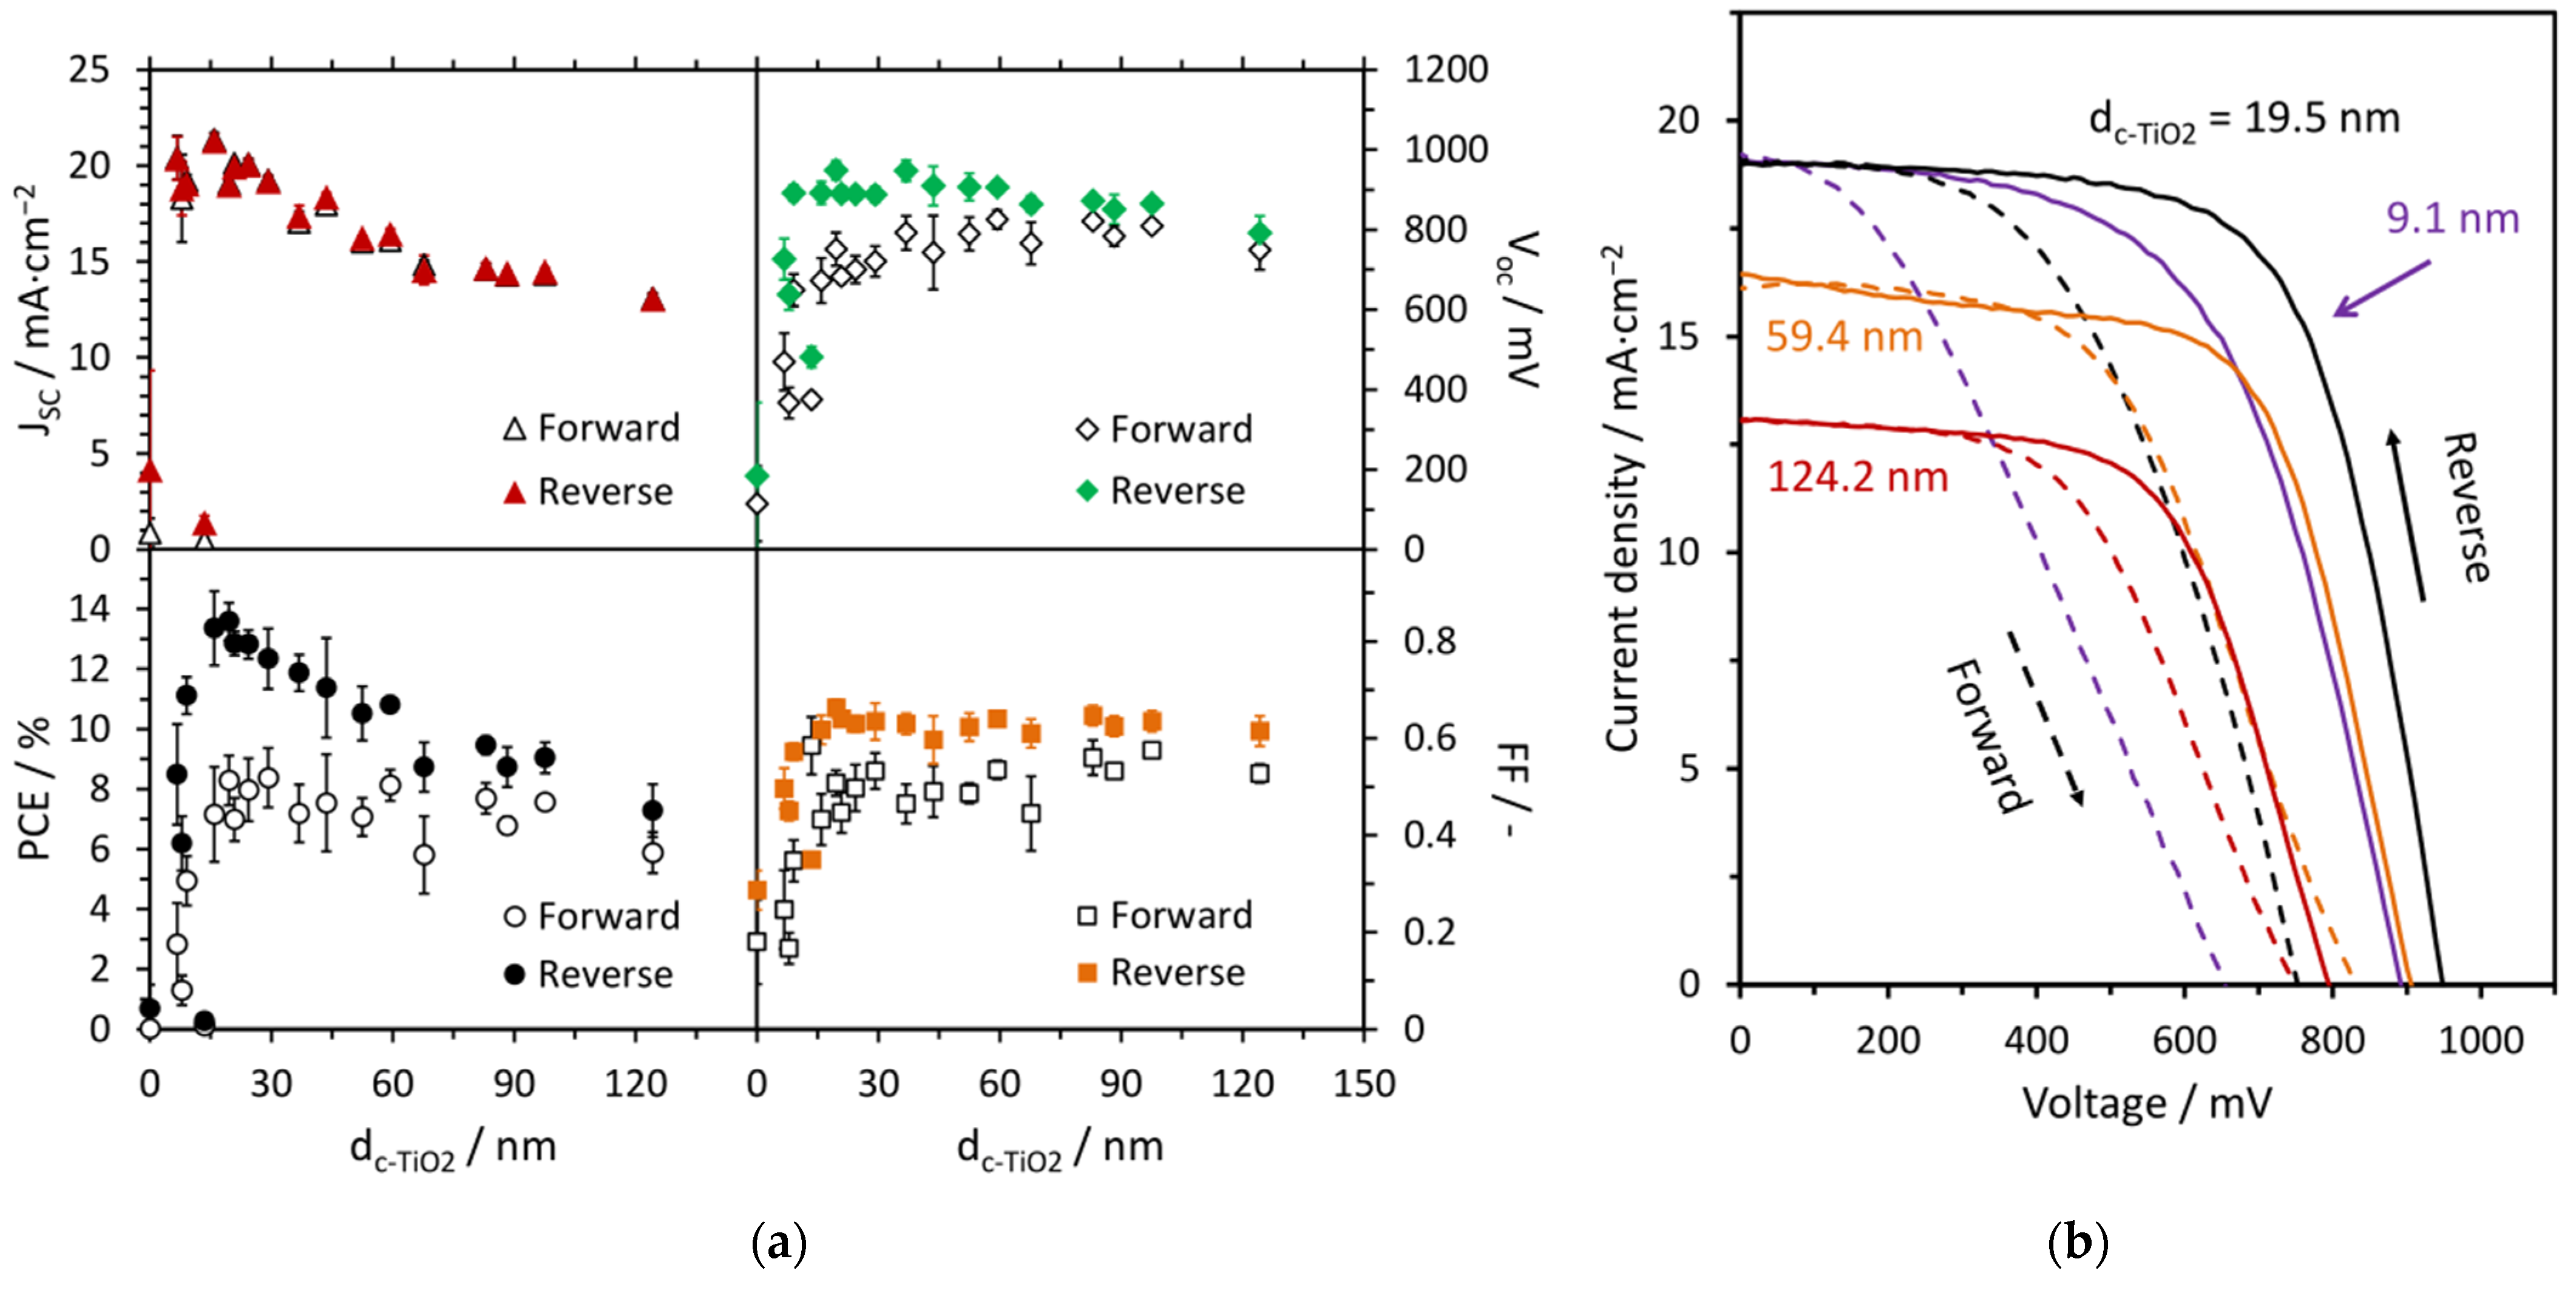
The electrical properties of solar cells have a direct impact on their performance. Figure 5a shows that the introduction of an even, very thin layer of c-TiO2 into the cells results in a step increase of all basic photoelectric parameters compared to the device where perovskite was deposited directly on FTO. However, TiO2 electron transport layers below ca. 15 nm are too thin, which lowers the cells’ efficiencies. Additionally, part of such cells turned out to be faulty, and the devices were difficult to repeat. Most likely, such c-TiO2 layers may not be completely continuous, and the pinholes present result in the fast electron–hole pair recombination at the FTO/MAPbI3 interface. This can also provide an alternate current path for the light-generated current, lowering the Shunt resistance of the cell. The optimal ETL thickness for the studied perovskite-based solar cells was 19.5 nm, resulting in the highest power conversion efficiency (PCE) of 13.6%. Along with thickening of the c-TiO2 layer, the fill factor (FF) remains at a similar level (0.60–0.65), the open-circuit voltage (VOC) slightly decreases from ca. 950 mV to ca. 800 mV, while the short-circuit current density (JSC) drops significantly from 19.0 to 13.1 mA·cm−2. This drop cannot be explained only by the lower effective transmittance (Figure 3b), which indicates the hindered transport properties. It is worth noting that the highest JSC of 21.3 mA·cm−2 was recorded for the cells with a 15.9 nm c-TiO2 layer; however, the remaining parameters (FF and VOC) were significantly lower than the cells with the optimal c-TiO2 layer. As a result, we observe a gradual decrease in PCE from 13.6% for the 19.5 nm c-TiO2 layer to 7.3% for the 124.2 nm layer. The selected electrical parameters are collected in Table 1, while the remaining are available in the Supporting Information (Table S2).
A few selected J–V curves for the studied cells are presented in Figure 5b. They directly reflect the trends observed for the electrical parameters (Figure 5a, Table 1). The shapes of the J–V curves are similar for all cells, which is reflected by similar values of FF. All devices exhibit hysteresis typical for perovskite solar cells between forward and reverse scans, the origins of which are due to ferroelectric polarization, ion migration, charge trapping and/or capacitive effects [43]. In the case of planar heterojunction PSCs under study, the hysteresis is much more pronounced for those with a thinner ETL. Although cells with a c-TiO2 layer of 9.1 and 19.5 nm show a similarly high JSC, a significantly lower VOC is observed for the thinner layer. It is also clear that the VOC decreases as the c-TiO2 thickens.
There may be several reasons for the trends in the electrical properties of the studied PSCs. The thick ETL acts as an insulator for the electrons generated in the absorber, increasing the series resistance of the cell. This hinders charge collection by lowering the gradient of the carrier concentration (diffusion-based transport) and also by disturbing the electric field in the material (drift-based transport).

4. Conclusions

The presented results clearly shows that the thickness of the compact TiO2 ETL clearly affects the performance of MAPbI3 perovskite solar cells. We chose the simplest planar heterojunction architecture (glass/FTO/b-TiO2/MAPbI3/Spiro-OMeTAD/Au) to minimize the influence of factors that could interfere with the results, e.g., the presence of a mesoporous TiO2 scaffold.
The ETL can significantly reduce the roughness of the FTO substrates. Even very thin c-TiO2 layers (6.7 nm) dull the sharp grains of FTO, while the thicker layers smooth the entire surface. Compact TiO2 also affects the optical transparency of the devices. The effective transmittance of glass/FTO substrates slowly decreases with the thickening of the ETL, but layers thinner than ca. 30 nm still hardly affected it.
More significant effects were observed for the current density–voltage characteristics of the cells. We found that c-TiO2 of ca. 20 nm is optimal, providing the best performance of the devices. Thinner layers may result in worse efficiency of cells or difficulties with the reproducibility of the devices. An ETL that is too thin may not be completely continuous and contain pinholes, which may result in fast electron–hole pair recombination at the FTO/MAPbI3 interface. It can also provide an alternate current path for the light-generated current, lowering the Shunt resistance of the cell. It is worth noting that even the very thin layer of c-TiO2 markedly increases all basic photoelectric parameters compared to the device with perovskite deposited directly on FTO. On the other hand, a TiO2 layer that is too thick also has a negative impact on the performance of PSCs, as it significantly reduces the short-circuit current density (JSC) and also the open-circuit voltage (VOC). Along with the thickening of the c-TiO2 layer from ca. 20 nm to ca. 125 nm, JSC decreased by 38% (from 21.3 to 13.1 mA·cm−2) and VOC by 16% (from 950 mV to 800 mV). Yet, for most cells, the FF remained at a similar level, between 0.6 and 0.65. In effect, we noticed a clear, gradual decrease in power conversion efficiency (PCE) from 13.6% to 7.3% along with the thickening of the c-TiO2 ETL.

Supplementary Materials

The following are available online at https://www.mdpi.com/article/10.3390/ma14123295/s1, Table S1: Parameters from ellipsometry measurements for the studied c-TiO2 layers on polished silicon wafers, Figure S1: Spin-coating program for the deposition of the MAPbI3 perovskite precursor, Figure S2: UV–vis–NIR spectra of the glass/FTO/c-TiO2 samples under study, Table S2: Electrical parameters of the studied FTO/b-TiO2/MAPbI3/Spiro-OMeTAD/Au solar cells: short-circuit current density (JSC), open-circuit voltage (VOC), fill factor (FF) and power conversion efficiency (PCE), Figure S3: SEM images showing the morphology of the MAPbI3 perovskite layer deposited on glass/FTO/c-TiO2.

Author Contributions

Conceptualization, A.S.; methodology, Z.S. and M.L.; validation, Z.S. and M.L.; formal analysis, A.S.; investigation, A.S. and Z.S.; resources, M.L.; data curation, A.S. and M.L.; writing—original draft preparation, A.S.; writing—review and editing, Z.S.; visualization, A.S.; supervision, M.L.; project administration, M.L.; funding acquisition, M.L. All authors have read and agreed to the published version of the manuscript.

Funding

This research was funded by the National Science Centre of Poland, Grant Number 2018/31/B/ST8/03294.

Institutional Review Board Statement

Not applicable.

Informed Consent Statement

Not applicable.

Data Availability Statement

Data is contained within the article or supplementary material.

Conflicts of Interest

The authors declare no conflict of interest. The funders had no role in the design of the study; in the collection, analyses, or interpretation of data; in the writing of the manuscript, or in the decision to publish the results.

References

  1. Kojima, A.; Teshima, K.; Shirai, Y.; Miyasaka, T. Organometal Halide Perovskites as Visible-Light Sensitizers for Photovoltaic Cells. J. Am. Chem. Soc. 2009, 131, 6050–6051. [Google Scholar] [CrossRef] [PubMed]
  2. NREL Best Research-Cell Efficiency Chart. Available online: https://www.nrel.gov/pv/cell-efficiency.html (accessed on 19 May 2021).
  3. O’Regan, B.; Grätzel, M. A low-cost, high-efficiency solar cell based on dye-sensitized colloidal TiO2 films. Nature 1991, 353, 737–740. [Google Scholar] [CrossRef]
  4. Saliba, M.; Correa-Baena, J.-P.; Wolff, C.M.; Stolterfoht, M.; Phung, N.; Albrecht, S.; Neher, D.; Abate, A. How to Make over 20% Efficient Perovskite Solar Cells in Regular (n–i–p) and Inverted (p–i–n) Architectures. Chem. Mater. 2018, 30, 4193–4201. [Google Scholar] [CrossRef]
  5. Lee, D.G.; Kim, M.-C.; Kim, B.J.; Kim, D.H.; Lee, S.M.; Choi, M.; Lee, S.; Jung, H.S. Effect of TiO2 particle size and layer thickness on mesoscopic perovskite solar cells. Appl. Surf. Sci. 2019, 477, 131–136. [Google Scholar] [CrossRef]
  6. Stranks, S.D.; Eperon, G.E.; Grancini, G.; Menelaou, C.; Alcocer, M.J.P.; Leijtens, T.; Herz, L.M.; Petrozza, A.; Snaith, H.J. Electron-Hole Diffusion Lengths Exceeding 1 Micrometer in an Organometal Trihalide Perovskite Absorber. Science 2013, 342, 341–344. [Google Scholar] [CrossRef] [PubMed] [Green Version]
  7. Jiang, Q.; Chu, Z.; Wang, P.; Yang, X.; Liu, H.; Wang, Y.; Yin, Z.; Wu, J.; Zhang, X.; You, J. Planar-Structure Perovskite Solar Cells with Efficiency beyond 21%. Adv. Mater. 2017, 29, 1703852. [Google Scholar] [CrossRef]
  8. Zhao, Y.; Ye, Q.; Chu, Z.; Gao, F.; Zhang, X.; You, J. Recent Progress in High-efficiency Planar-structure Perovskite Solar Cells. Energy Environ. Mater. 2019, 2, 93–106. [Google Scholar] [CrossRef] [Green Version]
  9. Liu, T.; Chen, K.; Hu, Q.; Zhu, R.; Gong, Q. Inverted Perovskite Solar Cells: Progresses and Perspectives. Adv. Energy Mater. 2016, 6, 1600457. [Google Scholar] [CrossRef]
  10. Xu, L.; Chen, X.; Jin, J.; Liu, W.; Dong, B.; Bai, X.; Song, H.; Reiss, P. Inverted perovskite solar cells employing doped NiO hole transport layers: A review. Nano Energy 2019, 63, 103860. [Google Scholar] [CrossRef]
  11. Wang, H.; Yang, F.; Xiang, Y.; Ye, S.; Peng, X.; Song, J.; Qu, J.; Wong, W.-Y. Achieving efficient inverted perovskite solar cells with excellent electron transport and stability by employing a ladder-conjugated perylene diimide dimer. J. Mater. Chem. A 2019, 7, 24191–24198. [Google Scholar] [CrossRef]
  12. Wang, R.; Mujahid, M.; Duan, Y.; Wang, Z.-K.; Xue, J.; Yang, Y. A Review of Perovskites Solar Cell Stability. Adv. Funct. Mater. 2019, 29, 1808843. [Google Scholar] [CrossRef]
  13. Kim, E.-B.; Akhtar, M.S.; Shin, H.-S.; Ameen, S.; Nazeeruddin, M.K. A review on two-dimensional (2D) and 2D-3D multidimensional perovskite solar cells: Perovskites structures, stability, and photovoltaic performances. J. Photochem. Photobiol. C Photochem. Rev. 2021, 100405. [Google Scholar] [CrossRef]
  14. Huang, F.; Li, M.; Siffalovic, P.; Cao, G.; Tian, J. From scalable solution fabrication of perovskite films towards commercialization of solar cells. Energy Environ. Sci. 2019, 12, 518–549. [Google Scholar] [CrossRef]
  15. Chen, D.; Dong, H.; Pang, S.; Zhu, W.; Xi, H.; Lin, Z.; Chang, J.; Zhang, J.; Zhang, C.; Hao, Y. Enhancing material quality and device performance of perovskite solar cells via a facile regrowth way assisted by the DMF/Chlorobenzene mixed solution. Org. Electron. 2019, 70, 300–305. [Google Scholar] [CrossRef]
  16. Du, Y.; Cai, H.; Wen, H.; Wu, Y.; Huang, L.; Ni, J.; Li, J.; Zhang, J. Novel Combination of Efficient Perovskite Solar Cells with Low Temperature Processed Compact TiO2 Layer via Anodic Oxidation. ACS Appl. Mater. Interfaces 2016, 8, 12836–12842. [Google Scholar] [CrossRef] [PubMed]
  17. Marchioro, A.; Teuscher, J.; Friedrich, D.; Kunst, M.; van de Krol, R.; Moehl, T.; Grätzel, M.; Moser, J.-E. Unravelling the mechanism of photoinduced charge transfer processes in lead iodide perovskite solar cells. Nat. Photonics 2014, 8, 250–255. [Google Scholar] [CrossRef]
  18. Kim, T.; Lim, J.; Song, S. Recent Progress and Challenges of Electron Transport Layers in Organic–Inorganic Perovskite Solar Cells. Energies 2020, 13, 5572. [Google Scholar] [CrossRef]
  19. Hu, W.; Yang, S.; Yang, S. Surface Modification of TiO2 for Perovskite Solar Cells. Trends Chem. 2020, 2, 148–162. [Google Scholar] [CrossRef]
  20. Zhou, Y.-Q.; Wu, B.-S.; Lin, G.-H.; Xing, Z.; Li, S.-H.; Deng, L.-L.; Chen, D.-C.; Yun, D.-Q.; Xie, S.-Y. Interfacing Pristine C60 onto TiO2 for Viable Flexibility in Perovskite Solar Cells by a Low-Temperature All-Solution Process. Adv. Energy Mater. 2018, 8, 1800399. [Google Scholar] [CrossRef]
  21. Huang, P.-H.; Huang, C.-W.; Kang, C.-C.; Hsu, C.-H.; Lien, S.-Y.; Wang, N.-F.; Huang, C.-J. The Investigation for Coating Method of Titanium Dioxide Layer in Perovskite Solar Cells. Crystals 2020, 10, 236. [Google Scholar] [CrossRef] [Green Version]
  22. Liu, D.; Li, S.; Zhang, P.; Wang, Y.; Zhang, R.; Sarvari, H.; Wang, F.; Wu, J.; Wang, Z.; Chen, Z.D. Efficient planar heterojunction perovskite solar cells with Li-doped compact TiO2 layer. Nano Energy 2017, 31, 462–468. [Google Scholar] [CrossRef] [Green Version]
  23. Chandiran, A.K.; Yella, A.; Stefik, M.; Heiniger, L.-P.; Comte, P.; Nazeeruddin, M.K.; Grätzel, M. Low-Temperature Crystalline Titanium Dioxide by Atomic Layer Deposition for Dye-Sensitized Solar Cells. ACS Appl. Mater. Interfaces 2013, 5, 3487–3493. [Google Scholar] [CrossRef]
  24. Lee, S.-W.; Bae, S.; Cho, K.; Kim, S.; Hwang, J.-K.; Lee, W.; Lee, S.; Hyun, J.Y.; Lee, S.; Choi, S.B.; et al. Sputtering of TiO2 for High-Efficiency Perovskite and 23.1% Perovskite/Silicon 4-Terminal Tandem Solar Cells. ACS Appl. Energy Mater. 2019, 2, 6263–6268. [Google Scholar] [CrossRef]
  25. Möllmann, A.; Gedamu, D.; Vivo, P.; Frohnhoven, R.; Stadler, D.; Fischer, T.; Ka, I.; Steinhorst, M.; Nechache, R.; Rosei, F.; et al. Highly Compact TiO2 Films by Spray Pyrolysis and Application in Perovskite Solar Cells. Adv. Eng. Mater. 2019, 21, 1801196. [Google Scholar] [CrossRef]
  26. Kavan, L.; O’Regan, B.; Kay, A.; Grätzel, M. Preparation of TiO2 (anatase) films on electrodes by anodic oxidative hydrolysis of TiCl3. J. Electroanal. Chem. 1993, 346, 291–307. [Google Scholar] [CrossRef]
  27. Starowicz, Z.; Gawlińska, K.; Walter, J.; Socha, R.P.; Kulesza-Matlak, G.; Lipiński, M. Extended investigation of sol aging effect on TiO2 electron transporting layer and performances of perovskite solar cells. Mater. Res. Bull. 2018, 99, 136–143. [Google Scholar] [CrossRef]
  28. Qin, J.; Zhang, Z.; Shi, W.; Liu, Y.; Gao, H.; Mao, Y. The optimum titanium precursor of fabricating TiO2 compact layer for perovskite solar cells. Nanoscale Res. Lett. 2017, 12, 640. [Google Scholar] [CrossRef] [Green Version]
  29. Xiao, M.; Huang, F.; Huang, W.; Dkhissi, Y.; Zhu, Y.; Etheridge, J.; Gray-Weale, A.; Bach, U.; Cheng, Y.-B.; Spiccia, L. A fast deposition-crystallization procedure for highly efficient lead iodide perovskite thin-film solar cells. Angew. Chem. Int. Ed. Engl. 2014, 53, 9898–9903. [Google Scholar] [CrossRef] [PubMed]
  30. Sun, W.; Choy, K.-L.; Wang, M. The Role of Thickness Control and Interface Modification in Assembling Efficient Planar Perovskite Solar Cells. Molecules 2019, 24, 3466. [Google Scholar] [CrossRef] [PubMed] [Green Version]
  31. Lu, H.; Ma, Y.; Gu, B.; Tian, W.; Li, L. Identifying the optimum thickness of electron transport layers for highly efficient perovskite planar solar cells. J. Mater. Chem. A 2015, 3, 16445–16452. [Google Scholar] [CrossRef]
  32. Guo, L.; Fei, C.; Zhang, R.; Li, B.; Shen, T.; Tian, J.; Cao, G. Impact of sol aging on TiO2 compact layer and photovoltaic performance of perovskite solar cell. Sci. China Mater. 2016, 59, 710–718. [Google Scholar] [CrossRef] [Green Version]
  33. Mishra, A.; Bhatt, N.; Bajpai, A.K. Chapter 12—Nanostructured superhydrophobic coatings for solar panel applications. In Nanomaterials-Based Coatings; Nguyen Tri, P., Rtimi, S., Ouellet Plamondon, C.M., Eds.; Elsevier: Amsterdam, The Netherlands, 2019; pp. 397–424. [Google Scholar]
  34. Meyerhofer, D. Characteristics of resist films produced by spinning. J. Appl. Phys. 1978, 49, 3993–3997. [Google Scholar] [CrossRef] [Green Version]
  35. Correa-Baena, J.-P.; Saliba, M.; Buonassisi, T.; Grätzel, M.; Abate, A.; Tress, W.; Hagfeldt, A. Promises and challenges of perovskite solar cells. Science 2017, 358, 739–744. [Google Scholar] [CrossRef] [PubMed] [Green Version]
  36. Johnson, P.B.; Christy, R.W. Optical Constants of the Noble Metals. Phys. Rev. B 1972, 6, 4370–4379. [Google Scholar] [CrossRef]
  37. Chang, S.H.; Lin, K.-F.; Chiang, C.-H.; Chen, S.-H.; Wu, C.-G. Plasmonic Structure Enhanced Exciton Generation at the Interface between the Perovskite Absorber and Copper Nanoparticles. Sci. World J. 2014, 2014, 128414. [Google Scholar] [CrossRef]
  38. Chen, H.-A.; Lee, M.-H.; Chen, C.-W. Wavelength-dependent optical transition mechanisms for light-harvesting of perovskite MAPbI3 solar cells using first-principles calculations. J. Mater. Chem. C 2016, 4, 5248–5254. [Google Scholar] [CrossRef]
  39. Casaluci, S.; Cinà, L.; Pockett, A.; Kubiak, P.S.; Niemann, R.G.; Reale, A.; Di Carlo, A.; Cameron, P.J. A simple approach for the fabrication of perovskite solar cells in air. J. Power Sources 2015, 297, 504–510. [Google Scholar] [CrossRef]
  40. Aharon, S.; Dymshits, A.; Rotem, A.; Etgar, L. Temperature dependence of hole conductor free formamidinium lead iodide perovskite based solar cells. J. Mater. Chem. A 2015, 3, 9171–9178. [Google Scholar] [CrossRef]
  41. Reyes-Coronado, D.; Rodríguez-Gattorno, G.; Espinosa-Pesqueira, M.E.; Cab, C.; de Coss, R.; Oskam, G. Phase-pure TiO2 nanoparticles: Anatase, brookite and rutile. Nanotechnology 2008, 19, 145605. [Google Scholar] [CrossRef]
  42. Asemi, M.; Ghanaatshoar, M. Minimizing the charge recombination rate at the FTO/Zn2SnO4 interface by metal oxide semiconductors in DSSCs. J. Mater. Sci. 2018, 53, 7551–7561. [Google Scholar] [CrossRef]
  43. Elumalai, N.K.; Uddin, A. Hysteresis in organic-inorganic hybrid perovskite solar cells. Sol. Energy Mater. Sol. Cells 2016, 157, 476–509. [Google Scholar] [CrossRef]
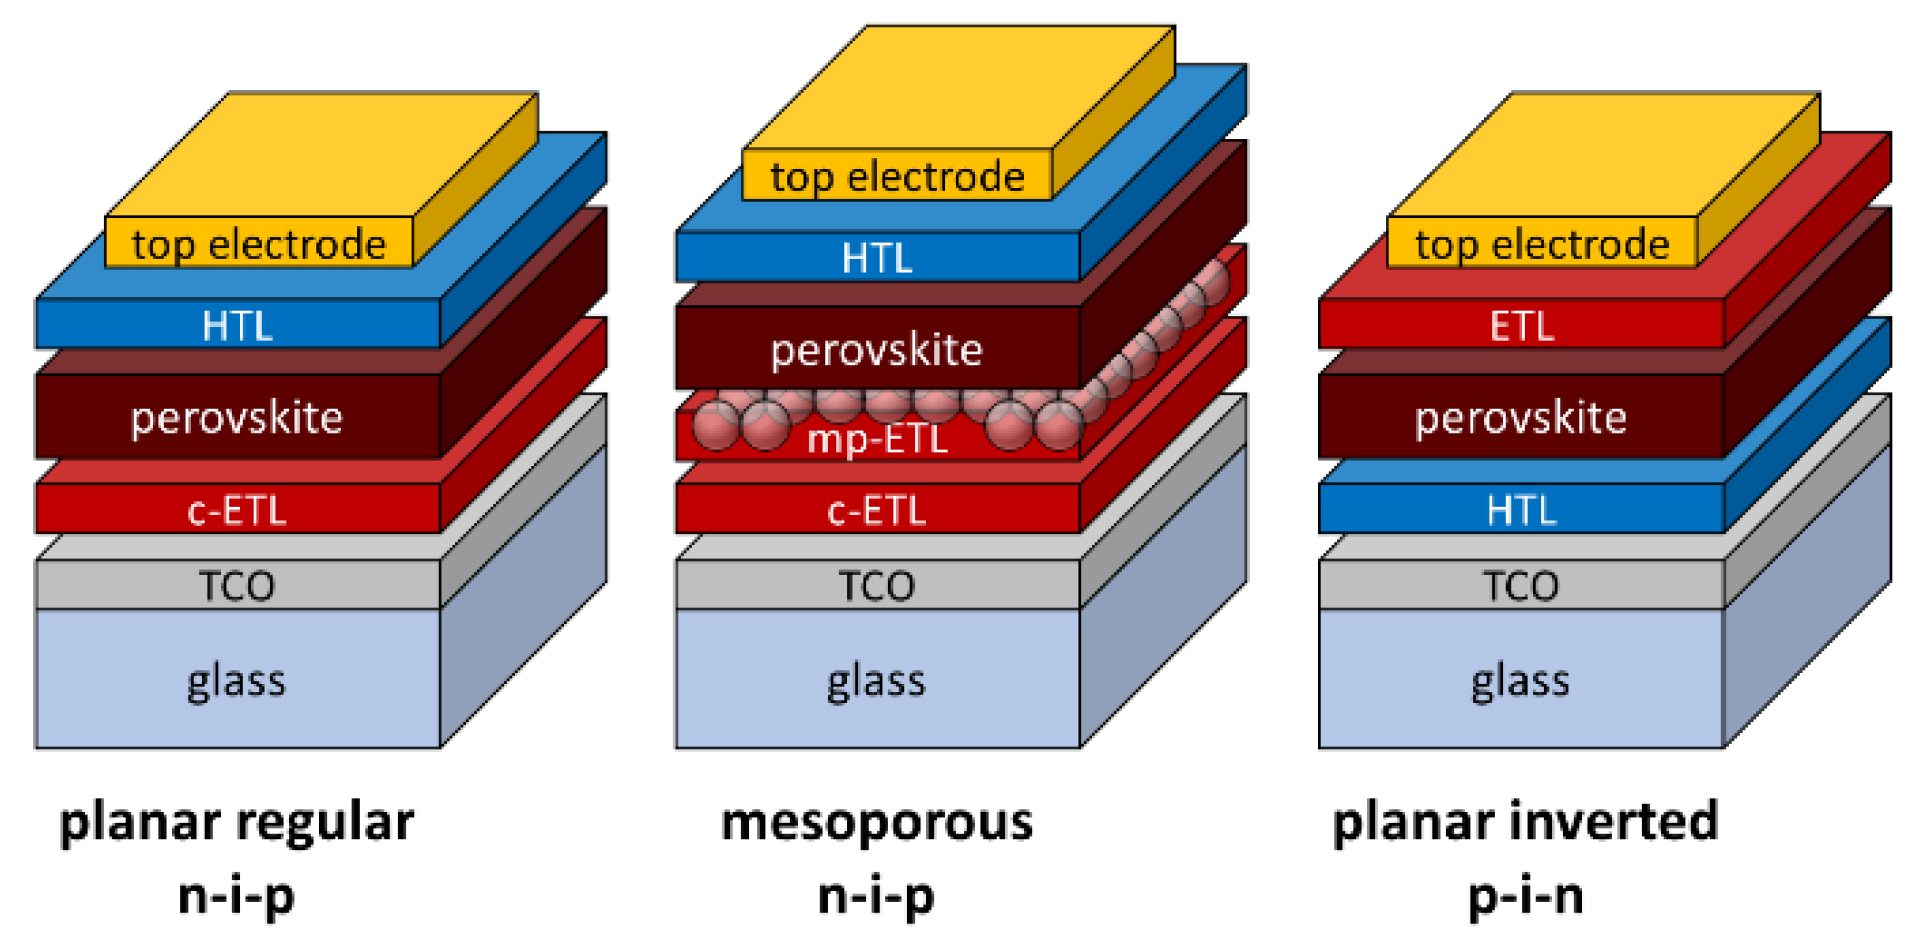
Figure 1. Schemes of the three most common architectures used in PSC technology, from left to right: planar regular (n–i–p), mesoporous (n–i–p) and planar inverted (p–i–n). The devices are composed of glass coated with transparent conductive oxide (TCO), an electron transport layer (ETL), a possibly mesoporous electron transport layer (mp-ETL), the perovskite, a hole transport layer (HTL) and the top electrode.
Materials 14 03295 g001
Figure 2. The dependence of the thickness of the c-TiO2 layer on the spin speed (in 103 revolutions per minute) in the spin-coating process for different concentrations of Ti(acac)2OiPr2 in the 1-BuOH precursor.
Materials 14 03295 g002
Figure 3. (a) Transmittance of glass/FTO/c-TiO2 of different thicknesses obtained from the Ti(acac)2OiPr2 solution in 1-BuOH; (b) the dependence of the effective transmittance on the thickness in glass/FTO/c-TiO2. Effective transmittance Teff was calculated for the range of wavelengths λ from 350 to 800 nm, where T is the transmittance, and Nph is the radiant flux.
Materials 14 03295 g003
Figure 4. The dependence of the root mean square surface roughness (Rq) on the thickness of the c-TiO2 layer deposited on the glass/FTO substrate. It was collated with the selected AFM images of the surface roughness and morphology of the glass/FTO/c-TiO2 substrate, where the sampling area was 2 µm × 2 µm. The color scale for height is also shown.
Materials 14 03295 g004
Figure 5. (a) Influence of the c-TiO2 layer thickness on basic photoelectric parameters: short-circuit current density (JSC), open-circuit voltage (VOC), power conversion efficiency (PCE) and fill factor (FF). (b) Averaged current density–voltage (J–V) curves for the selected cells with different c-TiO2 thicknesses (scan speed = 1V/s, light soaking 10 s before measurement).
Materials 14 03295 g005
Table 1. Average electrical parameters and their standard deviations for MAPbI3 perovskite solar cells with a compact TiO2 layer of different thicknesses (forward scan). The samples are named after the TTDB molar concentration and centrifugation speed.
Sampledc-TiO2 (nm)JSC (mA·cm−2)VOC (mV)FF (−)PCE (%)
Glass/FTO4.2 ± 5.2188 ± 5.160.29 ± 0.040.69 ± 0.80
0.1M_2kRPM9.119.1 ± 0.3891 ± 200.57 ± 0.0211.12 ± 0.62
0.2M_3kRPM15.921.3 ± 0.4892 ± 280.62 ± 0.0313.36 ± 1.23
0.2M_2kRPM19.519.0 ± 0.2949 ± 230.66 ± 0.0213.59 ± 0.63
0.5M_4kRPM36.917.4 ± 0.5947 ± 260.63 ± 0.0211.87 ± 0.61
0.75M_4kRPM59.416.4 ± 0.3906 ± 110.64 ± 0.0110.81 ± 0.22
1M_2kRPM124.213.1 ± 0.3791 ± 430.62 ± 0.037.29 ± 0.88
Publisher’s Note: MDPI stays neutral with regard to jurisdictional claims in published maps and institutional affiliations.