
An Attempt to Track Two Grades of Road Bitumen from Different Plants Using Fourier Transform Infrared Spectroscopy


Abstract
:1. Introduction
2. Materials and Methods
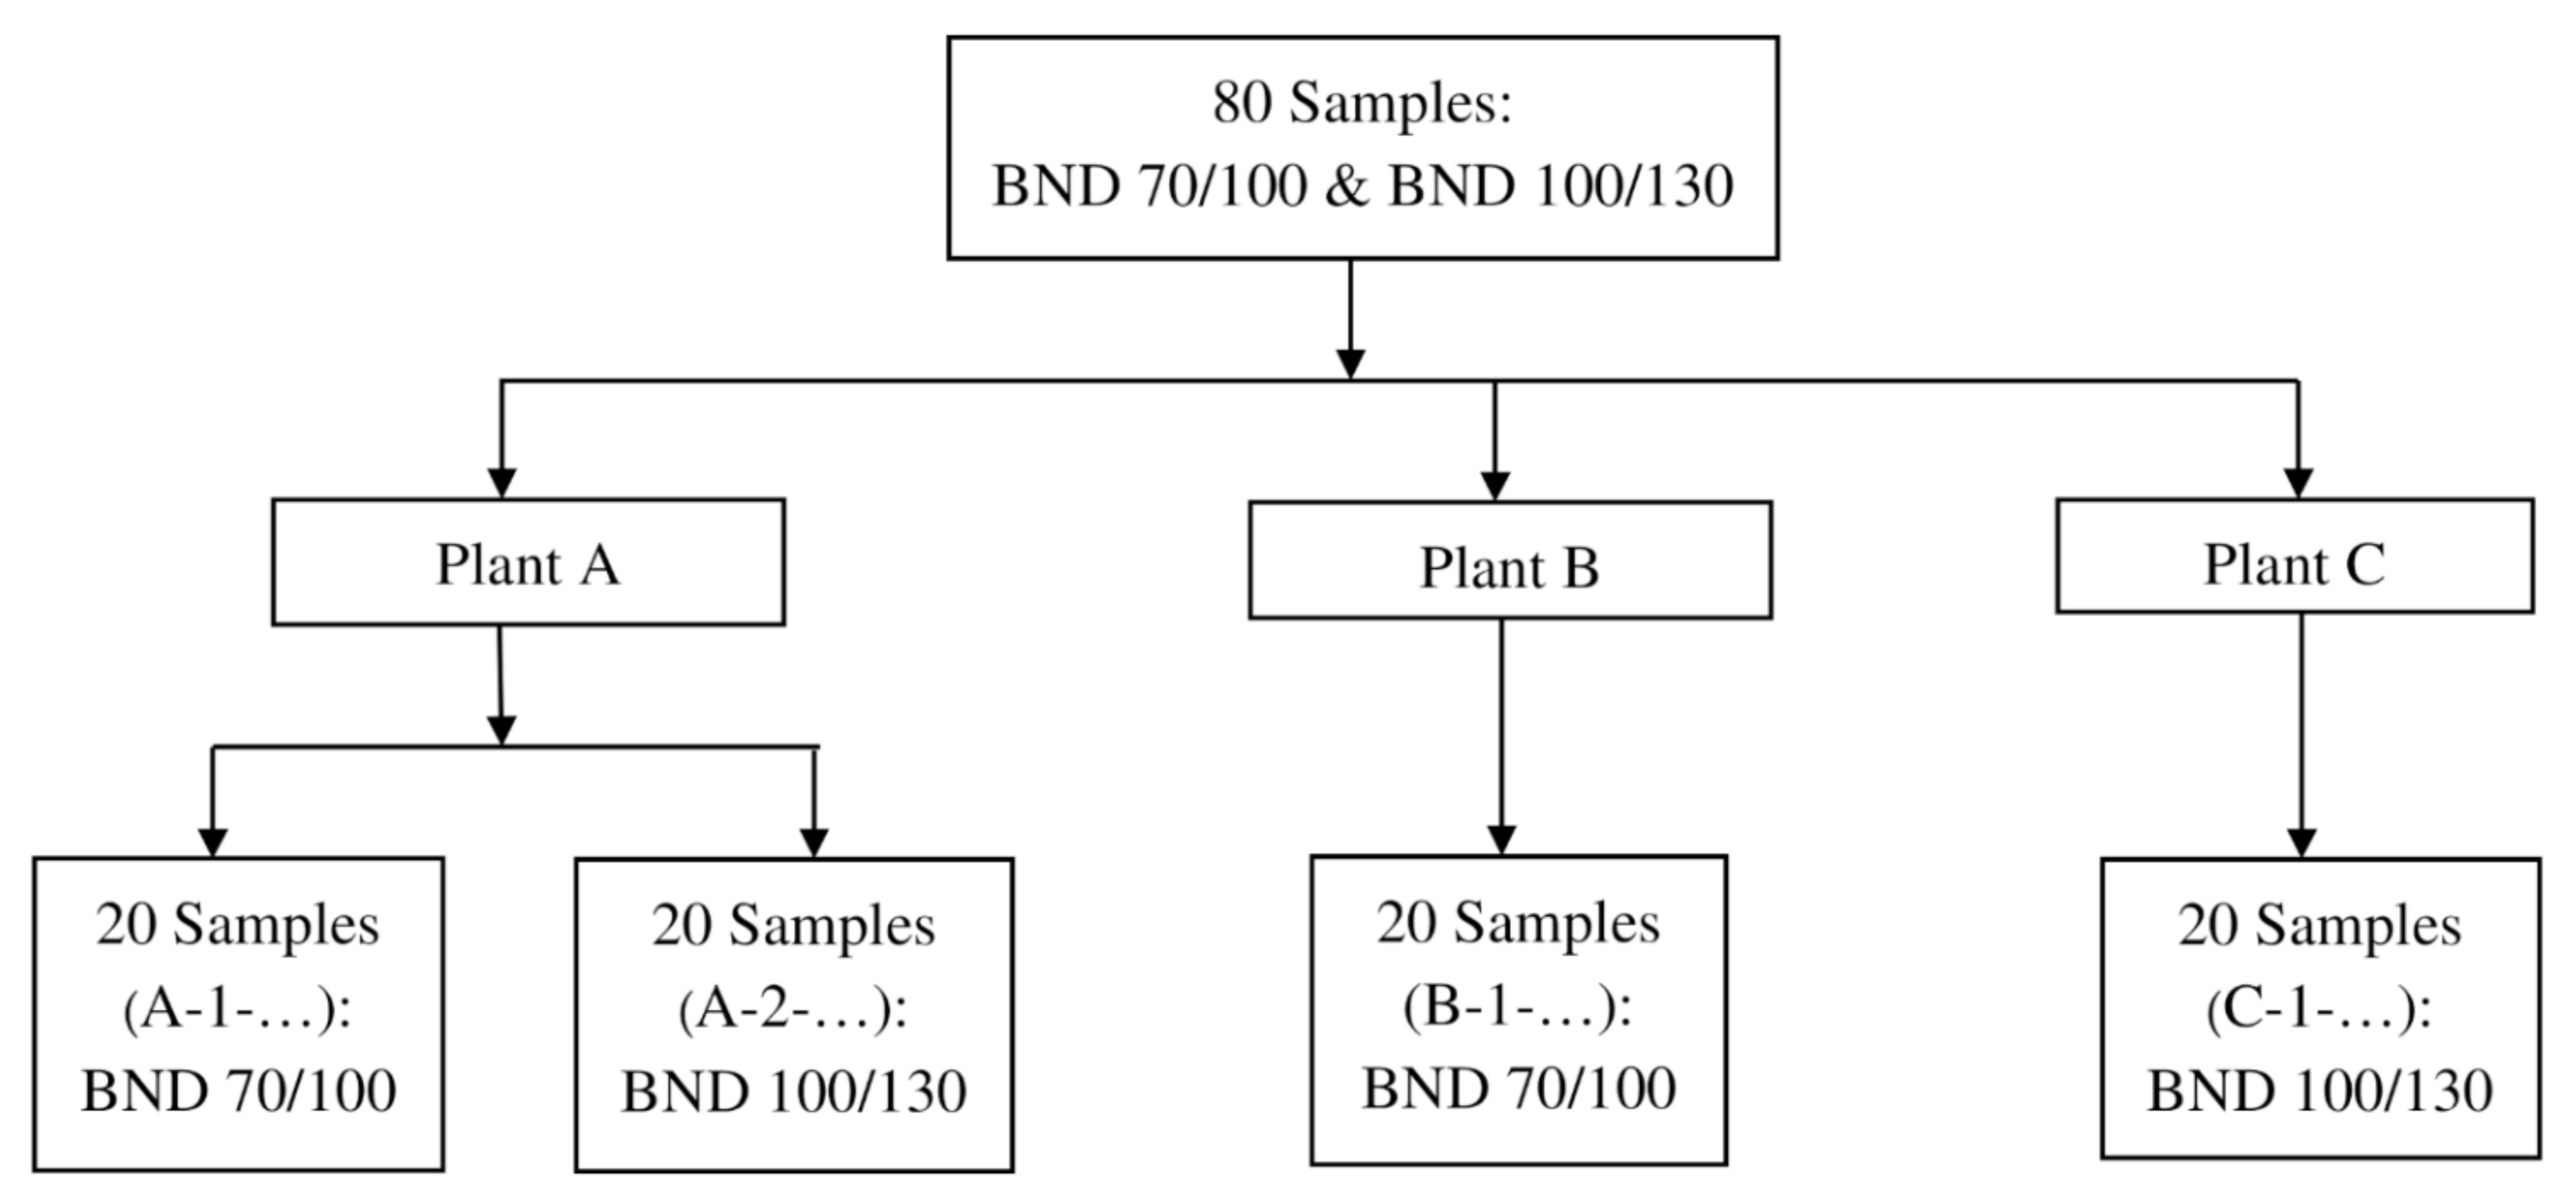
2.1. Materials
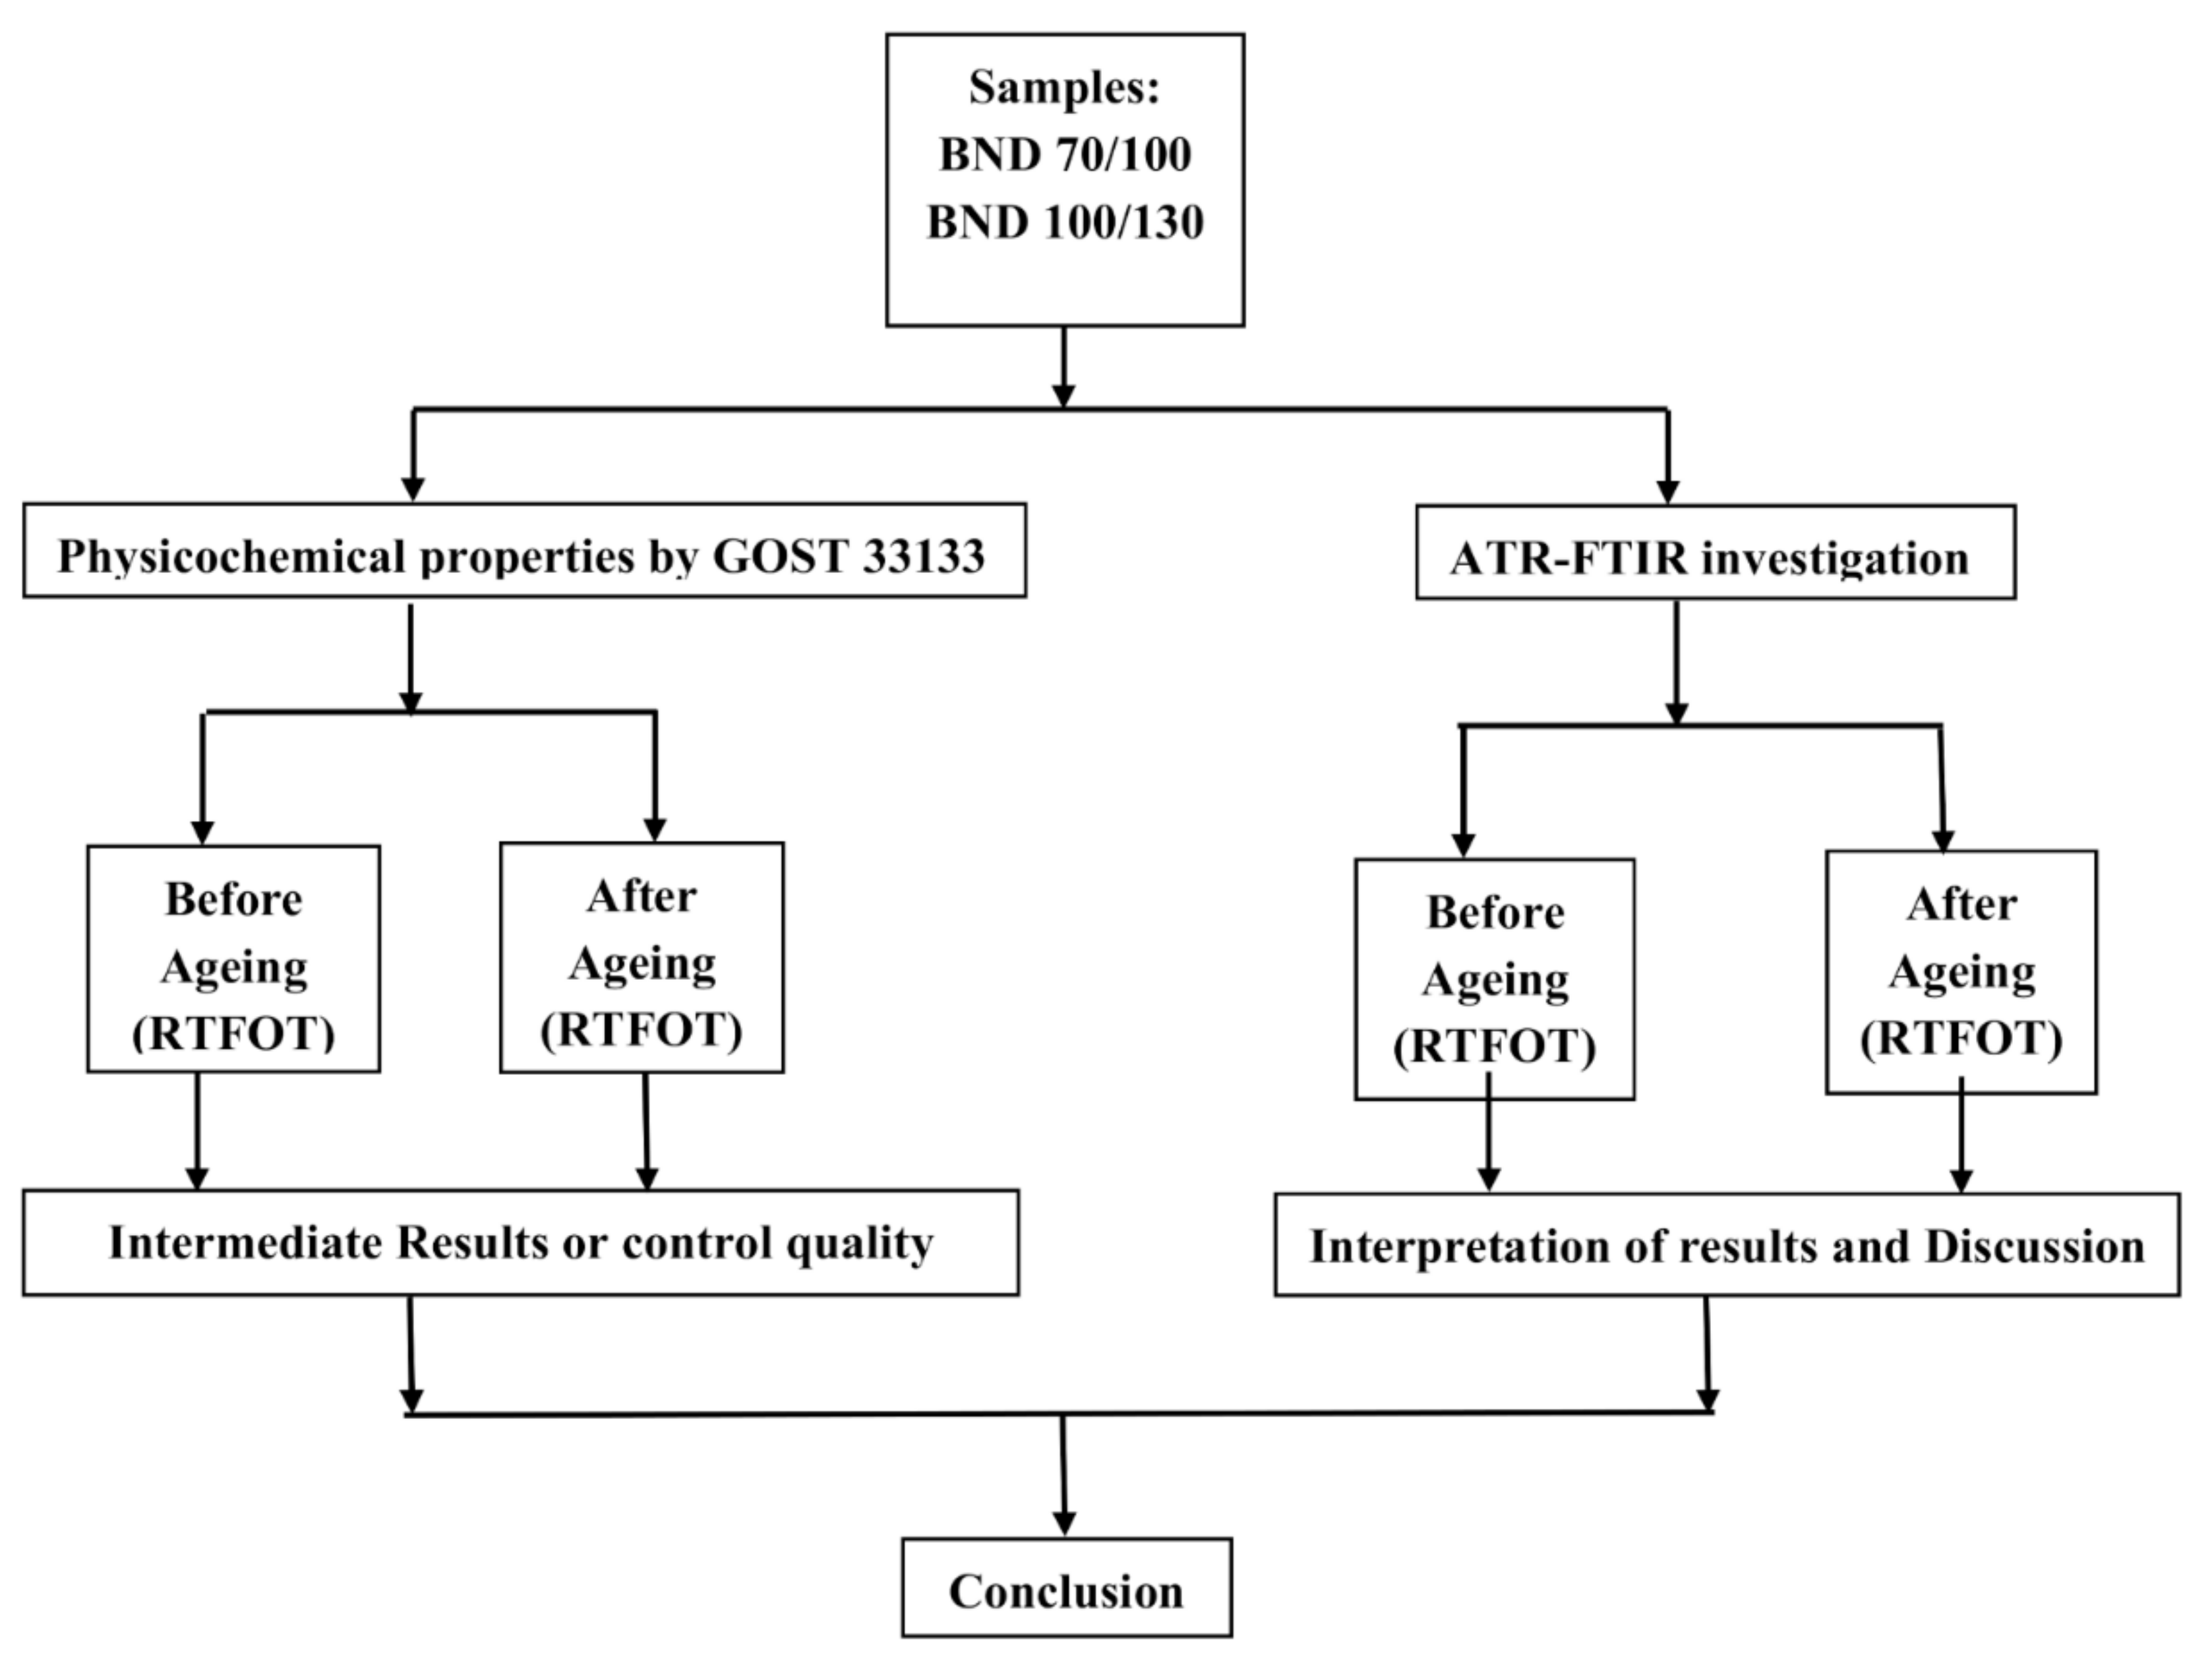
2.2. Methods
2.2.1. Russian Interstate Standards for Road Bitumen: GOST 33133–2014
2.2.2. Infrared Spectroscopy Analysis: ATR-FTIR Spectroscopy
3. Results and Discussions
3.1. Physicochemical Properties of Binder Samples by Plants
- Most of the studied samples had physicochemical properties under GOST 33133 requirements for BNDs 70/100 and 100/130. However, it should be noted that the samples studied here are far from being superior bituminous binders due to the low margin recorded.
- The test results further showed that 45% of the BND 70/100 samples and 60% of the BND 100/130 samples from Plant A did not meet GOST requirements, including “ductility at 0 °C” for BND 70/100 and “mass loss (%) after RTFOT ageing” for BND 100/130. Regarding “ductility at 0 °C” for BND 70/100 from Plant A, five (5) showed failure (crack) since the testing began. Thus, these five (5) measurements were not included in the statistical mean. On the other hand, concerning the property “mass loss (%) after RTFOT ageing” of BND100/130 from plant A, the parameters of the standard deviation/variance coefficient confirmed the remark. However, the arithmetic means of “mass loss (%) after ageing RTFOT” ET 100/130 from plant A was following GOST 33133, as for BAND 70/100 from plant B.
- Regarding the identification or tracking of bituminous binders, it is noted that the “rotational viscosity at 1.5 s−1 and 60 °C, Pa∙s before RTFOT” of the bituminous binder samples from plants A and C was generally less than 200 Pa∙s before RTFOT, and after short-term ageing, less than 500 Pa∙s. On the other hand, the rotational viscosity values of bituminous binders from plant B were close to 400 Pa∙s before RTFOT and 900 Pa∙s after RTFOT.
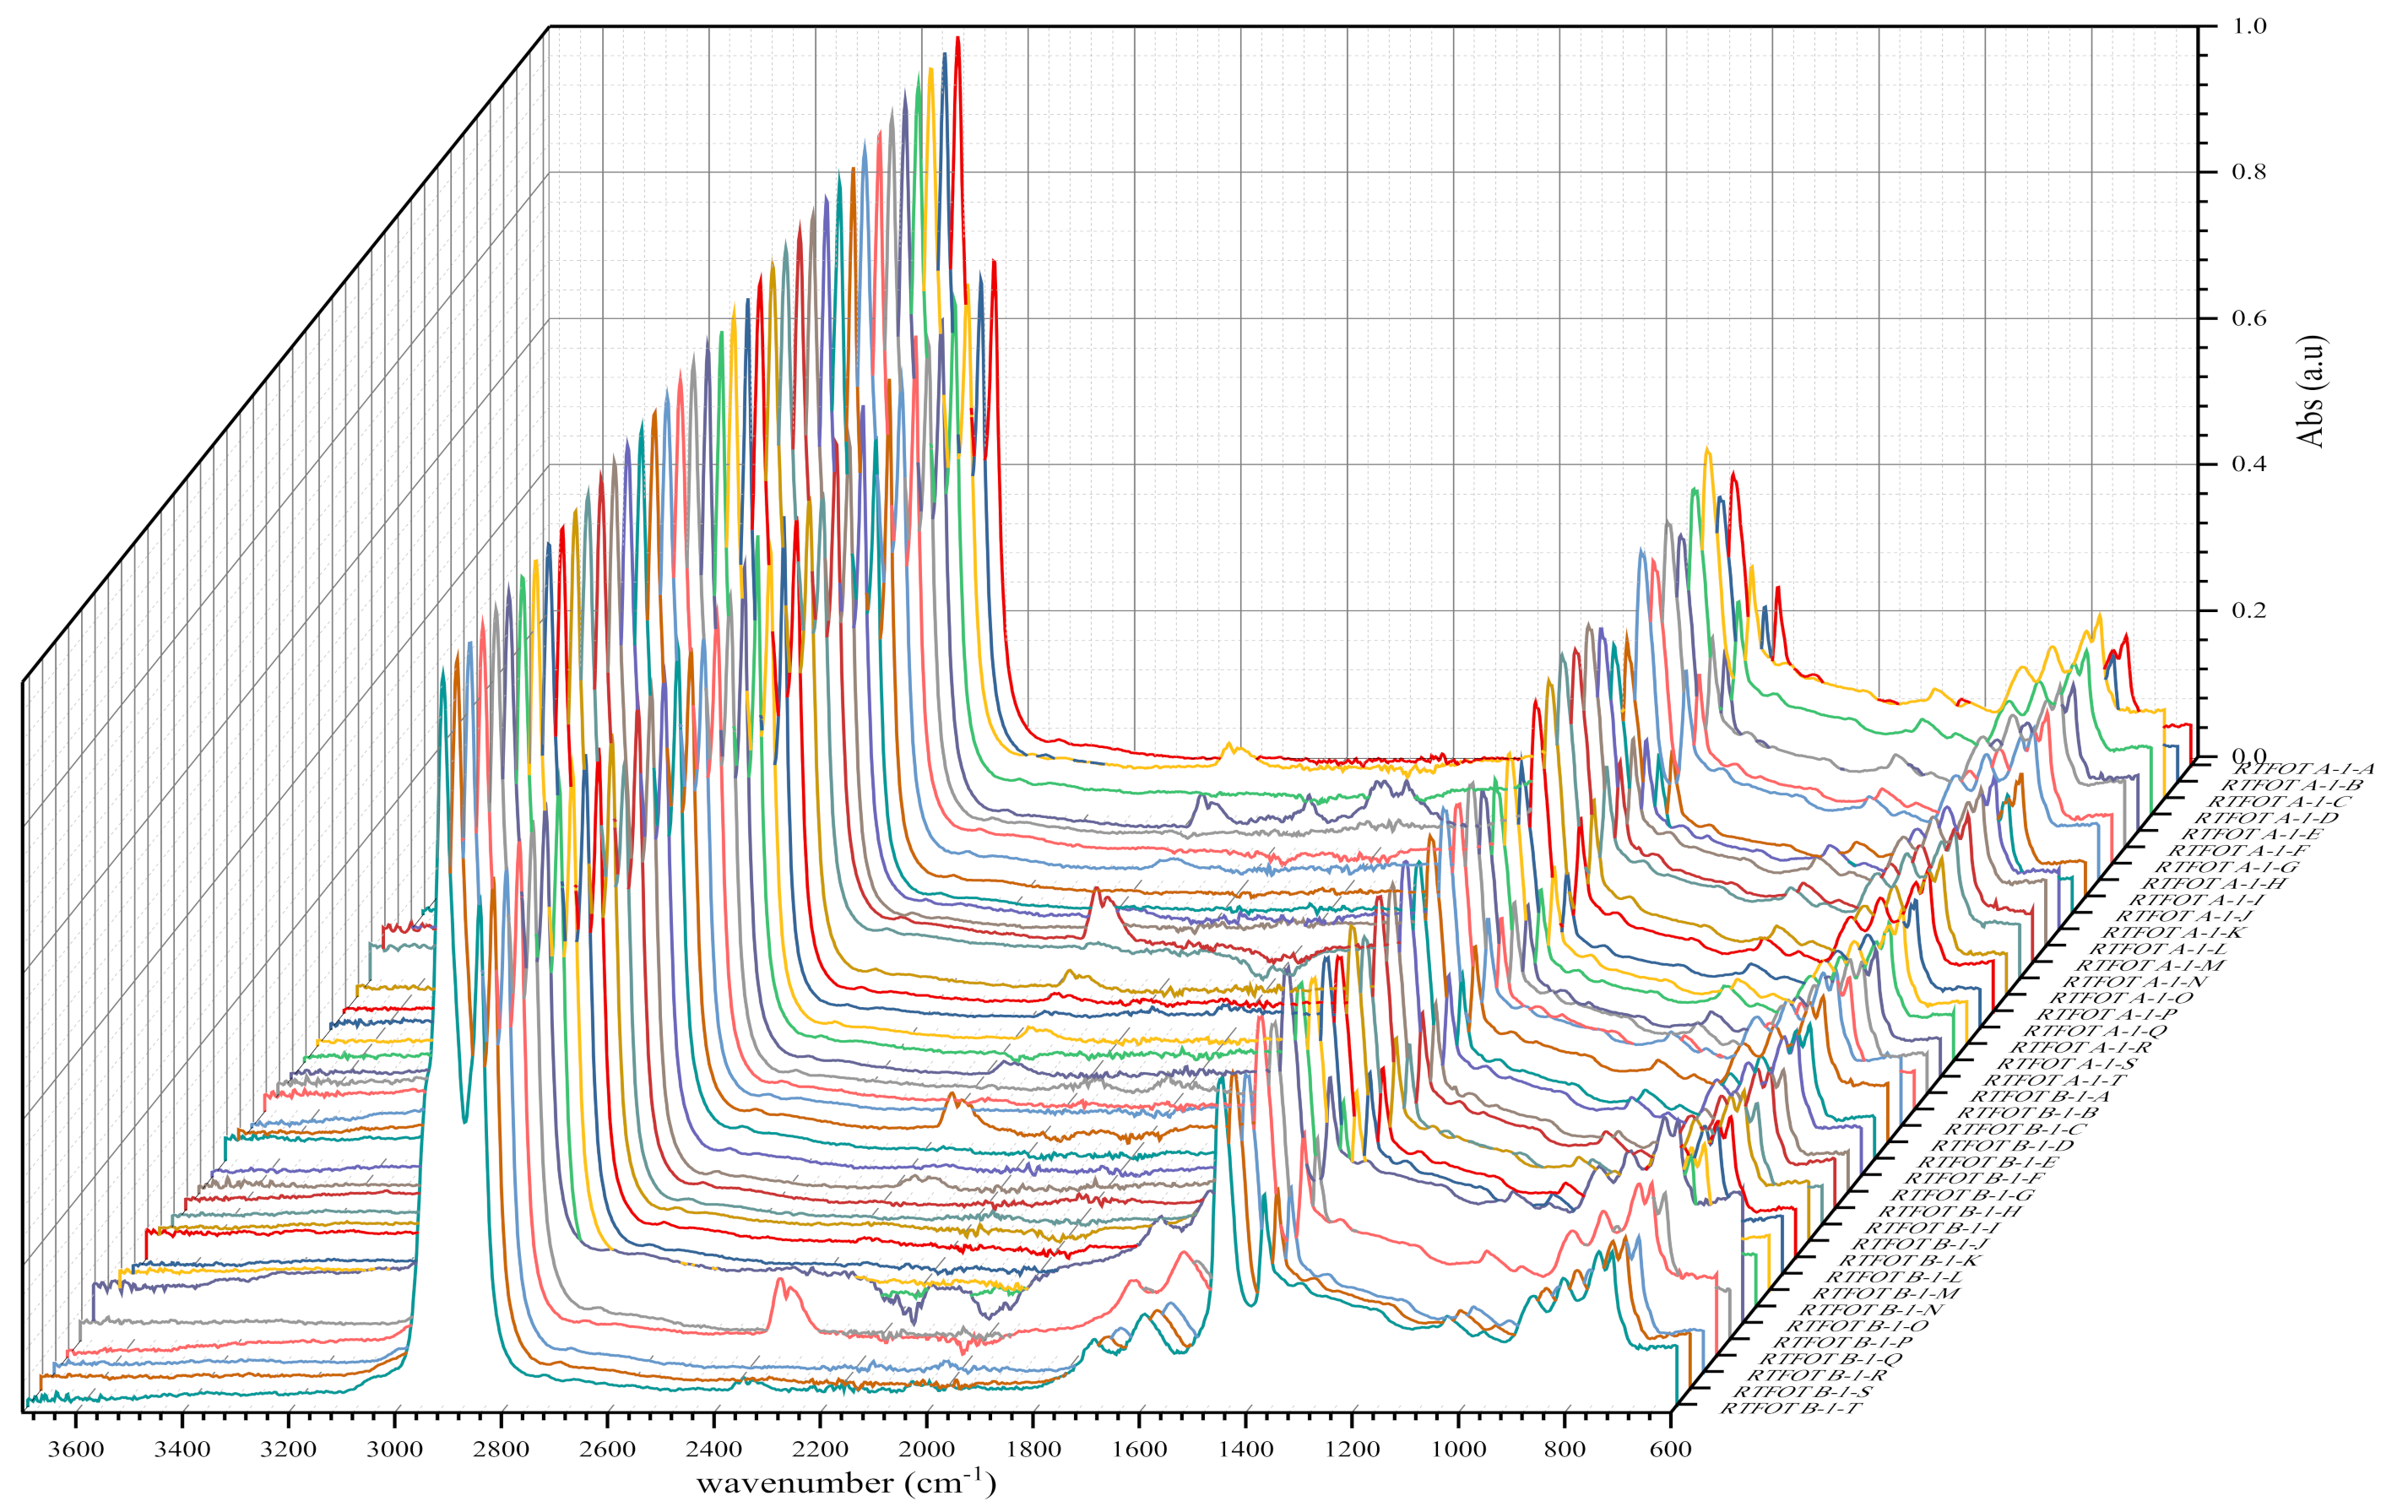
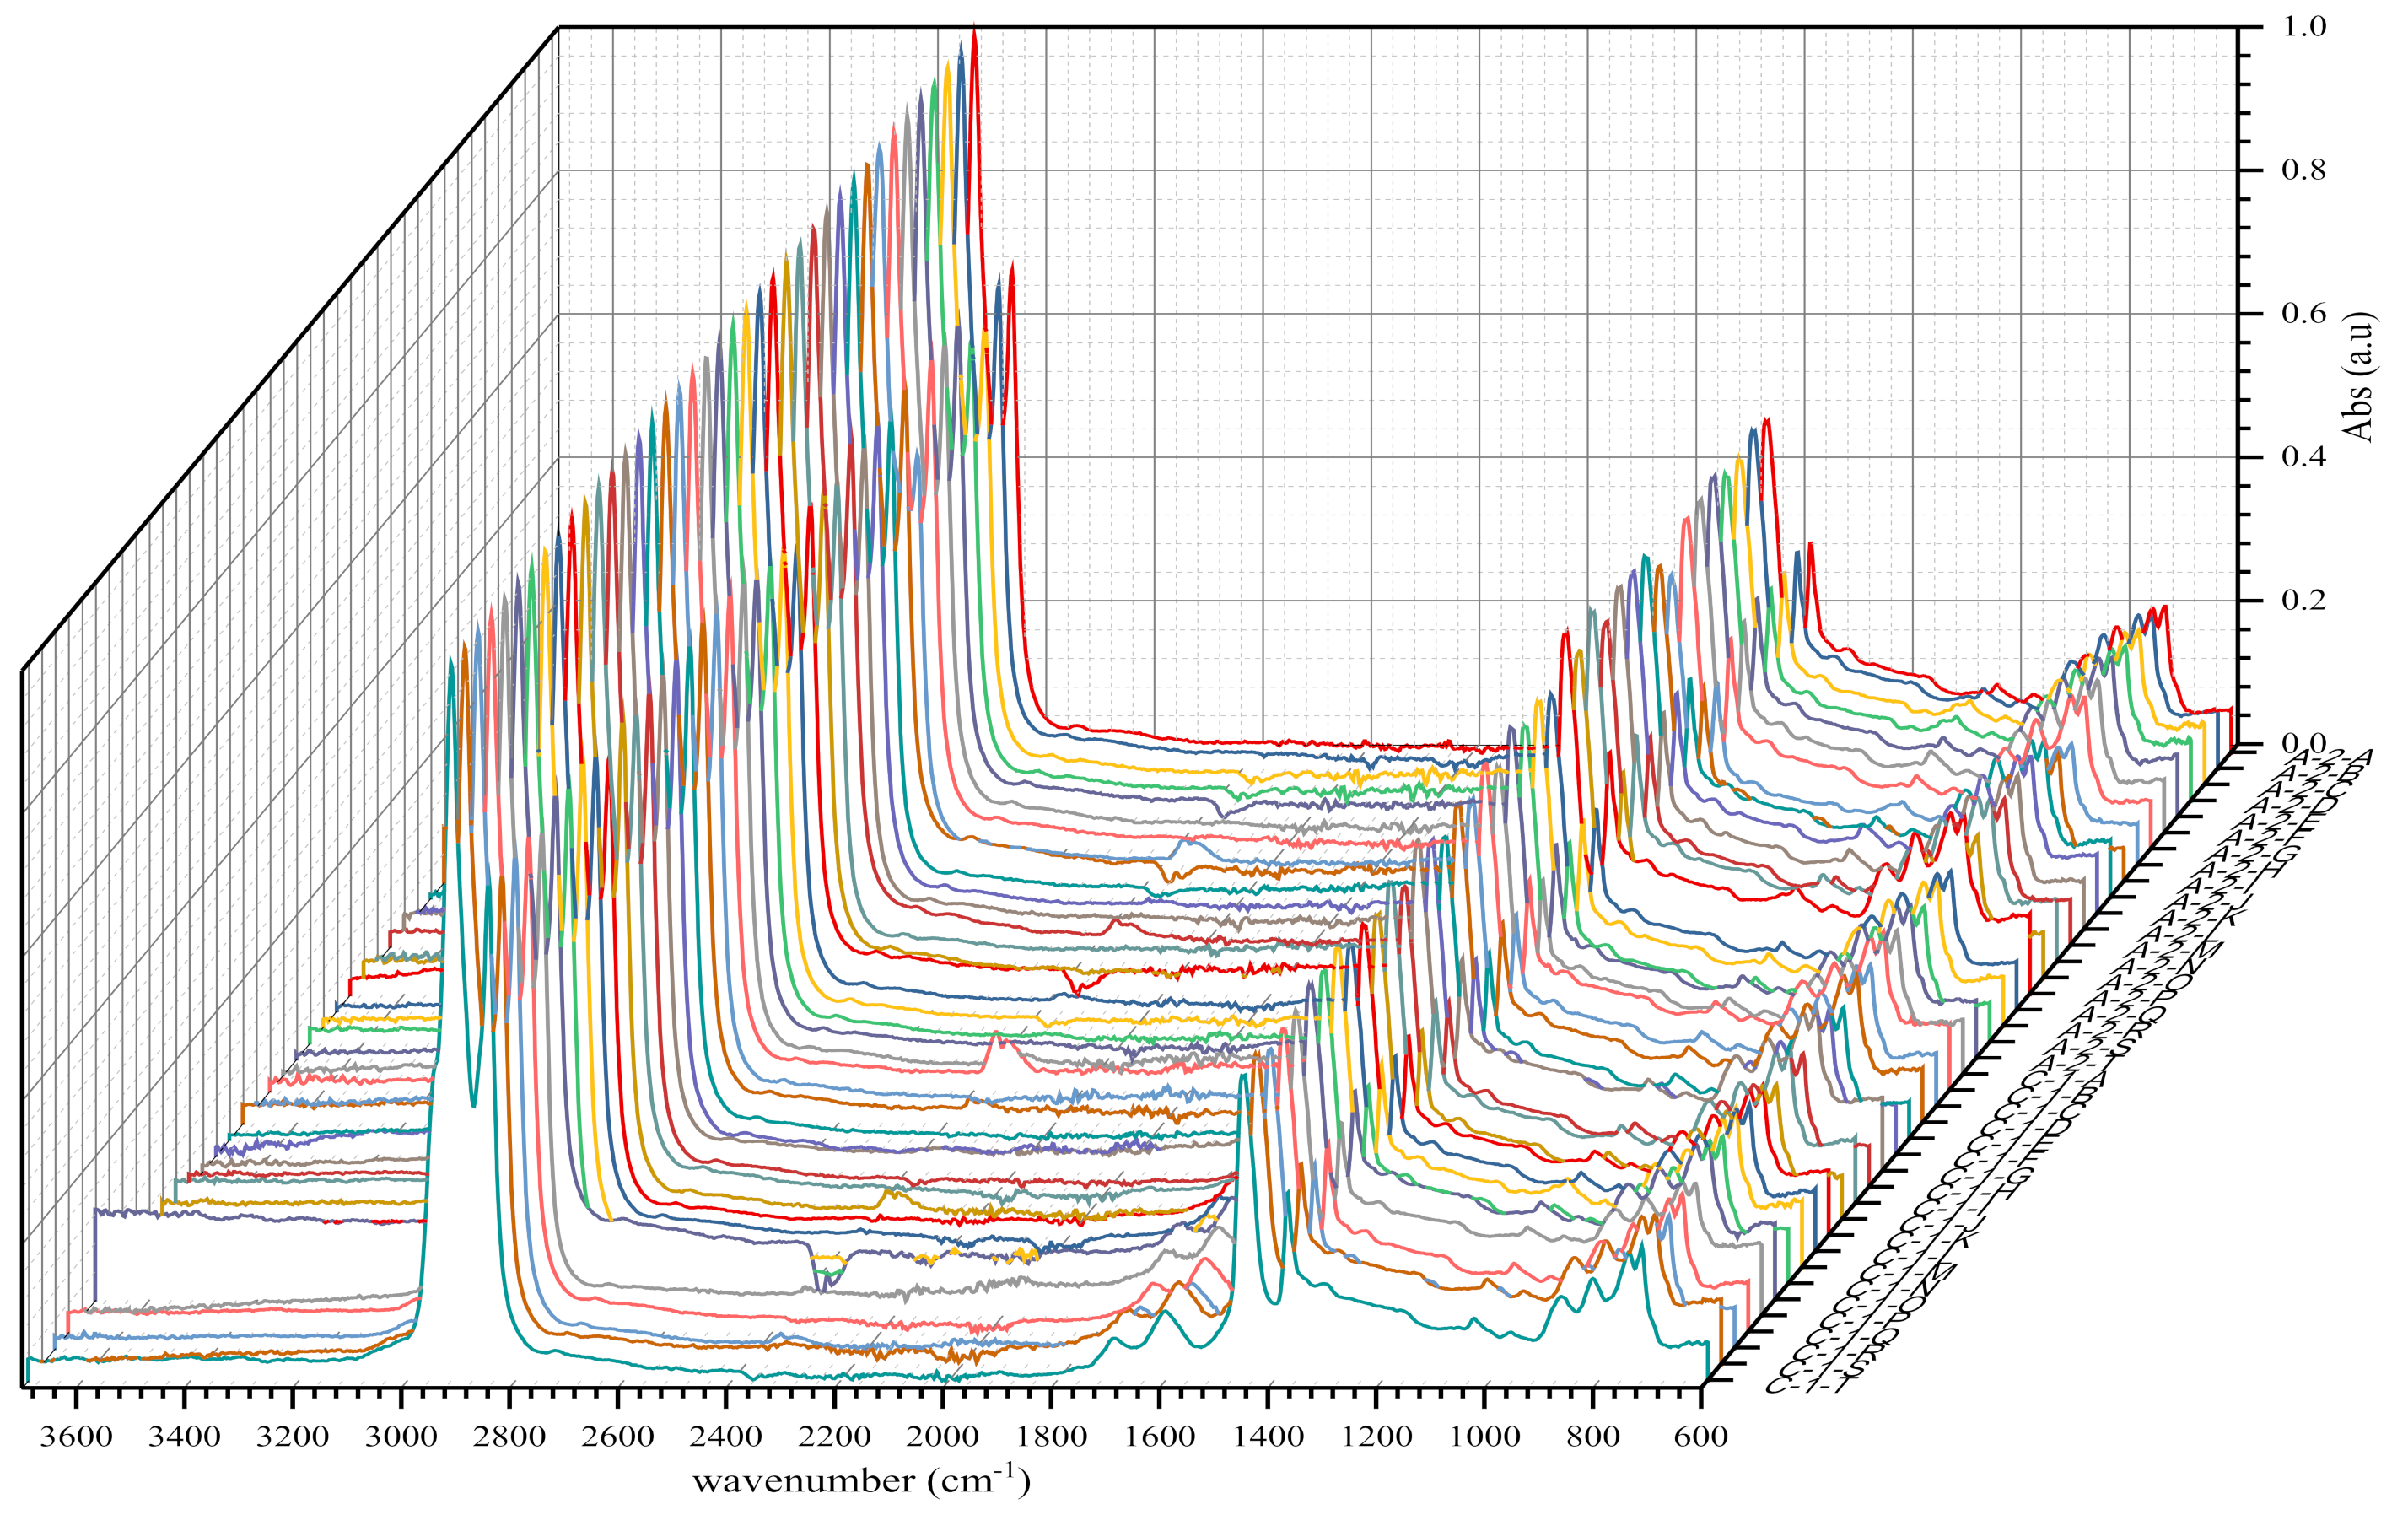
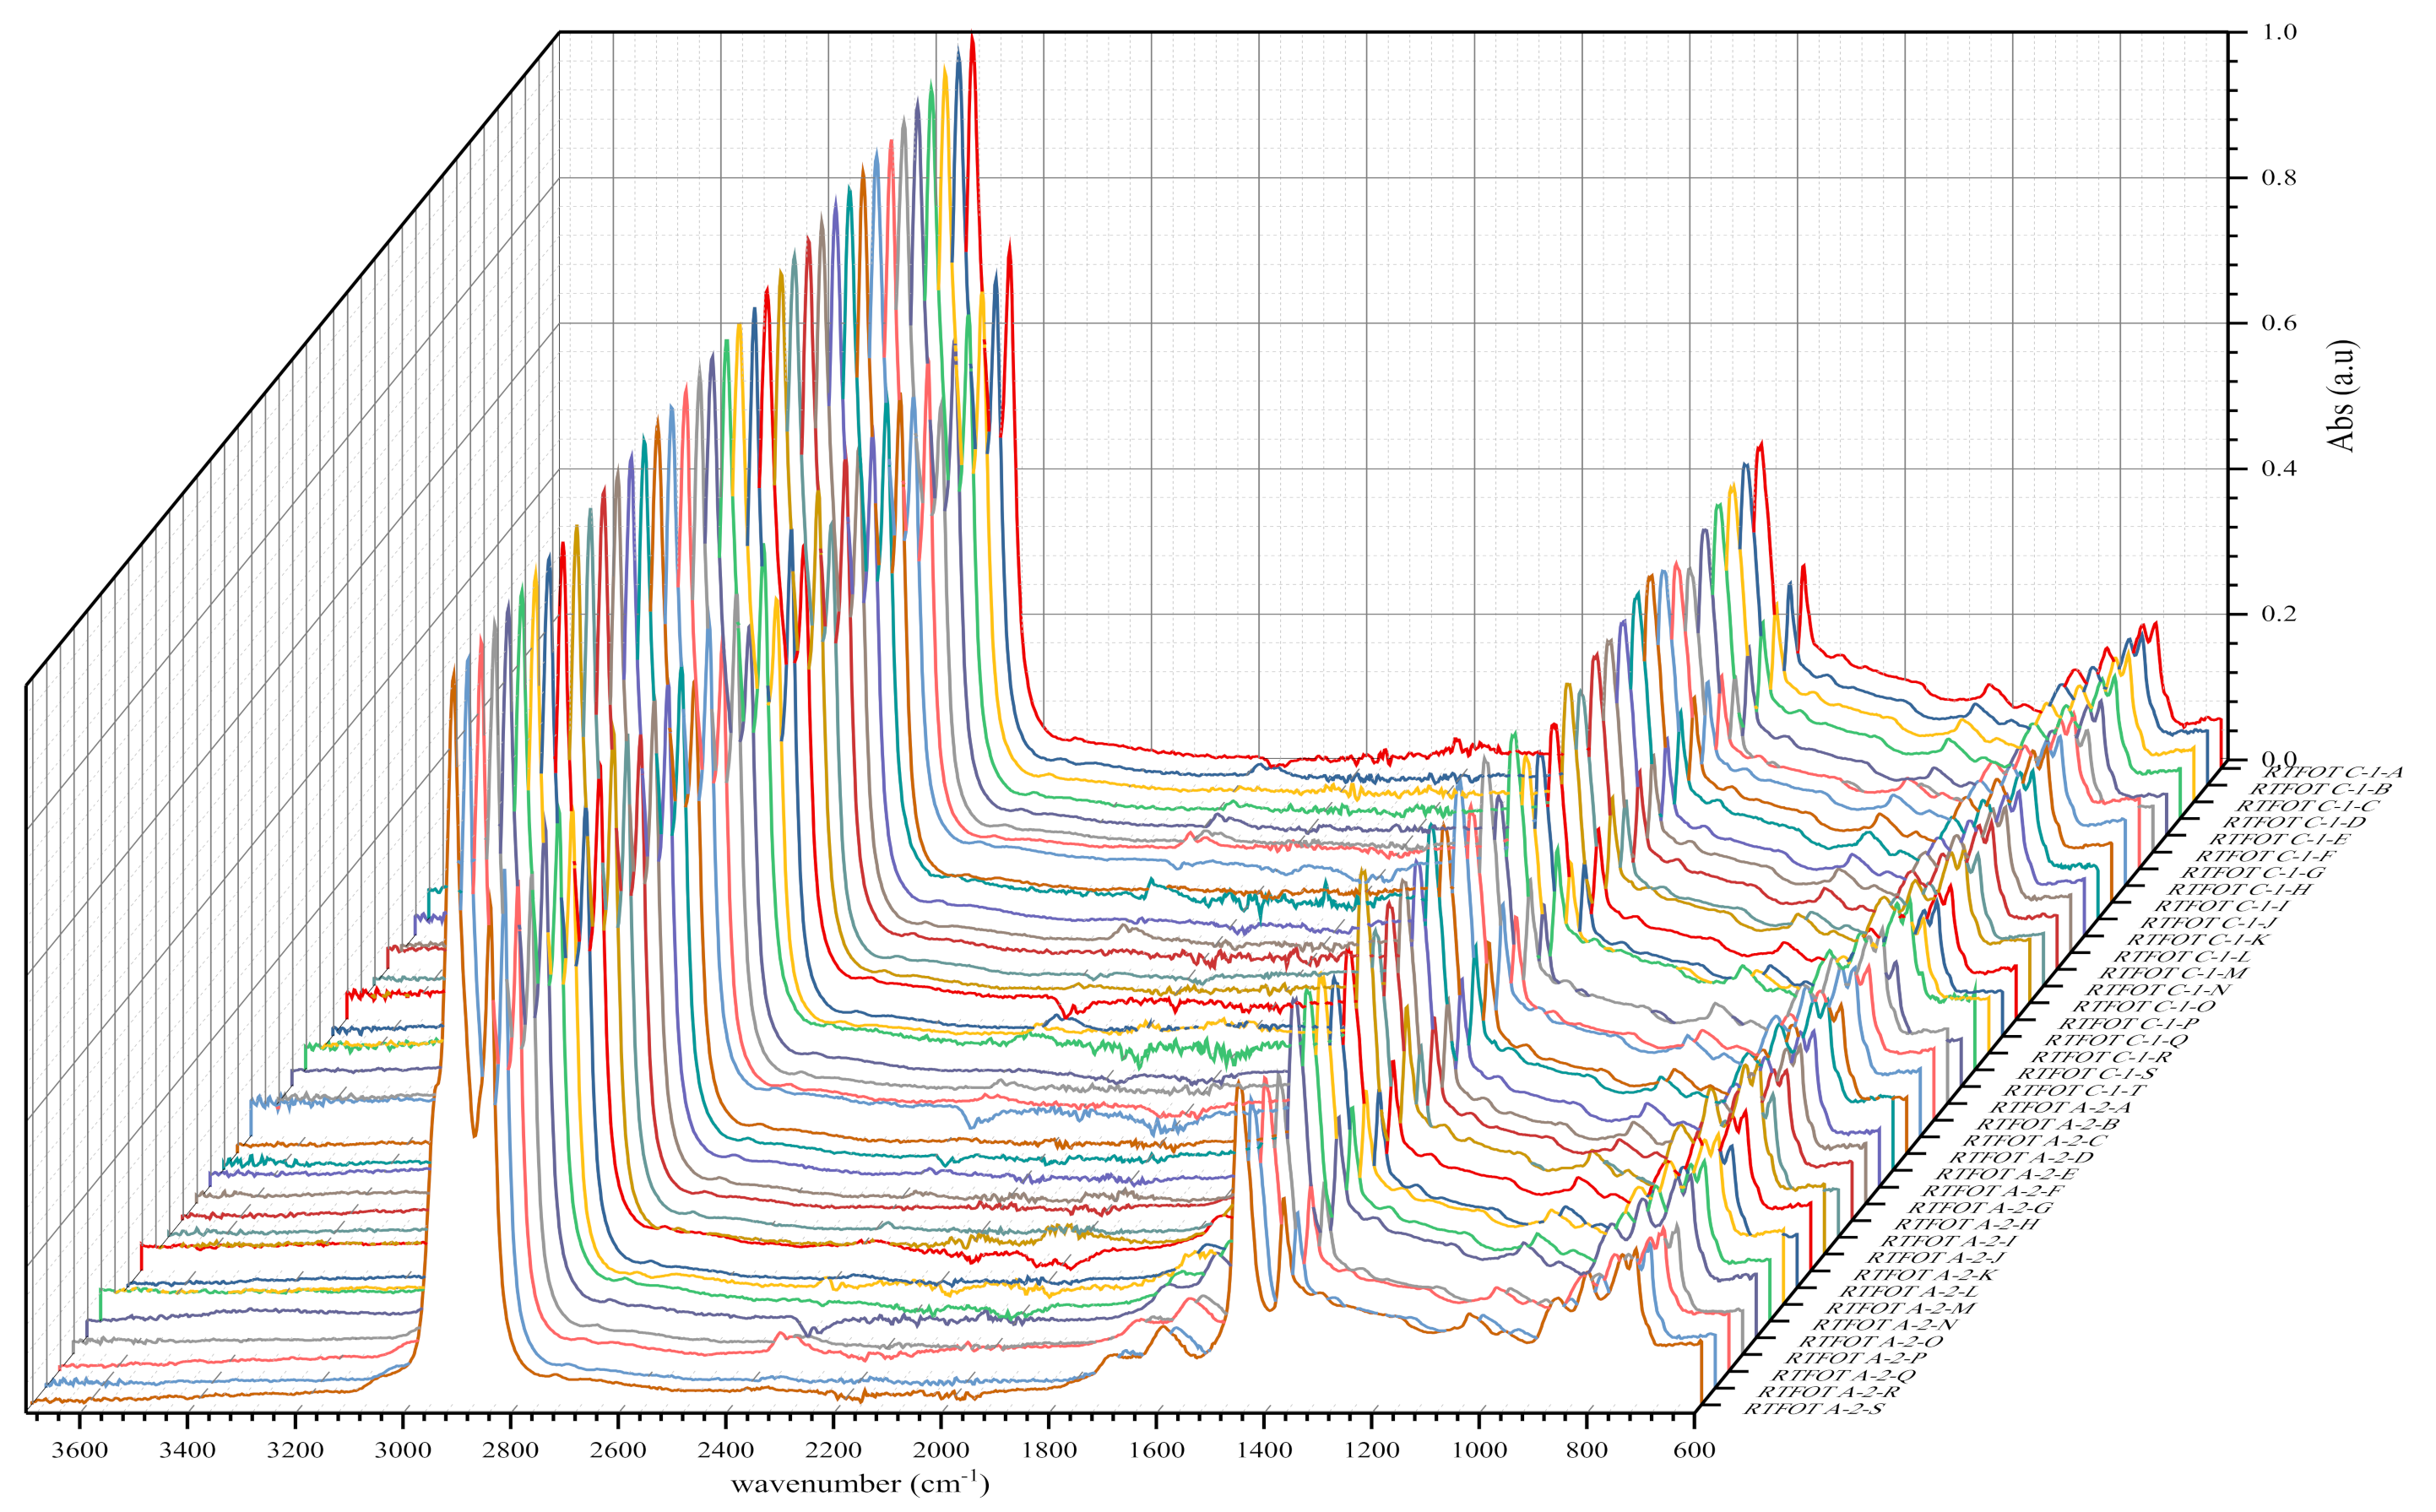
3.2. Results of Fourier-Transform Infrared Spectroscopy Investigation
4. Conclusions
Author Contributions
Funding
Institutional Review Board Statement
Acknowledgments
Conflicts of Interest
Disclaimer
Abbreviations
| ATR-FTIR Spectroscopy | Attenuated Total Reflection Fourier-Transform Infrared Spectroscopy |
| RTFOT | Rolling Thin Film Oven Test |
| GOST | Russian interstate standards |
| BND | Bituminous oil road |
References
- Rudenskaya, I.M.; Rudensky, A.V. Organic Binders for Road Construction; Infra-M: Moscow, Russia, 2010; p. 257. [Google Scholar]
- Kemalov, F.A.; Kemalov, R.A.; Ganieva, T.F. Production of Oxidised Bitumen. Kazan State Technological University: Kazan, Russia, 2010. [Google Scholar]
- Gureev, A.A. Petroleum Binders; Publishing House Nedra, LLC: Moscow, Russia, 2018. [Google Scholar]
- Motamedi, M.; Attar, M.M.; Rostami, M. Performance enhancement of the oxidized bitumen binder using epoxy resin. Prog. Org. Coat. 2017, 102, 178–185. [Google Scholar] [CrossRef]
- Adiko, S.-B.; Gureev, A.A.; Khasanova, N.M.; Sakharov, B.V. Processing of High-Paraffinic vacuum residues by thermocatalytic methods to obtain bitumen. Constr. Build. Mater. 2021, 285, 122880. [Google Scholar] [CrossRef]
- EN. 12591. Bitumen and Bituminous Binders. Specifications for Paving Grade Bitumens; CEN: Brussels, Belgium, 2009; p. 28. [Google Scholar]
- Asi, I.M. Performance evaluation of SUPERPAVE and Marshall asphalt mix designs to suite Jordan climatic and traffic conditions. Constr. Build. Mater. 2007, 21, 1732–1740. [Google Scholar] [CrossRef]
- Djimasbe, R.; Galiullin, E.A.; Varfolomeev, M.A.; Fakhrutdinov, R.Z.; Al-Muntaser, A.A.; Farhadian, A. Experimental study of non-oxidized and oxidized bitumen obtained from heavy oil. Sci. Rep. 2021, 11, 8107. [Google Scholar] [CrossRef] [PubMed]
- Jones, D.S.J. Introduction to Crude Oil and Petroleum Processing. In Handbook of Petroleum Processing; Kokayeff, P., Zink, S., Roxas, P., Eds.; Springer: Berlin, Germany, 2015; pp. 1–39. [Google Scholar]
- Lesueur, D. The colloidal structure of bitumen: Consequences on the rheology and on the mechanisms of bitumen modification. Adv. Colloid Interface Sci. 2009, 145, 42–82. [Google Scholar] [CrossRef] [PubMed]
- Speight, J.G. The Chemistry and Technology of Petroleum; CRC Press: Boca Raton, FL, USA, 2014. [Google Scholar]
- Hunter, R.N.; Self, A.; Read, J. The Shell Bitumen Handbook, 6nd ed.; ICE Publishing: London, UK, 2015; p. 788. [Google Scholar]
- BSI, BS EN 13304. Bitumen and ituminous binders. In Framework for Specification of Oxidized Bitumen; NSAI: Dublin, Ireland, 2009; p. 8. [Google Scholar]
- Yao, H.; Dai, Q.; You, Z. Fourier Transform Infrared Spectroscopy characterization of aging-related properties of original and nano-modified asphalt binders. Constr. Build. Mater. 2015, 101, 1078–1087. [Google Scholar] [CrossRef]
- MNivitha, R.; Prasad, E.; Krishnan, J.M. Ageing in modified bitumen using FTIR spectroscopy. Int. J. Pavement Eng. 2016, 17, 565–577. [Google Scholar] [CrossRef]
- Petersen, J.C. A review of the fundamentals of asphalt oxidation: Chemical, physicochemical, physical property, and durability relationships. Transp. Res. Circ. 2009, 10, 78. [Google Scholar]
- Tauste, R.; Moreno-Navarro, F.; Sol-Sánchez, M.; Rubio-Gámez, M.C. Understanding the bitumen ageing phenomenon: A review. Constr. Build. Mater. 2018, 192, 593–609. [Google Scholar] [CrossRef]
- Cong, P.; Guo, X.; Mei, L. Investigation on rejuvenation methods of aged SBS modified asphalt binder. Fuel 2020, 279, 118556. [Google Scholar] [CrossRef]
- Camargo, I.G.d.N.; Dhia, T.B.; Loulizi, A.; Hofko, B.; Mirwald, J. Anti-aging additives: Proposed evaluation process based on literature review. Road Mater. Pavement Des. 2021, 22, S134–S153. [Google Scholar] [CrossRef]
- Apostolidis, P.; Liu, X.; Erkens, S.; Scarpas, T. Oxidative aging of epoxy asphalt. Int. J. Pavement Eng. 2020, 1–11. [Google Scholar] [CrossRef]
- Weigel, S.; Stephan, D. The prediction of bitumen properties based on FTIR and multivariate analysis methods. Fuel 2017, 208, 655–661. [Google Scholar] [CrossRef]
- Pipintakos, G.; Ching, H.V.; Soenen, H.; Sjövall, P.; Mühlich, U.; van Doorslaer, S.; Varveri, A.; Lu, X. Experimental investigation of the oxidative ageing mechanisms in bitumen. Constr. Build. Mater. 2020, 260, 119702. [Google Scholar]
- Omar, M.A.; Nara, K.R.; Obieglo, A.; Belk, N.; Schalausky, R. Analysis of non-load bearing, 2 component epoxy-adhesive to the hemming process variations; Thermo-Gravimetric, Differential Scanning Calorimetry, and Fourier Transform Infrared Spectroscopy FT-IR analyses. Prog. Org. Coat. 2009, 65, 104–108. [Google Scholar] [CrossRef]
- Tarasevich, B.N. IR Spectra of Basic Classes of Organic Compounds; MSU: Moscow, Russia, 2012; p. 6. [Google Scholar]
- Tarasevich, B.N. Fundamentals of IR Spectroscopy with Fourier Transform. Sample Preparation in IR Spectroscopy; MSU: Moscow, Russia, 2012. [Google Scholar]
- Coates, J. Interpretation of infrared spectra, a practical approach. In Encyclopedia of Analytical Chemistry: Applications, Theory and Instrumentation; John Wiley & Sons, Ltd.: Hoboken, NJ, USA, 2006; pp. 10815–10837. [Google Scholar]
- Moretti, L.; Mandrone, V.; D’Andrea, A.; Caro, S. Comparative “from cradle to gate” life cycle assessments of Hot Mix Asphalt (HMA) materials. Sustainability 2017, 9, 400. [Google Scholar] [CrossRef] [Green Version]
- Hunter, R.N. Bituminous Mixtures in Road Construction, 2nd ed.; Thomas Telford: Telford, UK, 1994; p. 441. [Google Scholar]
- Isenring, T.; Koster, H.; Scazziga, I. Experiences with Porous Asphalt in Switzerland. Transp. Res. Rec 1990, 1265, 41–53. [Google Scholar]
- Gulen, S.G. Regionalization in the world crude oil market. Energy J. 1999, 20, 125–139. [Google Scholar] [CrossRef]
- Nakanishi, T.; Komiyama, R. Supply and Demand Analysis on Petroleum Products and Crude Oils for Asia and the World. IEEJ august 2006, 80. [Google Scholar]
- Abdi, H. Coefficient of variation. Encycl. Res. Des. 2010, 1, 169–171. [Google Scholar]
- Hofko, B.; Alavi, M.Z.; Grothe, H.; Jones, D.; Harvey, J. Repeatability and sensitivity of FTIR ATR spectral analysis methods for bituminous binders. Mater. Struct. 2017, 50, 187. [Google Scholar] [CrossRef] [Green Version]
- Kemalov, R.A.; Kemalov, A.F. Scientific and practical aspects of obtaining bitumen-emulsion mastics. Oil Gas. Technol. 2012, 6, 31–39. [Google Scholar]


| Designation | 100/130 | 70/100 | Test Methods |
|---|---|---|---|
| Indicators | Required Values | ||
| Penetration 0.1 mm at 25 °C | 101–130 | 71–100 | GOST 33136 |
| Softening point by ring and ball method, °C | ≥45 | ≥47 | GOST 33142 |
| Ductility at 0 °C, cm | ≥4.0 | ≥3.7 | GOST 33138 |
| Fraass breaking point, °C | ≤−20 | ≤−18 | GOST 33143 |
| Rotational viscosity at 1.5 s−1 and 60 °C, Pa∙s before RTFOT | - | GOST 33137 | |
| Mass loss (%) after RTFOT ageing | ≤0.7 | ≤0.6 | GOST 33140 |
| Difference in softening point after RTFOT, °C | ≤7 | GOST 33140/ GOST 33142 | |
| Rotational viscosity at 1.5 s−1 and 60 °C after RTFOT ageing, Pa’s | - | GOST 33140/ GOST 33137 | |
| Designation | BND 70/100 from Plant A | |||||||||
|---|---|---|---|---|---|---|---|---|---|---|
| Indicators | A-1-A | A-1-B | A-1-C | A-1-D | A-1-E | A-1-F | A-1-G | A-1-H | A-1-I | A-1-J |
| Penetration 0.1 mm at 25 °C | 80 | 81 | 81 | 80 | 89 | 80 | 73 | 81 | 48 | 73 |
| Softening point by ring and ball method, °C | 48.8 | 47.6 | 47.2 | 48.4 | 48.4 | 48.2 | 49.6 | 47.4 | 48.2 | 50.6 |
| Fraass breaking point, °C | −24 | −23 | −26 | - | −27 | - | - | - | −29.0 | −22 |
| Ductility at 0 °C, cm | 3.50 | crack | 5.60 | 5.20 | 3.20 | 3.80 | crack | 4.70 | 3.90 | 3.20 |
| Rotational viscosity at 1.5 s−1 and 60 °C, Pa∙s before RTFOT | 217.37 | 143.96 | 149.63 | 201.74 | 116.33 | 156.28 | 200.30 | 181.97 | 234.21 | 189.40 |
| Mass loss (%) after RTFOT ageing | 0.04 | 0.04 | 0.07 | 0.05 | 0.04 | 0.04 | 0.02 | 0.07 | 0.05 | 0.04 |
| Difference in softening point after RTFOT, °C | 5.6 | 5.8 | 5.6 | 5.0 | 4.8 | 5.2 | 4.6 | 5.8 | 6.0 | 4.4 |
| Rotational viscosity at 1.5s−1 and 60 °C after RTFOT ageing, Pa∙s | 499.13 | 392.44 | 361.10 | 502.93 | 291.71 | 391.11 | 526.48 | 421.36 | 527.76 | 480.27 |
| Indicators | A-1-K | A-1-L | A-1-M | A-1-N | A-1-O | A-1-P | A-1-Q | A-1-R | A-1-S | A-1-T |
| Penetration 0.1 mm at 25 °C | 81 | 83 | 78 | 69 | 78 | 87 | 66 | 94 | 80 | 90 |
| Softening point by ring and ball method, °C | 50.2 | 51.6 | 49.8 | 48.8 | 47.0 | 47.0 | 49.6 | 47.6 | 48.8 | 48.0 |
| Fraass breaking point, °C | −22 | - | −18 | - | −20 | - | - | −27 | - | - |
| Ductility at 0 °C, cm | 3.80 | 3.10 | 3.90 | 3.90 | crack | 4.60 | crack | 3.80 | crack | 5.00 |
| Rotational viscosity at 1.5 s−1 and 60 °C, Pa∙s before RTFOT | 142.17 | 290.23 | 166.89 | 224.49 | 138.70 | 126.45 | 198.56 | 170.00 | 153.26 | 308.00 |
| Mass loss (%) after RTFOT ageing | 0.05 | 0.04 | 0.07 | 0.03 | 0.06 | 0.07 | 0.05 | 0.07 | 0.04 | 0.07 |
| Difference in softening point after RTFOT, °C | 4.2 | 6.0 | 5.2 | 4.8 | 5.2 | 5.0 | 4.0 | 5.0 | 4.6 | 3.8 |
| Rotational viscosity at 1.5 s−1 and 60 °C after RTFOT ageing, Pa∙s | 376.41 | 773.83 | 456.87 | 587.08 | 386.47 | 332.18 | 615.77 | 316.03 | 359.95 | 292.54 |
| Designation | BND 100/130 from Plant A | |||||||||
|---|---|---|---|---|---|---|---|---|---|---|
| Indicators | A-2-A | A-2-B | A-2-C | A-2-D | A-2-E | A-2-F | A-2-G | A-2-H | A-2-I | A-2-J |
| Penetration 0.1 mm at 25 °C | 117.0 | 121.0 | 105.0 | 125.0 | 111.0 | 110.0 | 111.0 | 118.0 | 120.0 | 114.0 |
| Softening point by ring and ball method, °C | 45.3 | 45.4 | 45.0 | 44.8 | 44.6 | 45.0 | 45.4 | 45.6 | 46.0 | 45.4 |
| Fraass breaking point, °C | −34 | −35 | −25 | −26 | −29 | −30 | −22 | −22 | −29 | −20 |
| Ductility at 0 °C, cm | 4.60 | 5.10 | 4.80 | 4.30 | 5.10 | 5.70 | 4.80 | 4.40 | 4.80 | 4.70 |
| Rotational viscosity at 1.5 s−1 and 60 °C, Pa∙s before RTFOT | 120.30 | 114.50 | 127.90 | 104.68 | 182.60 | 176.90 | 173.20 | 144.88 | 109.00 | 139.70 |
| Mass loss (%) after RTFOT ageing | 0.60 | 0.80 | 0.80 | 0.60 | 0.60 | 0.60 | 0.60 | 0.80 | 0.90 | 0.80 |
| Difference in softening point after RTFOT, °C | 6.9 | 6.8 | 5.8 | 5.4 | 7.2 | 6.2 | 6.1 | 5.8 | 5.6 | 5.2 |
| Rotational viscosity at 1.5s−1 and 60 °C after RTFOT ageing, Pa∙s | 395.60 | 394.60 | 367.10 | 378.06 | 494.10 | 493.00 | 204.40 | 308.42 | 386.80 | 421.70 |
| Indicators | A-2-K | A-2-L | A-2-M | A-2-N | A-2-O | A-2-P | A-2-Q | A-2-R | A-2-S | A-2-T |
| Penetration 0.1 mm at 25 °C | 116.0 | 119.0 | 114.0 | 124.0 | 123.0 | 105.0 | 118.0 | 127.0 | 111.0 | 111.0 |
| Softening point by ring and ball method, °C | 45.6 | 45.2 | 45.4 | 43.6 | 44.4 | 45.4 | 46.0 | 45.2 | 45.6 | 45.2 |
| Fraass breaking point, °C | −31 | −29 | −15 | −27 | −24 | −26 | −18 | −28 | −23 | −27 |
| Ductility at 0 °C, cm | 4.90 | 5.00 | 4.40 | 4.50 | 5.10 | 4.90 | 4.80 | 5.00 | 5.00 | 4.50 |
| Rotational viscosity at 1.5 s−1 and 60 °C, Pa∙s before RTFOT | 168.70 | 150.60 | 141.61 | 137.50 | 136.00 | 137.20 | 154.14 | 119.80 | 132.75 | 131.90 |
| Mass loss (%) after RTFOT ageing | 0.80 | 0.80 | 0.80 | 0.80 | 0.04 | 0.80 | 0.70 | 0.90 | 0.80 | 0.10 |
| Difference in softening point after RTFOT, °C | 6.2 | 7.4 | 6.8 | 8.0 | 6.8 | 6.2 | 6.0 | 6.2 | 6.8 | 6.9 |
| Rotational viscosity at 1.5 s−1 and 60 °C after RTFOT ageing, Pa∙s | 390.90 | 422.30 | 422.14 | 369.50 | 395.10 | 413.60 | 429.62 | 391.23 | 424.27 | 414.00 |
| Designation | BND 70/100 from Plant B | |||||||||
|---|---|---|---|---|---|---|---|---|---|---|
| Indicators | B-1-A | B-1-B | B-1-C | B-1-D | B-1-E | B-1-F | B-1-G | B-1-H | B-1-I | B-1-J |
| Penetration 0.1 mm at 25 °C | 84 | 85 | 81 | 81 | 75 | 75 | 75 | 81 | 81 | 76 |
| Softening point by ring and ball method, °C | 49.2 | 49.4 | 50.2 | 50.6 | 51.0 | 51.0 | 50.4 | 48.5 | 48.8 | 51.0 |
| Fraass breaking point, °C | −34 | - | - | - | - | - | - | - | - | - |
| Ductility at 0 °C, cm | 4.40 | 4.40 | 4.30 | 4.10 | 4.00 | 3.90 | 4.10 | 4.20 | 3.80 | 4.20 |
| Rotational viscosity at 1.5 s−1 and 60 °C, Pa∙s before RTFOT | 351.00 | 357.89 | 412.29 | 390.04 | 423.37 | 420.38 | 418.19 | 346.42 | 350.19 | 447.35 |
| Mass loss (%) after RTFOT ageing | 0.20 | 0.10 | 0.10 | 0.11 | 0.20 | 0.14 | 0.14 | 0.12 | 0.14 | 0.13 |
| Difference in softening point after RTFOT, °C | 7.2 | 6.4 | 6.8 | 7.0 | 6.2 | 4.8 | 6.2 | 7.0 | 6.8 | 7.0 |
| Rotational viscosity at 1.5 s−1 and 60 °C after RTFOT ageing, Pa∙s | 890.70 | 970.34 | 1020.00 | 1041.40 | 925.60 | 971.24 | 1014.90 | 916.44 | 783.70 | 1020,6 |
| Indicators | B-1-K | B-1-L | B-1-M | B-1-N | B-1-O | B-1-P | B-1-Q | B-1-R | B-1-S | B-1-T |
| Penetration 0.1 mm at 25 °C | 83 | 77 | 75 | 80 | 81 | 76 | 78 | 87 | 75 | 74 |
| Softening point by ring and ball method, °C | 49.4 | 51.4 | 51.2 | 49.2 | 49.8 | 51.8 | 49.8 | 48.2 | 50.4 | 51.2 |
| Fraass breaking point, °C | - | −22 | −27 | −33 | −25 | −33 | −22 | −26 | −32 | −28 |
| Ductility at 0 °C, cm | 4.0 | 4.1 | 3.4 | 3.7 | 4.0 | 4.2 | 3.8 | 3.7 | 3.5 | 3.7 |
| Rotational viscosity at 1.5 s−1 and 60 °C, Pa∙s | 399.81 | 431.48 | 400.30 | 385.00 | 353.60 | 431.99 | 407.24 | 275.98 | 456.80 | 461.78 |
| Mass loss (%) after RTFOT ageing | 0.13 | 0.14 | 0.10 | 0.20 | 0.20 | 0.10 | 0.13 | 0.12 | 0.10 | 0.13 |
| Difference in softening point after RTFOT, °C | 7.4 | 6,4 | 6.2 | 6.6 | 7.7 | 5.2 | 6.6 | 6.8 | 7.5 | 7.4 |
| Rotational viscosity at 1.5 s−1 and 60 °C after RTFOT ageing, Pa∙s | 887.56 | 1093.30 | 1051.00 | 925.30 | 929.00 | 951.40 | 1010.40 | 779.45 | 1104.10 | 1141.30 |
| Designation | BND 100/130 from Plant C | |||||||||
|---|---|---|---|---|---|---|---|---|---|---|
| Indicators | C-1-A | C-1-B | C-1-C | C-1-D | C-1-E | C-1-F | C-1-G | C-1-H | C-1-I | C-1-J |
| Penetration 0.1 mm at 25 °C | 106 | 105 | 106 | 106 | 106 | 107 | 106 | 106 | 106 | 106 |
| Softening point by ring and ball method, °C | 45.8 | 45.8 | 45.6 | 46.0 | 45.2 | 46.6 | 45.6 | 45.4 | 45.6 | 45.6 |
| Fraass breaking point, °C | −23 | −22 | −29 | −21 | −28 | −28 | −24 | - | −29 | −26 |
| Ductility at 0 °C, cm | 5.1 | 4.3 | 5.0 | 5.0 | 5.2 | 4.0 | 4.7 | 4.7 | 4.5 | 4.7 |
| Rotational viscosity at 1.5 s−1 and 60 °C, Pa∙s before RTFOT | 193.93 | 196.09 | 173.76 | 184.03 | 185.89 | 179.83 | 194.29 | 180.83 | 192.74 | 206.30 |
| Mass loss (%) after RTFOT ageing | 0.24 | 0.50 | 0.30 | 0.24 | 0.23 | 0.30 | 0.22 | 0.20 | 0.40 | 0.30 |
| Difference in softening point after RTFOT, °C | 5.40 | 7.60 | 5.40 | 4.40 | 6.20 | 5.40 | 5.40 | 5.80 | 6.40 | 5.60 |
| Rotational viscosity at 1.5 s−1 and 60 °C after RTFOT ageing, Pa∙s | 464.28 | 633.70 | 432.36 | 482.35 | 423.77 | 440.85 | 424.14 | 485.03 | 512.17 | 483.56 |
| Indicators | C-1-K | C-1-L | C-1-M | C-1-N | C-1-O | C-1-P | C-1-Q | C-1-R | C-1-S | C-1-T |
| Penetration 0.1 mm at 25 °C | 106 | 106 | 106 | 105 | 108 | 106 | 105 | 105 | 105 | 107 |
| Softening point by ring and ball method, °C | 45.2 | 45.4 | 45.4 | 45.8 | 45.4 | 45.2 | 45.4 | 45.8 | 45.6 | 46.2 |
| Fraass breaking point, °C | −32 | −31 | −29 | −26 | - | −19 | −25 | −23 | −19 | −22 |
| Ductility at 0 °C, cm | 4.3 | 4.5 | 4.4 | 4.7 | 4.8 | 4.8 | 5.0 | 5.0 | 4.4 | 4.5 |
| Rotational viscosity at 1.5 s−1 and 60 °C, Pa∙s before RTFOT | 220.90 | 185.38 | 176.71 | 190.16 | 187.08 | 177.75 | 189.21 | 166.86 | 194.69 | 201.89 |
| Mass loss (%) after RTFOT ageing | 0.20 | 0.22 | 0.30 | 0.21 | 0.23 | 0.30 | 0.30 | 0.23 | 0.30 | 0.22 |
| Difference in softening point after RTFOT, °C | 6.20 | 6.60 | 6.80 | 6.00 | 5.60 | 5.80 | 6.20 | 5.60 | 6.00 | 6.20 |
| Rotational viscosity at 1.5 s−1 and 60 °C after RTFOT ageing, Pa∙s | 526.60 | 472.78 | 491.48 | 415.78 | 449.29 | 463.69 | 464.31 | 447.54 | 448.80 | 527.06 |
| Designation | BND 70/100 | BND 100/130 | ||||||||||
|---|---|---|---|---|---|---|---|---|---|---|---|---|
| Indicators | Plant A (A-1-…) | Plant B (B-1-…) | Plant A (A-2-…) | Plant C (C-1-…) | ||||||||
| Mean | SD | CV | Mean | SD | CV | Mean | SD | CV | Mean | SD | CV | |
| Penetration 0.1 mm at 25 °C | 80 | 9.83 | 12.30 | 79 | 3.91 | 4.95 | 116 | 6.32 | 5.45 | 106 | 0.76 | 0.72 |
| Softening point by ring and ball method, °C | 49 | 9.89 | 20.18 | 50 | 1.04 | 2.08 | 45.2 | 0.55 | 1.22 | 45.6 | 0.35 | 0.77 |
| Fraass breaking point, °C | −24 | 3.46 | 14.41 | −28 | 4.57 | 16.32 | −26 | 5.06 | 19.46 | −25 | 3.96 | 15.61 |
| Ductility at 0 °C, cm | 3 | 0.77 | 25.67 | 4 | 0.28 | 7.00 | 5 | 0.33 | 6.75 | 5 | 0.31 | 6.73 |
| Rotational viscosity at 1.5 s‒1 and 60 °C, Pa∙s before RTFOT | 185.50 | 50.99 | 27.49 | 396.06 | 45.81 | 12.32 | 140.19 | 22.23 | 15.86 | 188.92 | 12.22 | 6.47 |
| Mass loss (%) after RTFOT ageing | 0.05 | 0.01 | 20.00 | 0.09 | 0.19 | 202.33 | 0.68 | 0.27 | 40.00 | 0.27 | 0.02 | 21.30 |
| Difference in softening point after RTFOT, °C | 5.03 | 0.65 | 12.92 | 6.34 | 0.74 | 11.67 | 6.42 | 1.55 | 25.22 | 5.9 | 0.66 | 11.17 |
| Rotational viscosity at 1.5 s‒1 and 60 °C after RTFOT ageing, Pa∙s | 444.57 | 122.12 | 27.47 | 920.36 | 98.11 | 10.65 | 395.82 | 60.70 | 15.34 | 451.26 | 50.82 | 10.70 |
| Peak | Wavenumber (cm−1) | Assignation—Functional Group Components |
|---|---|---|
| 1 | 2960 (±3) | C–H stretch asymmetric (alkyl groups) |
| 2 | 2920 (±3) | C–H stretch asymmetric (alkyl groups) |
| 3 | 2850 (±3) | C–H stretch symmetric (alkyl groups) |
| 4 | 2360 (±3) | Molecules of carbon dioxide (CO2) |
| 5 | 1710 (±3) | C=O stretch (carbonyls groups) |
| 6 | 1600 (±3) | C=C stretch (aromatic structures) |
| 7 | 1455 (±3) | C–H bend (aliphatic structures) |
| 8 | 1375 (±3) | C–H bend (aliphatic structures) |
| 9 | 1320 (±3) | C–O stretch (carbonyls groups) |
| 10 | 1030 (±3) | S=O stretch (sulphoxide structures) |
| 11 | 1160 (±3) | C–O stretch (Ether and oxy compound group) |
| 12 | 885 (±3) | R4–C6H2 tetra substituted /R5–C6 H Penta substituted (aromatic structures) |
| 13 | 815 (±3) | C–H bend1,4-disubstituted or 1,2,3,4-tetrasubstituted |
| 14 | 750 (±3) | C=CH bend adjacent out of a plane (aromatic structures) |
| 15 | 720 (±3) | C-H bend rocking (long chains) |
| BND 70/100 from Plant A | ||||||||||||||
|---|---|---|---|---|---|---|---|---|---|---|---|---|---|---|
| Spectrometry indices | A-1-A | RTFOT A-1-A | A-1-B | RTFOT A-1-B | A-1-C | RTFOT A-1-C | A-1-D | RTFOT A-1-D | A-1-E | RTFOT A-1-E | A-1-F | RTFOT A-1-F | ||
| Aromaticity indices | 0.449 | 0.468 | 0.457 | 0.465 | 0.442 | 0.543 | 0.481 | 0.525 | 0.471 | 0.392 | 0.441 | 0.498 | ||
| Oxidation indices | 0.076 | 0.084 | 0.059 | 0.079 | 0.069 | 0.171 | 0.100 | 0.147 | 0.092 | 0.065 | 0.071 | 0.130 | ||
| Isomerisation indices | 0.614 | 0.614 | 0.622 | 0.616 | 0.619 | 0.666 | 0.636 | 0.655 | 0.632 | 0.618 | 0.617 | 0.646 | ||
| Aliphaticity indices | 5.247 | 5.068 | 5.316 | 5.127 | 5.421 | 4.172 | 5.039 | 4.383 | 4.977 | 5.739 | 5.500 | 4.615 | ||
| Sulphurisation indices | 0.207 | 0.231 | 0.174 | 0.217 | 0.194 | 0.316 | 0.223 | 0.295 | 0.221 | 0.227 | 0.238 | 0.288 | ||
| Asphaltenes indices | 0.361 | 0.365 | 0.348 | 0.359 | 0.355 | 0.398 | 0.369 | 0.386 | 0.365 | 0.358 | 0.352 | 0.376 | ||
| BND 70/100 from plant A | ||||||||||||||
| Spectrometry indices | A-1-G | RTFOT A-1-G | A-1-H | RTFOT A-1-H | A-1-I | RTFOT A-1-I | A-1-J | RTFOT A-1-J | A-1-K | RTFOT A-1-K | A-1-L | RTFOT A-1-L | A-1-M | RTFOT A-1-M |
| Aromaticity indices | 0.454 | 0.439 | 0.475 | 0.505 | 0.461 | 0.371 | 0.450 | 0.392 | 0.437 | 0.461 | 0.461 | 0.507 | 0.445 | 0.448 |
| Oxidation indices | 0.073 | 0.112 | 0.086 | 0.110 | 0.086 | 0.074 | 0.066 | 0.065 | 0.048 | 0.114 | 0.074 | 0.128 | 0.063 | 0.081 |
| Isomerisation indices | 0.625 | 0.628 | 0.622 | 0.639 | 0.637 | 0.578 | 0.620 | 0.592 | 0.607 | 0.631 | 0.621 | 0.648 | 0.620 | 0.601 |
| Aliphaticity indices | 5.460 | 5.122 | 5.059 | 4.699 | 5.125 | 5.890 | 5.435 | 5.933 | 5.611 | 4.837 | 5.330 | 4.575 | 5.386 | 5.230 |
| Sulphurisation indices | 0.221 | 0.252 | 0.205 | 0.257 | 0.219 | 0.218 | 0.190 | 0.207 | 0.170 | 0.282 | 0.186 | 0.280 | 0.188 | 0.231 |
| Asphaltenes indices | 0.365 | 0.364 | 0.361 | 0.375 | 0.371 | 0.359 | 0.352 | 0.362 | 0.343 | 0.371 | 0.345 | 0.386 | 0.353 | 0.359 |
| BND 70/100 from plant A | ||||||||||||||
| Spectrometry indices | A-1-N | RTFOT A-1-N | A-1-O | RTFOT A-1-O | A-1-P | RTFOTA-1-P | A-1-Q | RTFOT A-1-Q | A-1-R | RTFOT- A-1-R | A-1-S | RTFOT A-1-S | A-1-T | RTFOT A-1-T |
| Aromaticity indices | 0.503 | 0.434 | 0.476 | 0.511 | 0.468 | 0.577 | 0.456 | 0.477 | 0.430 | 0.453 | 0.532 | 0.431 | 0.515 | 0.425 |
| Oxidation indices | 0.133 | 0.109 | 0.090 | 0.110 | 0.086 | 0.150 | 0.070 | 0.080 | 0.067 | 0.087 | 0.107 | 0.104 | 0.070 | 0.075 |
| Isomerisation indices | 0.645 | 0.614 | 0.634 | 0.642 | 0.630 | 0.655 | 0.619 | 0.623 | 0.623 | 0.627 | 0.642 | 0.599 | 0.611 | 0.611 |
| Aliphaticity indices | 4.559 | 5.161 | 4.986 | 4.609 | 5.142 | 4.215 | 5.293 | 5.085 | 5.470 | 5.187 | 4.357 | 5.122 | 5.069 | 5.426 |
| Sulphurisation indices | 0.274 | 0.270 | 0.214 | 0.256 | 0.225 | 0.283 | 0.214 | 0.223 | 0.205 | 0.239 | 0.238 | 0.250 | 0.183 | 0.226 |
| Asphaltenes indices | 0.381 | 0.368 | 0.362 | 0.369 | 0.366 | 0.387 | 0.357 | 0.361 | 0.358 | 0.370 | 0.365 | 0.370 | 0.356 | 0.359 |
| BND 100/130 from Plant A | ||||||||||||||
|---|---|---|---|---|---|---|---|---|---|---|---|---|---|---|
| Spectrometry indices | A-2-A | RTFOT A-2-A | A-2-B | RTFOT A-2-B | A-2-C | RTFOT A-2-C | A-2-D | RTFOT A-2-D | A-2-E | RTFOT A-2-E | A-2-F | RTFOT A-2-F | A-2-G | RTFOT A-2-G |
| Aromaticity indices | 0.479 | 0.484 | 0.513 | 0.487 | 0.483 | 0.546 | 0.506 | 0.495 | 0.492 | 0.492 | 0.506 | 0.475 | 0.486 | 0.438 |
| Oxidation indices | 0.093 | 0.130 | 0.119 | 0.131 | 0.114 | 0.146 | 0.113 | 0.111 | 0.099 | 0.129 | 0.127 | 0.105 | 0.099 | 0.085 |
| Isomerisation indices | 0.633 | 0.647 | 0.642 | 0.644 | 0.650 | 0.663 | 0.646 | 0.640 | 0.642 | 0.650 | 0.659 | 0.636 | 0.640 | 0.630 |
| Aliphaticity indices | 5.075 | 4.643 | 4.676 | 4.686 | 4.903 | 4.348 | 4.682 | 4.881 | 4.863 | 4.693 | 4.601 | 4.907 | 4.902 | 5.195 |
| Sulphurisation indices | 0.207 | 0.287 | 0.239 | 0.283 | 0.259 | 0.285 | 0.236 | 0.253 | 0.249 | 0.268 | 0.272 | 0.254 | 0.224 | 0.248 |
| Asphaltenes indices | 0.346 | 0.366 | 0.361 | 0.367 | 0.353 | 0.368 | 0.354 | 0.357 | 0.341 | 0.358 | 0.355 | 0.345 | 0.341 | 0.341 |
| BND 100/130 from plant A | ||||||||||||||
| Spectrometry indices | A-2-H | RTFOT A-2-H | A-2-I | RTFOT A-2-I | A-2-J | RTFOT A-2-J | A-2-K | RTFOT A-2-K | A-2-L | RTFOT A-2-L | A-2-M | RTFOT A-2-M | A-2-N | RTFOT A-2-N |
| Aromaticity indices | 0.458 | 0.483 | 0.511 | 0.449 | 0.508 | 0.441 | 0.499 | 0.522 | 0.482 | 0.491 | 0.513 | 0.467 | 0.492 | 0.496 |
| Oxidation indices | 0.090 | 0.116 | 0.111 | 0.093 | 0.118 | 0.106 | 0.109 | 0.149 | 0.096 | 0.112 | 0.122 | 0.147 | 0.103 | 0.126 |
| Isomerisation indices | 0.629 | 0.637 | 0.620 | 0.623 | 0.641 | 0.645 | 0.637 | 0.645 | 0.651 | 0.633 | 0.645 | 0.642 | 0.636 | 0.643 |
| Aliphaticity indices | 5.466 | 4.875 | 4.882 | 5.077 | 4.704 | 5.143 | 4.824 | 4.376 | 5.015 | 4.840 | 4.648 | 4.761 | 4.966 | 4.680 |
| Sulphurisation indices | 0.220 | 0.251 | 0.178 | 0.244 | 0.238 | 0.268 | 0.236 | 0.284 | 0.217 | 0.258 | 0.250 | 0.282 | 0.233 | 0.260 |
| Asphaltenes indices | 0.342 | 0.356 | 0.338 | 0.356 | 0.353 | 0.349 | 0.353 | 0.363 | 0.343 | 0.356 | 0.361 | 0.366 | 0.344 | 0.358 |
| BND 100/130 from plant A | ||||||||||||||
| Spectrometry indices | A-2-O | RTFOT A-2-O | A-2-P | RTFOT A-2-P | A-2-Q | RTFOT A-2-Q | A-2-R | RTFOT A-2-R | A-2-S | RTFOT A-2-S | A-2-T | |||
| Aromaticity indices | 0.531 | 0.518 | 0.499 | 0.452 | 0.494 | 0.504 | 0.484 | 0.411 | 0.519 | 0.498 | 0.500 | |||
| Oxidation indices | 0.150 | 0.134 | 0.106 | 0.111 | 0.107 | 0.154 | 0.093 | 0.101 | 0.130 | 0.131 | 0.116 | |||
| Isomerisation indices | 0.673 | 0.651 | 0.635 | 0.614 | 0.637 | 0.633 | 0.630 | 0.609 | 0.647 | 0.639 | 0.652 | |||
| Aliphaticity indices | 4.394 | 4.538 | 4.894 | 4.965 | 4.909 | 4.434 | 5.101 | 5.131 | 4.611 | 4.608 | 4.796 | |||
| Sulphurisation indices | 0.301 | 0.277 | 0.216 | 0.233 | 0.225 | 0.282 | 0.206 | 0.250 | 0.251 | 0.280 | 0.265 | |||
| Asphaltenes indices | 0.367 | 0.359 | 0.352 | 0.358 | 0.350 | 0.376 | 0.344 | 0.356 | 0.362 | 0.366 | 0.354 | |||
| BND 70/100 from Plant B | ||||||||||||||
|---|---|---|---|---|---|---|---|---|---|---|---|---|---|---|
| Spectrometry indices | B-1-A | RTFOT B-1-A | B-1-B | RTFOT B-1-B | B-1-C | RTFOT B-1-C | B-1-D | RTFOT B-1-D | B-1-E | RTFOT B-1-E | B-1-F | RTFOT B-1-F | B-1-G | RTFOT B-1-G |
| Aromaticity indices | 0.586 | 0.575 | 0.554 | 0.572 | 0.549 | 0.587 | 0.548 | 0.568 | 0.508 | 0.539 | 0.588 | 0.556 | 0.592 | 0.599 |
| Oxidation indices | 0.185 | 0.133 | 0.153 | 0.147 | 0.155 | 0.187 | 0.153 | 0.175 | 0.118 | 0.150 | 0.180 | 0.153 | 0.178 | 0.140 |
| Isomerisation indices | 0.655 | 0.622 | 0.647 | 0.631 | 0.638 | 0.654 | 0.641 | 0.642 | 0.631 | 0.628 | 0.650 | 0.639 | 0.655 | 0.622 |
| Aliphaticity indices | 3.922 | 4.249 | 4.248 | 4.275 | 4.267 | 3.979 | 4.293 | 4.123 | 4.760 | 4.397 | 3.995 | 4.290 | 3.910 | 4.239 |
| Sulphurisation indices | 0.265 | 0.233 | 0.243 | 0.246 | 0.252 | 0.299 | 0.280 | 0.272 | 0.266 | 0.236 | 0.264 | 0.252 | 0.279 | 0.202 |
| Asphaltenes indices | 0.379 | 0.359 | 0.363 | 0.361 | 0.374 | 0.387 | 0.363 | 0.380 | 0.356 | 0.359 | 0.375 | 0.369 | 0.381 | 0.365 |
| BND 70/100 from plant B | ||||||||||||||
| Spectrometry indices | B-1-O | RTFOT B-1-O | B-1-P | RTFOTB-1-P | B-1-Q | RTFOT B-1-Q | B-1-R | RTFOT- B-1-R | B-1-S | RTFOT B-1-S | B-1-T | RTFOTB-1-T | ||
| Aromaticity indices | 0.519 | 0.655 | 0.537 | 0.538 | 0.625 | 0.604 | 0.569 | 0.517 | 0.552 | 0.521 | 0.648 | 0.596 | ||
| Oxidation indices | 0.165 | 0.281 | 0.144 | 0.139 | 0.222 | 0.202 | 0.152 | 0.125 | 0.154 | 0.143 | 0.206 | 0.176 | ||
| Isomerisation indices | 0.644 | 0.698 | 0.637 | 0.638 | 0.678 | 0.660 | 0.639 | 0.623 | 0.645 | 0.632 | 0.667 | 0.649 | ||
| Aliphaticity indices | 4.323 | 3.378 | 4.368 | 4.405 | 3.759 | 3.791 | 4.269 | 4.583 | 4.243 | 4.450 | 3.652 | 3.979 | ||
| Sulphurisation indices | 0.261 | 0.375 | 0.229 | 0.233 | 0.259 | 0.312 | 0.208 | 0.223 | 0.260 | 0.250 | 0.283 | 0.276 | ||
| Asphaltenes indices | 0.375 | 0.405 | 0.370 | 0.364 | 0.366 | 0.391 | 0.364 | 0.358 | 0.370 | 0.372 | 0.394 | 0.381 | ||
| BND 100/130 from Plant C | ||||||||||||||
|---|---|---|---|---|---|---|---|---|---|---|---|---|---|---|
| Spectrometry indices | C-1-A | RTFOT C-1-A | C-1-B | RTFOT C-1-B | C-1-C | RTFOT C-1-C | C-1-D | RTFOT C-1-D | C-1-E | RTFOT C-1-E | C-1-F | RTFOT C-1-F | C-1-G | RTFOT C-1-G |
| Aromaticity indices | 0.544 | 0.558 | 0.559 | 0.512 | 0.531 | 0.518 | 0.520 | 0.535 | 0.522 | 0.519 | 0.570 | 0.512 | 0.565 | 0.535 |
| Oxidation indices | 0.153 | 0.144 | 0.178 | 0.126 | 0.139 | 0.133 | 0.134 | 0.133 | 0.117 | 0.119 | 0.114 | 0.122 | 0.180 | 0.169 |
| Isomerisation indices | 0.635 | 0.633 | 0.647 | 0.627 | 0.631 | 0.630 | 0.630 | 0.625 | 0.618 | 0.615 | 0.629 | 0.617 | 0.647 | 0.630 |
| Aliphaticity indices | 4.319 | 4.302 | 4.151 | 4.586 | 4.434 | 4.516 | 4.490 | 4.458 | 4.617 | 4.639 | 4.091 | 4.784 | 4.065 | 4.196 |
| Sulphurisation indices | 0.250 | 0.258 | 0.275 | 0.249 | 0.247 | 0.259 | 0.240 | 0.250 | 0.217 | 0.217 | 0.232 | 0.237 | 0.282 | 0.294 |
| Asphaltenes indices | 0.377 | 0.368 | 0.383 | 0.368 | 0.373 | 0.368 | 0.366 | 0.370 | 0.360 | 0.359 | 0.355 | 0.368 | 0.385 | 0.385 |
| BND 100/130 from plant C | ||||||||||||||
| Spectrometry indices | C-1-H | RTFOT C-1-H | C-1-I | RTFOT C-1-I | C-1-J | RTFOT C-1-J | C-1-K | RTFOT C-1-K | C-1-L | RTFOT C-1-L | C-1-M | RTFOT C-1-M | C-1-N | |
| Aromaticity indices | 0.518 | 0.588 | 0.502 | 0.533 | 0.533 | 0.593 | 0.553 | 0.549 | 0.876 | 0.552 | 0.493 | 0.538 | 0.540 | |
| Oxidation indices | 0.123 | 0.178 | 0.134 | 0.145 | 0.123 | 0.155 | 0.166 | 0.152 | 0.495 | 0.148 | 0.137 | 0.143 | 0.147 | |
| Isomerisation indices | 0.618 | 0.645 | 0.632 | 0.630 | 0.622 | 0.644 | 0.643 | 0.630 | 1.146 | 0.633 | 0.637 | 0.632 | 0.635 | |
| Aliphaticity indices | 4.598 | 4.027 | 4.566 | 4.356 | 4.505 | 4.045 | 4.210 | 4.311 | 3.325 | 4.278 | 4.592 | 4.379 | 4.338 | |
| Sulphurisation indices | 0.216 | 0.284 | 0.243 | 0.269 | 0.222 | 0.267 | 0.272 | 0.257 | 0.657 | 0.265 | 0.281 | 0.255 | 0.254 | |
| Asphaltenes indices | 0.362 | 0.387 | 0.367 | 0.376 | 0.370 | 0.367 | 0.384 | 0.372 | 0.536 | 0.379 | 0.375 | 0.370 | 0.379 | |
| BND 100/130 from plant C | ||||||||||||||
| Spectrometry indices | RTFOT C-1-N | C-1-O | RTFOTC-1-O | C-1-P | RTFOT C-1-P | C-1-Q | RTFOT C-1-Q | C-1-R | RTFOT C-1-R | C-1-S | RTFOTC-1-S | C-1-T | RTFOTC-1-T | |
| Aromaticity indices | 0.545 | 0.646 | 0.540 | 0.670 | 0.562 | 0.535 | 0.489 | 0.493 | 0.572 | 0.551 | 0.561 | 0.518 | 0.558 | |
| Oxidation indices | 0.143 | 0.232 | 0.154 | 0.193 | 0.156 | 0.137 | 0.123 | 0.109 | 0.162 | 0.161 | 0.186 | 0.109 | 0.144 | |
| Isomerisation indices | 0.627 | 0.664 | 0.641 | 0.632 | 0.644 | 0.627 | 0.608 | 0.615 | 0.635 | 0.647 | 0.659 | 0.617 | 0.623 | |
| Aliphaticity indices | 4.423 | 3.584 | 4.308 | 3.662 | 4.327 | 4.440 | 4.682 | 4.834 | 4.220 | 4.232 | 4.091 | 4.624 | 4.415 | |
| Sulphurisation indices | 0.247 | 0.312 | 0.274 | 0.293 | 0.257 | 0.228 | 0.244 | 0.204 | 0.274 | 0.276 | 0.308 | 0.205 | 0.241 | |
| Asphaltenes indices | 0.377 | 0.396 | 0.378 | 0.415 | 0.377 | 0.370 | 0.365 | 0.357 | 0.392 | 0.387 | 0.374 | 0.355 | 0.377 | |
| Spectrometry Indices | BND 70/100 from Plant A | BND 100/130 from Plant A | ||||||||||
|---|---|---|---|---|---|---|---|---|---|---|---|---|
| Mean Initial | SD | CV | Mean RTFOT | SD | CV | Mean Initial | SD | CV | Mean RTFOT | SD | CV | |
| Aromaticity indices | 0.465 | 0.026 | 5.7 | 0.466 | 0.053 | 11.4 | 0.498 | 0.017 | 3.3 | 0.482 | 0.033 | 6.8 |
| Oxidation indices | 0.079 | 0.019 | 24.0 | 0.104 | 0.030 | 29.0 | 0.111 | 0.015 | 13.3 | 0.122 | 0.020 | 16.1 |
| Isomerisation indices | 0.625 | 0.010 | 1.6 | 0.625 | 0.023 | 3.7 | 0.642 | 0.012 | 1.8 | 0.638 | 0.013 | 2.0 |
| Aliphaticity indices | 5.189 | 0.313 | 6.0 | 5.010 | 0.505 | 10.1 | 4.846 | 0.229 | 4.7 | 4.778 | 0.257 | 5.4 |
| Sulphurisation indices | 0.209 | 0.025 | 11.9 | 0.252 | 0.031 | 12.1 | 0.236 | 0.027 | 11.5 | 0.266 | 0.017 | 6.3 |
| Asphaltenes indices | 0.359 | 0.009 | 2.6 | 0.370 | 0.011 | 3.1 | 0.351 | 0.008 | 2.3 | 0.359 | 0.008 | 2.3 |
| Spectrometry indices | BND 70/100 from plant B | BND 100/130 from plant C | ||||||||||
| Mean Initial | SD | CV | Mean RTFOT | SD | CV | Mean Initial | SD | CV | Mean RTFOT | SD | CV | |
| Aromaticity indices | 0.561 | 0.034 | 6.0 | 0.568 | 0.032 | 5.6 | 0.562 | 0.086 | 15.3 | 0.543 | 0.026 | 4.8 |
| Oxidation indices | 0.160 | 0.024 | 15.3 | 0.162 | 0.034 | 21.0 | 0.164 | 0.084 | 51.2 | 0.147 | 0.018 | 12.4 |
| Isomerisation indices | 0.645 | 0.012 | 1.9 | 0.639 | 0.017 | 2.7 | 0.659 | 0.115 | 17.5 | 0.631 | 0.012 | 1.8 |
| Aliphaticity indices | 4.209 | 0.262 | 6.2 | 4.188 | 0.268 | 6.4 | 4.284 | 0.387 | 9.0 | 4.367 | 0.205 | 4.7 |
| Sulphurisation indices | 0.248 | 0.024 | 9.6 | 0.259 | 0.037 | 14.3 | 0.270 | 0.096 | 35.5 | 0.260 | 0.021 | 7.9 |
| Asphaltenes indices | 0.370 | 0.009 | 2.5 | 0.372 | 0.012 | 3.3 | 0.383 | 0.039 | 10.2 | 0.374 | 0.008 | 2.1 |
| Designation | BND 70/100 | BND 100/130 | ||
|---|---|---|---|---|
| Indicators | Plant A | Plant B | Plant A | Plant C |
| Mean | Mean | Mean | Mean | |
| Penetration 0.1 mm at 25 °C | 80 | 79 | 116 | 106 |
| Softening point by ring and ball method, °C | 49 | 50 | 45.2 | 45.6 |
| Fraass breaking point, °C | −24 | −28 | −26 | −25 |
| Ductility at 0 °C, cm | 3 | 4 | 5 | 5 |
| Rotational viscosity at 1.5 sv‒1 and 60 °C, Pa∙s before RTFOT | 185.50 | 396.06 | 140.19 | 188.92 |
| Mass loss (%) after RTFOT ageing | 0.05 | 0.09 | 0.68 | 0.27 |
| Difference in softening point after RTFOT, °C | 5.03 | 6.34 | 6.42 | 5.9 |
| Rotational viscosity at 1.5 s‒1 and 60 °C after RTFOT ageing, Pa∙s | 444.57 | 920.36 | 395.82 | 451.26 |
| Designation | BND 70/100 from Plant A | BND 100/130 from Plant A | BND 70/100 from Plant B | BND 100/130 from Plant C | ||||
|---|---|---|---|---|---|---|---|---|
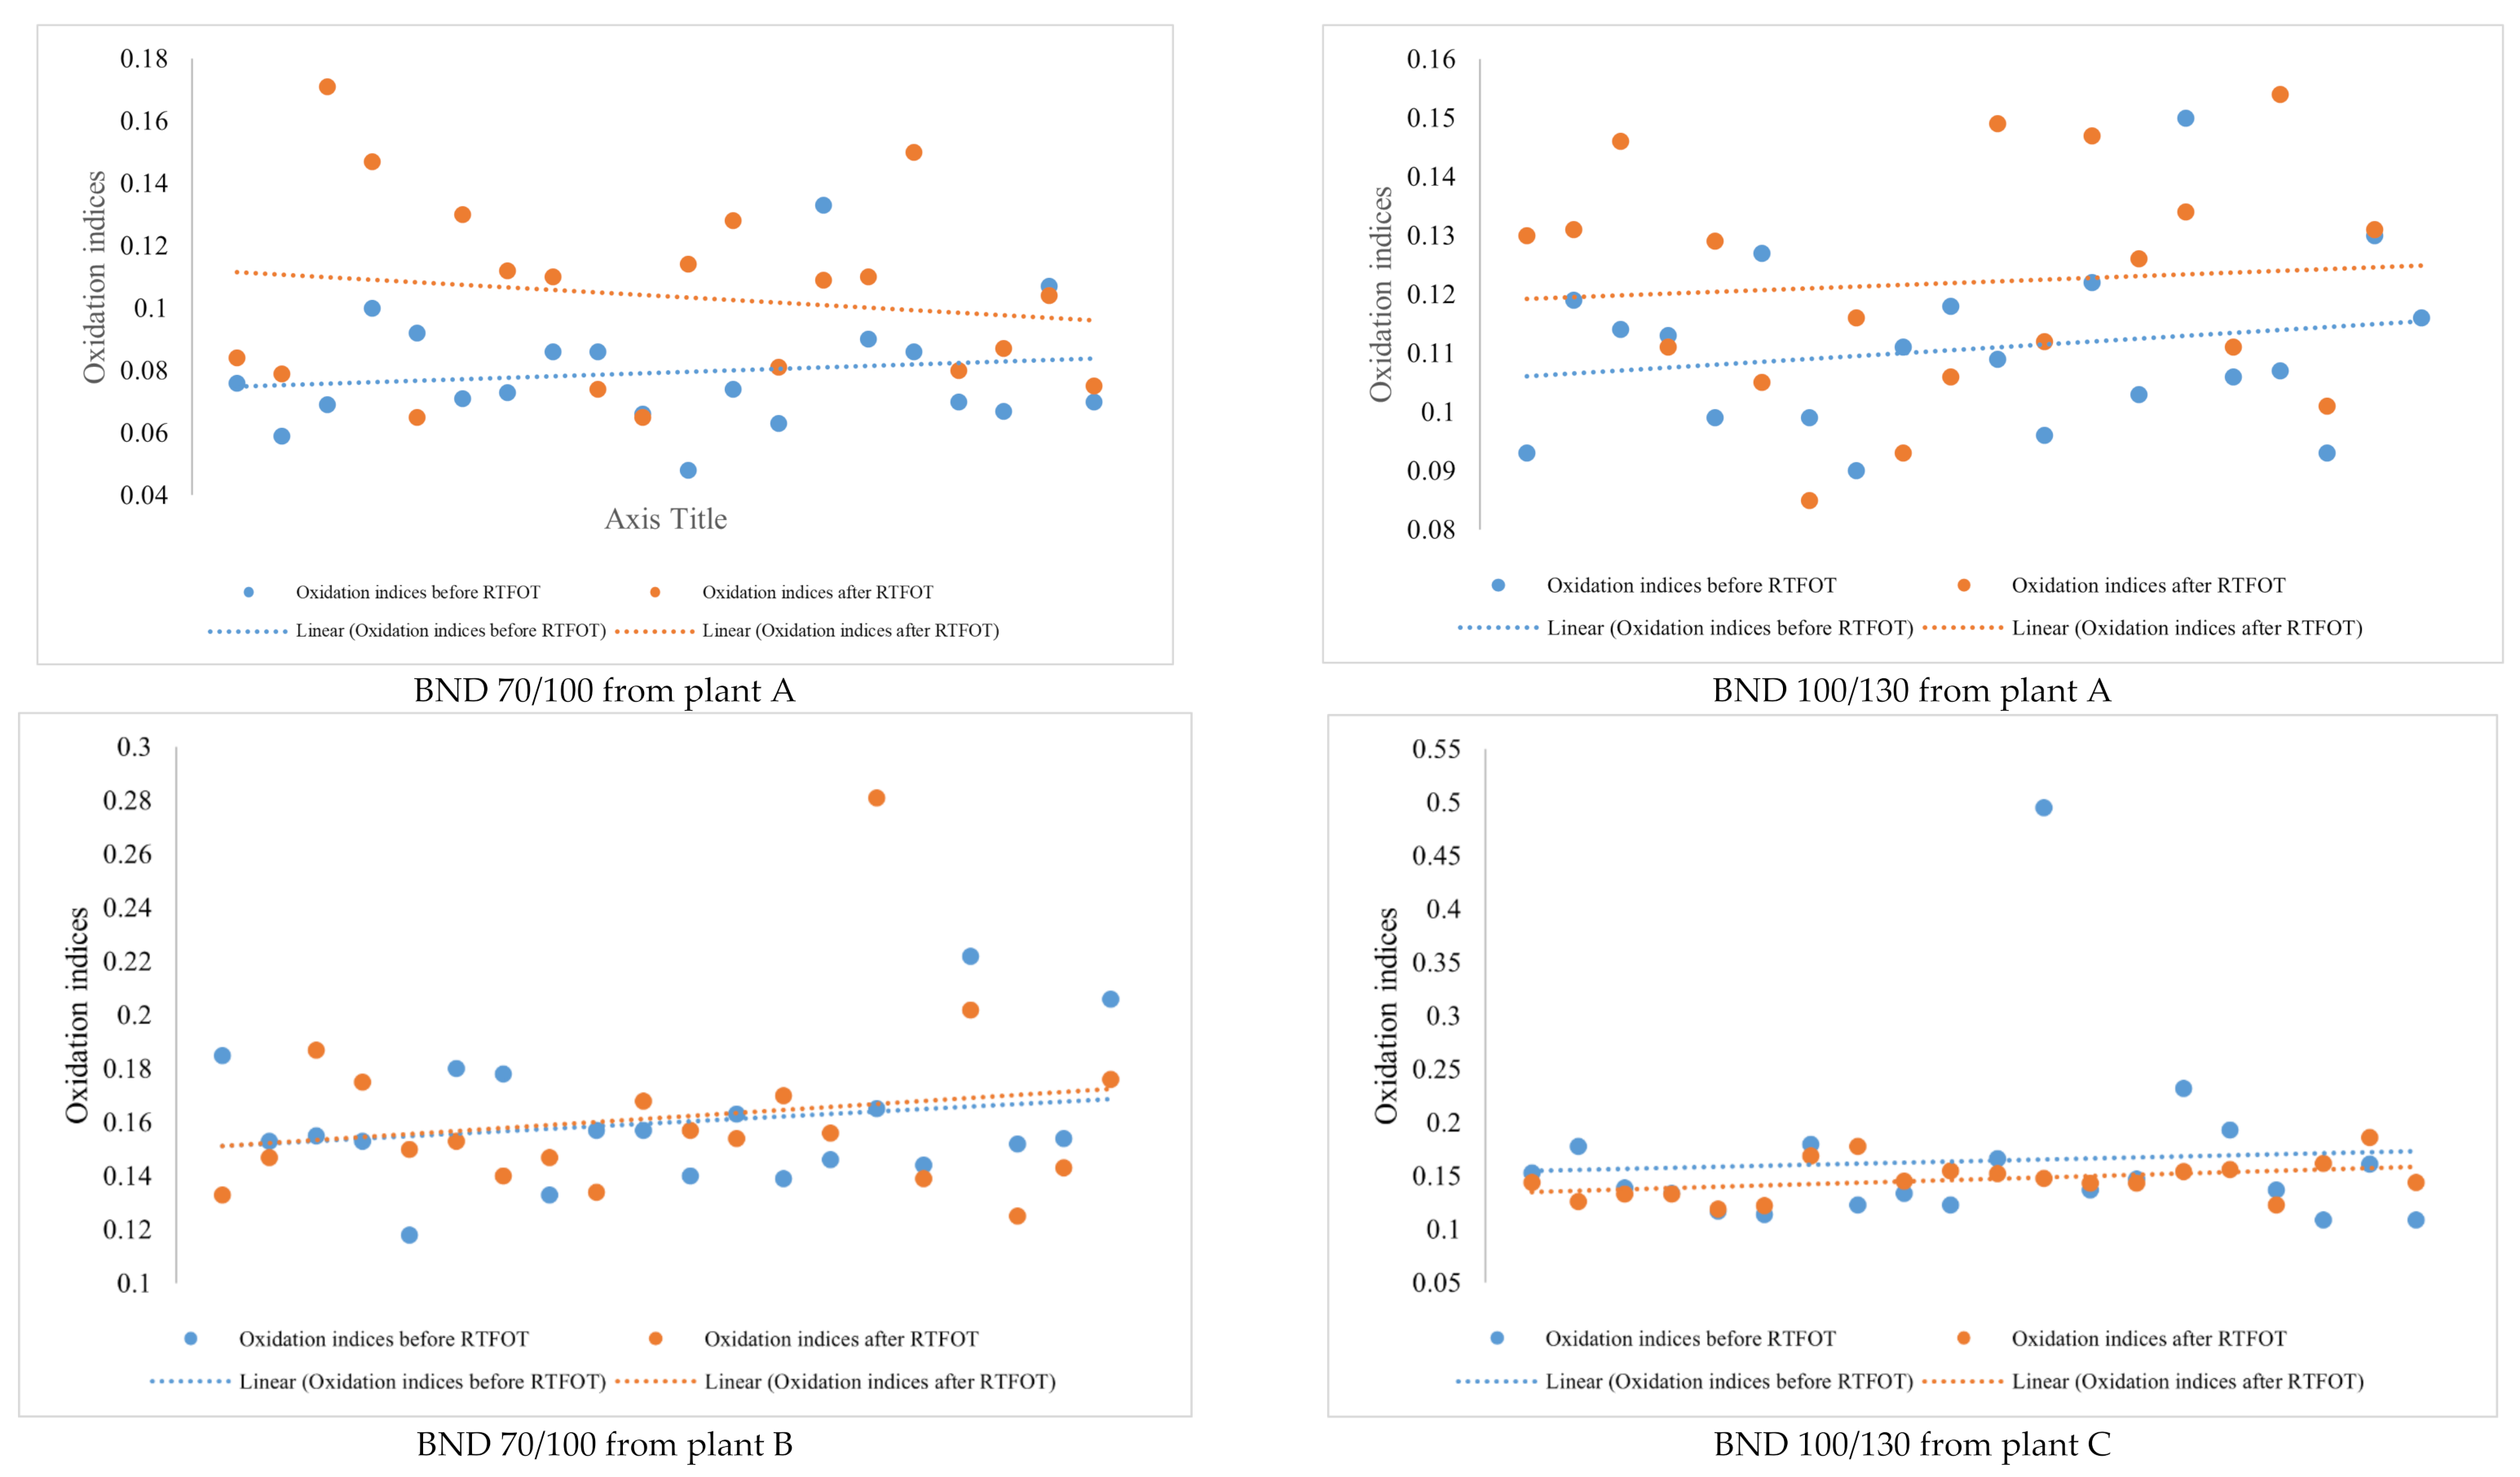
| Visual Discrepancy between Samples | Almost no Band at 1710 cm−1(C=O) | The Presence of Band at 1710 cm−1(C=O) | ||||||
| Discrepancy between samples based on mean values of spectrometry indices | Oxidation indices | |||||||
| Mean Initial | Mean RTFOT | Mean Initial | Mean RTFOT | Mean Initial | Mean RTFOT | Mean Initial | Mean RTFOT | |
| 0.079 | 0.104 | 0.111 | 0.122 | 0.160 | 0.162 | 0.164 | 0.147 | |
| CV = 24.0 | CV = 29.0 | CV = 13.3 | CV = 16.1 | CV = 15.3 | CV = 21.0 | CV = 51.2 | CV = 12.4 | |
| The oxidation degree is relatively low, even if we consider before and after RTFOT; the mean is 0.092. | The oxidation degree is relatively low, even if we consider before and after RTFOT; the mean is 0.117. | The oxidation degree is relatively high but does not change even after RTFOT; the mean is 0.161. | The oxidation degree is relatively high before RTFOT, but after RTFOT, we observe a decrease of oxidation indices; the mean is 0.156. | |||||
| Aromaticity indices | ||||||||
| Mean Initial | Mean RTFOT | Mean Initial | Mean RTFOT | Mean Initial | Mean RTFOT | Mean Initial | Mean RTFOT | |
| 0.465 | 0.466 | 0.498 | 0.481 | 0.561 | 0.568 | 0.562 | 0.543 | |
| CV = 5.7 | CV = 11.4 | CV = 3.3 | CV = 6.8 | CV = 6.0 | CV = 5.6 | CV = 15.3 | CV = 4.8 | |
| Aliphaticity indices | ||||||||
| Mean Initial | Mean RTFOT | Mean Initial | Mean RTFOT | Mean Initial | Mean RTFOT | Mean Initial | Mean RTFOT | |
| 5.189 | 5.010 | 4.845 | 4.778 | 4.209 | 4.188 | 4.284 | 4.367 | |
| CV = 6.0 | CV = 10.1 | CV = 4.7 | CV = 5.4 | CV = 6.2 | CV = 6.4 | CV = 9.0 | CV = 4.7 | |
Publisher’s Note: MDPI stays neutral with regard to jurisdictional claims in published maps and institutional affiliations. |
© 2021 by the authors. Licensee MDPI, Basel, Switzerland. This article is an open access article distributed under the terms and conditions of the Creative Commons Attribution (CC BY) license (https://creativecommons.org/licenses/by/4.0/).
Share and Cite
Adiko, S.-B.; Gureev, A.A.; Voytenko, O.N.; Korotkov, A.V. An Attempt to Track Two Grades of Road Bitumen from Different Plants Using Fourier Transform Infrared Spectroscopy. Materials 2021, 14, 5870. https://doi.org/10.3390/ma14195870
Adiko S-B, Gureev AA, Voytenko ON, Korotkov AV. An Attempt to Track Two Grades of Road Bitumen from Different Plants Using Fourier Transform Infrared Spectroscopy. Materials. 2021; 14(19):5870. https://doi.org/10.3390/ma14195870
Chicago/Turabian StyleAdiko, Serge-Bertrand, Alexey A. Gureev, Olga N. Voytenko, and Alexey V. Korotkov. 2021. "An Attempt to Track Two Grades of Road Bitumen from Different Plants Using Fourier Transform Infrared Spectroscopy" Materials 14, no. 19: 5870. https://doi.org/10.3390/ma14195870
APA StyleAdiko, S.-B., Gureev, A. A., Voytenko, O. N., & Korotkov, A. V. (2021). An Attempt to Track Two Grades of Road Bitumen from Different Plants Using Fourier Transform Infrared Spectroscopy. Materials, 14(19), 5870. https://doi.org/10.3390/ma14195870