
Multivariate Correlation Analysis of the Electroconductive Textiles Obtained Using Functionalization by Radio-Frequency Oxygen Plasma Treatments


Abstract
:1. Introduction
2. Materials and Methods
- 1.
- To measure the Rs[Ω] in Table 1 was used a portable Surface Resistance Meter (Quantachrome, Beijing, China) and the surface resistance (Rs [Ω]) was measured as the ratio between the continuous voltage applied between the two parallel electrodes on the surface of a test sample and the current between these electrodes, neglecting any polarization phenomena on the electrodes.
- 2.
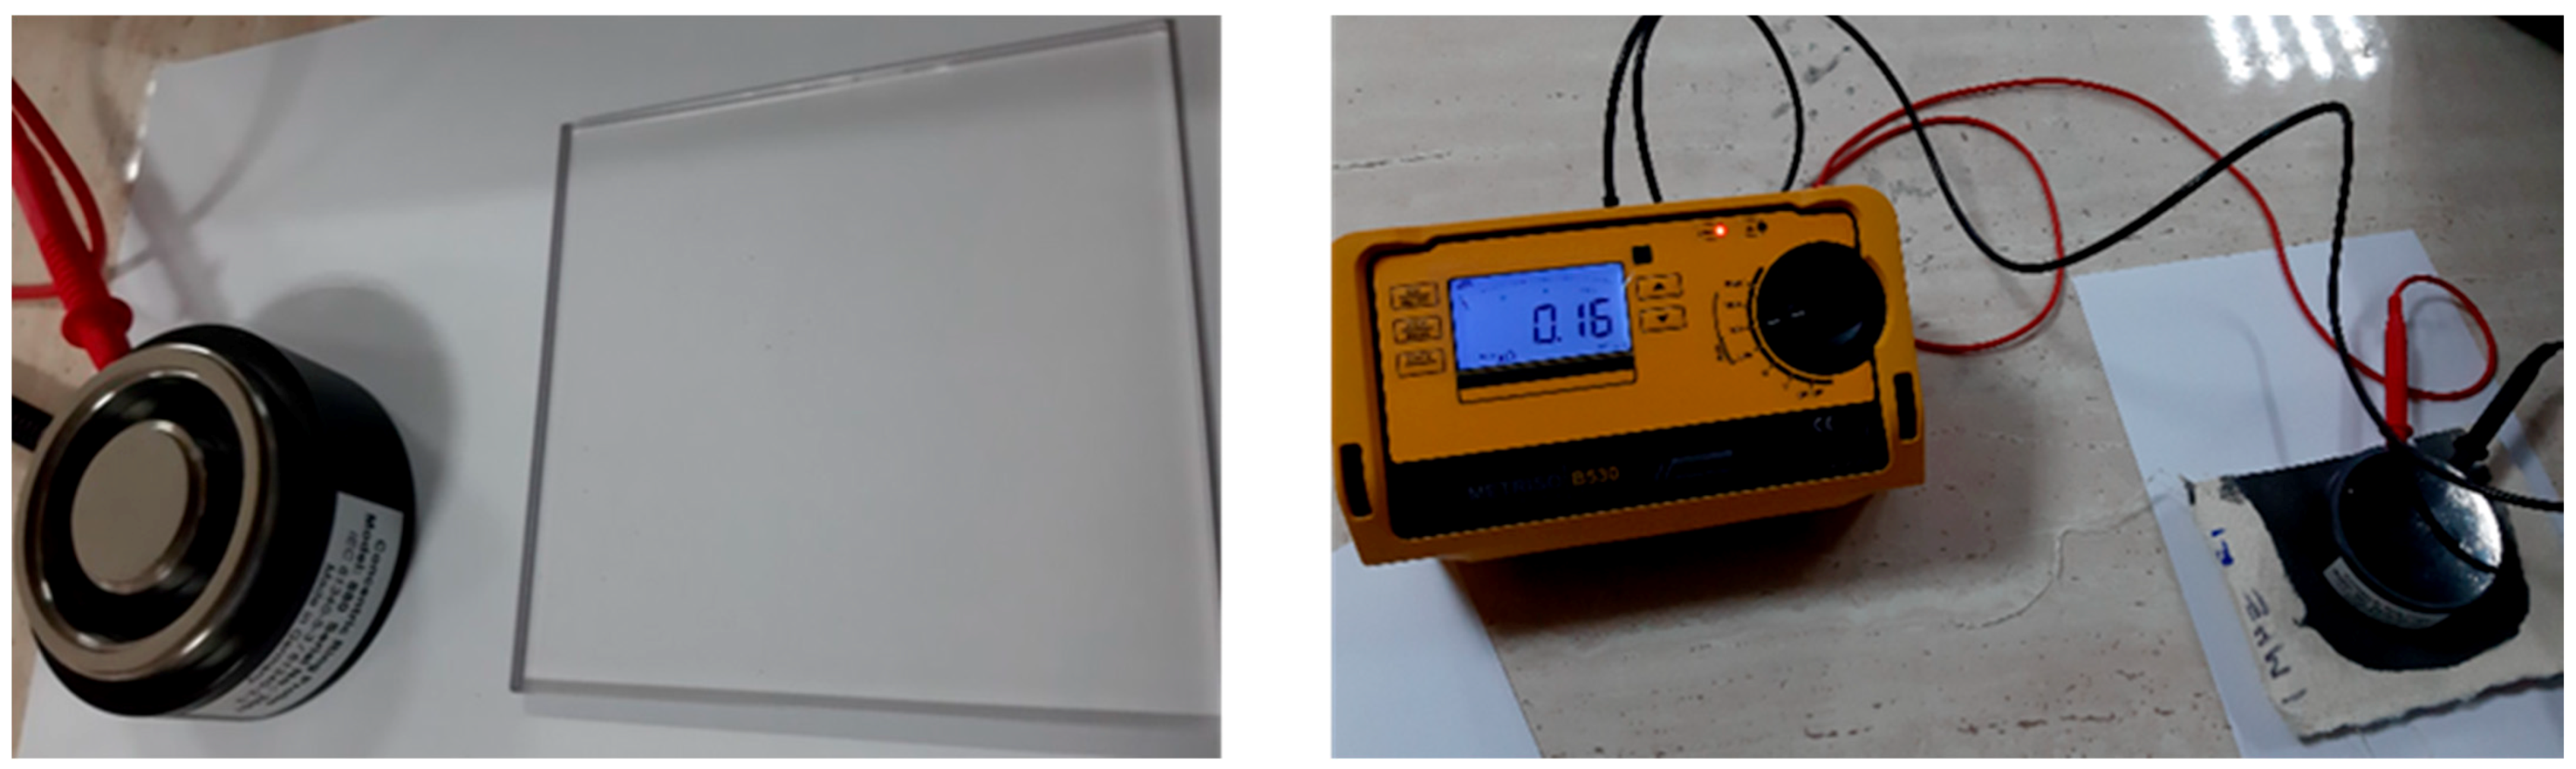
- Surface resistance (noted with REDS [Ω]) was measured using a high precision device Warmbier METRISO B530 Surface Resistance Tester (Wolfgang Warmbier GmbH & Co., Hilzingen, Germany) based on concentric electrodes (Figure 3) and supply voltage:
- -
- 10 V for samples treated in RF plasma O2 using an RF2 generator 40 kHz and power of 100 W, respectively, an RF1 generator of 13.56 MHz frequency and power 200 W;
- -
- 100 V for samples treated in RF plasma O2 using an RF2 generator of 40 kHz frequency and power 50 W.
3. Results
3.1. Characterization of the Samples Treated Using RF Plasma O2 and Conductive Paste
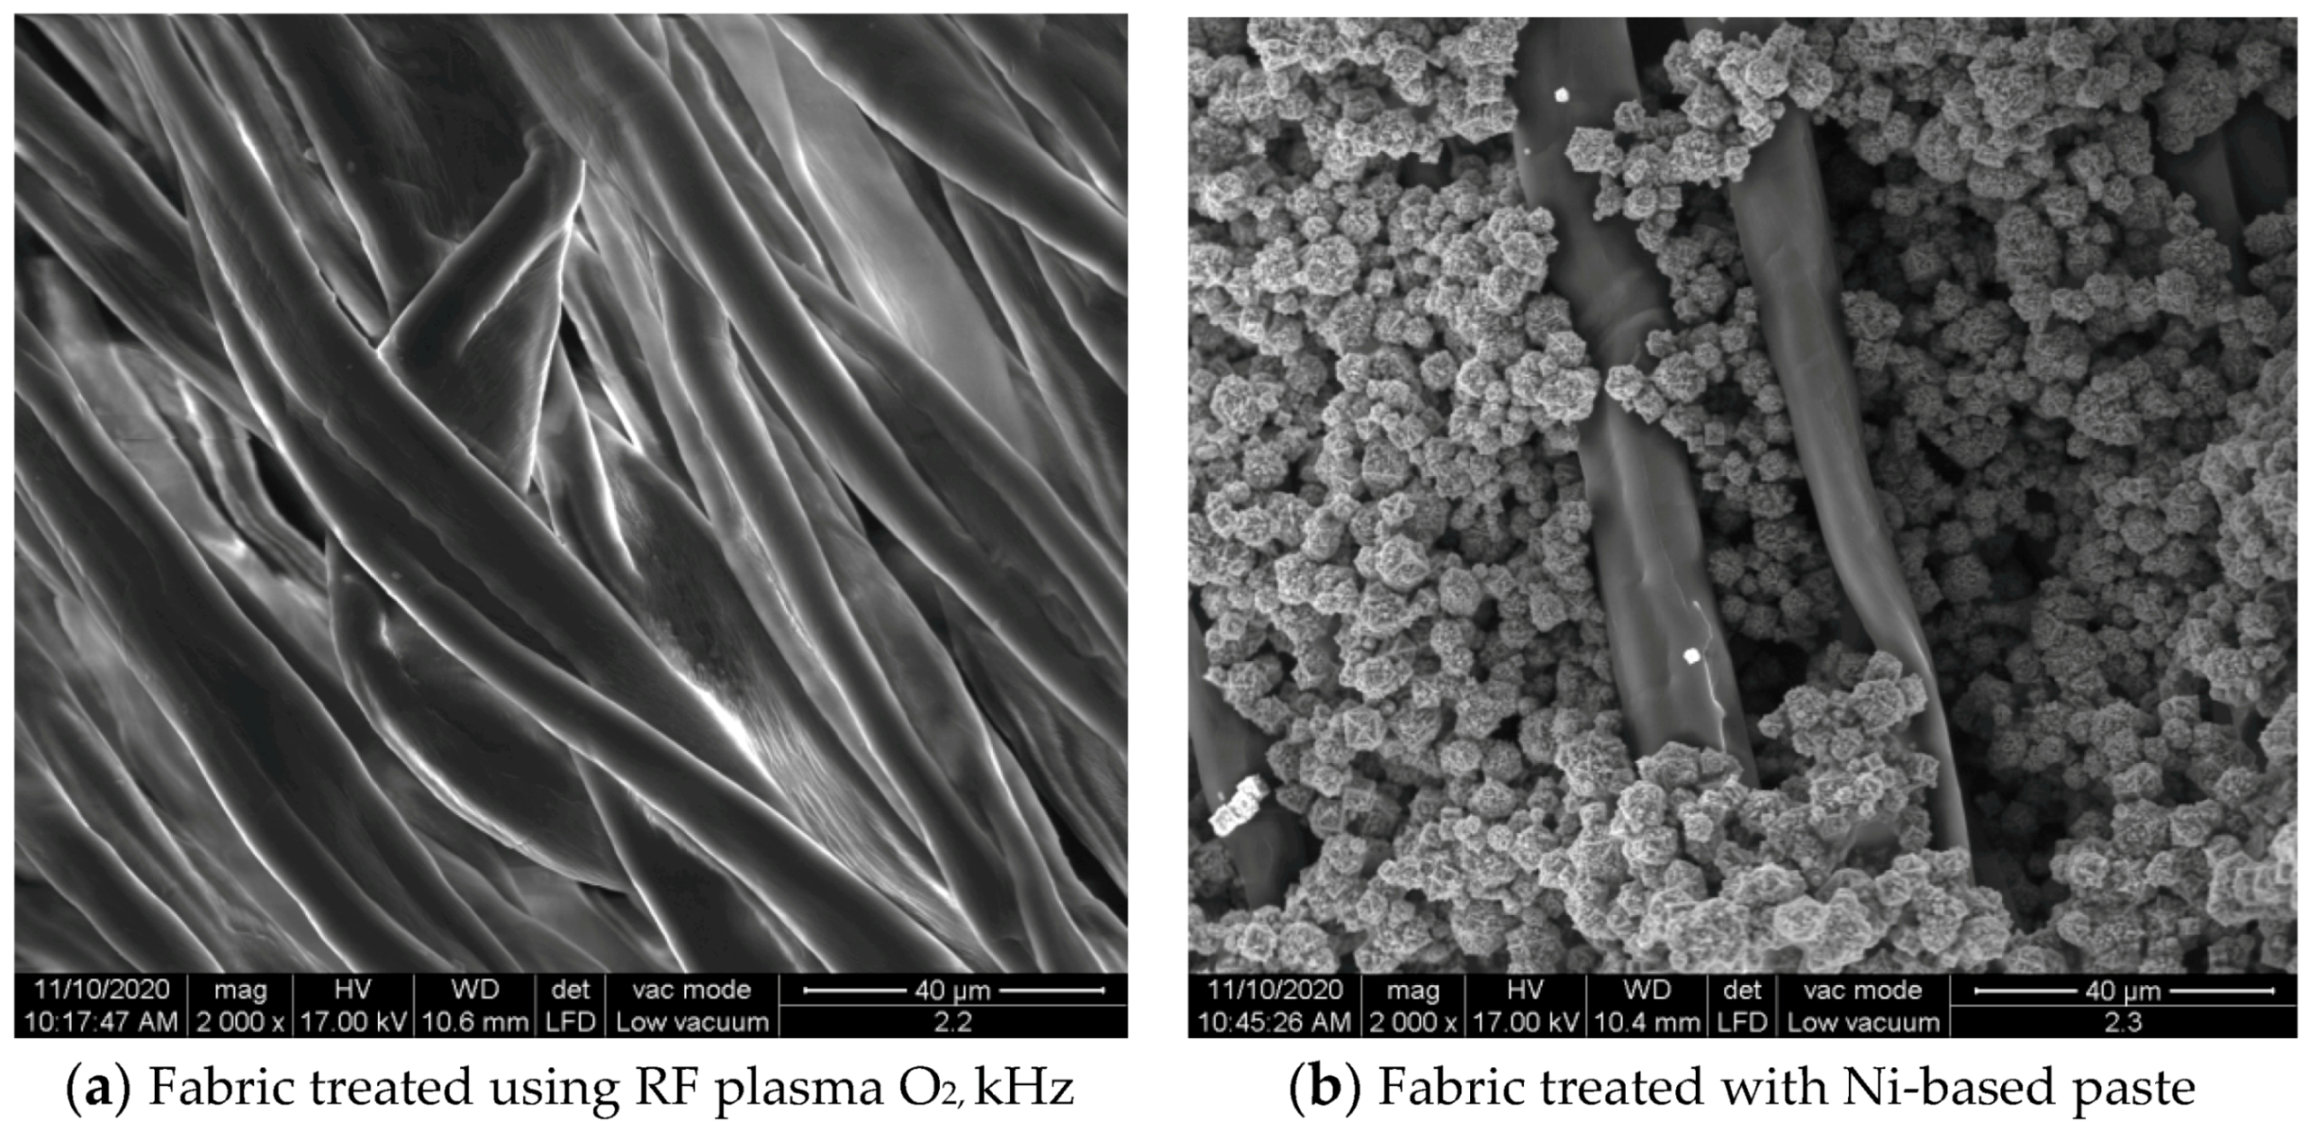
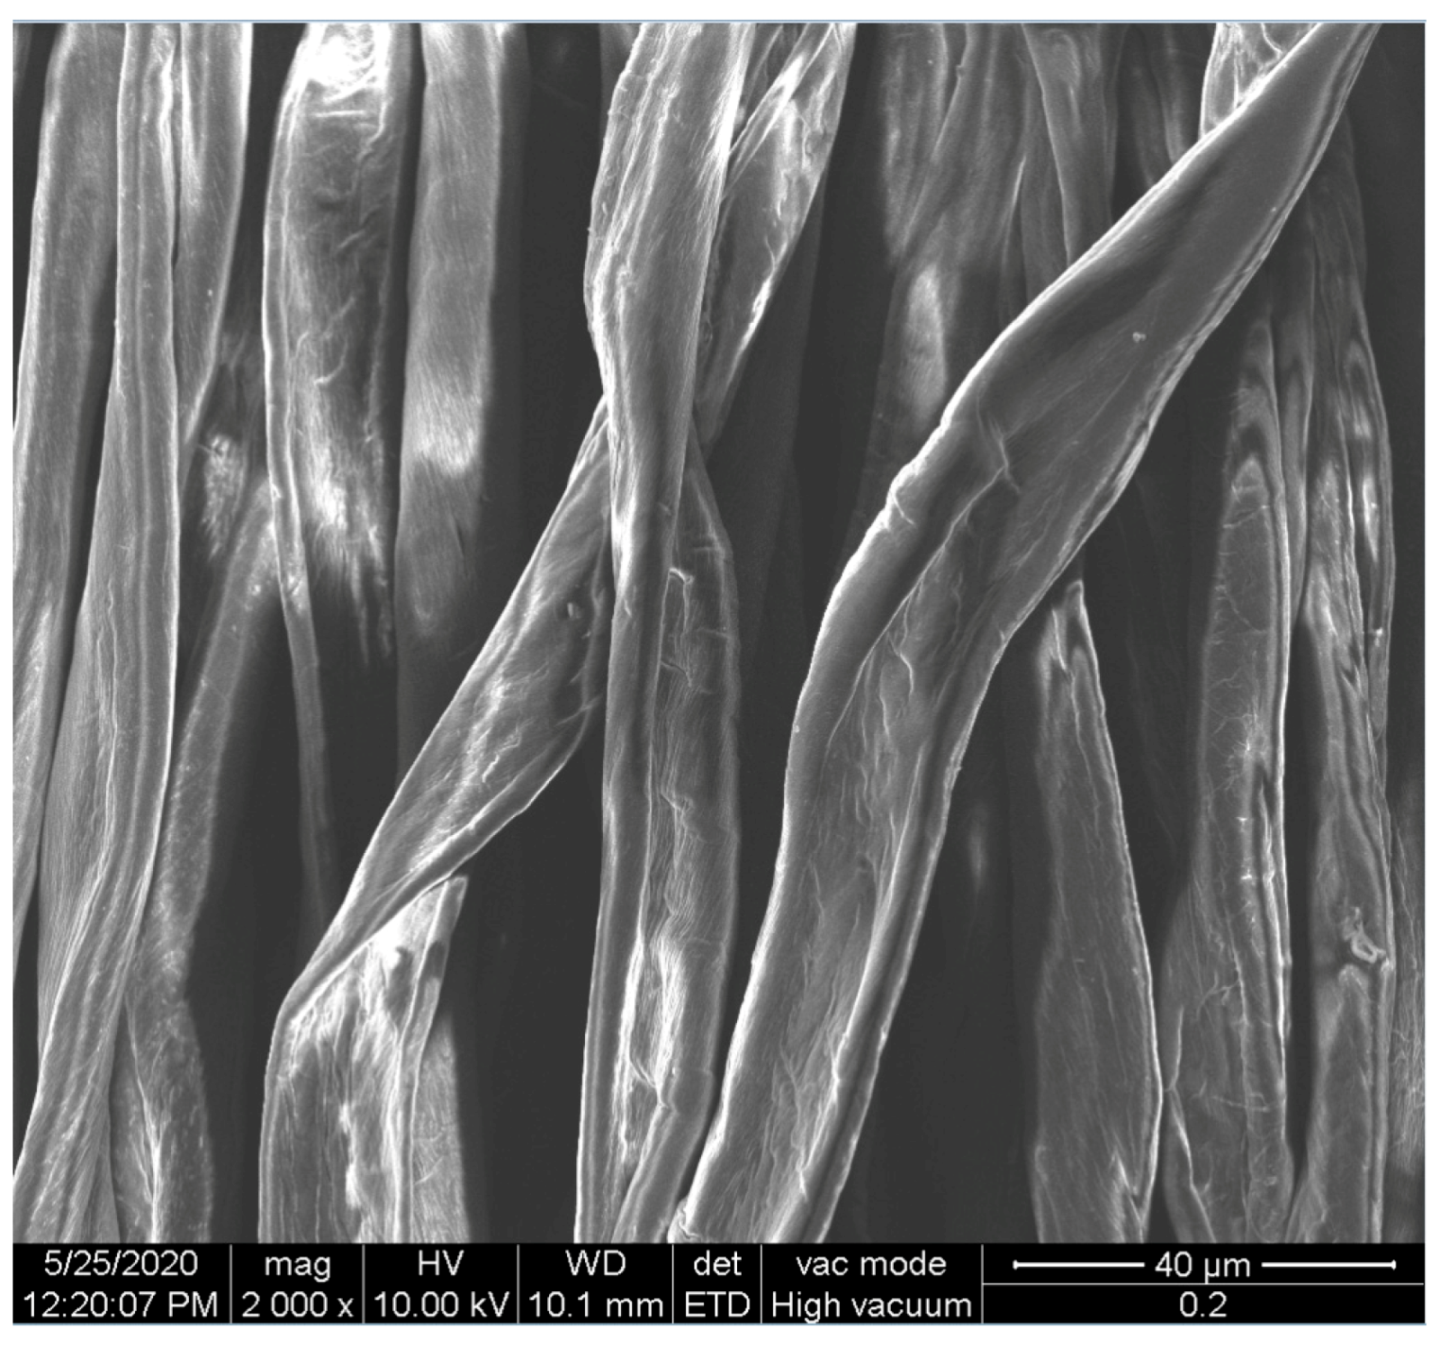
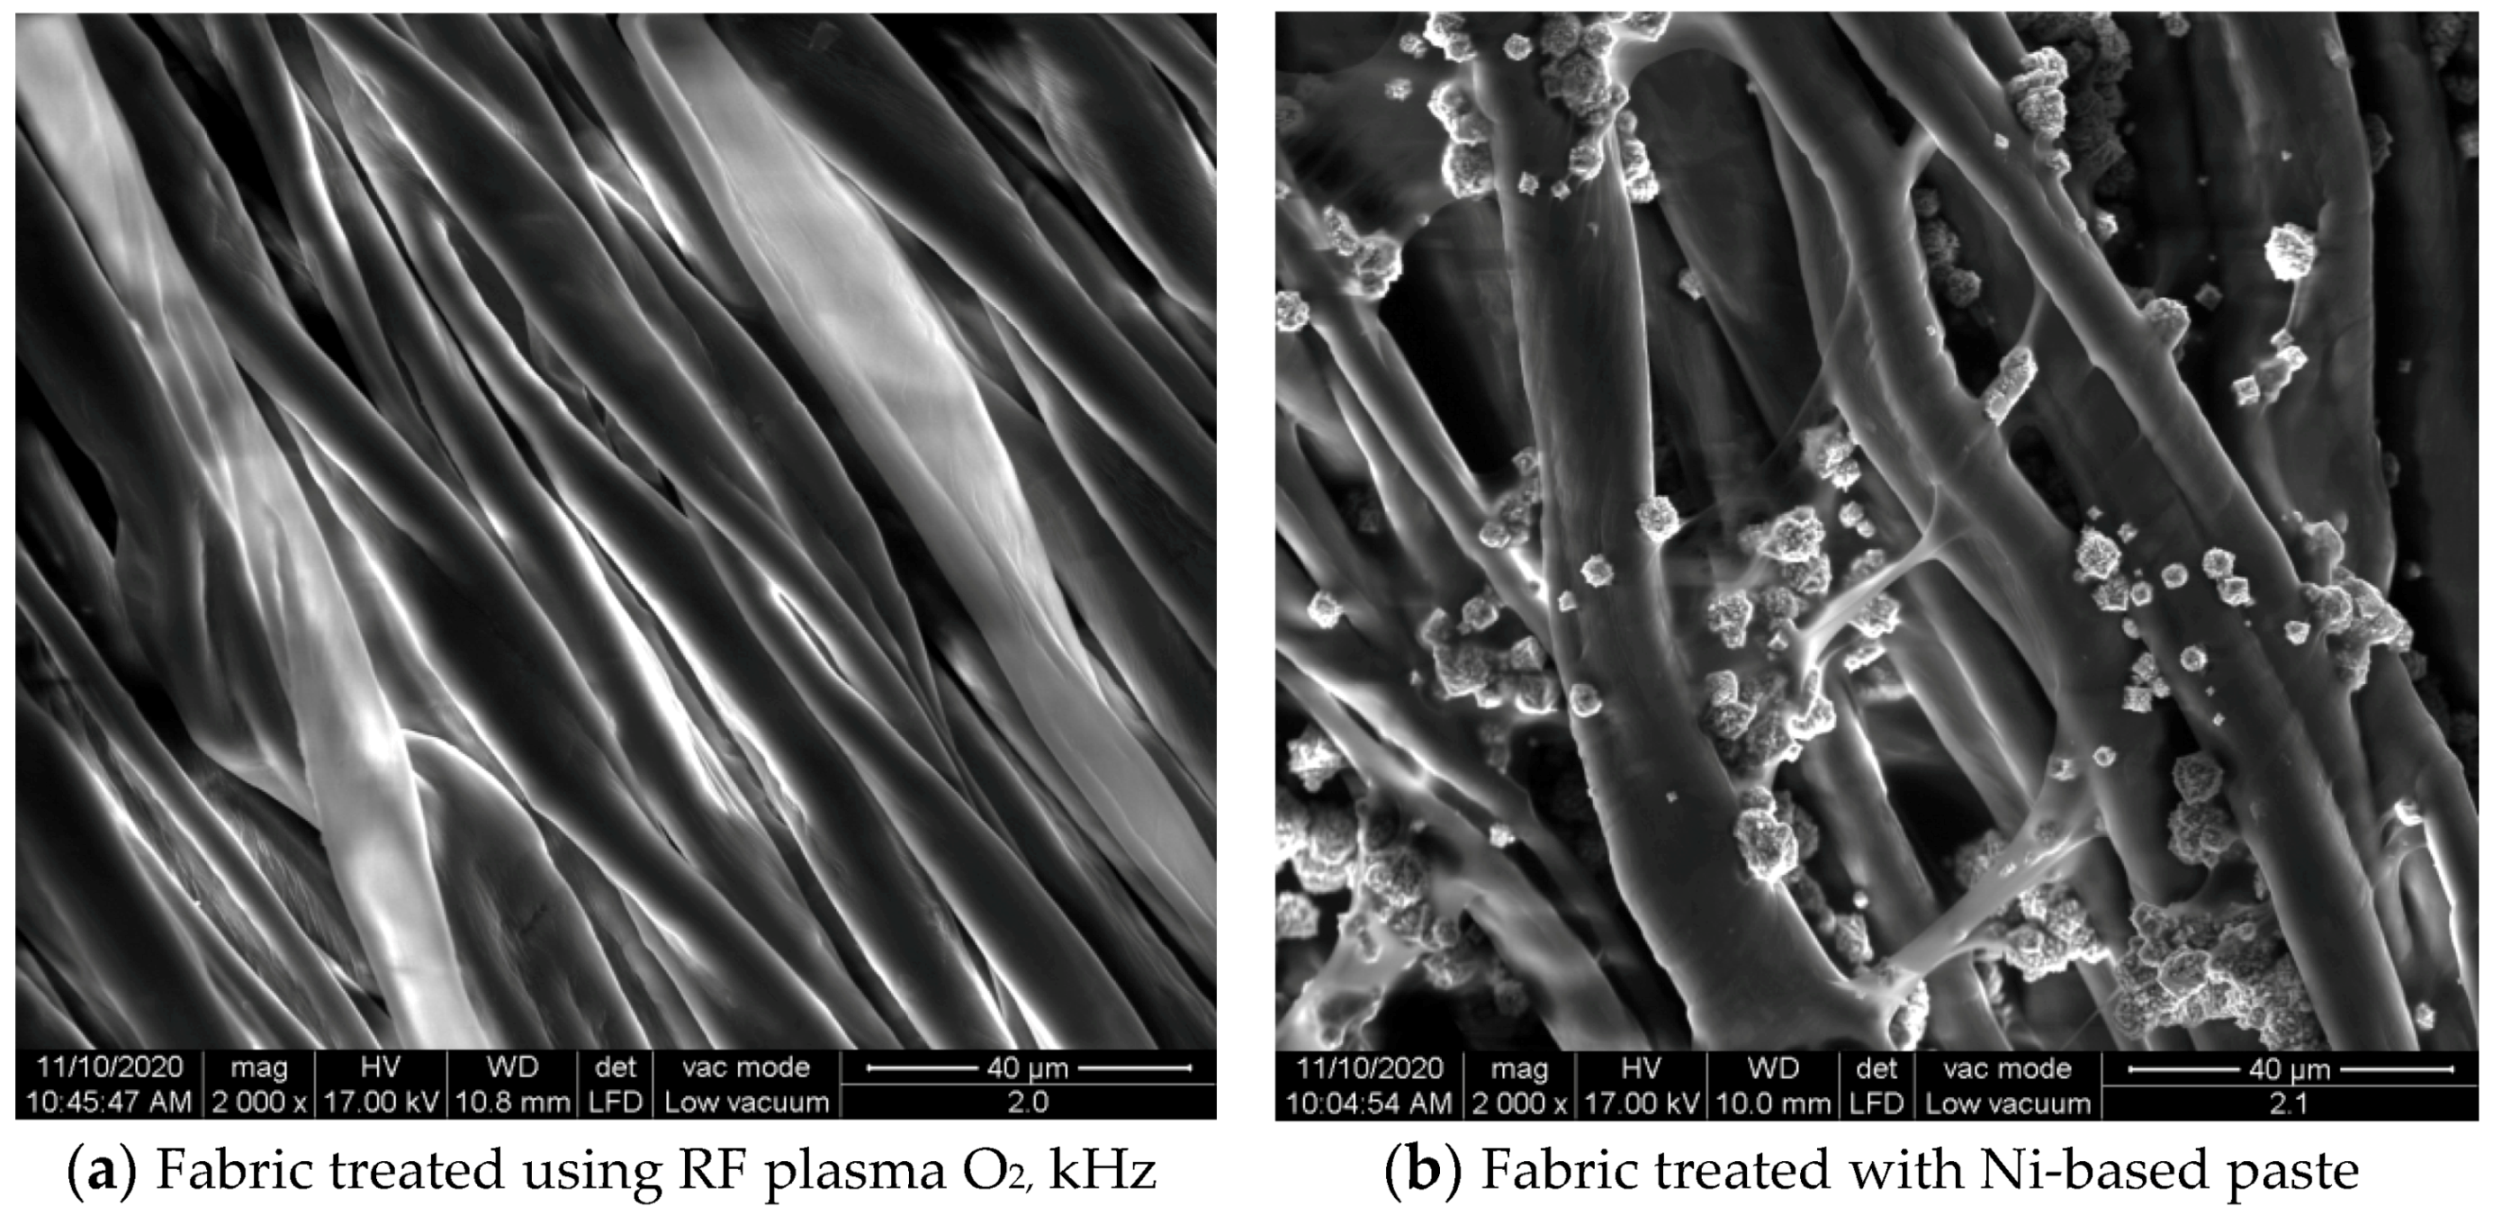
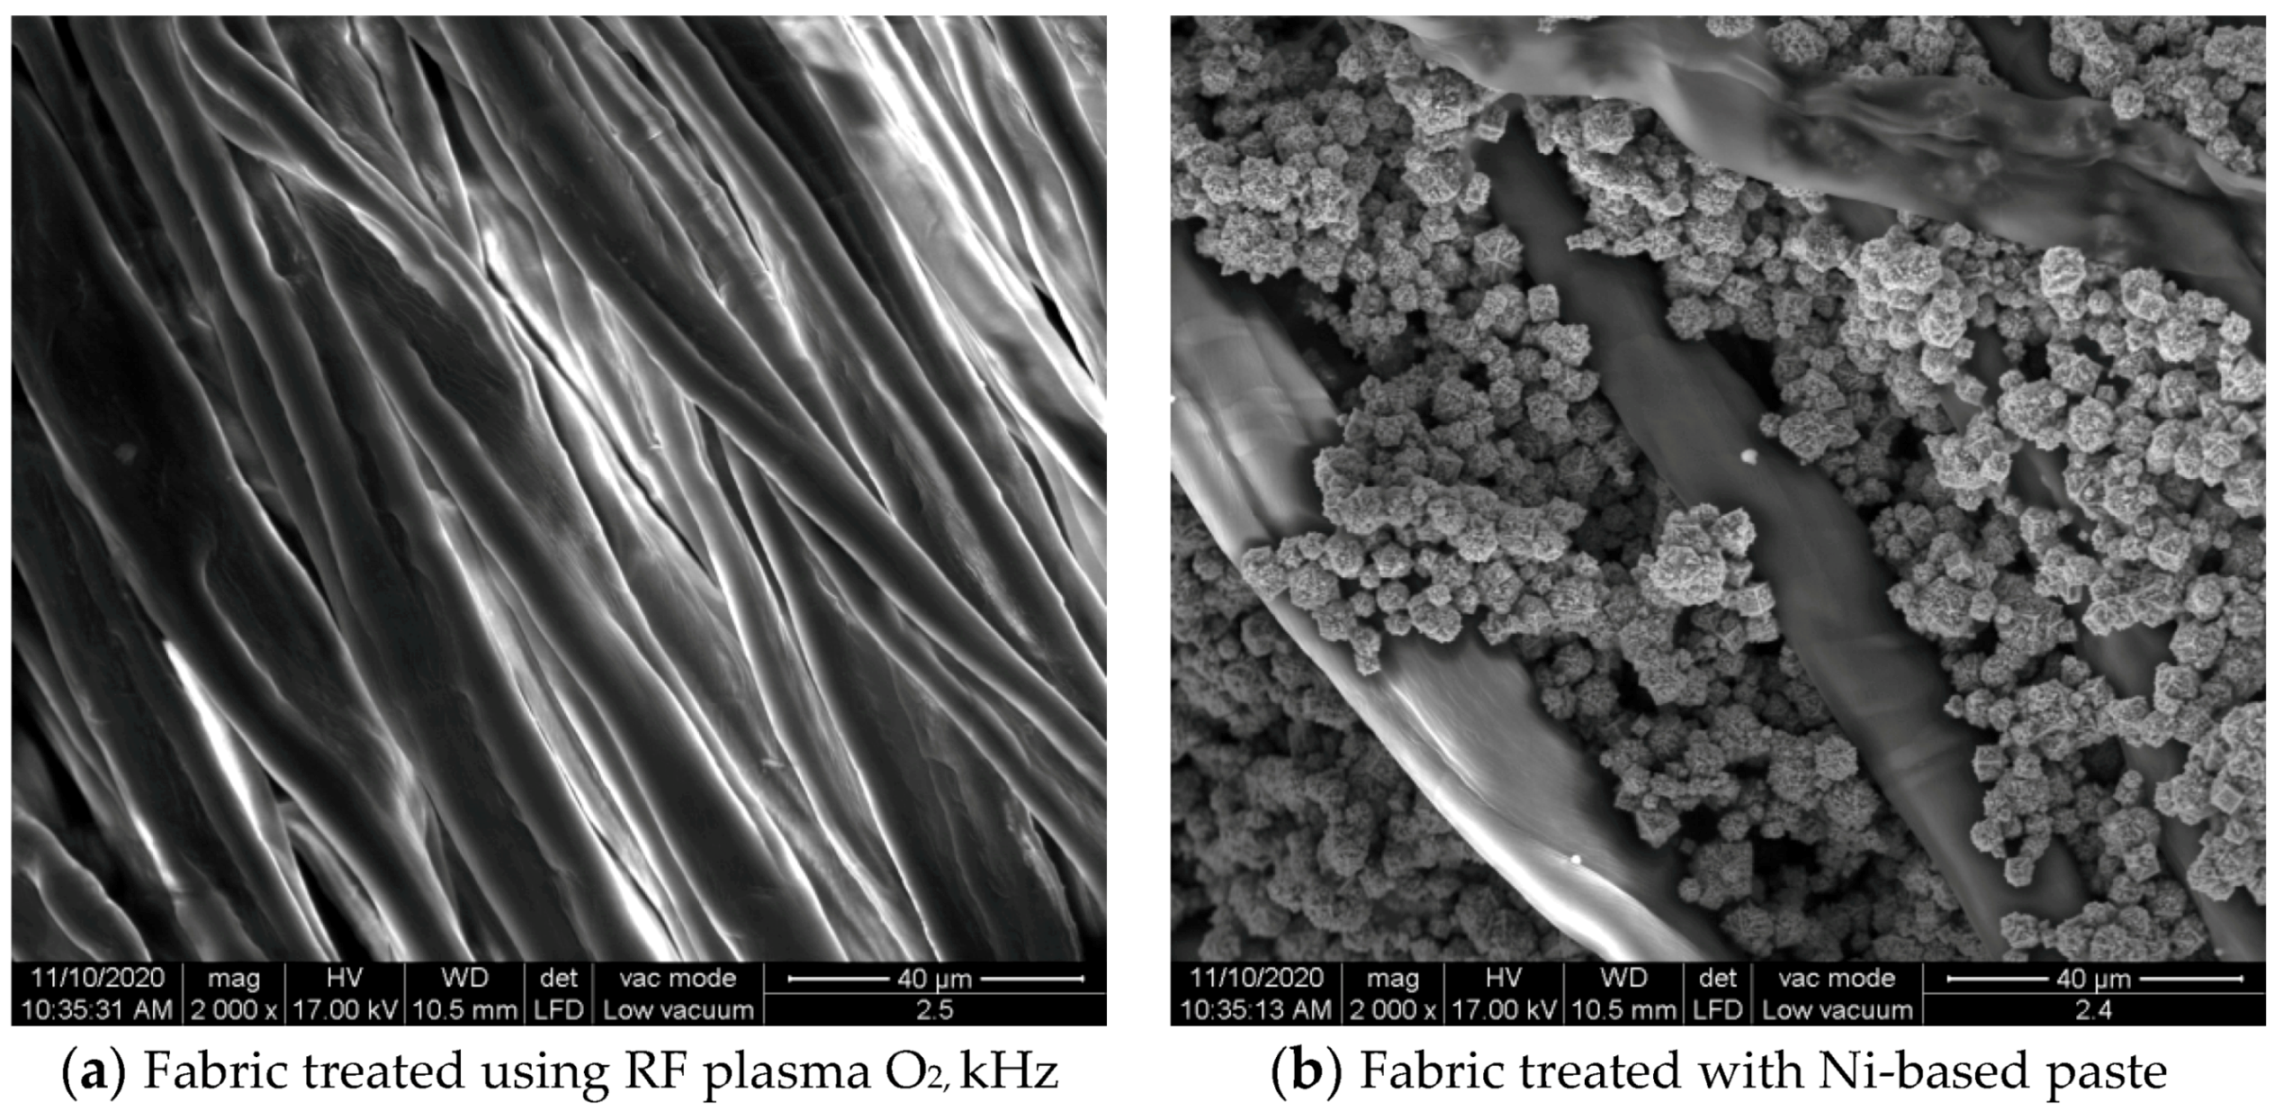
3.1.1. Surface Morphology Using SEM
3.1.2. Surface Topography Using Optical Microscopy
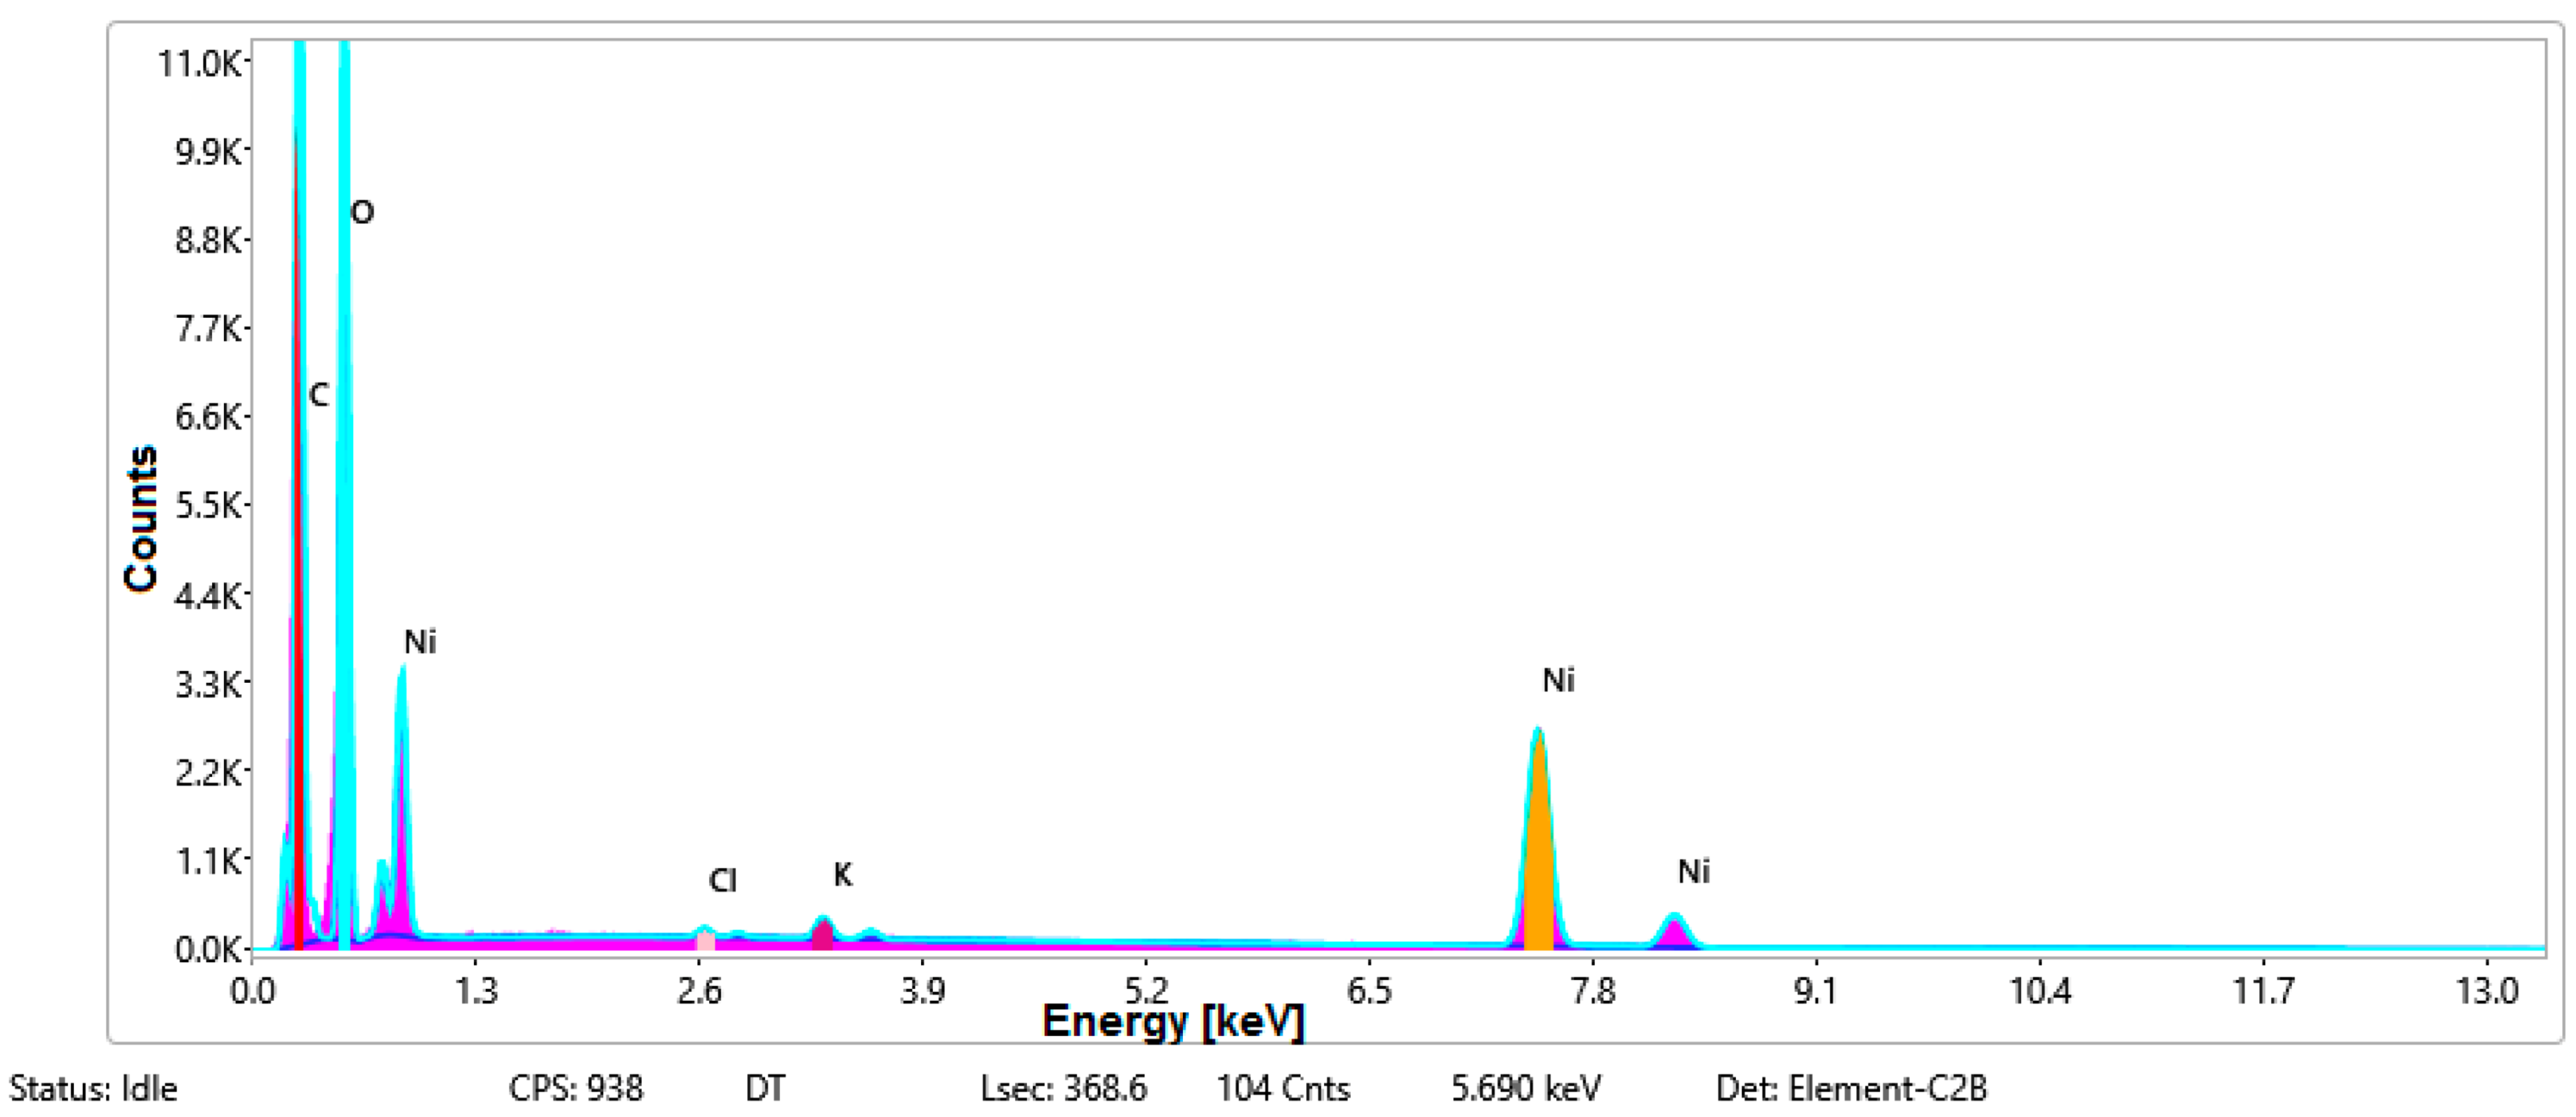
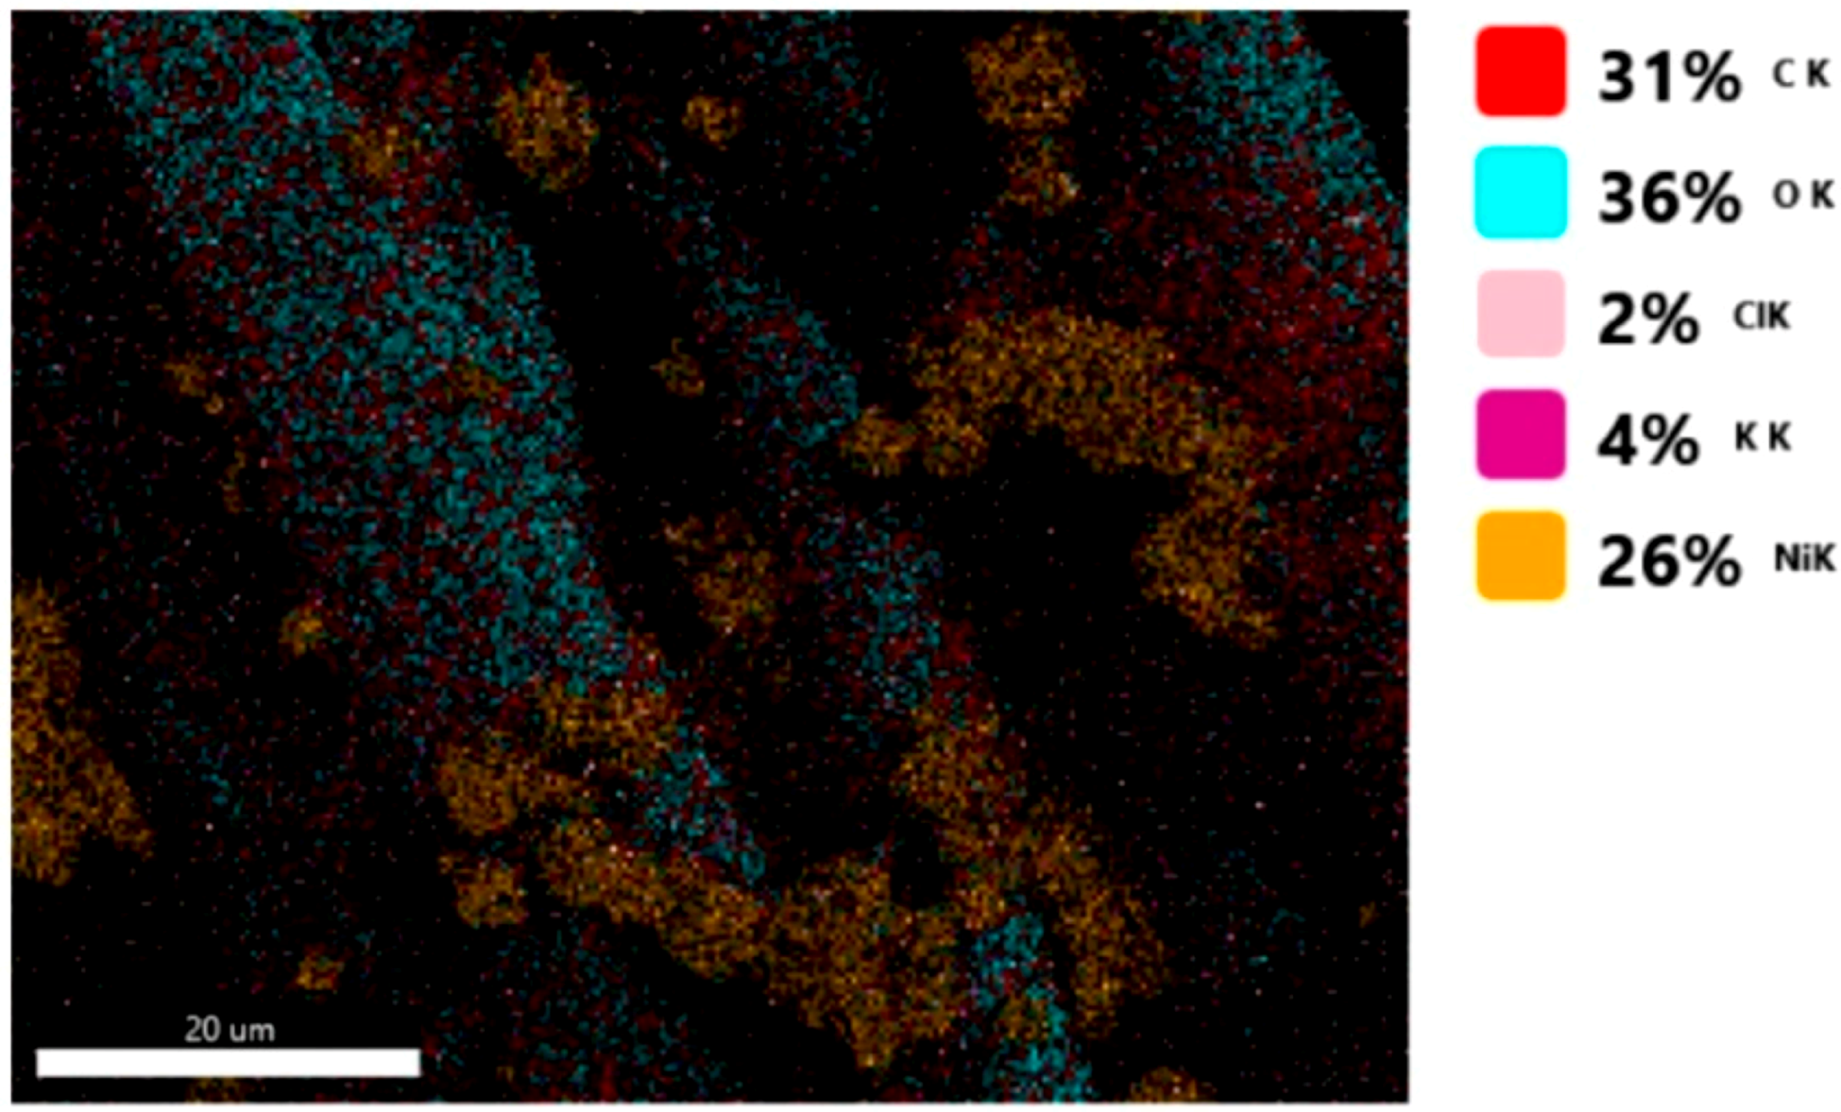
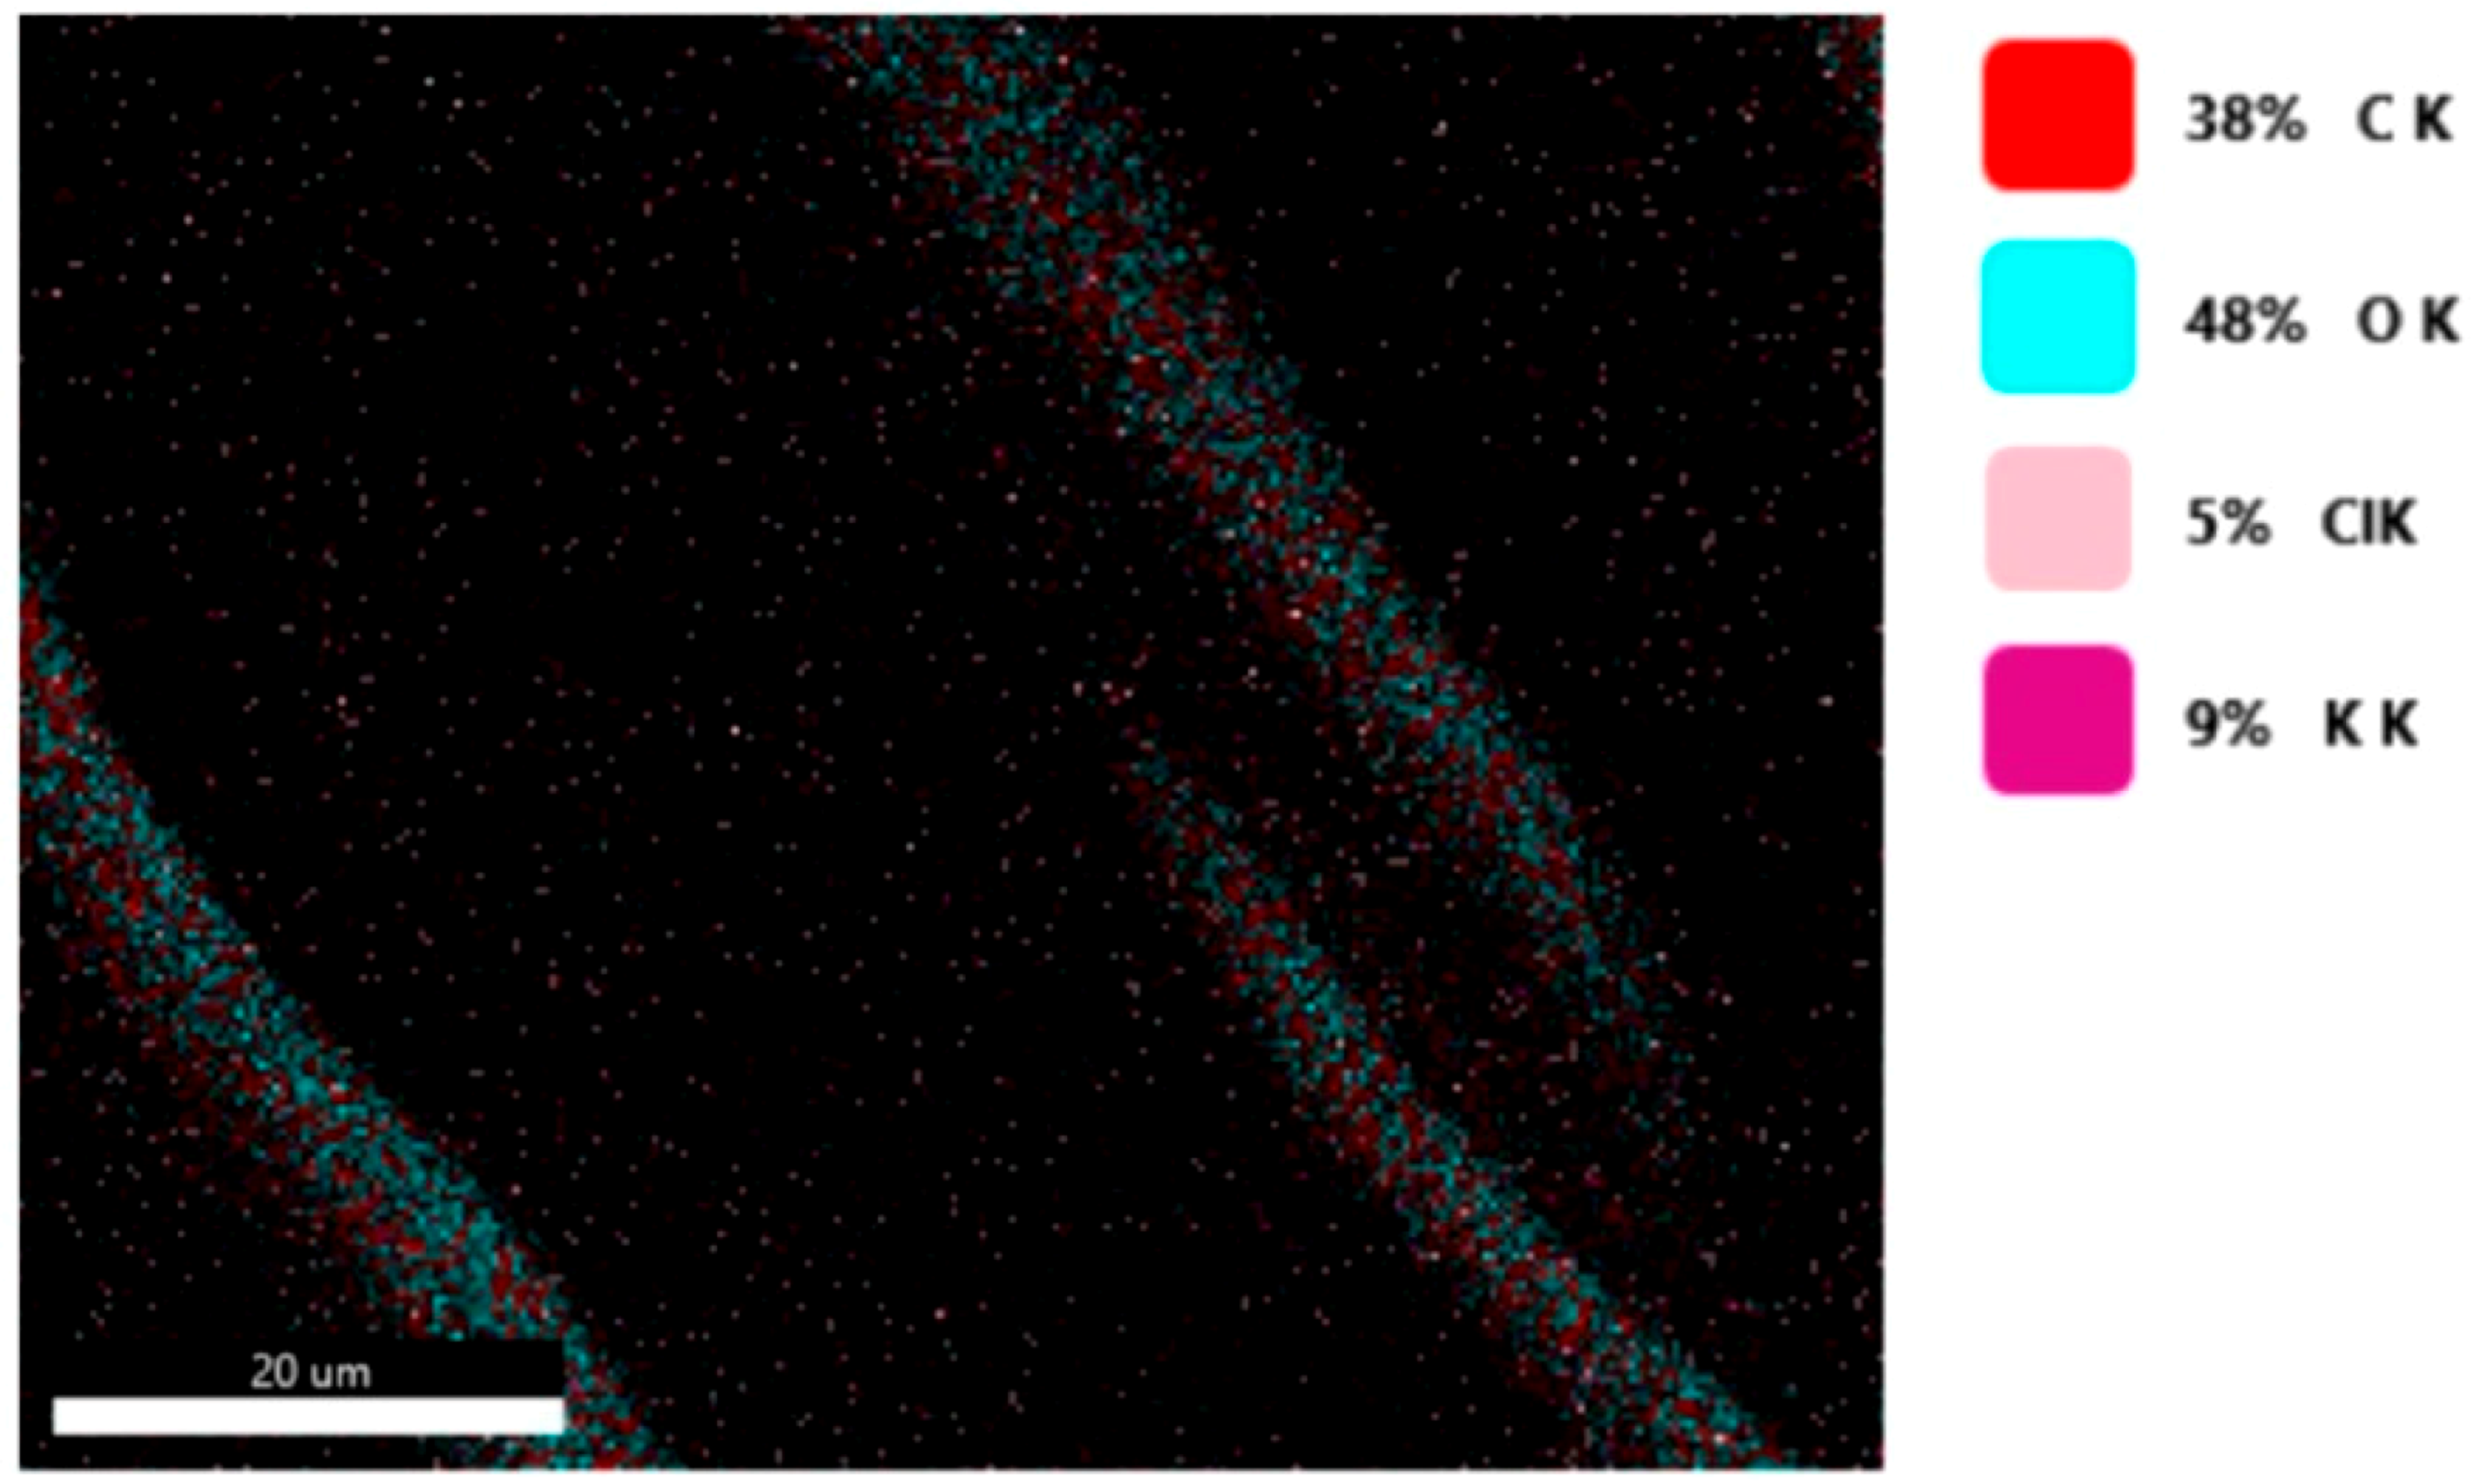
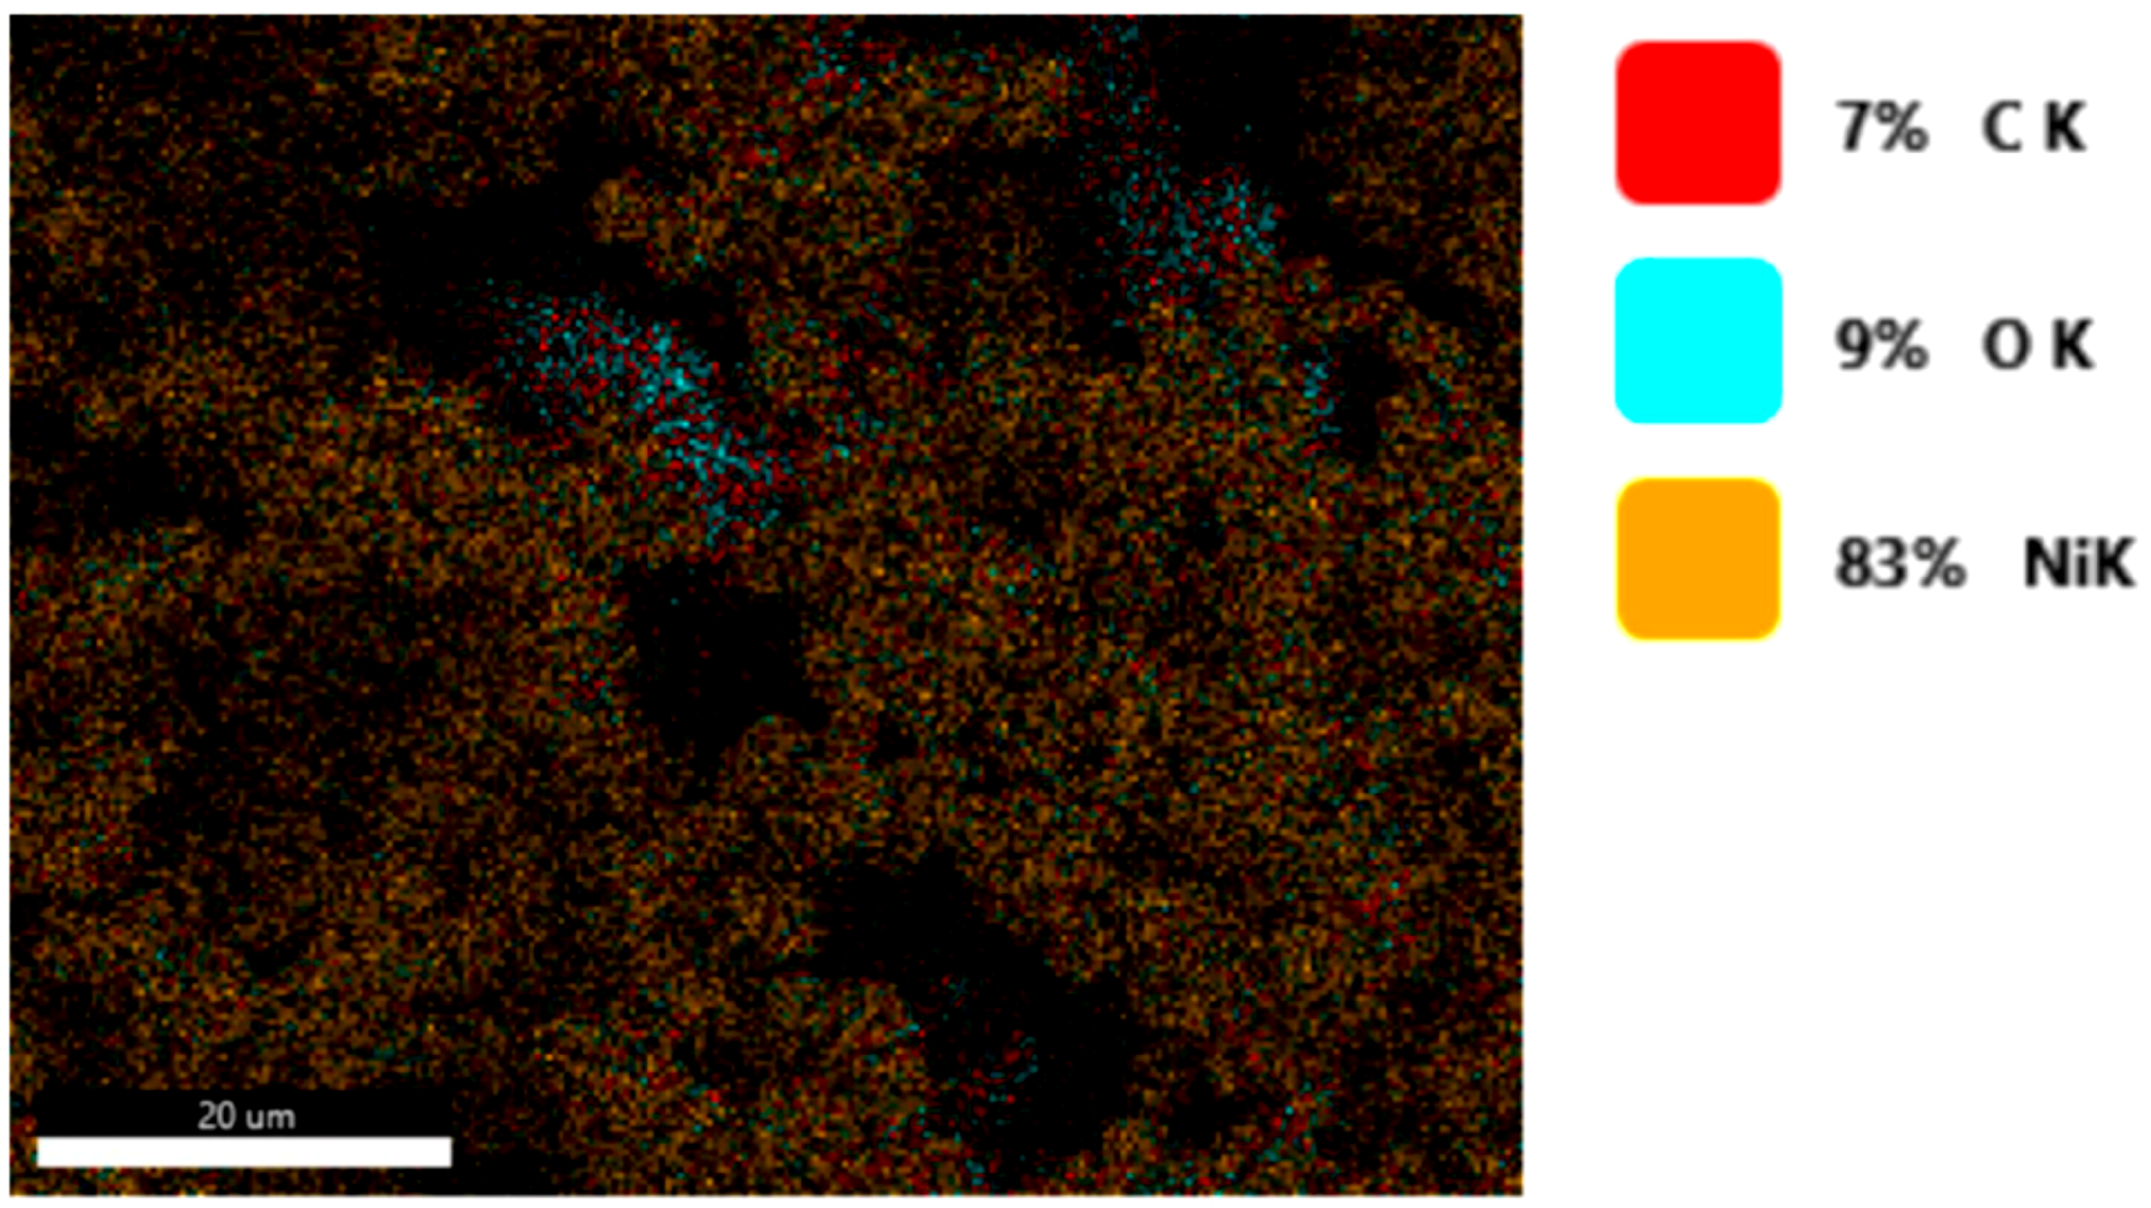
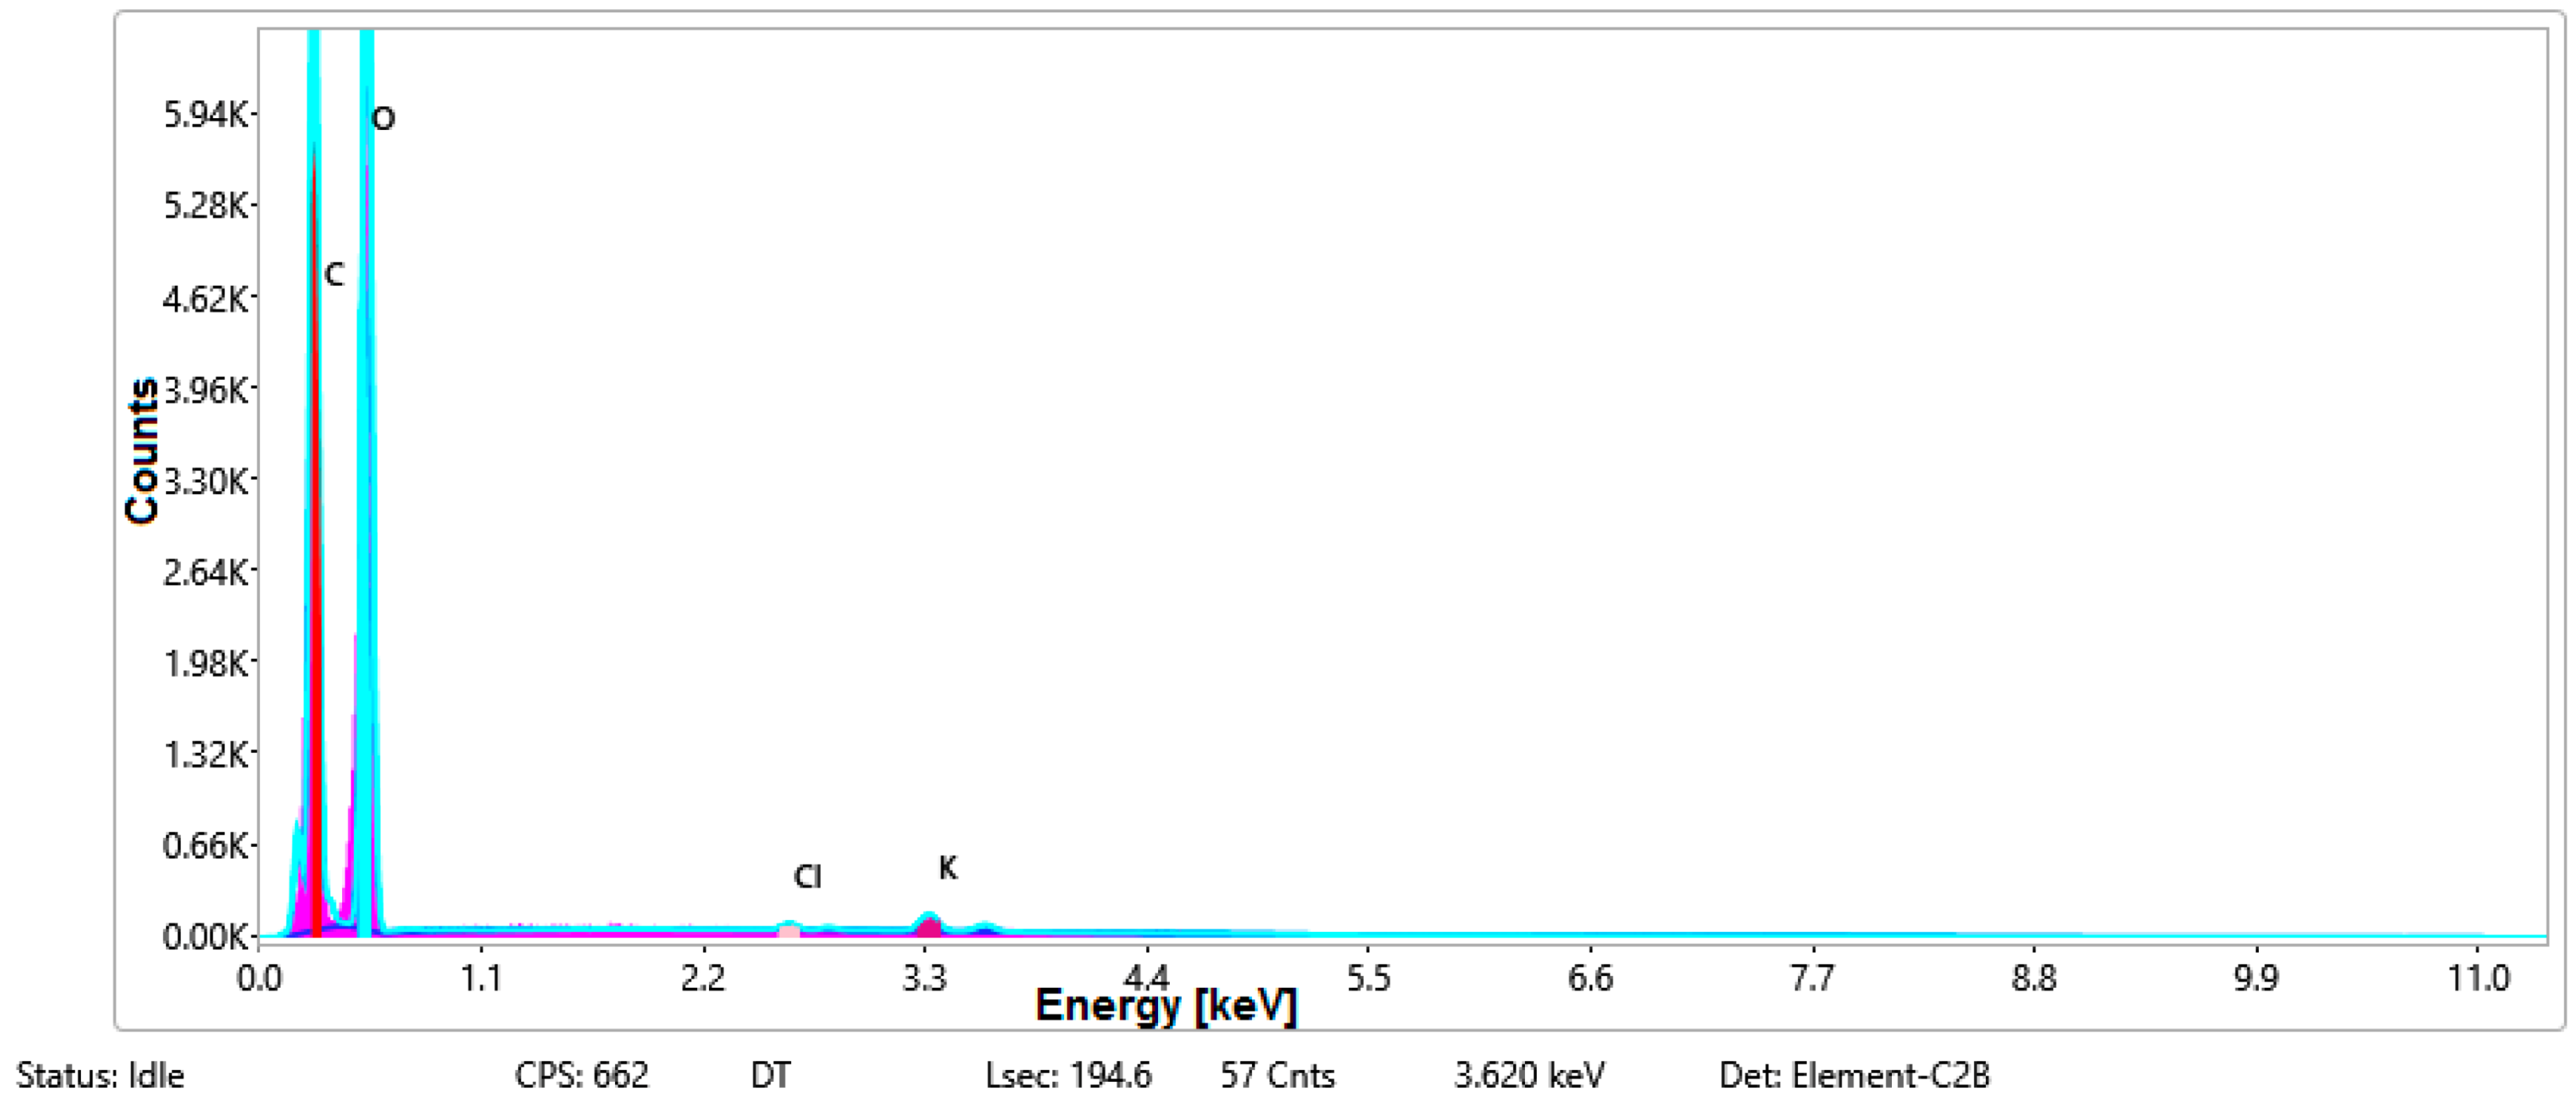
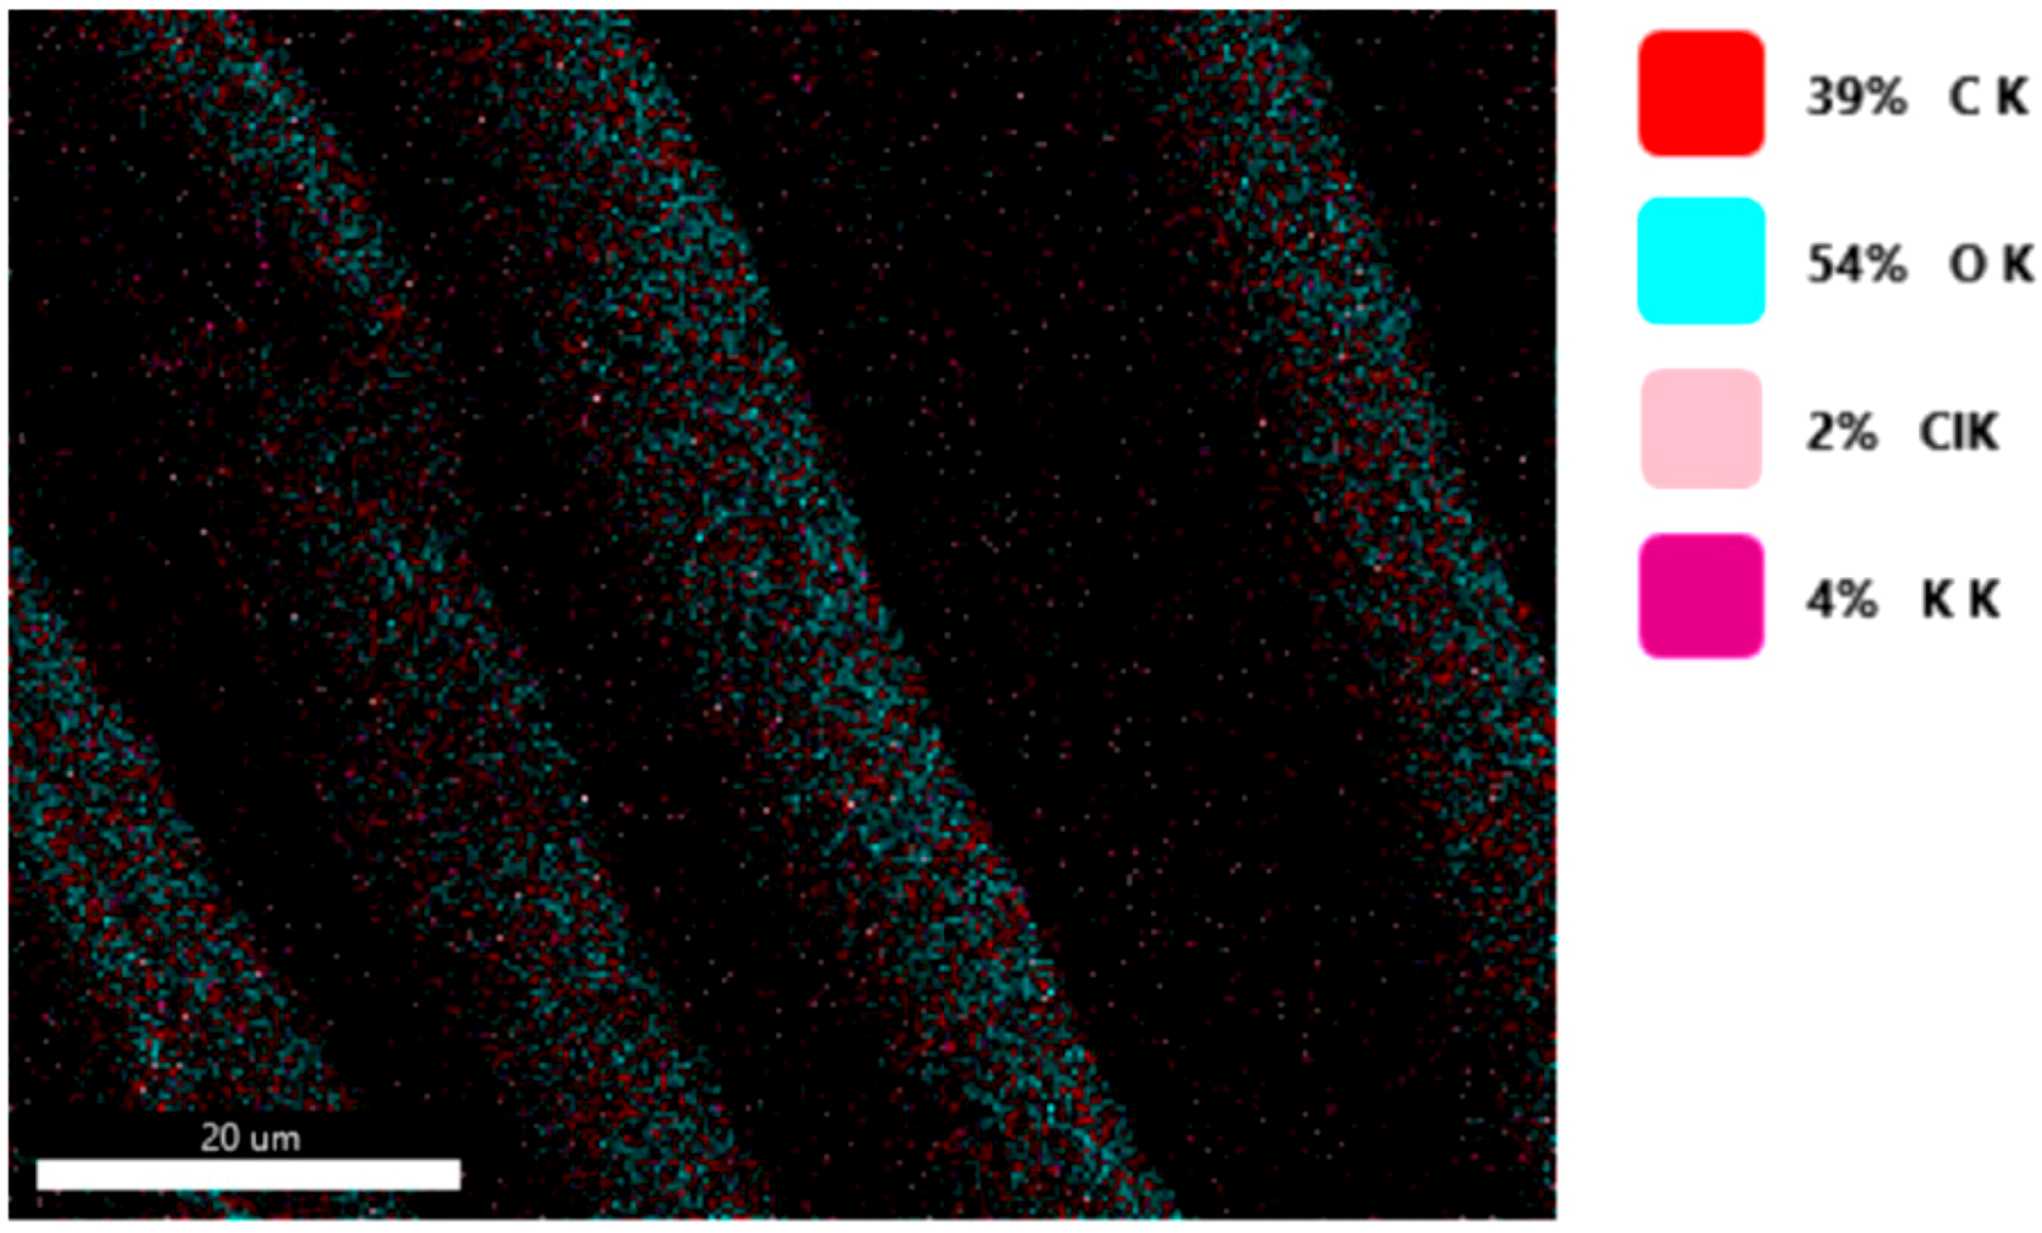
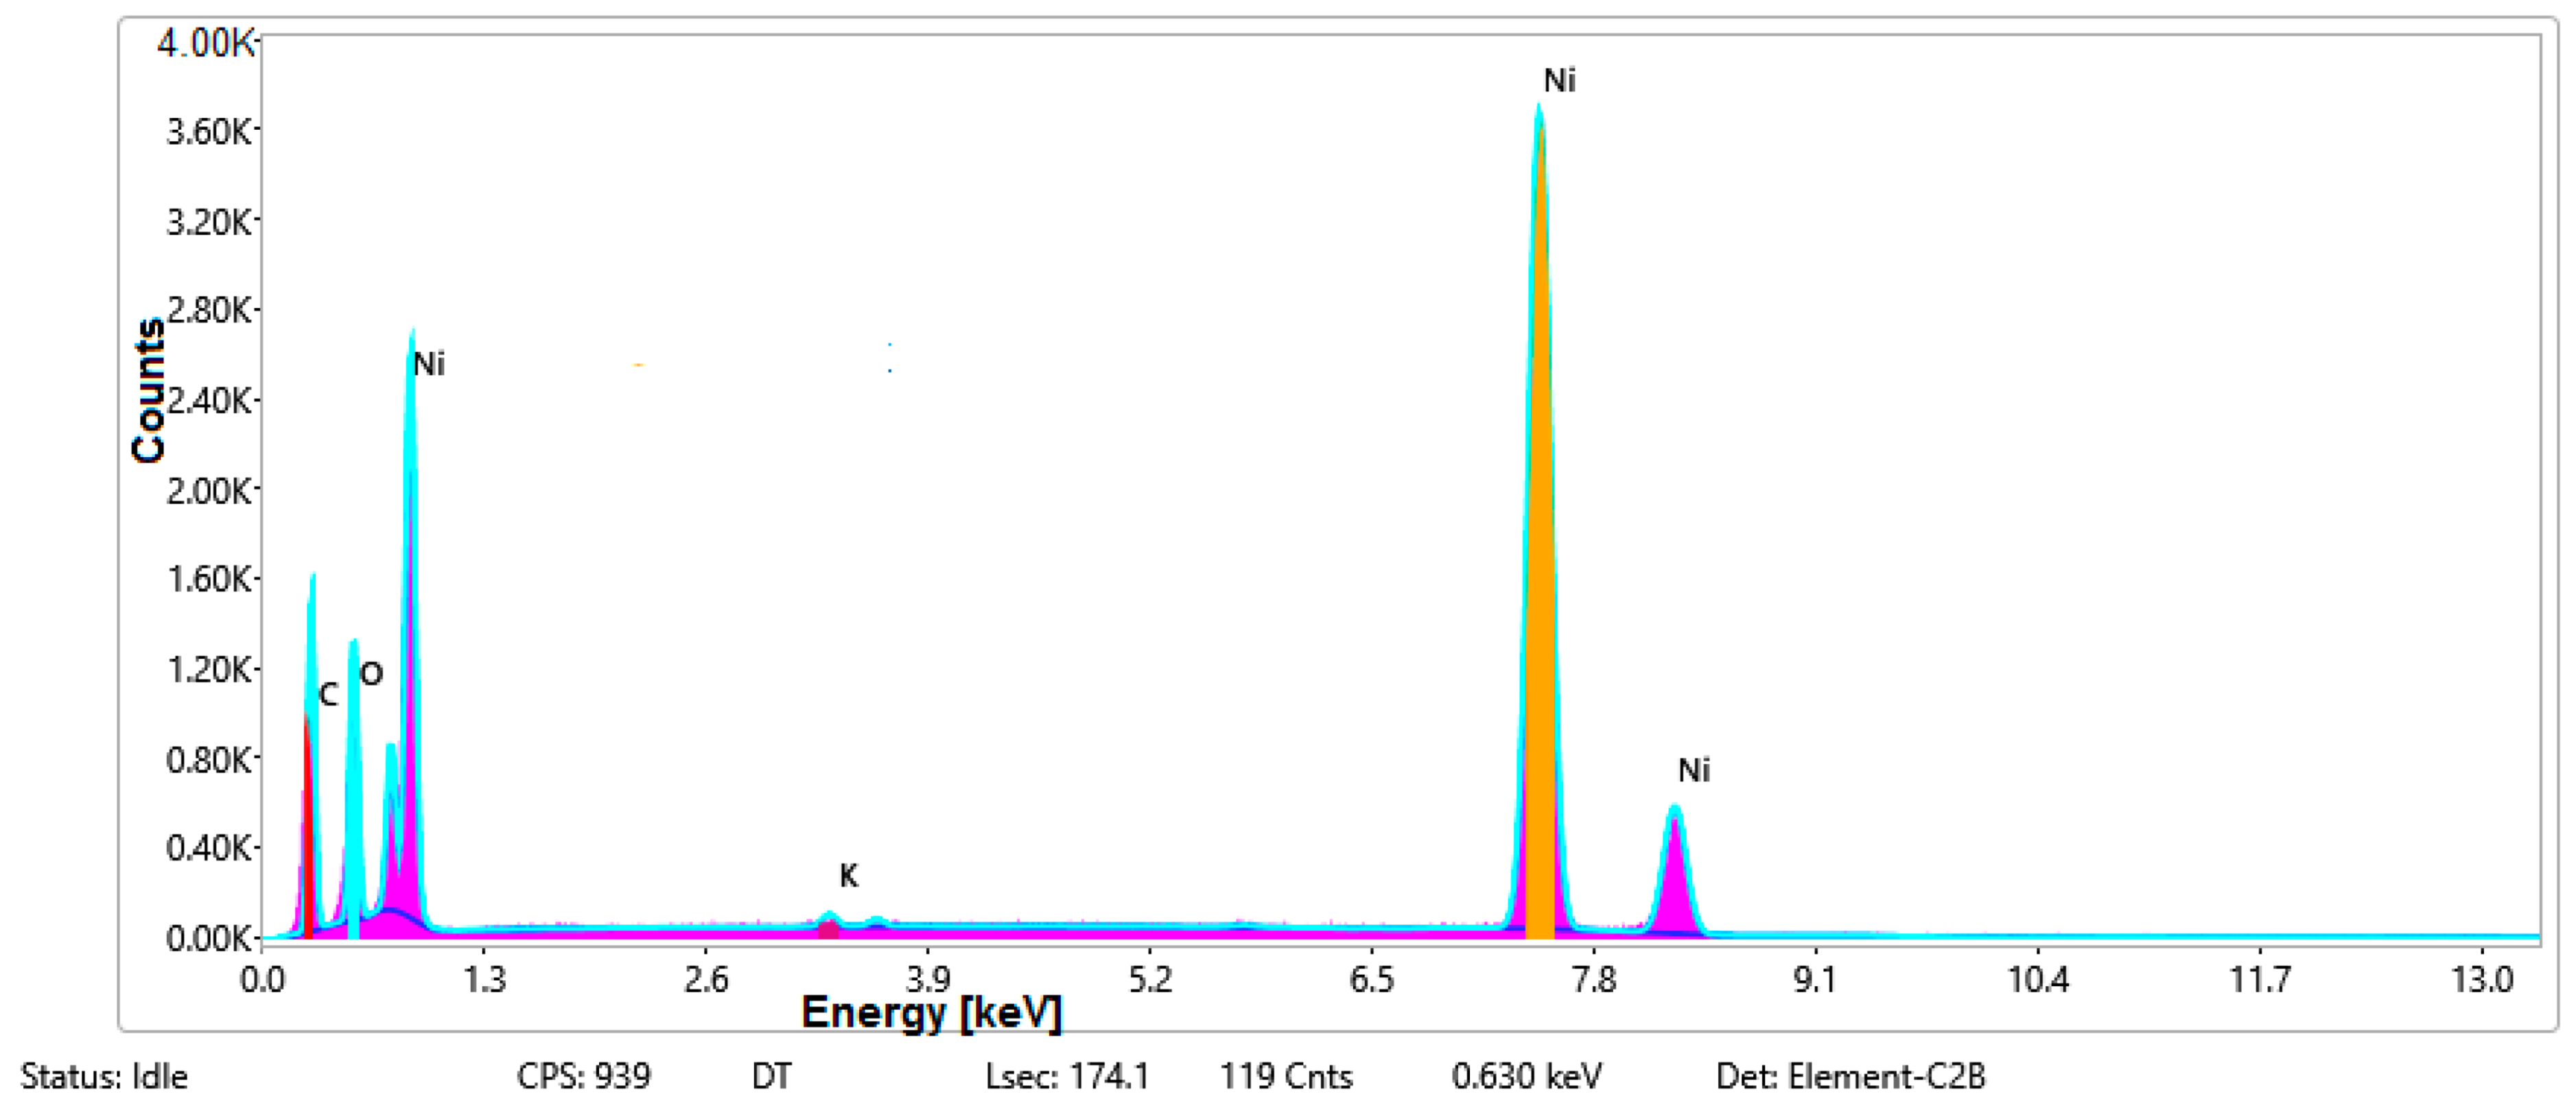
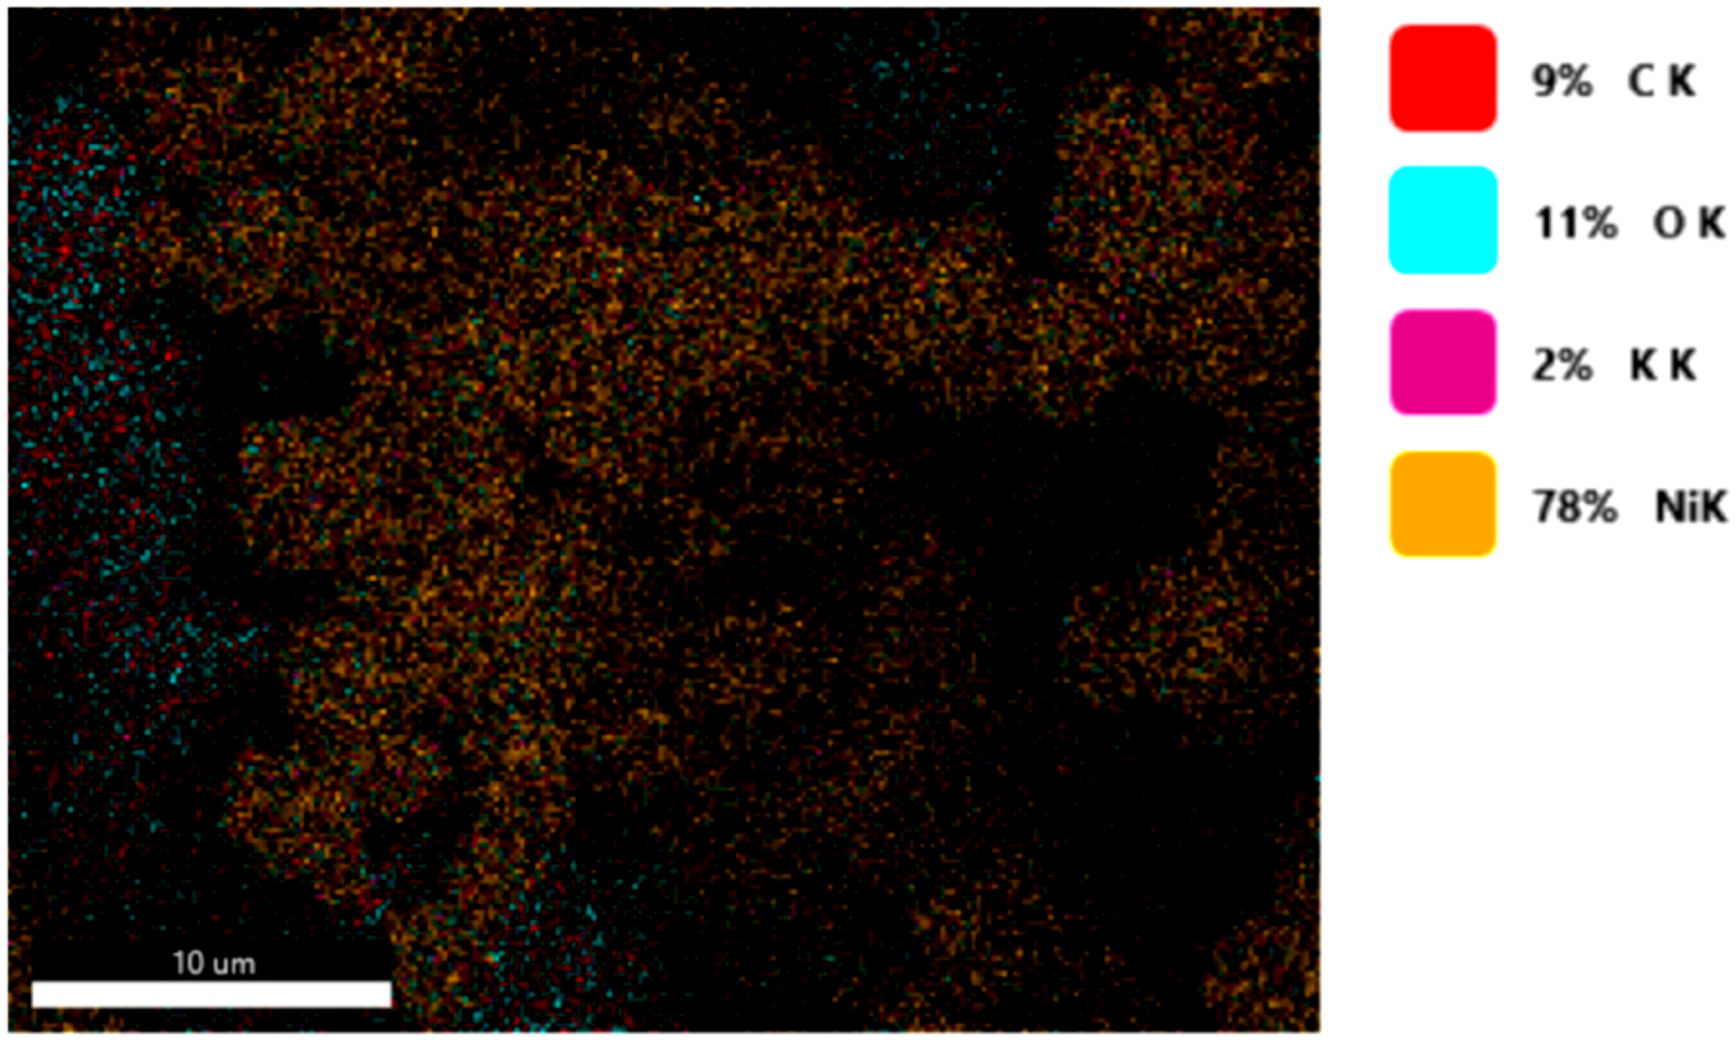
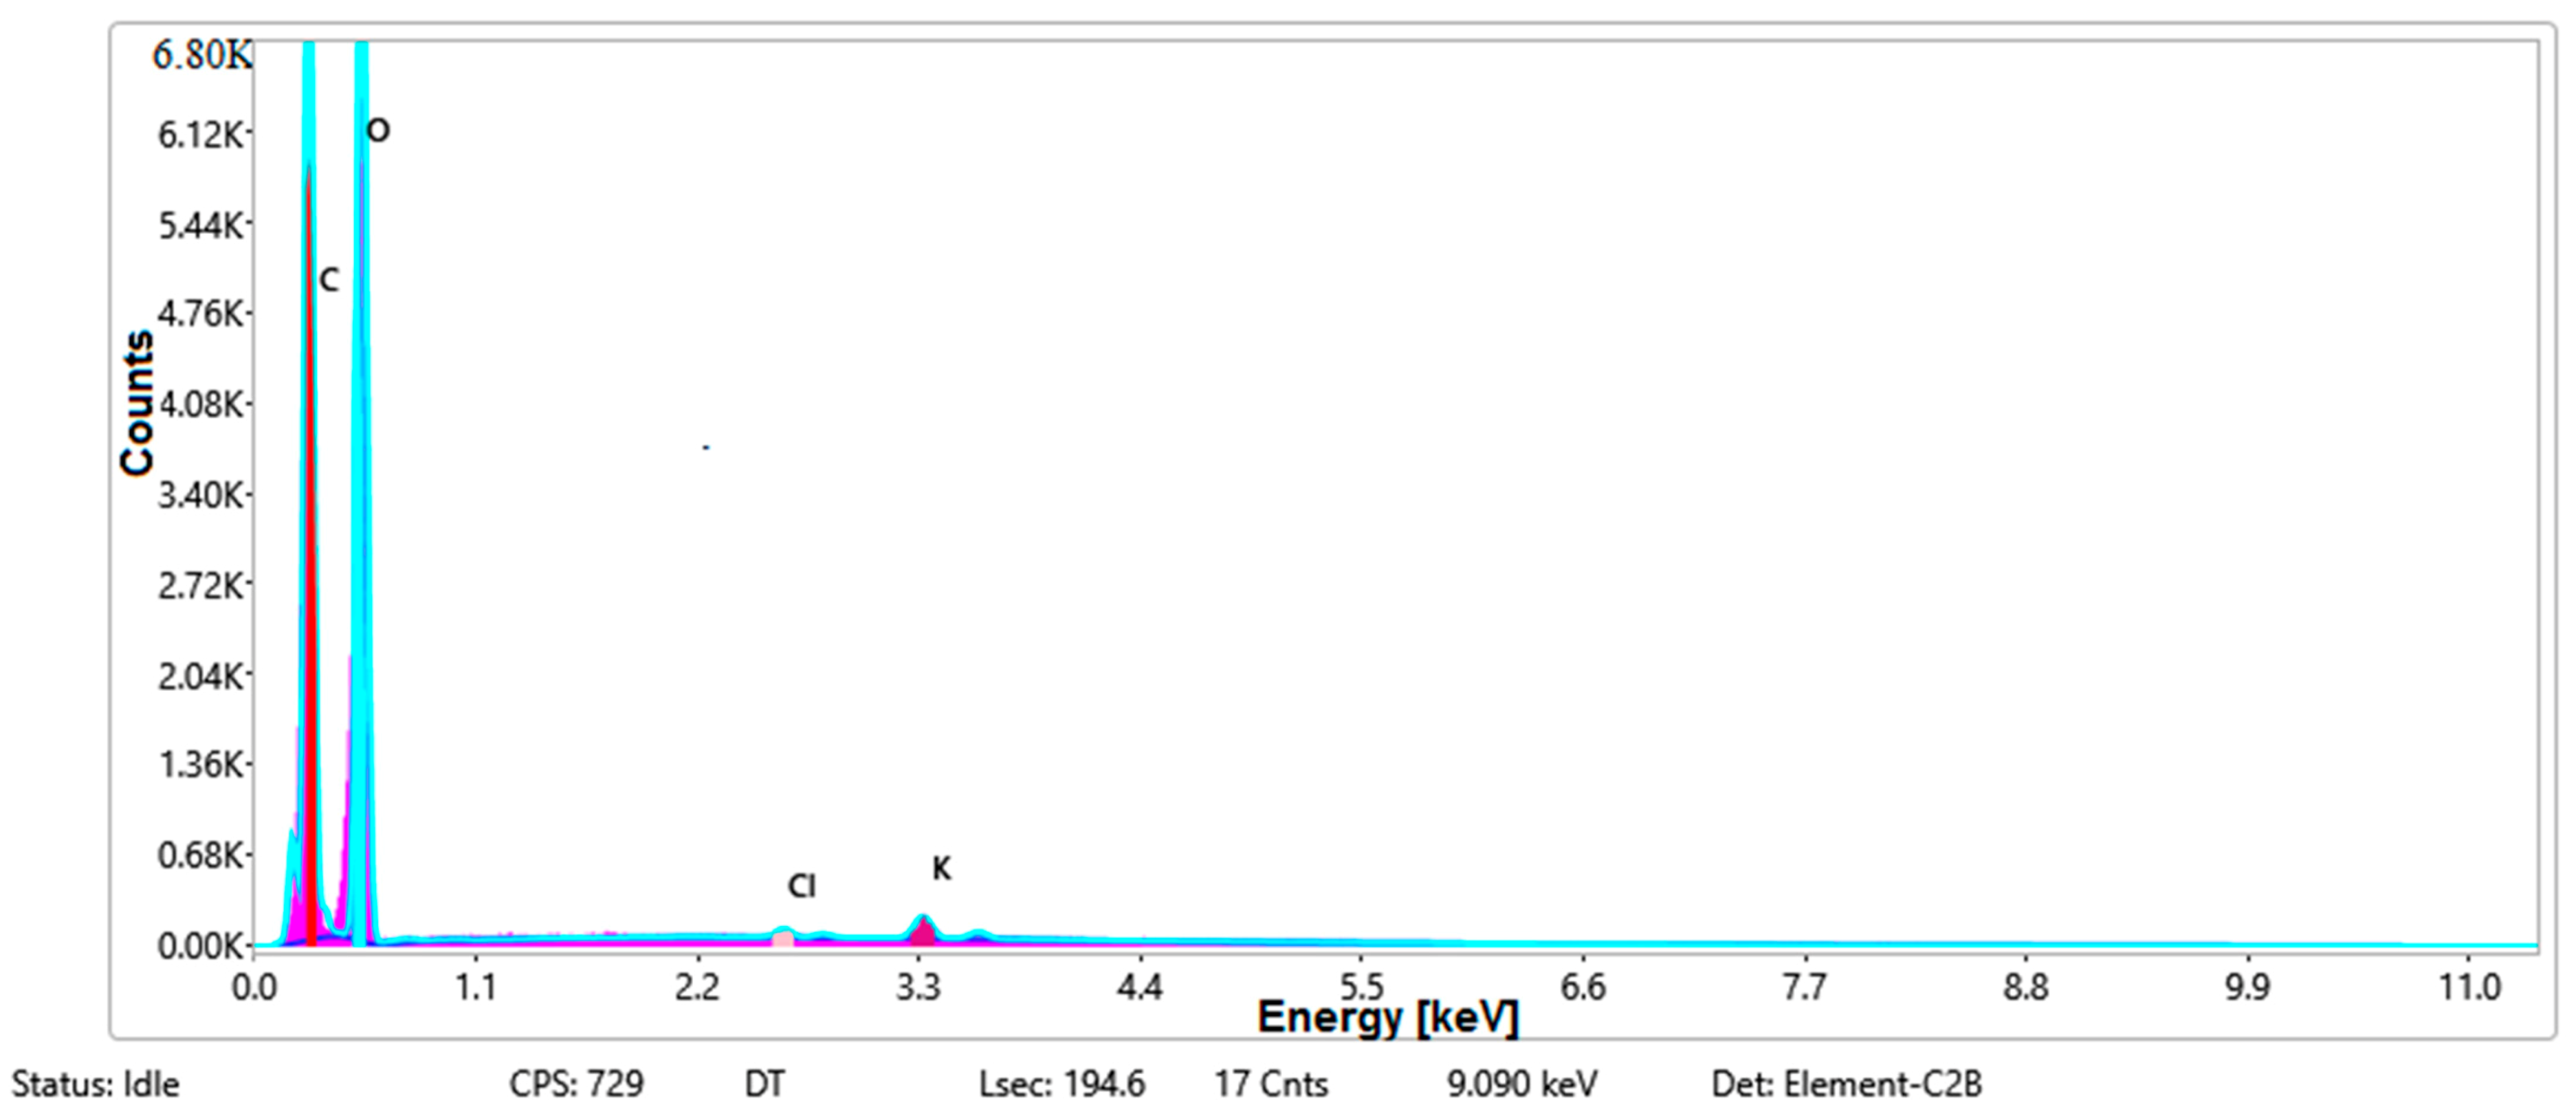
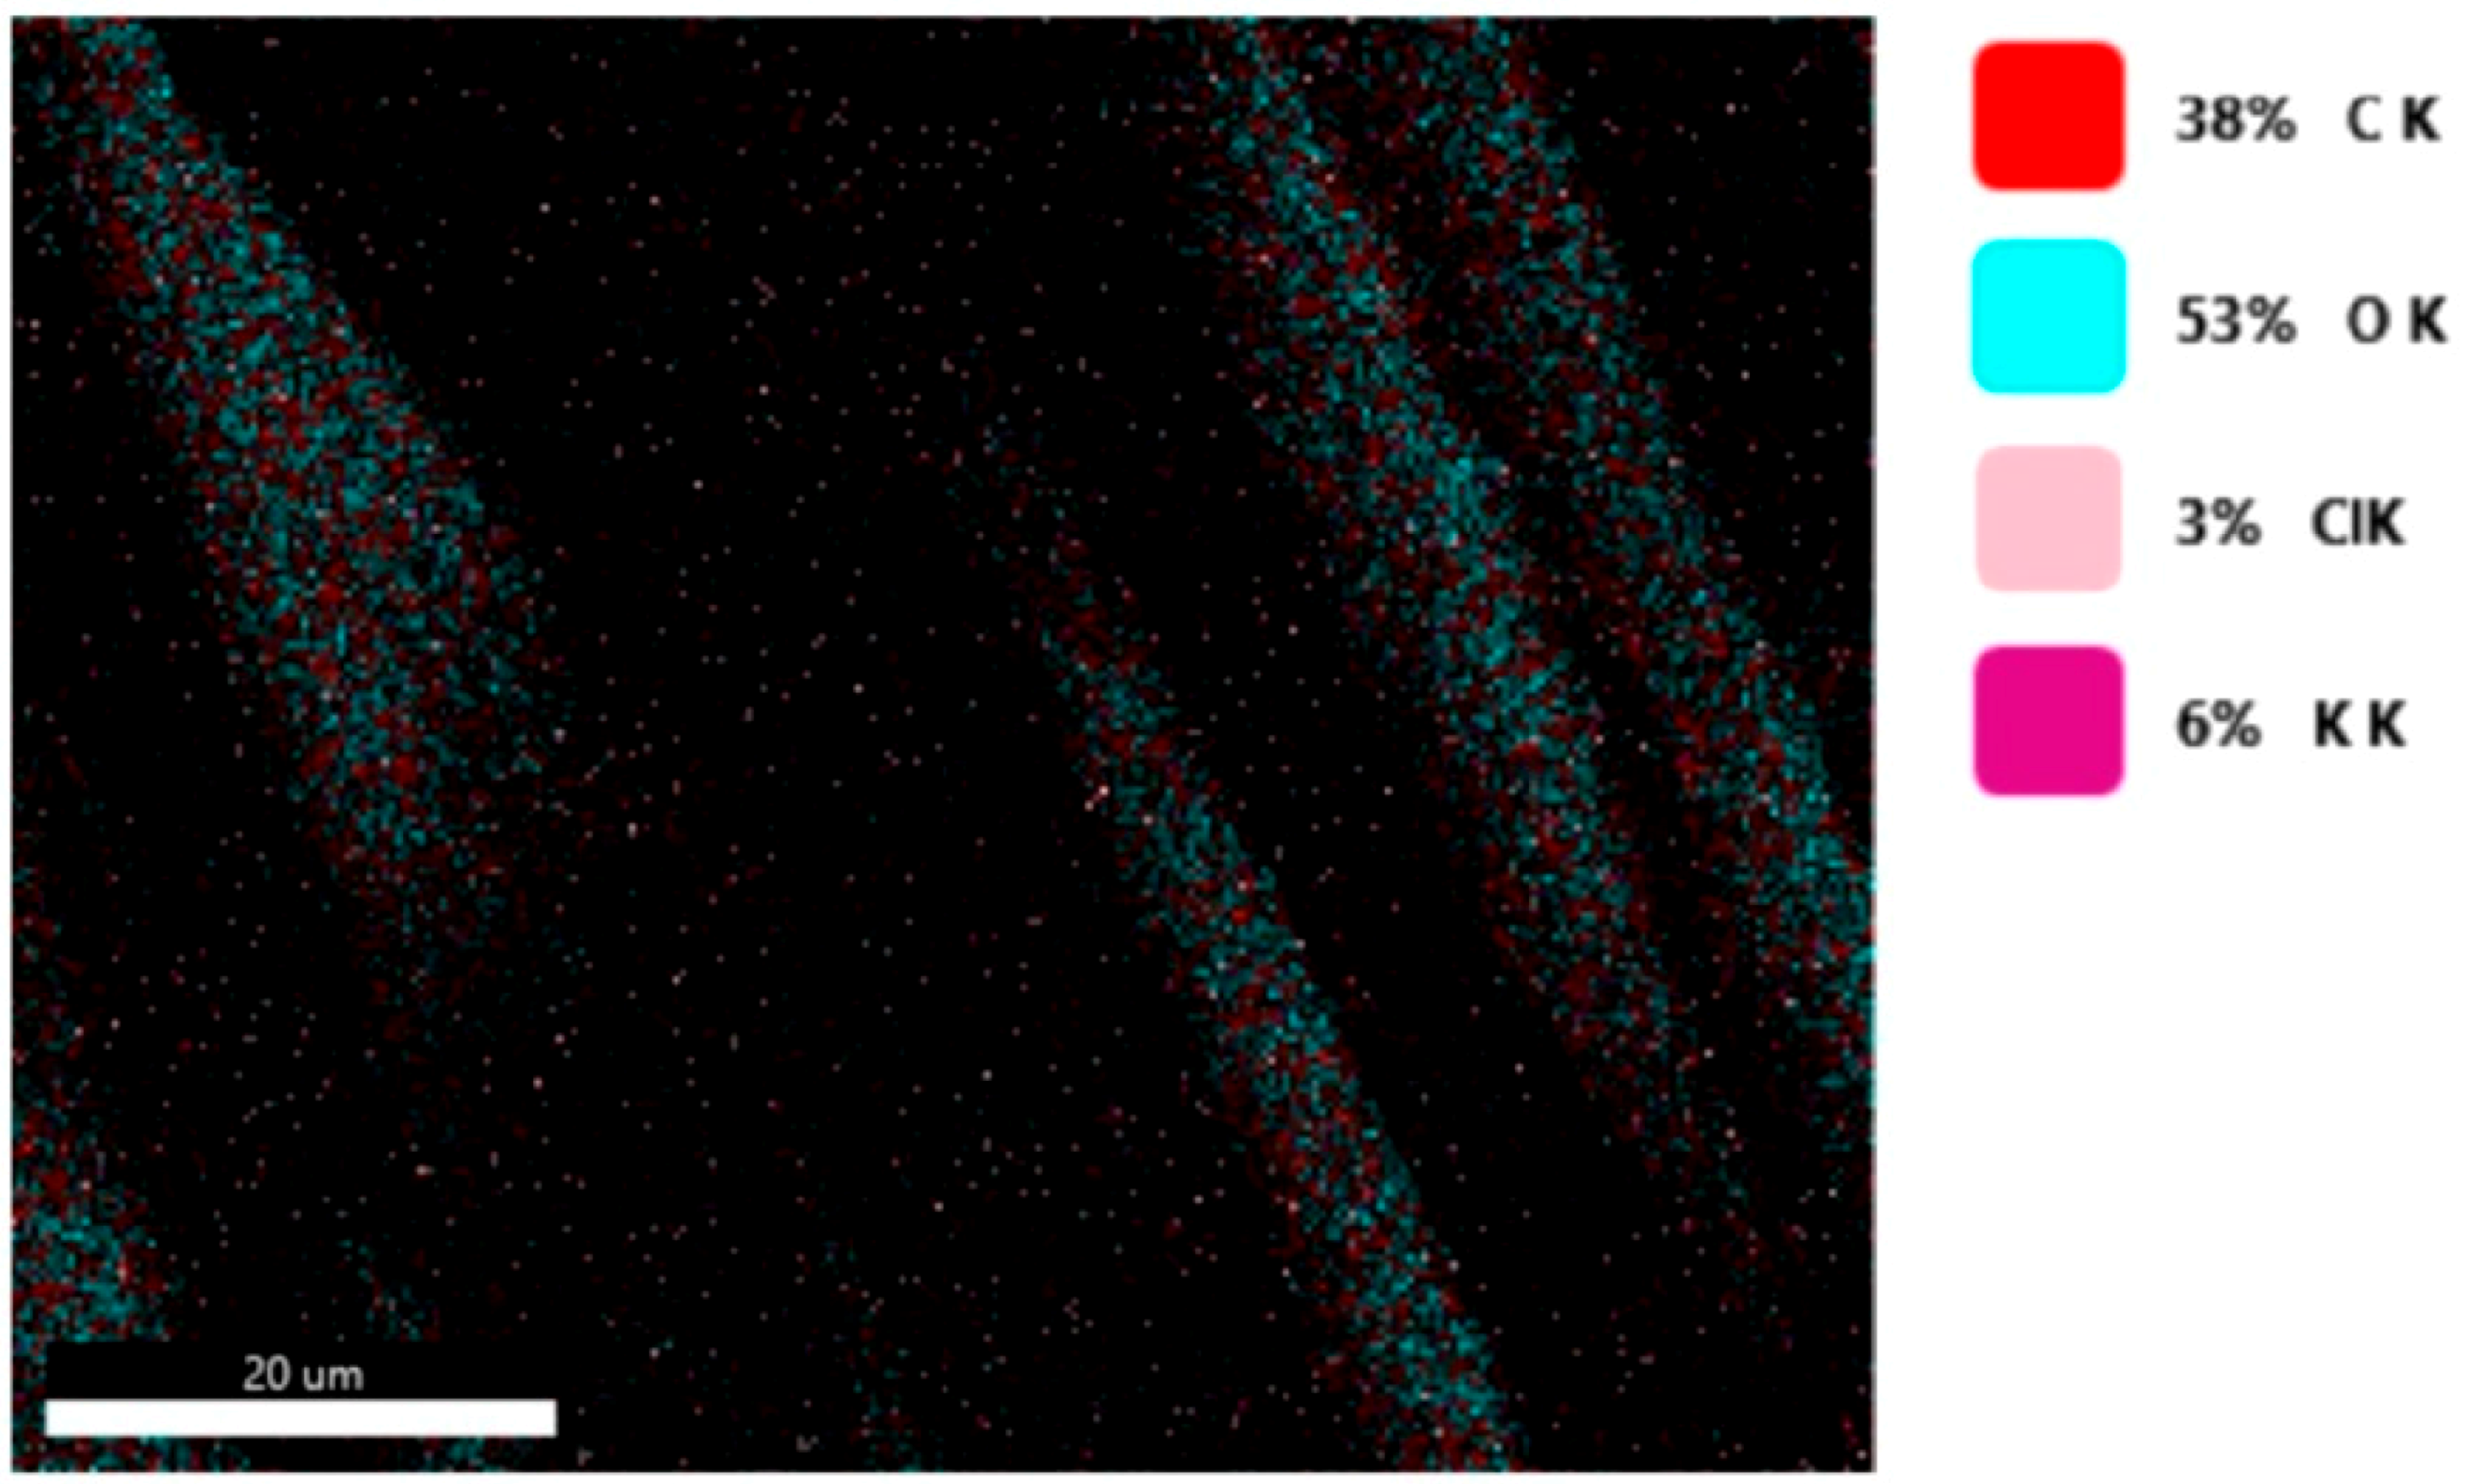
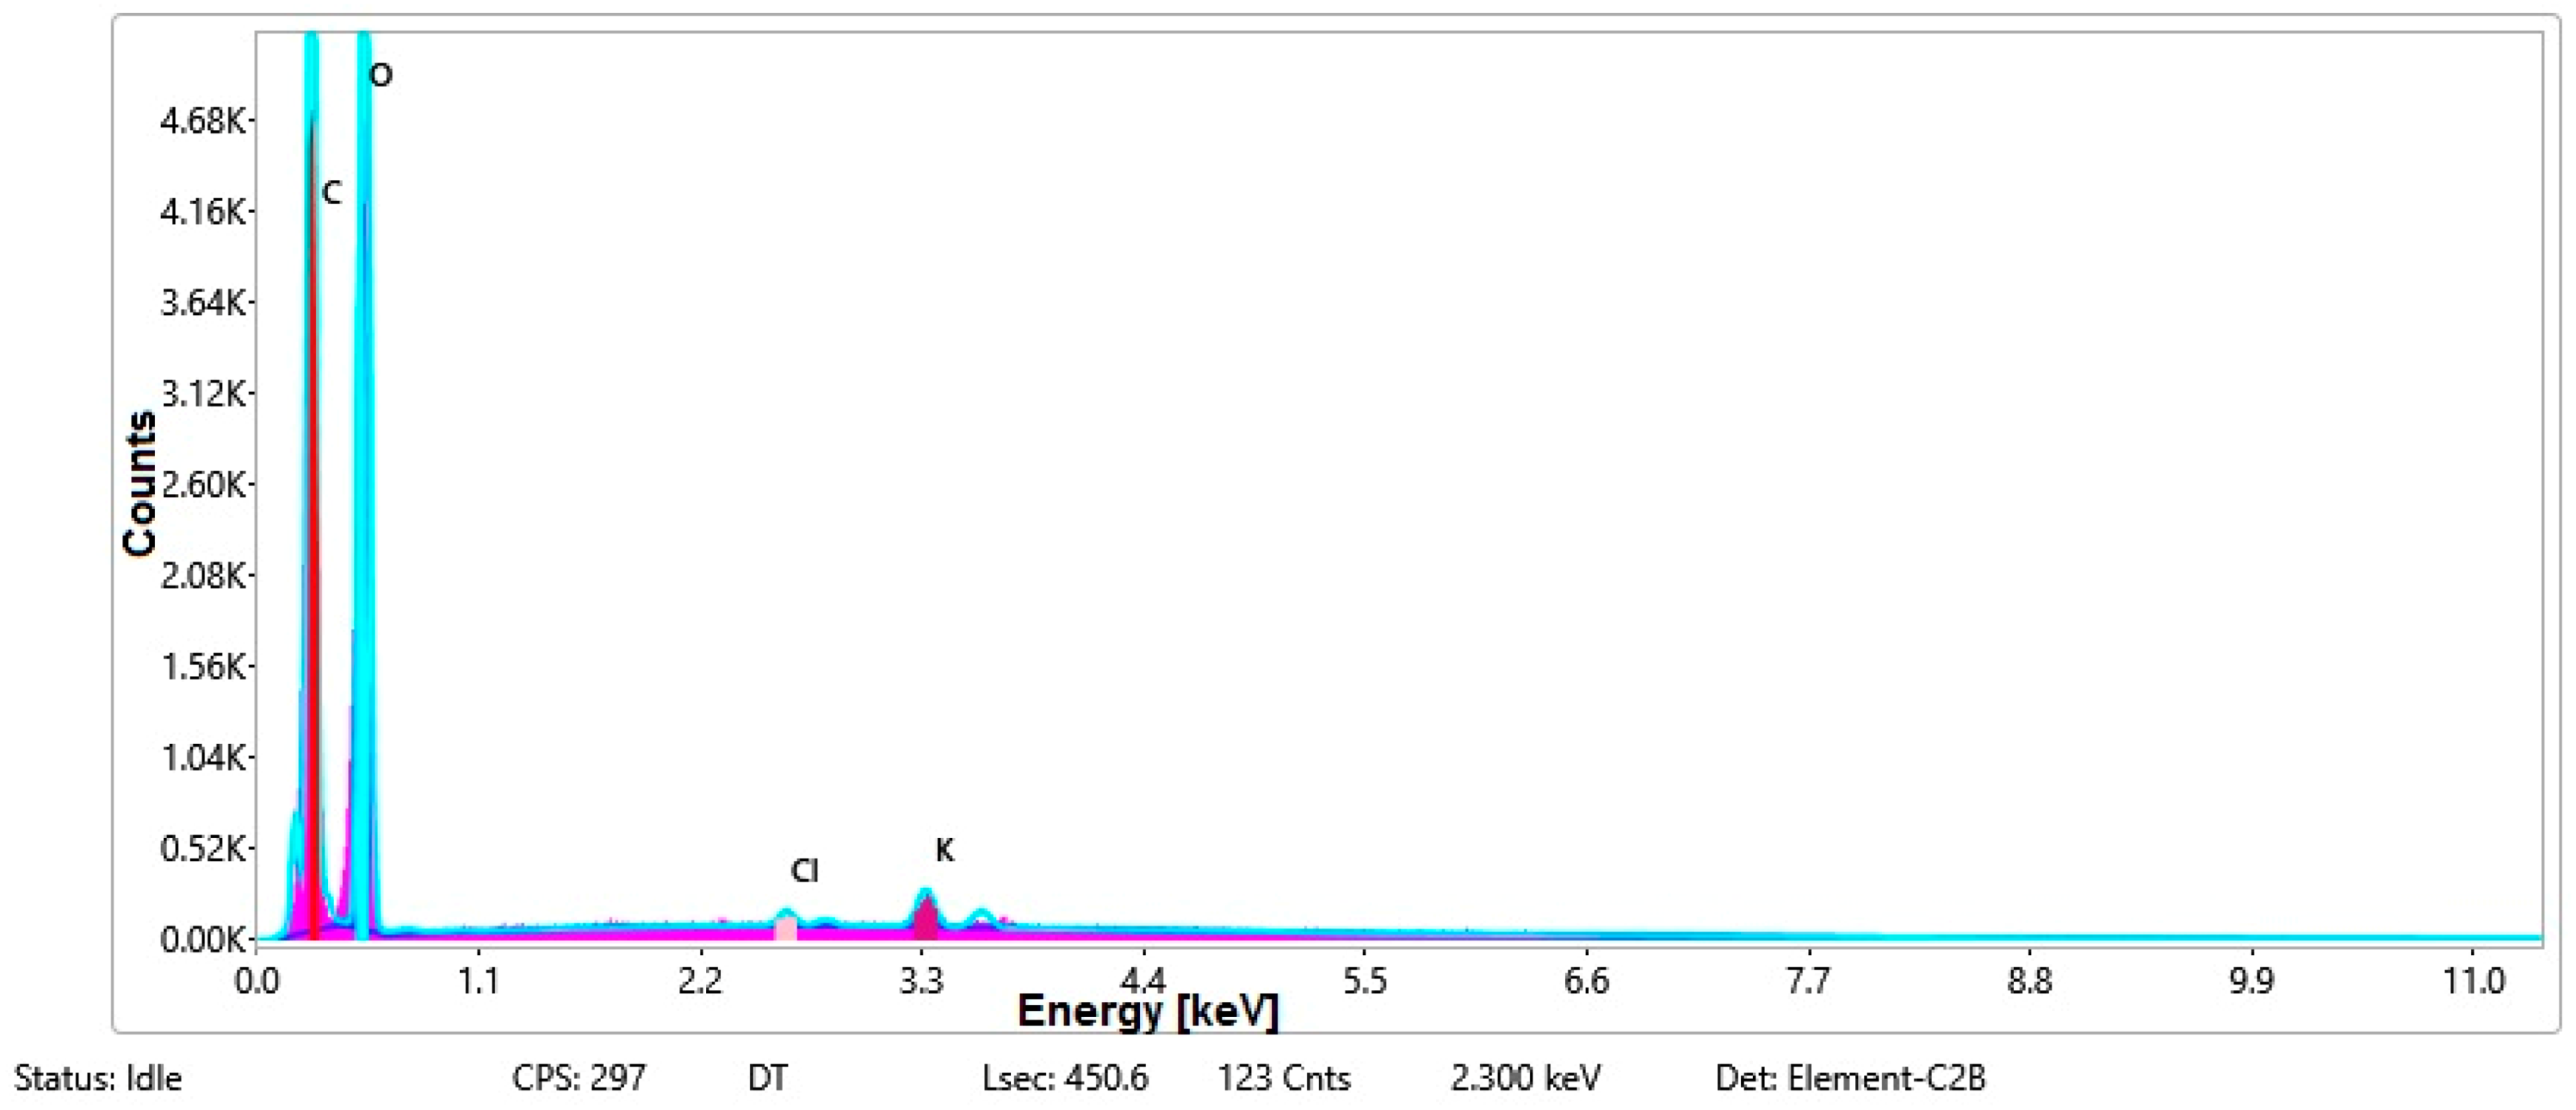
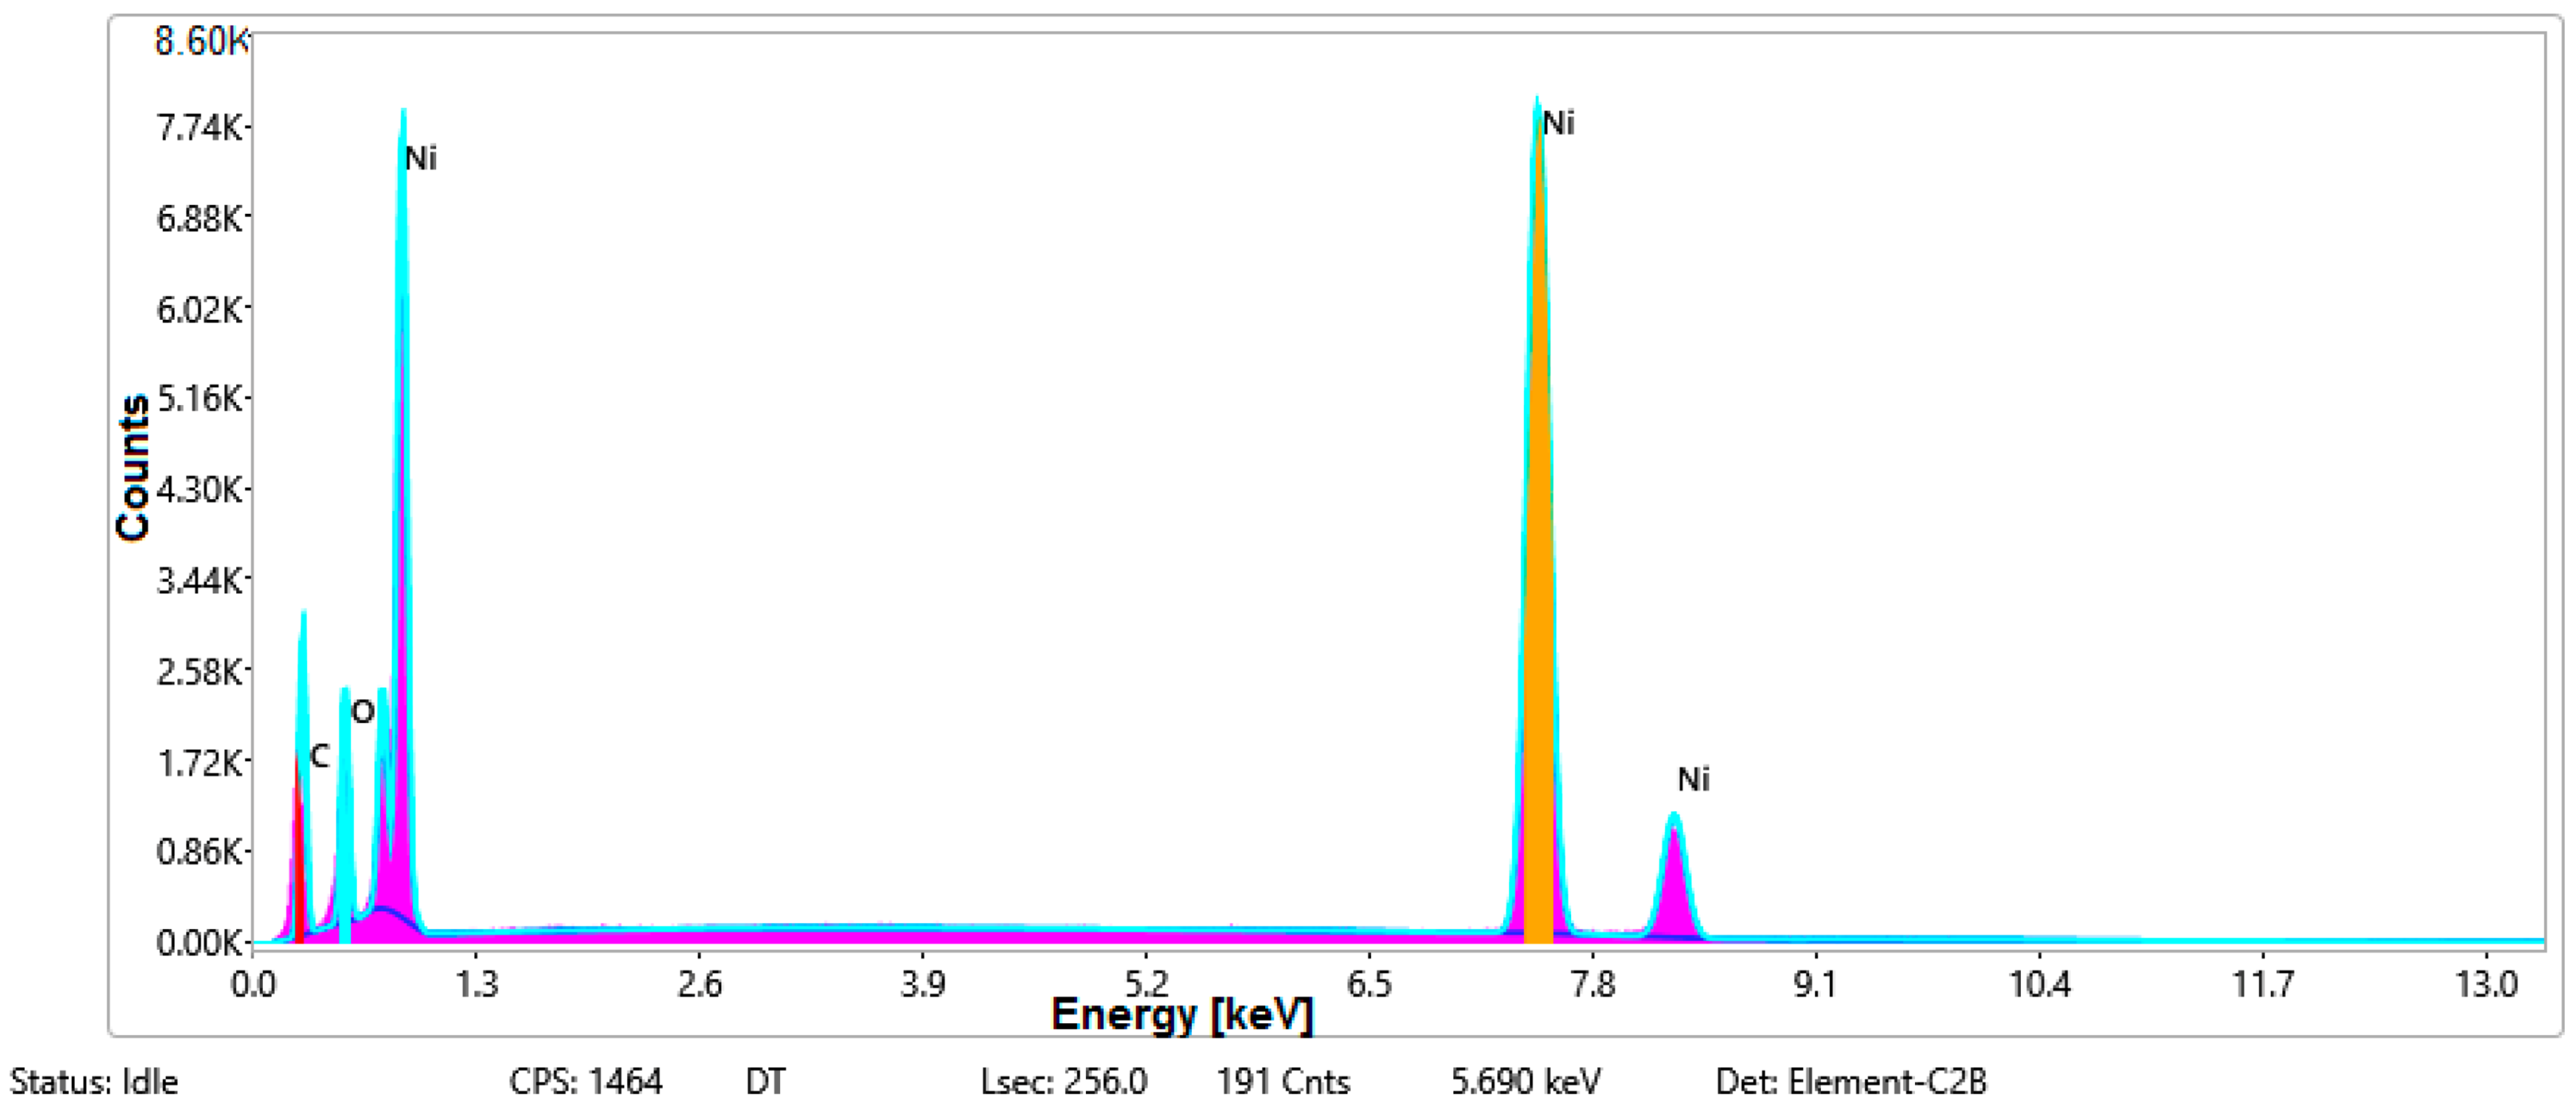
3.1.3. Chemical Composition
4. Discussion
- x, y represents the individual values of the variables x and y;
- represents the arithmetic mean of all the values of x, y;
- sx, sy represents the standard deviation of all values x and y.
5. Conclusions
Author Contributions
Funding
Institutional Review Board Statement
Informed Consent Statement
Data Availability Statement
Acknowledgments
Conflicts of Interest
References
- Höcker, H. Plasma treatment of textile fibers. Pure Appl. Chem. 2002, 74, 423–427. [Google Scholar] [CrossRef]
- Rauscher, H.; Perucca, M.; Buyle, G. (Eds.) Plasma Technology for Hyperfunctional Surfaces: Food, Biomedical and Textile Applications; John Wiley & Sons: Hoboken, NJ, USA, 2010. [Google Scholar]
- Takamatsu, T.; Hirai, H.; Sasaki, R.; Miyahara, H.; Okino, A. Surface hydrophilization of polyimide films using atmospheric damage-free multigas plasma jet source. IEEE Trans. Plasma Sci. 2012, 41, 119–125. [Google Scholar] [CrossRef]
- Kale, K.; Palaskar, S. Atmospheric Pressure Glow Discharge of Helium-Oxygen Plasma Treatment on Polyester/Cotton Blended Fabric. Indian J. Fibre Text. Res. 2011, 36, 137–144. Available online: nopr.niscair.res.in (accessed on 30 September 2020).
- Kamel, M.M.; El Zawahry, M.M.; Helmy, H.; Eid, M.A. Improvements in the dyeability of polyester fabrics by atmospheric pressure oxygen plasma treatment. J. Text. Inst. 2011, 102, 220–231. [Google Scholar] [CrossRef]
- Mehmood, T.; Kaynak, A.; Dai, X.J.; Kouzani, A.; Magniez, K.; de Celis, D.R.; Hurren, C.J.; du Plessis, J. Study of oxygen plasma pre-treatment of polyester fabric for improved polypyrrole adhesion. Mater. Chem. Phys. 2014, 143, 668–675. [Google Scholar] [CrossRef]
- Wei, Q.; Wang, Y.; Yang, Q.; Yu, L. Functionalization of Textile Materials by Plasma Enhanced Modification. J. Ind. Text. 2007, 36, 301–309. [Google Scholar] [CrossRef]
- Vesel, A.; Mozetic, M.; Strnad, S.; Peršin, Z.; Stana-Kleinschek, K.; Hauptman, N. Plasma modification of viscose textile. Vacuum 2009, 84, 79–82. [Google Scholar] [CrossRef]
- Maalek, R.; Holme, I. The Effect of Plasma Treatment on Some Properties of Cotton. Iran. Polym. J. 2003, 12, 271–280. [Google Scholar]
- Wang, Q.; Fan, X.R.; Cui, L.; Wang, P.; Wu, J.; Chen, J. Plasma-aided cotton bioscouring: Dielectric barrier discharge versus low-pressure oxygen plasma. Plasma Chem. Plasma Process. 2009, 29, 399–409. [Google Scholar] [CrossRef]
- Jazbec, K.; Šala, M.; Mozetič, M.; Vesel, A.; Gorjanc, M. Functionalization of Cellulose Fibres with Oxygen Plasma and ZnO Nanoparticles for Achieving UV Protective Properties. J. Nanomater. 2015, 2015, 346739. [Google Scholar] [CrossRef] [Green Version]
- Wang, C.; Lv, J.; Ren, Y.; Zhou, Q.; Chen, J.; Zhi, T.; Lu, Z.; Gao, D.; Ma, Z.; Jin, L. Cotton fabric with plasma pretreatment and ZnO/Carboxymethyl chitosan composite finishing for durable UV resistance and antibacterial property. Carbohydr. Polym. 2016, 138, 106–113. [Google Scholar] [CrossRef] [PubMed]
- Lam, Y.L.; Kan, C.W.; Yuen, C.W. Effect of oxygen plasma pretreatment and titanium dioxide overlay coating on flame retardant finished cotton fabrics. Bioresources 2011, 6, 1454–1474. [Google Scholar]
- Mejía, M.; Marín, J.; Restrepo, G.; Pulgarín, C.; Mielczarski, E.; Arroyo, Y.; Lavanchy, J.-C.; Kiwi, J. Self-cleaning modified TiO2–cotton pretreated by UVC-light (185 nm) and RF-plasma in vacuum and also under atmospheric pressure. Appl. Catal. B Environ. 2009, 91, 481–488. [Google Scholar] [CrossRef]
- Shahidi, S.; Rashidi, A.; Ghoranneviss, M.; Anvari, A.; Rahimi, M.K.; Moghaddam, M.B.; Wiener, J. Investigation of metal absorption and antibacterial activity on cotton fabric modified by low temperature plasma. Cellulose 2010, 17, 627–634. [Google Scholar] [CrossRef]
- Lam, Y.L.; Kan, C.-W.; Yuen, C.W.M. A study of metal oxide on antimicrobial effect of plasma pre-treated cotton fabric. Fibers Polym. 2013, 14, 52–58. [Google Scholar] [CrossRef]
- Hassabo, A.G.; El-Sayed, E. Recent advances in the application of plasma in textile finishing (A Review). J. Text. Color. Polym. Sci. 2021, 18, 33–43. [Google Scholar] [CrossRef]
- Malapit, G.M.; Baculi, R.Q. Bactericidal efficiency of silver nanoparticles deposited on polyester fabric using atmospheric pressure plasma jet system. J. Text. Inst. 2021, 1–9. [Google Scholar] [CrossRef]
- Haji, A. Eco-friendly dyeing and antibacterial treatment of cotton. Cellul. Chem. Technol. 2013, 47, 303–308. [Google Scholar]
- Vaideki, K.; Jayakumar, S.; Thilagavathi, G.; Rajendran, R. A study on the antimicrobial efficacy of RF oxygen plasma and neem extract treated cotton fabrics. Appl. Surf. Sci. 2007, 253, 7323–7329. [Google Scholar] [CrossRef]
- Katouah, H.; El-Metwaly, N.M. Plasma treatment toward electrically conductive and superhydrophobic cotton fibers by in situ preparation of polypyrrole and silver nanoparticles. React. Funct. Polym. 2021, 159, 104810. [Google Scholar] [CrossRef]
- Jia, Y.; Xin, B. Preparation and Characterization of Polypyrrole-coated Wool Fabric for High Electrical Conductivity. J. Phys. Conf. Ser. 2021, 1790, 012080. [Google Scholar] [CrossRef]
- Hu, S.; Kremenakova, D.; Militký, J.; Periyasamy, A.P. Copper-Coated Textiles for Viruses Dodging. In Textiles and Their Use in Microbial Protection; CRC Press: Boca Raton, FL, USA, 2021; pp. 235–250. [Google Scholar]
- Kogelschatz, U. Dielectric-Barrier Discharges: Their History, Discharge Physics, and Industrial Applications. Plasma Chem. Plasma Process. 2003, 23, 1–46. [Google Scholar] [CrossRef]
- Hossain, M.M.; Herrmann, A.S.; Hegemann, D. Plasma Hydrophilization Effect on Different Textile Structures. Plasma Process. Polym. 2006, 3, 299–307. [Google Scholar] [CrossRef]
- Haji, A.; Kan, C.-W. Plasma Treatment for Sustainable Functionalization of Textiles; Woodhead Publishing: Sawston, UK, 2021; pp. 265–277. [Google Scholar]
- Gouveia, I.C.; Antunes, L.C.; Gomes, A.P. Low-pressure plasma treatment for hydrophilization of poly(ethylene terephthalate) fabrics. J. Text. Inst. 2011, 102, 203–213. [Google Scholar] [CrossRef]
- Chen, F.; Xu, W.; Huang, S.; Liu, J.; Song, J.; Liu, X. Plasma Hydrophilization of Superhydrophobic Surface and Its Aging Behavior: The Effect of Micro/nanostructured Surface. Surf. Interface Anal. 2016, 48, 368–372. [Google Scholar] [CrossRef]
- Bogaczyk, M.; Sretenović, G.B.; Wagner, H.-E. Influence of the applied voltage shape on the barrier discharge operation modes in helium. Eur. Phys. J. D 2013, 67, 212. [Google Scholar] [CrossRef]
- Saifutdinov, A.I.; Saifutdinova, A.A.; Timerkaev, B.A. Numerical Study of the Voltage Waveform Effect on the Spatio-temporal Characteristics of a Dielectric Barrier Microdischarge in Argon. Plasma Phys. Rep. 2018, 44, 312–322. [Google Scholar] [CrossRef]
- Abdelaziz, A.A.; Ishijima, T.; Seto, T. Humidity effects on surface dielectric barrier discharge for gaseous naphthalene decomposition. Phys. Plasmas 2018, 25, 043512. [Google Scholar] [CrossRef]
- Mazharul, I.K. Chemical Composition of the Cotton Fiber. Available online: textilelearner.net/chemical-composition-of-cotton-fiber (accessed on 10 June 2021).
- Pettigrew, W.T. Potassium influences on yield and quality production for maize, wheat, soybean and cotton. Physiol. Plant. 2008, 133, 670–681. [Google Scholar] [CrossRef] [PubMed]
- Hussain, S.; Ali, H.; Gardezi, S.T.R. Soil applied potassium improves productivity and fiber quality of cotton cultivars grown on potassium deficient soils. PLoS ONE 2021, 16, e0250713. [Google Scholar] [CrossRef]
- Fontana, J.E.; Wang, G.; Sun, R.; Xue, H.; Li, Q.; Liu, J.; Davis, K.E.; Thornburg, T.E.; Zhang, B.; Zhang, Z.; et al. Impact of potassium deficiency on cotton growth, development and potential microRNA-mediated mechanism. Plant Physiol. Biochem. 2020, 153, 72–80. [Google Scholar] [CrossRef] [PubMed]


| No | Rs [Ω] | RESD Free Drying | RESD Cross-Linking | RF1 Plasma O2 Using MHz Generator | Physical-Mechanical Characteristics | ||||||
|---|---|---|---|---|---|---|---|---|---|---|---|
| Power [W] | Gas Flow [sccm] | Time [min] | Presssure [mTorr] | * M [g/m2] | ** δ [mm] | *** Pv [%] | **** Pa [L/m2/s] | ||||
| 1 | 103 | 11.7 | 0.25 | 200 | 200 | 3 | 100.4 | 503.6 | 1.36 | 31.88 | 148.8 |
| 2 | 103 | 12.8 | 0.61 | 200 | 200 | 3 | 100.4 | 492.8 | 1.296 | 30.73 | 171.8 |
| 3 | 103 | 10.6 | 0.4 | 200 | 200 | 3 | 100.4 | 398.4 | 1.014 | 32.26 | 92.82 |
| 4 | 103 | 6 | 0.6 | 200 | 200 | 3 | 100.4 | 453.2 | 1.074 | 30.15 | 67.84 |
| 5 | 103 | 6.8 | 0.04 | 200 | 200 | 3 | 100.4 | 470.8 | 1.366 | 31.11 | 74.84 |
| 6 | 103 | 3.3 | 0.02 | 200 | 200 | 3 | 100.4 | 476.8 | 1.322 | 30.34 | 90.4 |
| 7 | 103 | 7.8 | 0.07 | 200 | 200 | 3 | 100.4 | 454.8 | 1.12 | 31.11 | 46.44 |
| 8 | 103 | 4.5 | 7.69 | 200 | 200 | 3 | 100.4 | 431.6 | 0.814 | 26.69 | 130 |
| RF Plasma O2 using RF2 kHz generator | |||||||||||
| 9 | 103 | - | 0.16 | 100 | 200 | 3 | 84.8 | 522 | 1.39 | 32.26 | 161.2 |
| 10 | 103 | - | 2.69 | 100 | 200 | 3 | 84.8 | 510.4 | 1.36 | 32.67 | 184.6 |
| 11 | 103 | - | 0.01 | 100 | 200 | 3 | 84.8 | 410 | 1.01 | 35.74 | 88.12 |
| 12 | 103 | - | 0.01 | 100 | 200 | 3 | 84.8 | 477.6 | 1.09 | 34.72 | 64.12 |
| 13 | 103 | - | 0.17 | 100 | 200 | 3 | 84.8 | 512.4 | 1.36 | 32.67 | 67.18 |
| 14 | 103 | - | 0.01 | 100 | 200 | 3 | 84.8 | 502.4 | 1.36 | 30.84 | 97.36 |
| 15 | 103 | - | 0.04 | 100 | 200 | 3 | 84.8 | 473.2 | 1.15 | 33.08 | 47.92 |
| 16 | 103 | - | 7.09 | 100 | 200 | 3 | 84.8 | 437.2 | 0.81 | 29 | 120.8 |
| 17 | 1012 | - | 3.53 | 50 | 200 | 3 | 93.1 | 516.4 | 1.39 | 31.2 | 157.2 |
| 18 | 1012 | - | 4.03 | 50 | 200 | 3 | 93.1 | 506.4 | 1.294 | 29.2 | 160.4 |
| 19 | 1012 | - | 2.39 | 50 | 200 | 3 | 93.1 | 401.2 | 1.002 | 31.7 | 90.8 |
| 20 | 1012 | - | 2.31 | 50 | 200 | 3 | 93.1 | 456.8 | 1.064 | 29 | 60.82 |
| 21 | 1013 | - | 3.37 | 50 | 200 | 3 | 93.1 | 508.8 | 1.412 | 28.3 | 70.1 |
| 22 | 1012 | - | 4.07 | 50 | 200 | 3 | 93.1 | 459.6 | 1.084 | 27.9 | 31.12 |
| No. | Nuva TCC | Ni | Cu | Ag | PVA | H2O | * Rs1 [Ω] | ** Rs2 [Ω] | M [g/m2] | δ [mm] | Pa [l/m2/s] |
|---|---|---|---|---|---|---|---|---|---|---|---|
| A1 | x | x | x | 109 | 1012 | 992.8 | 2.932 | 8.148 | |||
| A2 | x | x | x | 103 | 103 | 950.4 | 3.9 | 10.148 | |||
| A3 | x | x | x | 103 | 103 | 1020.4 | 3.248 | 3.248 | |||
| A4 | x | x | x | x | 109 | 1010 | 1125.2 | 4.106 | 90.3 | ||
| A5 | x | x | x | x | 103 | 103 | 966.4 | 4.00 | 90.383 | ||
| A6 | x | x | x | x | 108 | 103 | 1002.8 | 4.762 | 141 |
| Sample No. | After Hydrophilization in RF Plasma O2 Using RF1 Generator | Surface After Deposition of Thin-Film Based PVA Matrix and Nickel Microparticles |
|---|---|---|
| 1 |  | 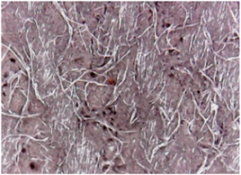 |
| 2 | 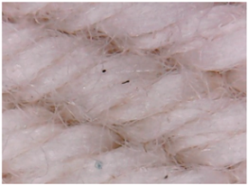 |  |
| 3 | 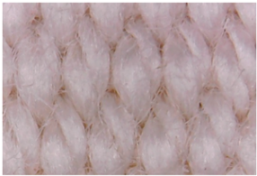 | 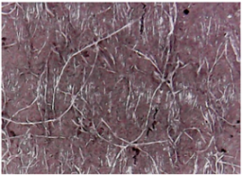 |
| 4 | 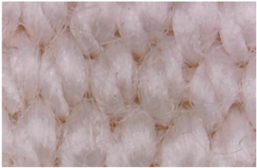 |  |
| 5 |  | 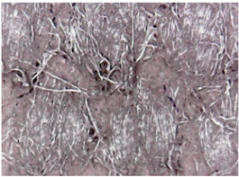 |
| 6 | 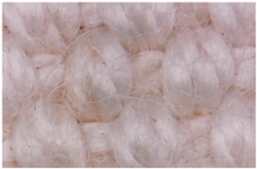 | 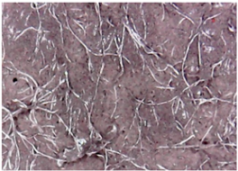 |
| Microparticles | Hydrophil Fabric | Hydrophobic Fabric |
|---|---|---|
| Ni | 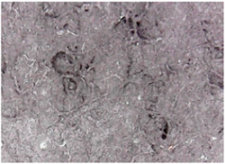 | 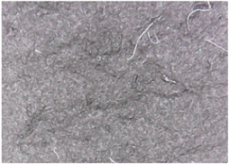 |
| Cu | 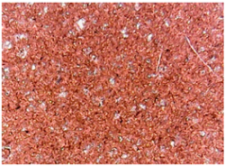 | 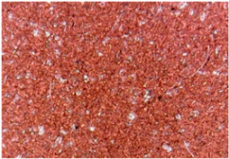 |
| Ag | 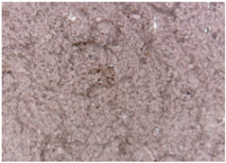 | 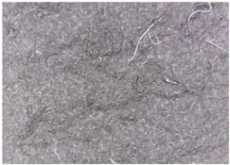 |
| Sample No. | C | O | Cl | K | Ni |
|---|---|---|---|---|---|
| S1treated using RF2, 50 W | 38 | 53 | 3 | 6 | - |
| S1treated with Ni paste | 31 | 36 | 2 | 4 | 26 |
| S2treated using RF1, 200 W | 39 | 54 | 2 | 2 | - |
| S2 treated with Ni paste | 7 | 9 | - | - | 83 |
| S3treated using RF2, 100 W | 40 | 54 | 3 | 4 | - |
| S3 treated with Ni paste | 9 | 11 | - | 2 | 78 |
Publisher’s Note: MDPI stays neutral with regard to jurisdictional claims in published maps and institutional affiliations. |
© 2021 by the authors. Licensee MDPI, Basel, Switzerland. This article is an open access article distributed under the terms and conditions of the Creative Commons Attribution (CC BY) license (https://creativecommons.org/licenses/by/4.0/).
Share and Cite
Aileni, R.M.; Chiriac, L.; Toma, D.; Sandulache, I. Multivariate Correlation Analysis of the Electroconductive Textiles Obtained Using Functionalization by Radio-Frequency Oxygen Plasma Treatments. Materials 2021, 14, 5609. https://doi.org/10.3390/ma14195609
Aileni RM, Chiriac L, Toma D, Sandulache I. Multivariate Correlation Analysis of the Electroconductive Textiles Obtained Using Functionalization by Radio-Frequency Oxygen Plasma Treatments. Materials. 2021; 14(19):5609. https://doi.org/10.3390/ma14195609
Chicago/Turabian StyleAileni, Raluca Maria, Laura Chiriac, Doina Toma, and Irina Sandulache. 2021. "Multivariate Correlation Analysis of the Electroconductive Textiles Obtained Using Functionalization by Radio-Frequency Oxygen Plasma Treatments" Materials 14, no. 19: 5609. https://doi.org/10.3390/ma14195609
APA StyleAileni, R. M., Chiriac, L., Toma, D., & Sandulache, I. (2021). Multivariate Correlation Analysis of the Electroconductive Textiles Obtained Using Functionalization by Radio-Frequency Oxygen Plasma Treatments. Materials, 14(19), 5609. https://doi.org/10.3390/ma14195609