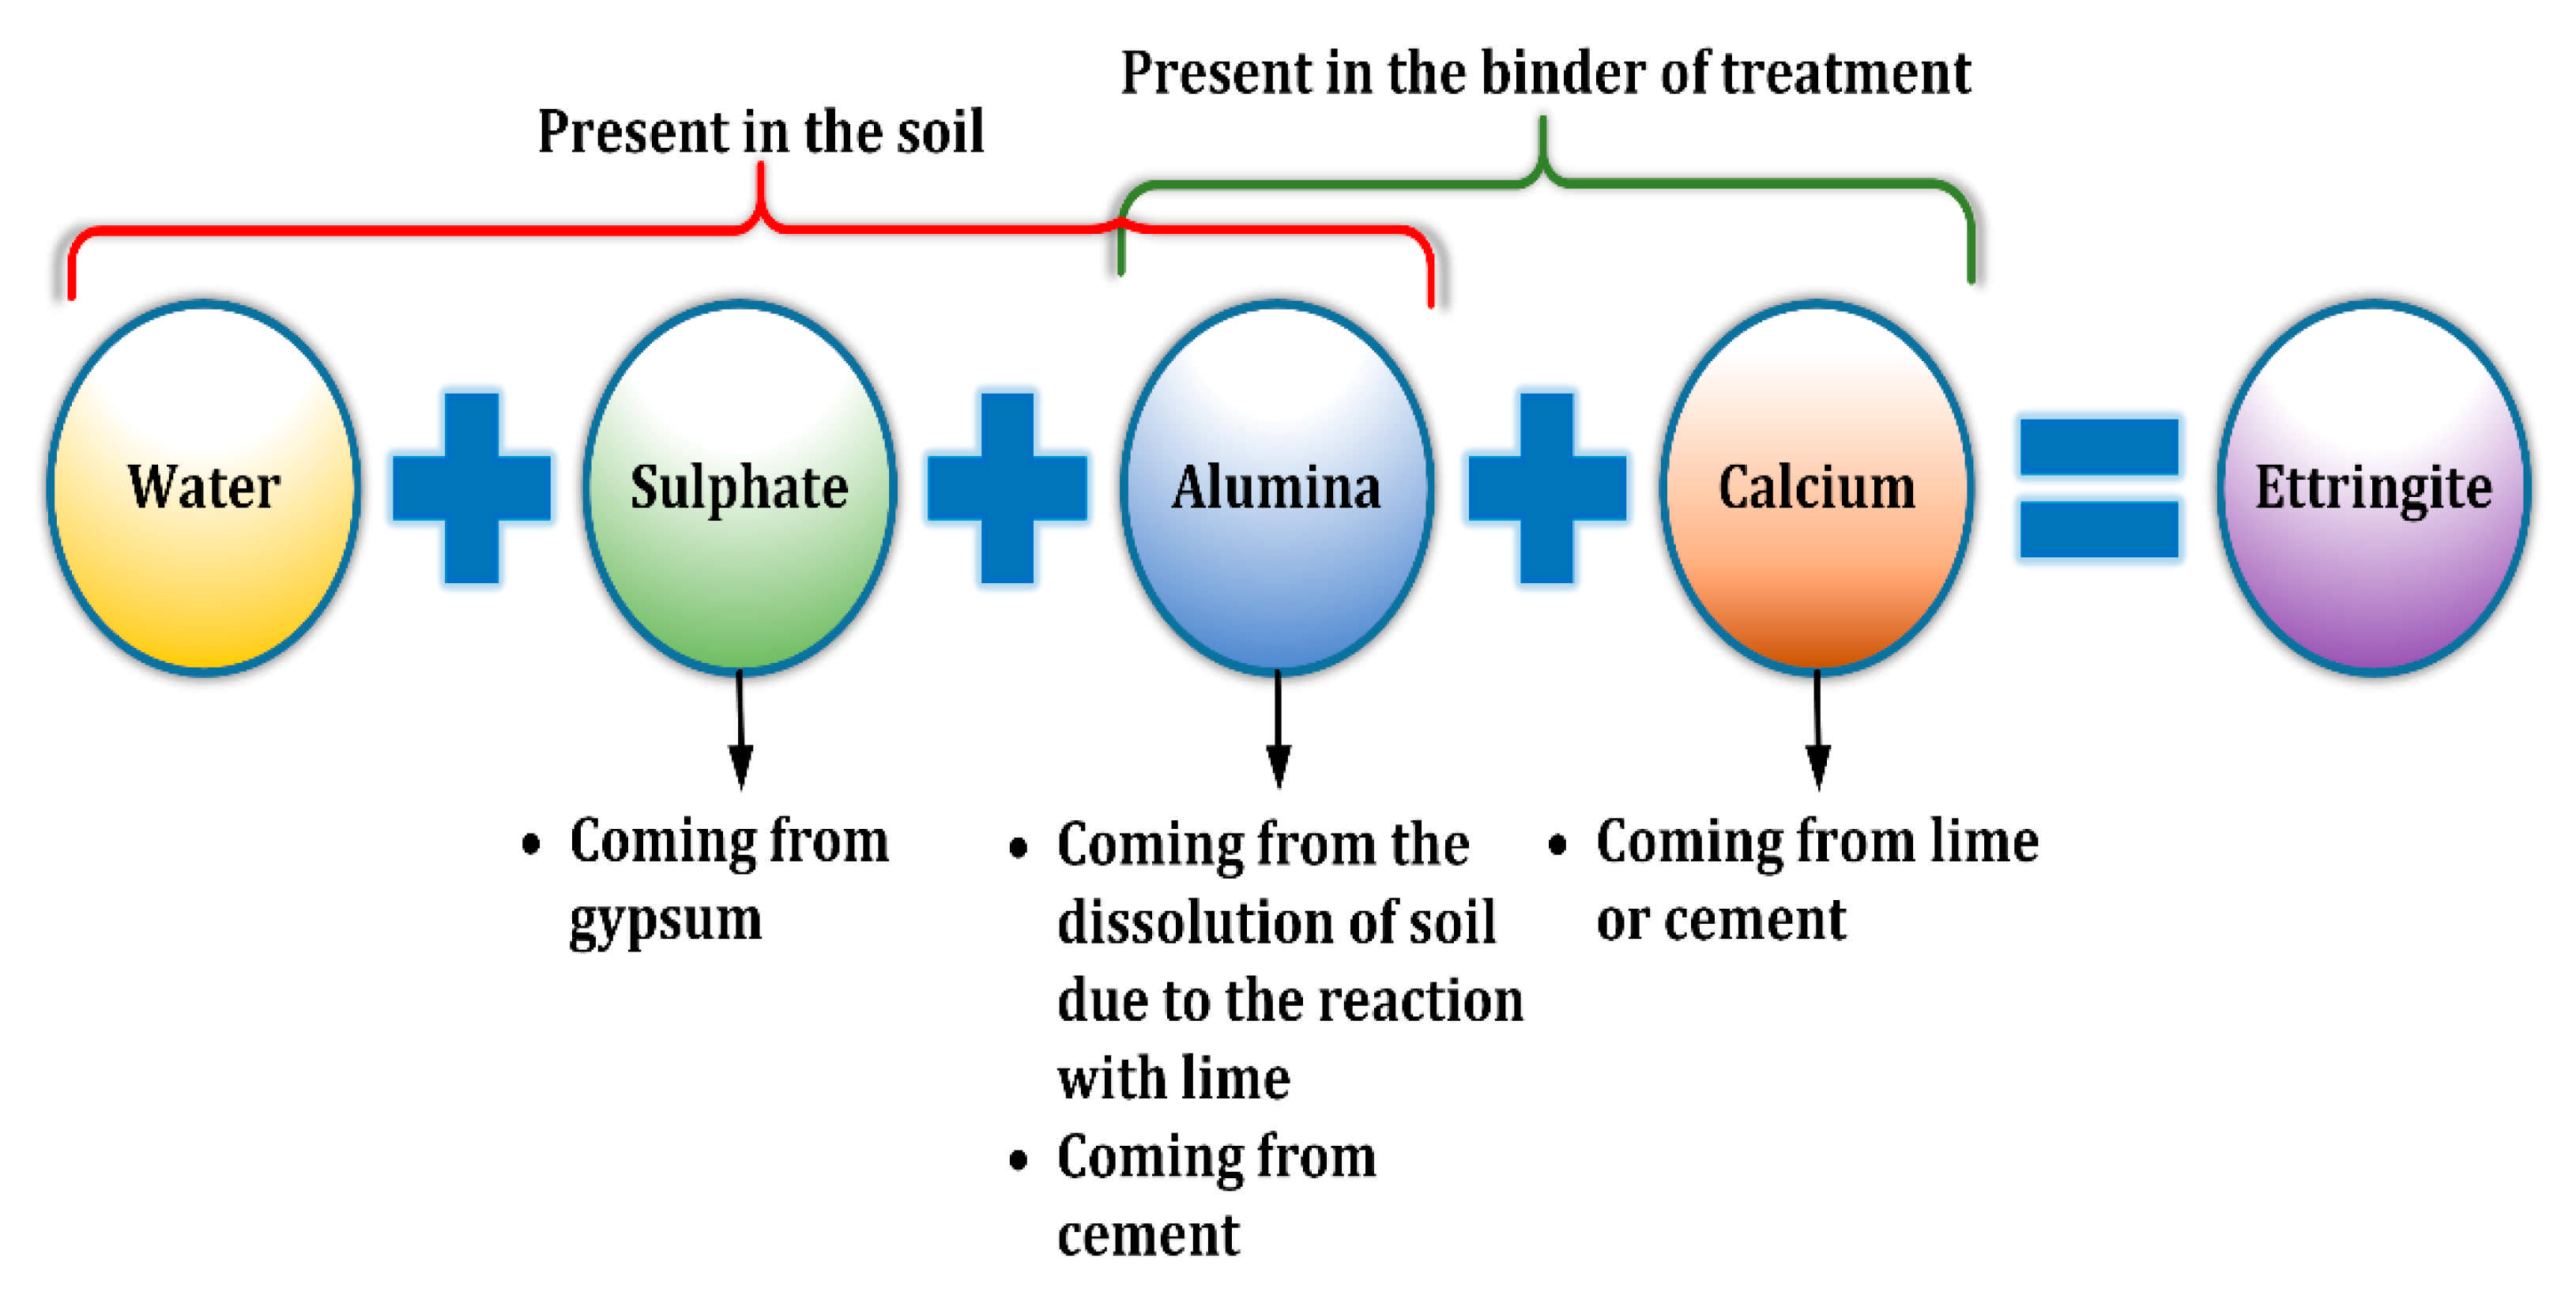
Figure 1.
Schematic explaining the reaction of sulphate-bearing soil treated by cement and lime.
Figure 1.
Schematic explaining the reaction of sulphate-bearing soil treated by cement and lime.
Figure 2.
Particle size distribution (PSD) of the kaolin clay, MK, and GGBS used in this study.
Figure 2.
Particle size distribution (PSD) of the kaolin clay, MK, and GGBS used in this study.
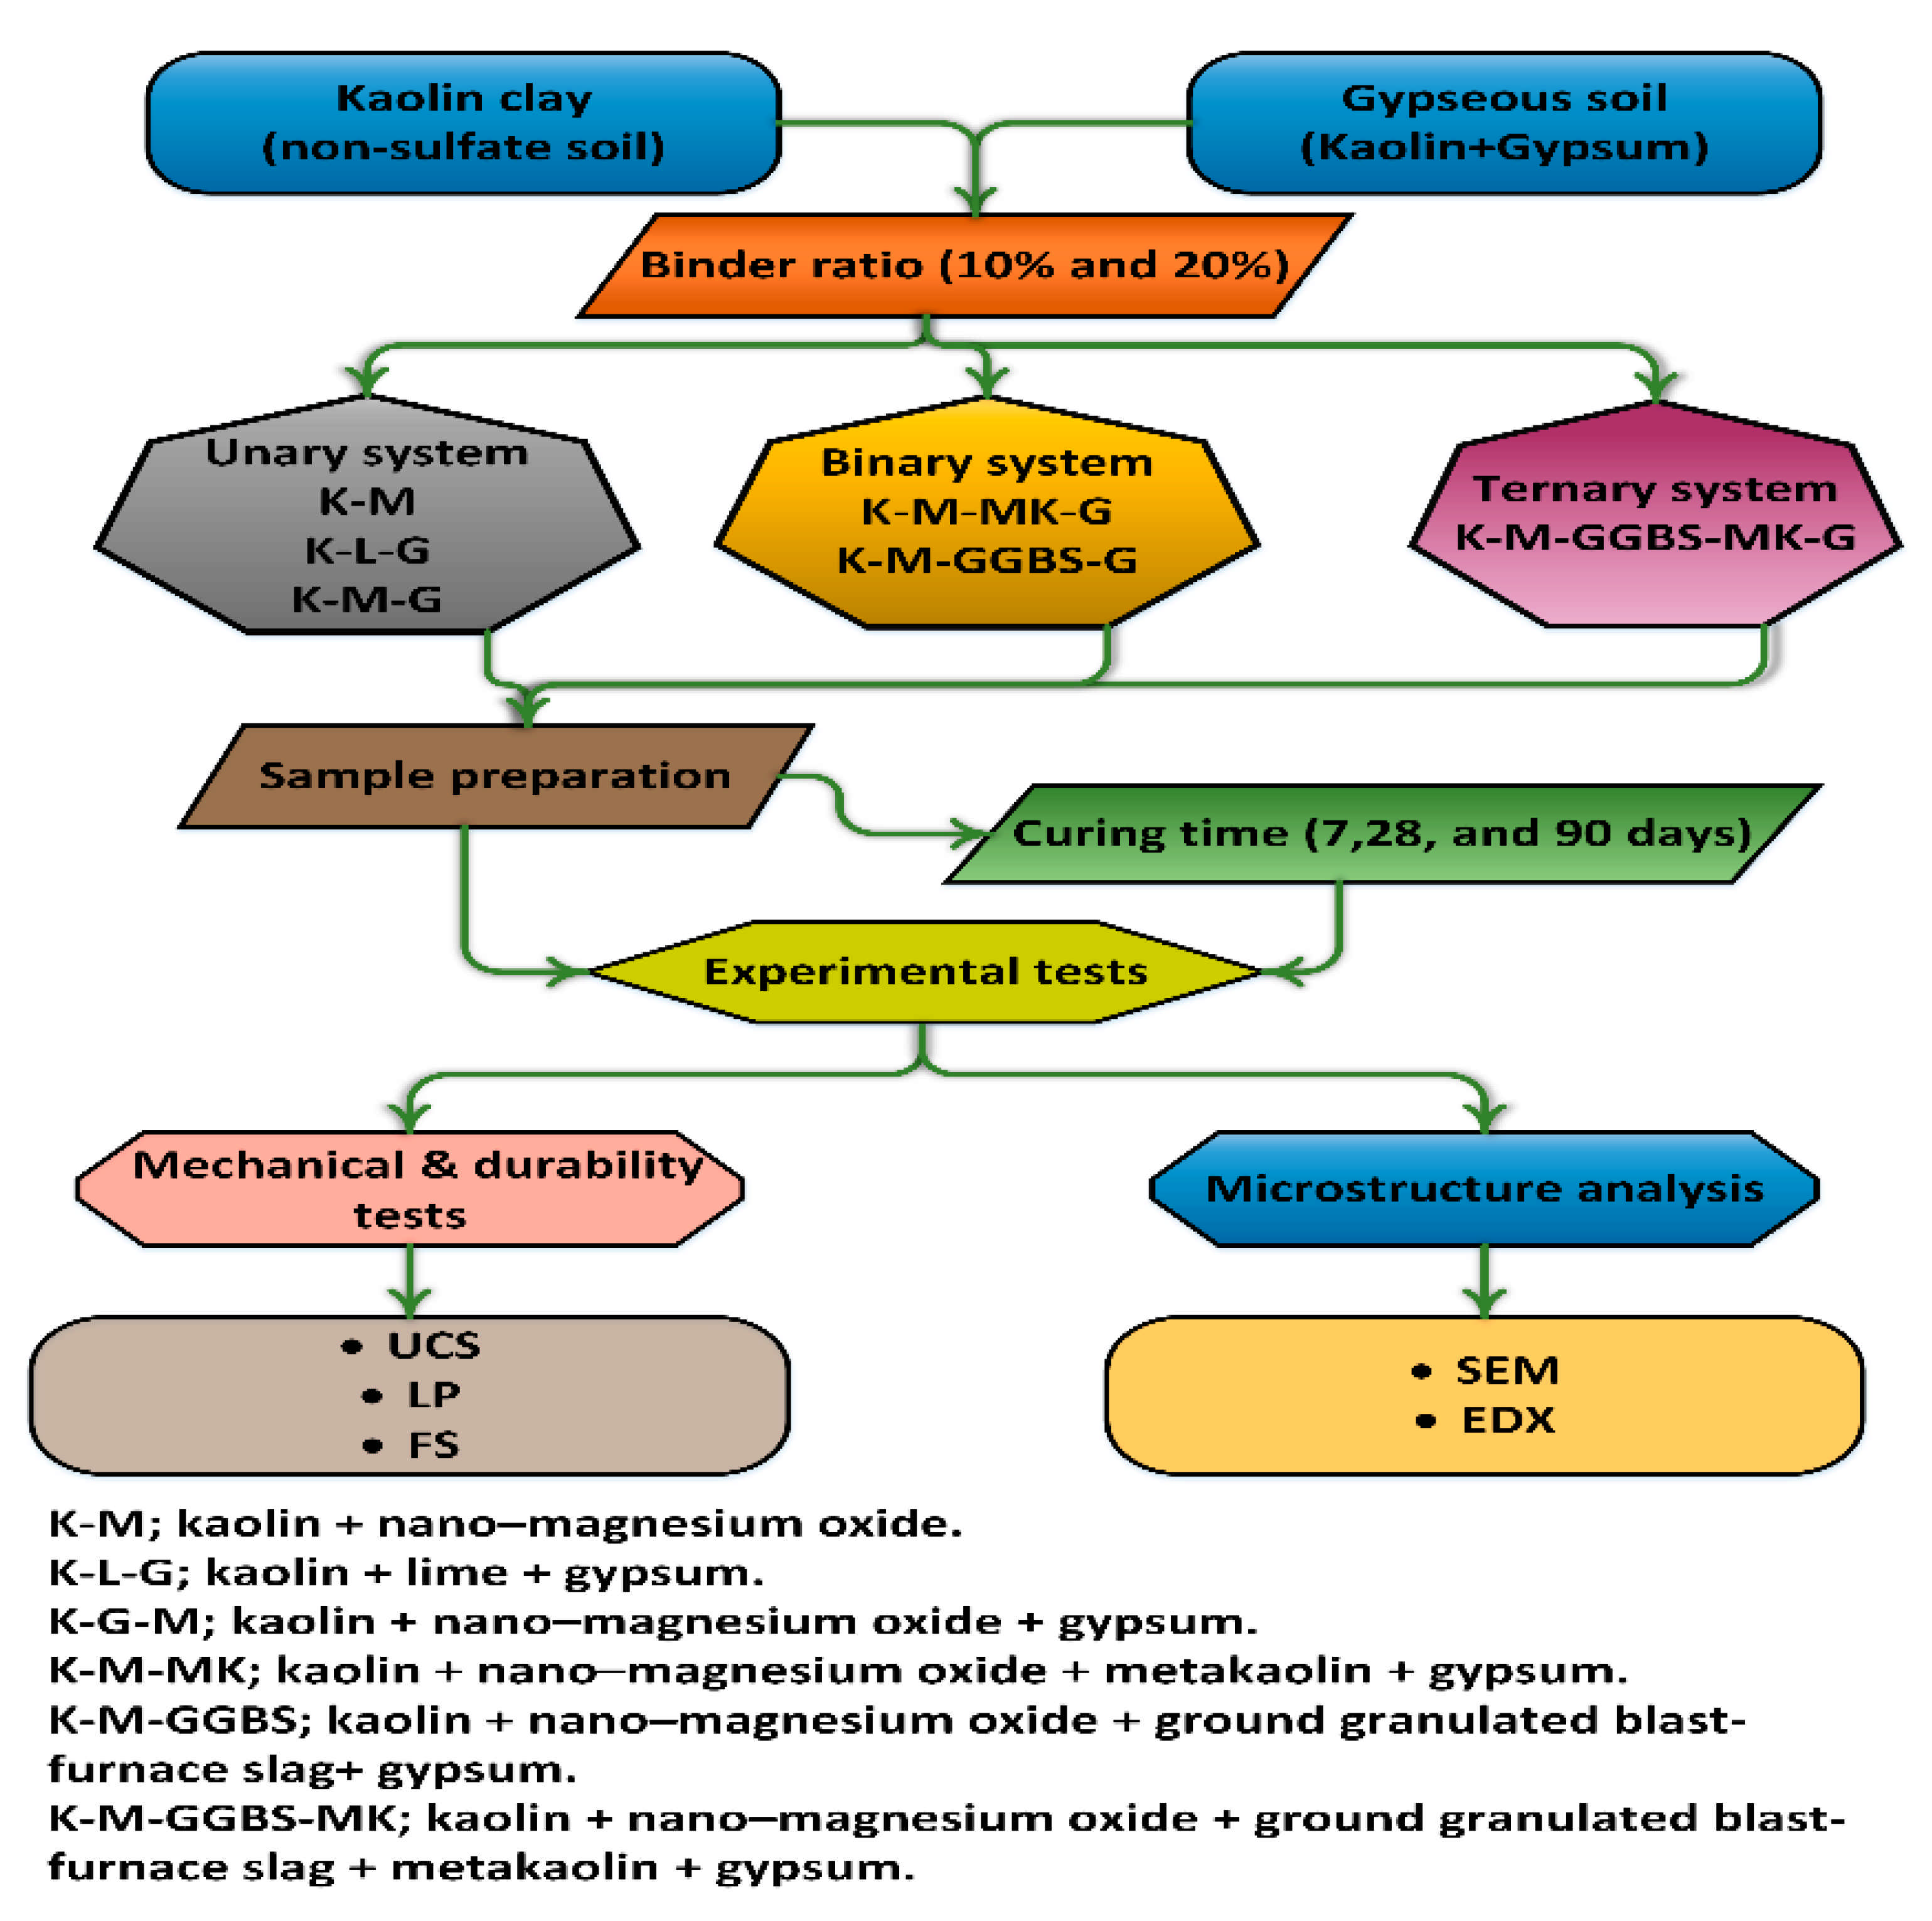
Figure 3.
Schematic representation of the experimental procedure.
Figure 3.
Schematic representation of the experimental procedure.
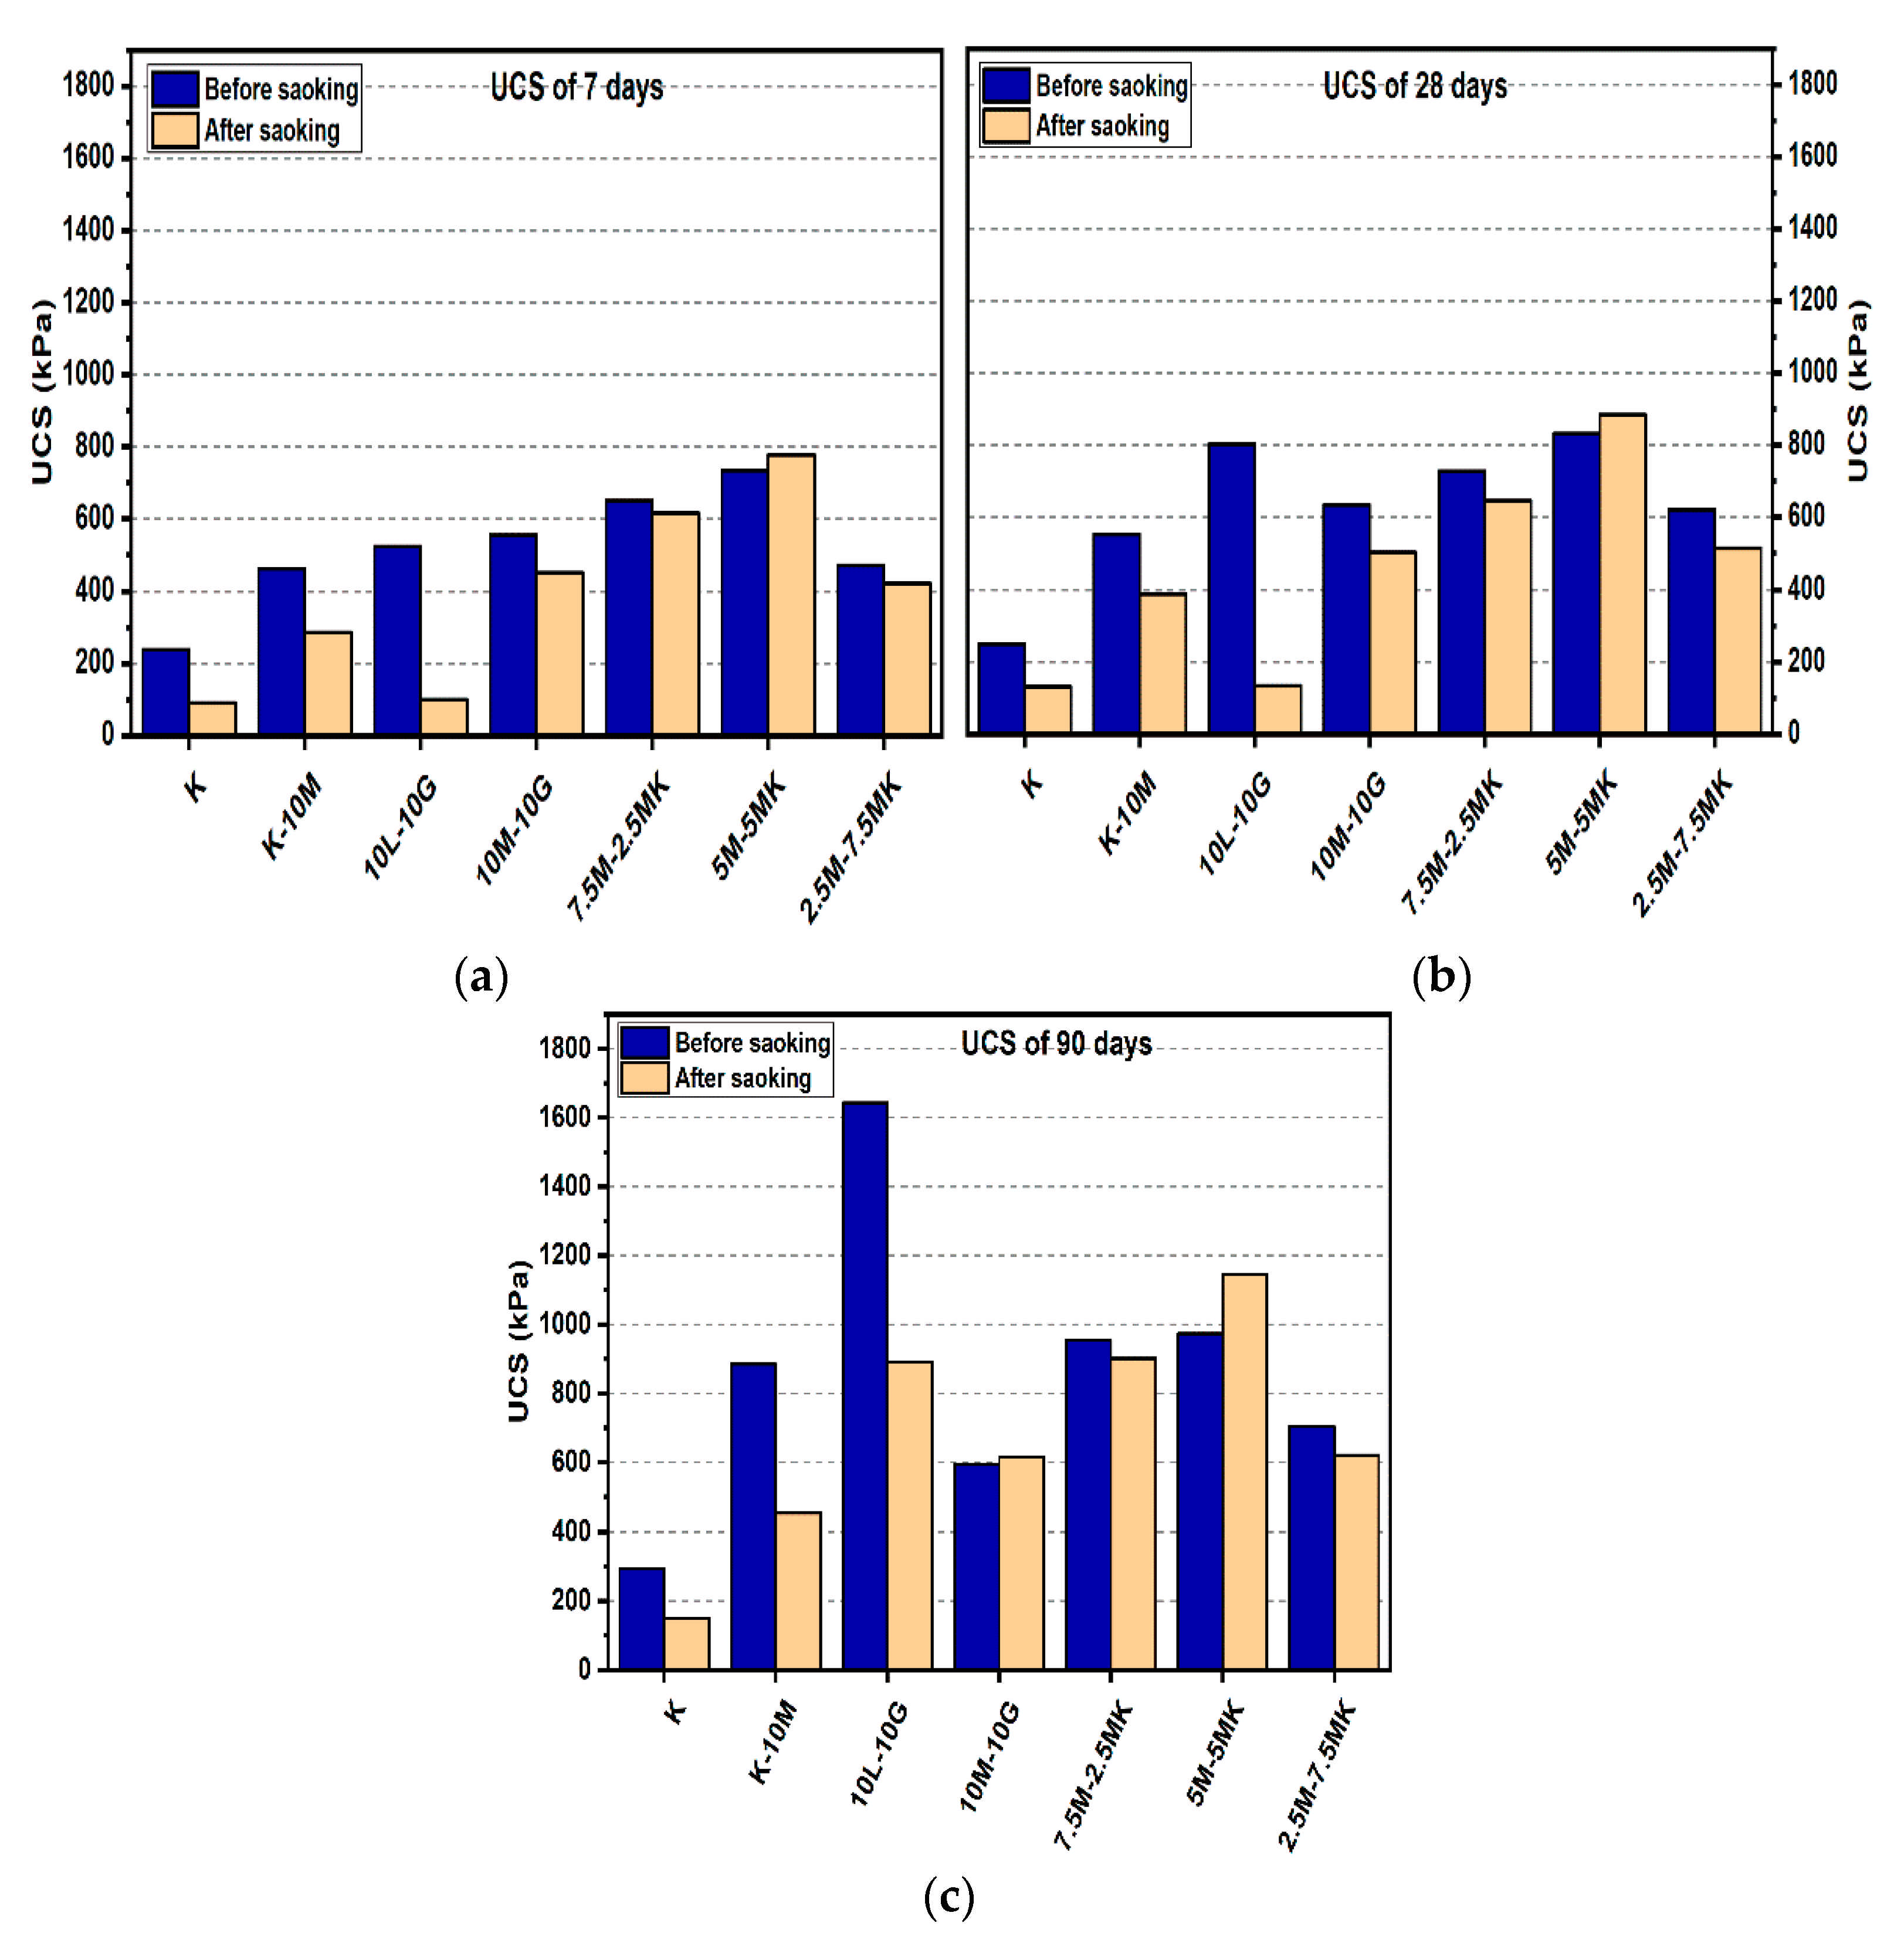
Figure 4.
UCS of soils stabilized with 10% of L, M, and M-MK before and after soaking in the presence of sulphate: (a) after curing for 7 days, (b) after curing for 28 days, (c) after curing for 90 days.
Figure 4.
UCS of soils stabilized with 10% of L, M, and M-MK before and after soaking in the presence of sulphate: (a) after curing for 7 days, (b) after curing for 28 days, (c) after curing for 90 days.
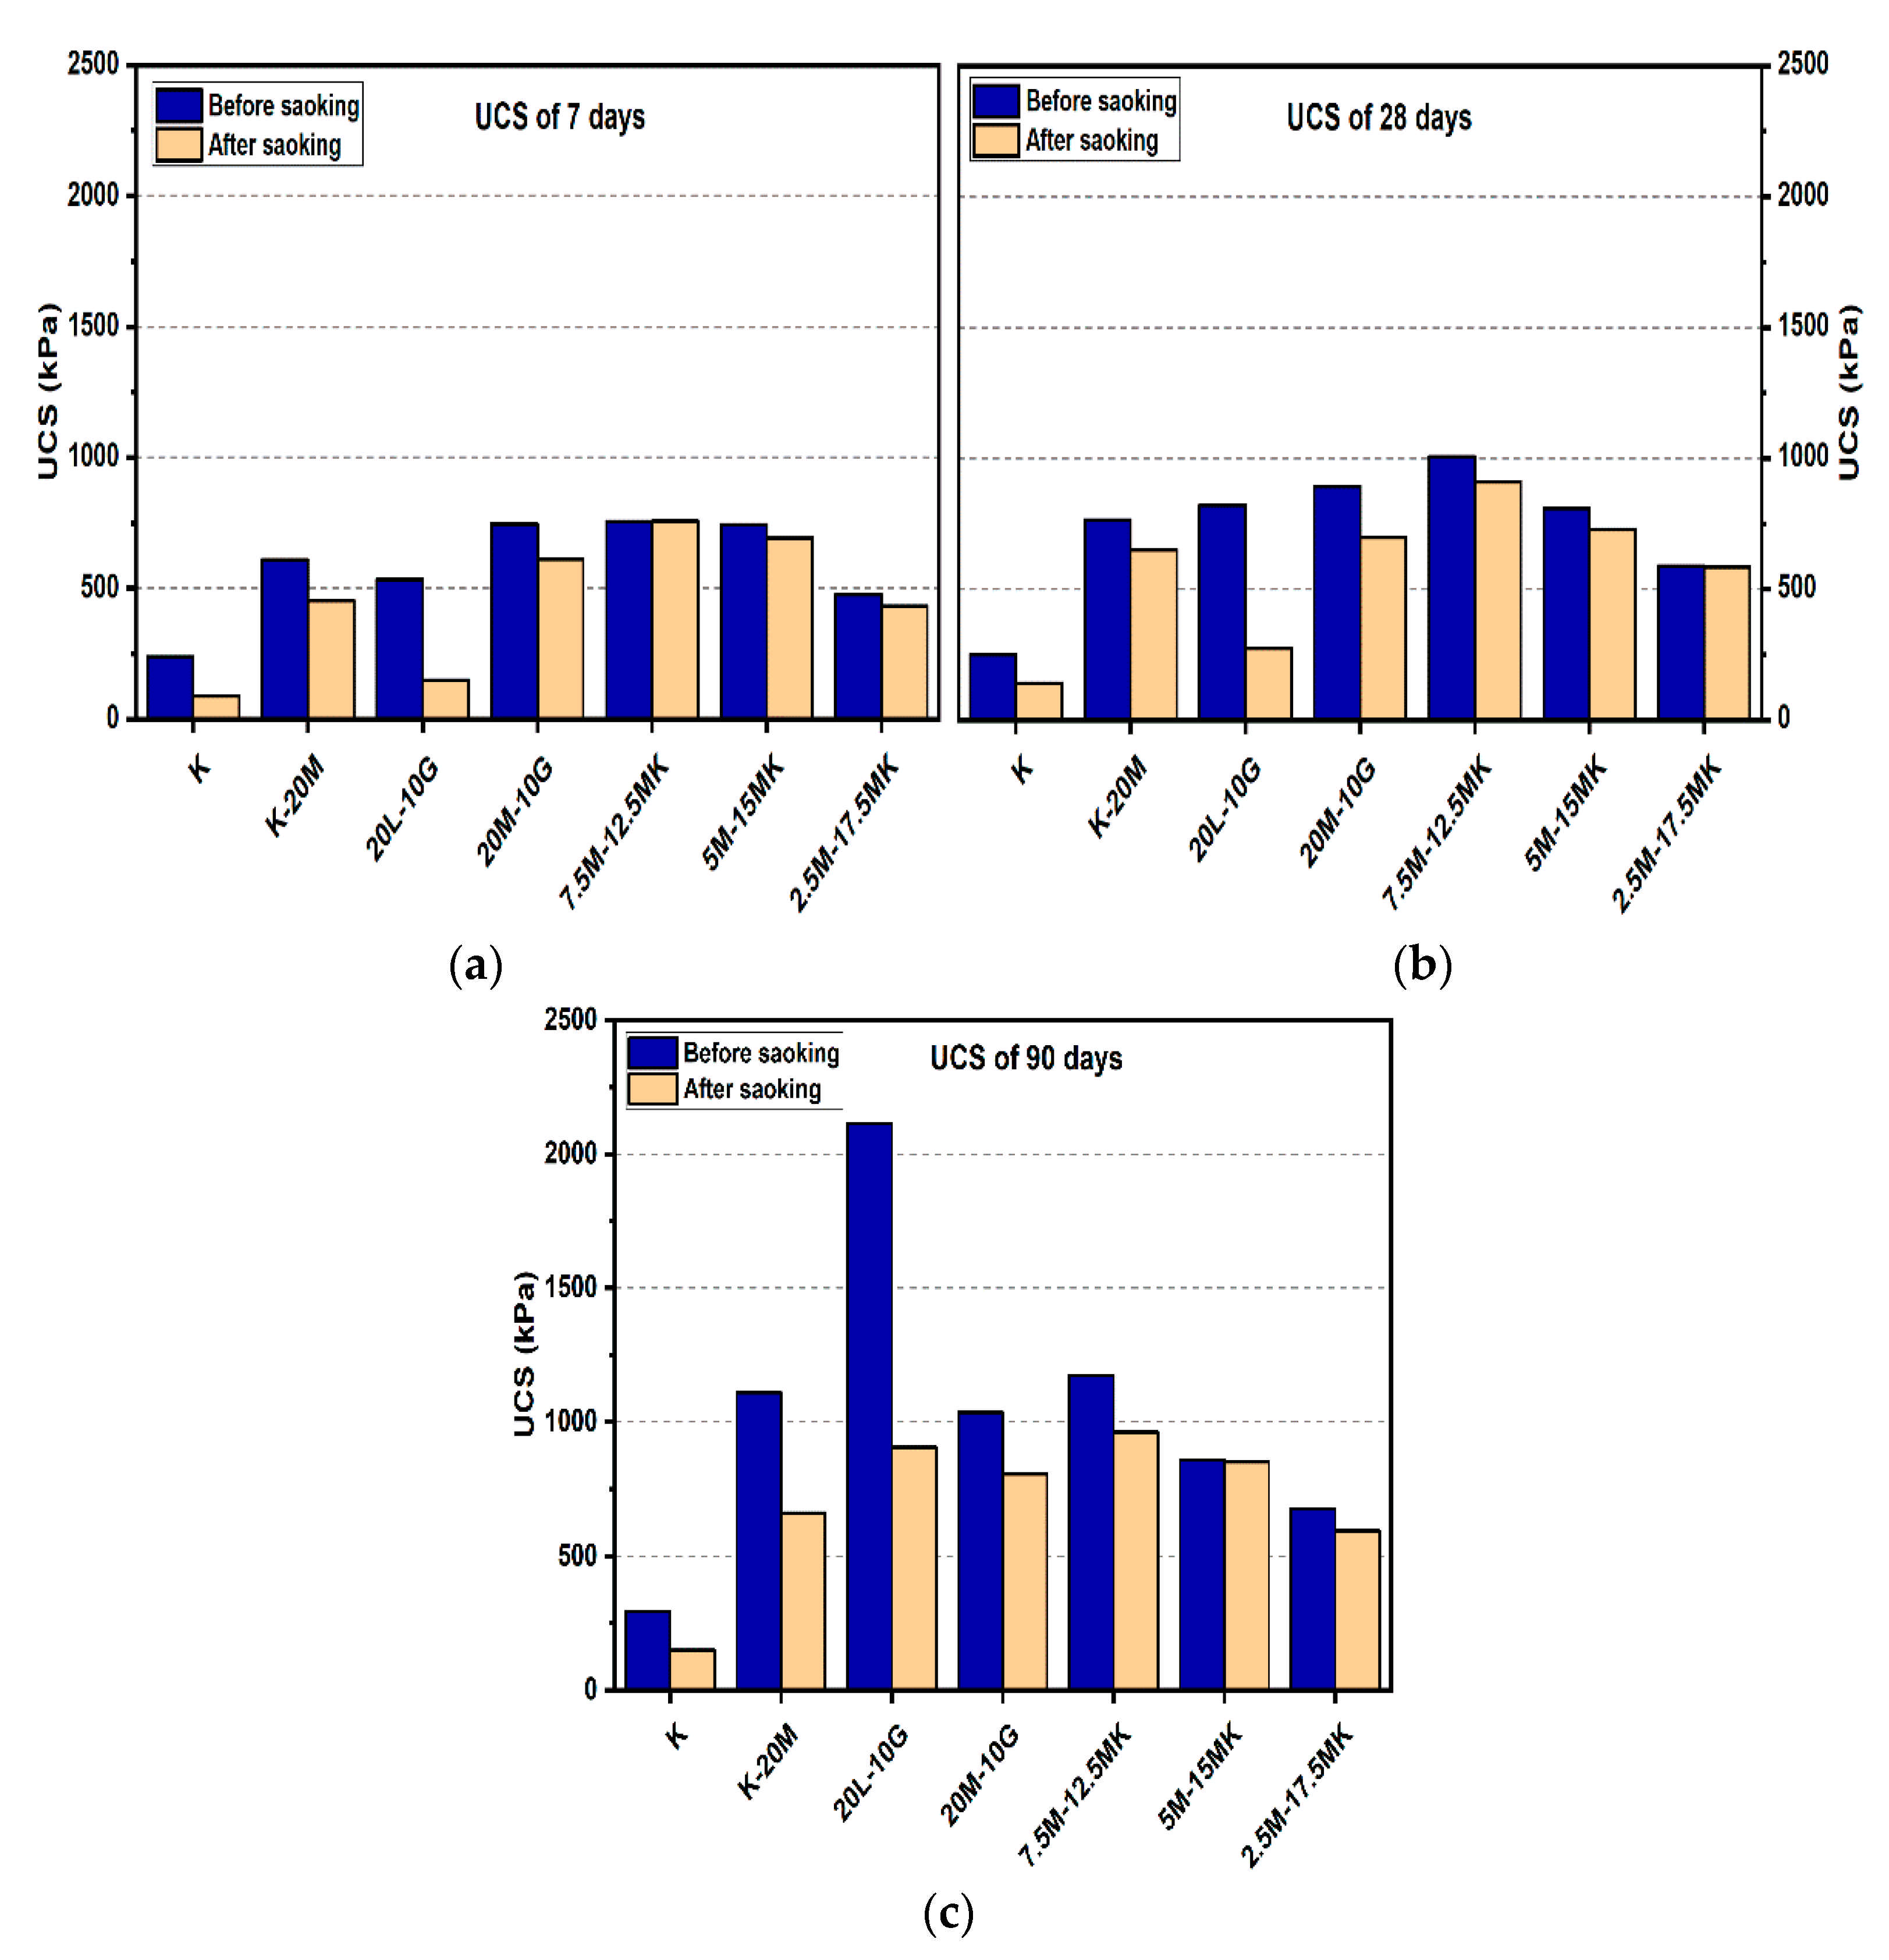
Figure 5.
UCS of soils stabilized with 20% of L, M, and M-MK before and after soaking in the presence of sulphate: (a) after curing for 7 days, (b) after curing for 28 days, (c) after curing for 90 days.
Figure 5.
UCS of soils stabilized with 20% of L, M, and M-MK before and after soaking in the presence of sulphate: (a) after curing for 7 days, (b) after curing for 28 days, (c) after curing for 90 days.
Figure 6.
UCS of soils stabilized with 10% of L, M, and M-GGBS before and after soaking in the presence of sulphate: (a) after curing for 7 days, (b) after curing for 28 days, (c) after curing for 90 days.
Figure 6.
UCS of soils stabilized with 10% of L, M, and M-GGBS before and after soaking in the presence of sulphate: (a) after curing for 7 days, (b) after curing for 28 days, (c) after curing for 90 days.
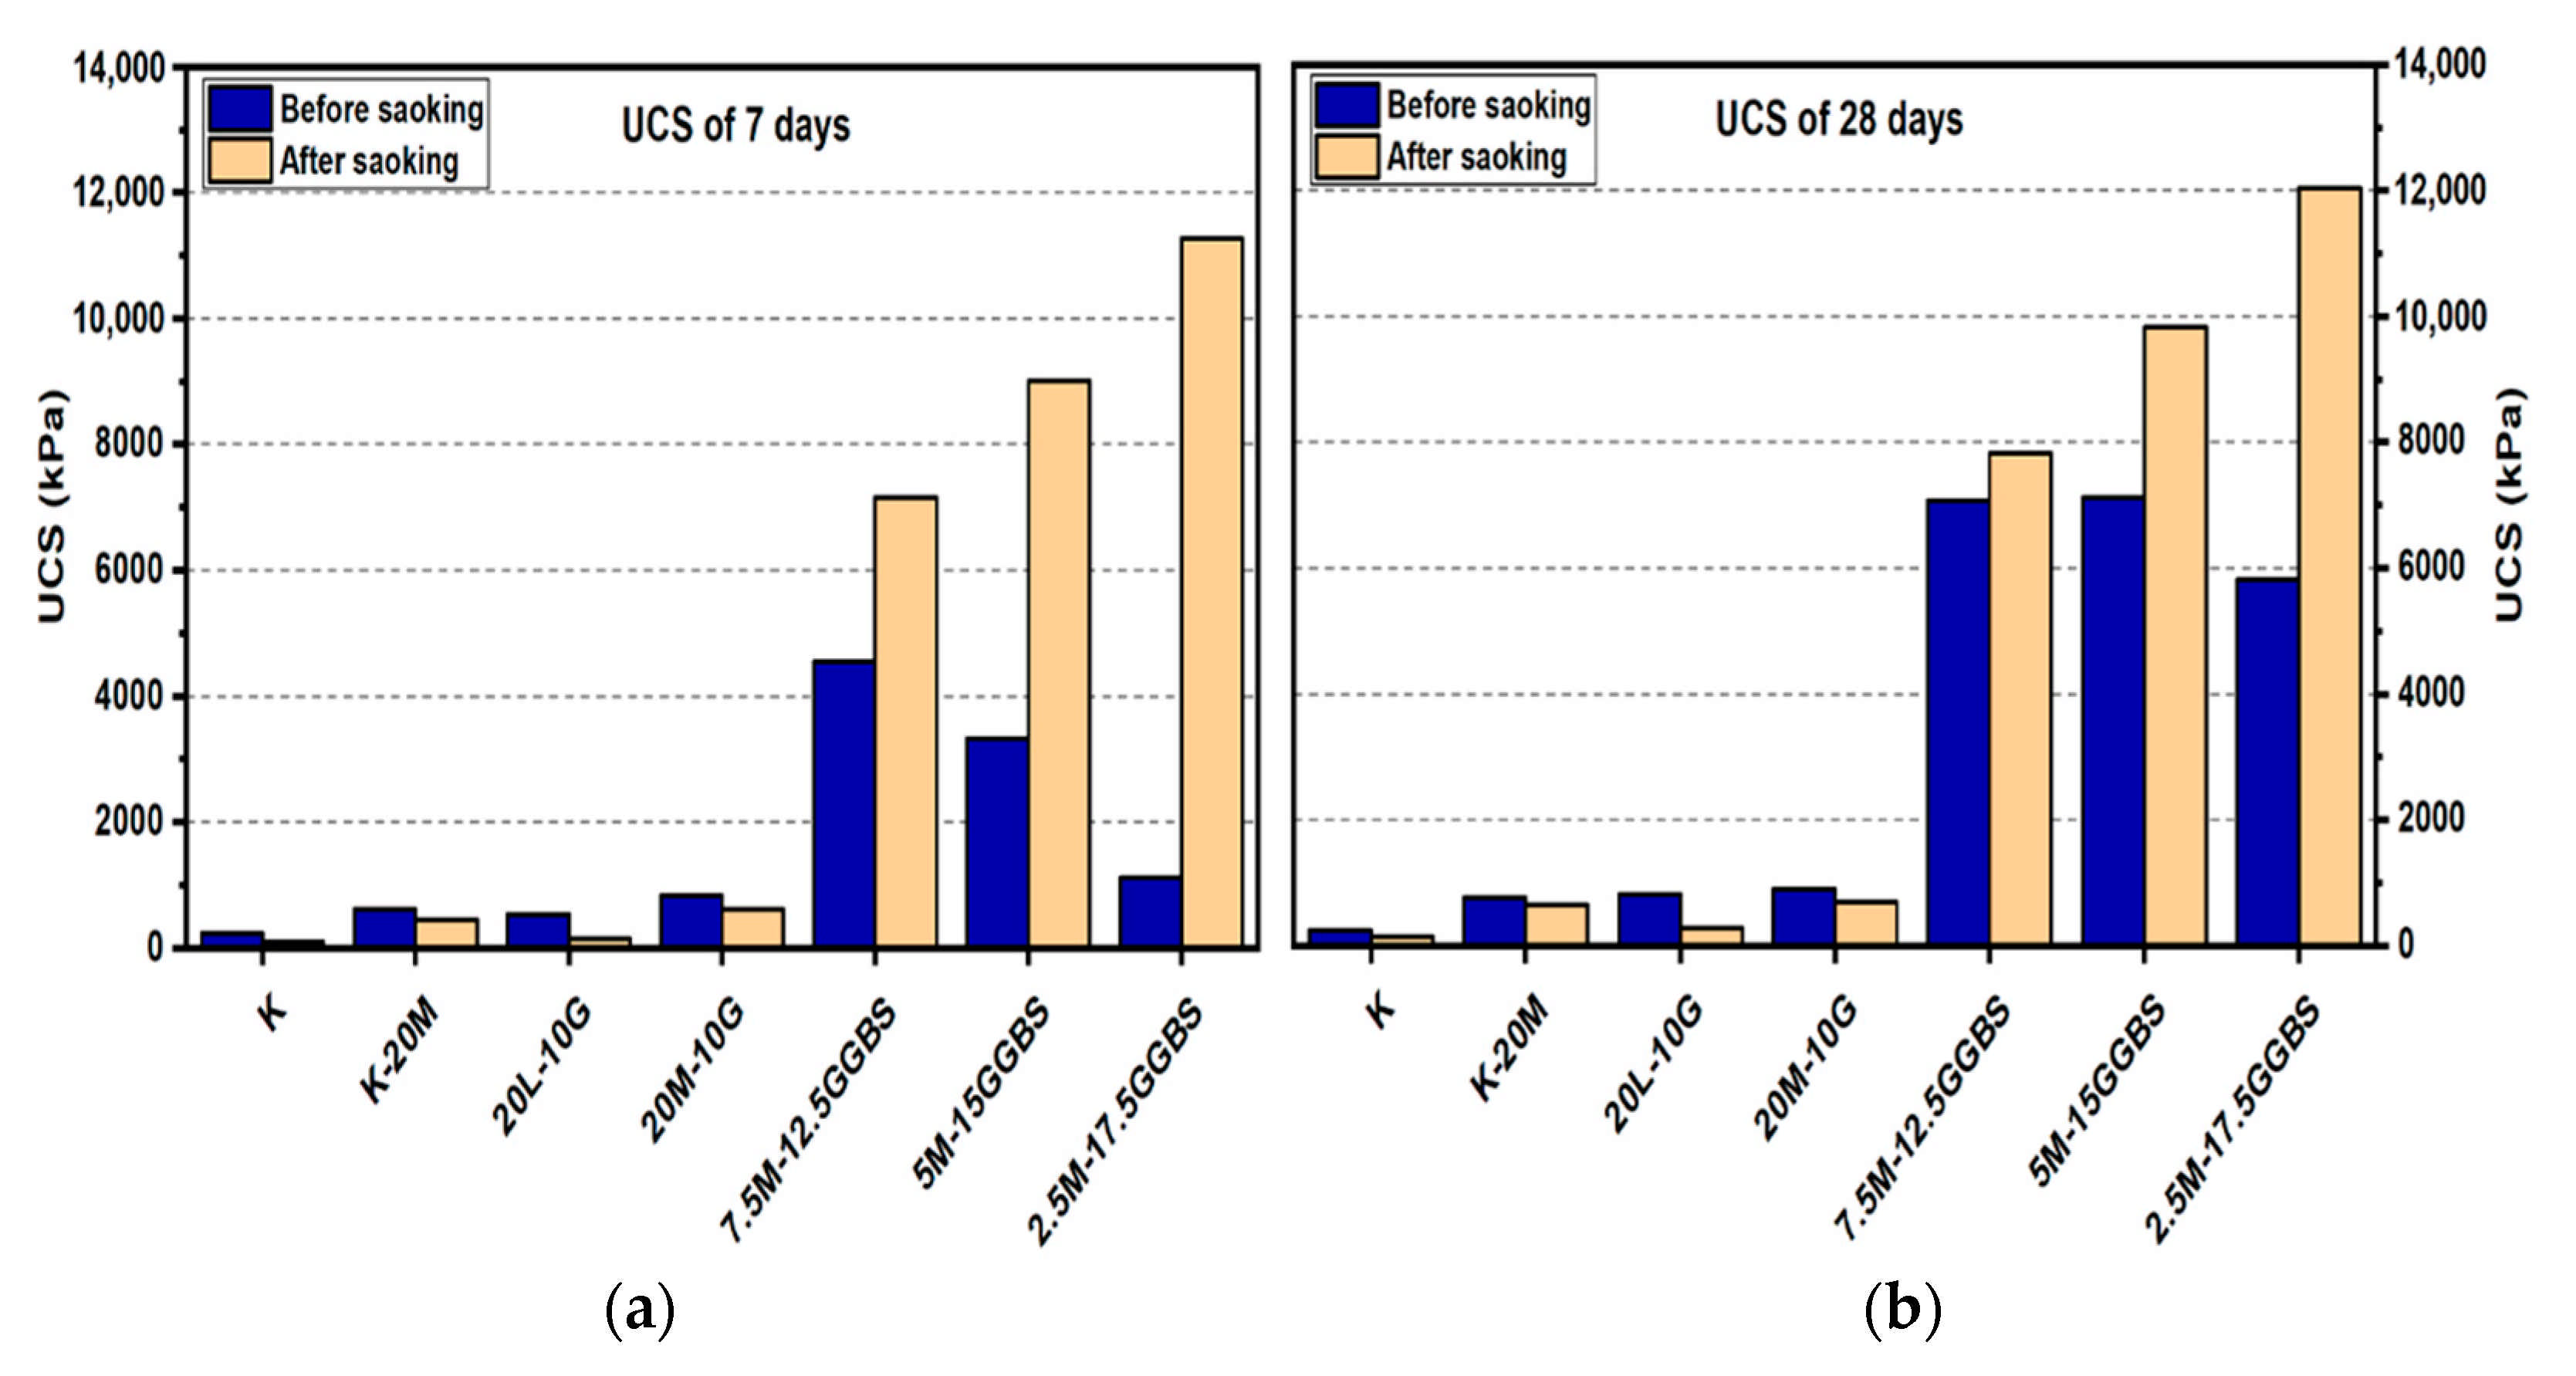
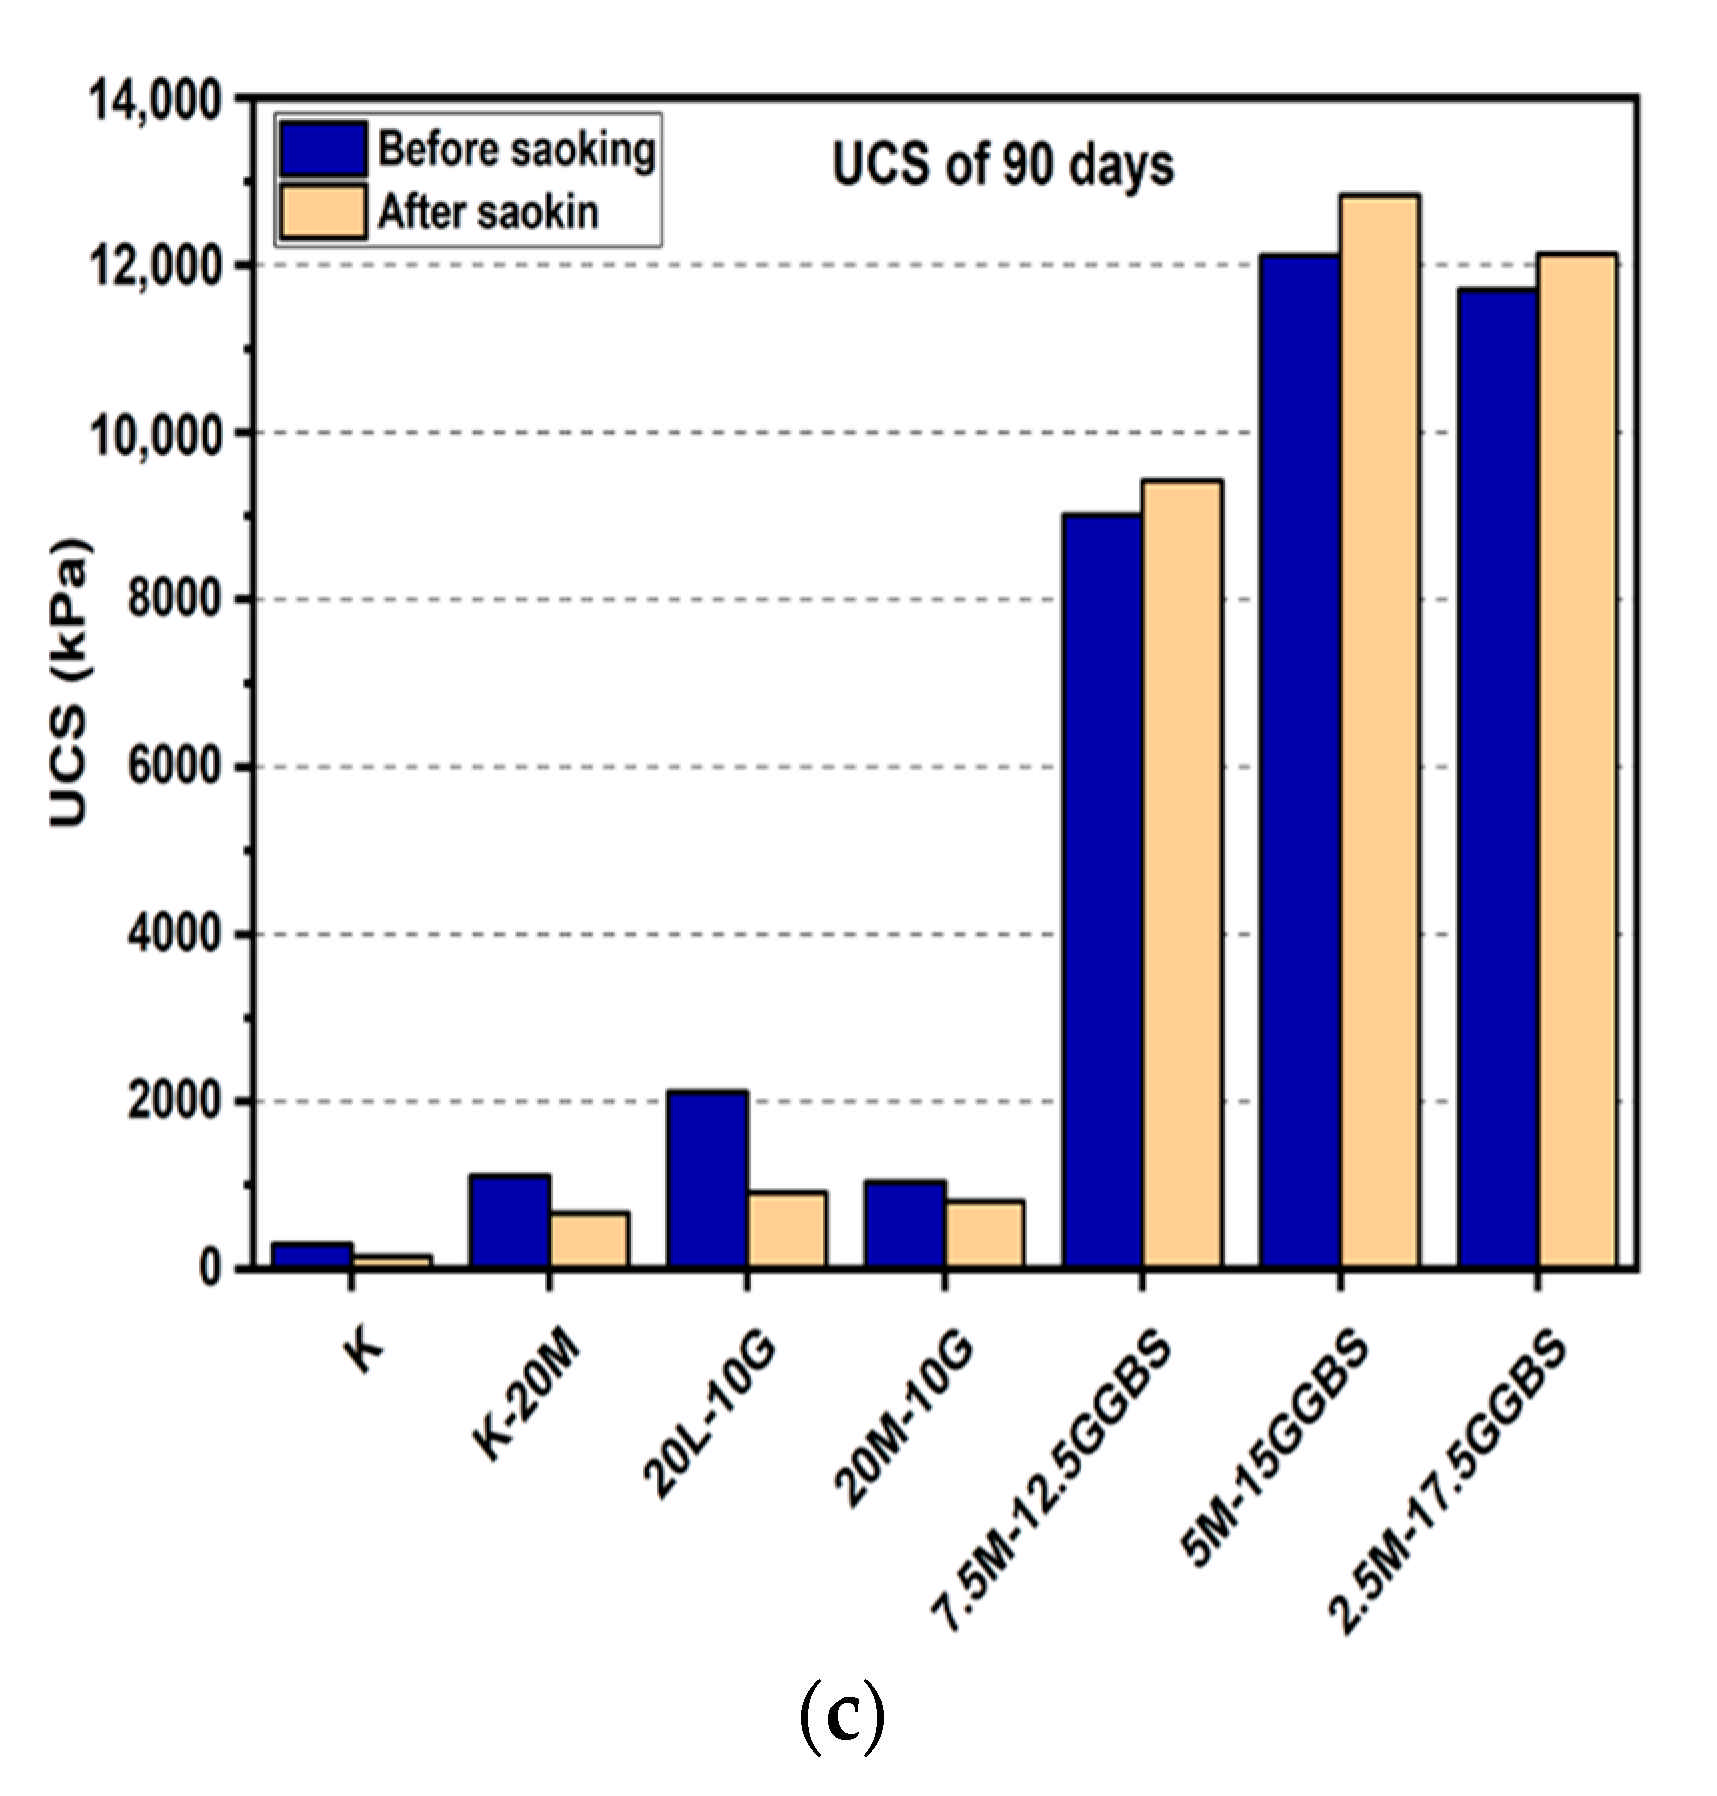
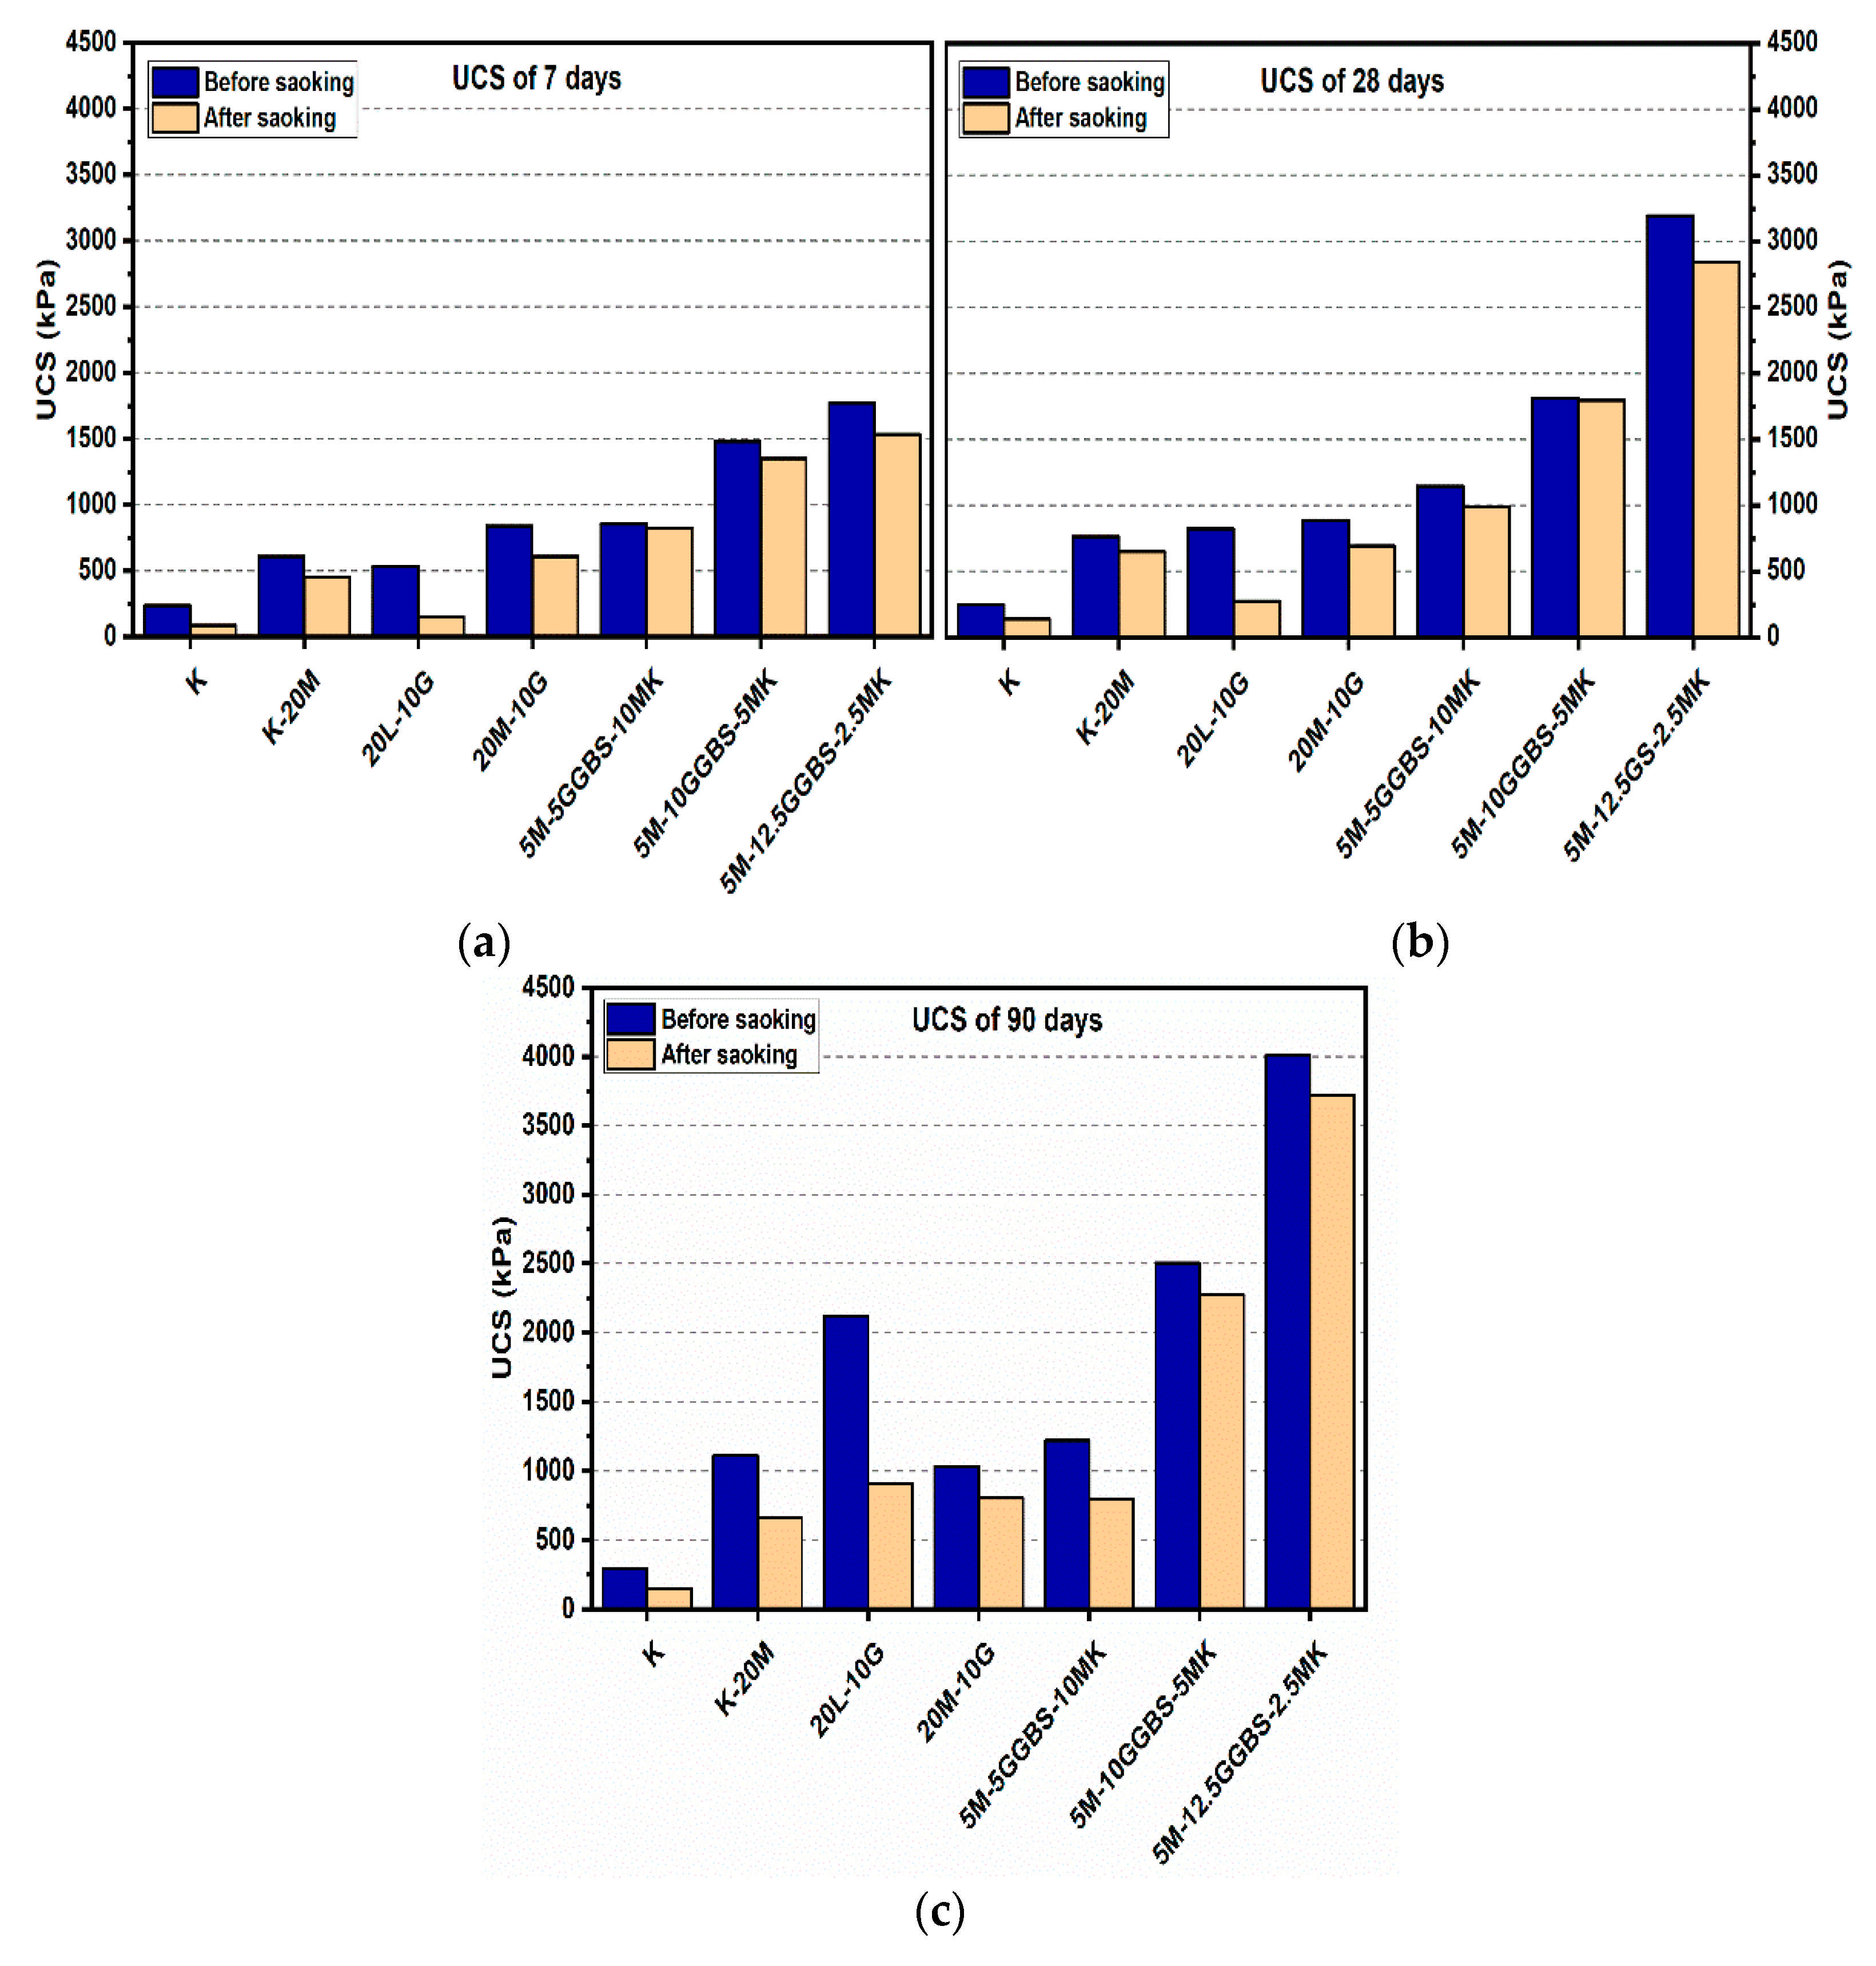
Figure 7.
UCS of soils stabilized with 20% of L, M, and M-GGBS before and after soaking in the presence of sulphate: (a) after curing for 7 days, (b) after curing for 28 days, (c) after curing for 90 days.
Figure 7.
UCS of soils stabilized with 20% of L, M, and M-GGBS before and after soaking in the presence of sulphate: (a) after curing for 7 days, (b) after curing for 28 days, (c) after curing for 90 days.
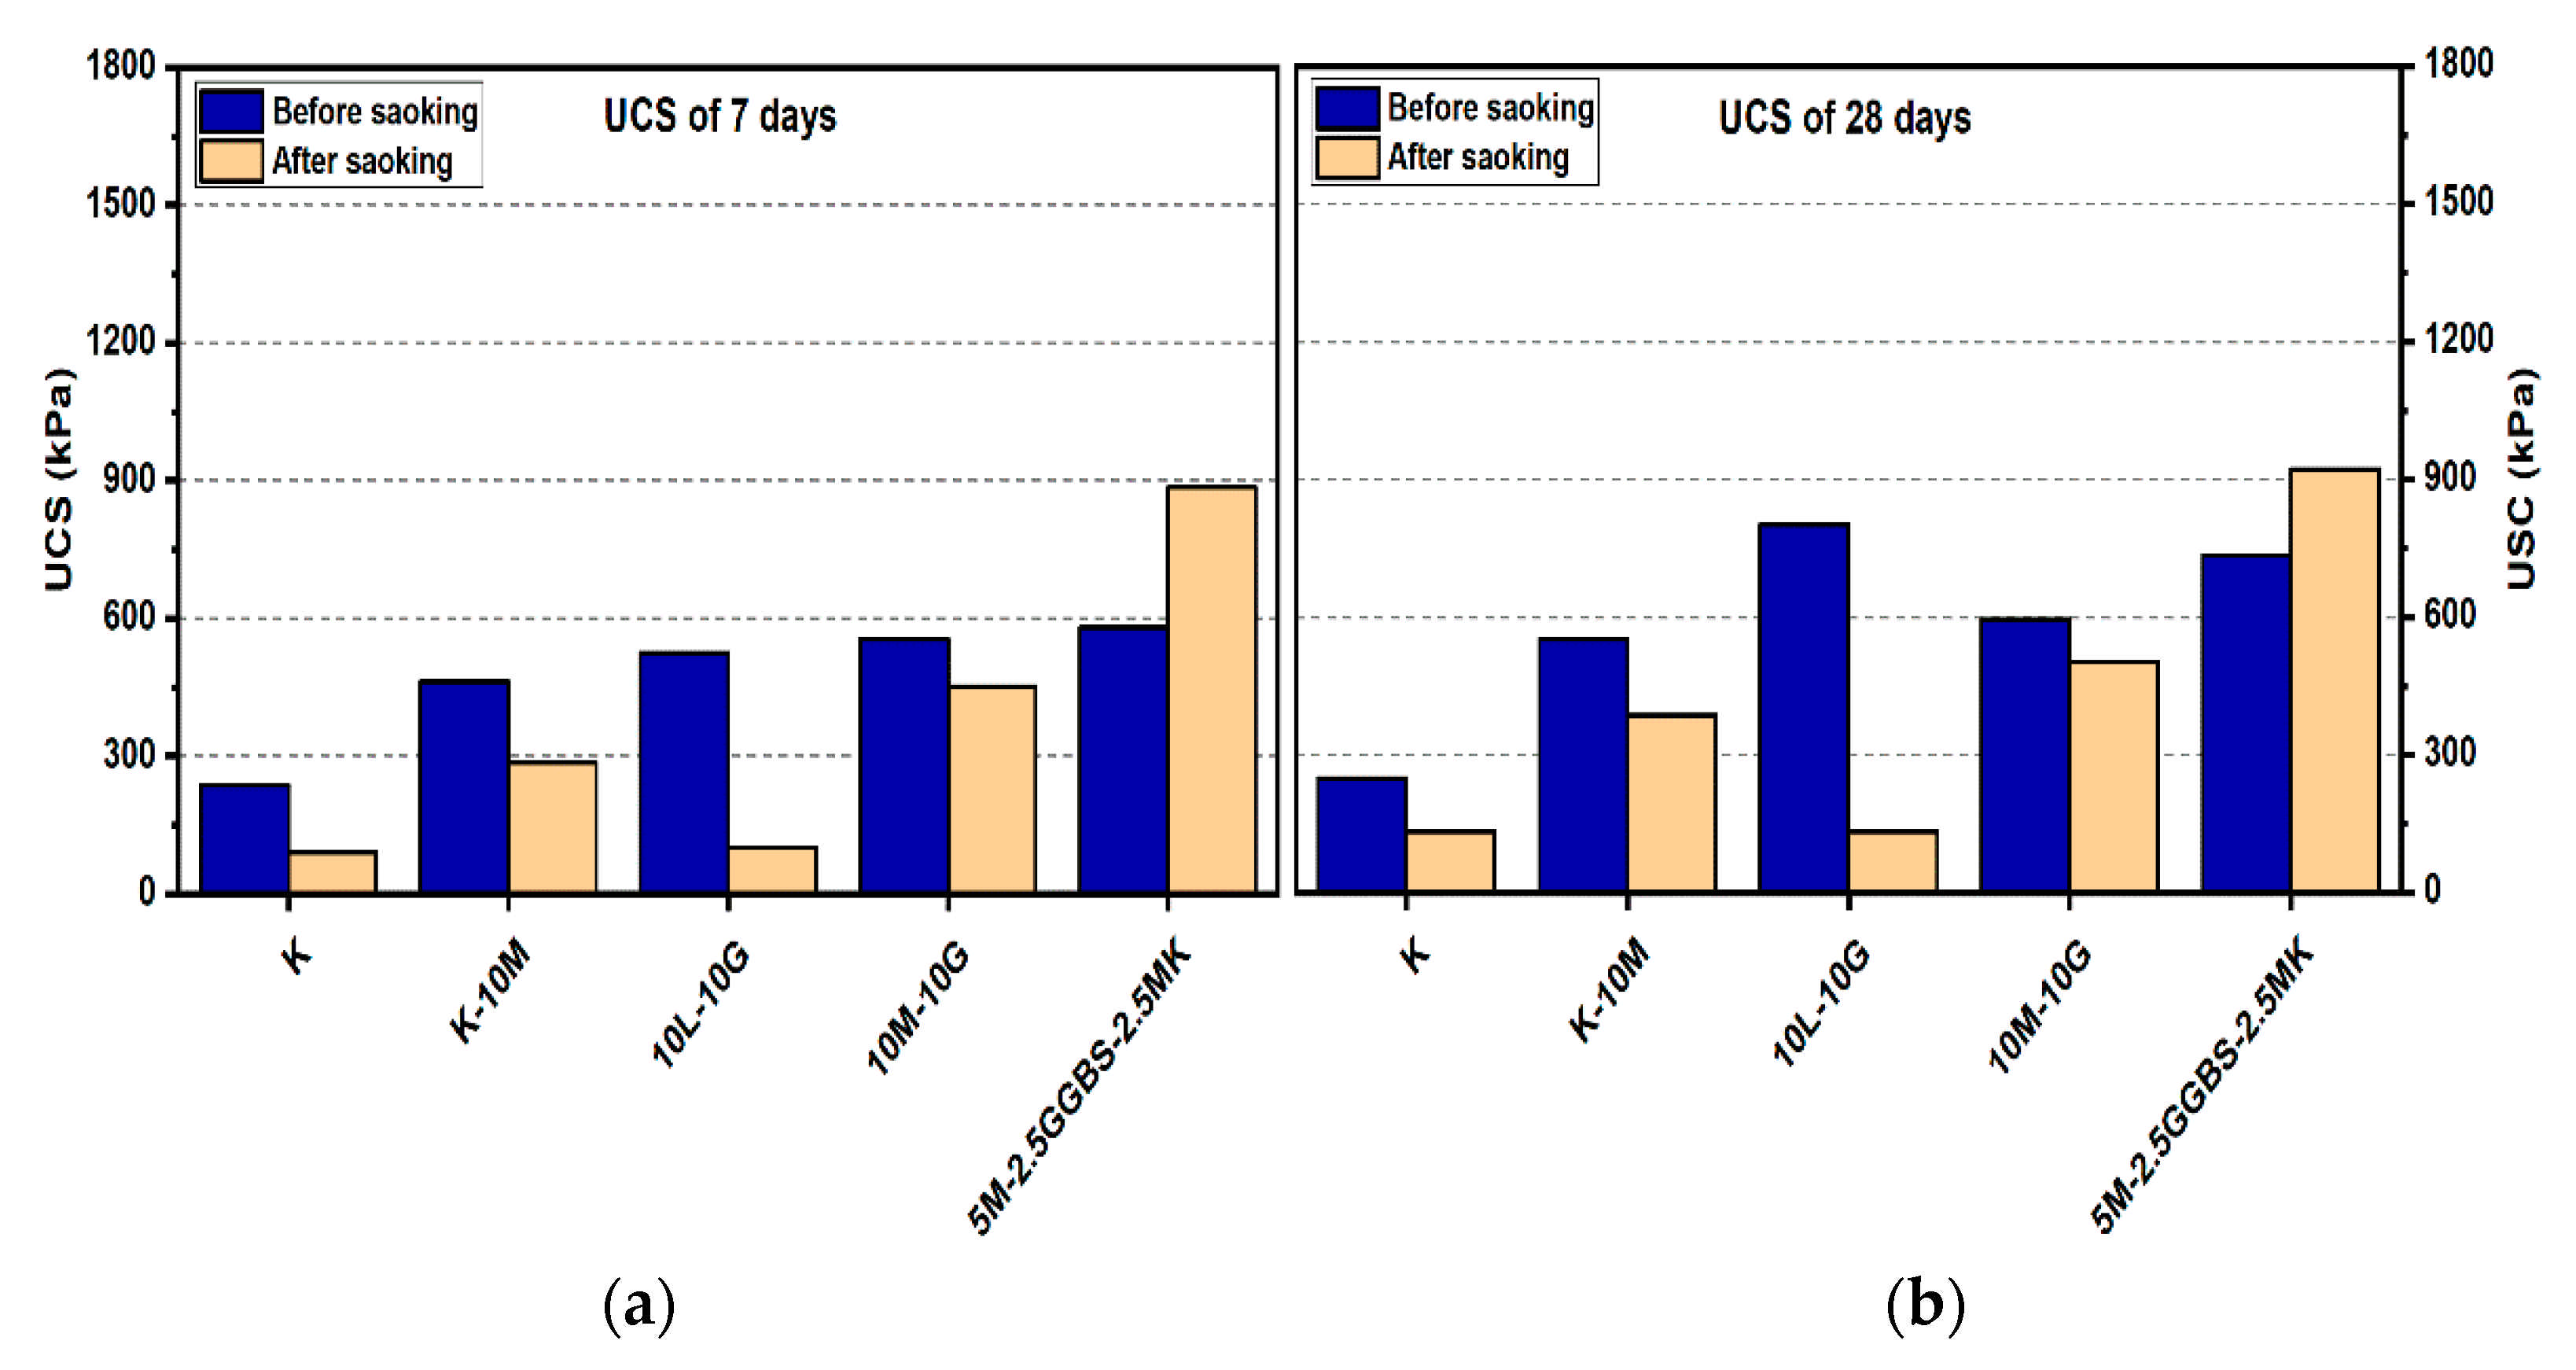
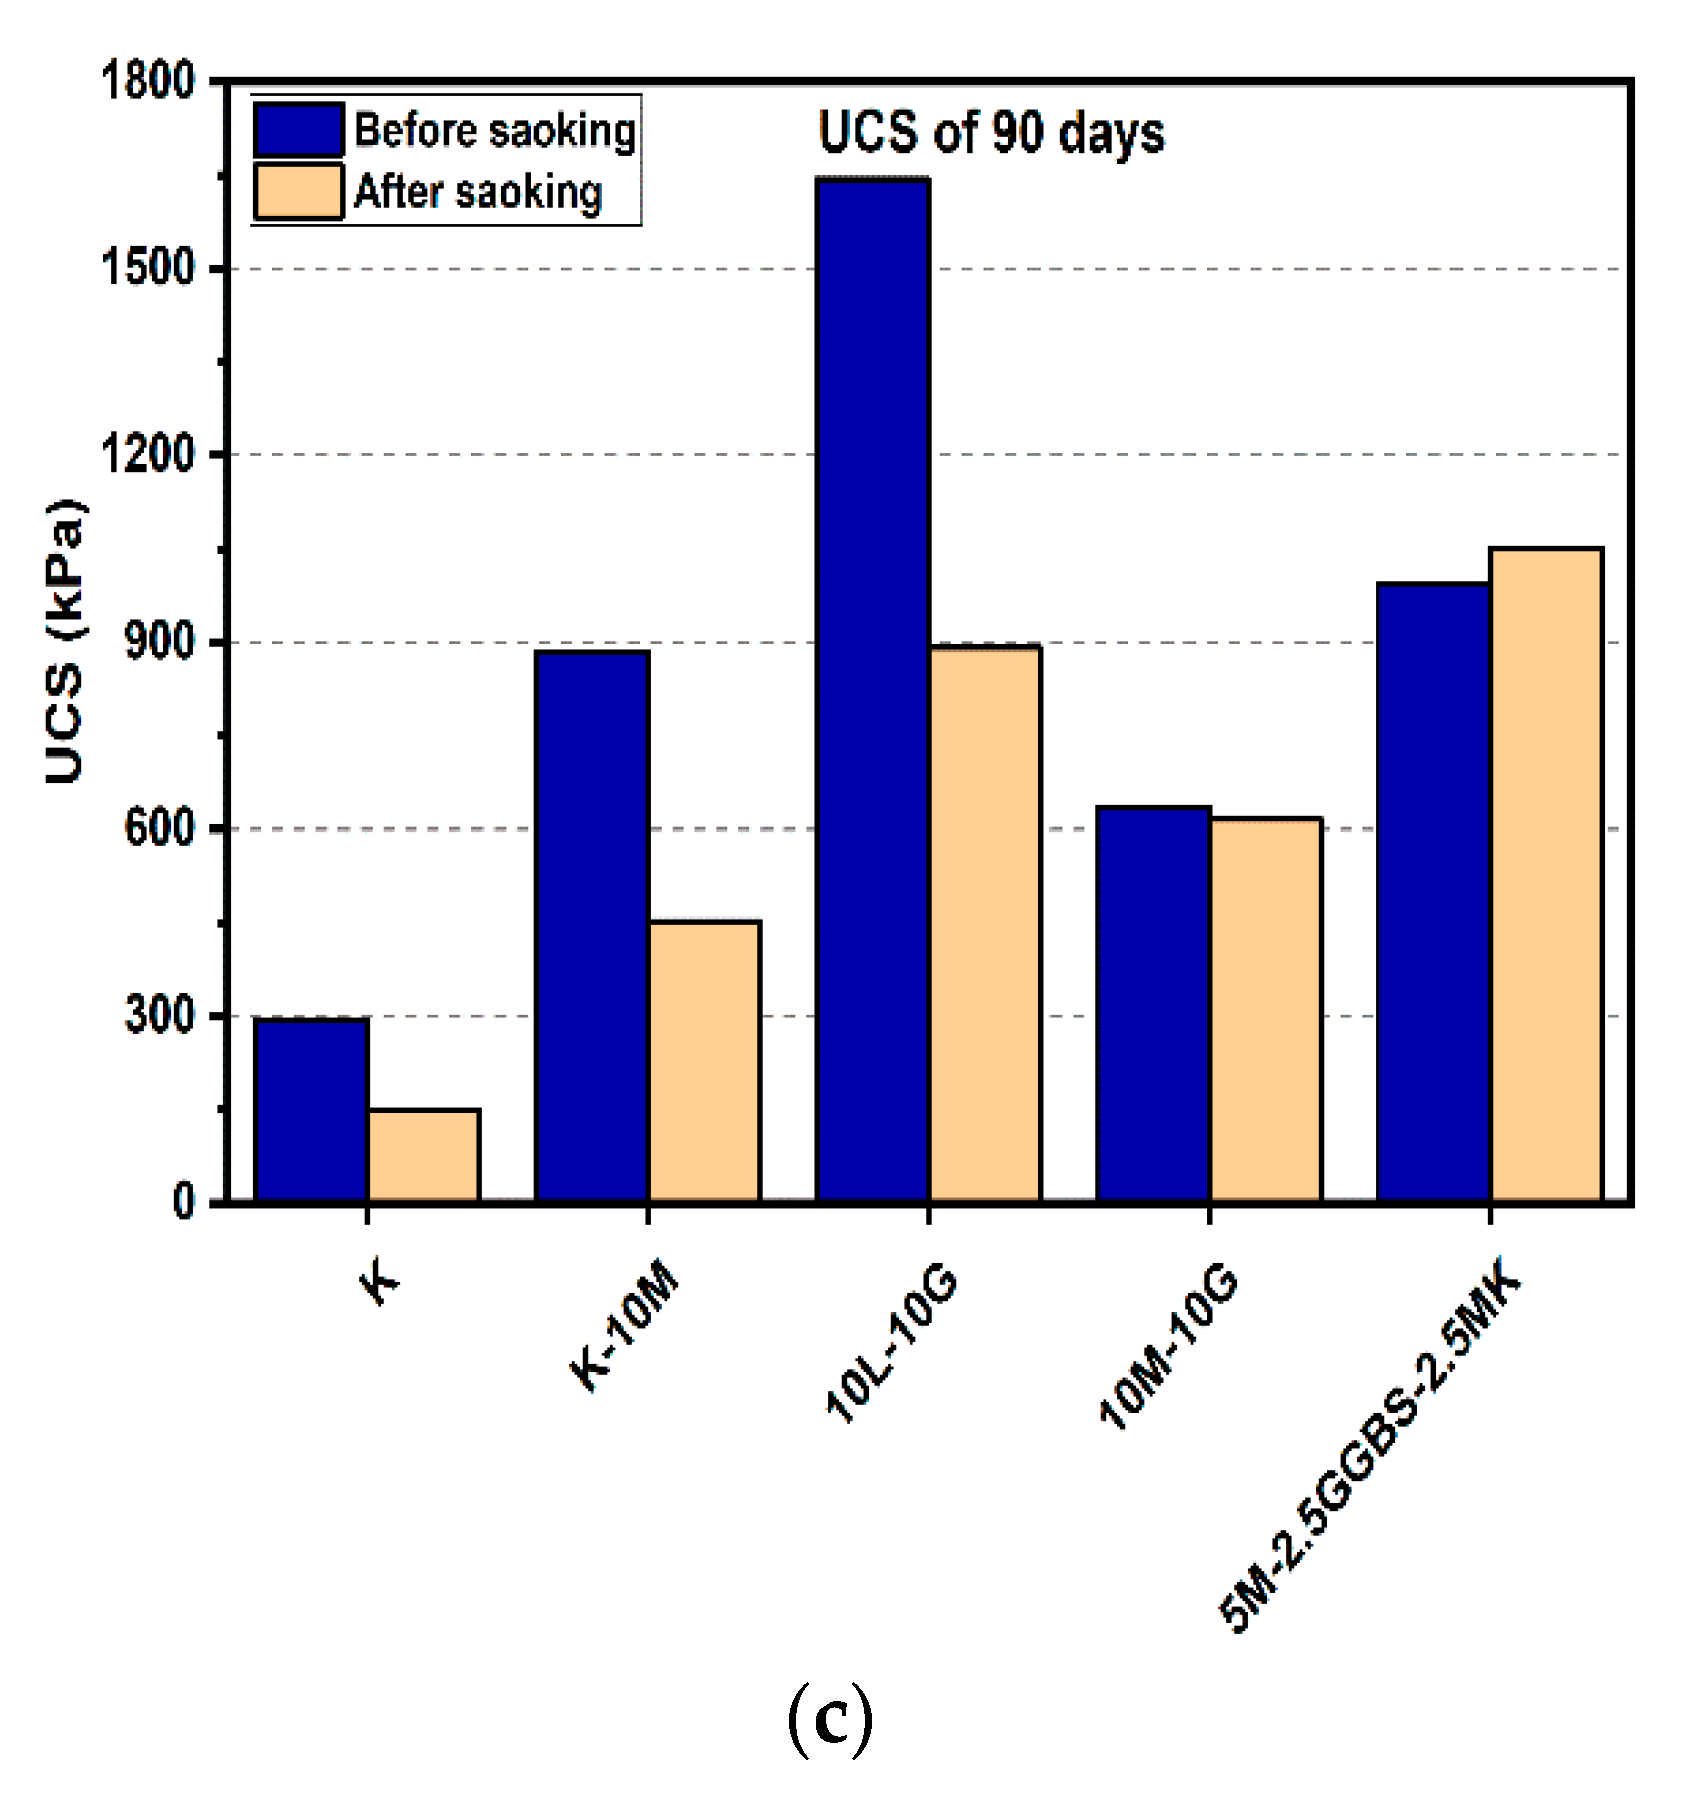
Figure 8.
UCS of soils stabilized with 10% of L, M, and M-GGBS-MK before and after soaking in the presence of sulphate: (a) after curing for 7 days, (b) after curing for 28 days, (c) after curing for 90 days.
Figure 8.
UCS of soils stabilized with 10% of L, M, and M-GGBS-MK before and after soaking in the presence of sulphate: (a) after curing for 7 days, (b) after curing for 28 days, (c) after curing for 90 days.
Figure 9.
UCS of soils stabilized with 20% of L, M and M-GGBS-MK before and after soaking in the presence of sulphate: (a) after curing for 7 days, (b) after curing for 28 days, (c) after curing for 90 days.
Figure 9.
UCS of soils stabilized with 20% of L, M and M-GGBS-MK before and after soaking in the presence of sulphate: (a) after curing for 7 days, (b) after curing for 28 days, (c) after curing for 90 days.
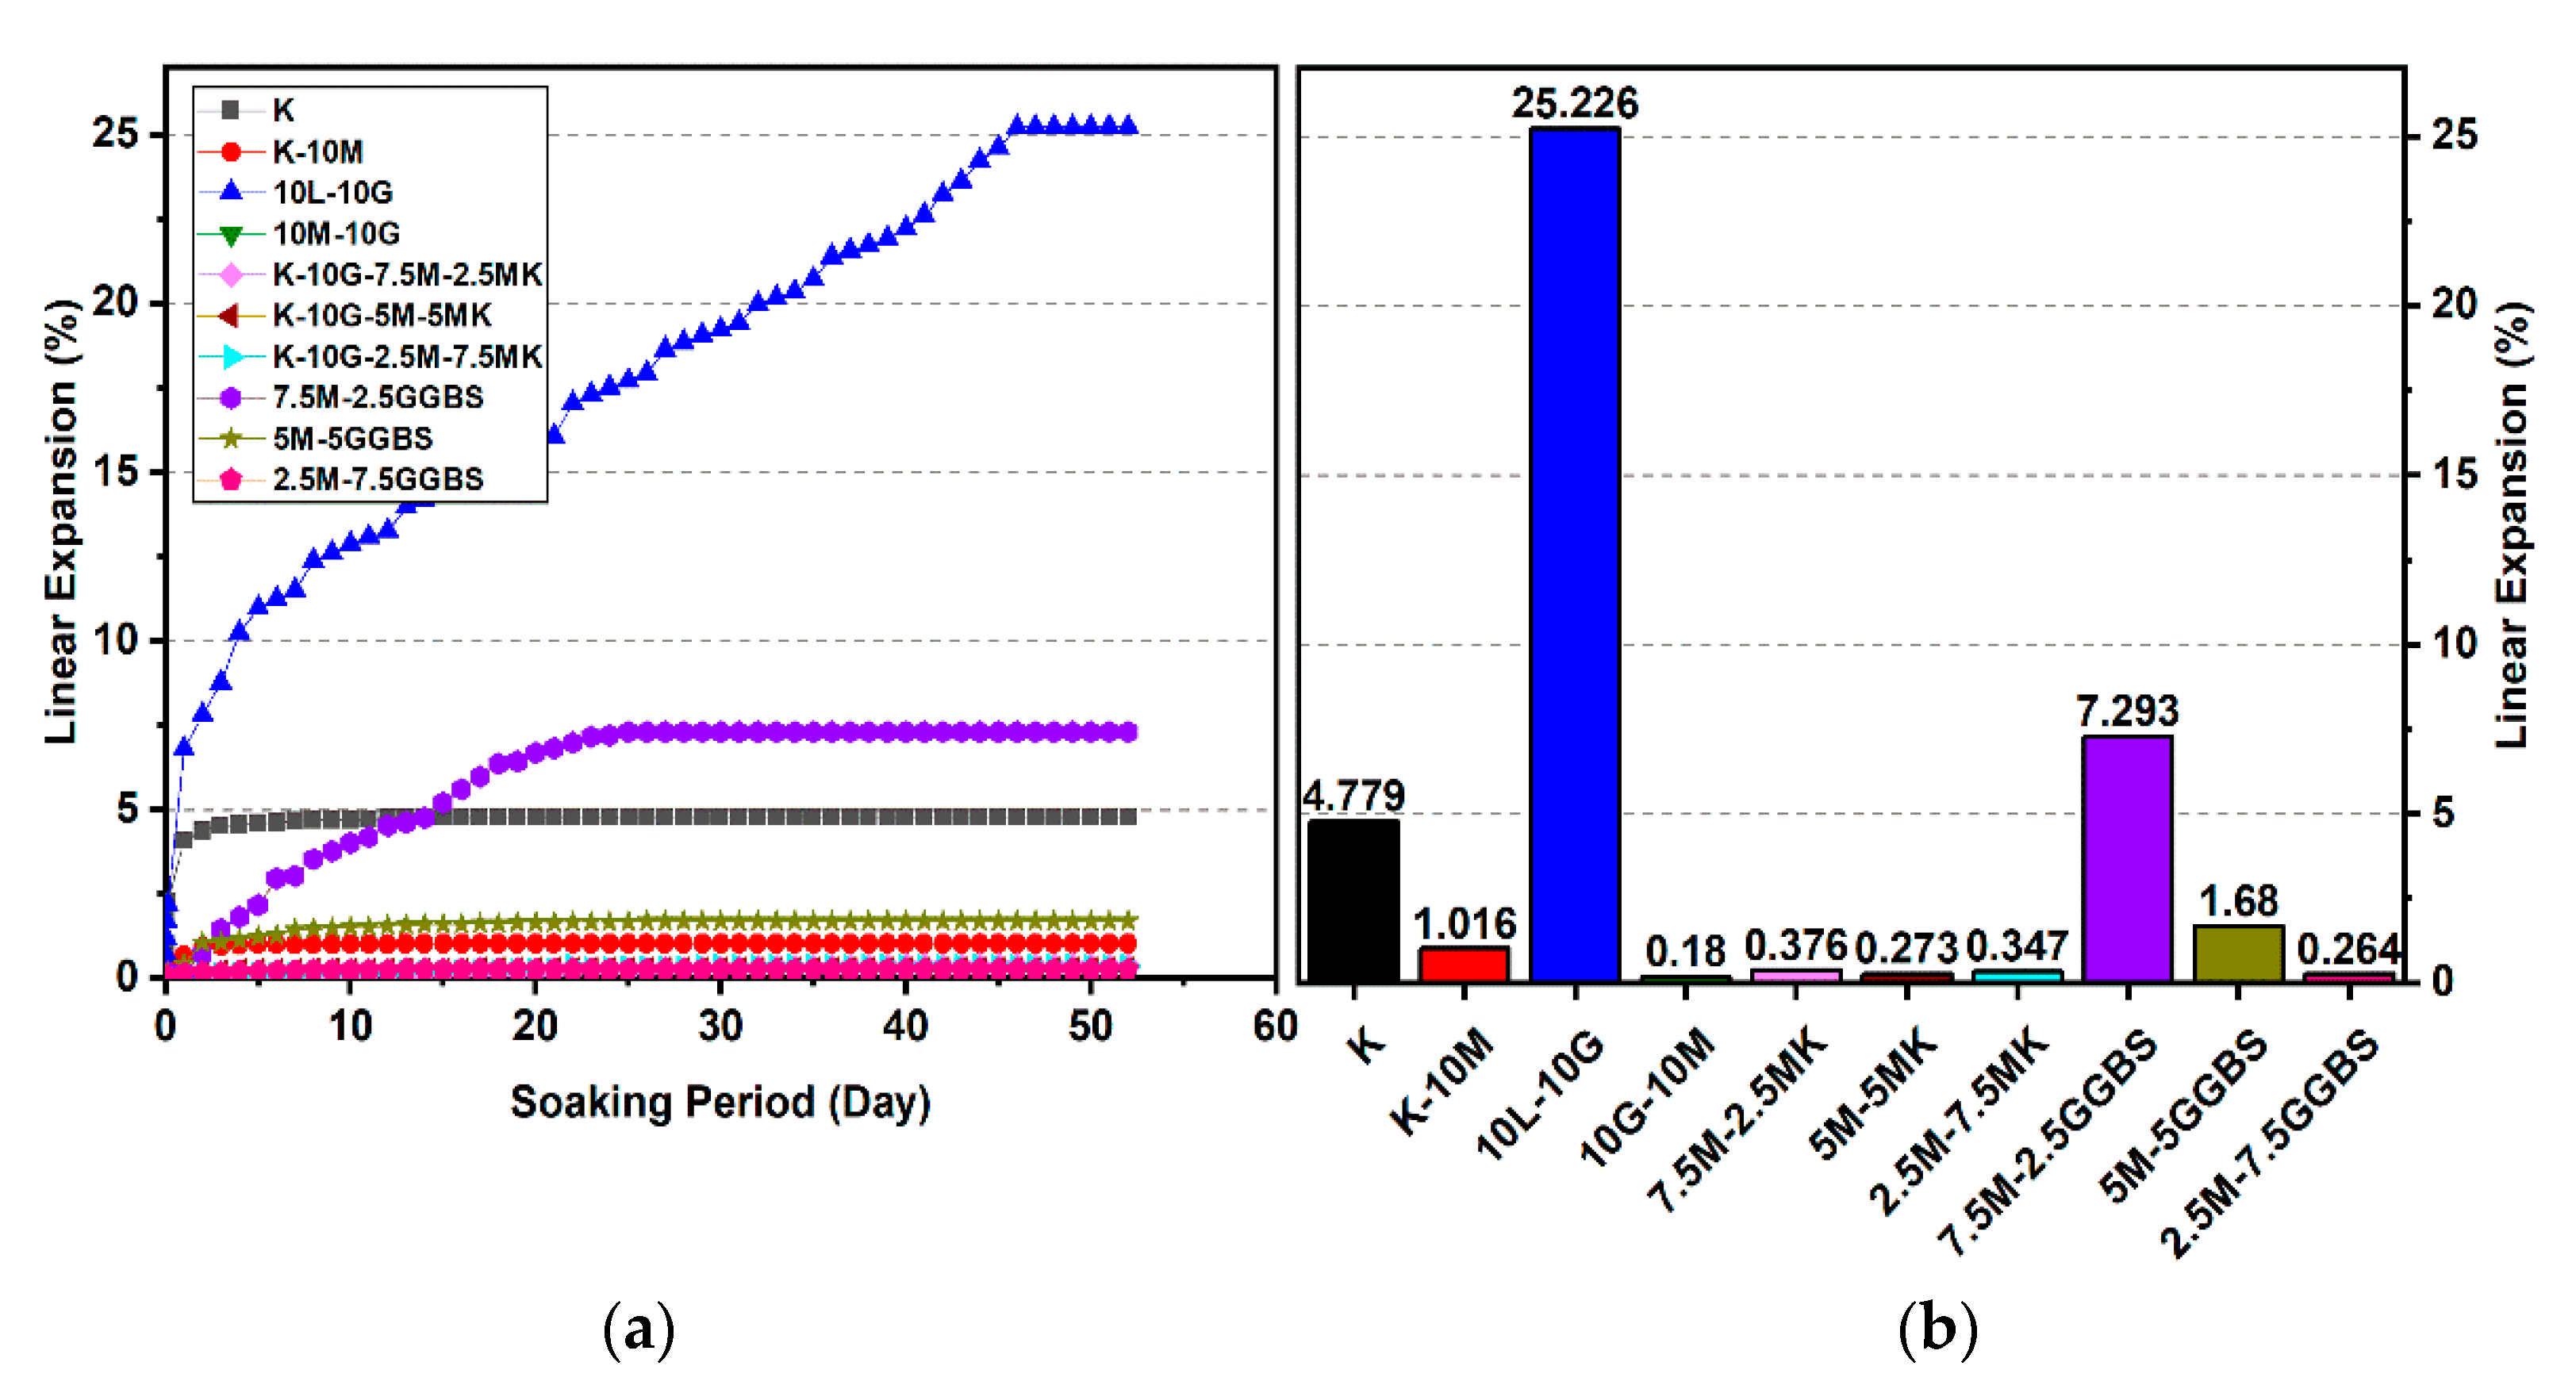
Figure 10.
Vertical swelling strain of soils stabilized with 10% of L, M, M-MK, and M-GGBS after 7 days of curing: (a) results presented as a line curve, (b) results presented as columns.
Figure 10.
Vertical swelling strain of soils stabilized with 10% of L, M, M-MK, and M-GGBS after 7 days of curing: (a) results presented as a line curve, (b) results presented as columns.
Figure 11.
Vertical swelling strain of soils stabilized with 10% of L, M, M-MK, and M-GGBS after 28 days of curing: (a) results presented as a line curve, (b) results presented as columns.
Figure 11.
Vertical swelling strain of soils stabilized with 10% of L, M, M-MK, and M-GGBS after 28 days of curing: (a) results presented as a line curve, (b) results presented as columns.
Figure 12.
Vertical swelling strain of soils stabilized with 10% of L, M, M-MK, and M-GGBS after 90 days of curing: (a) results presented as a line curve, (b) results presented as columns.
Figure 12.
Vertical swelling strain of soils stabilized with 10% of L, M, M-MK, and M-GGBS after 90 days of curing: (a) results presented as a line curve, (b) results presented as columns.
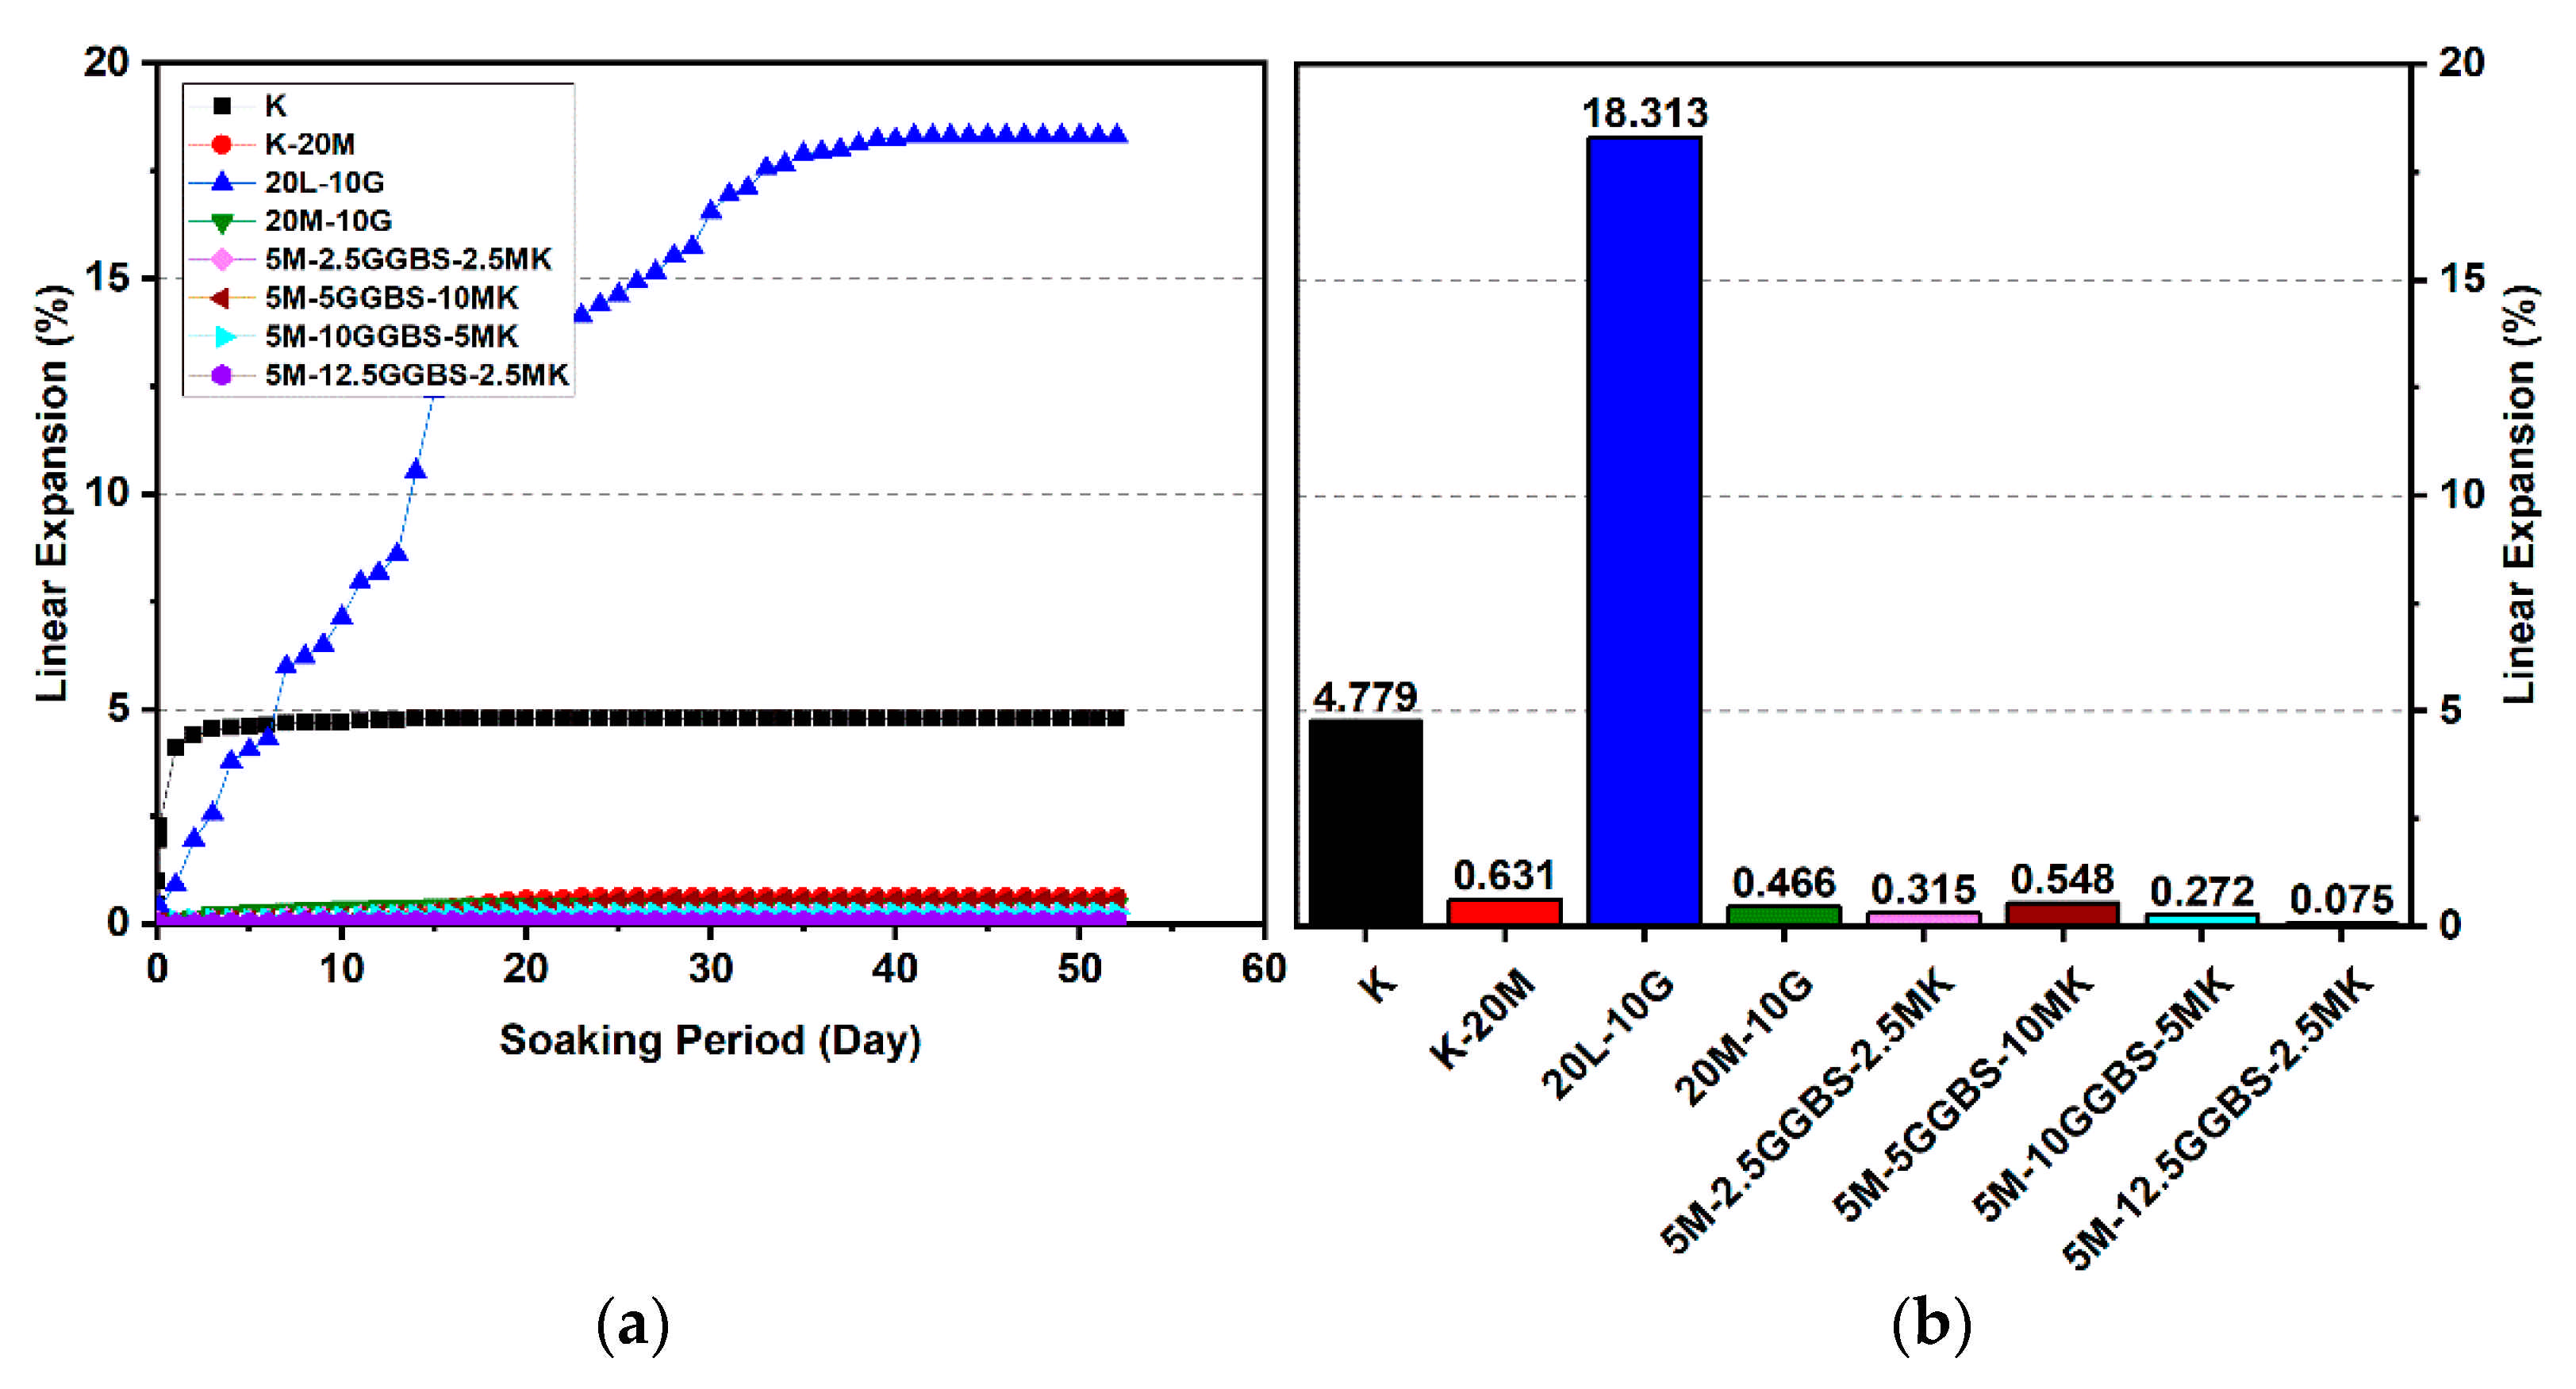
Figure 13.
Vertical swelling strain of soils stabilized with 20% of L, M, M-MK, and M-GGBS after 7 days of curing: (a) results presented as a line curve, (b) results presented as columns.
Figure 13.
Vertical swelling strain of soils stabilized with 20% of L, M, M-MK, and M-GGBS after 7 days of curing: (a) results presented as a line curve, (b) results presented as columns.
Figure 14.
Vertical swelling strain of soils stabilized with 20% of L, M, M-MK, and M-GGBS after 28 days of curing: (a) results presented as a line curve, (b) results presented as columns.
Figure 14.
Vertical swelling strain of soils stabilized with 20% of L, M, M-MK, and M-GGBS after 28 days of curing: (a) results presented as a line curve, (b) results presented as columns.
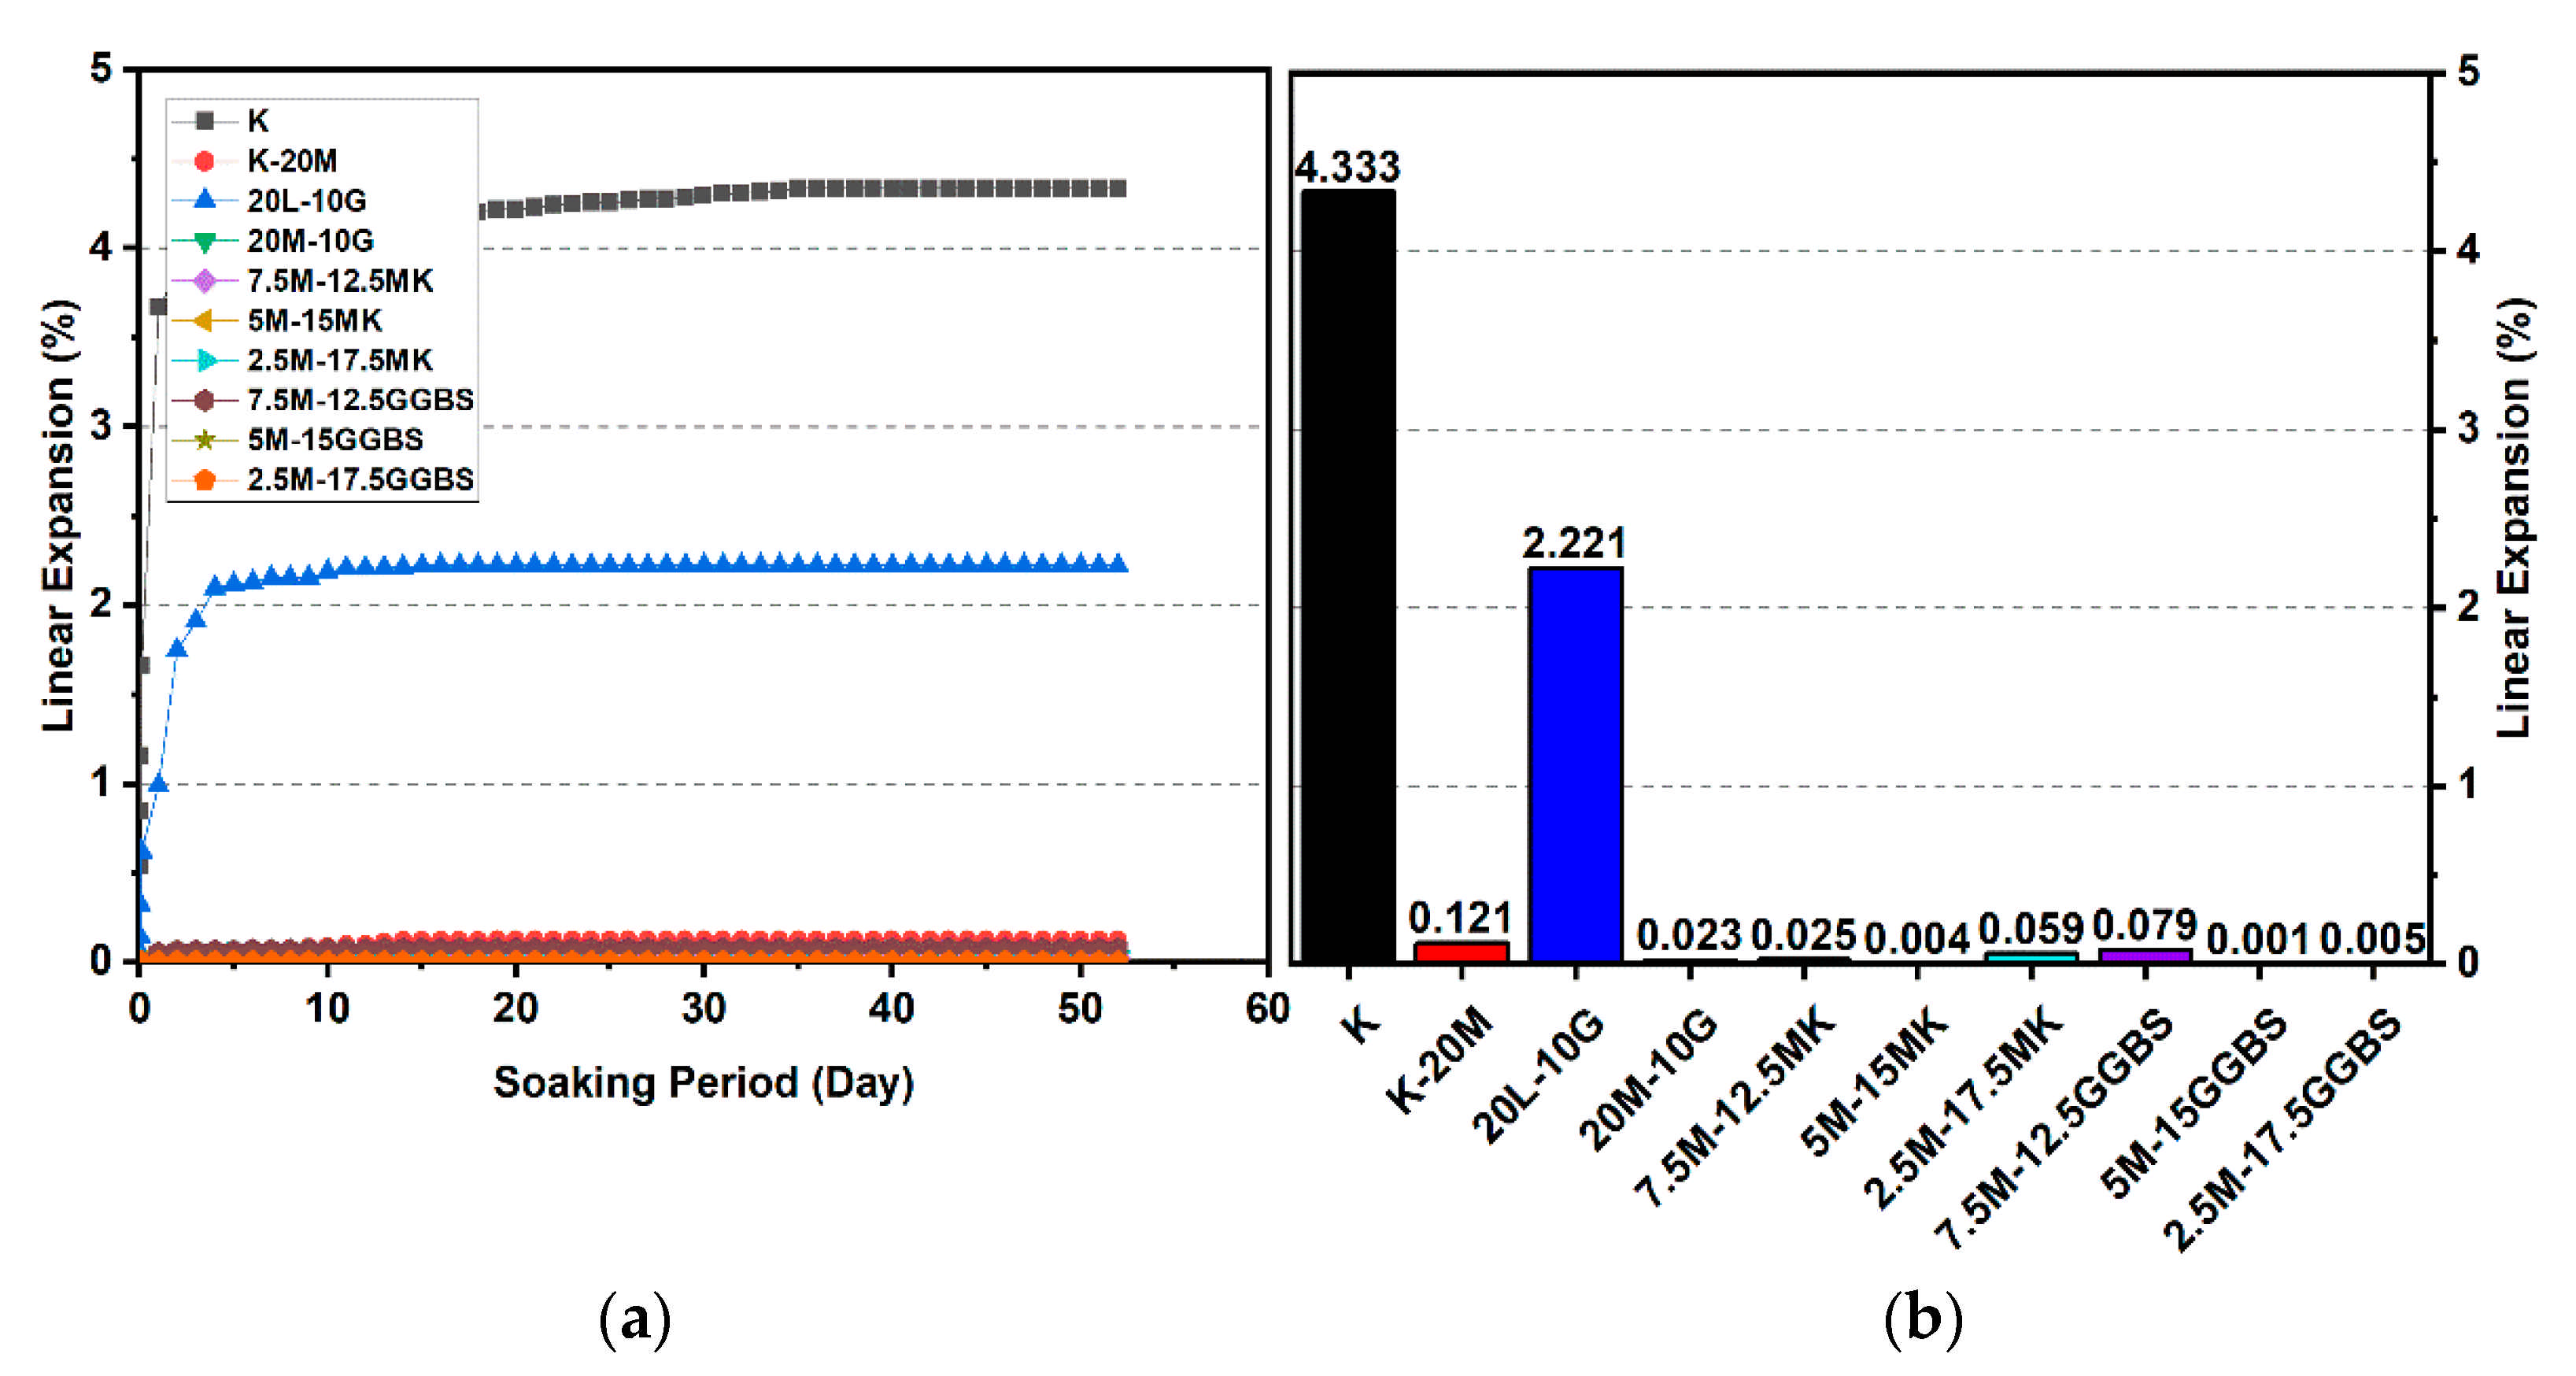
Figure 15.
Vertical swelling strain of soils stabilized with 20% of L, M, M-MK, and M-GGBS after 90 days of curing: (a) results presented as a line curve, (b) results presented as columns.
Figure 15.
Vertical swelling strain of soils stabilized with 20% of L, M, M-MK, and M-GGBS after 90 days of curing: (a) results presented as a line curve, (b) results presented as columns.
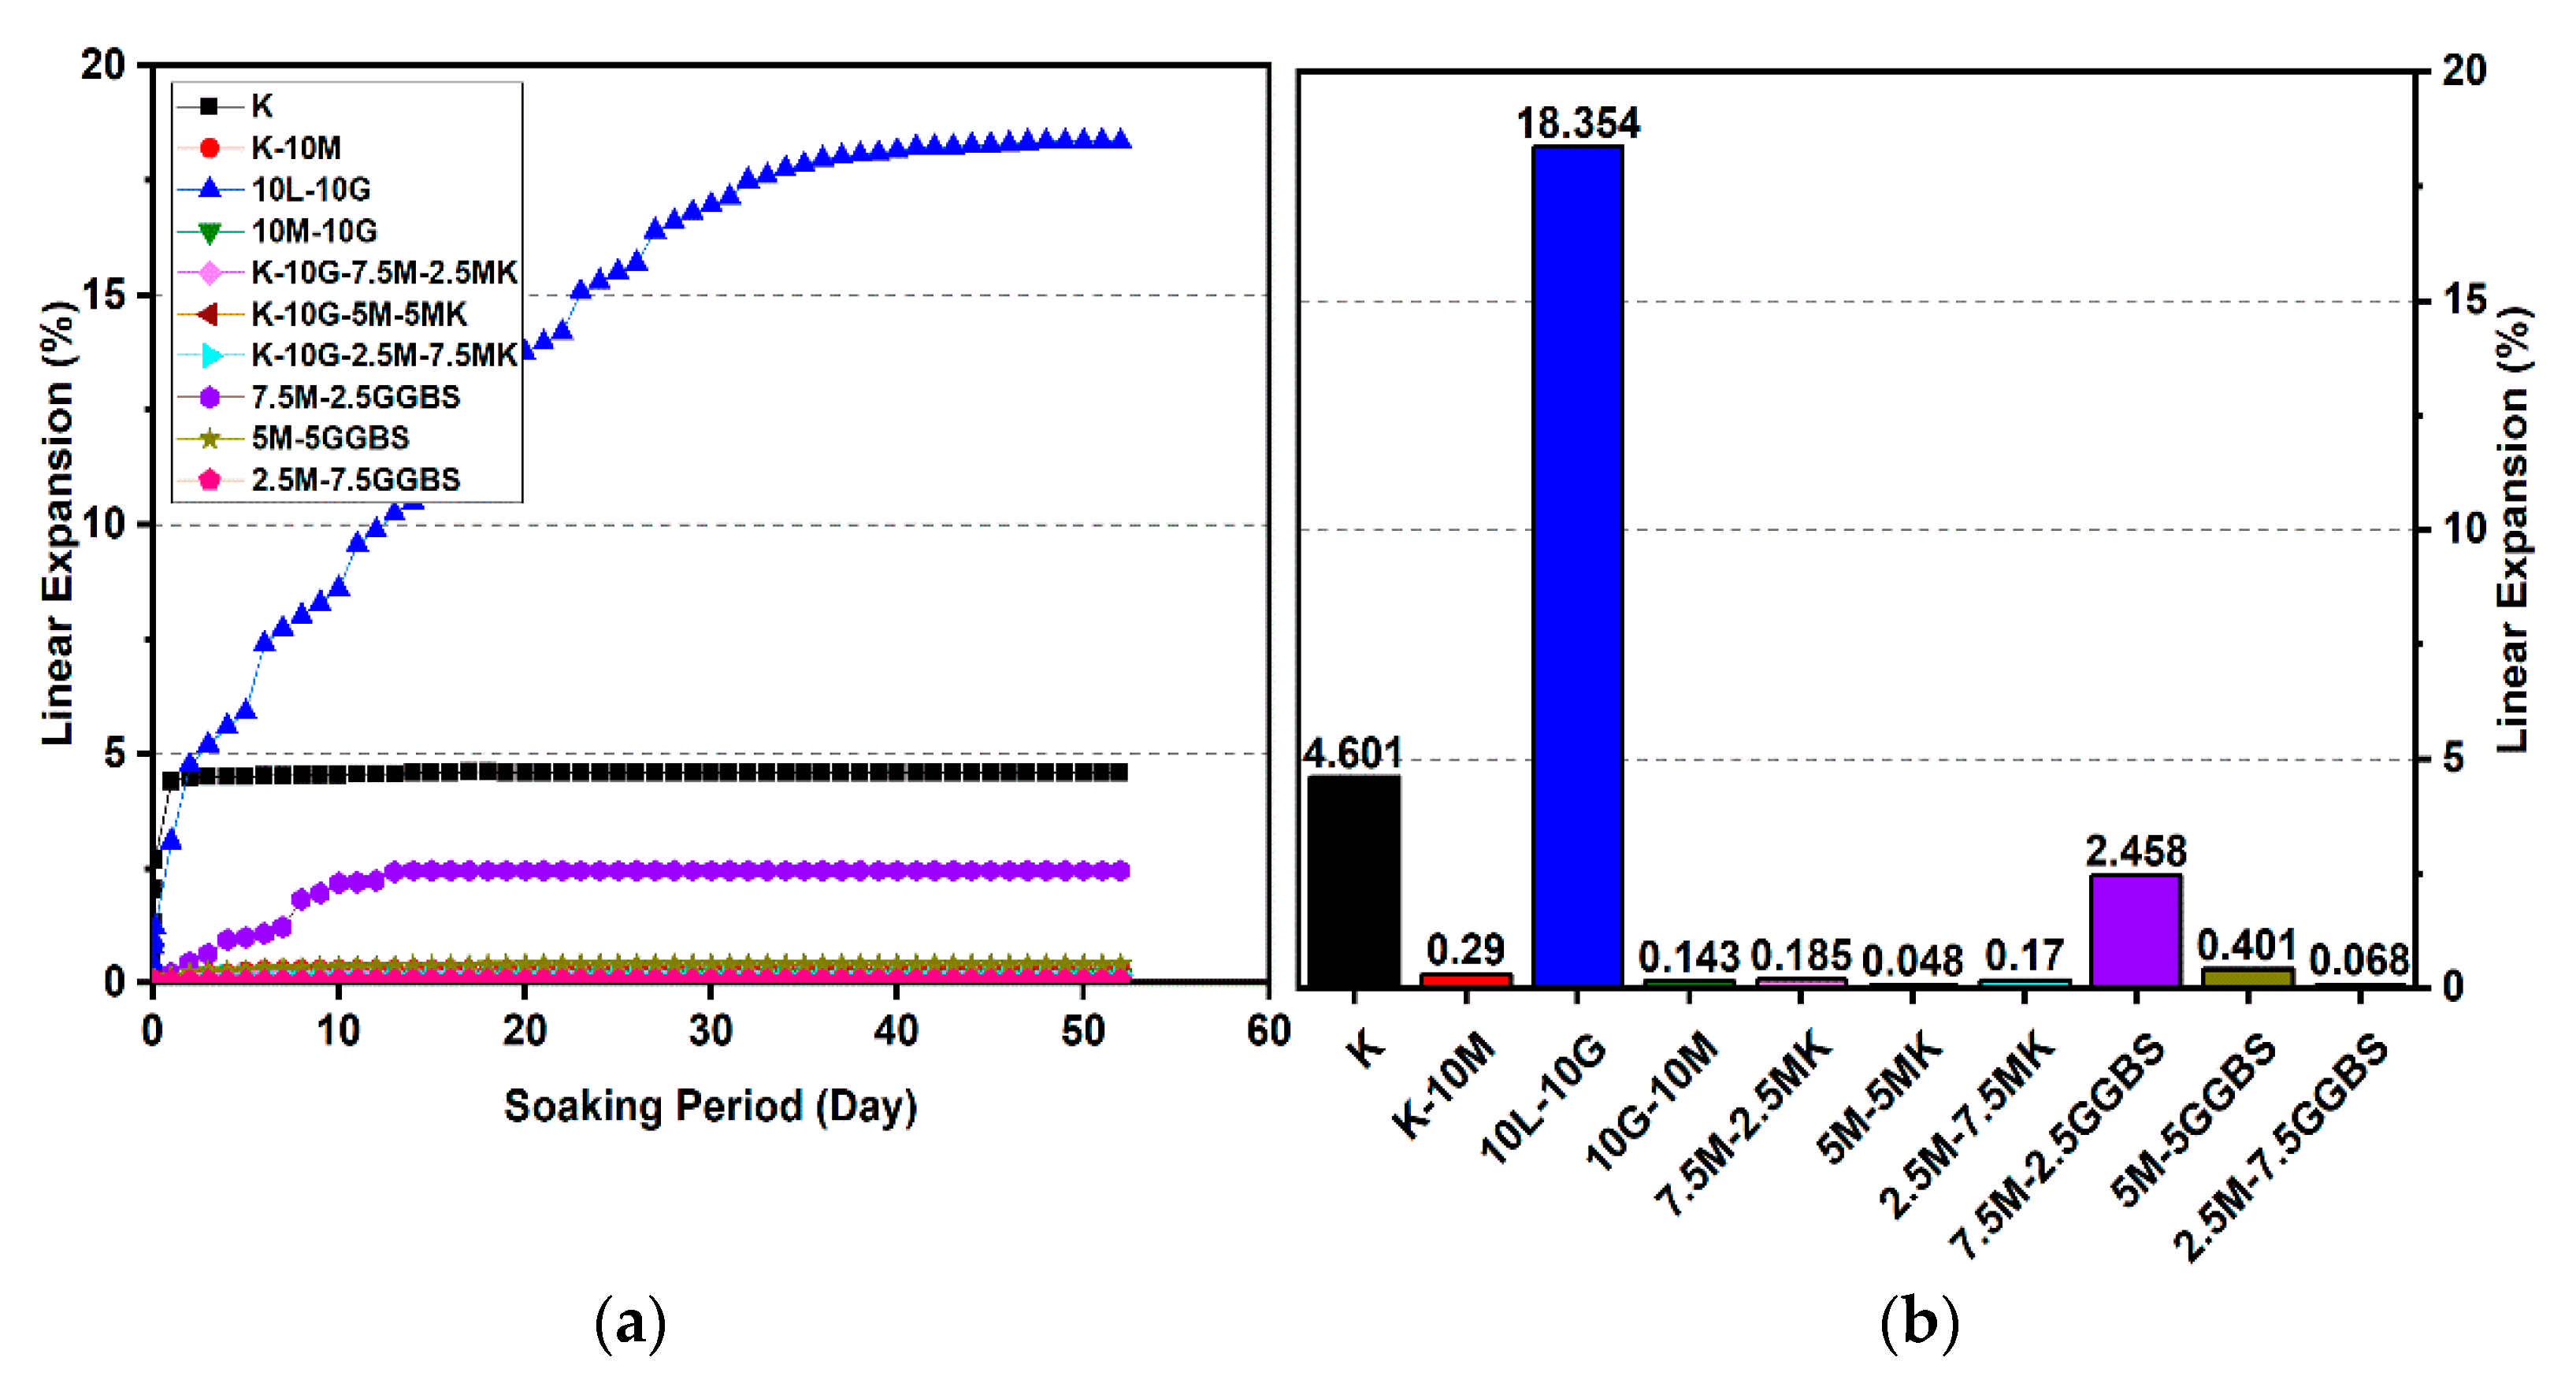
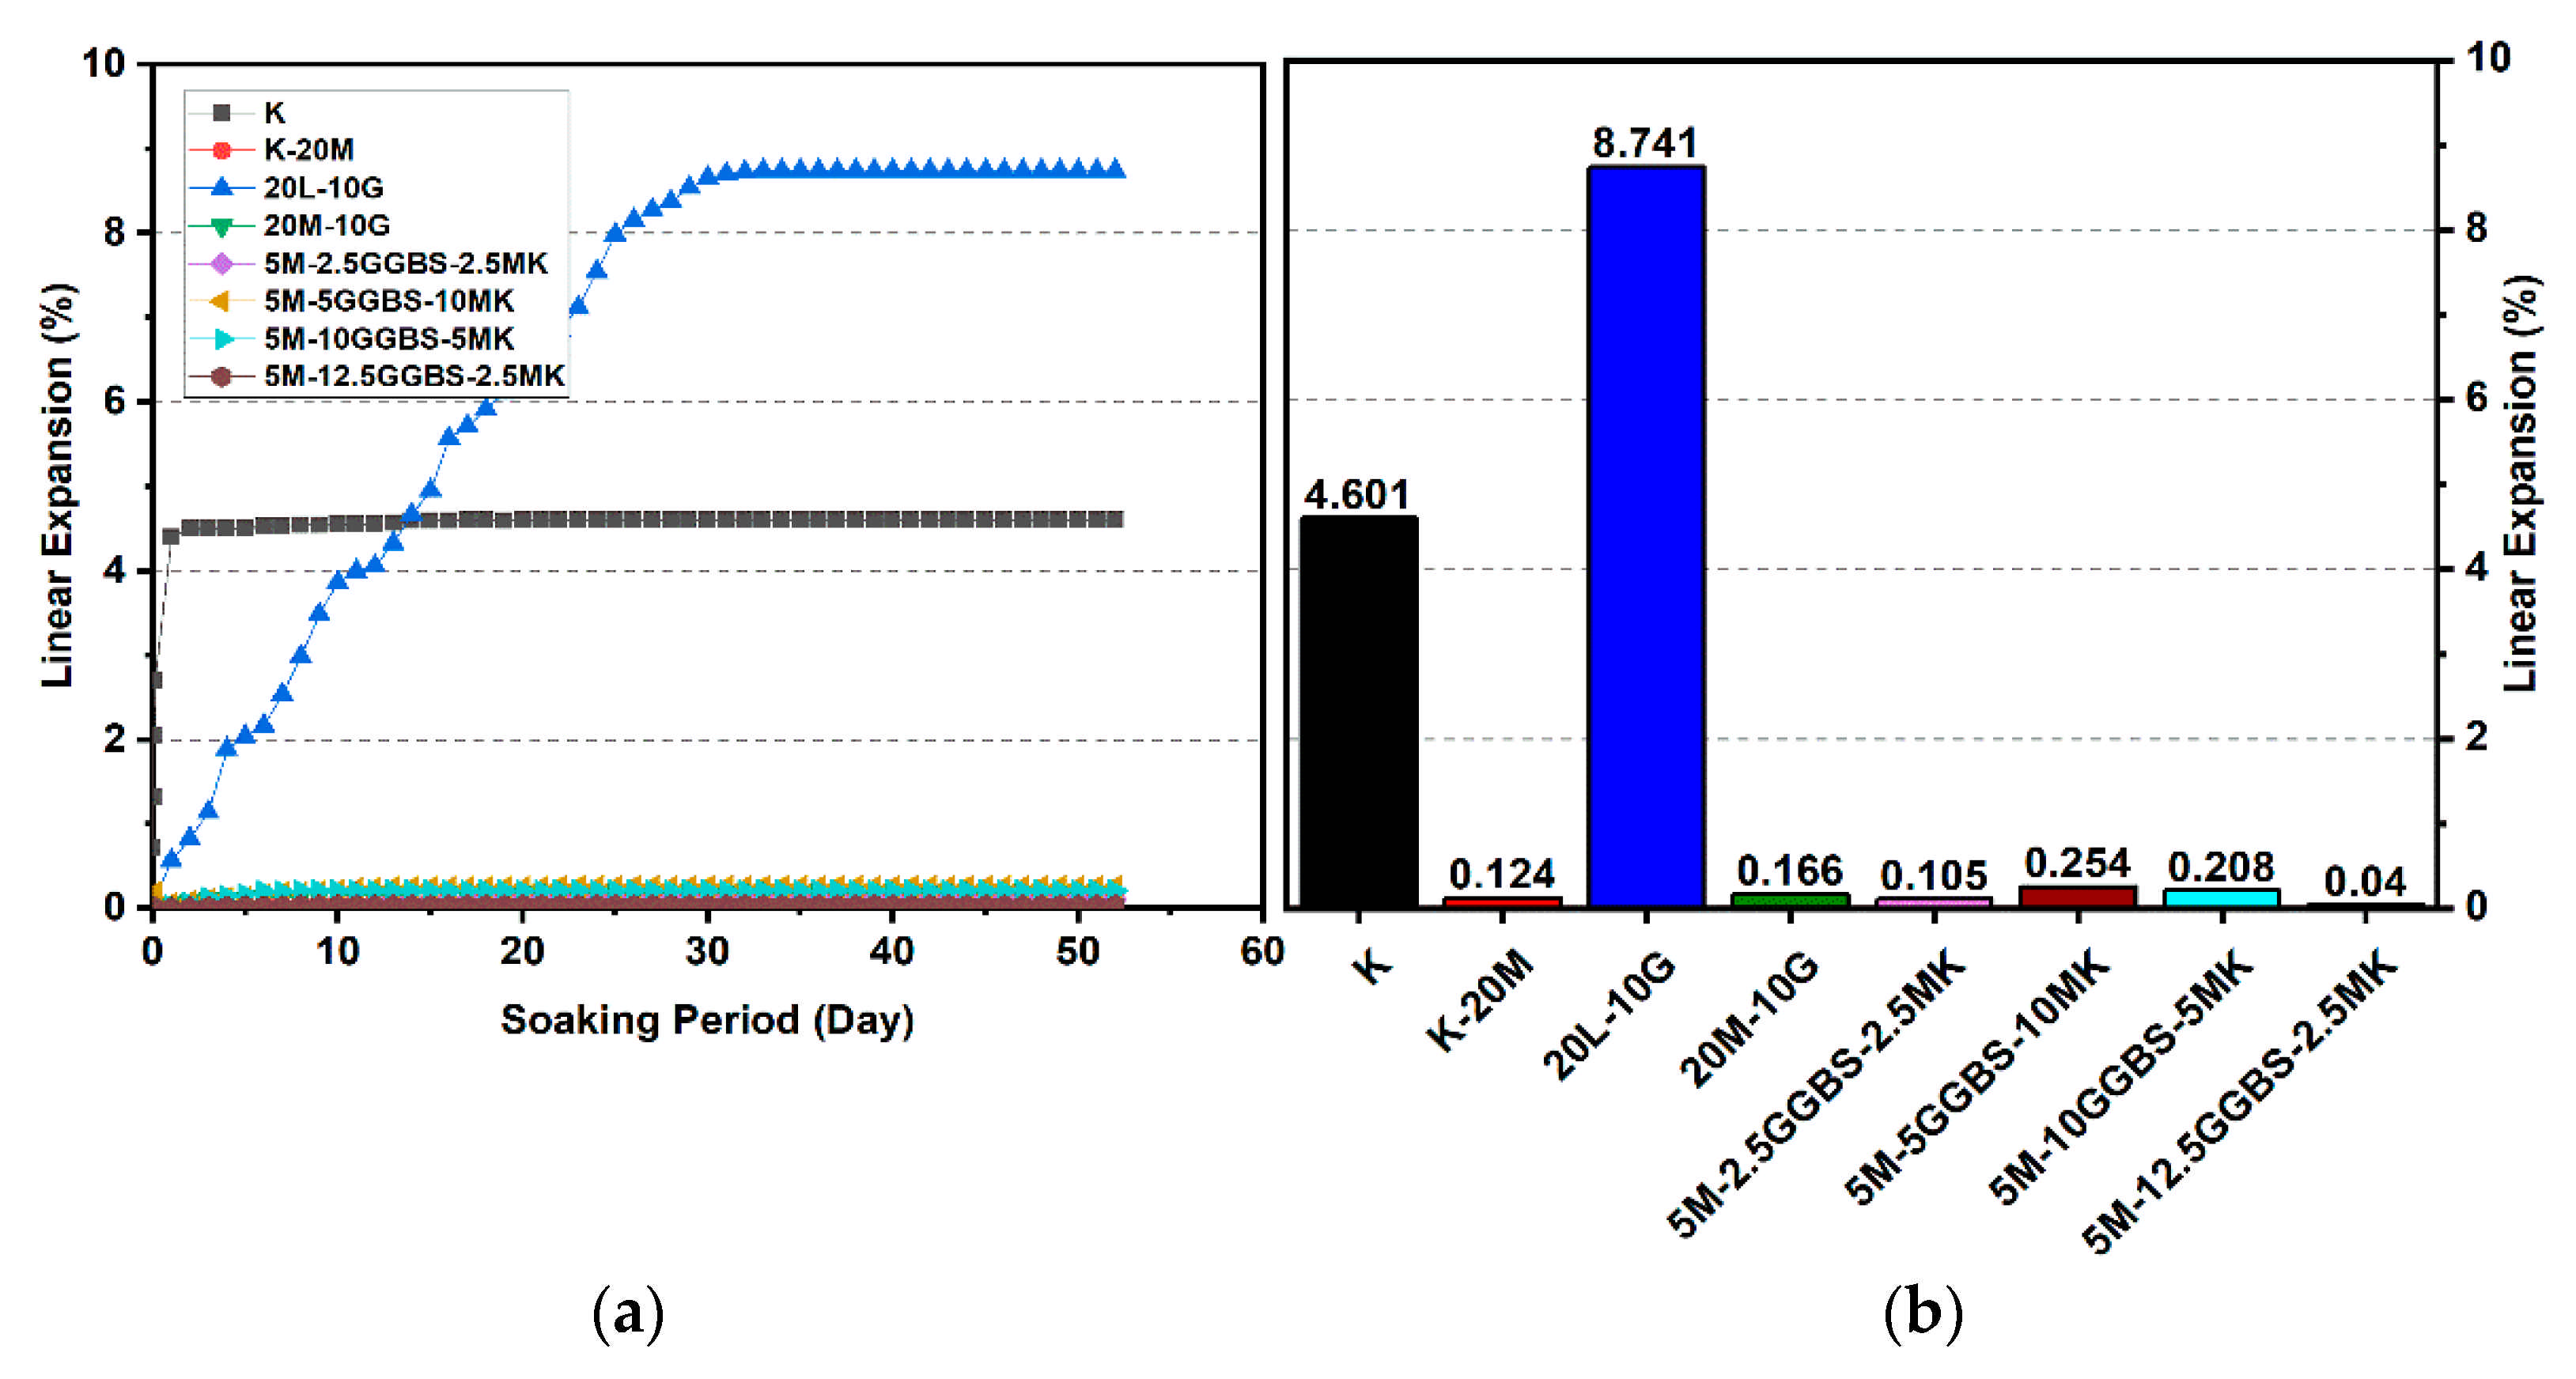
Figure 16.
Vertical swelling strain of soils stabilized with 10% and 20% of L, M, and M-GGBS-MK after 7 days of curing: (a) results presented as a line curve, (b) results presented as columns.
Figure 16.
Vertical swelling strain of soils stabilized with 10% and 20% of L, M, and M-GGBS-MK after 7 days of curing: (a) results presented as a line curve, (b) results presented as columns.
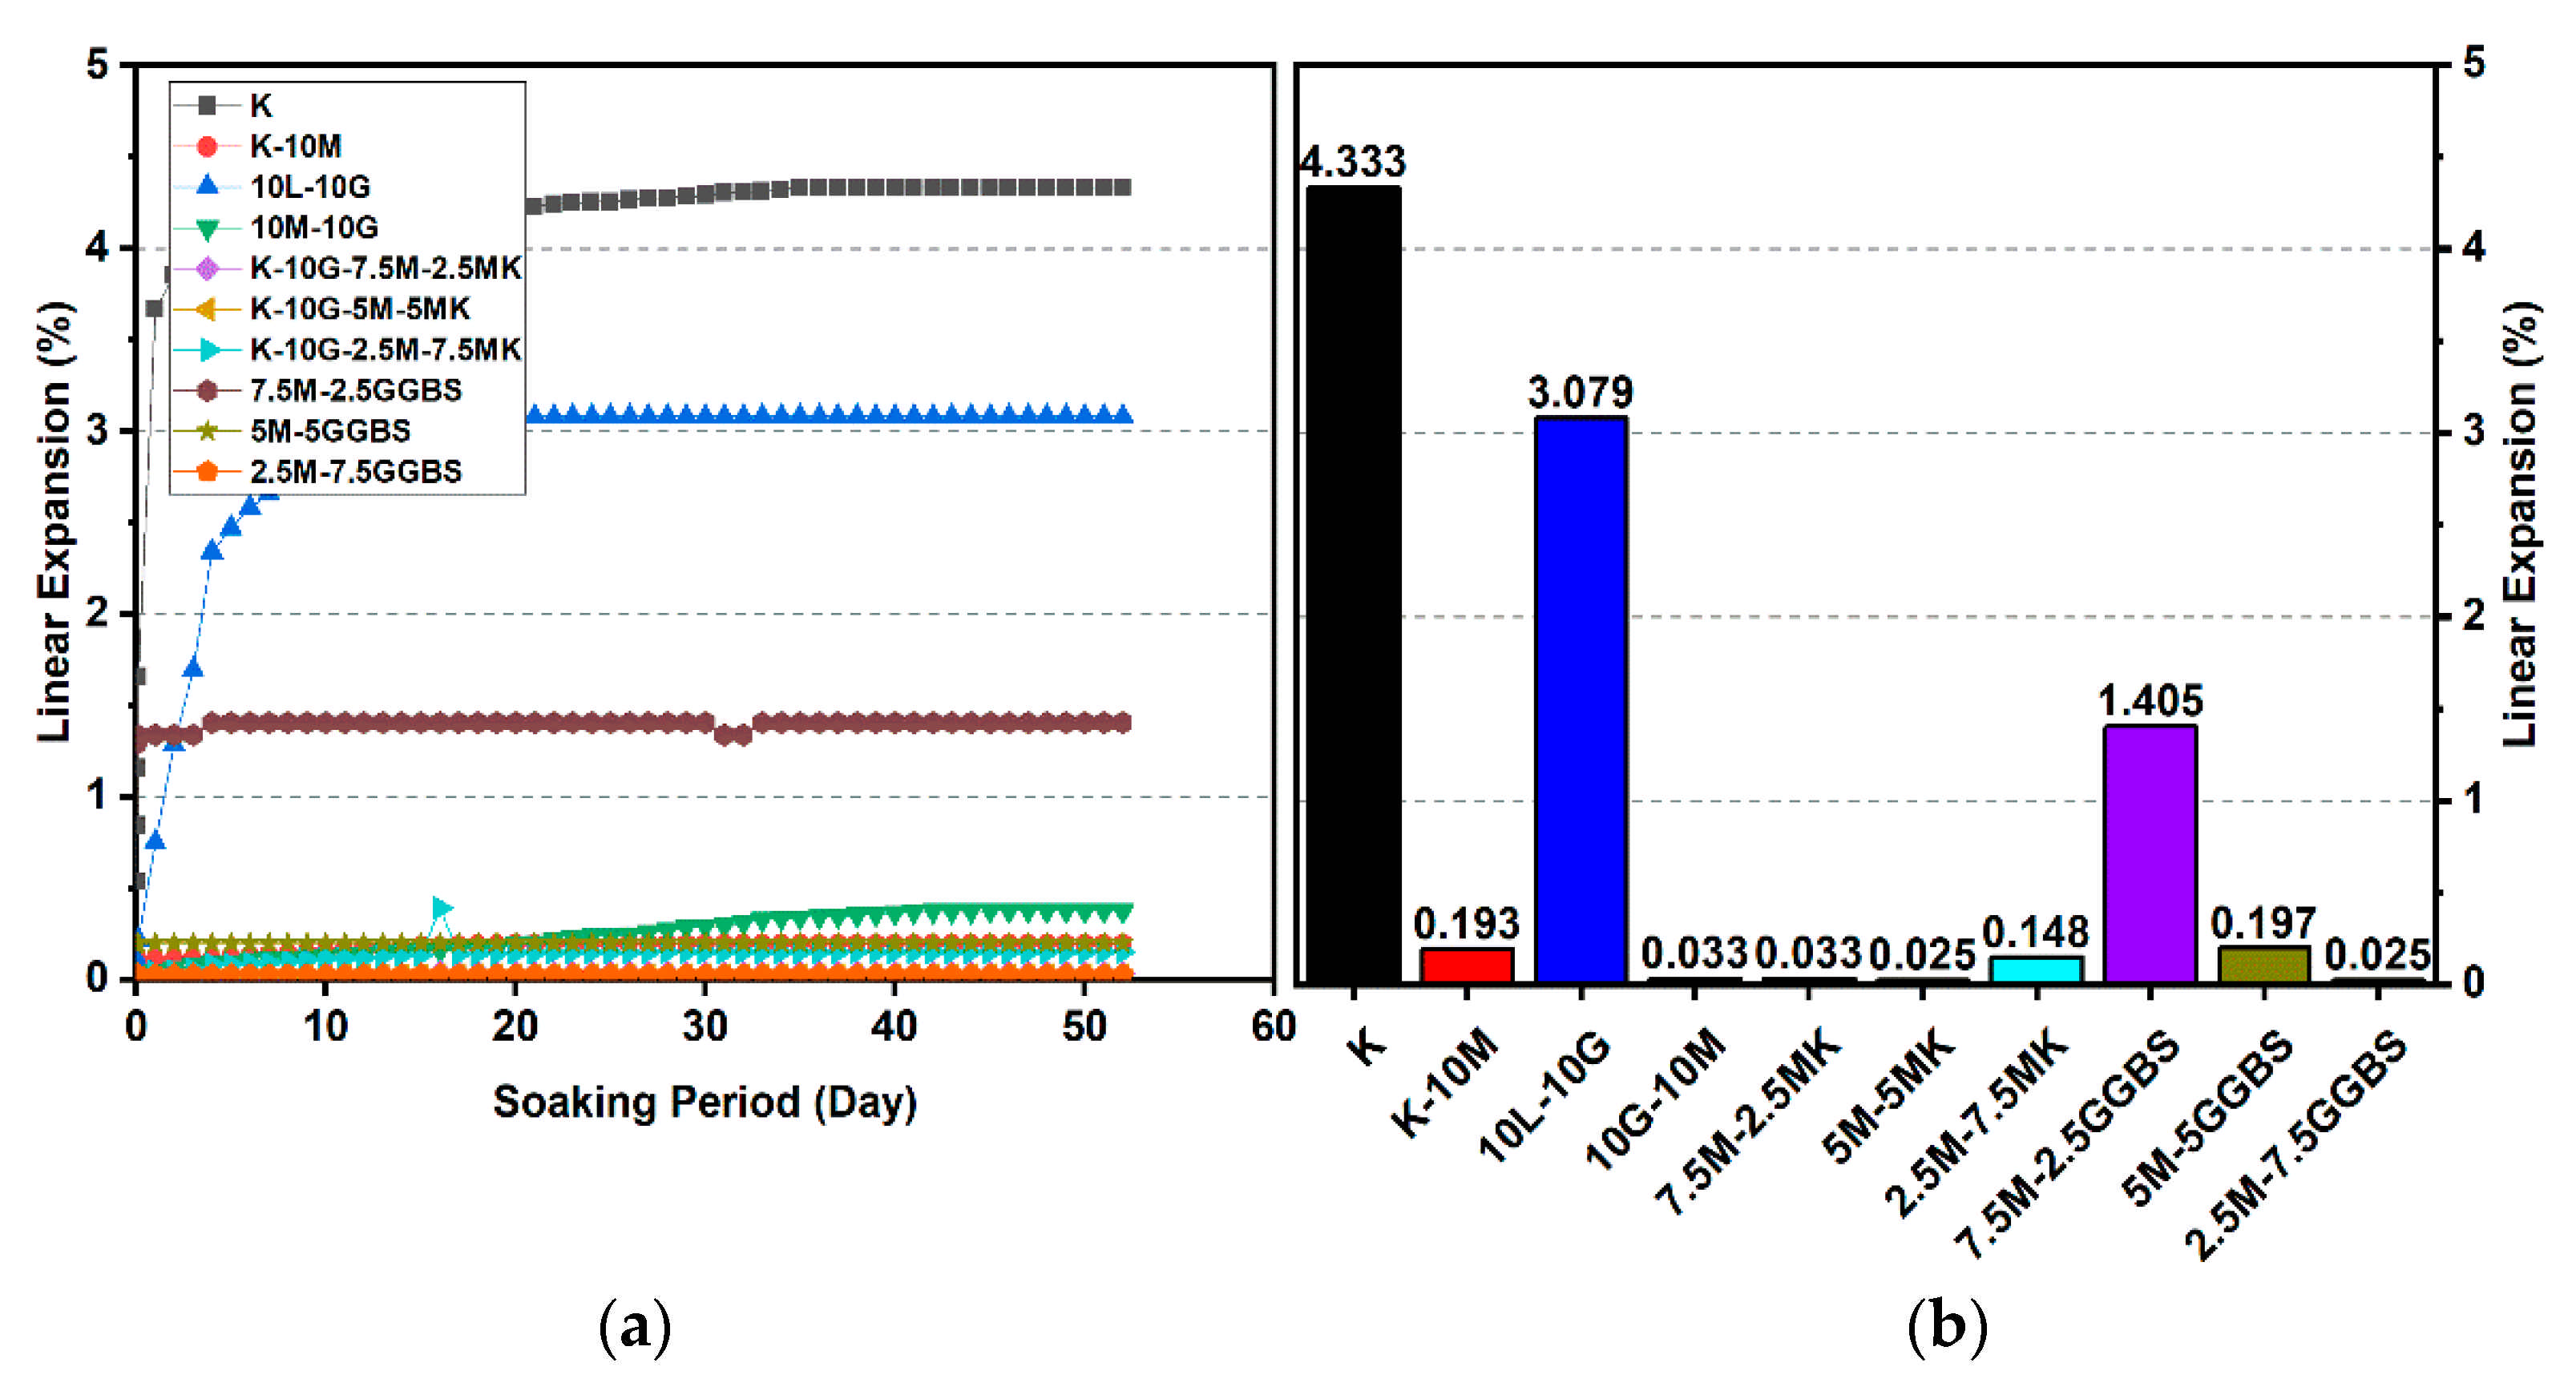
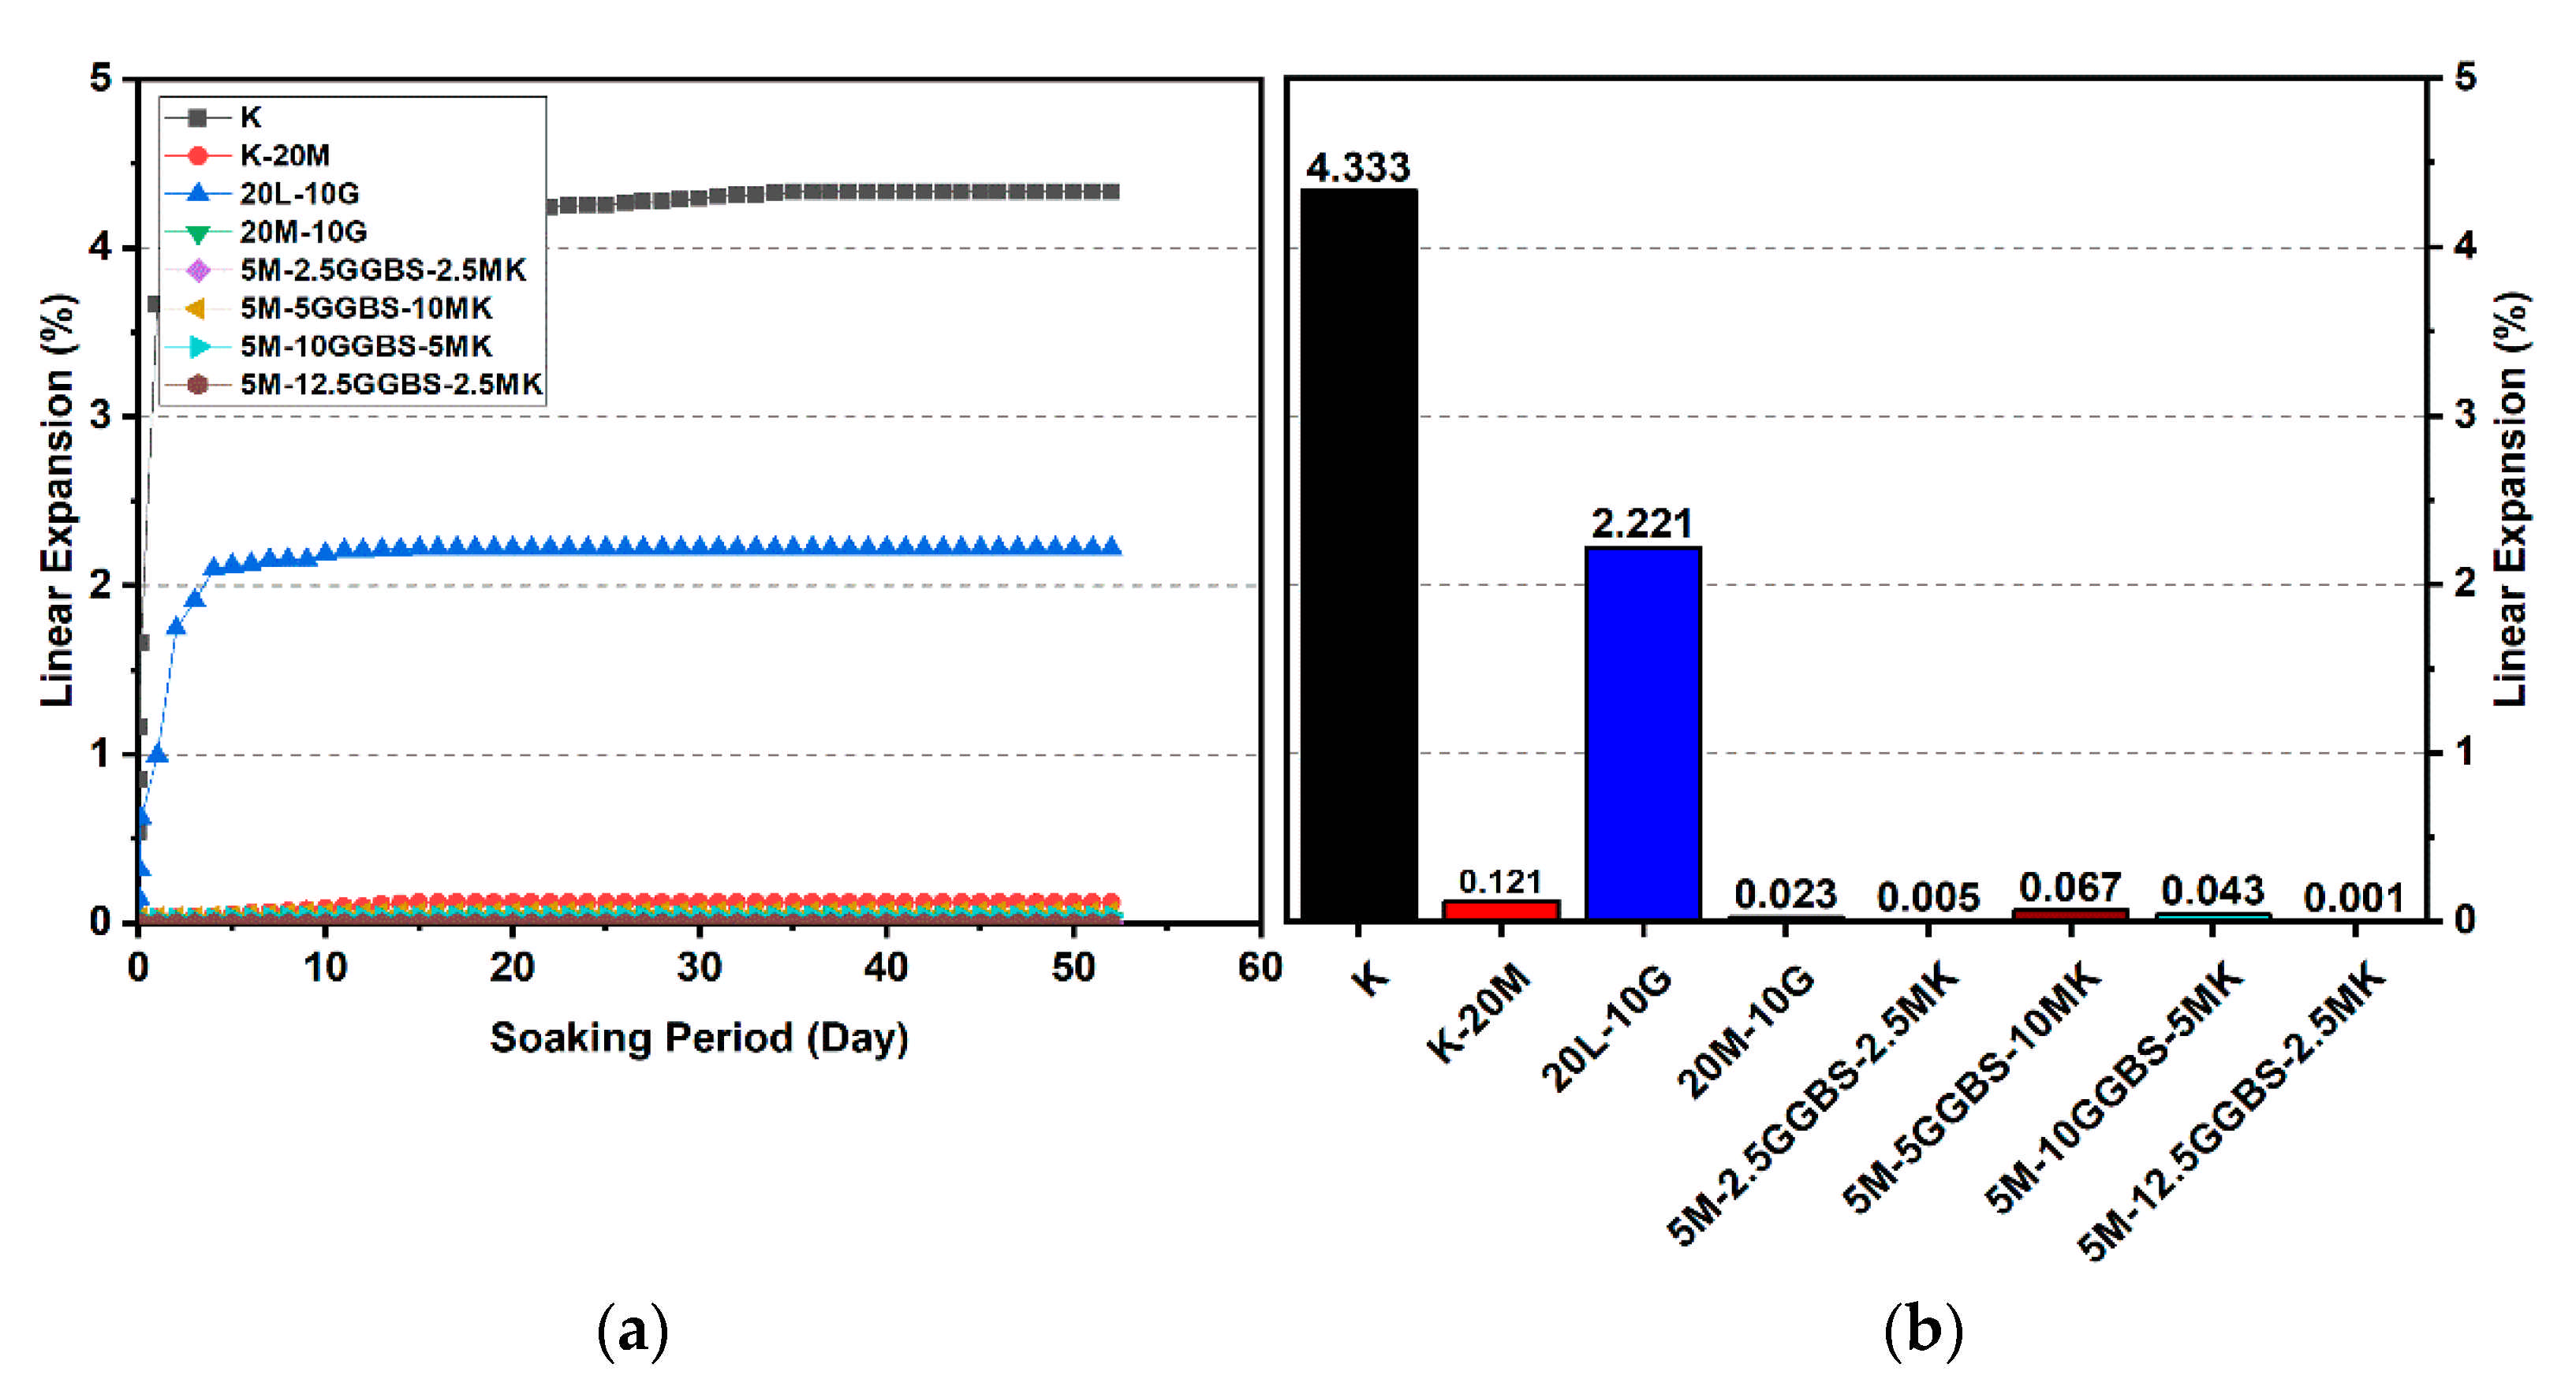
Figure 17.
Vertical swelling strain of soils stabilized with 10% and 20% of L, M, and M-GGBS-MK after 28 days of curing: (a) results presented as a line curve, (b) results presented as columns.
Figure 17.
Vertical swelling strain of soils stabilized with 10% and 20% of L, M, and M-GGBS-MK after 28 days of curing: (a) results presented as a line curve, (b) results presented as columns.
Figure 18.
Vertical swelling strain of soils stabilized with 10% and 20% of L, M, and M-GGBS-MK after 90 days of curing: (a) results presented as a line curve, (b) results presented as columns.
Figure 18.
Vertical swelling strain of soils stabilized with 10% and 20% of L, M, and M-GGBS-MK after 90 days of curing: (a) results presented as a line curve, (b) results presented as columns.
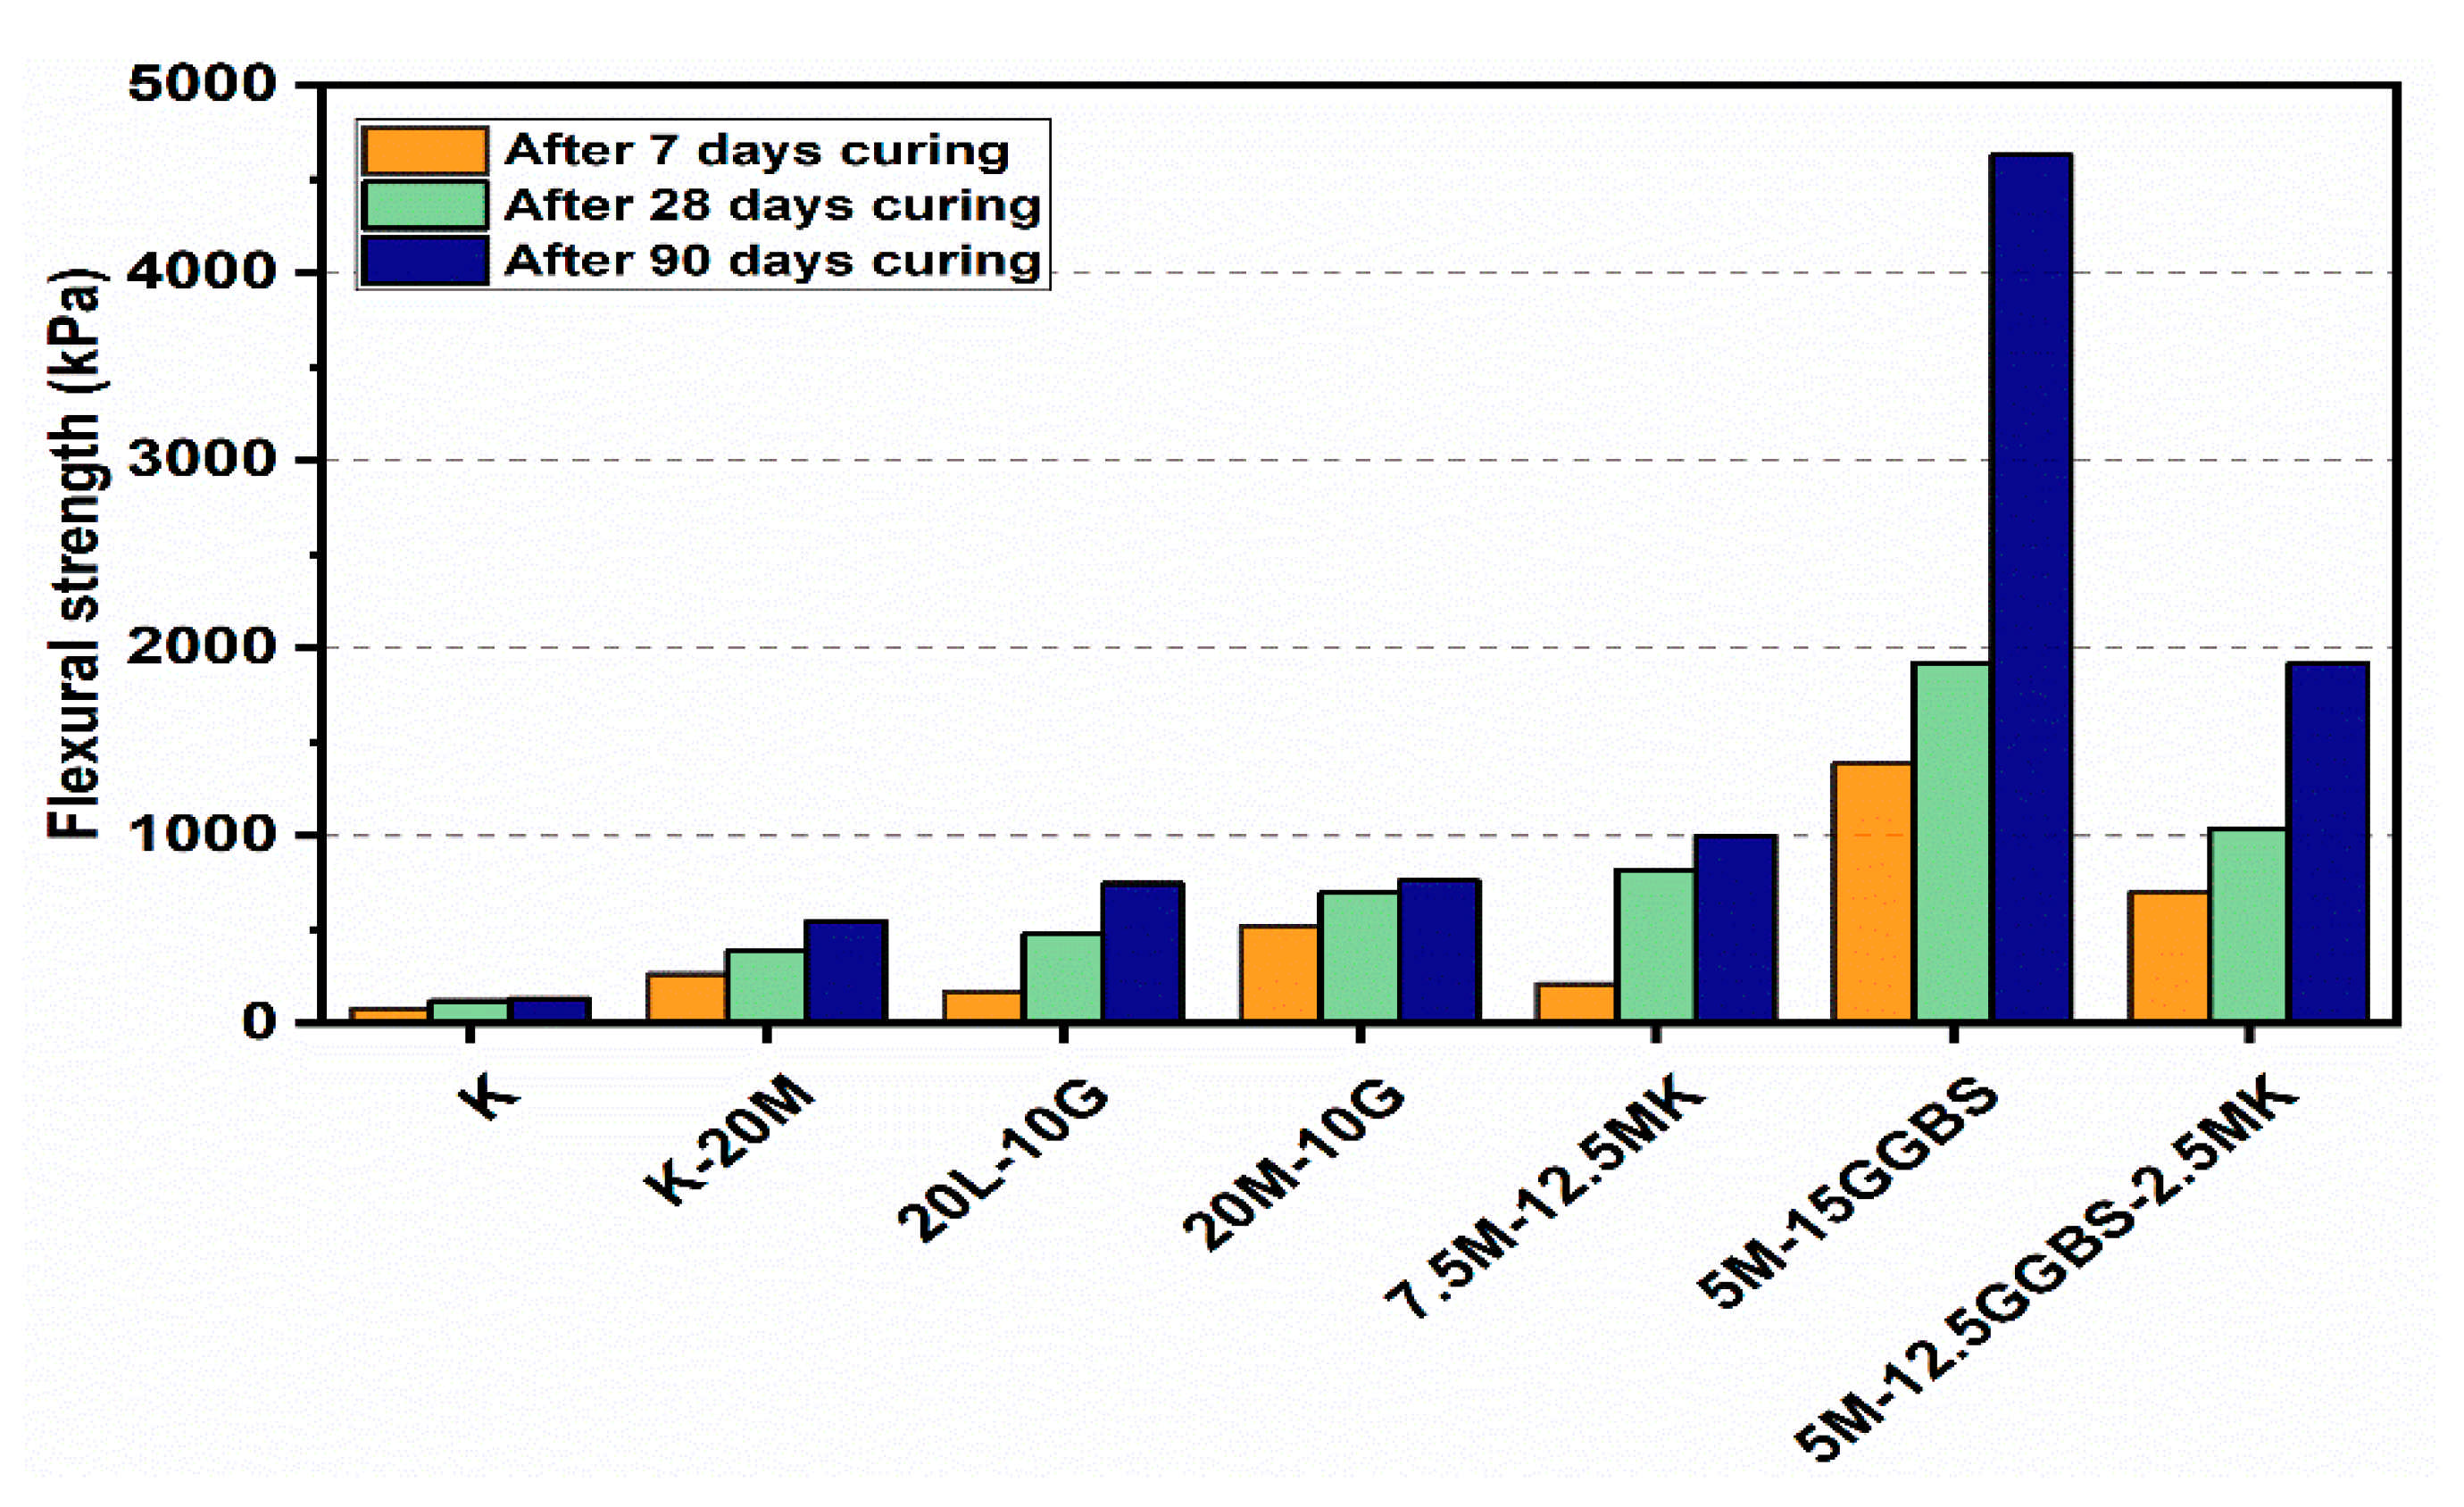
Figure 19.
Flexural load curves of test gypseous soils treated with 10% mixture content after 7, 28 and 90 days of curing.
Figure 19.
Flexural load curves of test gypseous soils treated with 10% mixture content after 7, 28 and 90 days of curing.
Figure 20.
Flexural load curves of test gypseous soils treated with 20% mixture content after 7, 28 and 90 days of curing.
Figure 20.
Flexural load curves of test gypseous soils treated with 20% mixture content after 7, 28 and 90 days of curing.
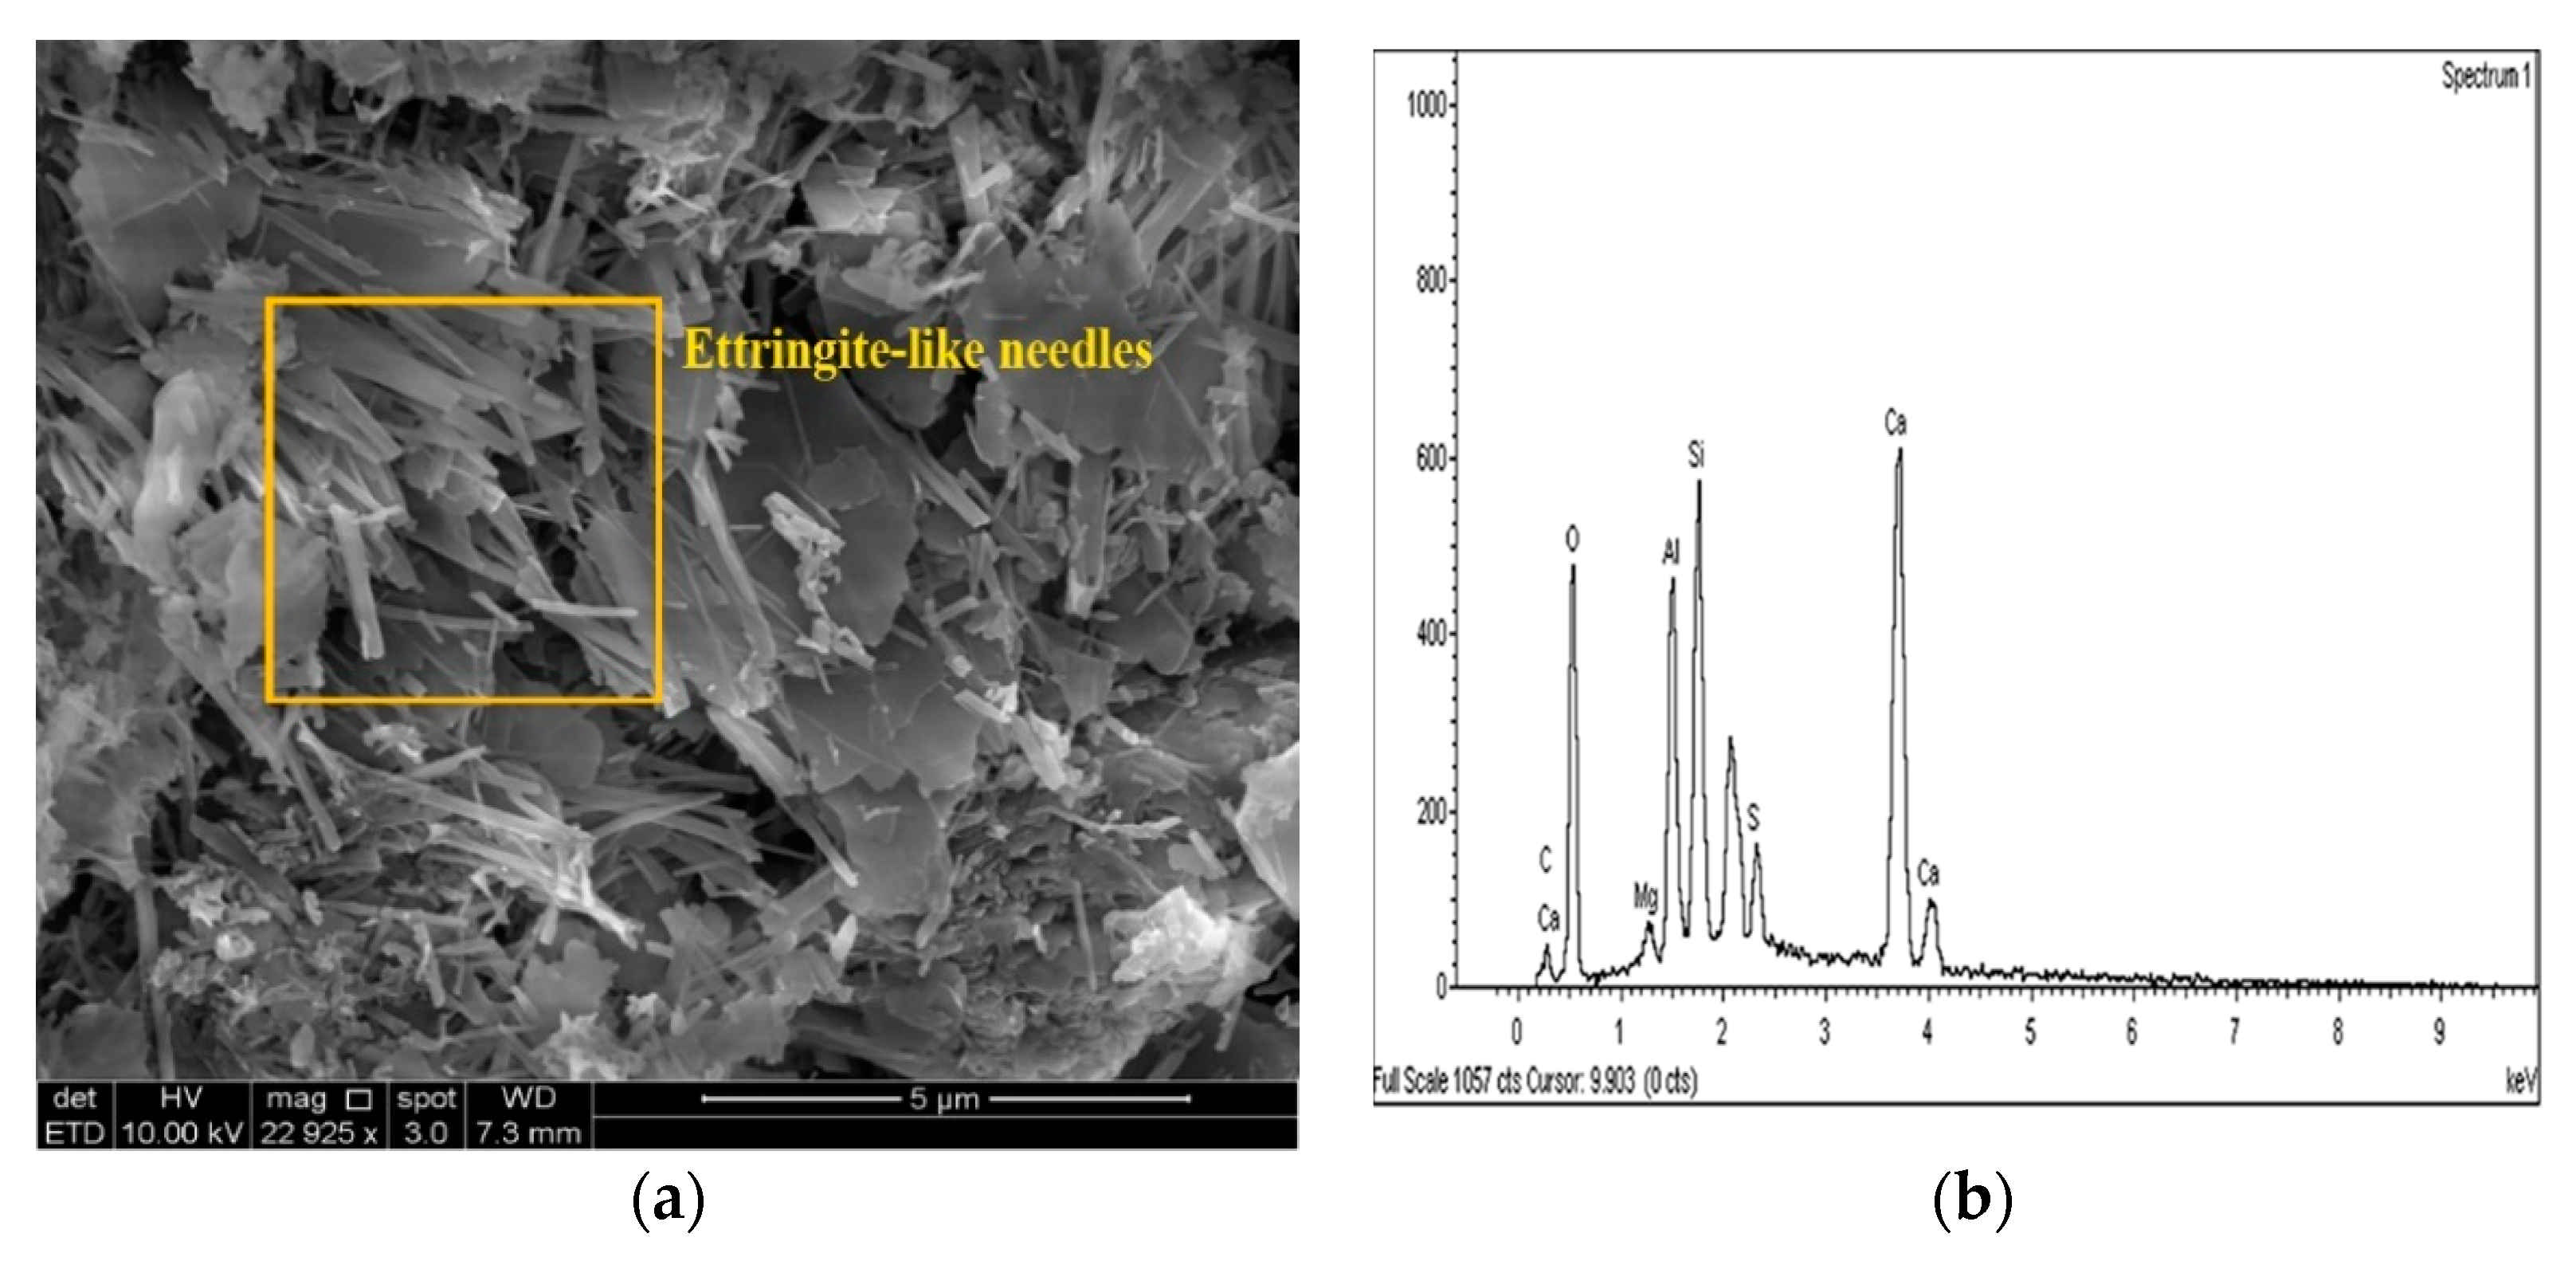
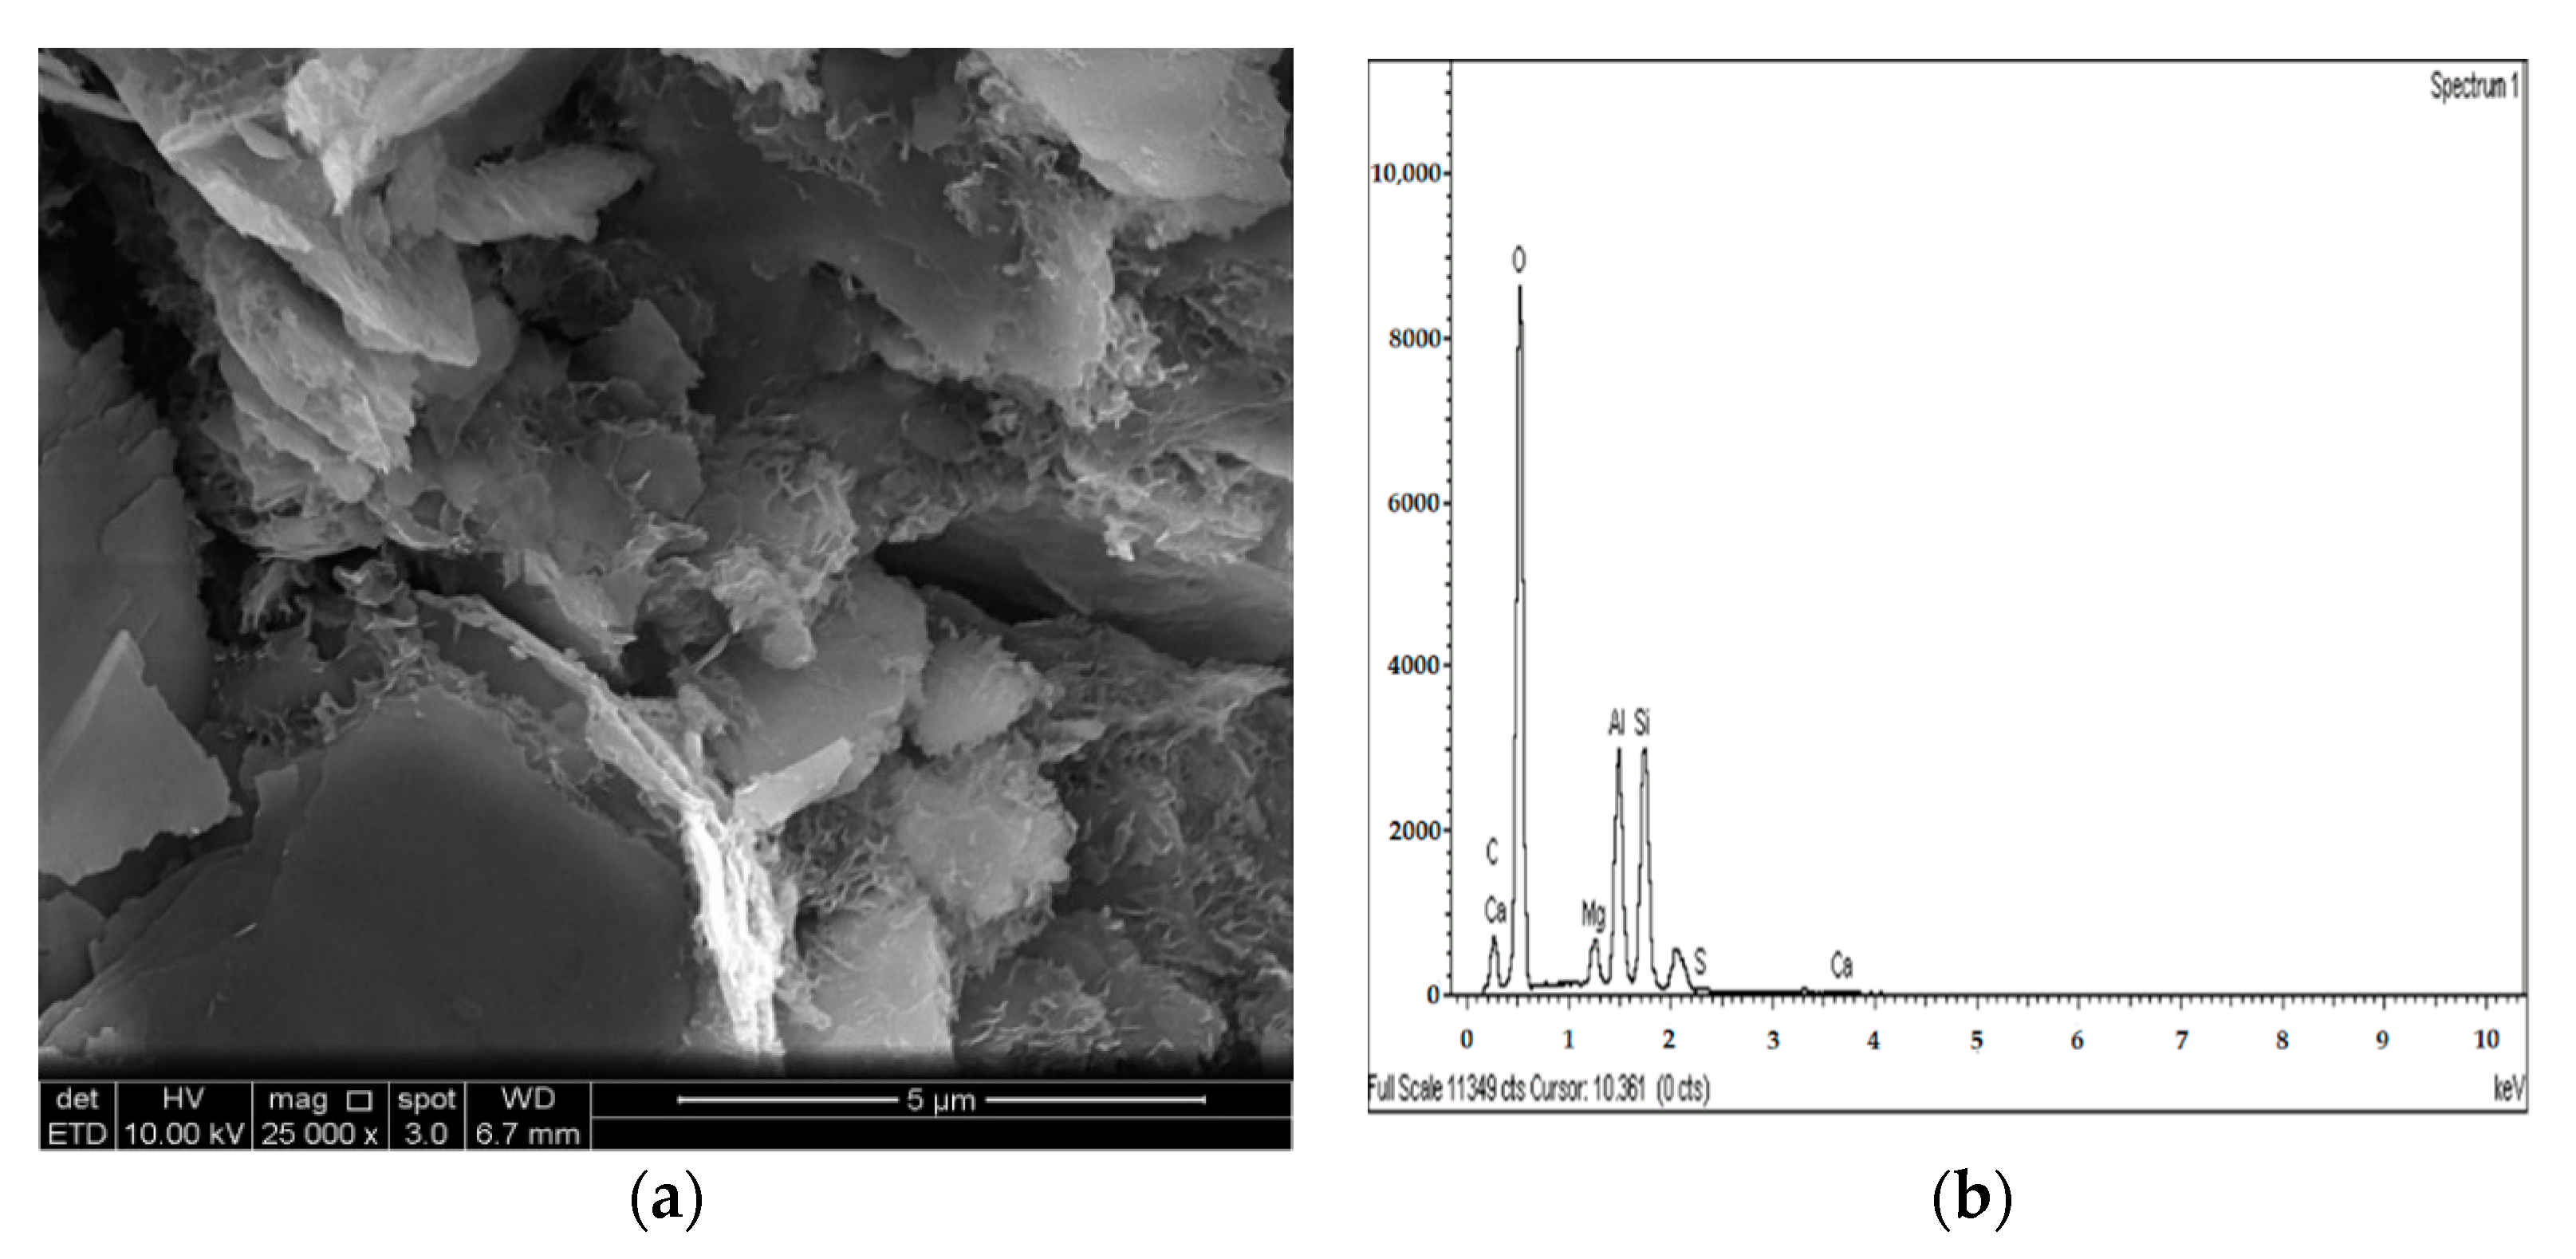
Figure 21.
SEM photo and EDX spectrograph of stabilized gypseous soils after 90 days of curing: (a) SEM photo of 10L:10G and (b) EDX spectrograph of 10L:10G.
Figure 21.
SEM photo and EDX spectrograph of stabilized gypseous soils after 90 days of curing: (a) SEM photo of 10L:10G and (b) EDX spectrograph of 10L:10G.
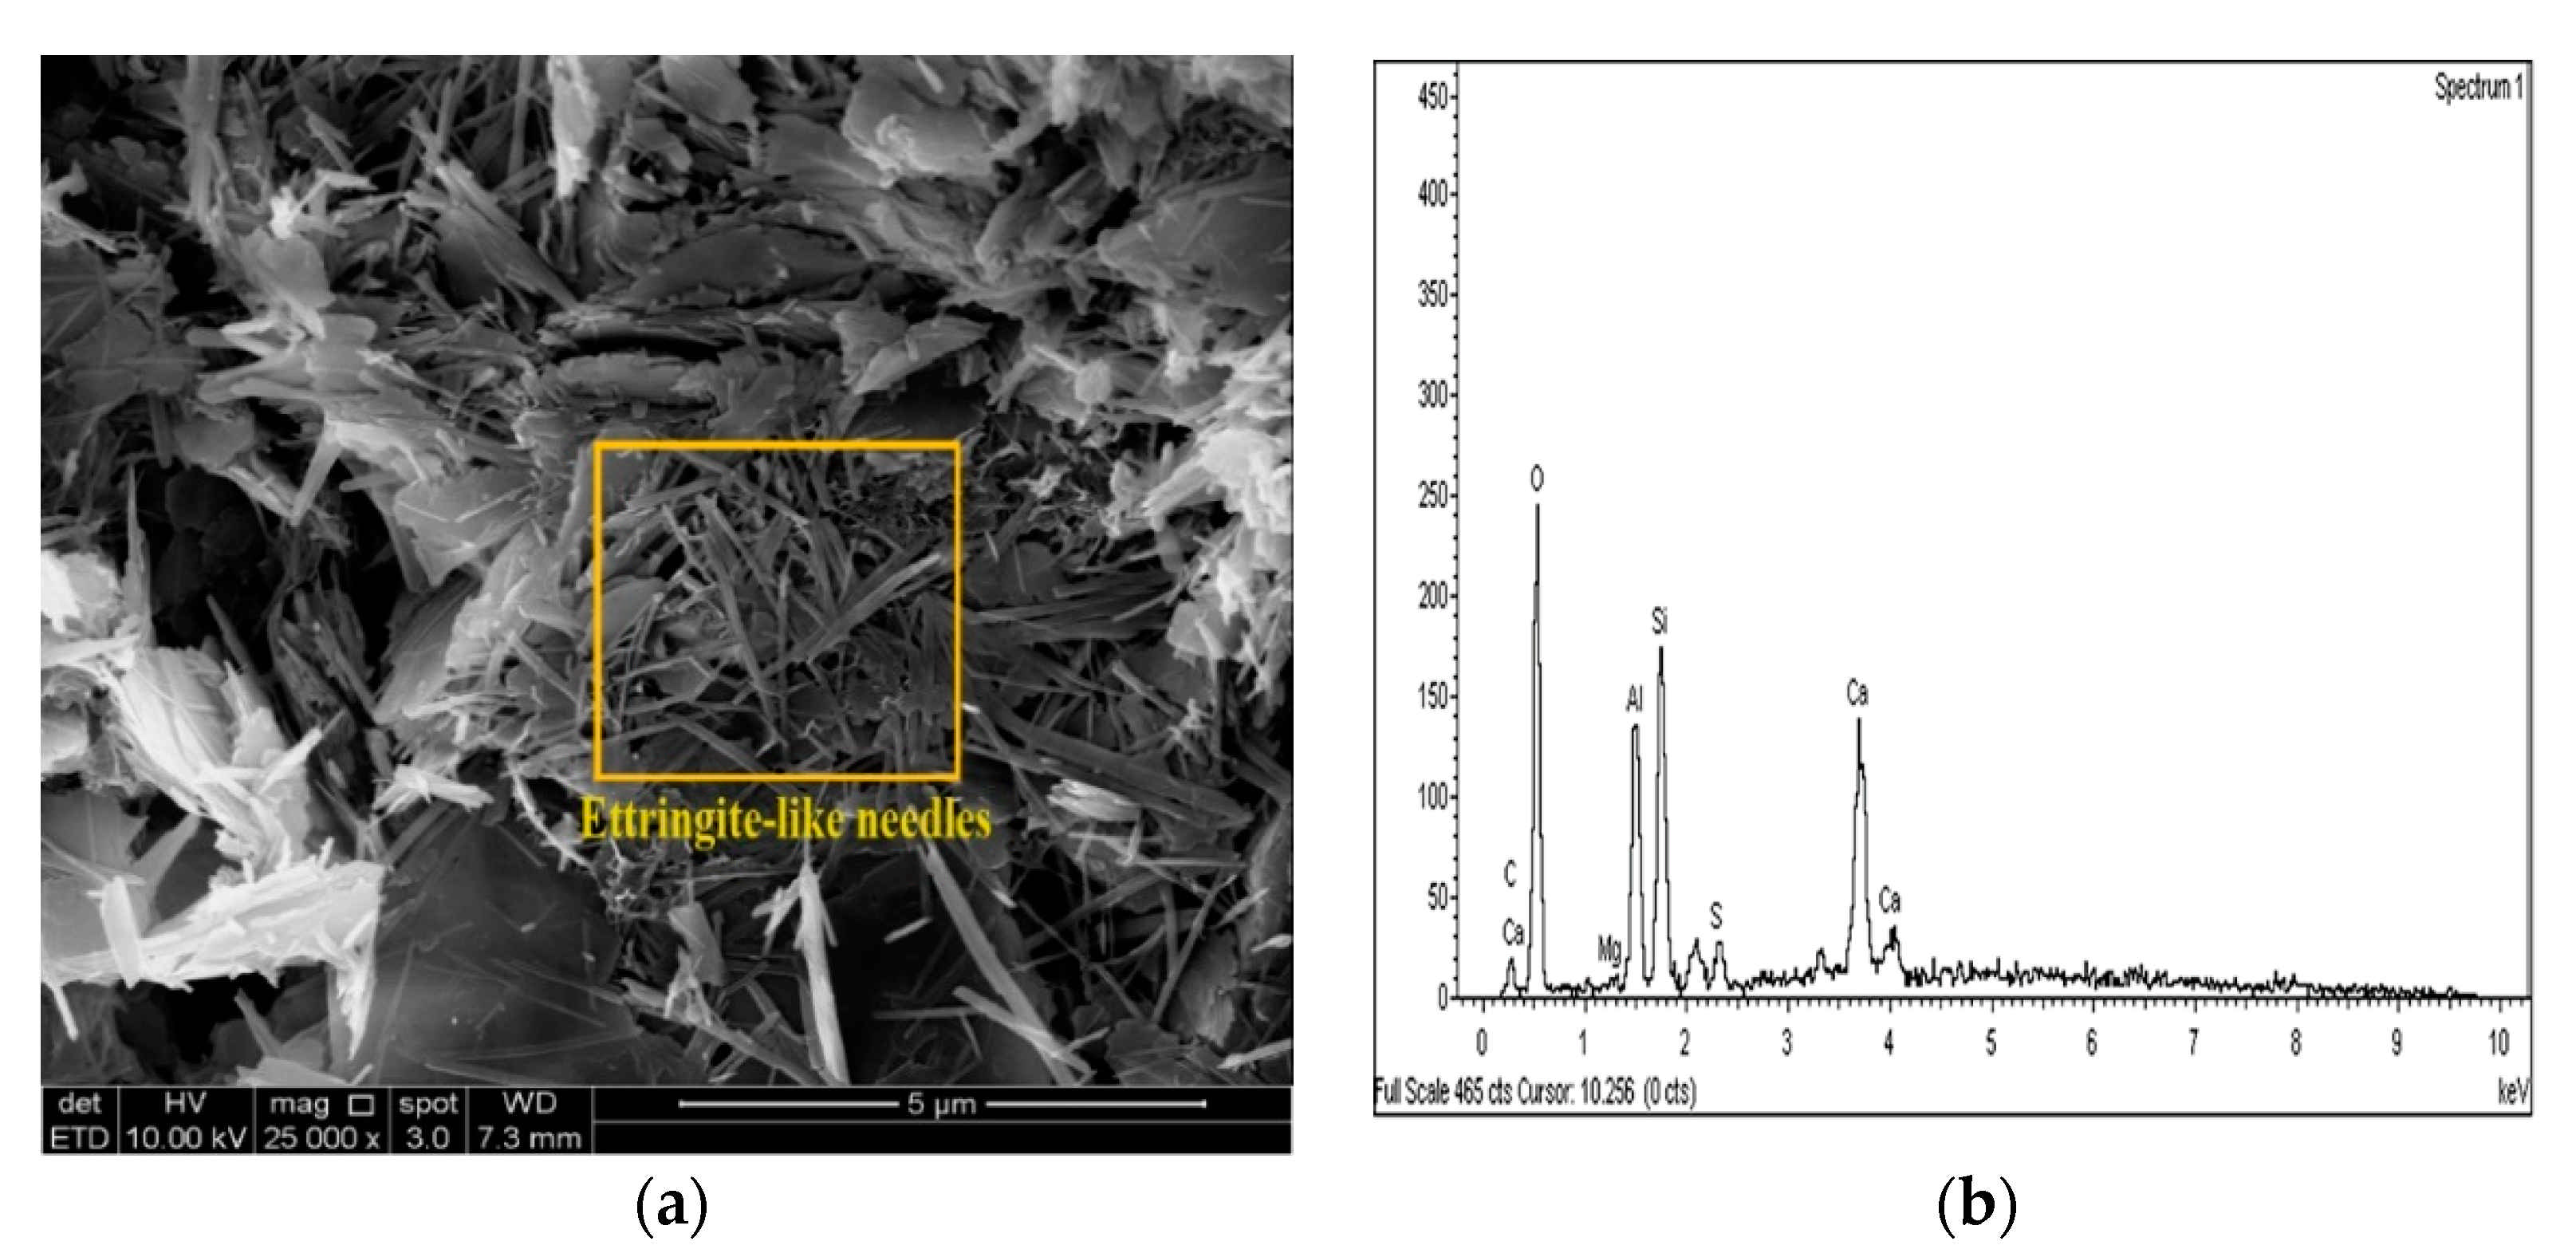
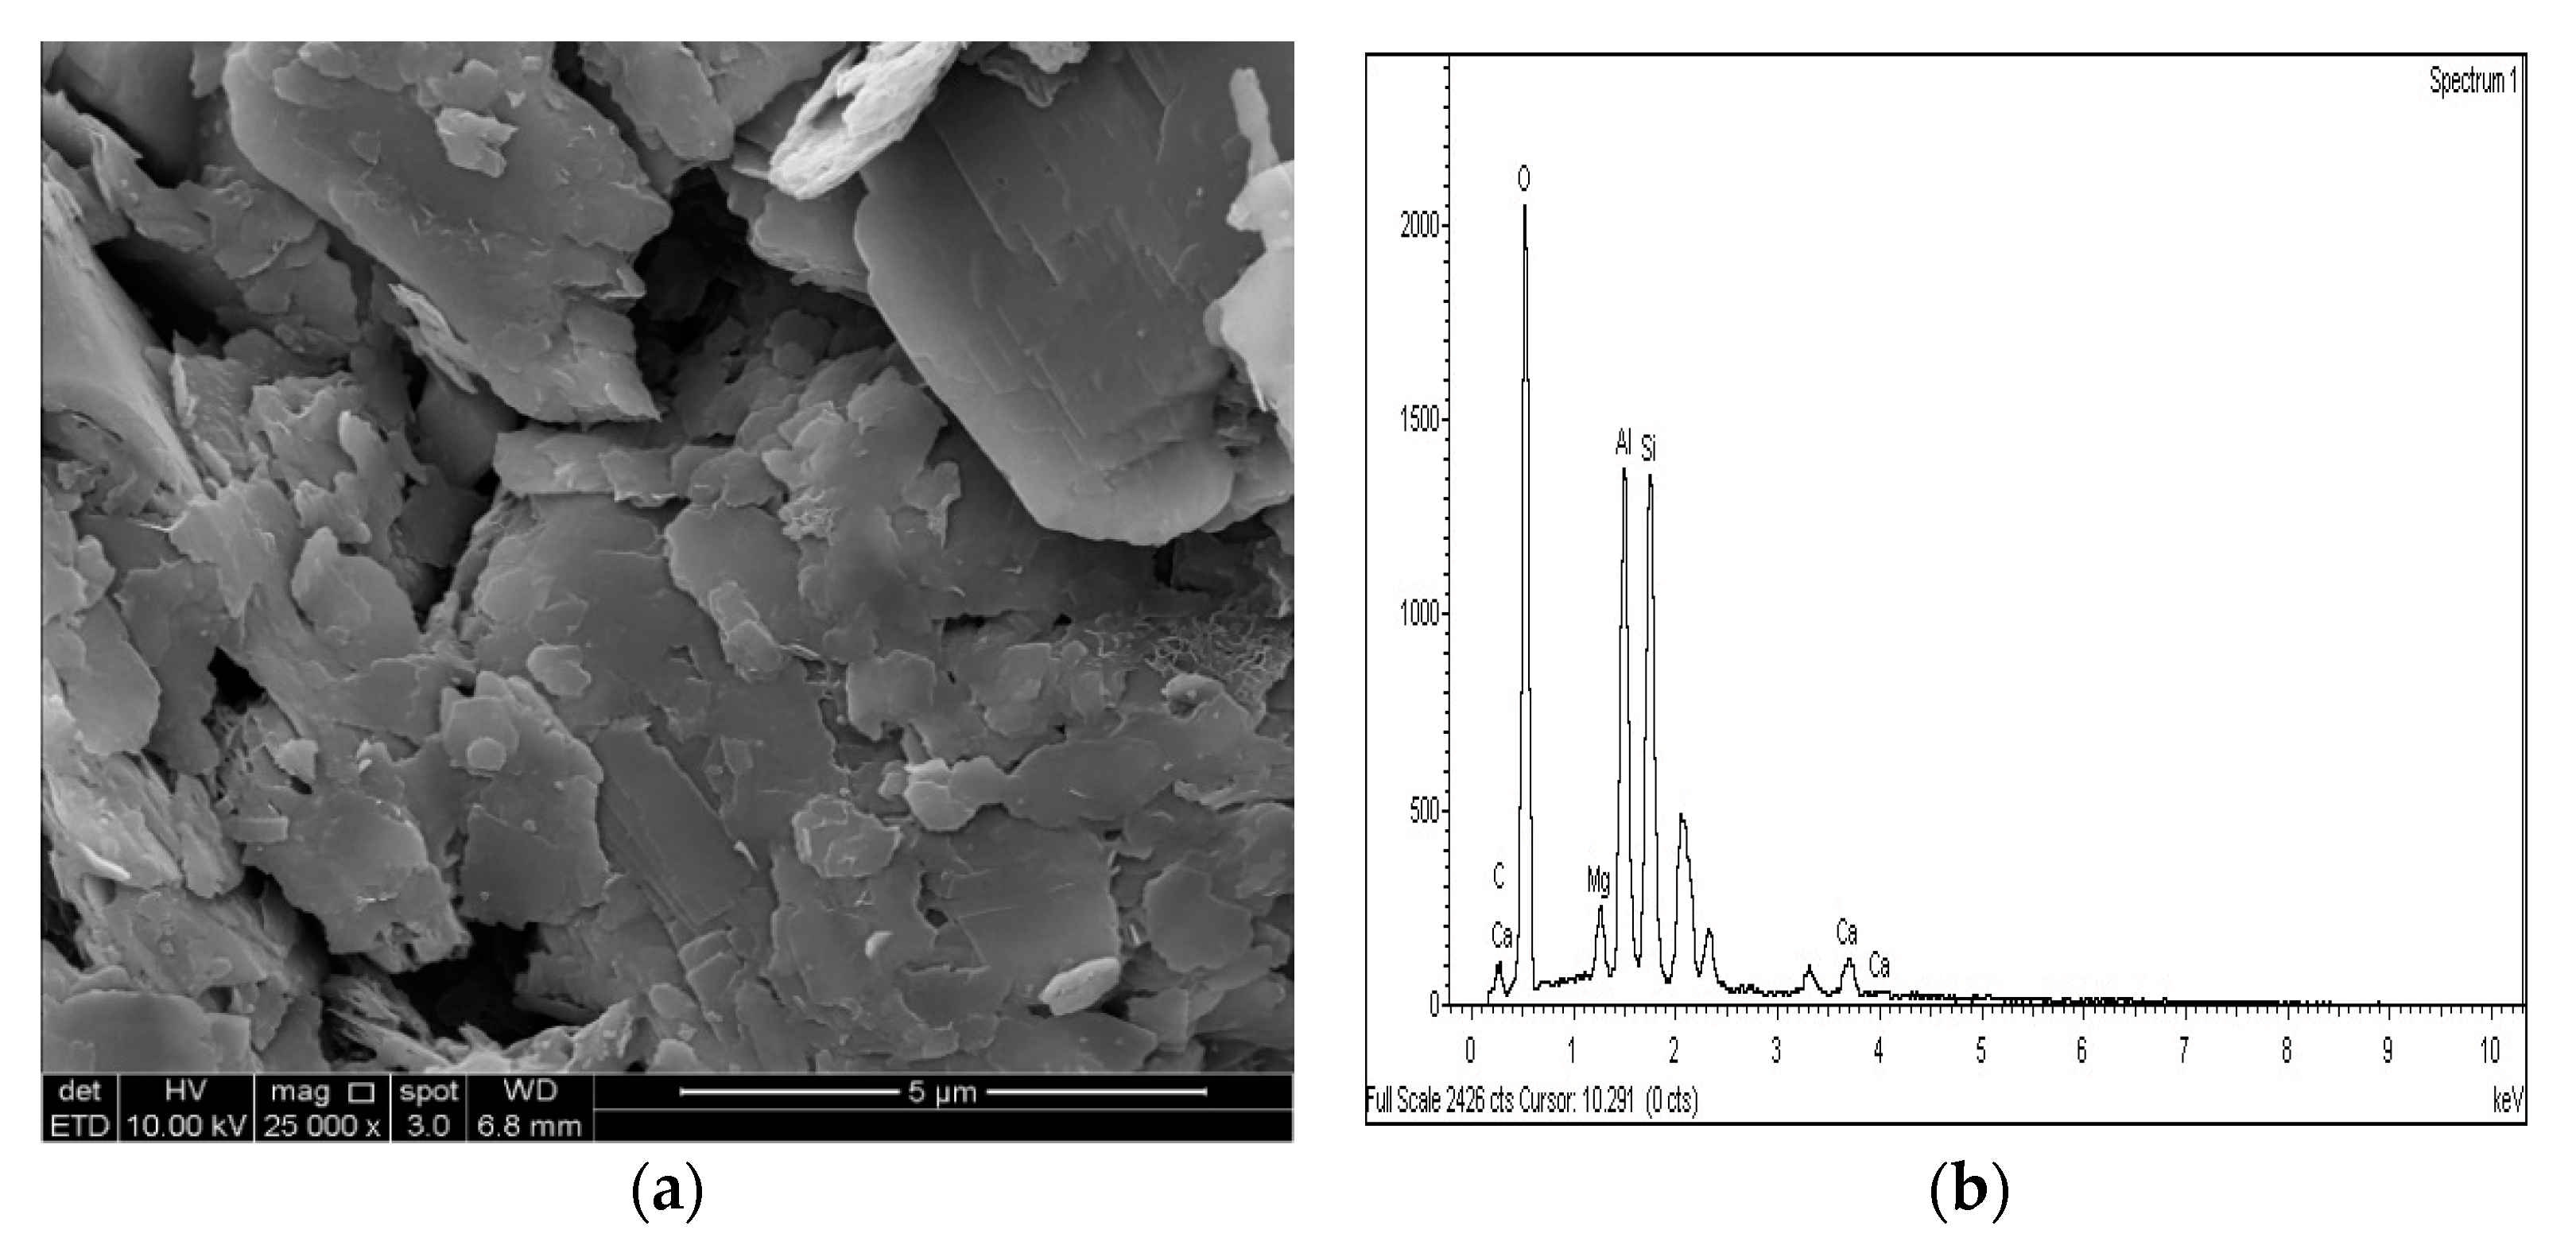
Figure 22.
SEM photo and EDX spectrograph of stabilized gypseous soils after 90 days of curing: (a) SEM photo of 20L:10G and (b) EDX spectrograph of 20L:10G.
Figure 22.
SEM photo and EDX spectrograph of stabilized gypseous soils after 90 days of curing: (a) SEM photo of 20L:10G and (b) EDX spectrograph of 20L:10G.
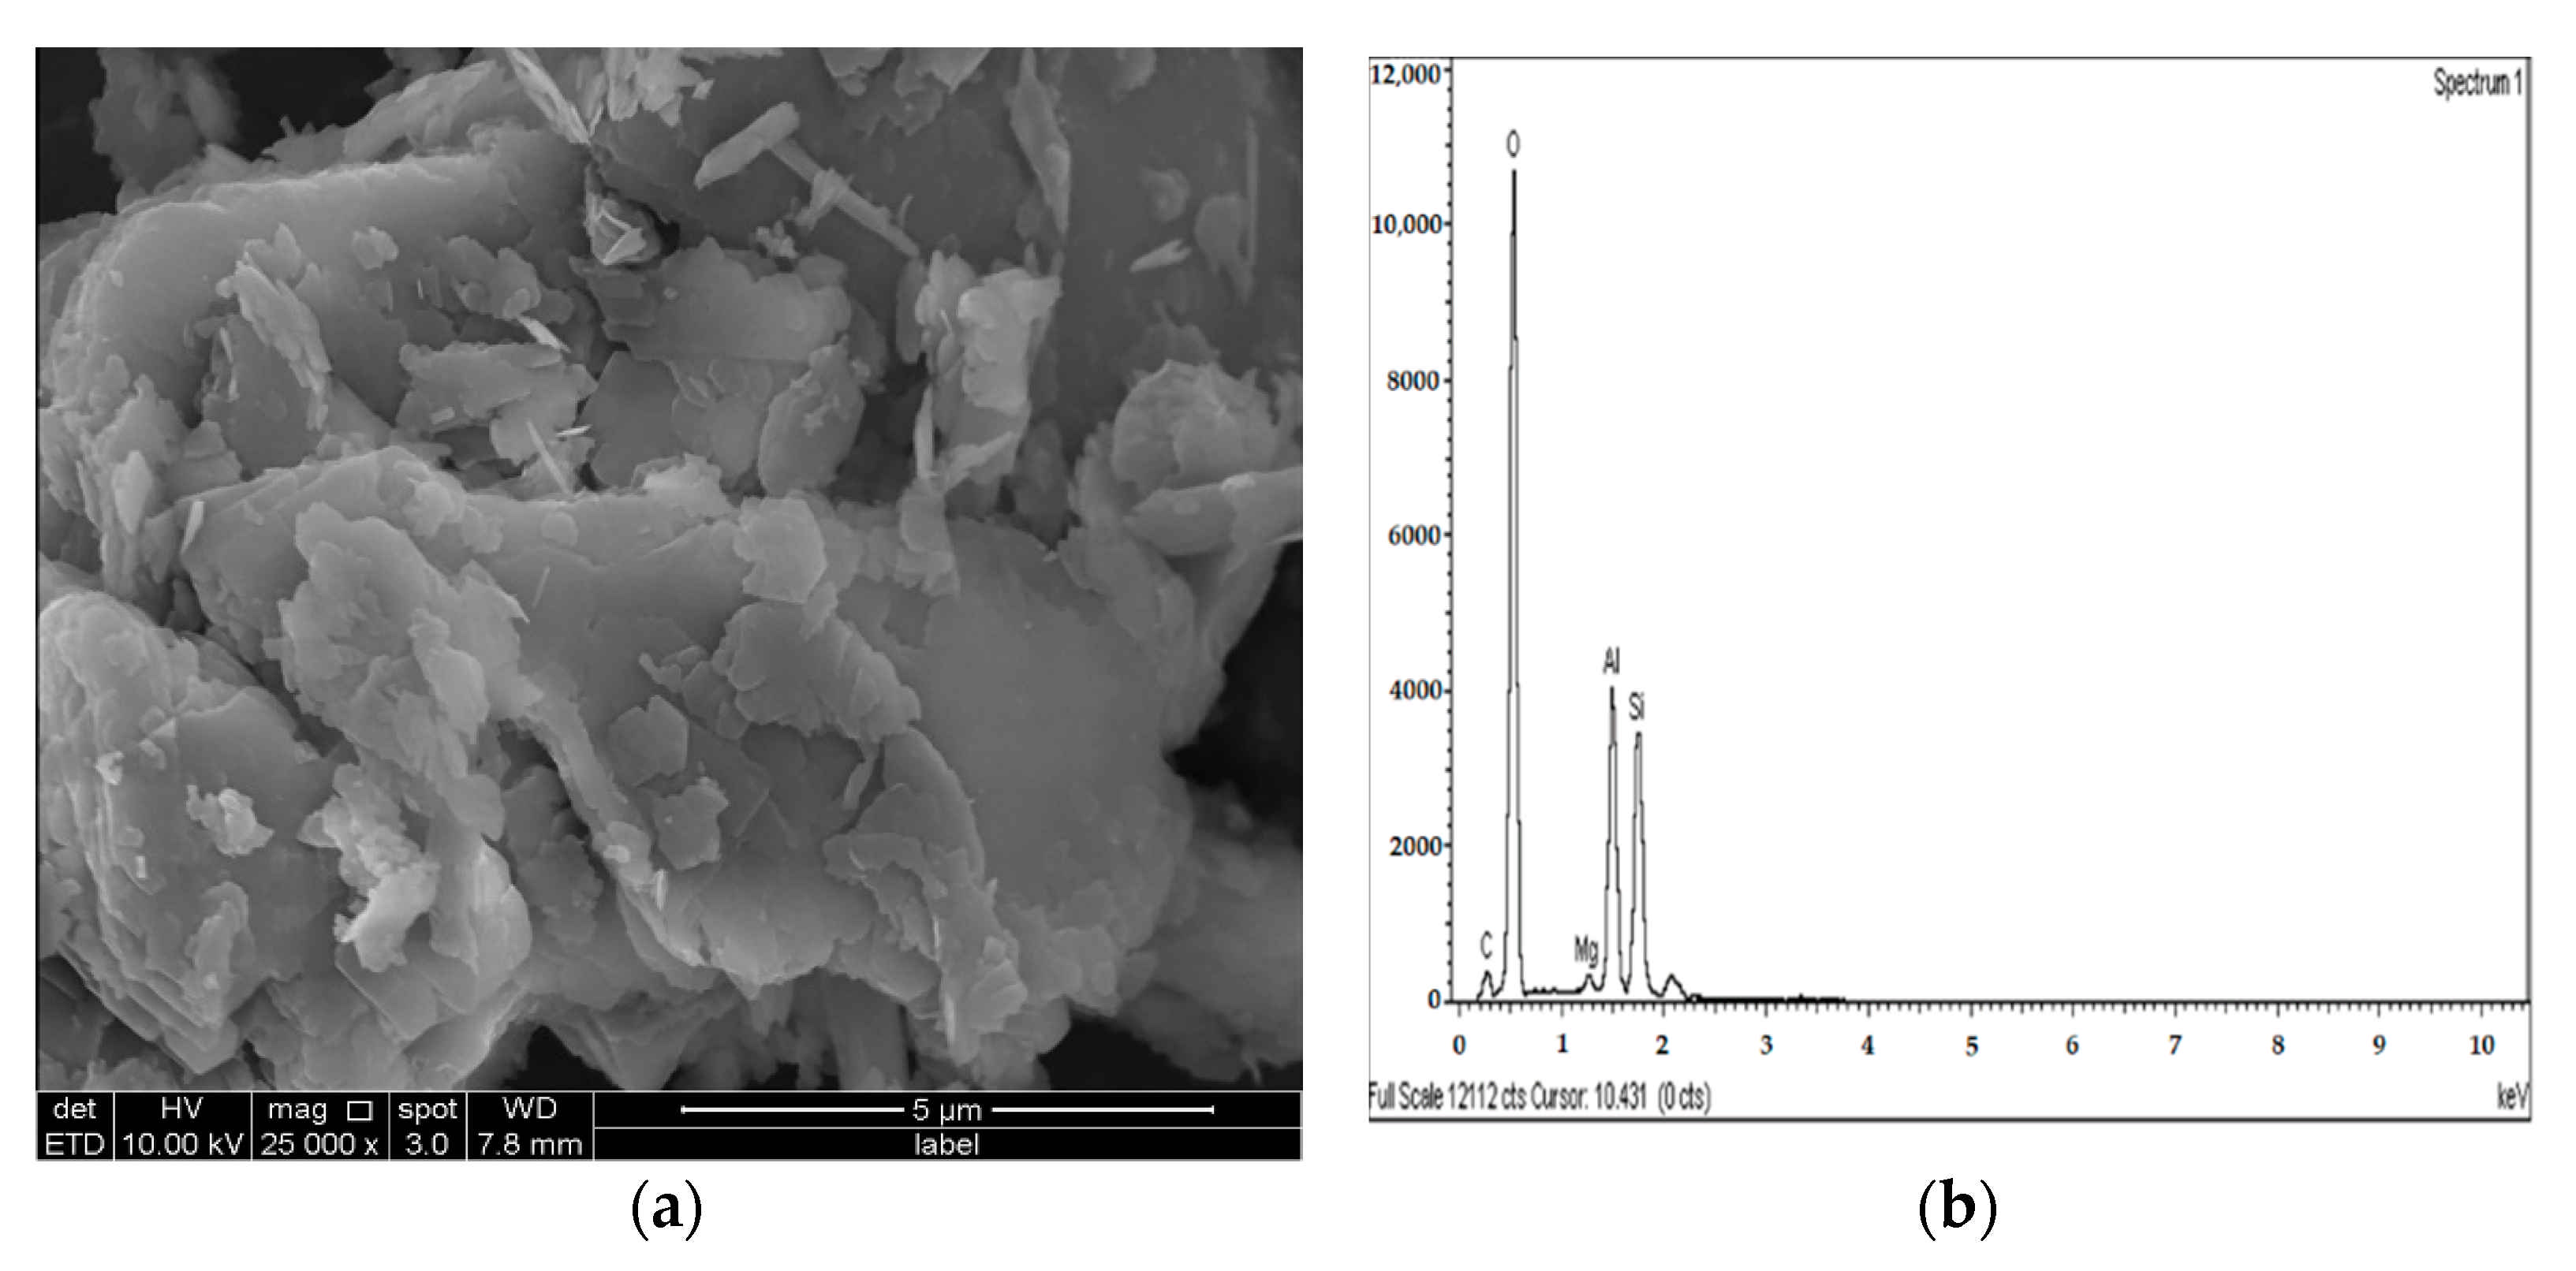
Figure 23.
SEM photo and EDX spectrograph of stabilized gypseous soils after 90 days of curing: (a) SEM photo of 10M:10G and (b) EDX spectrograph of 10M:10G.
Figure 23.
SEM photo and EDX spectrograph of stabilized gypseous soils after 90 days of curing: (a) SEM photo of 10M:10G and (b) EDX spectrograph of 10M:10G.
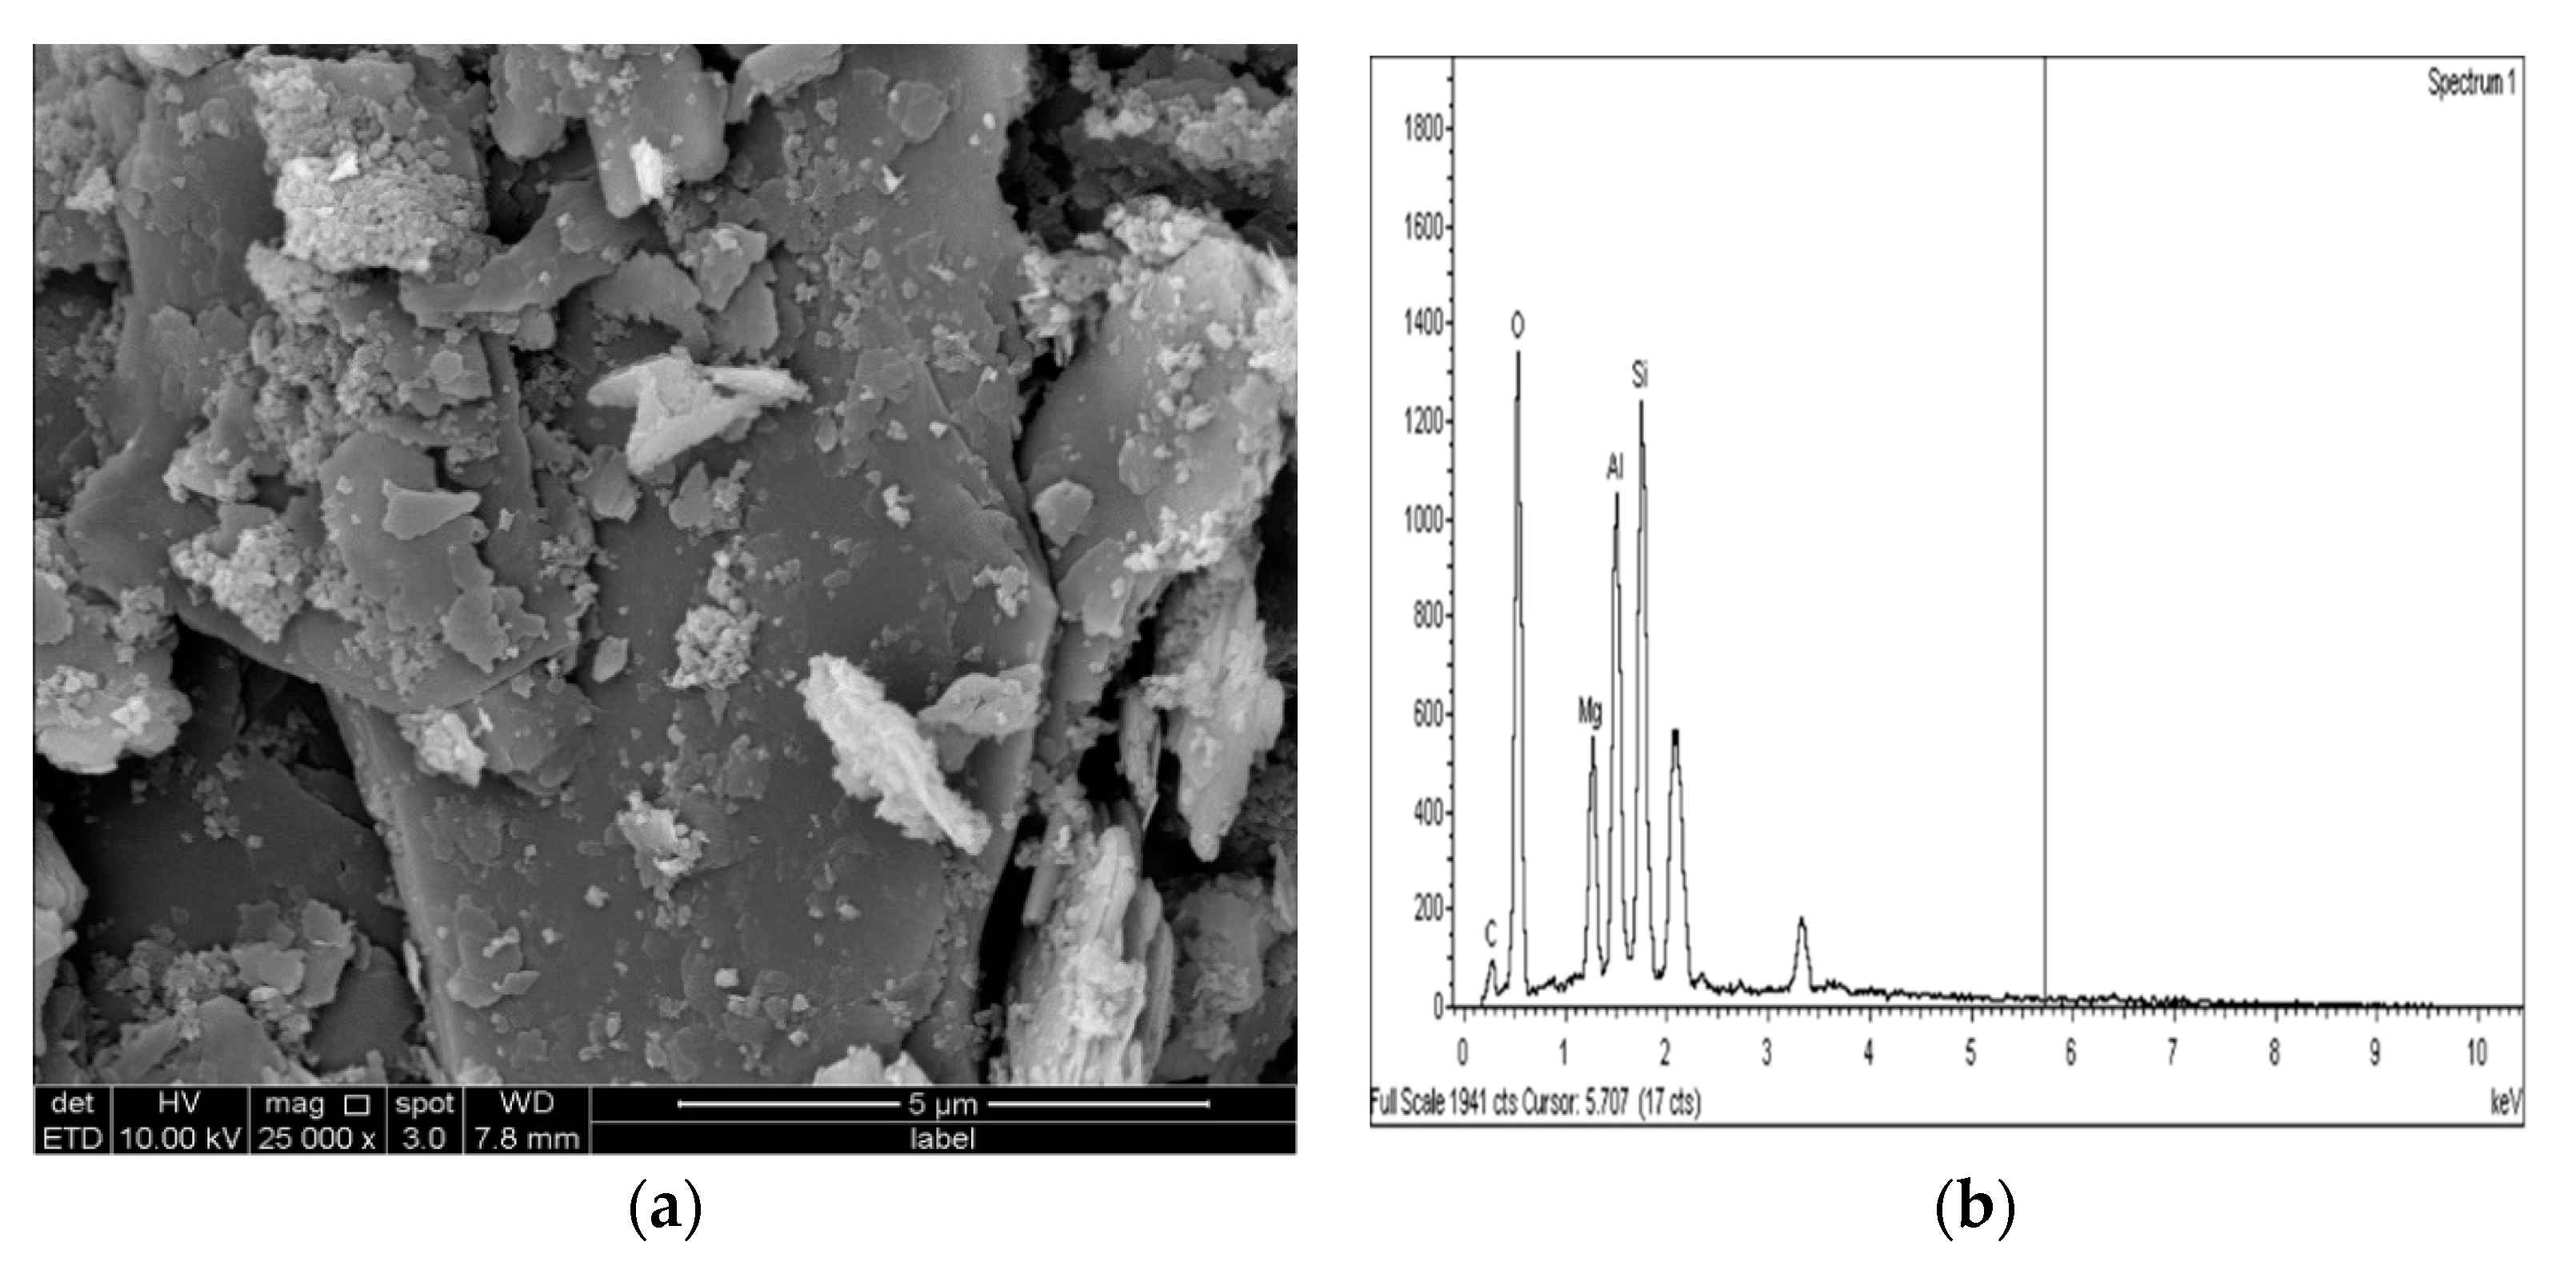
Figure 24.
SEM photo and EDX spectrograph of stabilized gypseous soils after 90 days of curing: (a) SEM photo of 20M:10G and (b) EDX spectrograph of 20M:10G.
Figure 24.
SEM photo and EDX spectrograph of stabilized gypseous soils after 90 days of curing: (a) SEM photo of 20M:10G and (b) EDX spectrograph of 20M:10G.
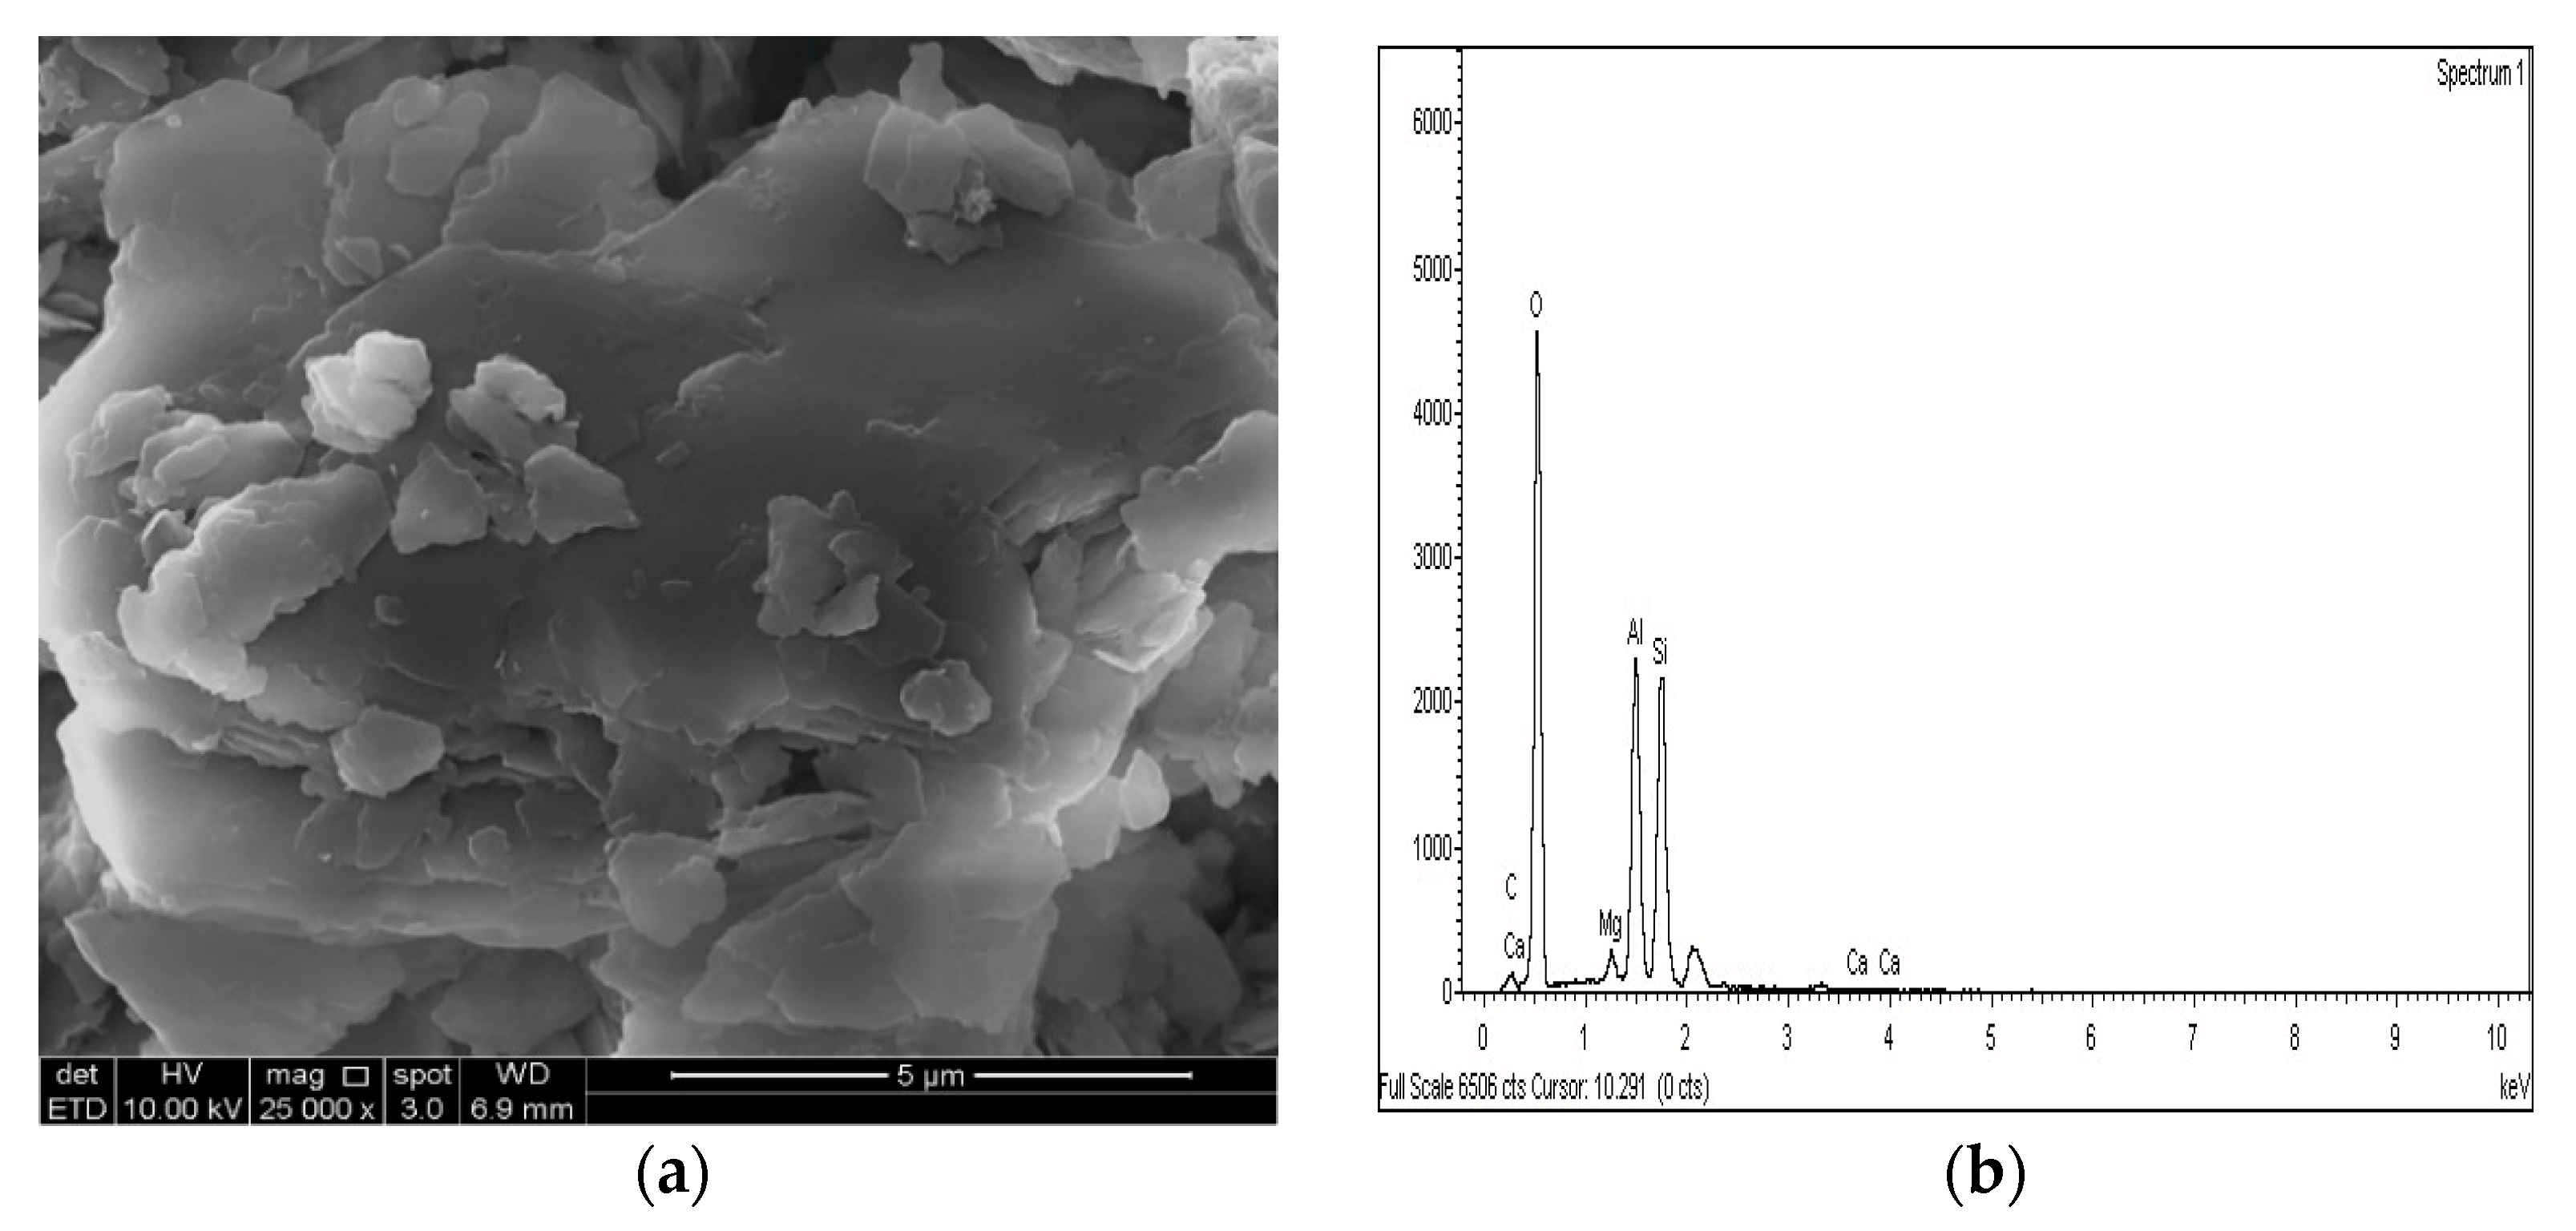
Figure 25.
SEM photo and EDX spectrograph of stabilized gypseous soils after 90 days of curing: (a) SEM photo of 7.5M:12.5MK and (b) EDX spectrograph of 7.5M:12.5MK.
Figure 25.
SEM photo and EDX spectrograph of stabilized gypseous soils after 90 days of curing: (a) SEM photo of 7.5M:12.5MK and (b) EDX spectrograph of 7.5M:12.5MK.
Figure 26.
SEM photo and EDX spectrograph of stabilized gypseous soils after 90 days of curing: (a) SEM photo of 5M:15GGBS and (b) EDX spectrograph of 5M:15GGBS.
Figure 26.
SEM photo and EDX spectrograph of stabilized gypseous soils after 90 days of curing: (a) SEM photo of 5M:15GGBS and (b) EDX spectrograph of 5M:15GGBS.
Figure 27.
SEM photo and EDX spectrograph of stabilized gypseous soils after 90 days of curing: (a) SEM photo of 5M:12.5GGBS:2.5MK and (b) EDX spectrograph of 5M-12.5GGBS:2.5MK.
Figure 27.
SEM photo and EDX spectrograph of stabilized gypseous soils after 90 days of curing: (a) SEM photo of 5M:12.5GGBS:2.5MK and (b) EDX spectrograph of 5M-12.5GGBS:2.5MK.
Table 1.
Characteristics of the kaolin clay used in this study.
Table 1.
Characteristics of the kaolin clay used in this study.
| Properties | Value |
|---|
| Liquid limit (%) | 57.78 |
| Plastic limit (%) | 38.13 |
| Shrinking limit (%) | 4.4 |
| Plasticity index | 19.65 |
| Sand (%) | - |
| Silt (%) | 88.35 |
| Clay (%) | 11.65 |
| Electric conductivity (µS/cm) | 320 |
| pH | 5 |
| Specific gravity (Gs) | 2.46 |
| Water content (%) | 1.01 |
| Optimum moisture content (%) | 29 |
| Maximum dry density (Mg/m3) | 1.326 |
Table 2.
Most common types of sulphates found in soil.
Table 2.
Most common types of sulphates found in soil.
| Sulphate Type | Common Name | Chemical Formula | Solubility |
|---|
| Calcium | Selenite, gypsum | CaSO4∙2H2O | 1.44 |
| Potassium | Arcanite | K2SO4 | 130 |
| Magnesium | Epsomite | MgSO4∙7H2O | 225 |
| Sodium | Themadite, mirabilite | Na2SO4∙10H2O | >225 |
Table 3.
Chemical compositions of kaolin clay, L, M, G, GGBS, and MK.
Table 3.
Chemical compositions of kaolin clay, L, M, G, GGBS, and MK.
| Oxides | Characteristic (%) |
|---|
| Kaolin Clay | L | M | G | GGBS | MK |
|---|
| CaO | - | - | - | | 37 | 0.2 |
| CaOH2 | - | 92 | - | | - | - |
| SiO2 | 58 | 2.5 | - | | 32.7 | 52 |
| Al2O3 | 38 | 0.9 | - | | 15.3 | 36 |
| Ca2SO4 | - | 0.1 | - | 99 | - | - |
| SO3 | - | - | 0.03 | | 4.7 | - |
| MgO | - | 3.5 | 99.5 | | 8.1 | 0.1 |
| Cl | - | - | 0.01 | 0.005 | - | - |
| Fe | - | 0.06 | 0.01 | 0.005 | - | 8 |
| H2O | - | 0.7 | 0.2 | | - | - |
| Loss on ignition | 11–14 | 0.24 | 0.25 | 0.99 | 2.2 | 3.7 |
| pH | 5 | 11.85 | 10.83 | 7.5 | 10.23 | 6.71 |
| Specific gravity | 2.46 | 2.23 | 3.58 | 2.34 | 2.96 | 2.33 |
Table 4.
Severity of sulphate levels.
Table 4.
Severity of sulphate levels.
| Risk Level | Sulphate Concentration |
|---|
| Parts per Million | Percentage of Dry Weight |
|---|
| Low risk | >3000 ppm | >3% |
| Moderate risk | 3000–5000 ppm | 3–5% |
| Moderate to high risk | 5000–8000 ppm | 5–8% |
| High to unacceptable risk | >8000 ppm | >8% |
| Unacceptable risk | >10,000 ppm | >10% |
Table 5.
Results of compaction test.
Table 5.
Results of compaction test.
| Stabilizer | MDD (Mg/m3) | OMC (%) |
|---|
| Type | Binder Ratio (%) | Dosage (%) | Dosage (%) |
|---|
| 10% | 20% | 10% | 20% | 10% | 20% |
|---|
| K | 0 | 0 | 1.326 | 1.326 | 29 | 29 |
| Unary | | | | | | |
| L | 100 | 100 | 1.28 | 1.27 | 30 | 32 |
| M | 100 | 100 | 1.37 | 1.39 | 29 | 29.5 |
| Binary | | | | | | |
| M-MK | 7.5:2.5 | 2.5:17.2 | 1.335 | 1.32 | 28 | 29.5 |
| | 5:5 | 5:15 | 1.33 | 1.31 | 28.5 | 30 |
| | 2.5:7.5 | 7.5:12.5 | 1.315 | 1.3 | 29.5 | 30.4 |
| M-GGBS | 7.5:2.5 | 2.5:17.2 | 1.375 | 1.38 | 27.2 | 26 |
| | 5:5 | 5:15 | 1.38 | 1.39 | 25 | 24.5 |
| | 2.5:7.5 | 7.5:12.5 | 1.39 | 1.4 | 24 | 23.5 |
| Ternary | | | | | | |
| M-GGBS-MK | 5:2.5:2.5 | 5:5:10 | 1.35 | 1.36 | 25 | 26 |
| | | 5:10:5 | - | 1.37 | - | 25.5 |
| | | 5:12.5:2.5 | - | 1.38 | - | 25 |
Table 6.
Mixture designs of stabilizer agents.
Table 6.
Mixture designs of stabilizer agents.
| Mix Code | Binder Composition | Binder Ratio (%) | Dosage (%) |
|---|
| Unary | | | |
| K | K | - | - |
| K-L | L | 100 | 10, 20 |
| K-M | M | 100 | 10, 20 |
| K-L-G | L | 100 | 10, 20 |
| K-M-G | M | 100 | 10, 20 |
| Binary | | | |
| K-M-MK-G | M:MK | 3:1, 1:1, 1:3 | 10, 20 |
| K-M-GGBS-G | M:GGBS | 3:1, 1:1, 1:3 | 10, 20 |
| Ternary | | | |
| K-M-GGBS-MK-G | M:GGBS:MK | 1:0.5:0.5, 1:1:2, 1:2:1, 1:2.5:0.5 | 10, 20 |
Table 7.
Levels of swelling for clay soil.
Table 7.
Levels of swelling for clay soil.
| Swelling (%) | Swelling Level |
|---|
| 0 | No swell |
| 0–0.1 | Negligible |
| 0.1–0.5 | Light |
| 0.5–1.0 | Medium |
| 1.0–2.0 | Strong |
| Over 2.0 | Very strong |


