Article

Design of V-Substituted TiFe-Based Alloy for Target Pressure Range and Easy Activation

1
Center for Energy Materials Research, Korea Institute of Science and Technology, Seoul 02792, Korea
2
Division of Materials Science and Engineering, Hanyang University, Seoul 04763, Korea
*
Authors to whom correspondence should be addressed.
These authors contributed equally to this paper.
Materials 2021, 14(17), 4829; https://doi.org/10.3390/ma14174829
Submission received: 4 August 2021 / Revised: 22 August 2021 / Accepted: 23 August 2021 / Published: 25 August 2021

Abstract

:
Titanium iron (TiFe) alloy is a room-temperature hydrogen-storage material, and it absorbs hydrogen via a two-step process to form TiFeH and then TiFeH2. The effect of V addition in TiFe alloy was recently elucidated. The V substitution for Ti sublattice lowers P2/P1 ratio, where P1 and P2 are the equilibrium plateau pressure for TiFe/TiFeH and TiFeH/TiFeH2, respectively, and thus restricts the two-step hydrogenation within a narrow pressure range. The focus of the present investigation was to optimize the V content such that maximum usable storage capacity can be achieved for the target pressure range: 1 MPa for absorption and 0.1 MPa for desorption. The effect of V substitution at selective Ti or Fe sublattices was closely analyzed, and the alloy composition Ti46Fe47.5V6.5 displayed the best performance with ca. 1.5 wt.% of usable capacity within the target pressure range. At the same time, another issue in TiFe-based alloys, which is a difficulty in activation at room temperature, was solved by Ce addition. It was shown that 3 wt.% Ce dispersion in TiFe alloy imparted to it easy room-temperature (RT) activation properties.

Graphical Abstract

1. Introduction

The increasing demand for an alternative to fossil fuel has stimulated hydrogen-storage research. The room-temperature hydrogen-storage alloy TiFe is the forerunner in the quest for a suitable medium owing to the abundance of constituting elements and appreciable hydrogen-storage capacity of 1.9 wt.% H [1,2] near ambient temperature and pressure. The two major bottlenecks must be overcome to commercialize TiFe alloy as a room-temperature hydrogen-storage material. First, the initial hydrogenation, or activation, should be carried out at room temperature. A high-temperature activation procedure was usually involved for activating pure TiFe [1]. Second, usable capacity under a practical operation pressure range, e.g., 1 MPa for hydrogen absorption and 0.1 MPa for desorption, must be increased. Hydrogenation of TiFe proceeds in two steps, sequentially forming TiFeH monohydride and TiFeH2 dihydride. The ratio of equilibrium pressure for each step, P2/P1 (P1 and P2 are the equilibrium plateau pressure for TiFe/TiFeH and TiFeH/TiFeH2, respectively), should be minimized to ensure large usable capacity in a narrow pressure range [2].
Available studies emphasized the characterization of the TiFe alloy, and only a few attempted to optimize the operation pressure range. Ternary phase diagram observations revealed that most of the elemental substitutions (e.g., Mn, Co, Cr, Ni, and Zr) resulted in the formation of secondary phases [3,4,5,6,7,8,9,10] dispersed uniformly in the TiFe-based primary phase [11], which was unavoidable because of the narrow single-phase region of the TiFe phase. The resultant improvement in the initial activation and other hydrogen-storage properties of TiFe alloys was attributed to the presence of these secondary hydrogen-absorbing phases [12,13]. For instance, easy activation of Zr-added TiFe alloy reported in some studies [13,14,15,16] is likely due to the formation of Ti-Fe-Zr-based ternary alloy: Faisal et al. [17] recently reported that single-phase Ti-Fe-Zr ternary alloys in the C14 structure were easily activated under 3 MPa of hydrogen pressure at room temperature. Likewise, Cr-added TiFe alloy could be activated at room temperature with the help of a Ti(Fe,Cr)2 phase in the C14 structure [18,19,20]. However, in those studies, the two-step plateaus became more pronounced after alloying, i.e., P2/P1 became larger. Hence, it is necessary to use alloying elements that can improve activation without modifying the thermodynamics of the TiFe phase. It was reported that over-stoichiometric Ti or the addition of mischmetal (Mm) in small quantity improved the activation properties of TiFe alloy drastically [21,22,23]. Ma et al. [24] showed that FeTi1.3 + x wt.% Mm (x = 1.5, 3.0, 4.5, 6.0) were hydrogenated at room temperature, with FeTi1.3 + 6 wt.% Mm showing 1.58 wt.% H-storage capacity. Wang et al. [22] studied hydrogen-storage properties of TixFe + y wt.% La. La in small quantities helped improve activation of TiFe alloy without degrading hydrogen-storage capacity substantially. It has been established in previous studies [25] that the addition of a small amount of Ce showed remarkable improvement in the activation properties of TiFe0.9Mn0.1 at 353 K and 4 MPa hydrogen pressure, which was otherwise virtually impossible to activate under the above conditions [26]. Liu et al. [27] and Yan et al. [28] showed Ce segregation in Ce-containing BCC alloy. They showed that this segregation had no effect on the alloy structure and its lattice parameter. It was mentioned that Ce-containing alloys showed Ce and CeO2 enrichment, and Ce reacted with hydrogen, imparting RT activation properties to the alloys. Therefore, adding some percentage of Lanthanide elements can be a good strategy to solve the activation issue.
To tailor the operation pressure range of hydrogen storage via alloying, the alloy composition should stay within the single-phase TiFe in the B2 structure. It is worth mentioning that most of the element alloying with TiFe replaces Fe sublattice [15,29,30,31,32]. The conventional knowledge about Fe substitution with most-studied elements such as Ni, Co, and Cr is that they result in a significant reduction in P1, which in turn increases P2/P1 ratio. The element Mn, in contrast, leads to a lesser reduction in equilibrium pressure [26,33,34]. Liu et al. [35] showed that TiFe-based alloy demonstrated as Fe1−xMnxTi1−yVy had the ability to absorb and desorb hydrogen under close-to-constant pressure, implying P2/P1 ratio approaching unity. This resulted in the enhancement of usable maximum hydrogen capacity in a narrow pressure range. Mitrokhin et al. [36] highlighted that the desorption pressure-composition isotherm curves for Ti-Fe-V-Mn alloys had the plateaus both approaching each other and being combined into one single sloping plateau. They coined the term “pressure smoothing effect” to explain the phenomenon. Massicot [37] illustrated that Ti47V5Fe48 displayed a sloping plateau over the complete absorption/desorption domain without a detectable two-step plateau. Jung et al. [2] pointed out the importance of V, which can substitute for both Ti and Fe sites [38] unlike the other 3d transition metals. This allowed more degrees of freedom in tailoring the two equilibrium pressures, P1 and P2, and an optimal hydrogen-storage property can be derived only through V without resorting to additional alloying elements.
In the current discussion, we present a systematic study of designing an optimal composition of V-substituted TiFe alloy, exhibiting P2/P1 ratio close to unity, thus maximizing the usable capacity under the target pressure range of 0.1–1 MPa. We utilized the unique property of V, i.e., its versatility to substitute for Fe and Ti, simultaneously. The role of Ce addition in improving the RT activation of V-substituted TiFe alloy was also envisaged. Thus, we propose a novel V-substituted TiFe alloy with Ce addition as a prime material sorted for RT solid-state hydrogen-storage applications.

2. Materials and Methods

2.1. Sample Synthesis

A binary Ti-Fe alloy and eight ternary Ti-Fe-V alloys with 3 wt.% Ce addition (samples 0 to 8) were synthesized via arc melting under argon (6N purity) atmosphere. The elements Ti, Fe, and V were 99.995%, 99.9%, and 99.95% pure, respectively. The required proportions of the elements were weighed such that each alloy was 25 g (±0.005 g). All the alloys were melted six times by flipping the sample button between two consecutive melting procedures to enhance the compositional homogeneity. The weight loss of the alloys after the arc melting was <0.5%. The alloys were wrapped in tantalum foil and vacuum-sealed in quartz tubes. The first six alloys (0–5) were annealed at 1000 °C for a week while the last three (6–8) were annealed for three weeks at 1000 °C. Table 1 presents nominal compositions for each alloy along with respective sample IDs. Alloy 0 is the reference alloy without V substitution. Assuming that Ti and Fe are preferentially positioned at their own sublattices, V distribution at the Ti and Fe sublattices was determined and is summarized in Table 1.

2.2. Structure and Chemical Composition Analysis

The crystal structure, phase fractions and lattice parameters of the alloy samples were analyzed via X-ray powder diffraction (XRD) using Cu-Kα radiation (D8 ADVANCE, Bruker AXS GmbH, Karlsruhe, Germany). Rietveld refinement analysis was performed on the diffraction patterns using TOPAS software (version 5, Bruker AXS GmbH, Karlsruhe, Germany) [39]. The phase fractions and lattice parameters were assessed via whole-profile fitting (WPF). The atomic composition of each phase was analyzed from energy-dispersive x-ray spectroscopy (EDX) on backscattered electron (BSE) images obtained from field-emission scanning electron microscope (FE-SEM, Inspect F50, FEI Company, Hillsboro, OR, USA). The phase fraction in area percentage was obtained from image analysis using Image J, FIJI, software (version 2, NIH, Bethesda, MD, USA).

2.3. Hydrogen Sorption Property

The alloy samples were activated in a lab-made stainless-steel reactor (3 cm3 capacity). The bulk alloy pieces were charged in the reactor, and the reactor was evacuated to 10−1 Pa at 30 °C; 3 MPa of pure hydrogen gas (6N purity) was introduced inside the reactor at room temperature, and the pressure change was monitored over time. The sample was deemed to be activated when the pressure drop inside the reactor ceased. Pressure–composition isotherm (PCI) measurement was performed on each sample to evaluate their hydrogen sorption property. Before a PCI measurement, the activated alloy sample inside the reactor was evacuated under dynamic vacuum at 200 °C for 1 h to remove any residual hydrogen from the activation process. The PCI curves were obtained at 30 °C with maximum hydrogen pressure of 4 MPa via an automatic high-pressure volumetric analyzer (HPVA II, Particulate Systems). For sample 8, PCI measurements were made at three different temperatures (30, 40, and 50 °C).

3. Results and Discussion

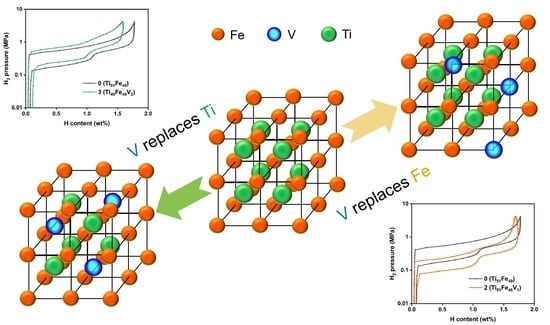
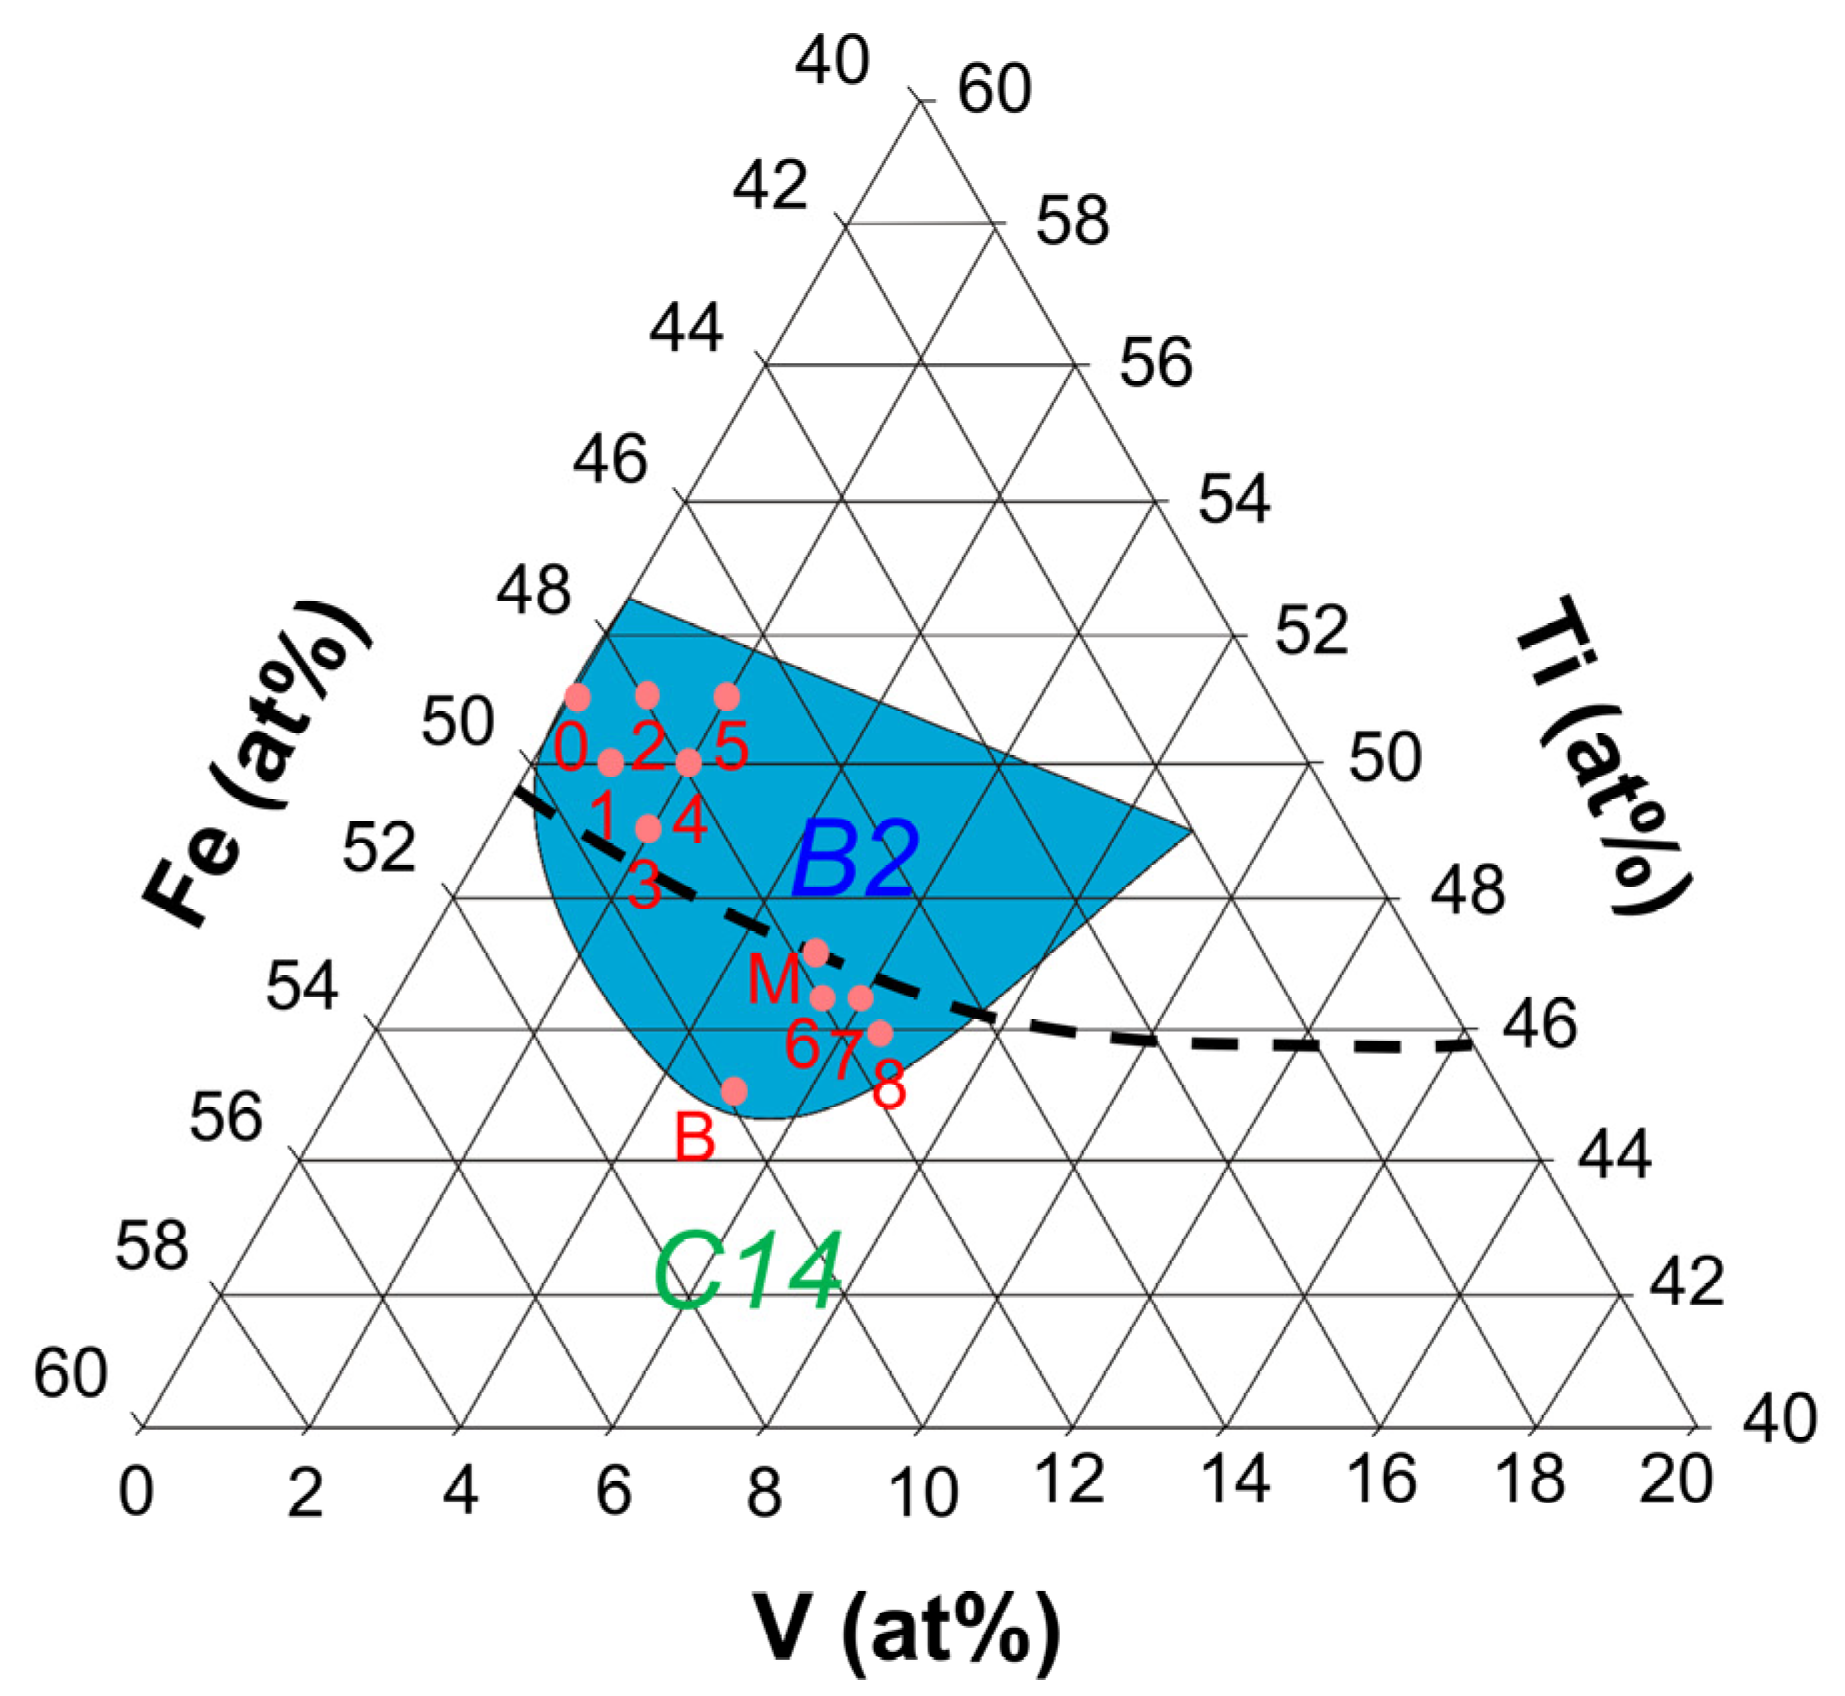
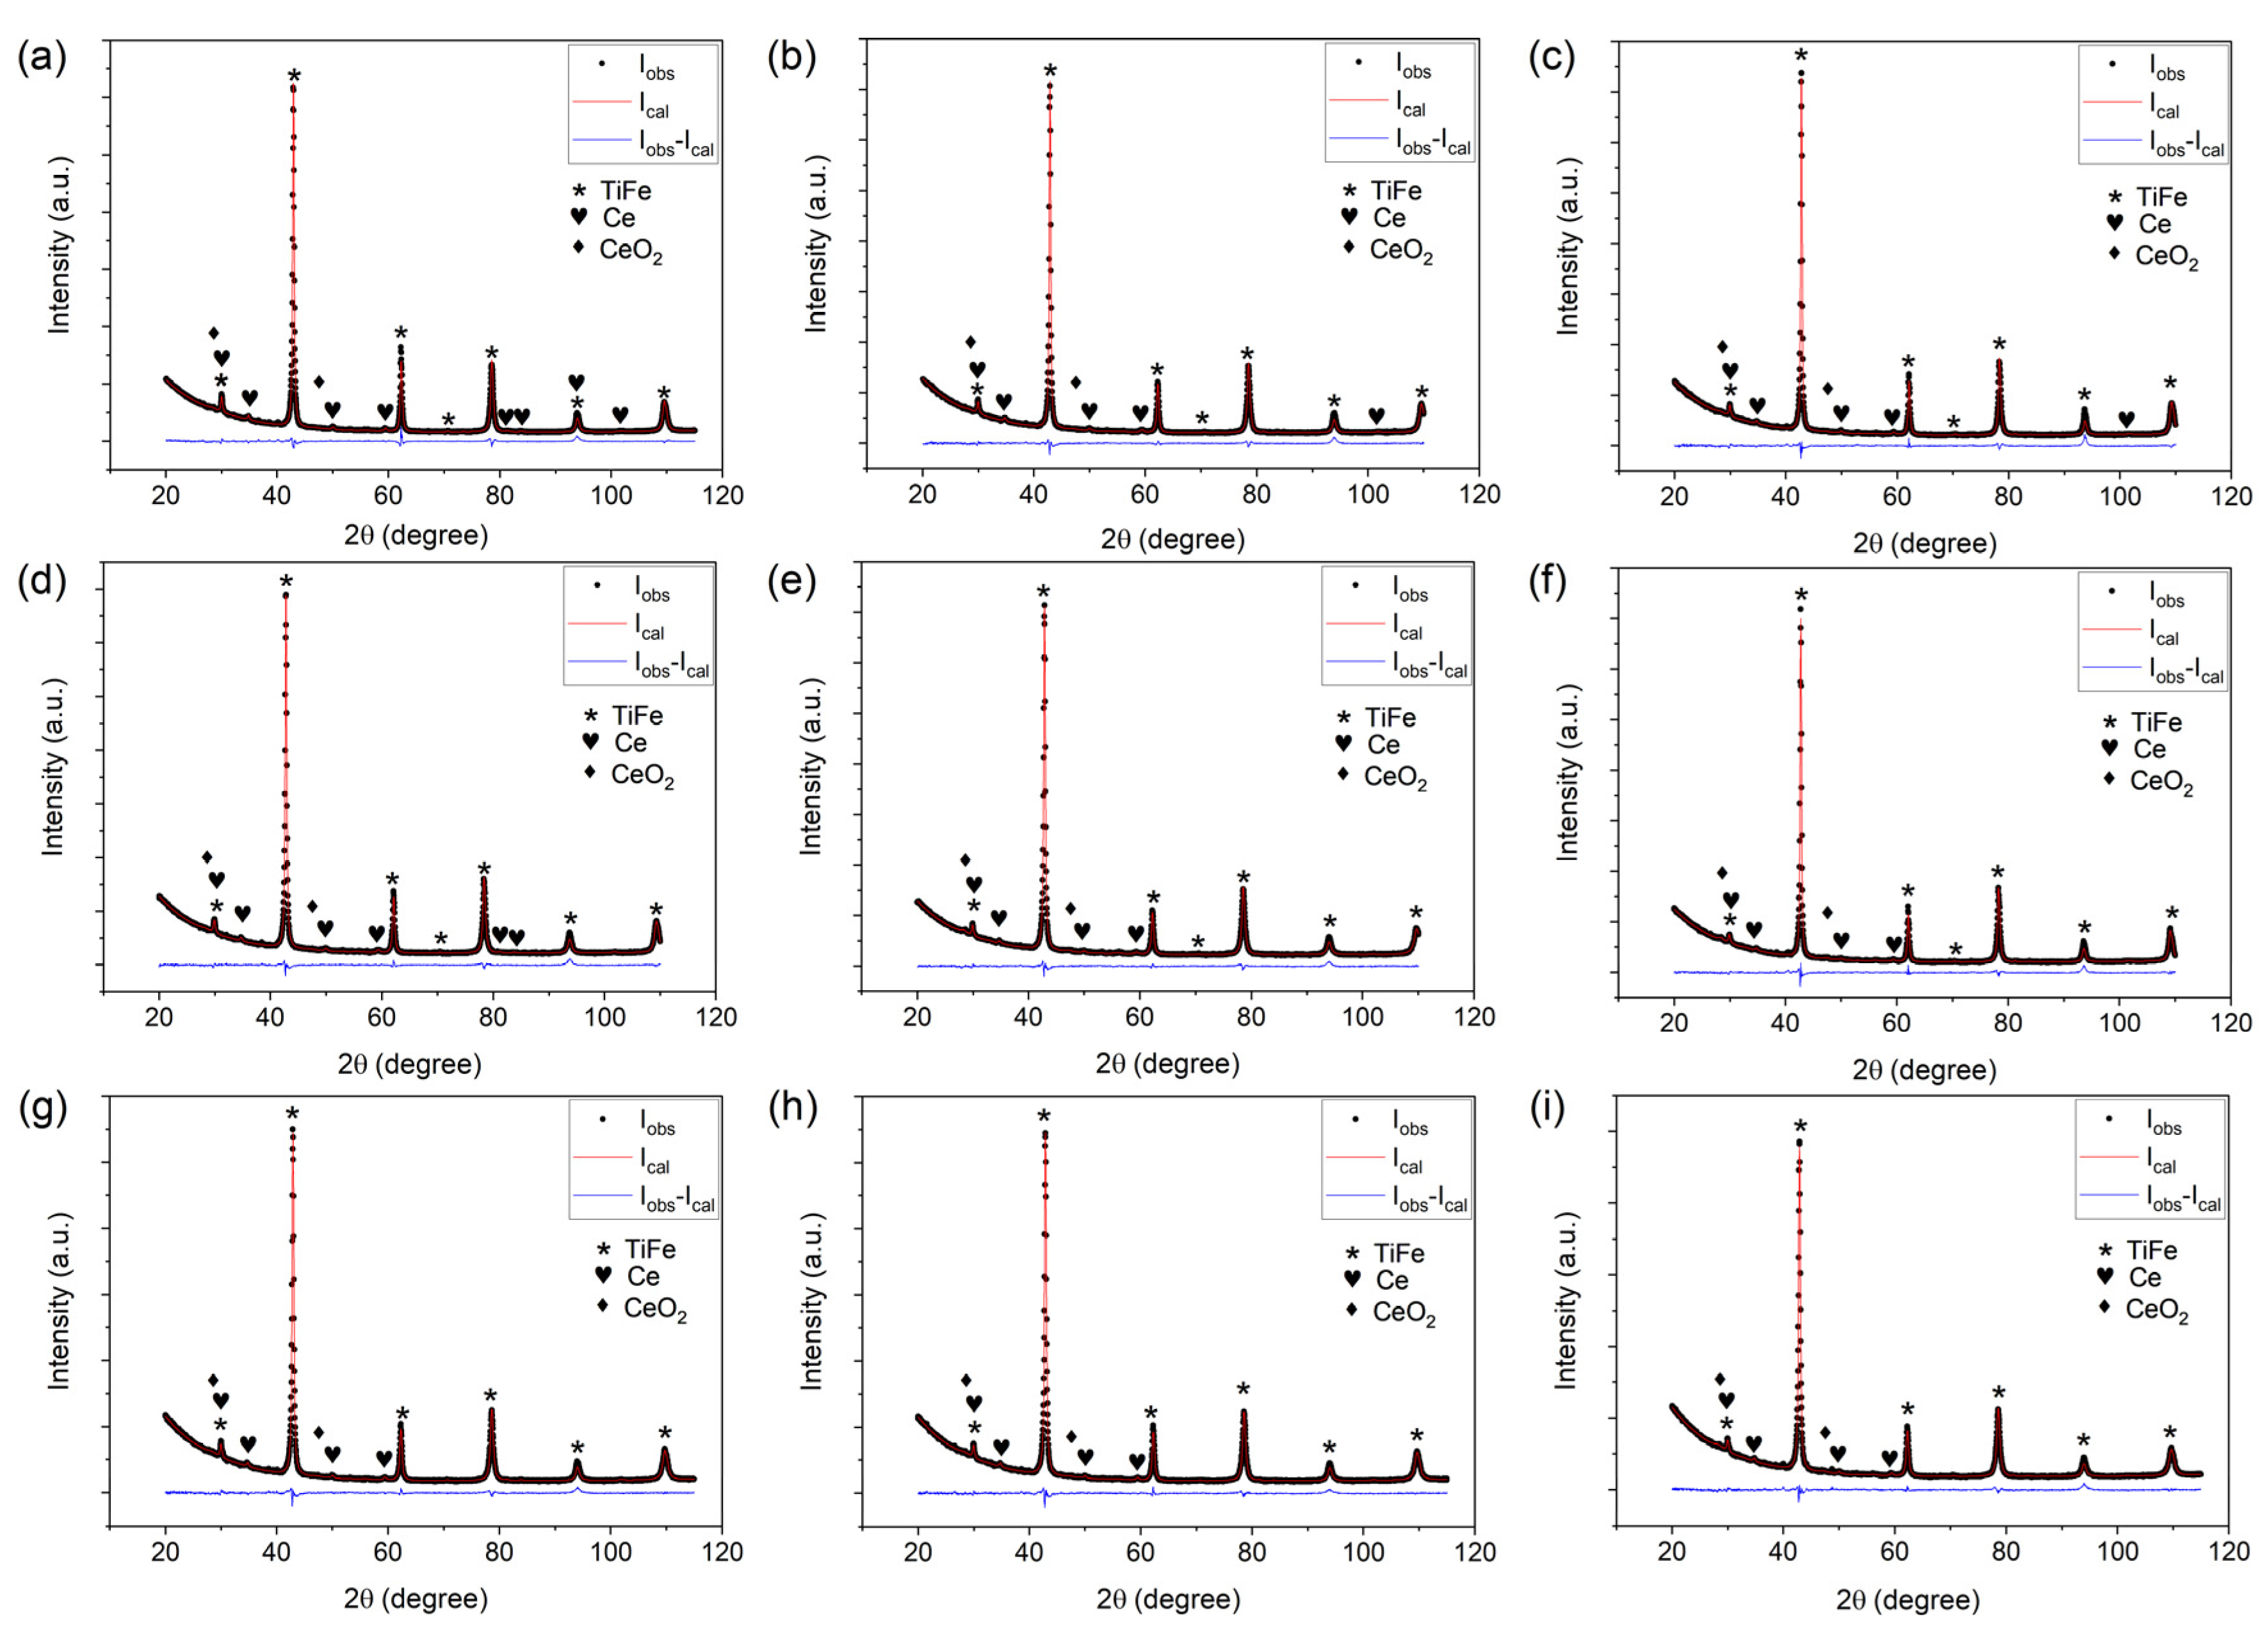
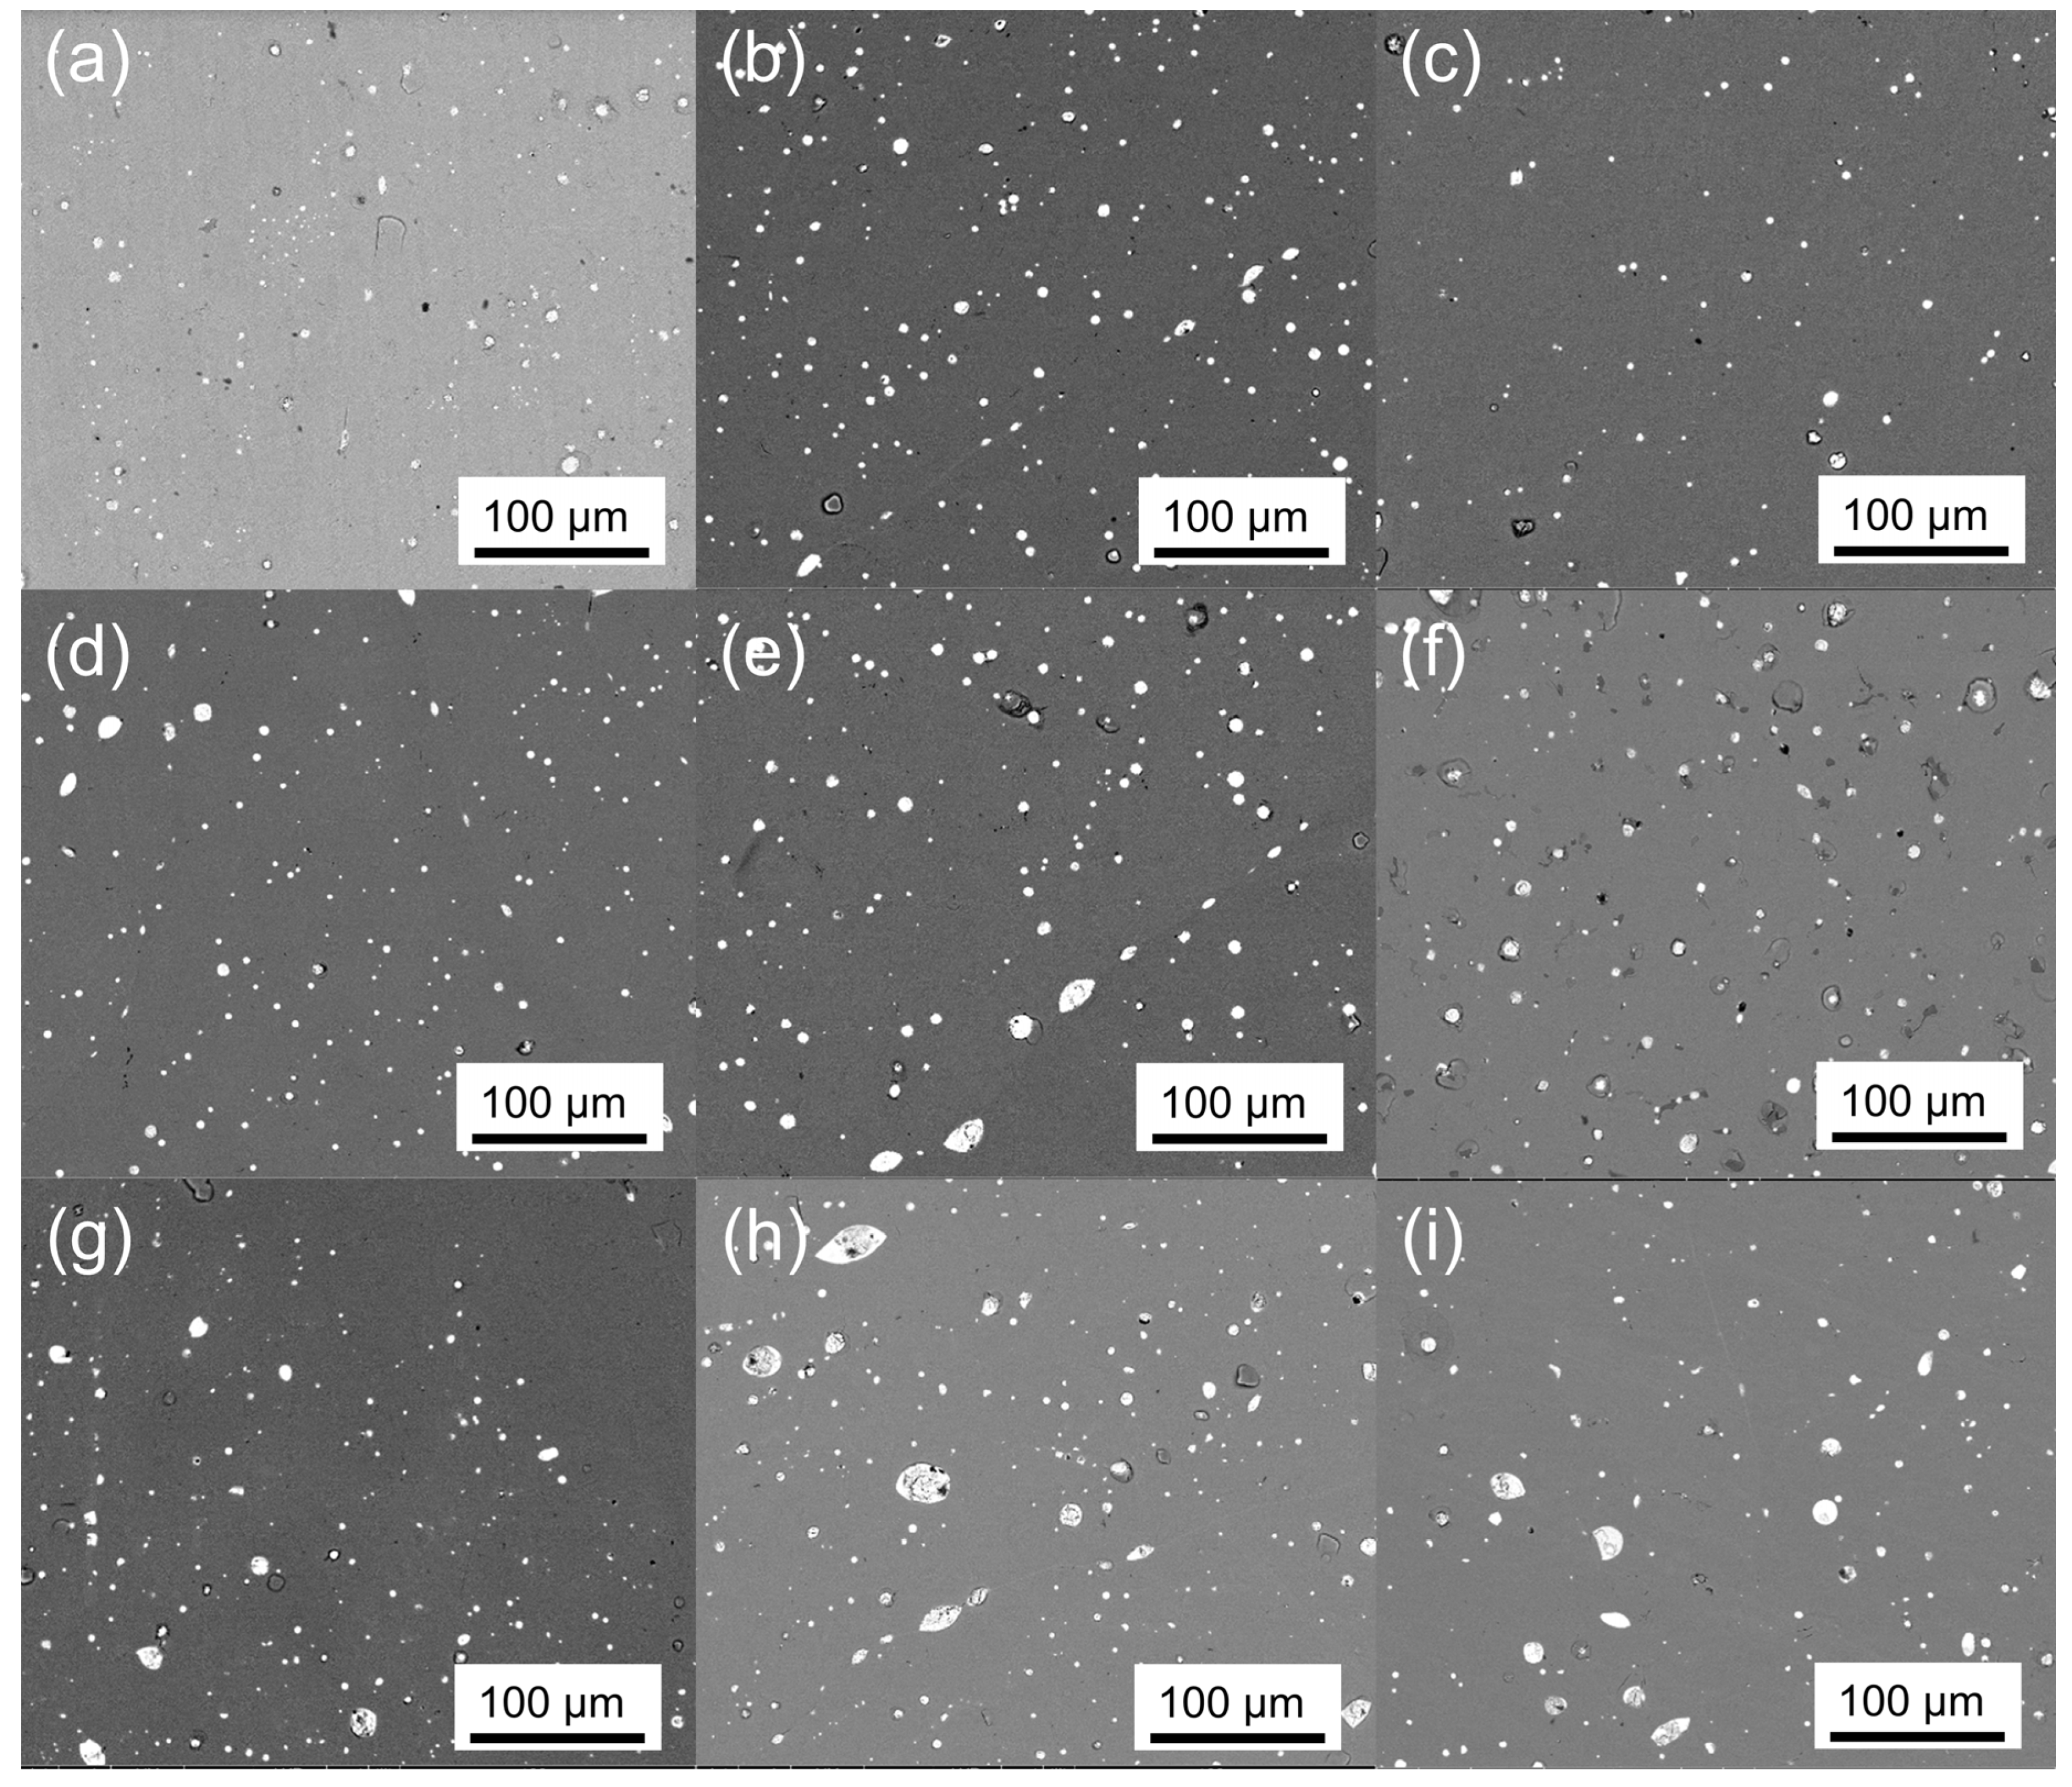
3.1. Alloy Design and Phase Study

Figure 1 shows a portion of the horizontal section of a ternary phase diagram of the Ti-Fe-V system at 1000 °C (redrawn from [38]), overlaid with the nominal compositions of samples 0–8, designed for the current study. The nominal compositions from samples 0–5 were designed in a fashion that the effect of V substitution at Fe and Ti sublattices becomes evident. The composition of Ti51Fe49 (the subscript denotes the composition in at%) was chosen as the starting composition instead of Ti50Fe50 because P2 of Ti50Fe50 is higher than 1 MPa at 30 °C [1], outside the target pressure range in this study. The hydrides of Ti51Fe49 are more stable than that of Ti50Fe50. The compositions of samples 6 to 8 were designed such that the usable capacity between 0.1 and 1 MPa should be maximized: this is elaborated later.
The WPF plots from the XRD data of samples 0–8 are shown in Figure 2. Only three phases were detected: TiFe main phase (space group Pm-3m) and small amounts of Ce (space group Fm-3m) and CeO2 (space group Fm-3m) phases. Precisely speaking, the TiFe main phase is the Ti-Fe-V ternary phase in the B2 structure (in Figure 1), but we henceforth refer to it as a TiFe phase for simplicity. The Rietveld refinement results of the XRD data are summarized in Table 2. The sum of the phase fraction of Ce and CeO2 was about 3 wt.%, approximately the same as the initial amount of 3 wt.% Ce. Evidently, Ce is not soluble in TiFe [25] and exists as separate phases. The presence of CeO2 reflects that Ce acts as an oxygen scavenger, besides promoting initial hydrogenation. At 1000 °C, the standard Gibbs free energy of formation of CeO2 and TiO2 is −826 kJ mol−1 and −714 kJ mol−1, respectively (from HSC Chemistry software, version 5.1, Outokumpu Research Oy, Pori, Finland). This characteristic allows us to precisely control Ti and Fe content in the B2 structure. In a previous study, the Ti4Fe2O1−x suboxide phase was found, and because of the formation of this suboxide phase, the contents of Ti and Fe were different from those of the nominal composition [2]. In the XRD data, we did not find the peaks related to this suboxide phase.
In samples 0–5, although the composition change stayed within 2 at.%, the lattice parameters in Table 2 were systematically varied according to the composition. From now on, the change in alloy composition from one sample to another is represented by ‘→’. For instance, if the composition of sample 0 changes to 1, it would be represented as 0→1. Table 2 shows that samples 0→1→3 have Fe composition fixed to 49 at.%, with increasing V in 0→1→2 at.% and decreasing Ti in 51→50→49 at.%. The atomic radii for the elements are in the following order: Ti > V > Fe. Therefore, when V substitutes for Ti (V→Ti), the lattice parameter must decrease. This trend is illustrated in Figure 3. Similarly, samples 0→2→5 have Ti composition fixed at 51 at% with V substituting for Fe (V→Fe). The lattice parameter monotonically increased in this series. For samples 3→4→5, Ti substituted for Fe (Ti→Fe), and again the lattice parameter increased showing the largest slope among the three series in Figure 3.
BSE images of the samples in Figure 4 further validated the phase analysis from XRD. In Figure 4, only two contrasts were evident regardless of the sample ID. The EDX elemental map of sample 8 shown in Figure 5 revealed that the gray or dark contrast was the TiFe phase. The white or bright contrast showed enrichment of Ce and O, and they corresponded to phases Ce and/or CeO2. The area fractions evaluated for gray and white contrast are summarized in Table 3 and in good agreement with the phase fractions from XRD data in Table 2. Thus, the above observation suggests that phases and their relative fractions obtained after melting and heat treatment were in confirmation with the respective intentionally designed alloys.

3.2. Activation and PCI Measurements

Activation of alloys 0–8 was performed at 30 °C under 3 MPa H2 pressure. As shown in Figure 6, all the alloys absorbed hydrogen under the above condition although the kinetics varied among the samples. The effect of Ce addition to TiFe-based alloys has been highlighted earlier [25], and also in our cases, the addition of 3 wt.% Ce promoted activation. Complete activation of each alloy took three to five cycles of hydrogen absorption at 3 MPa followed by evacuation under rough vacuum (10−1 Pa) at 30 °C.
In Figure 7, the PCI curves for the three series of the composition change are presented: 0→1→3, 0→2→5, and 3→4→5, as the lattice parameter analysis in Figure 3. It can be seen that the desorption plateau pressures P1 and P2 for the starting composition 0 were positioned within 0.1–1 MPa, but pressure hysteresis in the absorption process limited the absorbed amount under 1 MPa, and further optimization of the composition was necessary. When comparing the plateau pressures, we focused on the desorption plateau pressures because the pressure hysteresis in Figure 7 was apparently affected by the composition and the absorption plateau pressures were less systematically changed by the composition change.
We start the discussion with sample 0→1→3 in Figure 7a. As the composition of the alloy sample changed 0→1, there was no profound change in the plateau pressure. In contrast, with increasing V from 1 to 2 at.%, in 1→3, P1 and P2 certainly rose to higher pressures. Referring to the sublattice occupation in Table 1, Ti at Fe sublattice was replaced by V in 0→1 (Fe49Ti1→ Fe49V1), whereas Ti at Ti sublattice was replaced by V in 1→3 (Ti50→Ti49V1). Therefore, equilibrium pressure tailoring outcomes would differ depending on the V site occupancy [2]: Ti or V substitution at Fe sublattice changed the plateau pressure to a similar degree, but V substitution at Ti sublattice raised the plateau pressures. The PCI curves of the second series 0→2→5, plotted in Figure 7b, displayed a monotonic decrease in the plateau pressures. Different from the aforementioned 0→1→3 series, here only Fe at Fe sublattice was replaced by V as V concentration increased from 0 to 2 at.%. In the last series, 3→4→5 in Figure 7c, P1 and P2 again decreased monotonically. However, the drop in 3→4 was more pronounced than that in 4→5. This is also related to the underlying substitution mechanism in Table 1. At the Fe sublattice, the occupation change in 3→4 (Fe49V1→Fe48V2) and 4→5 (Fe48V2→Fe47Ti1V2) was the increase of either V or Ti by 1 at.%, and we found that the effect on the pressure change was similar. However, there was an additional change in the Ti sublattice occupation in 3→4 (Ti49V1→Ti50), and this resulted in a more significant drop in P1 and P2 in the case of 3→4. Therefore, the plateau pressure change is comprehensible only when the sublattice occupation is considered [40]: the nominal composition change does not provide full understanding. To clearly visualize the pressure variation, P1 and P2 were taken at the midpoint of the desorption plateaus and are plotted in Figure 8.
Based on the PCI results, we established a strategy to maximize the usable capacity between 0.1 and 1 MPa: P2 is lowered through V substitution at Fe sublattice, and then P1 is raised by V substitution at Ti sublattice. In Figure 8, P2 of the samples 2, 4, and 5 is low enough to ensure a high amount of hydrogen absorption under 1 MPa even with pressure hysteresis. Therefore 2–3 at.% V at Fe sublattice can bring down the P2 value to the desired pressure range. However, then their P1 values become too low to fully desorb hydrogen under 0.1 MPa. Considering the increase in P1 in 1→3 when 1 at.% of V replaced Ti, 3–4 at.% V at Ti sublattice would be needed to make P1 similar to P2. Under this logic, we designed three new compositions: Ti46.5Fe48V5.5 (sample 6), Ti46.5Fe47.5V6 (sample 7), and Ti46Fe47.5V6.5 (sample 8). A precaution was taken when preparing these samples. In Figure 1, the black dashed line is the liquidus surface projection, overlaid on a portion of the isothermal section of the Ti-Fe-V phase diagram at 1000 °C [38]. The alloy composition marked as B (Ti45Fe50V5) is located in the region where C14 is solidified first from liquid. This composition contained ~10 wt.% of the C14 phase even after 1 week of annealing in a previous study [2], and it would require a longer annealing time to reach thermodynamic equilibrium, i.e., a single B2 phase. It was shown in another study that the alloy composition marked as M (Ti47V5Fe48), which is on the liquidus surface projection line that divides the region of B2 and C14, resulted in an almost-B2 phase after three weeks of annealing [37]. Therefore, samples 6–8 need a longer annealing time than that applied for samples 0–5 (one week), and they were annealed for three weeks at 1000 °C. The XRD data in Figure 2g–i for samples 6–8 confirmed that they only contained the TiFe phase in the B2 structure except for Ce and CeO2; we did not find the peaks of the C14 phase.
Figure 9a shows the PCI curves for samples 6, 7, and 8 measured at 30 °C. As intended, P1 and P2 were located closely for all of them, and the two-step desorption plateaus became almost a single plateau. Although it is a subtle difference, P1 of sample 7 was the lowest because it contained more V at Fe sublattice than sample 6 and less V at Ti sublattice than sample 8; this again proves that the equilibrium pressure can be precisely engineered if the effect of substitution at each sublattice is well understood. All of them turned out to be suitable to be used between the target pressure range of 0.1–1 MPa. Among them, sample 8 displayed the best performance. Although further analyses are necessary, it is also possible that the smaller maximum hydrogen content in samples 6 and 7 could have originated from the failure of full activation of the samples rather than from the difference in composition. Samples 1 and 3 in Figure 7a also displayed smaller maximum capacities, and there is no apparent reason why such a small change in composition can significantly affect the maximum capacity. Their PCI curves look squeezed along the abscissa, and it indicates that some part of the samples remained unactivated. To determine the reproducibility of the PCI curve of sample 8, another measurement was performed and presented as #2 in Figure 9b. The data were not from the consecutive cycle of #1 but an independent measurement with a new sampling and the activation process.
Continuing the discussion on the usable capacity, sample 8, showing the best performance, absorbed ~1.6 wt.% H under 1 MPa and desorbed most of the absorbed hydrogen at 0.1 MPa, resulting in 1.5 wt.% of usable hydrogen-storage capacity in this range. This surpasses the maximum capacity of 1.4 wt.% of LaNi5 (LaNi5 to LaNi5H6) and highlights the potential of TiFe-based alloy as a room-temperature hydrogen-storage material. Further improvement in the usable capacity by increasing V content is conceivable. However, as shown in Figure 1, composition 8 is close to the phase boundary of the B2 single phase, and the V content is limited by thermodynamics. Therefore we do not expect any significant improvement in the usable capacity by further increasing V content.
The enthalpy and entropy change of hydrogen desorption of sample 8 was characterized by measuring PCI curves at 40 and 50 °C, and the results are shown in Figure 10a. The P1 and P2 from the desorption plateaus were taken at H/M = 0.25 (0.486 wt.% H) and H/M = 0.7 (1.361 wt.% H), respectively, where H/M is the hydrogen to metal ratio, and van’t Hoff plots are shown in Figure 10b. The enthalpy change (∆H) and entropy change (∆S) per one mole of hydrogen were obtained from the slope and the intercept of the linear regression result. The obtained values are: ∆H1 = 25.1 ± 0.4 kJ mol−1 and ∆H2 = 34.4 ± 2.2 kJ mol−1, and ∆S1 = 89.3 ± 1.2 J K−1 mol−1 and ∆S2 = 123.8 ± 7.0 J K−1 mol−1. Compared to the enthalpy change of pure TiFe, ∆H1 = 28.1 kJ mol−1 and ∆H2 = 33.3 kJ mol−1 (at H/M = 0.7) by Reilly and Wiswall [1] and ∆H1 = 25.6 ± 1.0 and ∆H2 = 31.6 ± 1.2 kJ mol−1 (at H/M = 0.7) by Wenzl and Lebsanft [41], ∆H1 was down-shifted and ∆H2 was up-shifted. Especially, the difference, ∆H2−∆H1, was appreciably larger in sample 8. Hence the decrease in P2 (i.e., stabilization of dihydride and larger ∆H2) and the increase in P1 (i.e., destabilization of monohydride and smaller ∆H1) by V substitution were correctly captured in the enthalpy change.

4. Conclusions

The objectives of the present investigation were twofold: (1) design of a TiFe alloy with a maximum usable hydrogen-storage capacity in a target pressure range (0.1–1 MPa) and (2) easy RT activation of the TiFe alloy via Ce addition. Enhancement in the usable storage capacity was achieved via V substitution. The unique characteristic of V, i.e., appreciable substitution at both Ti and Fe sublattices, was exploited to tailor the plateau pressures. The cue to enhance hydrogen-storage capacity is the reduction in the P2/P1 ratio: P2 was lowered by V substitution at Fe sublattice whereas P1 was raised by V substitution at Ti sublattice. The addition of 3 wt.% Ce promoted activation at room temperature and suppressed the formation of Ti4Fe2O1−x suboxide, which enabled better control of the composition of the TiFe phase. Among the series of the Ti-Fe-V alloys, composition Ti46Fe47.5V6.5 exhibited the maximum usable capacity of 1.5 wt.% under 1 MPa of absorption and 0.1 MPa of desorption pressure at 30 °C. The enthalpy change of hydrogen desorption was ∆H1 = 25.1 ± 0.4 kJ mol−1 and ∆H2 = 34.4 ± 2.2 kJ mol−1, providing an increased value of ∆H2−∆H1 compared to pure TiFe.

Author Contributions

Conceptualization, M.F. and Y.-S.L.; Formal Analysis, M.F., J.-H.K. and Y.-S.L.; Investigation, M.F. and J.-H.K.; Writing—Original Draft Preparation, M.F. and J.-H.K.; Writing—Review and Editing, Y.W.C., J.-Y.S. and Y.-S.L.; Visualization, M.F., J.-H.K. and Y.-S.L.; Supervision, J.J. and J.-H.S.; Project Administration, Y.W.C. and J.-Y.S.; Funding Acquisition, Y.-S.L. All authors have read and agreed to the published version of the manuscript.

Funding

This research was funded by the Korea Institute of Science and Technology (grant number 2E30993) and by the “Technology Development Program to Solve Climate Changes” of the National Research Foundation funded by the Ministry of Science and ICT of Korea (NRF-2020M1A2A2080881).

Institutional Review Board Statement

Not applicable.

Informed Consent Statement

Not applicable.

Data Availability Statement

Not applicable.

Conflicts of Interest

The authors declare no conflict of interest.

References

  1. Reilly, J.J.; Wiswall, R.H. Formation and properties of iron titanium hydride. Inorg. Chem. 1974, 13, 218–222. [Google Scholar] [CrossRef]
  2. Jung, J.Y.; Lee, Y.S.; Suh, J.Y.; Huh, J.Y.; Cho, Y.W. Tailoring the equilibrium hydrogen pressure of TiFe via vanadium substitution. J. Alloys Compd. 2021, 854, 157263–157272. [Google Scholar] [CrossRef]
  3. Lee, S.M.; Perng, T.P. Correlation of substitutional solid solution with hydrogenation properties of TiFe1-xMx (M = Ni, Co, Al) alloys. J. Alloys Compd. 1999, 291, 254–261. [Google Scholar] [CrossRef]
  4. Bououdina, M.; Fruchart, D.; Jacquet, S.; Pontonnier, L.; Soubeyroux, J.L. Effect of nickel alloying by using ball milling on the hydrogen absorption properties of TiFe. Int. J. Hydrogen Energy 1999, 24, 885–890. [Google Scholar] [CrossRef]
  5. Lee, S.M.; Perng, T.P. Effect of the second phase on the initiation of hydrogenation of TiFe1−xMx (M = Cr, Mn) alloys. Int. J. Hydrogen Energy 1994, 19, 259–263. [Google Scholar] [CrossRef]
  6. Oguro, K.; Osumi, Y.; Suzuki, H.; Kato, A.; Imamura, Y.; Tanaka, H. Hydrogen storage properties of TiFe1−xNiyMz alloys. J. Less-Common. Met. 1983, 89, 275–279. [Google Scholar] [CrossRef]
  7. Qu, H.; Du, J.; Pu, C.; Niu, Y.; Huang, T.; Li, Z.; Lou, Y.; Wu, Z. Effects of Co introduction on hydrogen storage properties of Ti–Fe–Mn alloys. Int. J. Hydrogen Energy 2015, 40, 2729–2735. [Google Scholar] [CrossRef]
  8. Patel, A.K.; Duguay, A.; Tougas, B.; Neumann, B.; Schade, C.; Sharma, P.; Huot, J. Study of the Microstructural and First Hydrogenation Properties of TiFe Alloy with Zr, Mn and V as Additives. Processes 2021, 9, 1217–1228. [Google Scholar] [CrossRef]
  9. Dematteis, E.M.; Dreistadt, D.M.; Capurso, G.; Jepsen, J.; Cuevas, F.; Latroche, M. Fundamental hydrogen storage properties of TiFe-alloy with partial substitution of Fe by Ti and Mn. J. Alloys Compd. 2021, 874, 159925–159936. [Google Scholar] [CrossRef]
  10. Dematteis, E.M.; Berti, N.; Cuevas, F.; Latroche, M.; Baricco, M. Substitutional effects in TiFe for hydrogen storage: A comprehensive review. Mater. Adv. 2021, 2, 2524–2560. [Google Scholar] [CrossRef]
  11. Zeng, L.; Xu, G.; Liu, L.; Bai, W.; Zhang, L. Experimental investigation of phase equilibria in the Ti-Fe-Zr system. Calphad 2018, 61, 20–32. [Google Scholar] [CrossRef]
  12. Gosselin, C.; Santos, D.; Huot, J. First hydrogenation enhancement in TiFe alloys for hydrogen storage. J. Phys. D Appl. Phys 2017, 50, 375303–375308. [Google Scholar] [CrossRef]
  13. Lv, P.; Huot, J. Hydrogen storage properties of Ti0.95FeZr0.05, TiFe0.95Zr0.05 and TiFeZr0.05 alloys. Int. J. Hydrogen Energy 2016, 41, 22128–22133. [Google Scholar] [CrossRef]
  14. Gosselin, C.; Huot, J. Hydrogenation Properties of TiFe Doped with Zirconium. Materials 2015, 8, 7864–7872. [Google Scholar] [CrossRef] [Green Version]
  15. Jain, P.; Gosselin, C.; Huot, J. Effect of Zr, Ni and Zr7Ni10 alloy on hydrogen storage characteristics of TiFe alloy. Int. J. Hydrogen Energy 2015, 40, 16921–16927. [Google Scholar] [CrossRef]
  16. Lv, P.; Huot, J. Hydrogenation improvement of TiFe by adding ZrMn2. Energy 2017, 138, 375–382. [Google Scholar] [CrossRef]
  17. Faisal, M.; Suh, J.Y.; Lee, Y.S. Understanding first cycle hydrogenation properties of Ti–Fe–Zr ternary alloys. Int. J. Hydrogen Energy 2021, 46, 4241–4251. [Google Scholar] [CrossRef]
  18. Kim, H.; Faisal, M.; Lee, S.I.; Jung, J.Y.; Kim, H.J.; Hong, J.; Lee, Y.S.; Shim, J.H.; Cho, Y.W.; Kim, D.H.; et al. Activation of Ti–Fe–Cr alloys containing identical AB2 fractions. Alloy. Compd. 2021, 864, 158876–158883. [Google Scholar] [CrossRef]
  19. Jung, J.Y.; Lee, S.I.; Faisal, M.; Kim, H.; Lee, Y.S.; Suh, J.Y.; Shim, J.H.; Huh, J.Y.; Cho, Y.W. Effect of Cr addition on room temperature hydrogenation of TiFe alloys. Int. J. Hydrogen Energy 2021, 46, 19478–19485. [Google Scholar] [CrossRef]
  20. Park, K.B.; Ko, W.S.; Fadonougbo, J.O.; Na, T.W.; Im, H.T.; Park, J.Y.; Kang, J.W.; Kang, H.S.; Park, C.S.; Park, H.K. Effect of Fe substitution by Mn and Cr on first hydrogenation kinetics of air-exposed TiFe-based hydrogen storage alloy. Mater. Charact. 2021, 178, 111246–111251. [Google Scholar] [CrossRef]
  21. Bronca, V.; Bergman, P.; Ghaemmaghami, V.; Khatamian, D.; Manchester, F.D. Hydrogen absorption characteristics of an FeTi + misch metal alloy. J Less-Common Met. 1985, 108, 313–325. [Google Scholar] [CrossRef]
  22. Wang, X.; Chen, R.; Chen, C.; Wang, Q. Hydrogen storage properties of TixFe + y wt.% La and its use in metal hydride hydrogen compressor. J. Alloys Compd. 2006, 425, 291–295. [Google Scholar] [CrossRef]
  23. Singh, B.K.; Singh, A.K.; Srivastava, O.N. Improved hydrogen sorption characteristics in FeTi1 + xMm material. Int. J. Hydrogen Energy 1996, 21, 111–117. [Google Scholar] [CrossRef]
  24. Ma, J.; Pan, H.; Wang, X.; Chen, C.; Wang, Q. Hydrogen storage properties of FeTi1.3+x wt%Mm (x=0.0, 1.5, 3.0, 4.5, 6.0) hydrogen storage alloys. Int. J. Hydrogen Energy 2000, 25, 779–782. [Google Scholar] [CrossRef]
  25. Leng, H.; Yu, Z.; Yin, J.; Li, Q.; Wu, Z.; Chou, K.-C. Effects of Ce on the hydrogen storage properties of TiFe0.9Mn0.1 alloy. Int. J. Hydrogen Energy 2017, 42, 23731–23736. [Google Scholar] [CrossRef]
  26. Nagai, H.; Kitagaki, K.; Shoji, K. Microstructure and hydriding characteristics of FeTi alloys containing manganese. J. Less-Common Met. 1987, 134, 275–286. [Google Scholar] [CrossRef]
  27. Liu, X.P.; Cuevas, F.; Jiang, L.J.; Latroche, M.; Li, Z.N.; Wang, S.M. Improvement of the hydrogen storage properties of Ti–Cr–V–Fe BCC alloy by Ce addition. J. Alloys Compd. 2009, 476, 403–407. [Google Scholar] [CrossRef]
  28. Yan, Y.; Chen, Y.; Liang, H.; Zhou, X.; Wu, C.; Tao, M. Effect of Ce on the structure and hydrogen storage properties of V55Ti22.5Cr16.1Fe6.4. J. Alloys Compd. 2007, 429, 301–305. [Google Scholar] [CrossRef]
  29. Bruzzone, G.; Costa, G.; Ferretti, M.; Olcese, G.L. Hydrogen storage in a beryllium substituted TiFe compound. Int. J. Hydrogen Energy 1980, 5, 317–322. [Google Scholar] [CrossRef]
  30. Yang, T.; Wang, P.; Xia, C.; Liu, N.; Liang, C.; Yin, F.; Li, Q. Effect of chromium, manganese and yttrium on microstructure and hydrogen storage properties of TiFe-based alloy. Int. J. Hydrogen Energy 2020, 45, 12071–12081. [Google Scholar] [CrossRef]
  31. Zadorozhnyy, V.Y.; Klyamkin, S.N.; Zadorozhnyy, M.Y.; Bermesheva, O.V.; Kaloshkin, S.D. Mechanical alloying of nanocrystalline intermetallic compound TiFe doped by aluminum and chromium. J. Alloys Compd. 2014, 586, S56–S60. [Google Scholar] [CrossRef]
  32. Berdonosova, E.A.; Zadorozhnyy, V.Y.; Zadorozhnyy, M.Y.; Geodakian, K.V.; Zheleznyi, M.V.; Tsarkov, A.A.; Kaloshkin, S.D.; Klyamkin, S.N. Hydrogen storage properties of TiFe-based ternary mechanical alloys with cobalt and niobium. A thermochemical approach. Int. J. Hydrogen Energy 2019, 44, 29159–29165. [Google Scholar] [CrossRef]
  33. Johnson, J.R.; Reilly, J.J. The Use of Manganese Substituted Ferrotitanium Alloys for Energy Storage. In Proceedings of the International Conference on Alternative Energy Sources, Miami Beach, FL, USA, 5–7 December 1977. [Google Scholar]
  34. Mintz, M.H.; Vaknin, S.; Biderman, S.; Hadari, Z. Hydrides of ternary TiFexM1−x (M=Cr, Mn, Co, Ni) intermetallics. J. Appl. Phys 1981, 52, 463–467. [Google Scholar] [CrossRef]
  35. Liu, J.; Lundin, C.E. Alloys for Hydrogen Storage. U.S. Patent 4358316, 1982. [Google Scholar]
  36. Mitrokhin, S.V.; Verbetsky, V.N.; Kajumov, R.R.; Cunmao, H.; Yufen, Z. Hydrogen sorption peculiarities in FeTi-type Ti-Fe-V-Mn alloys. J. Alloys Compd. 1993, 199, 155–160. [Google Scholar] [CrossRef]
  37. Massicot, B. Étude du Système Fe–Ti–V et de ses Applications au Stockage de Lߣhydrogène. Ph.D. Thesis, Université Paris-Est, Thiais, France, 2009. [Google Scholar]
  38. Massicot, B.; Joubert, J.M.; Latroche, M. Phase equilibria in the Fe–Ti–V system. Int. J. Mat. Res. 2010, 101, 1414–1423. [Google Scholar] [CrossRef]
  39. TOPAS Version 5; Bruker AXS GmbH: Karlsruhe, Germany, 2014.
  40. Ko, W.S.; Park, K.B.; Park, H.K. Density functional theory study on the role of ternary alloying elements in TiFe-based hydrogen storage alloys. J. Mater. Sci. Technol. 2021, 92, 148–158. [Google Scholar] [CrossRef]
  41. Wenzl, H.; Lebsanft, E. Phase diagram and thermodynamic parameters of the quasibinary interstitial alloy Fe0.5Ti0.5Hx in equilibrium with hydrogen gas. J. Phys. F Met. Phys 1980, 10, 2147–2156. [Google Scholar] [CrossRef]
Figure 1. Horizontal section of a ternary phase diagram of Ti-Fe-V system at 1000 °C [38] overlaid with designed nominal compositions of samples 0–8 and the two compositions B and M from previous studies [2,38]. The shaded region corresponds to a single phase in the B2 structure. The black dashed line is a tentative liquidus surface projection and is a border between the B2 and C14 regions.
Materials 14 04829 g001
Figure 2. WPF plot for the XRD data from samples: (a) 0; (b) 1; (c) 2; (d) 3; (e) 4; (f) 5; (g) 6; (h) 7; (i) 8. The peaks of TiFe, Ce, and CeO2 were indexed. Observed intensity (Iobs), calculated intensity (Ical), and the difference (Iobs–Ical) were plotted in black circles, red line, and blue line, respectively.
Materials 14 04829 g002
Figure 3. Lattice parameter change with composition for the series of the samples, 0→1→3, 0→2→5, and 3→4→5. Sample IDs are annotated. In the legend, V→Ti denotes that V replaces Ti and likewise for the other cases.
Materials 14 04829 g003
Figure 4. SEM BSE images of samples: (a) 0; (b) 1; (c) 2; (d) 3; (e) 4; (f) 5; (g) 6; (h) 7; (i) 8.
Materials 14 04829 g004
Figure 5. SEM BSE image and EDX elemental map of sample 8: (a) BSE image; (b) Ti; (c) Fe; (d) V; (e) Ce; (f) O.
Materials 14 04829 g005
Figure 6. First-cycle activation profile for samples 0–8. The hydrogen pressure inside the closed reactor was recorded for 20 h.
Materials 14 04829 g006
Figure 7. PCI curves for the three series of the samples measured at 30 °C: (a) 0, 1, and 3; (b) 0, 2, and 5; (c) 3, 4, and 5.
Materials 14 04829 g007
Figure 8. Variation of the desorption plateau pressures (a) P1 and (b) P2 for the three series of the samples in Figure 7. Sample IDs are annotated. In the legend, V→Ti denotes that V replaces Ti and likewise for the other cases.
Materials 14 04829 g008
Figure 9. (a) PCI curves for samples 6, 7, and 8 at 30 °C. (b) Comparison of the two independently measured PCI curves for sample 8.
Materials 14 04829 g009
Figure 10. (a) PCI curves for sample 8 at 30, 40, and 50 °C; (b) van’t Hoff plots of the desorption plateau pressures for sample 8. The dashed lines in (b) are the linear regression results and P0 = 1.01325 × 10⁵ Pa.
Materials 14 04829 g010
Table 1. Nominal composition of the samples from 0 to 8. The subscripts indicate at% of the corresponding elements. Third and fourth columns show atom distribution at the Ti and Fe sublattices.
Sample IDNominal CompositionTi SublatticeFe Sublattice
0Ti51Fe49Ti50Fe49Ti1
1Ti50Fe49V1Ti50Fe49V1
2Ti51Fe48V1Ti50Fe48Ti1V1
3Ti49Fe49V2Ti49V1Fe49V1
4Ti50Fe48V2Ti50Fe48V2
5Ti51Fe47V2Ti50Fe47Ti1V2
6Ti46.5Fe48V5.5Ti46.5V3.5Fe48V2
7Ti46.5Fe47.5V6Ti46.5V3.5Fe47.5V2.5
8Ti46Fe47.5V6.5Ti46V4Fe47.5V2.5
Table 2. XRD analysis of the samples. The lattice parameter of the TiFe main phase and the phase fractions determined by the Rietveld refinement of the XRD data in Figure 2. The weighted profile R-factor (Rwp) and the goodness of fit (χ2) are listed to show the quality of the fit.
Sample IDNominal
Composition
Lattice
Parameter (Å)
Phase Fraction (wt.%)Rwp (%)χ2
TiFeCeCeO2
0Ti51Fe492.98327 (5)96.9 (2)1.3 (1)1.8 (2)3.522.83
1Ti50Fe49V12.98241 (7)97.2 (2)1.4 (1)1.4 (2)3.412.15
2Ti51Fe48V12.98764 (6)97.2 (3)1.1 (1)1.7 (3)4.072.57
3Ti49Fe49V22.98058 (7)97.5 (2)0.9 (1)1.6 (1)3.092.00
4Ti50Fe48V22.98690 (6)96.8 (3)1.3 (1)1.9 (3)3.282.10
5Ti51Fe47V22.99072 (6)97.5 (2)1.0 (1)1.5 (1)3.542.21
6Ti46.5Fe48V5.52.98008 (6)96.7 (2)1.2 (1)2.1 (2)3.291.93
7Ti46.5Fe47.5V62.98179 (6)96.9 (2)1.0 (1)2.1 (2)3.041.79
8Ti46Fe47.5V6.52.98122 (7)96.5 (2)1.1 (1)2.4 (2)3.261.89
Table 3. Phase analysis of the samples from the SEM micrographs. The phase fractions from the BSE images.
Sample IDNominal CompositionPhase Fraction (Area%)
GrayWhite
0Ti51Fe4996.93.1
1Ti50Fe49V196.93.1
2Ti51Fe48V197.42.6
3Ti49Fe49V297.03.0
4Ti50Fe48V296.53.5
5Ti51Fe47V297.22.8
6Ti46.5Fe48V5.597.03.0
7Ti46.5Fe47.5V696.83.2
8Ti46Fe47.5V6.597.03.0
Publisher’s Note: MDPI stays neutral with regard to jurisdictional claims in published maps and institutional affiliations.

