
Electrochemical Investigation of Curcumin–DNA Interaction by Using Hydroxyapatite Nanoparticles–Ionic Liquids Based Composite Electrodes


Abstract
:
1. Introduction
2. Materials and Methods
2.1. Instruments
2.2. Chemicals
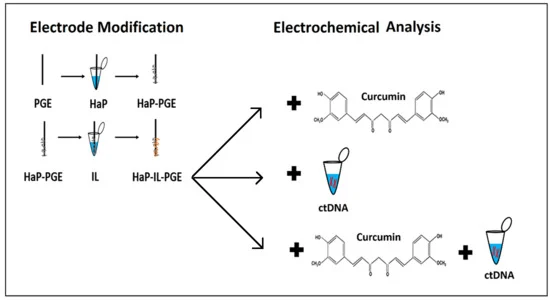
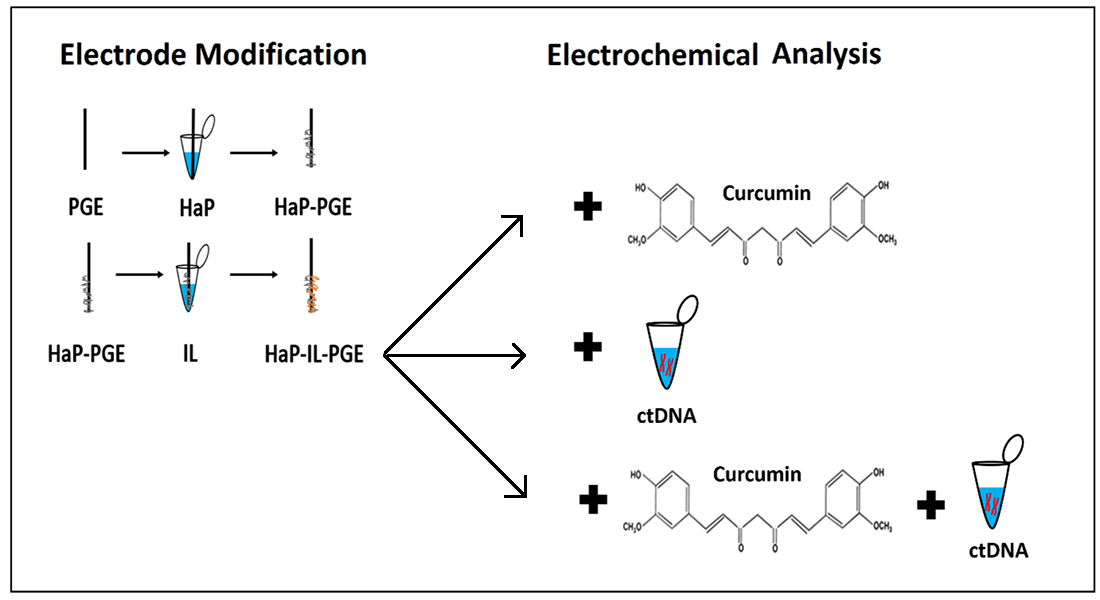
2.3. Procedure
- (i)
- Electrochemical pretreatment of PGEs;
- (ii)
- Surface modification of PGE with HaP and IL, respectively;
- (iii)
- ctDNA (calf thymus double-stranded DNA) immobilization onto the surface of HaP-IL-PGE;
- (iv)
- Electrochemical detection of curcumin–ctDNA interaction by HaP-IL-PGE.
2.3.1. Preparation of HaP-PGEs
2.3.2. Preparation of HaP-IL-PGE
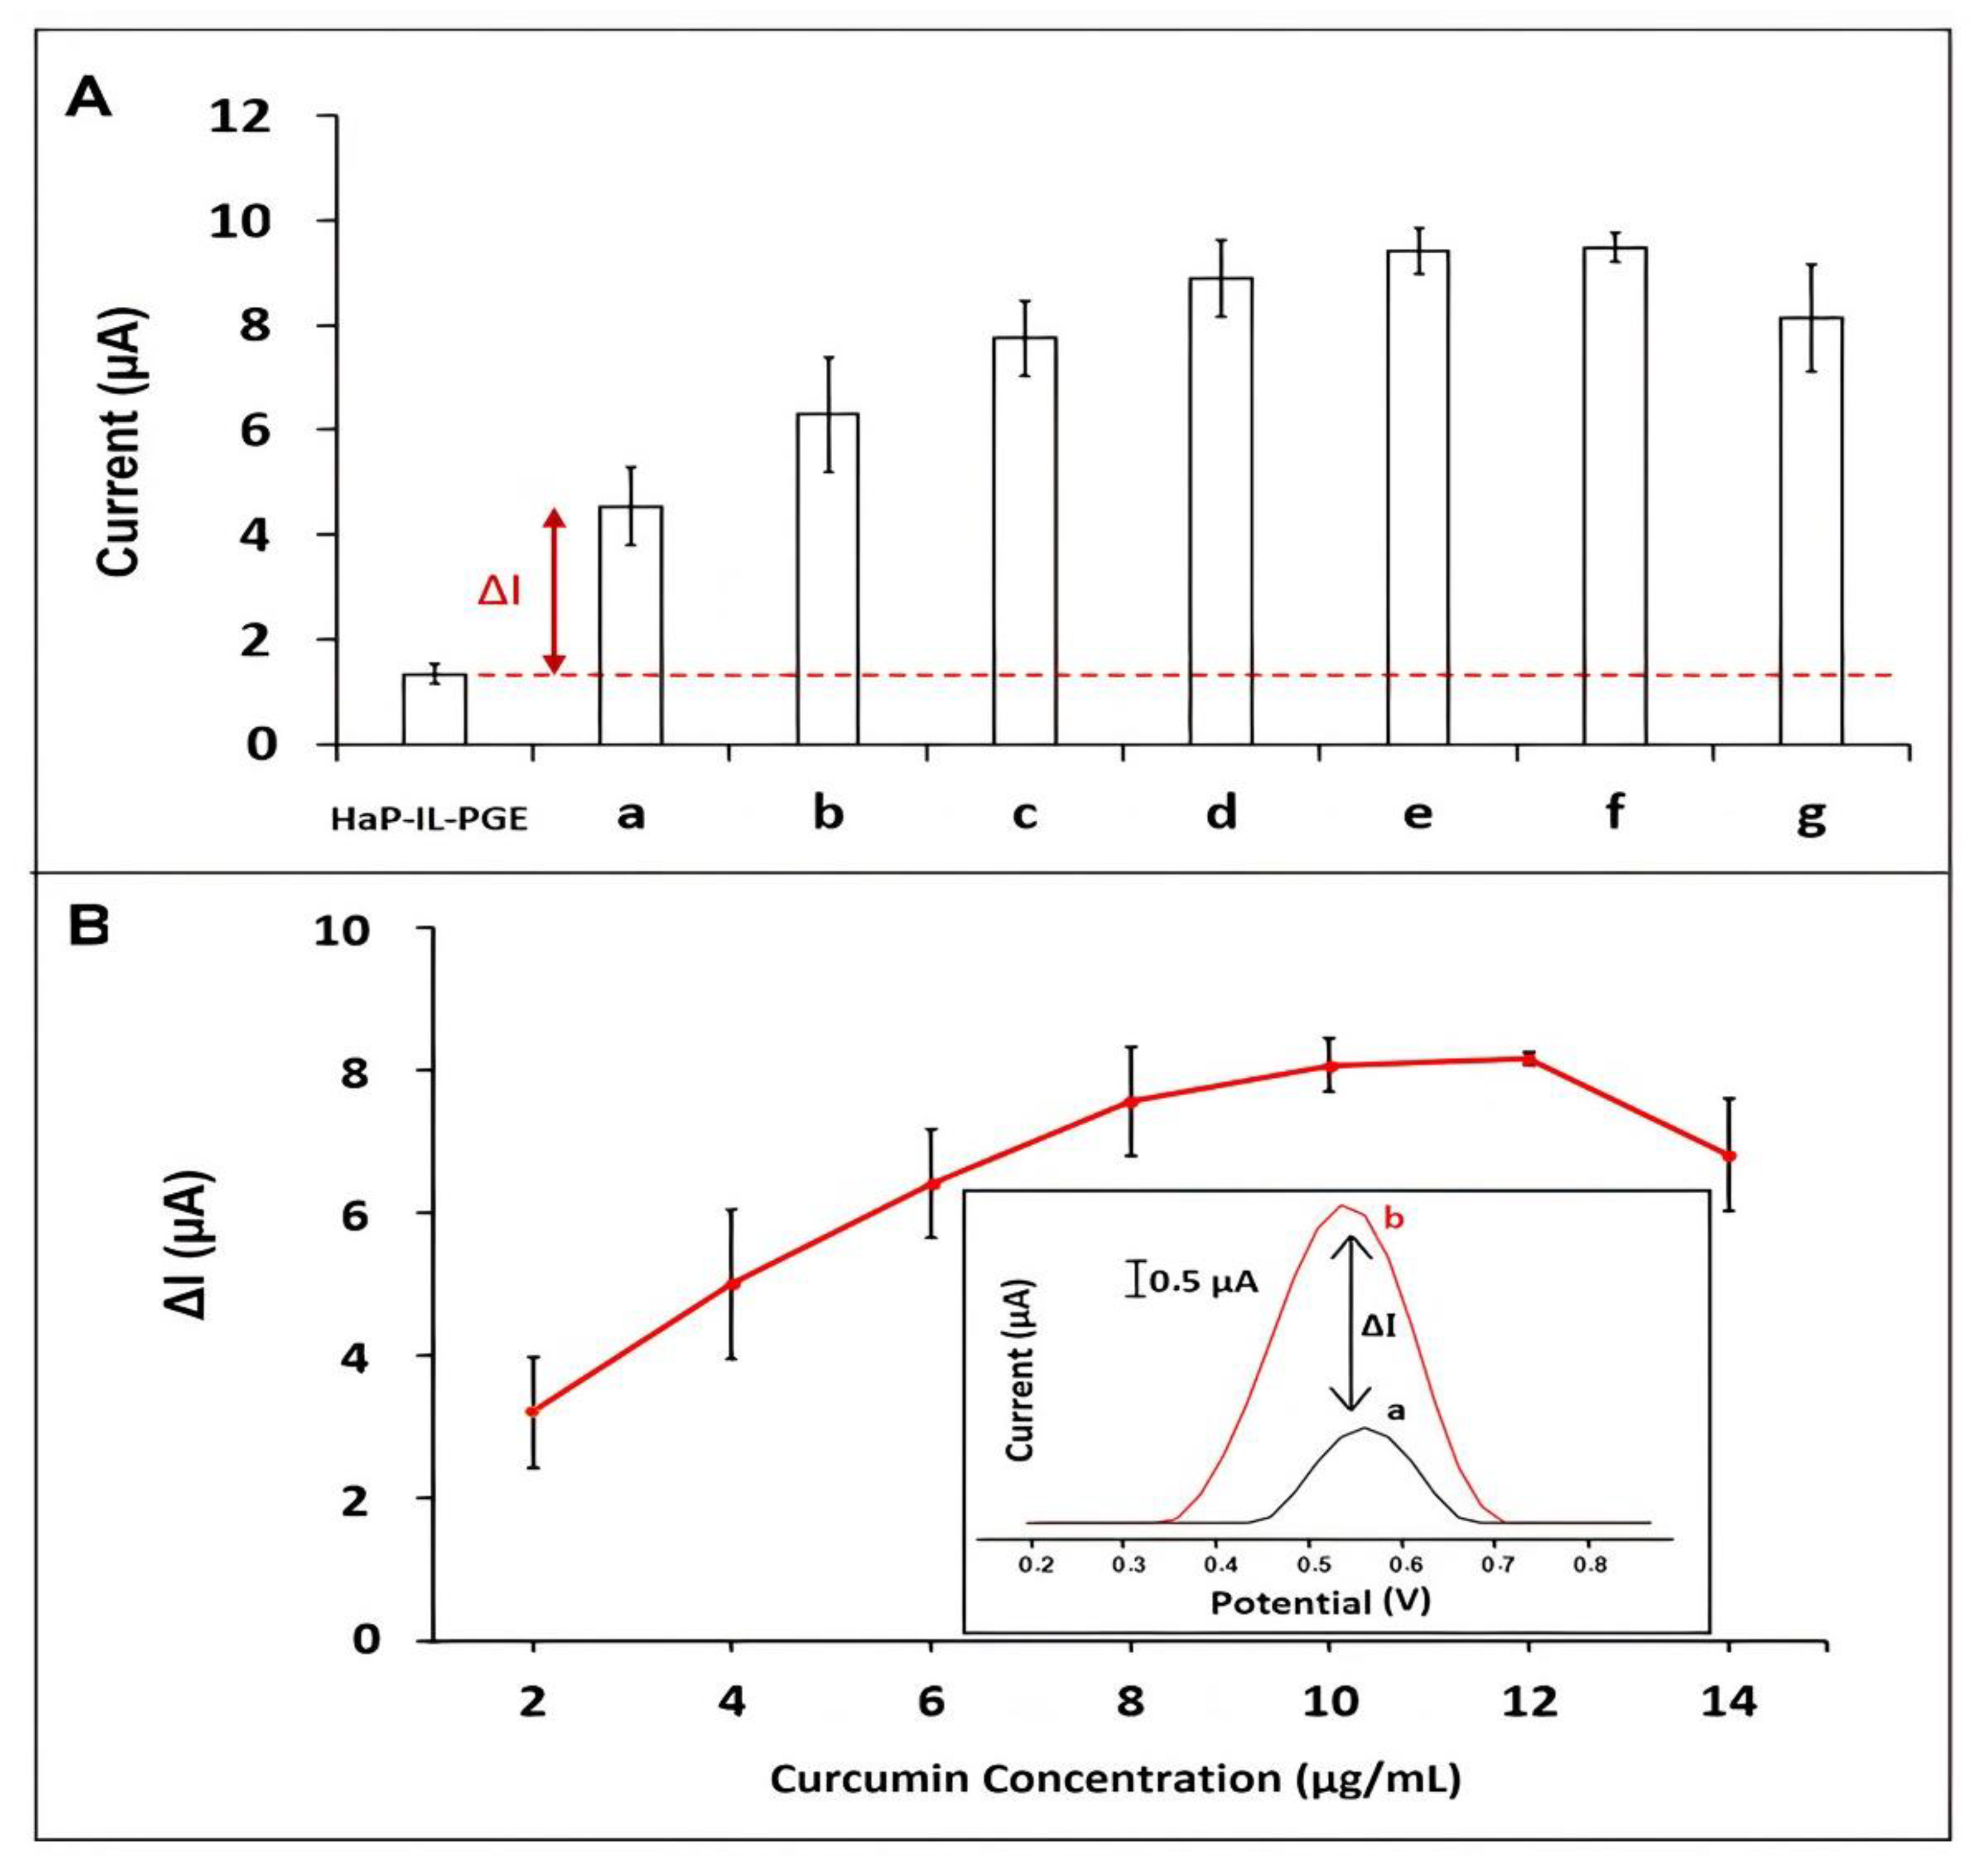
2.3.3. Curcumin Immobilization on HaP-IL-PGEs
2.3.4. ctDNA Immobilization on HaP-IL-PGEs
2.3.5. Interaction of Curcumin with ctDNA at the Surface of HaP-IL-PGEs
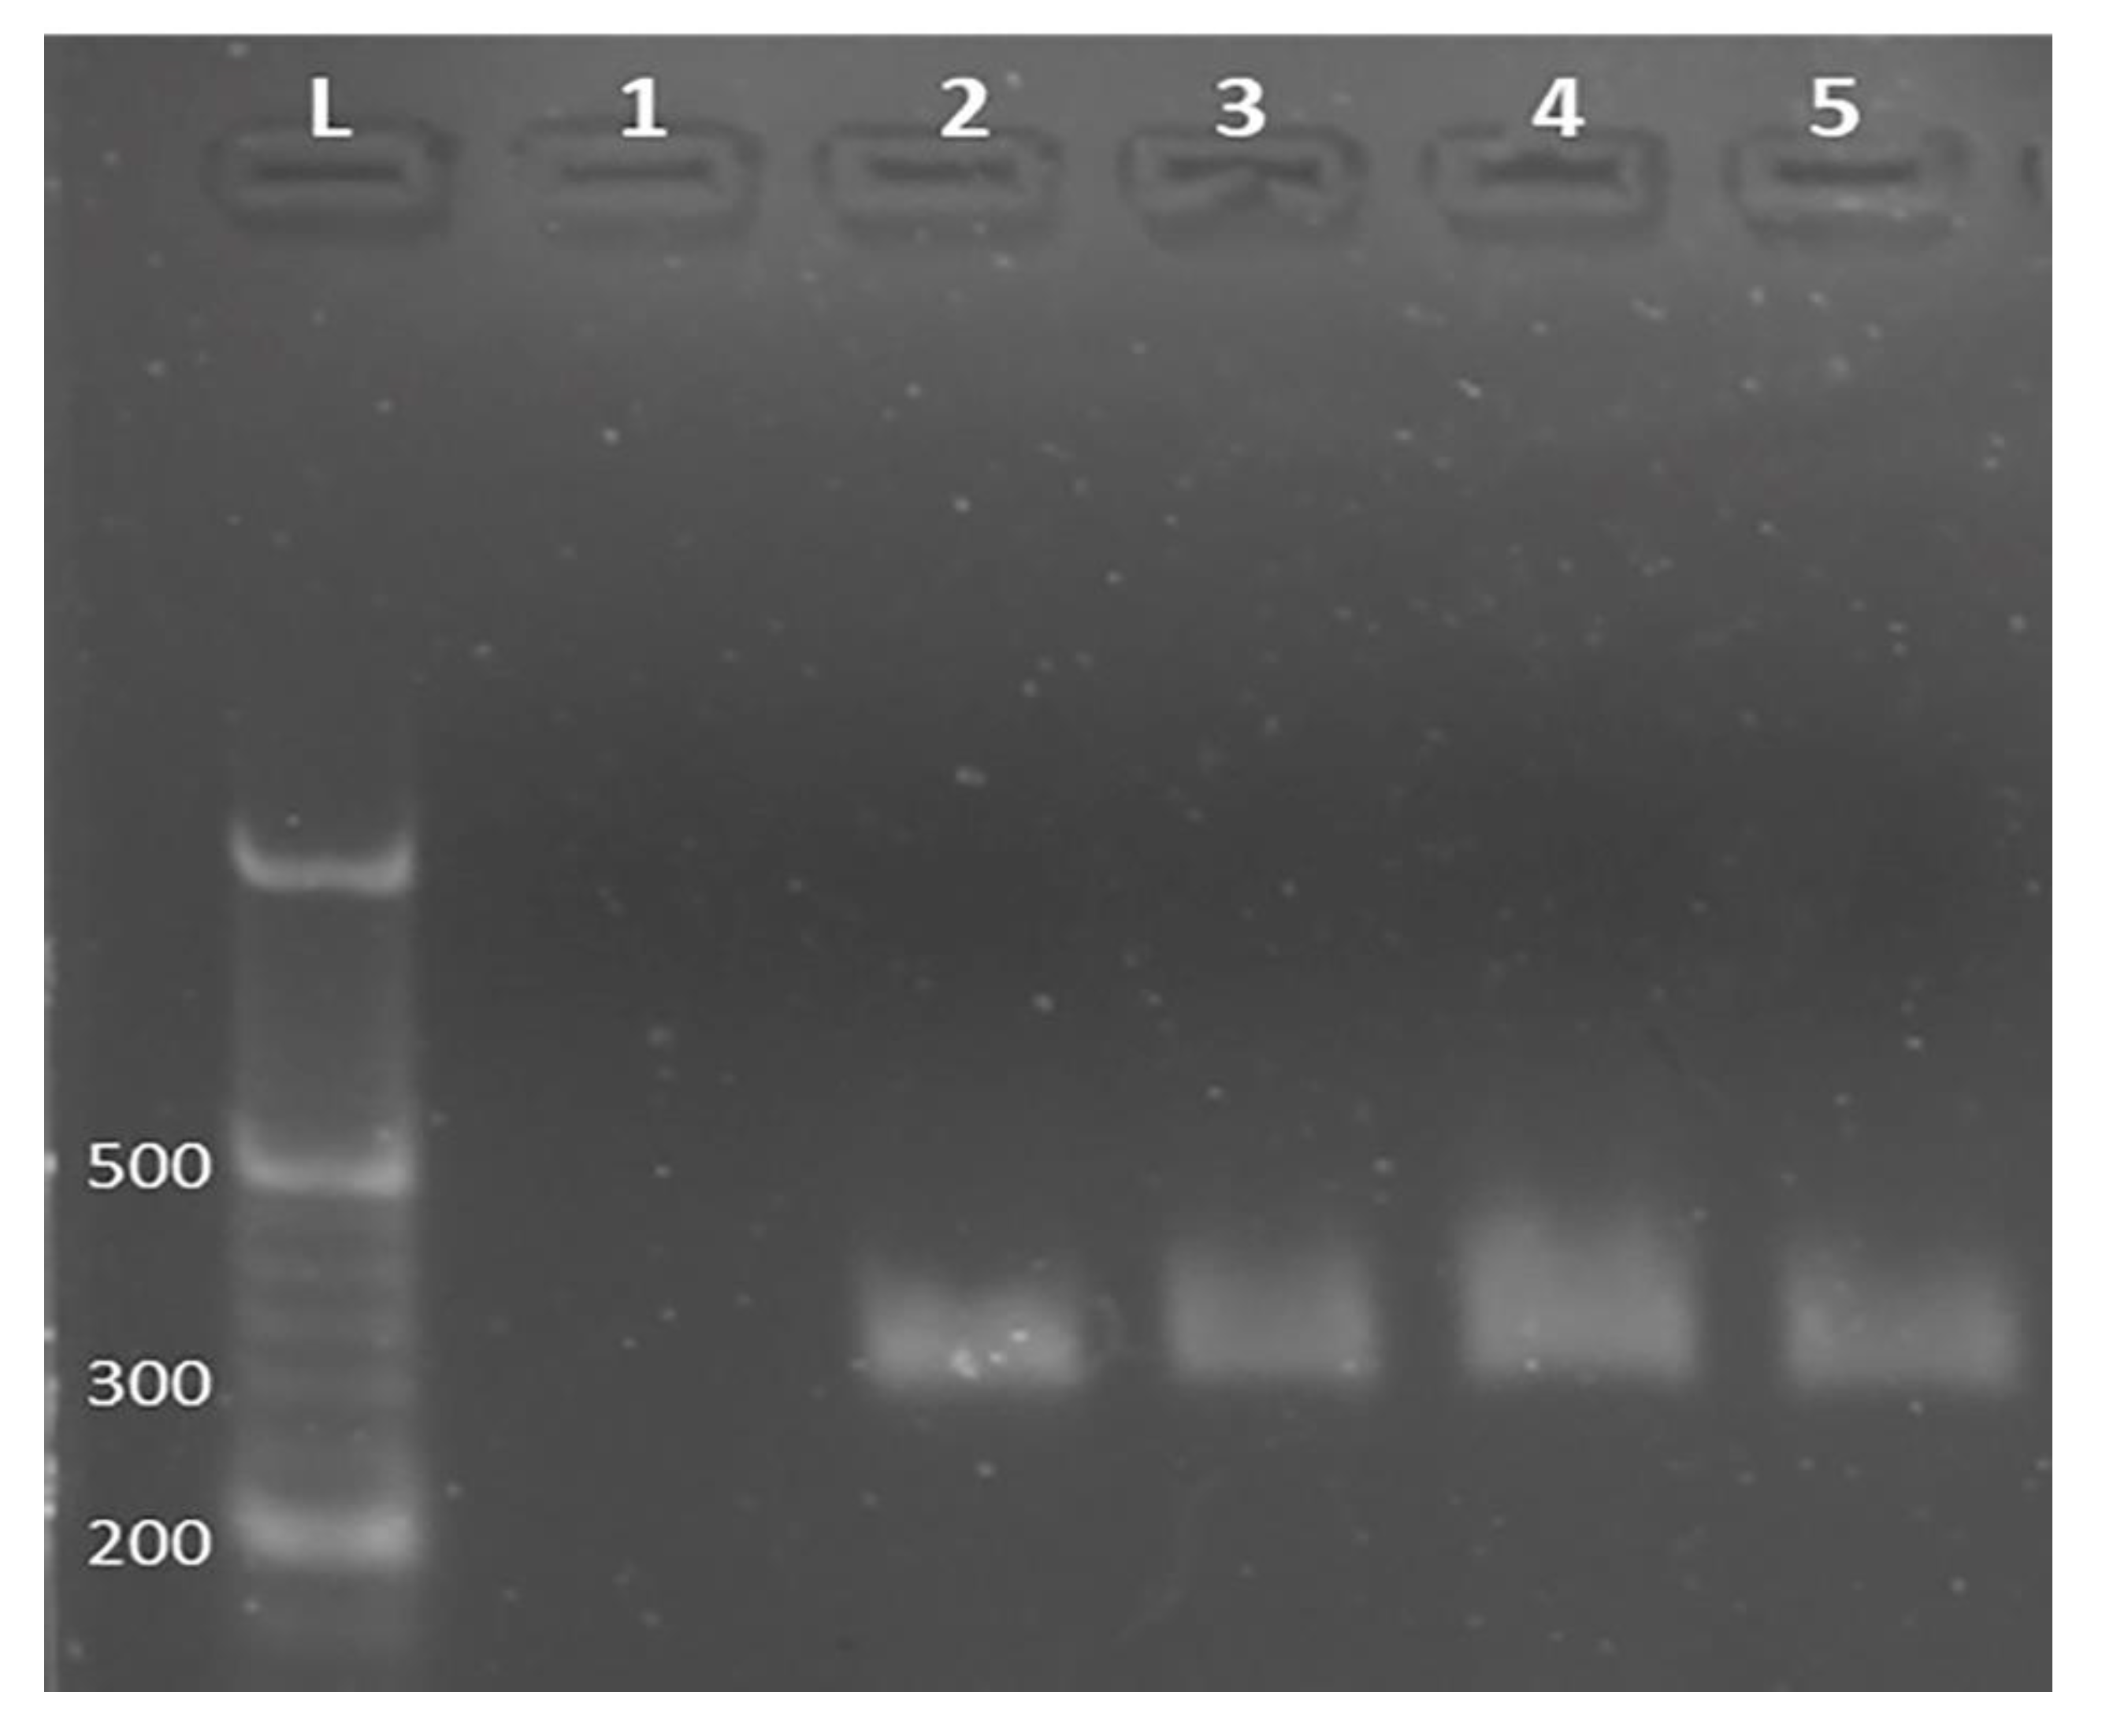
2.3.6. Preparation of PCR Samples
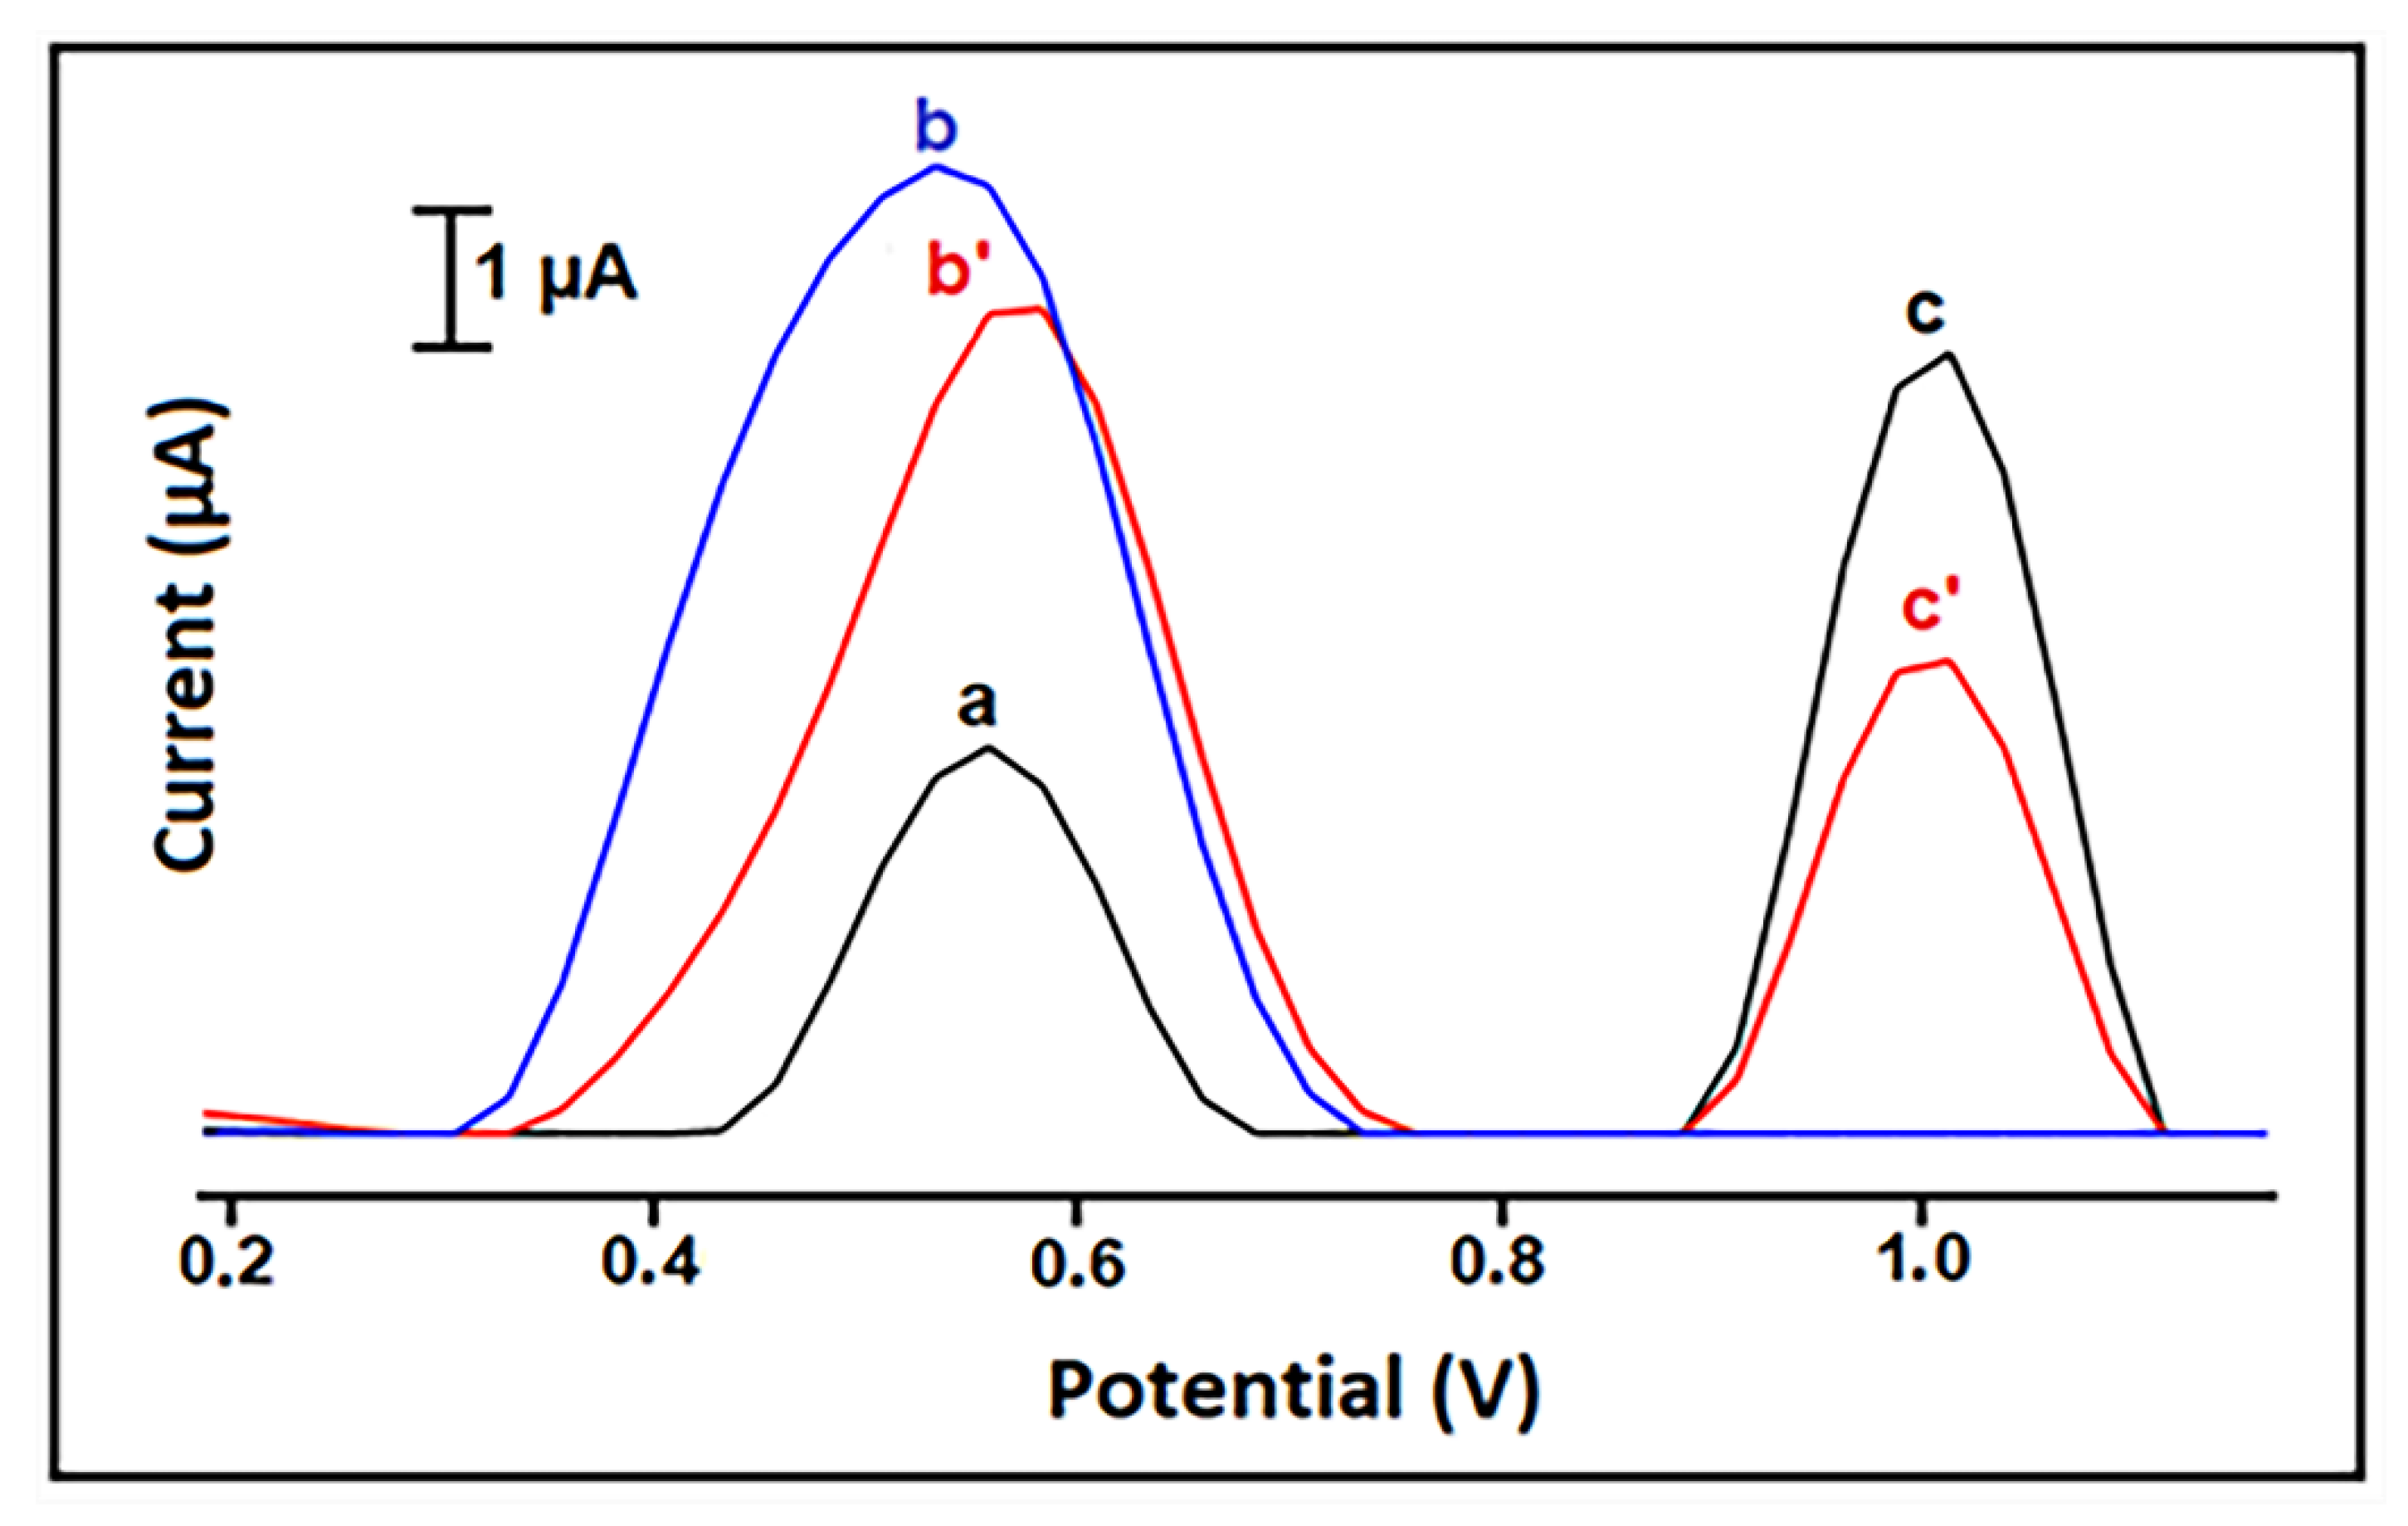
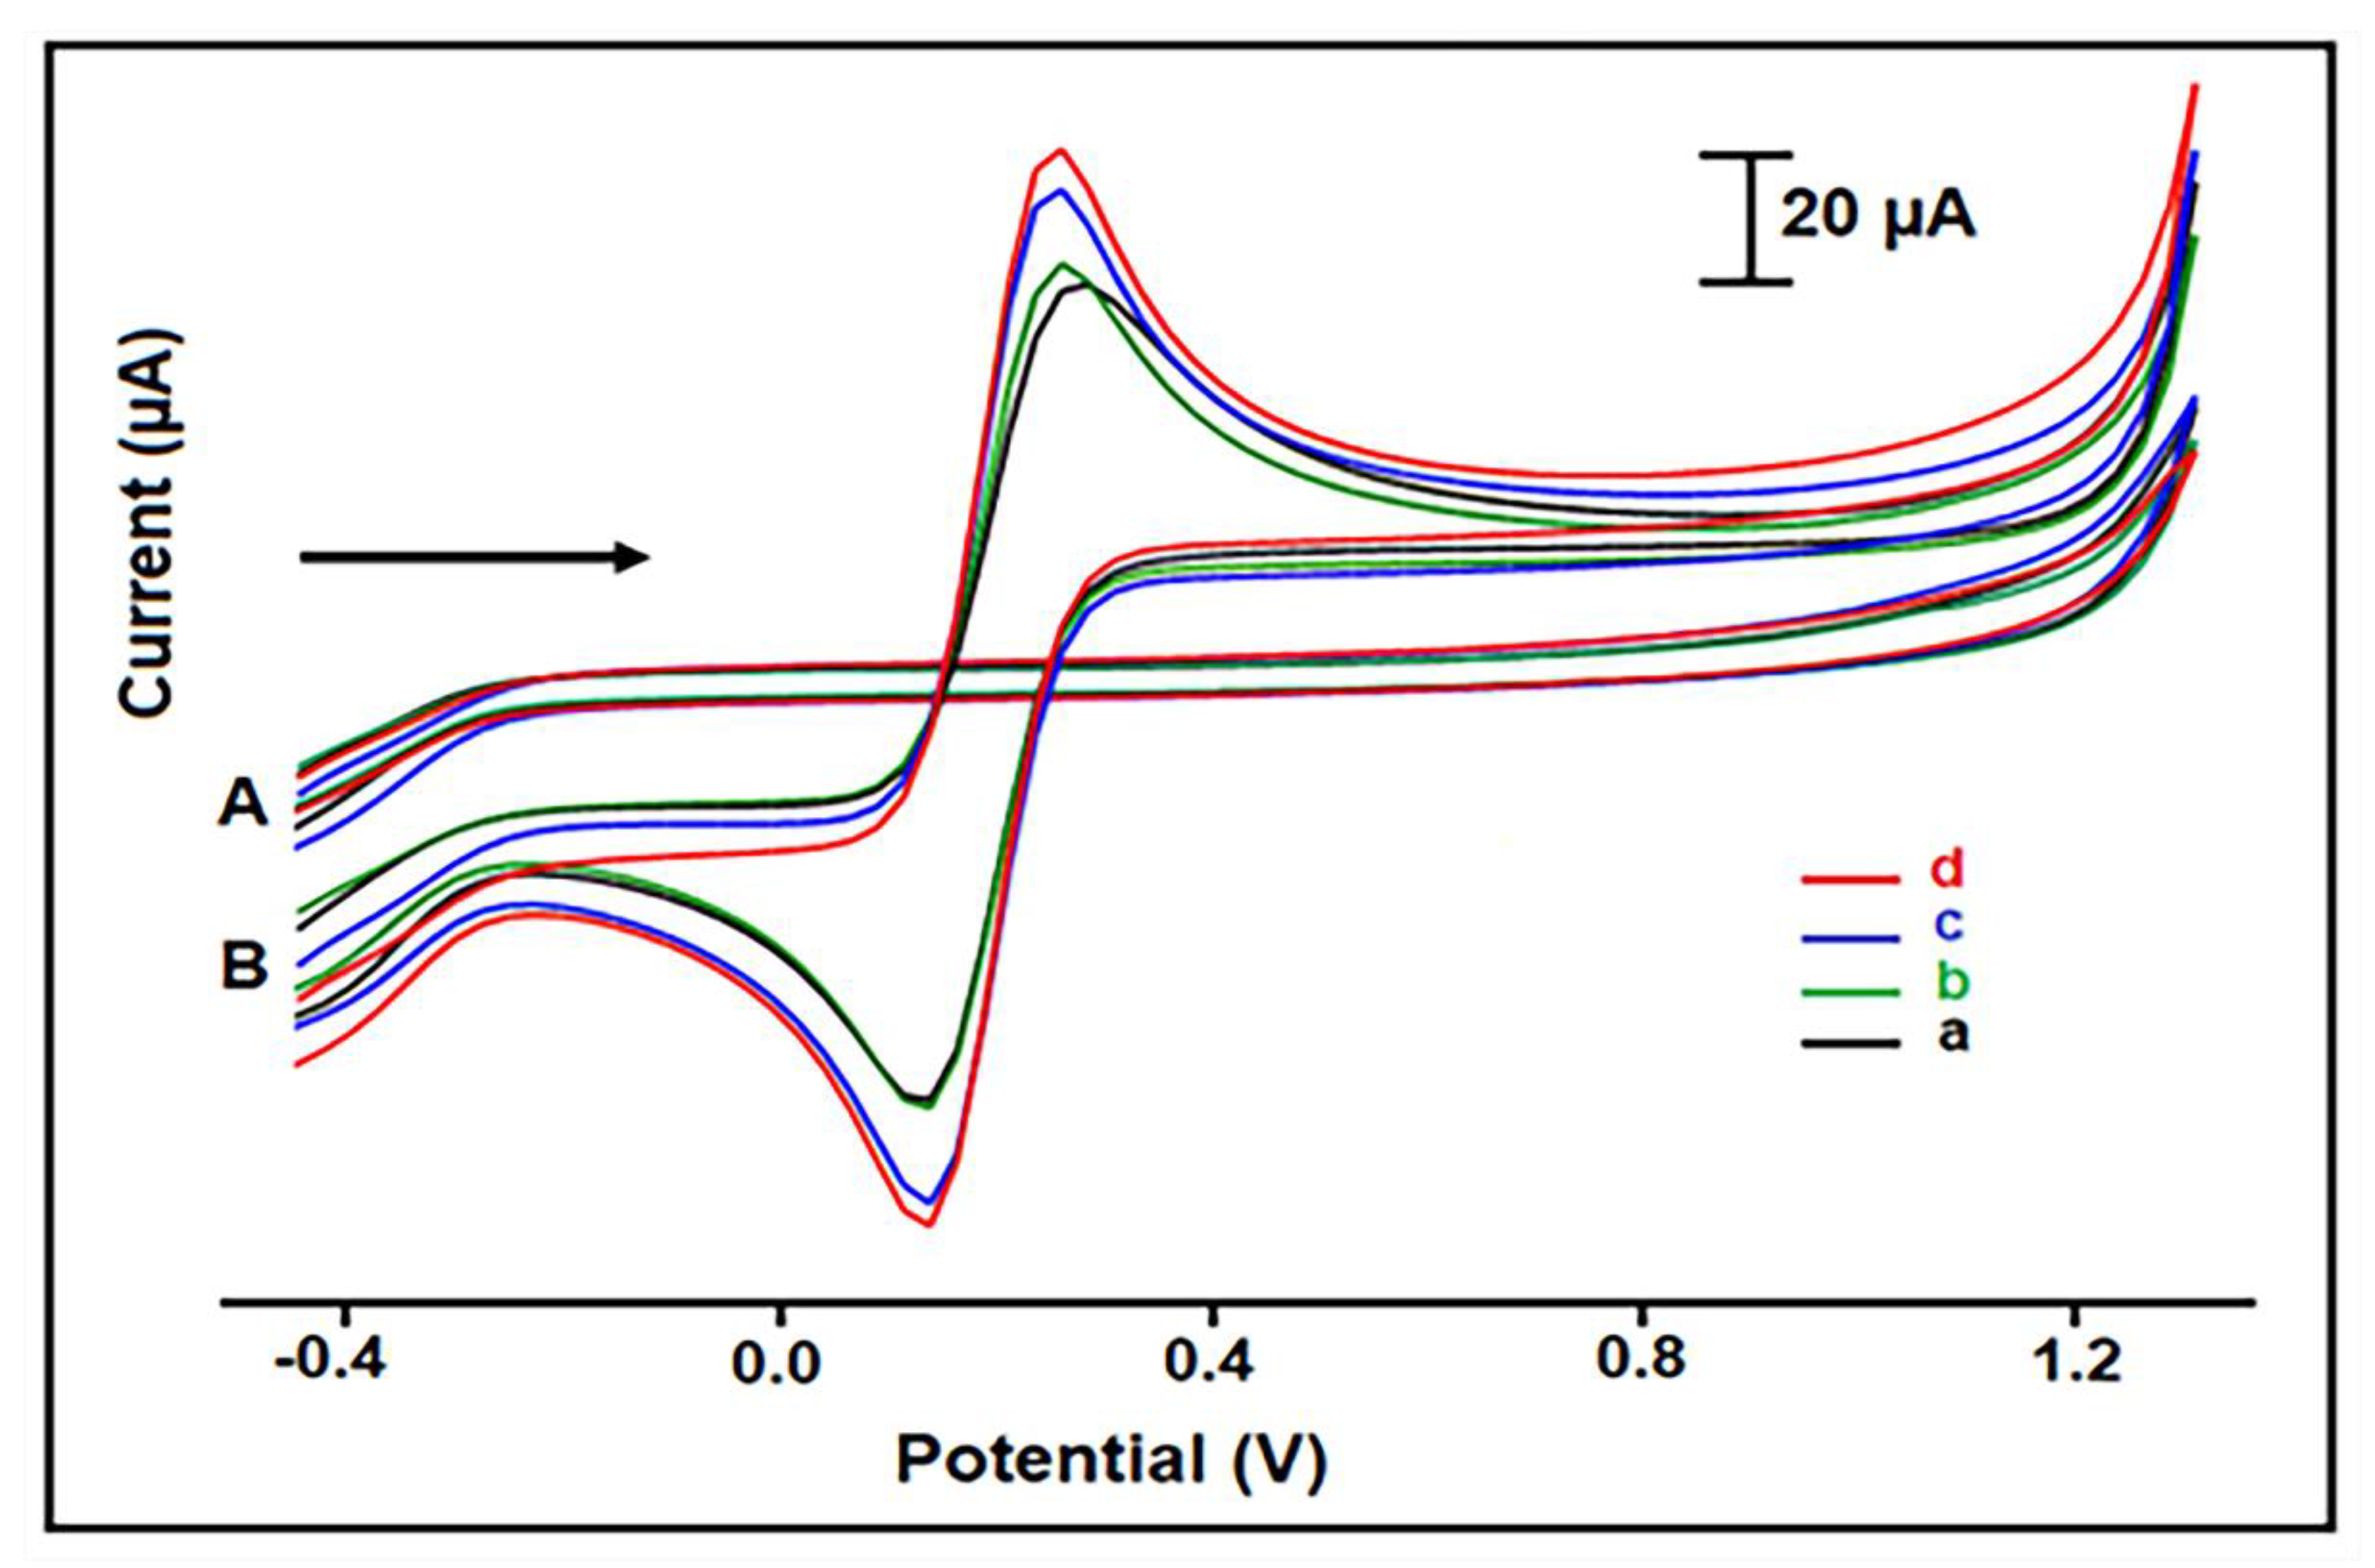
2.4. Electrochemical Measurements
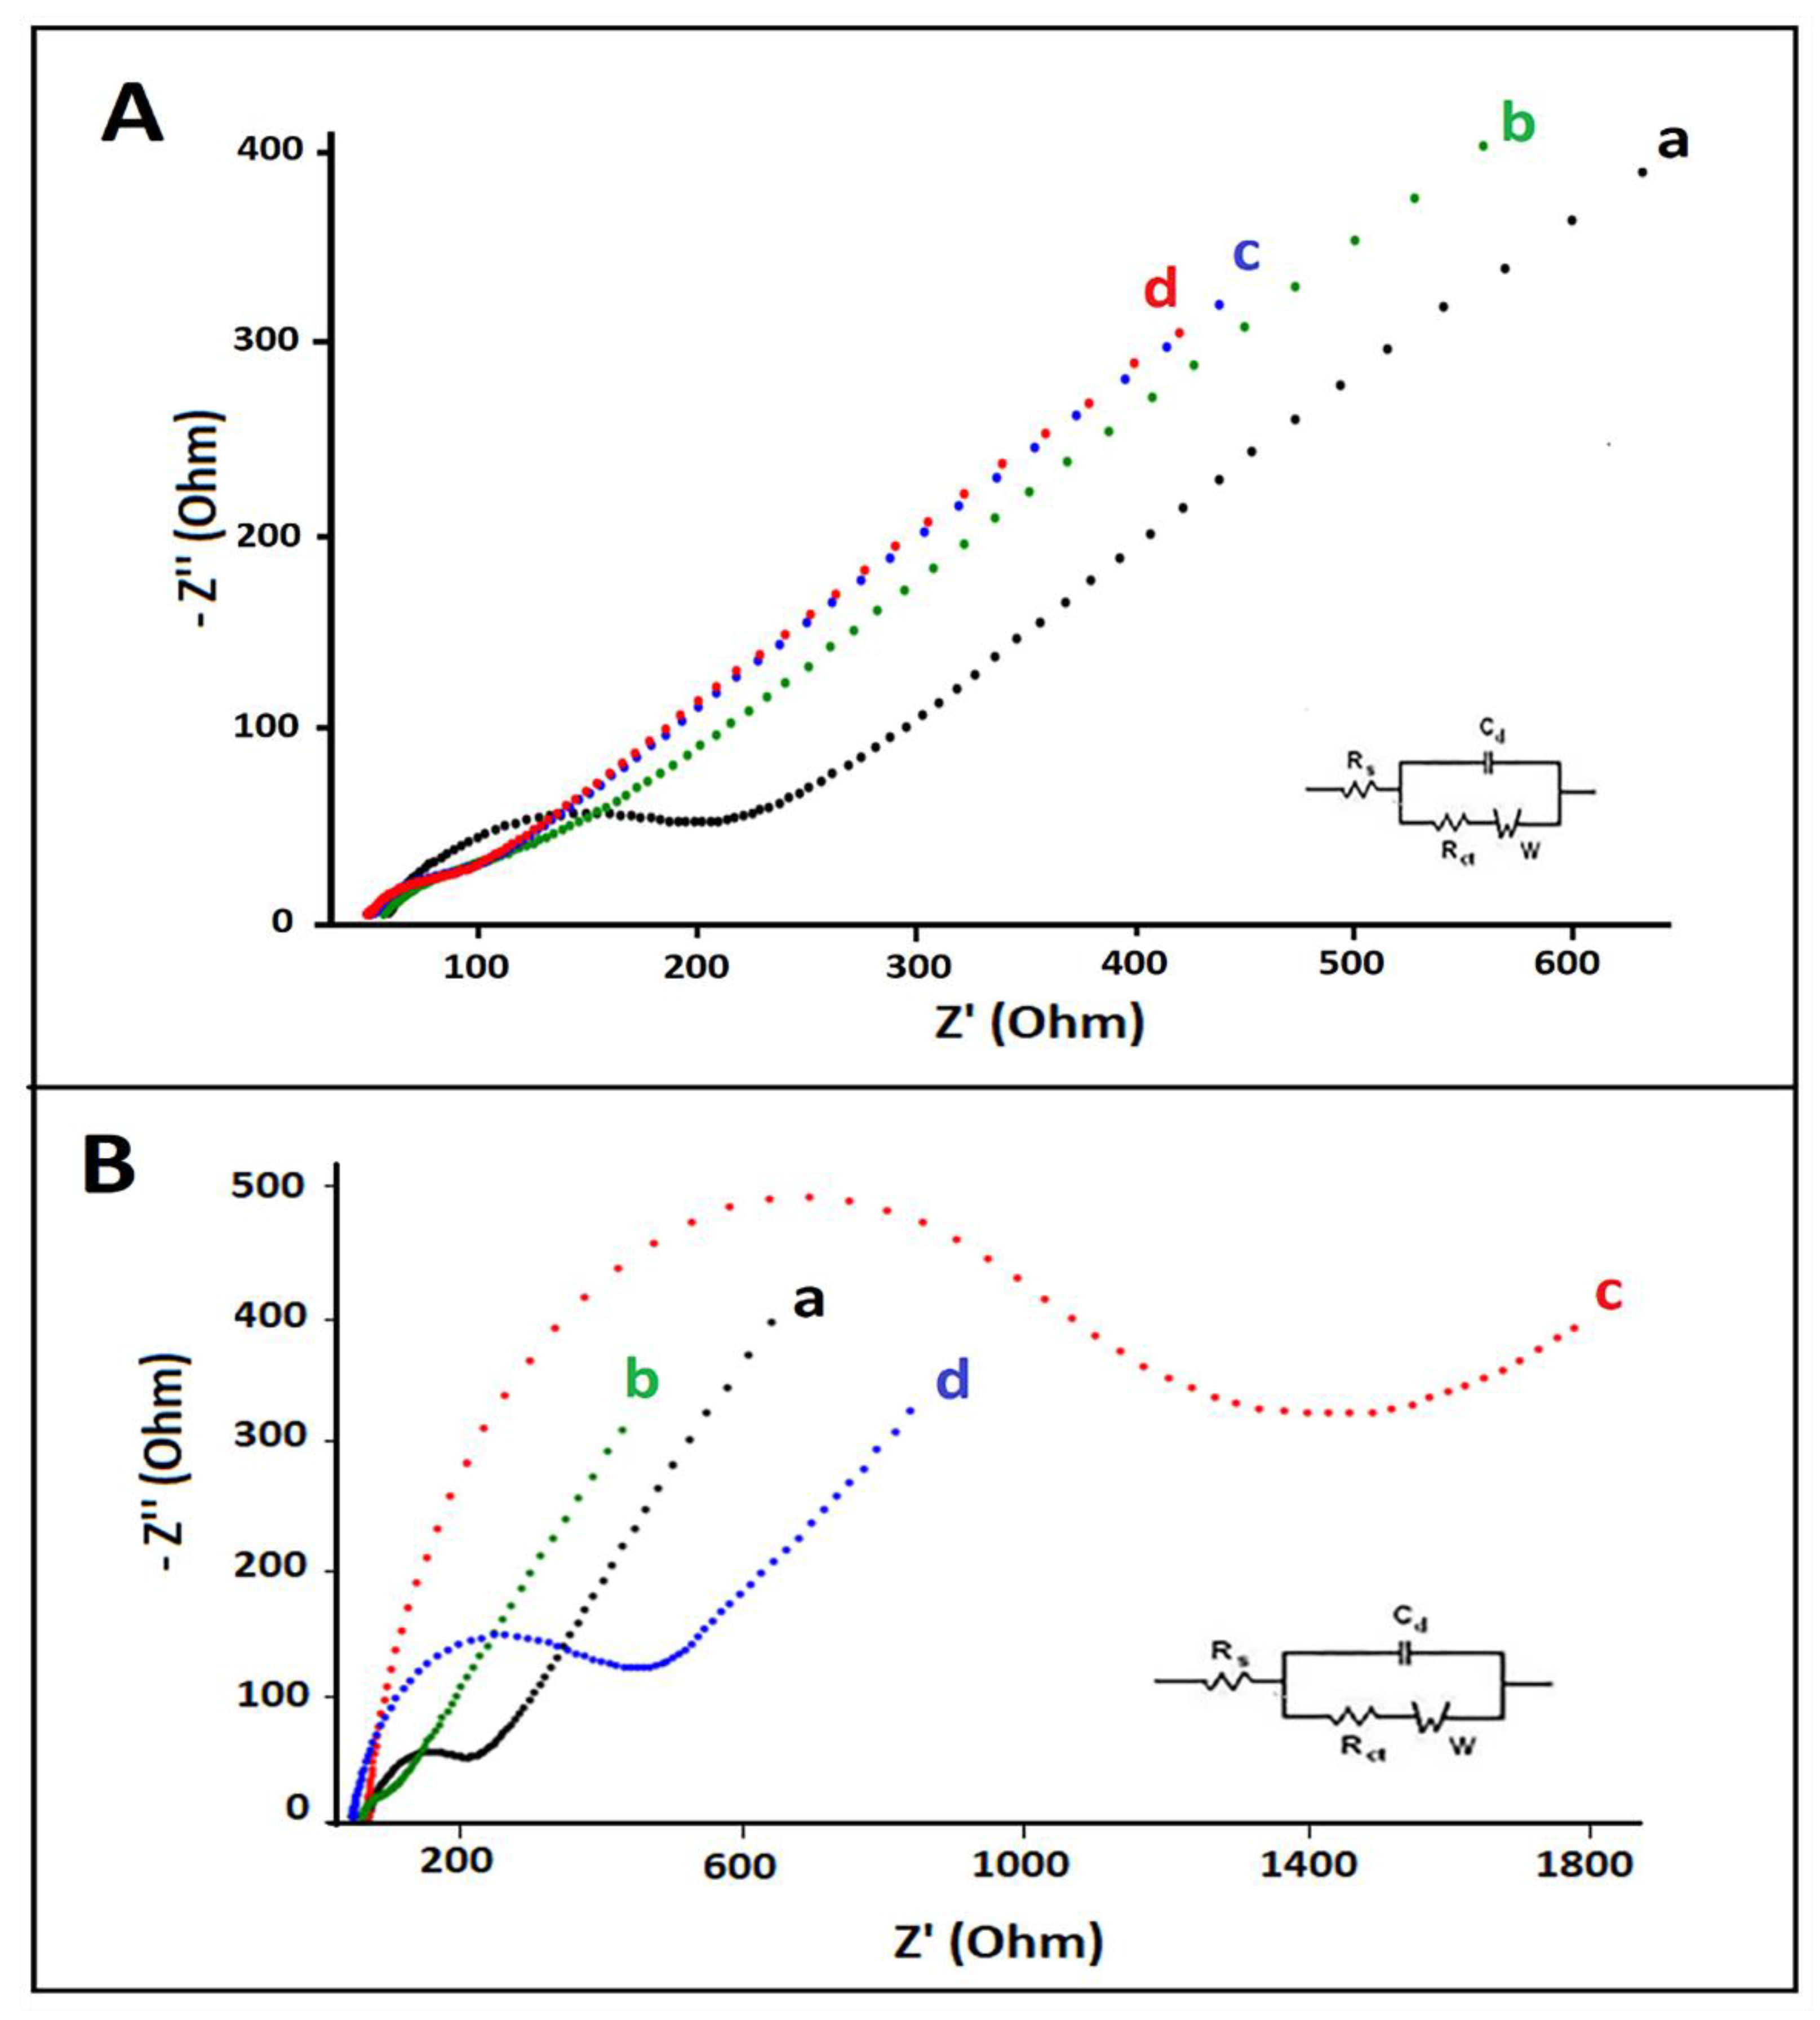
2.5. Impedimetric Measurements
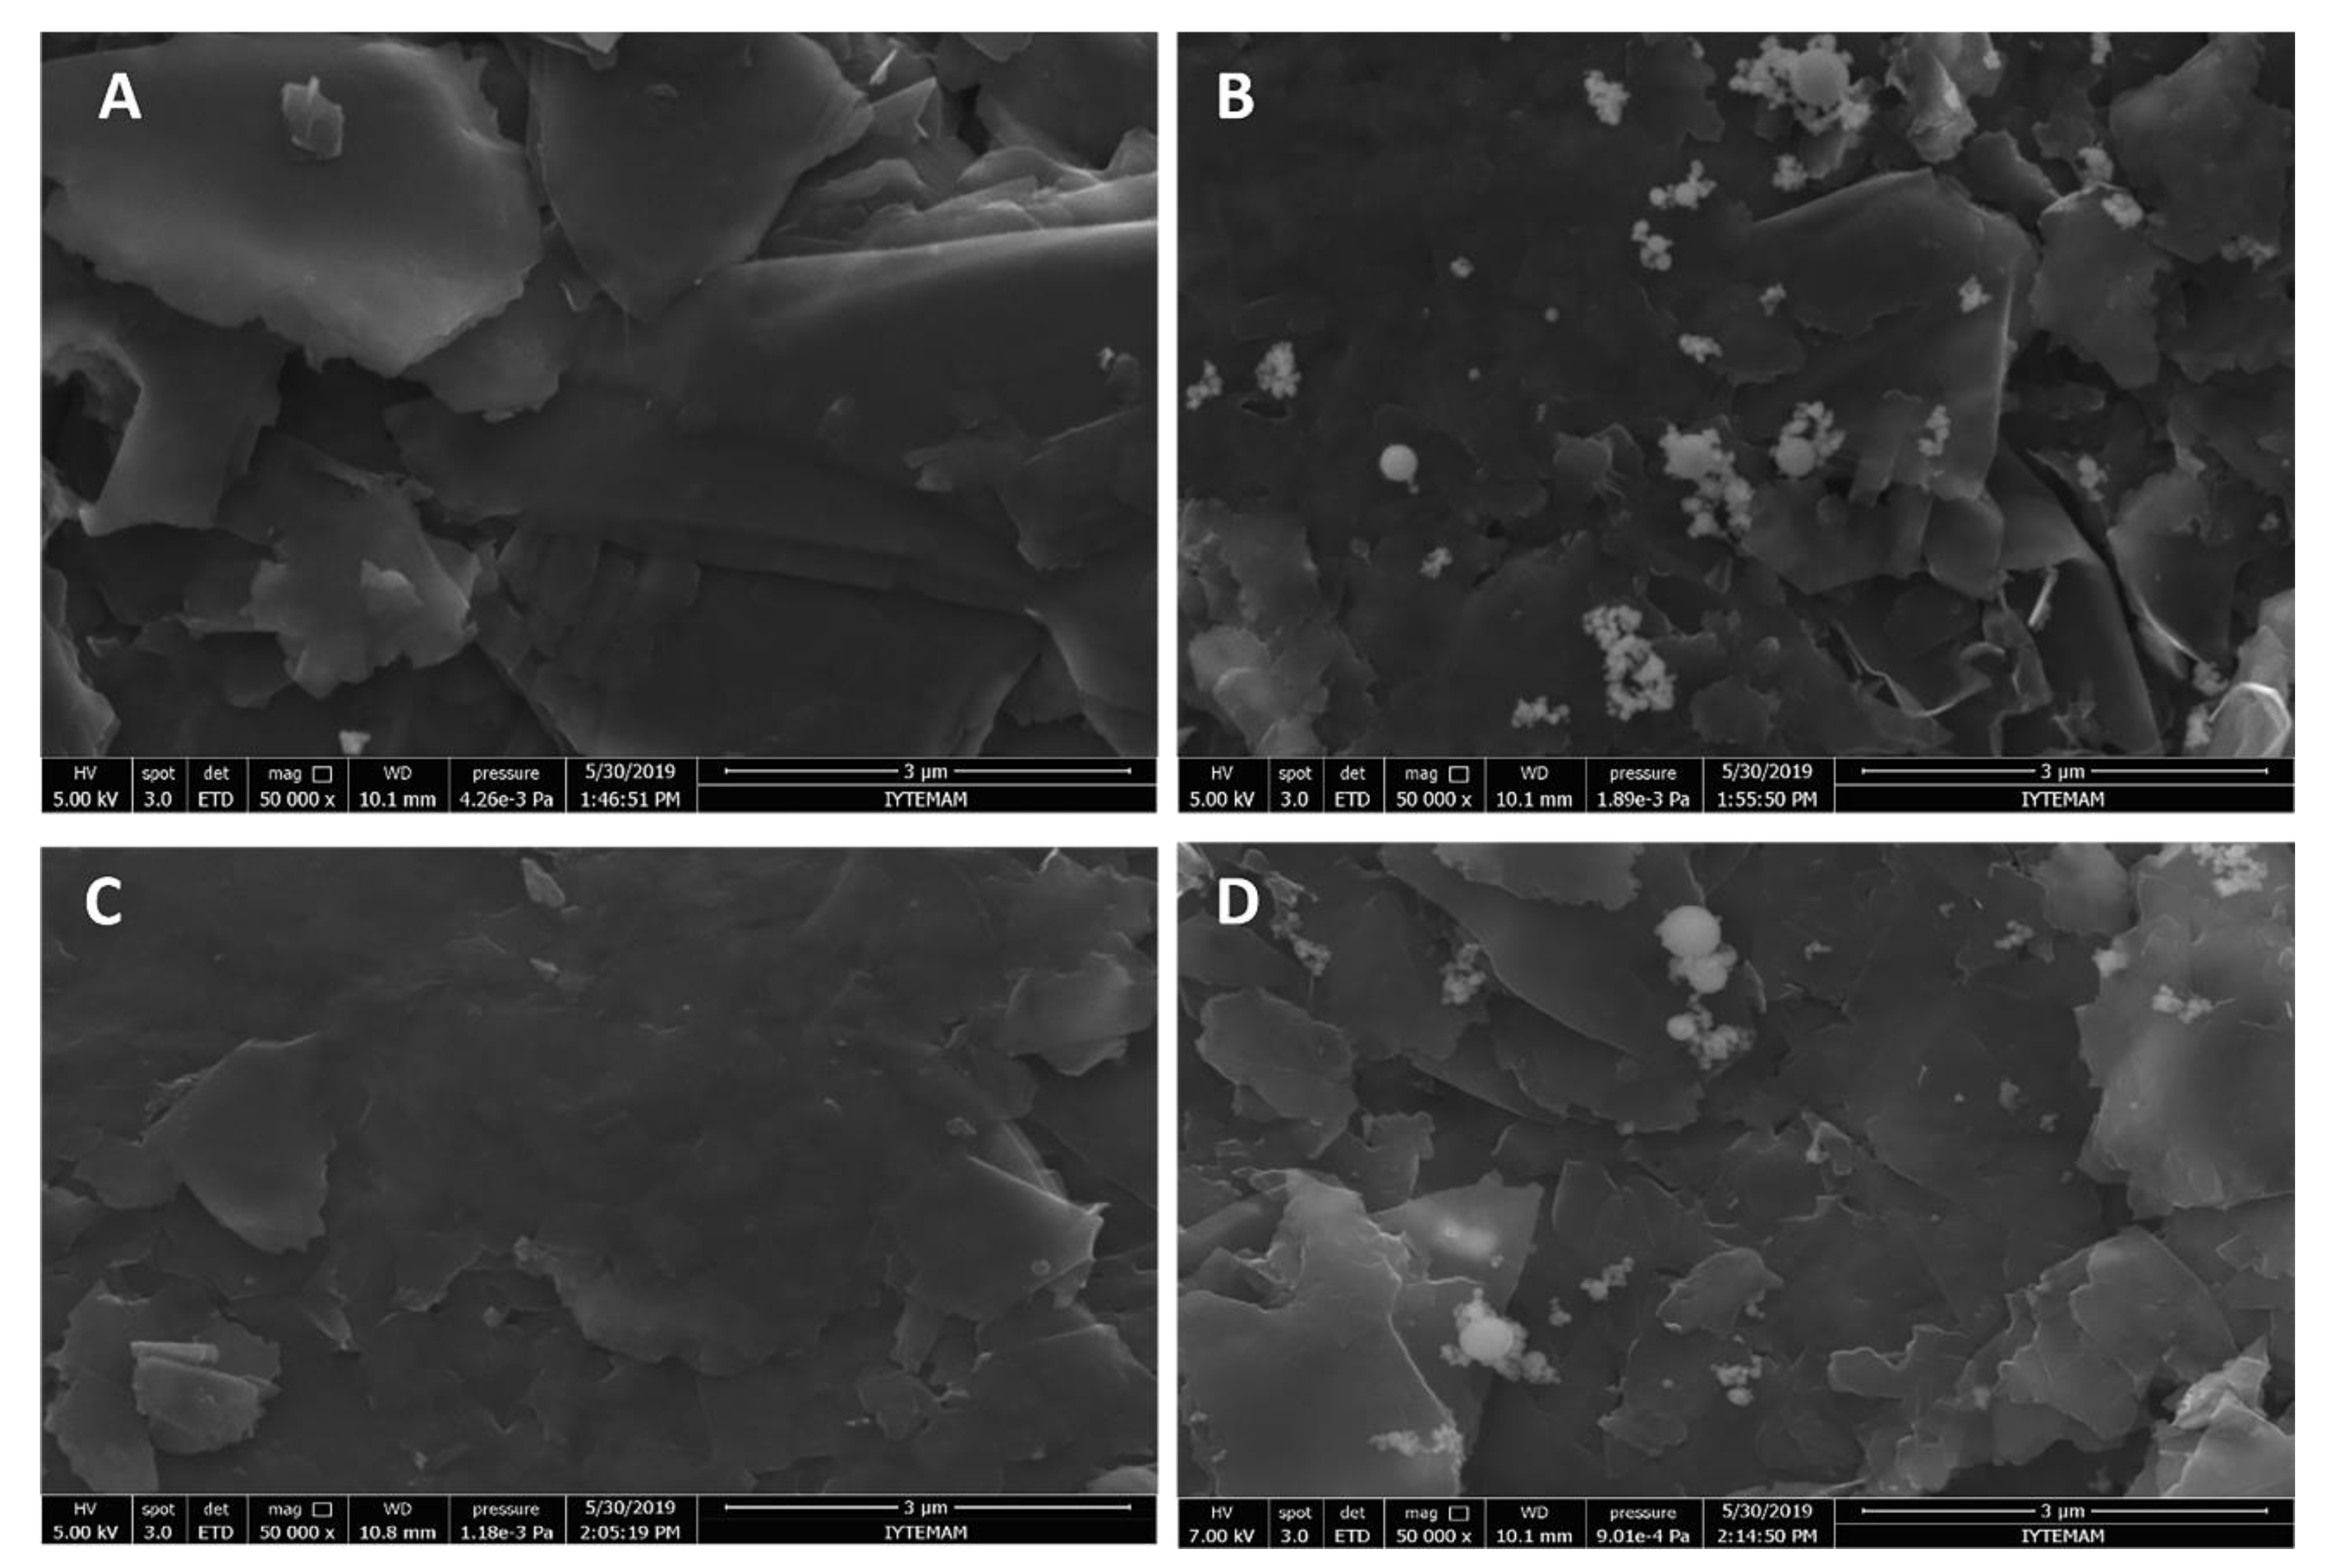
2.6. Microscopic Characterization
2.7. Gel Electrophoresis
3. Results and Discussion
4. Conclusions
Supplementary Materials
Author Contributions
Funding
Institutional Review Board Statement
Informed Consent Statement
Data Availability Statement
Acknowledgments
Conflicts of Interest
References
- Teles, F.R.R.L.; Fonseca, P. Trends in DNA biosensors. Talanta 2008, 77, 606–623. [Google Scholar] [CrossRef]
- Kerman, K.; Kobayashi, M.; Tamiya, E. Recent trends in electrochemical DNA biosensor technology. Meas. Sci. Technol. 2003, 15, R1. [Google Scholar] [CrossRef] [Green Version]
- Erdem, A.; Muti, M.; Mese, F.; Eksin, E. Chitosan–ionic liquid modified single-use sensor for electrochemical monitoring of sequence-selective DNA hybridization. Colloids Surf. B Biointerfaces 2014, 114, 261–268. [Google Scholar] [CrossRef] [PubMed]
- Rassaei, L.; Marken, F.; Sillanpää, M.; Amiri, M.; Cirtiu, C.M.; Sillanpää, M. Nanoparticles in electrochemical sensors for environmental monitoring. TrAC Trend. Anal. Chem. 2011, 30, 1704–1715. [Google Scholar] [CrossRef]
- Erdem, A. Nanomaterial-based electrochemical DNA sensing strategies. Talanta 2007, 74, 318–325. [Google Scholar] [CrossRef]
- El-Maghrabi, H.H.; Younes, A.A.; Salem, A.R.; Rabie, K.; El-Shereafy, E.S. Magnetically modified hydroxyapatite nanoparticles for the removal of Uranium (VI): Preparation, characterization and adsorption optimization. J. Hazar. Mater. 2019, 378. [Google Scholar] [CrossRef]
- Erdem, A.; Congur, G. Hydroxyapatite nanoparticles modified graphite electrodes for electrochemical DNA detection. Electroanalysis 2018, 30, 67–74. [Google Scholar] [CrossRef]
- Kanchana, P.; Sekar, C. Development of electrochemical folic acid sensor based on hydroxyapatite nanoparticles. Spectrochim. Acta A Mol. Biomol. Spectrosc. 2015, 137, 58–65. [Google Scholar] [CrossRef]
- Yang, Z.; Shang, X.; Zhang, C.; Zhu, J. Photoelectrochemical bilirubin biosensor based on Fe3O4/hydroxyapatite/molecularly imprinted polypyrrole nanoparticles. Sens. Actuators B Chem. 2014, 201, 167–172. [Google Scholar] [CrossRef]
- You, J.; Ding, W.; Ding, S.; Ju, H. Direct electrochemistry of hemoglobin immobilized on colloidal gold-hydroxyapatite nanocomposite for electrocatalytic detection of hydrogen peroxide. Electroanal. Int. J. Devoted Fundam. Pract. Asp. Electroanal. 2009, 21, 190–195. [Google Scholar] [CrossRef]
- Ding, Y.; Liu, J.; Wang, H.; Shen, G.; Yu, R. A piezoelectric immunosensor for the detection of α-fetoprotein using an interface of gold/hydroxyapatite hybrid nanomaterial. Biomaterials 2007, 28, 2147–2154. [Google Scholar] [CrossRef] [PubMed]
- Kanchana, P.; Lavanya, N.; Sekar, C. Development of amperometric L-tyrosine sensor based on Fe-doped hydroxyapatite nanoparticles. Mater. Sci. Eng. C 2014, 35, 85–91. [Google Scholar] [CrossRef] [PubMed]
- Kanchana, P.; Navaneethan, M.; Sekar, C. Fabrication of Ce doped hydroxyapatite nanoparticles based non-enzymatic electrochemical sensor for the simultaneous determination of norepinephrine, uric acid and tyrosine. Mater. Sci. Eng. B 2017, 226, 132–140. [Google Scholar] [CrossRef]
- Sengiz, C.; Congur, G.; Erdem, A. Development of ionic liquid modified disposable graphite electrodes for label-free electrochemical detection of DNA hybridization related to Microcystis spp. Sensors 2015, 15, 22737–22749. [Google Scholar] [CrossRef] [Green Version]
- Tateishi-Karimata, H.; Sugimoto, N. Biological and nanotechnological applications using interactions between ionic liquids and nucleic acids. Biophys. Rev. 2018, 10, 931–940. [Google Scholar] [CrossRef]
- Kwak, K.; Kumar, S.S.; Pyo, K.; Lee, D. Ionic liquid of a gold nanocluster: A versatile matrix for electrochemical biosensors. ACS Nano 2014, 8, 671–679. [Google Scholar] [CrossRef]
- Benjamin, M.; Manoj, D.; Thenmozhi, K.; Bhagat, P.R.; Saravanakumar, D.; Senthilkumar, S. A bioinspired ionic liquid tagged cobalt-salophen complex for nonenzymatic detection of glucose. Biosens. Bioelectron. 2017, 91, 380–387. [Google Scholar] [CrossRef]
- Pereiro, A.B.; Araujo, J.M.M.; Martinho, S.; Alves, F.; Nunes, S.; Matias, A.; Duarte, C.M.M.; Rebelo, L.P.N.; Marrucho, I.M. Fluorinated ionic liquids: Properties and applications. ACS Sustain. Chem. Eng. 2013, 1, 427–439. [Google Scholar] [CrossRef]
- Sprenger, K.G.; Plaks, J.G.; Kaar, J.L.; Pfaendtner, J. Elucidating sequence and solvent specific design targets to protect and stabilize enzymes for biocatalysis in ionic liquids. Phys. Chem. Chem. Phys. 2017, 19, 17426–17433. [Google Scholar] [CrossRef] [PubMed]
- Wasilewski, T.; Gebicki, J.; Kamysz, W. Prospects of ionic liquids application in electronic and bioelectronic nose instruments. TrAC Trends Anal. Chem. 2017, 93, 23–36. [Google Scholar] [CrossRef]
- Manoj, D.; Theyagarajan, K.; Saravanakumar, D.; Senthilkumar, S.; Thenmozhi, K. Aldehyde functionalized ionic liquid on electrochemically reduced graphene oxide as a versatile platform for covalent immobilization of biomolecules and biosensing. Biosens. Bioelectron. 2018, 103, 104–112. [Google Scholar] [CrossRef]
- Eksin, E.; Muti, M.; Erdem, A. Chitosan/ionic liquid composite electrode for electrochemical monitoring of the surface-confined interaction between mitomycin C and DNA. Electroanalysis 2013, 25, 2321–2329. [Google Scholar] [CrossRef]
- Chen, T.; Xiong, H.; Wen, W.; Zhang, X.; Wang, S. Electrochemistry of heme proteins entrapped in DNA films in two imidazolium-based room temperature ionic liquids. Bioelectrochemistry 2013, 91, 8–14. [Google Scholar] [CrossRef]
- Wang, L.; Wen, W.; Xiong, H.; Zhang, X.; Gu, H.; Wang, S. A novel amperometric biosensor for superoxide anion based on superoxide dismutase immobilized on gold nanoparticle-chitosan-ionic liquid biocomposite film. Anal. Chim. Acta. 2013, 758, 66–71. [Google Scholar] [CrossRef] [PubMed]
- Wang, X.; Chen, L.; Su, X.; Ai, S. Electrochemical immunosensor with graphene quantum dots and apoferritin-encapsulated Cu nanoparticles double-assisted signal amplification for detection of avian leukosis virus subgroup J. Biosens. Bioelectron. 2013, 47, 171–177. [Google Scholar] [CrossRef] [PubMed]
- Wang, X.; Hang, Y.; Liu, J.; Hou, Y.; Wang, N.; Wang, M. Anticancer effect of curcumin inhibits cell growth through miR-21/PTEN/Akt pathway in breast cancer cell. Oncol. Lett. 2017, 13, 4825–4831. [Google Scholar] [CrossRef] [Green Version]
- Chiu, J.; Khan, Z.A.; Farhangkhoee, H.; Chakrabarti, S. Curcumin prevents diabetes-associated abnormalities in the kidneys by inhibiting p300 and nuclear factor-kappaB. Nutrition 2009, 25, 964–972. [Google Scholar] [CrossRef] [PubMed]
- Cao, J.; Jiang, L.P.; Liu, Y.; Yang, G.; Yao, X.F.; Zhong, L.F. Curcumin-induced genotoxicity and antigenotoxicity in HepG2 cells. Toxicon 2007, 49, 1219–1222. [Google Scholar] [CrossRef] [PubMed]
- Kumar, A.; Bora, U. Interactions of curcumin and its derivatives with nucleic acids and their implications. Mini Rev. Med. Chem. 2013, 13, 256–264. [Google Scholar] [CrossRef]
- Jayaprakasha, G.K.; Rao, L.J.M.; Sakariah, K.K. Chemistry and biological activities of C. longa. Trends Food Sci. Technol. 2005, 16, 533–548. [Google Scholar] [CrossRef]
- Cao, J.; Jia, L.; Zhou, H.M.; Liu, Y.; Zhong, L.F. Mitochondrial and nuclear DNA damage induced by curcumin in human hepatoma G2 cells. Toxicol. Sci. 2006, 91, 476–483. [Google Scholar] [CrossRef] [PubMed] [Green Version]
- Tang, B.; Ma, L.; Wang, H.Y.; Zhang, G.Y.; Zhang, J. Study on the supramolecular interaction of curcumin and β-cyclodextrin by spectrophotometry and its analytical application. Agric. Food Chem. 2002, 50, 1355–1361. [Google Scholar] [CrossRef] [PubMed]
- Liu, X.; Zhu, L.; Gao, X.; Wang, Y.; Lu, H.; Tang, Y.; Li, J. Magnetic molecularly imprinted polymers for spectrophotometric quantification of curcumin in food. Food Chem. 2016, 202, 309–315. [Google Scholar] [CrossRef] [PubMed]
- Heath, D.D.; Pruitt, M.A.; Brenner, D.E.; Rock, C.L. Curcumin in plasma and urine: Quantitation by high-performance liquid chromatography. J. Chromatogr. B Anal. Technol. Biomed. Life Sci. 2003, 783, 287–295. [Google Scholar] [CrossRef]
- Lechtenberg, M.; Quandt, B.; Nahrstedt, A. Quantitative determination of curcuminoids in Curcuma rhizomes and rapid differentiation of Curcuma domestica Val. and Curcuma xanthorrhiza Roxb. by capillary electrophoresis. Phytochem. Anal. 2004, 15, 152–158. [Google Scholar] [CrossRef] [PubMed]
- Gören, A.C.; Çıkrıkçı, S.; Çergel, M.; Bilsel, G. Rapid quantitation of curcumin in turmeric via NMR and LC–tandem mass spectrometry. Food Chem. 2009, 113, 1239–1242. [Google Scholar] [CrossRef]
- Duan, Z.; Yin, M.; Zhang, C.; Song, G.; Zhao, S.; Yang, F.; Wang, H. Polyhydric polymer-loaded pyrene composites as powerful adsorbents and fluorescent probes: Highly efficient adsorption and test strips-based fluorimetric analysis of curcumin in urine and plant extracts. Analyst 2018, 143, 392–395. [Google Scholar] [CrossRef]
- Blackburn, G.M.; Gait, M.J. Nucleic Acids in Chemistry and Biology; Oxford University Press: Oxford, UK, 1990. [Google Scholar]
- Serpi, C.; Stanic, Z.; Girousi, S. Electroanalytical Study of the Interaction Between Double Stranded DNA and Antitumor Agent Curcumin. Anal. Lett. 2010, 43, 1491–1506. [Google Scholar] [CrossRef]
- Zhang, Y.; Wu, P.; Lin, X. Electrochemical studies of interaction between curcumin and DNA. Huaxue Yanjiu 2009, 20, 37–39. [Google Scholar] [CrossRef]
- Zsila, F.; Bikádi, Z.; Simonyi, M. Circular dichroism spectroscopic studies reveal pH dependent binding of curcumin in the minor groove of natural and synthetic nucleic acids. Org. Biomol. Chem. 2004, 2, 2902–2910. [Google Scholar] [CrossRef]
- Senthil, K.; Iyandurai, N.; Sarojini, R. Curcumin-Nucleotide Interaction by FT-Raman, Spectroscopy. Asian J. Chem. 2009, 21, 4237–4240. [Google Scholar]
- Kunwar, A.; Simon, E.; Singh, U.; Chittela, R.K.; Sharma, D.; Sandur, S.K.; Priyadarsini, I.K. Interaction of a curcumin analogue dimethoxycurcumin with DNA. Chem. Biol. Drug Des. 2011, 77, 81–287. [Google Scholar] [CrossRef] [PubMed]
- Sahoo, B.; Ghosh, K.; Bera, R.; Dasgupta, S. Studies on the interaction of diacetylcurcumin with calf thymus-DNA. Chem. Phys. 2008, 351, 163–169. [Google Scholar] [CrossRef]
- Martín-Cordero, C.; López-Lázaro, M.; Gálvez, M.; Ayuso, M.J. Curcumin as a DNA topoisomerase II poison. J. Enzym. Inhib. Med. Chem. 2003, 18, 505–509. [Google Scholar] [CrossRef] [PubMed]
- Gao, S.; Fan, T.; Yang, L.; Wang, L.; Li, H. Study on determination of stability constant of curcumin-Fe2+ and interaction of the complex with salmon sperm DNA by spectrophotometry. Fenxi Shiyanshi. 2011, 30, 36–38. [Google Scholar]
- Vukićević, M.; Tønnesen, H.H. Interaction between curcumin and human serum albumin in the presence of excipients and the effect of binding on curcumin photostability. Pharm. Dev. Technol. 2016, 21, 428–436. [Google Scholar] [CrossRef] [PubMed]
- Khandelwal, H.; Prakash, S. Synthesis and characterization of hydroxyapatite powder by eggshell. J. Miner. Mater. Char. Eng. 2016, 4, 119. [Google Scholar] [CrossRef] [Green Version]
- Hernández-Fernández, F.J.; De los Ríos, A.P.; Tomás-Alonso, F.; Palacios, J.M.; Víllora, G. Preparation of supported ionic liquid membranes: Influence of the ionic liquid immobilization method on their operational stability. J. Membrane Sci. 2009, 341, 172–177. [Google Scholar] [CrossRef]
- Bose, S.; Saha, S.K. Synthesis and characterization of hydroxyapatite nanopowders by emulsion technique. Chem. Mater. 2003, 15, 4464–4469. [Google Scholar] [CrossRef]
- Huang, Y.; Tang, C.; Liu, J.; Cheng, J.; Si, Z.; Li, T.; Yang, M. Signal amplification strategy for electrochemical immunosensing based on a molybdophosphate induced enhanced redox current on the surface of hydroxyapatite nanoparticles. Microchim. Acta 2017, 184, 855–861. [Google Scholar] [CrossRef]
- Yang, L.; Wei, W.; Gao, X.; Xia, J.; Tao, H. A new antibody immobilization strategy based on electrodeposition of nanometer-sized hydroxyapatite for label-free capacitive immunosensor. Talanta 2005, 68, 40–46. [Google Scholar] [CrossRef] [PubMed]
- Kim, M.S.; Ryu, J.J.; Sung, Y.M. One-step approach for nano-crystalline hydroxyapatite coating on titanium via micro-arc oxidation. Electrochem. Commun. 2007, 9, 1886–1891. [Google Scholar] [CrossRef]
- Cummings, T.E.; Elving, P.J. Determination of the electrochemically effective electrode area. Anal. Chem. 1978, 50, 480–488. [Google Scholar] [CrossRef]
- Arora, K.; Prabhakar, N.; Chand, S.; Malhotra, B.D. Ultrasensitive DNA hybridization biosensor based on polyaniline. Biosens. Bioelectron. 2007, 23, 613–620. [Google Scholar] [CrossRef] [PubMed]
- Janek, R.P.; Fawcett, W.R. Impedance spectroscopy of self-assembled monolayers on Au(111): Sodium ferrocyanide charge transfer at modified electrodes. Langmuir 1998, 14, 3011–3018. [Google Scholar] [CrossRef]
- Miller, J.N.; Miller, J.C. Statistics and Chemometrics for Analytical Chemistry, 5th ed.; Pearson Education: Essex, UK, 2005; pp. 121–123. [Google Scholar]
- Piedade, J.A.P.; Oliveira, P.S.C.; Lopes, M.C.; Oliveira-Brett, A.M. Voltammetric determination of gamma radiation-induced DNA damage. Anal. Biochem. 2006, 355, 39–49. [Google Scholar] [CrossRef] [PubMed]
- Fojta, M. Detecting DNA damage with electrodes. In Perspectives in Bioanalysis; Palecek, E., Scheller, F., Wang, J., Eds.; Elsevier: Amsterdam, The Netherlands, 2005; pp. 385–431. [Google Scholar]
- Oliveira-Brett, A.M. Electrochemistry for probing DNA damage. In Encyclopedia of Sensors; Grimes, C.A., Dickey, E.C., Pishko, M.V., Eds.; American Scientific Publishers: Stevenson Ranch, CA, USA, 2006; pp. 301–314. [Google Scholar]
- Oliveira-Brett, A.M.; Diculescu, V.C.; Chiorcea-Paquim, A.M.; Serrano, S.H.P. DNA-electrochemical biosensors for investigating DNA damage. In Comprehensive Analytical Chemistry; Alegret, S., Merkoçi, A., Eds.; Elsevier: Amsterdam, The Netherlands, 2007; pp. 413–437. [Google Scholar]
- Oliveira, S.C.B.; Chiorcea-Paquim, A.M.; Ribeiro, S.M.; Melo, A.T.P.; Vivan, M.; Oliveira-Brett, A.M. In situ electrochemical and AFM study of thalidomide–DNA interaction. Bioelectrochemistry 2009, 76, 201–207. [Google Scholar] [CrossRef] [PubMed]


| Interaction Time (min) | Guanine Signal before Interaction (µA) | Guanine Signal after Interaction (µA) | Decrease % at Guanine Signal |
|---|---|---|---|
| 1 | 6 ± 0.9 (RSD% = 14.7%) | 4.3 ± 0.5 (RSD% = 10.9%) | 29.3% |
| 3 | 3.9 ± 0.3 (RSD% = 8.2%) | 36.3% | |
| 5 | 3.4 ± 0.6 (RSD% = 16.7%) | 43.2% |
Publisher’s Note: MDPI stays neutral with regard to jurisdictional claims in published maps and institutional affiliations. |
© 2021 by the authors. Licensee MDPI, Basel, Switzerland. This article is an open access article distributed under the terms and conditions of the Creative Commons Attribution (CC BY) license (https://creativecommons.org/licenses/by/4.0/).
Share and Cite
Uca, M.; Eksin, E.; Erac, Y.; Erdem, A. Electrochemical Investigation of Curcumin–DNA Interaction by Using Hydroxyapatite Nanoparticles–Ionic Liquids Based Composite Electrodes. Materials 2021, 14, 4344. https://doi.org/10.3390/ma14154344
Uca M, Eksin E, Erac Y, Erdem A. Electrochemical Investigation of Curcumin–DNA Interaction by Using Hydroxyapatite Nanoparticles–Ionic Liquids Based Composite Electrodes. Materials. 2021; 14(15):4344. https://doi.org/10.3390/ma14154344
Chicago/Turabian StyleUca, Merve, Ece Eksin, Yasemin Erac, and Arzum Erdem. 2021. "Electrochemical Investigation of Curcumin–DNA Interaction by Using Hydroxyapatite Nanoparticles–Ionic Liquids Based Composite Electrodes" Materials 14, no. 15: 4344. https://doi.org/10.3390/ma14154344
APA StyleUca, M., Eksin, E., Erac, Y., & Erdem, A. (2021). Electrochemical Investigation of Curcumin–DNA Interaction by Using Hydroxyapatite Nanoparticles–Ionic Liquids Based Composite Electrodes. Materials, 14(15), 4344. https://doi.org/10.3390/ma14154344