
Effect of Hydrothermal Treatment and Doping on the Microstructural Features of Sol-Gel Derived BaTiO3 Nanoparticles

 ,
, 
 ,
, 

Abstract
:1. Introduction
2. Materials and Methods
2.1. Materials
2.2. Synthesis of BT Powders
2.3. Thermal Treatment
2.4. Characterization
3. Results and Discussion
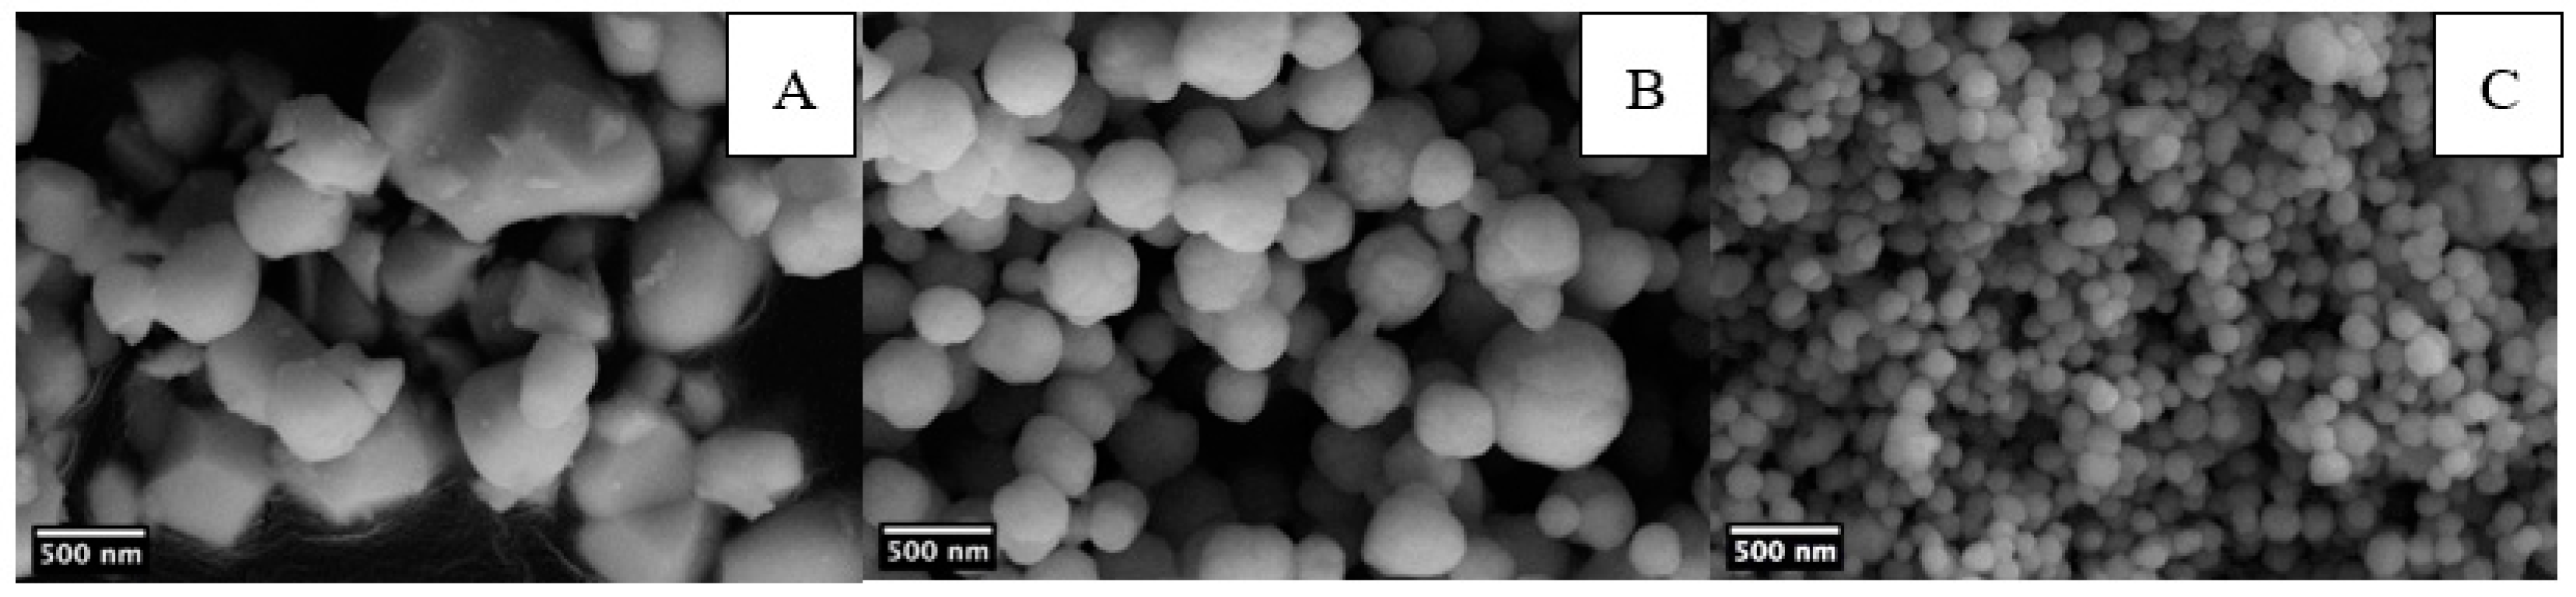
3.1. Effect of Hydrothermal Reaction Time
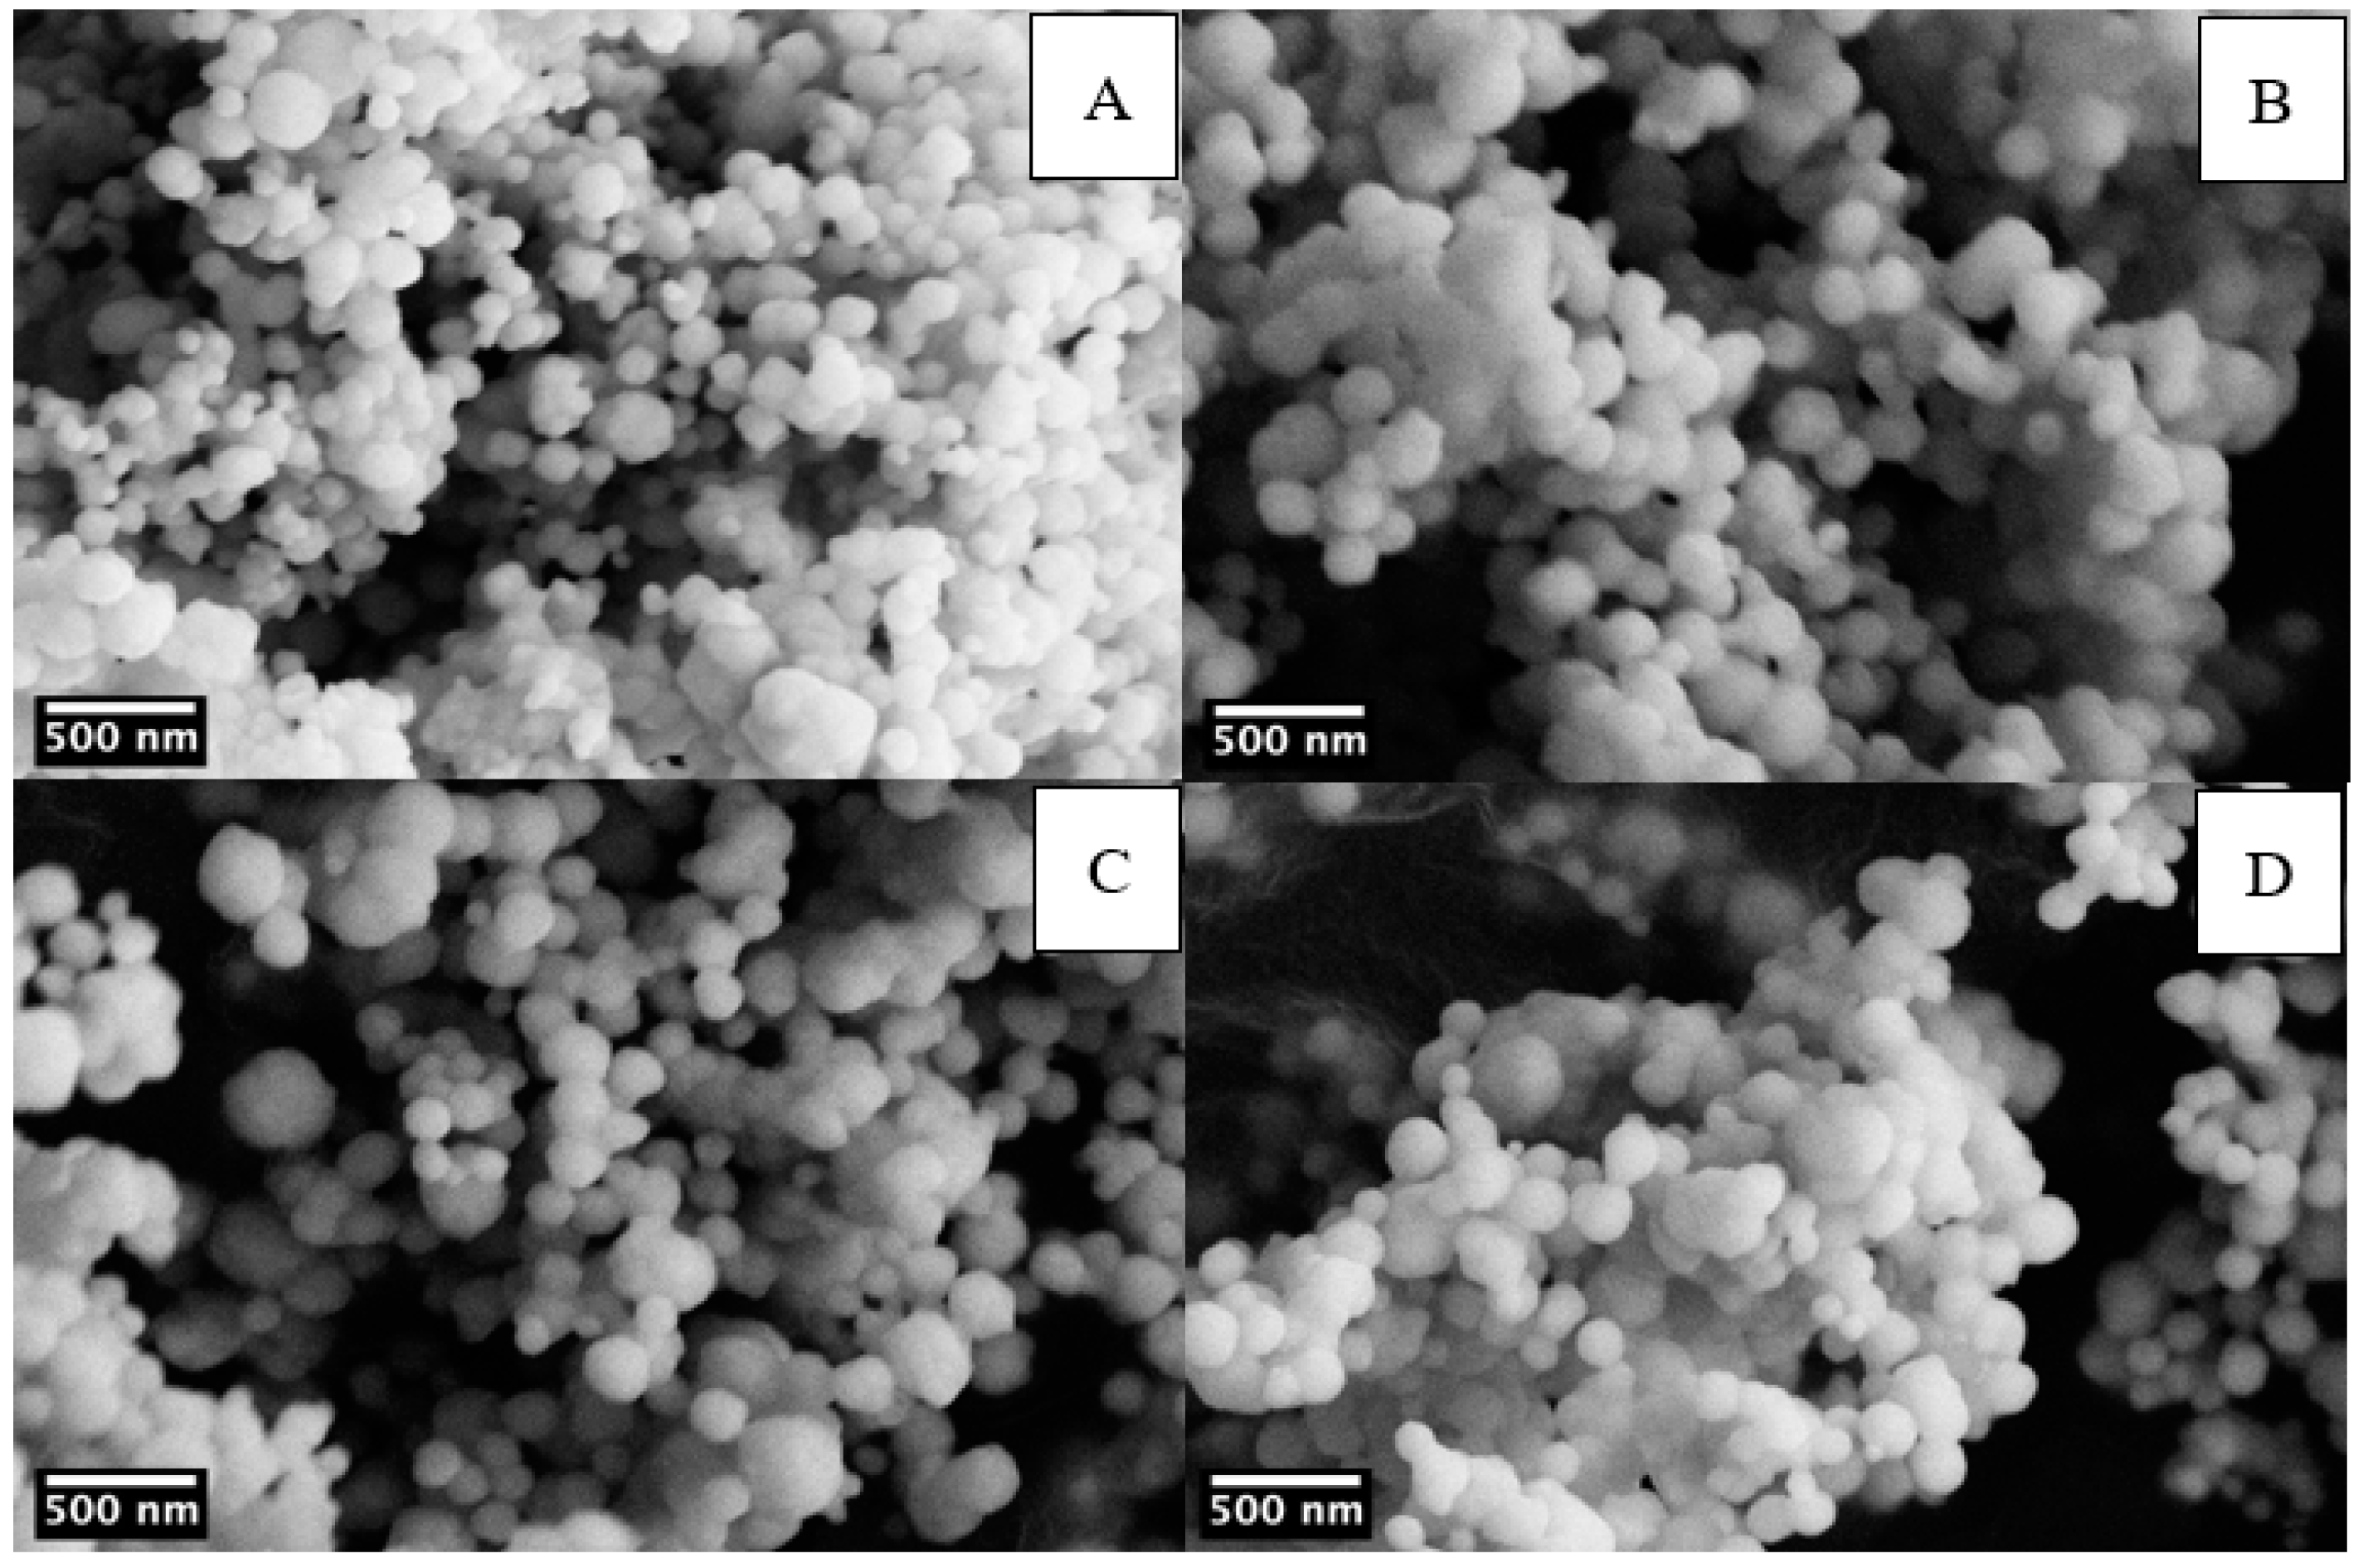
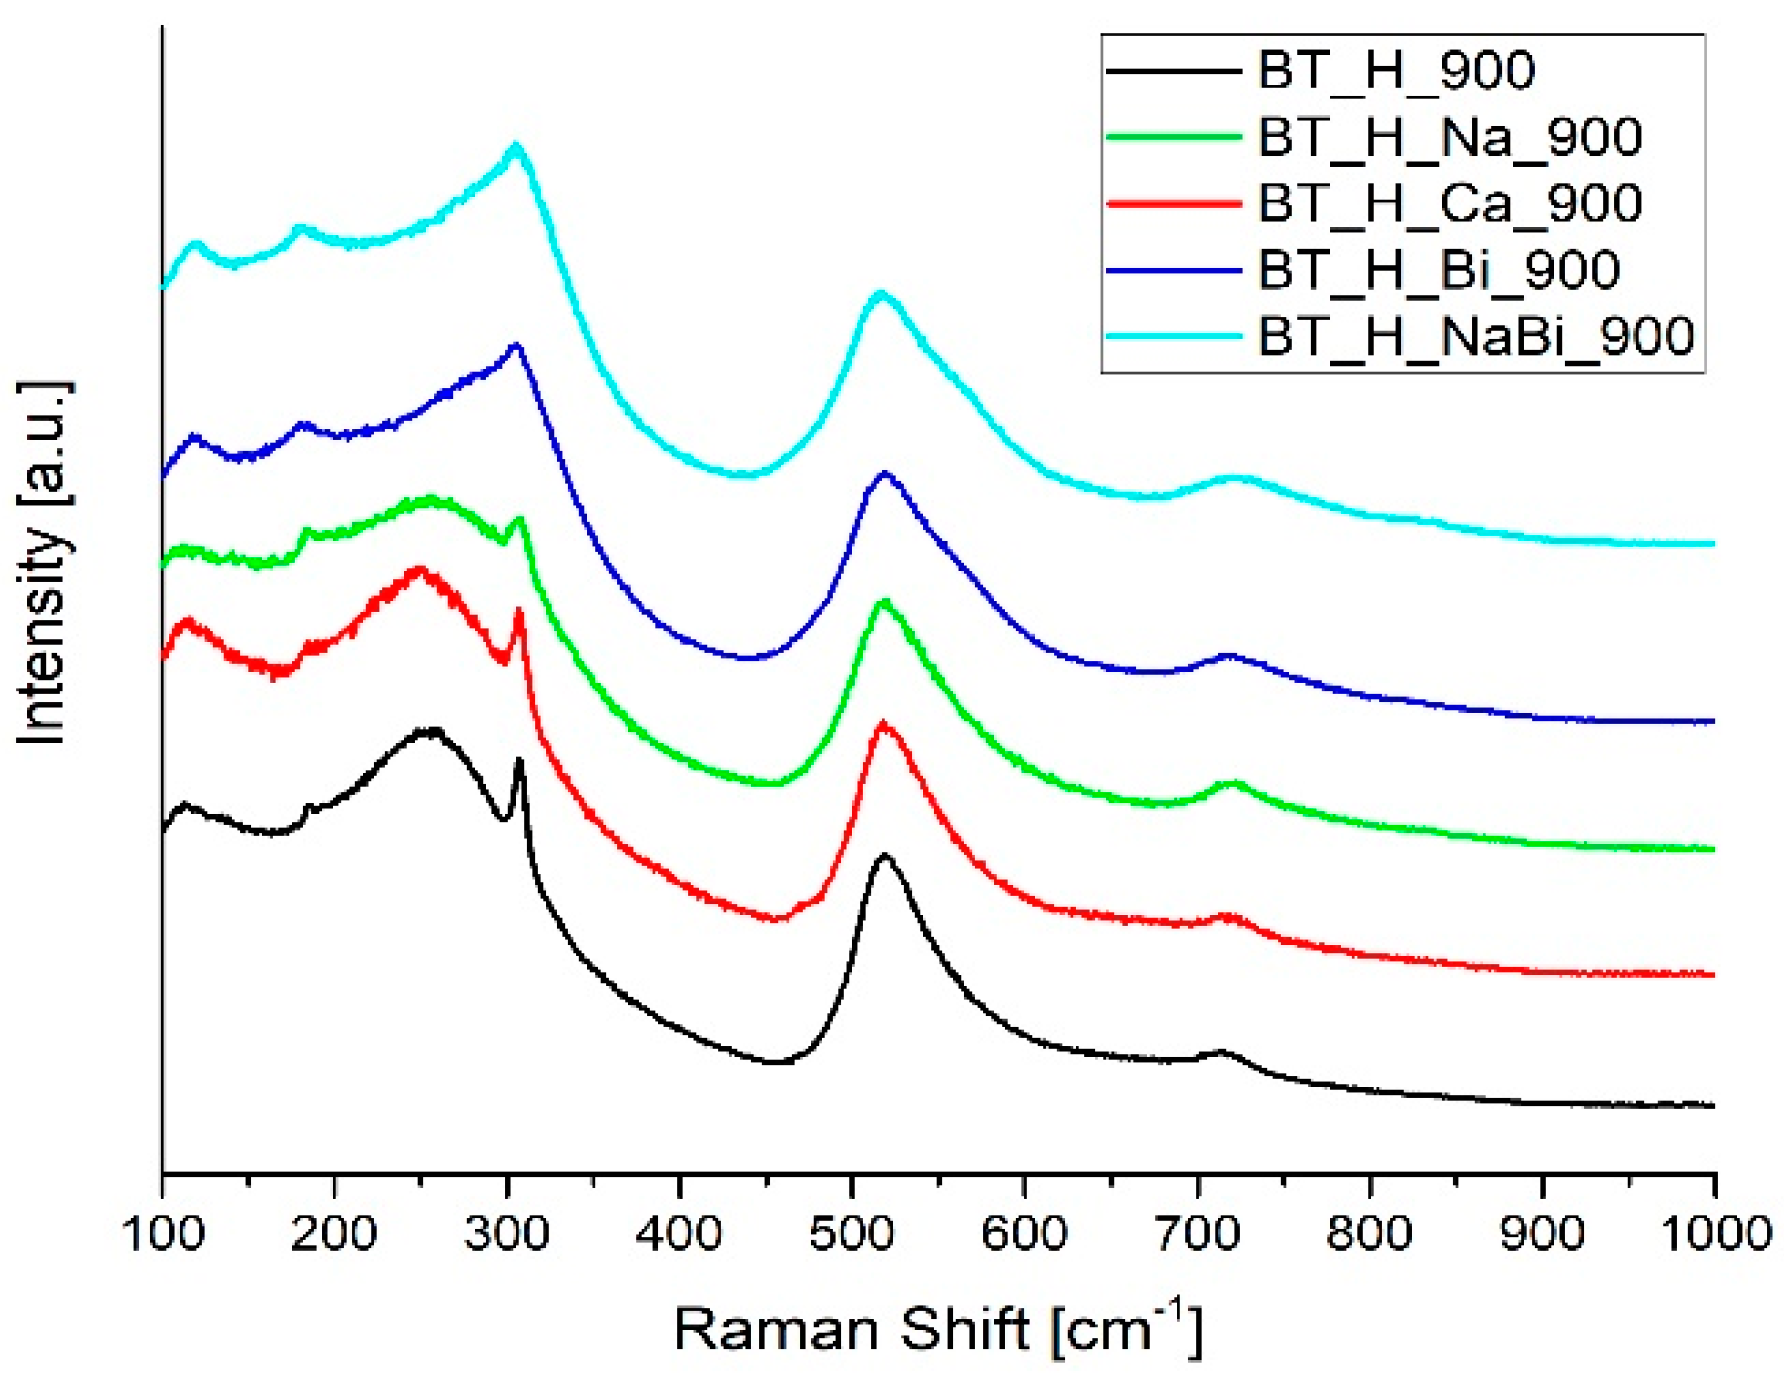
3.2. Effect of Doping
4. Conclusions
Author Contributions
Funding
Institutional Review Board Statement
Informed Consent Statement
Data Availability Statement
Acknowledgments
Conflicts of Interest
References
- Chinya, I.; Sasmal, A.; Pal, A.; Sen, S. Flexible Piezoelectric Energy Harvesters Using Different Architectures of Ferrite Based Nanocomposites. CrystEngComm 2019, 21, 3478–3488. [Google Scholar] [CrossRef]
- Zhang, Y.; Jeong, C.K.; Wang, J.; Sun, H.; Li, F.; Zhang, G.; Chen, L.Q.; Zhang, S.; Chen, W.; Wang, Q. Flexible Energy Harvesting Polymer Composites Based on Biofibril-Templated 3-Dimensional Interconnected Piezoceramics. Nano Energy 2018, 50, 35–42. [Google Scholar] [CrossRef]
- Xie, M.; Zhang, Y.; Kraśny, M.J.; Bowen, C.; Khanbareh, H.; Gathercole, N. Flexible and Active Self-Powered Pressure, Shear Sensors Based on Freeze Casting Ceramic-Polymer Composites. Energy Environ. Sci. 2018, 11, 2919–2927. [Google Scholar] [CrossRef] [PubMed] [Green Version]
- Smith, G.L.; Pulskamp, J.S.; Sanchez, L.M.; Potrepka, D.M.; Proie, R.M.; Ivanov, T.G.; Rudy, R.Q.; Nothwang, W.D.; Bedair, S.S.; Meyer, C.D.; et al. PZT-Based Piezoelectric MEMS Technology. J. Am. Ceram. Soc. 2012, 95, 1777–1792. [Google Scholar] [CrossRef]
- Furukawa, T.; Ishida, K.; Fukada, E. Piezoelectric Properties in the Composite Systems of Polymers and PZT Ceramics. J. Appl. Phys. 1979, 50, 4904–4912. [Google Scholar] [CrossRef]
- Tressler, J.F.; Alkoy, S.; Newnham, R.E. Piezoelectric Sensors and Sensor Materials. J. Electroceramics 1998, 2, 257–272. [Google Scholar] [CrossRef]
- Guo, R.; Cross, L.E.; Park, S.-E.; Noheda, B.; Cox, D.E.; Shirane, G. Origin of the High Piezoelectric Response in PbZr1−xTixO3. Phys. Rev. Lett. 2000, 84, 5423–5426. [Google Scholar] [CrossRef] [Green Version]
- Panda, P.K.; Sahoo, B. PZT to Lead Free Piezo Ceramics: A Review. Ferroelectrics 2015, 474, 128–143. [Google Scholar] [CrossRef]
- Shrout, T.R.; Zhang, S.J. Lead-Free Piezoelectric Ceramics: Alternatives for PZT? J. Electroceramics 2007, 19, 111–124. [Google Scholar] [CrossRef] [Green Version]
- Nath, R.; Zhong, S.; Alpay, S.P.; Huey, B.D.; Cole, M.W. Enhanced Piezoelectric Response from Barium Strontium Titanate Multilayer Films. Appl. Phys. Lett. 2008, 92, 012916. [Google Scholar] [CrossRef] [Green Version]
- Xu, K.; Li, J.; Lv, X.; Wu, J.; Zhang, X.; Xiao, D.; Zhu, J. Superior Piezoelectric Properties in Potassium–Sodium Niobate Lead-Free Ceramics. Adv. Mater. 2016, 28, 8519–8523. [Google Scholar] [CrossRef] [PubMed]
- Demartin Maeder, M.; Damjanovic, D.; Setter, N. Lead Free Piezoelectric Materials. J. Electroceramics 2004, 13, 385–392. [Google Scholar] [CrossRef]
- Vijatović, M.M.; Bobić, J.D.; Stojanović, B.D. History and Challenges of Barium Titanate: Part II. Sci. Sinter. 2008, 40, 235–244. [Google Scholar] [CrossRef]
- Johnsson, M.; Lemmens, P. Crystallography and Chemistry of Perovskites. In Handbook of Magnetism and Advanced Magnetic Materials; Kronmuller, H., Parkin, S., Coey, J.D.M., Inoue, A., Eds.; John Wiley & Sons, Ltd.: Hoboken, NJ, USA, 2007; Volume 4. [Google Scholar]
- Sharma, V.; Pilania, G.; Rossetti, G.A.; Slenes, K.; Ramprasad, R. Comprehensive Examination of Dopants and Defects in BaTiO3 from First Principles. Phys. Rev. B 2013, 87, 134109. [Google Scholar] [CrossRef] [Green Version]
- Gomes, M.A.; Lima, Á.S.; Eguiluz, K.I.B.; Salazar-Banda, G.R. Wet Chemical Synthesis of Rare Earth-Doped Barium Titanate Nanoparticles. J. Mater. Sci. 2016, 51, 4709–4727. [Google Scholar] [CrossRef]
- Ghosez, P.; Gonze, X.; Lambin, P.; Michenaud, J.-P. Born Effective Charges of Barium Titanate: Band-by-Band Decomposition and Sensitivity to Structural Features. Phys. Rev. B 1995, 51, 6765–6768. [Google Scholar] [CrossRef] [Green Version]
- Chávez, E.; Fuentes, S.; Zarate, R.A.; Padilla-Campos, L. Structural Analysis of Nanocrystalline BaTiO3. J. Mol. Struct. 2010, 984, 131–136. [Google Scholar] [CrossRef]
- Sundar, U.; Lao, Z.; Cook-Chennault, K. Enhanced Dielectric Permittivity of Optimized Surface Modified of Barium Titanate Nanocomposites. Polymers 2020, 12, 827. [Google Scholar] [CrossRef] [Green Version]
- Iijima, M.; Sato, N.; Wuled Lenggoro, I.; Kamiya, H. Surface Modification of BaTiO3 Particles by Silane Coupling Agents in Different Solvents and Their Effect on Dielectric Properties of BaTiO3/Epoxy Composites. Colloid Surf. A Physicochem. Eng. Asp. 2009, 352, 88–93. [Google Scholar] [CrossRef]
- Sundar, U.; Lao, Z.; Cook-Chennault, K. Investigation of Piezoelectricity and Resistivity of Surface Modified Barium Titanate Nanocomposites. Polymers 2019, 11, 2123. [Google Scholar] [CrossRef] [PubMed] [Green Version]
- Guo, C.; Fuji, M. Effect of Silicone Coupling Agent on Dielectric Properties of Barium Titanate/Silicone Elastomer Composites. Adv. Powder Tech. 2016, 27, 1162–1172. [Google Scholar] [CrossRef] [Green Version]
- Cheung, M.C.; Chan, H.L.W.; Choy, C.L. Study on Barium Titanate Ceramics Prepared by Various Methods. J. Mater. Sci. 2001, 36, 381–387. [Google Scholar] [CrossRef]
- Stojanovic, B.D.; Simoes, A.Z.; Paiva-Santos, C.O.; Jovalekic, C.; Mitic, V.V.; Varela, J.A. Mechanochemical Synthesis of Barium Titanate. J. Eur. Ceram. Soc. 2005, 25, 1985–1989. [Google Scholar] [CrossRef]
- Akilarasan, M.; Tamilalagan, E.; Chen, S.-M.; Maheshwaran, S.; Chen, T.-W.; Al-Mohaimeed, A.M.; Al-Onazi, W.A.; Soliman Elshikh, M. An Eco-Friendly Low-Temperature Synthetic Approach towards Micro-Pebble-Structured GO@SrTiO3 Nanocomposites for the Detection of 2,4,6-Trichlorophenol in Environmental Samples. Microchim. Acta 2021, 188, 72. [Google Scholar] [CrossRef]
- Song, Z.-Q.; Wang, S.-B.; Yang, W.; Li, M.; Wang, H.; Yan, H. Synthesis of Manganese Titanate MnTiO3 Powders by a Sol–Gel–Hydrothermal Method. Mater. Sci. Eng. B 2004, 113, 121–124. [Google Scholar] [CrossRef]
- Magnone, E.; Kim, J.R.; Park, J.H. The Effect of the Hydrothermal Synthesis Variables on Barium Titanate Powders. Ceram. Int. 2016, 42, 10030–10036. [Google Scholar] [CrossRef]
- Ávila, H.A.; Ramajo, L.A.; Reboredo, M.M.; Castro, M.S.; Parra, R. Hydrothermal Synthesis of BaTiO3 from Different Ti-Precursors and Microstructural and Electrical Properties of Sintered Samples with Submicrometric Grain Size. Ceram. Int. 2011, 37, 2383–2390. [Google Scholar] [CrossRef]
- Wu, M.; Long, J.; Wang, G.; Huang, A.; Luo, Y. Hydrothermal Synthesis of Tetragonal Barium Titanate from Barium Hydroxide and Titanium Dioxide under Moderate Conditions. J. Am. Ceram. Soc. 1999, 82, 3254–3256. [Google Scholar] [CrossRef]
- Xu, H.; Gao, L.; Guo, J. Hydrothermal Synthesis of Tetragonal Barium Titanate from Barium Chloride and Titanium Tetrachloride under Moderate Conditions. J. Am. Ceram. Soc. 2002, 85, 727–729. [Google Scholar] [CrossRef]
- Lee, S.K.; Choi, G.J.; Hwang, U.Y.; Koo, K.K.; Park, T.J. Effect of Molar Ratio of KOH to Ti-Isopropoxide on the Formation of BaTiO3 Powders by Hydrothermal Method. Mater. Lett. 2003, 57, 2201–2207. [Google Scholar] [CrossRef]
- Yoon, S.; Baik, S.; Kim, M.G.; Shin, N. Formation Mechanisms of Tetragonal Barium Titanate Nanoparticles in Alkoxide-Hydroxide Sol-Precipitation Synthesis. J. Am. Ceram. Soc. 2006, 89, 1816–1821. [Google Scholar] [CrossRef]
- Schubert, U. Chemical Modification of Titanium Alkoxides for Sol-Gel Processing. J. Mater. Chem. 2005, 15, 3701–3715. [Google Scholar] [CrossRef]
- Hwang, U.Y.; Park, H.S.; Koo, K.K. Behavior of Barium Acetate and Titanium Isopropoxide during the Formation of Crystalline Barium Titanate. Ind. Eng. Chem. Res. 2004, 43, 728–734. [Google Scholar] [CrossRef]
- Hwang, U.-Y.; Park, H.-S.; Koo, K.-K. Low-Temperature Synthesis of Fully Crystallized Spherical BaTiO3 Particles by the Gel-Sol Method. J. Am. Ceram. Soc. 2004, 87, 2168–2174. [Google Scholar] [CrossRef]
- Lutterotti, L. Maud: A Rietveld Analysis Program Designed for the Internet and Experiment Integration. Acta Crystallogr. Sect. A Found. Crystallogr. 2000, 56, s54. [Google Scholar] [CrossRef] [Green Version]
- Ritter, J.J.; Roth, R.S.; Blendell, J.E. Alkoxide Precursor Synthesis and Characterization of Phases in the Barium-Titanium Oxide System. J. Am. Ceram. Soc. 1986, 69, 155–162. [Google Scholar] [CrossRef]
- Chu, J.P.; Chang, C.W.; Mahalingam, T.; Lin, C.C.; Wang, S.F. Effects of Nb Doping on Properties of Barium Titanate Thin Films. J. Mater. Sci. Lett. 2003, 22, 1269–1273. [Google Scholar] [CrossRef]
- Frey, M.H.; Payne, D.A. Grain-Size Effect on Structure and Phase Transformations for Barium Titanate. Phys. Rev. B 1996, 54, 3158–3168. [Google Scholar] [CrossRef]
- Ashiri, R. Detailed FT-IR Spectroscopy Characterization and Thermal Analysis of Synthesis of Barium Titanate Nanoscale Particles through a Newly Developed Process. Vib. Spectrosc. 2013, 66, 24–29. [Google Scholar] [CrossRef]
- Xing, X.; Deng, J.; Chen, J.; Liu, G. Phase Evolution of Barium Titanate from Alkoxide Gel-Derived Precursor. J. Alloys Compd. 2004, 384, 312–317. [Google Scholar] [CrossRef]
- Pfaff, G. Sol-Gel Synthesis of Barium Titanate Powders of Various Compositions. J. Mater. Chem. 1992, 2, 591–594. [Google Scholar] [CrossRef]
- Vinothini, V.; Singh, P.; Balasubramanian, M. Synthesis of Barium Titanate Nanopowder Using Polymeric Precursor Method. Ceram. Int. 2006, 32, 99–103. [Google Scholar] [CrossRef]
- Last, J.T. Infrared-Absorption Studies on Barium Titanate and Related Materials. Phys. Rev. 1957, 105, 1740–1750. [Google Scholar] [CrossRef]
- Shahid, T.; Arfan, M.; Zeb, A.; Bibi, T.; Khan, T.M. Preparation and Physical Properties of Functional Barium Carbonate Nanostructures by a Facile Composite-Hydroxide-Mediated Route. Nanomater. Nanotechnol. 2018, 8, 1–8. [Google Scholar] [CrossRef] [Green Version]
- Zheng, C.-C.; Cui, B.; You, Q.-M.; Chang, Z.-G. Characterization of BaTiO3 Powders and Ceramics Prepared Using the Sol-Gel Process, with Triton X-100 Used as a Surfactant. In Proceedings of the 7th National Conference on Functional Materials and Applications, Changsha, China, 15–18 October 2010; Scientific Research Publishing: Changsha, China, 2010; pp. 341–346. [Google Scholar]
- Parra, R.; Góes, M.S.; Castro, M.S.; Longos, E.; Bueno, P.R.; Varela, J.A. Reaction Pathway to the Synthesis of Anatase via the Chemical Modification of Titanium Isopropoxide with Acetic Acid. Chem. Mater. 2008, 20, 143–150. [Google Scholar] [CrossRef]
- Socrates, G. Infrared and Raman Characteristic Group Frequencies; John Wiley & Sons, Ltd.: Chichester, UK, 2001; pp. 115–134. [Google Scholar]
- Tangwiwat, S.; Milne, S.J. Barium Titanate Sols Prepared by a Diol-Based Sol-Gel Route. J. Non Cryst. Solids 2005, 351, 976–980. [Google Scholar] [CrossRef]
- Wang, W.; Cao, L.; Liu, W.; Su, G.; Zhang, W. Low-Temperature Synthesis of BaTiO3 Powders by the Sol-Gel-Hydrothermal Method. Ceram. Int. 2013, 39, 7127–7134. [Google Scholar] [CrossRef]
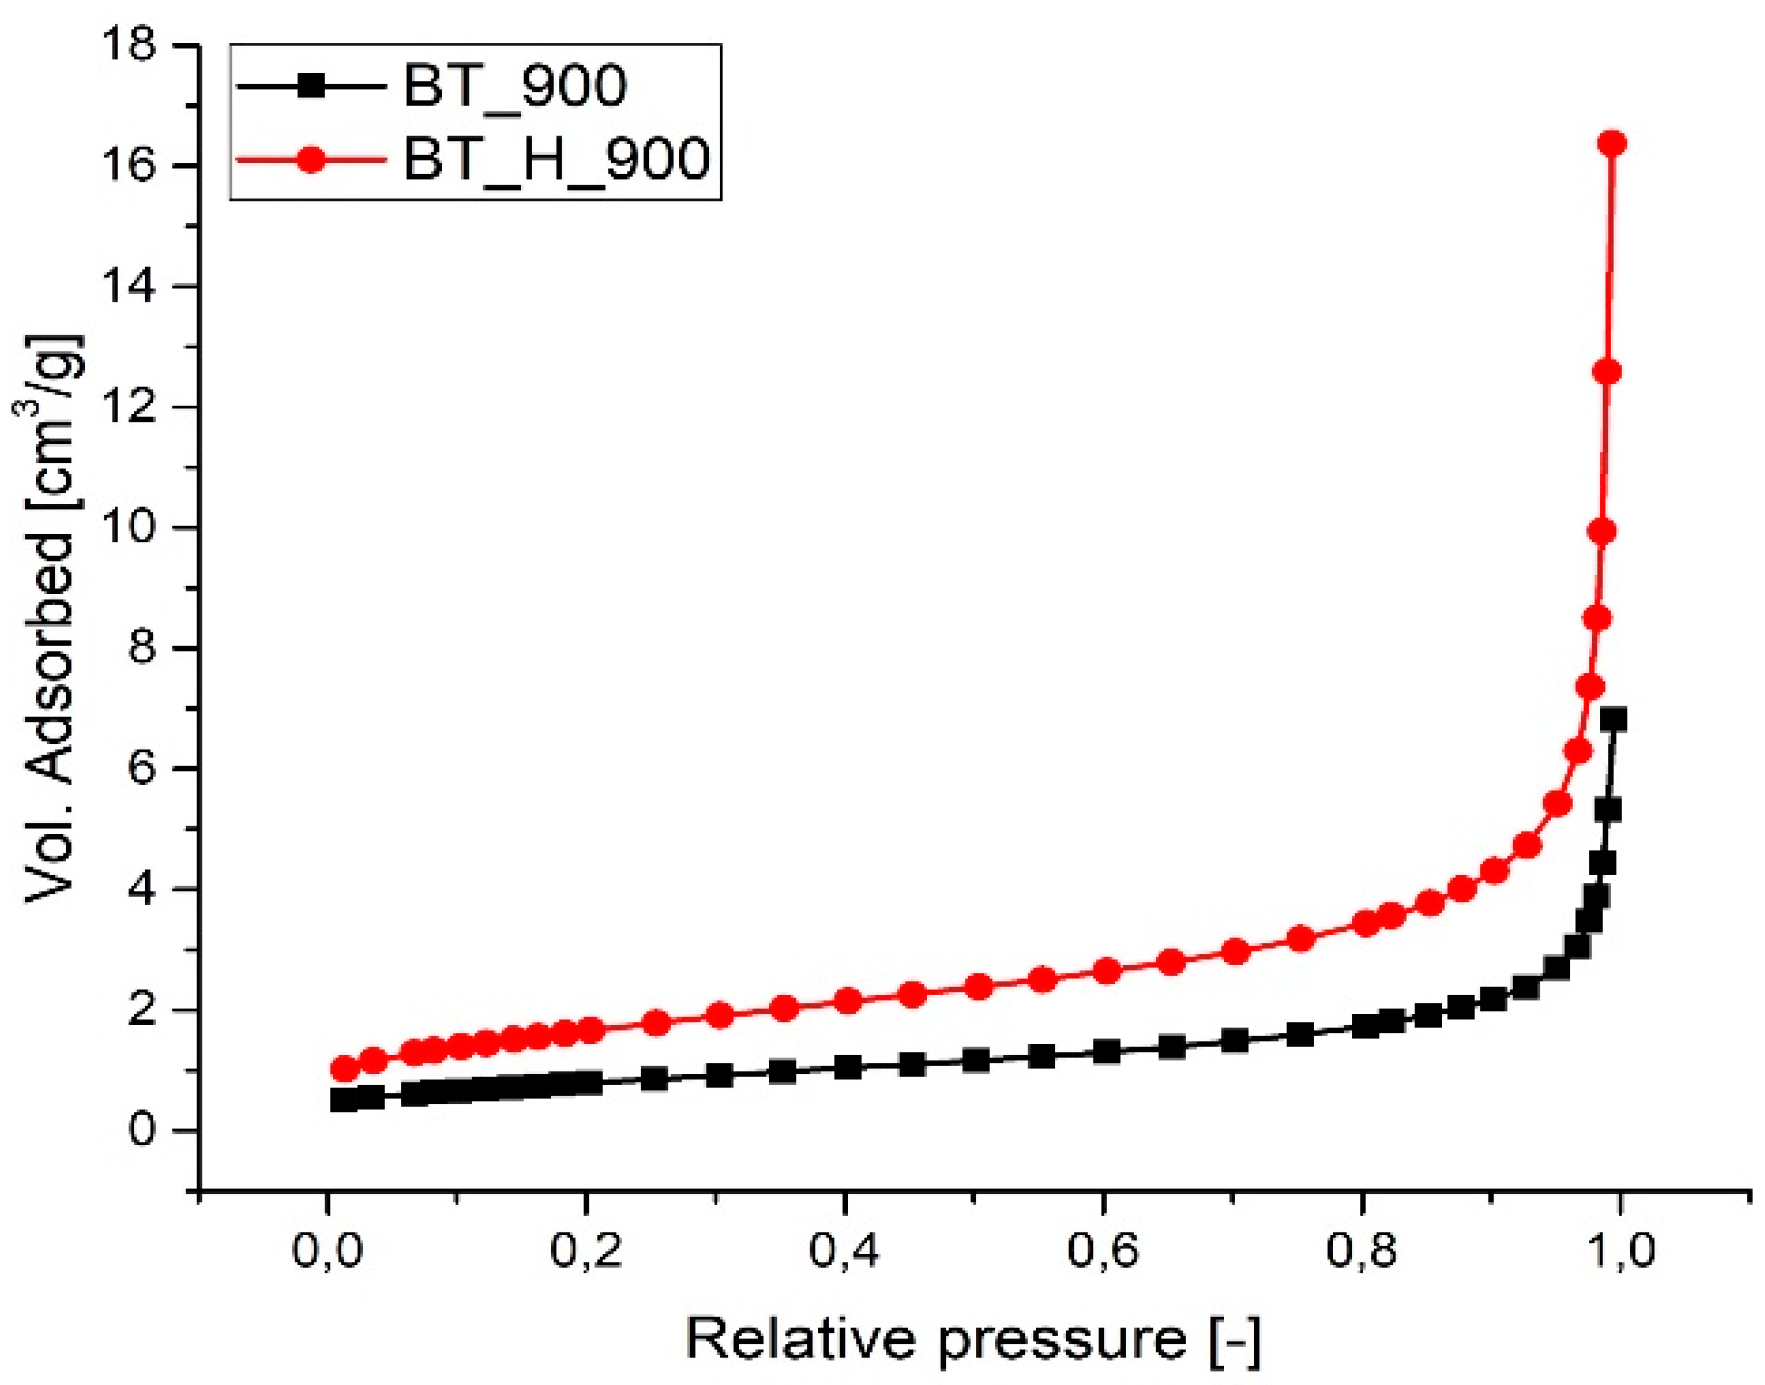
- Thommes, M.; Kaneko, K.; Neimark, A.V.; Olivier, J.P.; Rodriguez-Reinoso, F.; Rouquerol, J.; Sing, K.S.W. Physisorption of Gases, with Special Reference to the Evaluation of Surface Area and Pore Size Distribution (IUPAC Technical Report). Pure Appl. Chem. 2015, 87, 1051–1069. [Google Scholar] [CrossRef] [Green Version]
- Alkathy, M.S.; Hezam, A.; Manoja, K.S.D.; Wang, J.; Cheng, C.; Byrappa, K.; Raju, K.C.J. Effect of Sintering Temperature on Structural, Electrical, and Ferroelectric Properties of Lanthanum and Sodium Co-Substituted Barium Titanate Ceramics. J. Alloys Compd. 2018, 762, 49–61. [Google Scholar] [CrossRef]
- Yoon, D.-H. Ceramic Processing Research Tetragonality of Barium Titanate Powder for a Ceramic Capacitor Application. J. Ceram. Process. Res. 2006, 7, 343–354. [Google Scholar]
- Cont, L.; Chateigner, D.; Lutterotti, L.; Ricote, J.; Calzada, M.L.; Mendiola, J. Combined X-Ray Texture-Structure-Microstructure Analysis Applied to Ferroelectric Ultrastructures: A Case Study on Pb0.76Ca0.24TiO3. Ferroelectrics 2002, 267, 323–328. [Google Scholar] [CrossRef]
- Jiang, B.; Iocozzia, J.; Zhao, L.; Zhang, H.; Harn, Y.W.; Chen, Y.; Lin, Z. Barium Titanate at the Nanoscale: Controlled Synthesis and Dielectric and Ferroelectric Properties. Chem. Soc. Rev. 2019, 48, 1194–1228. [Google Scholar] [CrossRef] [PubMed]
- Wada, S.; Yako, K.; Kakemoto, H.; Tsurumi, T.; Kiguchi, T. Enhanced Piezoelectric Properties of Barium Titanate Single Crystals with Different Engineered-Domain Sizes. J. Appl. Phys. 2005, 98, 014109. [Google Scholar] [CrossRef]
- Su, C.Y.; Otsuka, Y.; Huang, C.Y.; Hennings, D.F.; Pithan, C.; Shiao, F.T.; Waser, R. Grain Growth and Crystallinity of Ultrafine Barium Titanate Particles Prepared by Various Routes. Ceram. Int. 2013, 39, 6673–6680. [Google Scholar] [CrossRef]
- Dixit, A.; Majumder, S.B.; Dobal, P.S.; Katiyar, R.S.; Bhalla, A.S. Phase Transition Studies of Sol-Gel Deposited Barium Zirconate Titanate Thin Films. Thin Solid Films 2004, 447, 284–288. [Google Scholar] [CrossRef]
- Scalabrin, A.; Chaves, A.S.; Shim, D.S.; Porto, S.P.S. Temperature Dependence of the A1 and E Optical Phonons in BaTiO3. Phys. Stat. Sol. 1977, 79, 731–742. [Google Scholar] [CrossRef]
- Hayashi, H.; Nakamura, T.; Ebina, T. In-Situ Raman Spectroscopy of BaTiO3 Particles for Tetragonal-Cubic Transformation. J. Phys. Chem. Solids 2013, 74, 957–962. [Google Scholar] [CrossRef]
- Ćirković, J.; Vojisavljević, K.; Nikolić, N.; Vulić, P.; Branković, Z.; Srećković, T.; Branković, G. Dielectric and Ferroelectric Properties of BST Ceramics Obtained by a Hydrothermally Assisted Complex Polymerization Method. Ceram. Int. 2015, 41, 11306–11313. [Google Scholar] [CrossRef]
- Woo, K.; Choi, G.J.; Sim, S.J.; Cho, Y.S.; Kim, Y.D. Synthesis and Characteristics of Near-Stoichiometric Barium Titanate Powder by Low Temperature Hydrothermal Reaction Using Titanium Tetra(Methoxyethoxide). J. Mater. Sci. 2000, 35, 4539–4548. [Google Scholar] [CrossRef]
- Lee, S.K.; Park, T.J.; Choi, G.J.; Koo, K.K.; Kim, S.W. Effects of KOH/BaTi and Ba/Ti Ratios on Synthesis of BaTiO3 Powder by Coprecipitation/Hydrothermal Reaction. Mater. Chem. Phys. 2003, 82, 742–749. [Google Scholar] [CrossRef]
- Choi, G.J.; Lee Sang, K.; Woo, K.J.; Koo, K.K.; Cho, Y.S. Characteristics of BaTiO3 Particles Prepared by Spray-Coprecipitation Method Using Titanium Acylate-Based Precursors. Chem. Mater. 1998, 10, 4104–4113. [Google Scholar] [CrossRef]
- Liao, J.X.; Wei, X.B.; Xu, Z.Q.; Wang, P. Effect of Potassium-Doped Concentration on Structures and Dielectric Performance of Barium-Strontium-Titanate Films. Vacuum 2014, 107, 291–296. [Google Scholar] [CrossRef]
- De Andrade, M.C.; Carneiro, G.N.; Moreira, E.L.; Araújo, J.C.; Moraes, V.C.A. Synthesis and Characterization of Barium Titanate by Solid-State Reaction. Mater. Sci. Forum 2014, 802, 285–290. [Google Scholar] [CrossRef]
- Ho Han, Y.; Appleby, J.B.; Smyth, D.M. Calcium as an Acceptor Impurity in BaTiO3. J. Am. Ceram. Soc. 1987, 70, 96–100. [Google Scholar] [CrossRef]
- Zhou, L.; Vilarinho, P.M.; Baptista, J.L. Solubility of Bismuth Oxide in Barium Titanate. J. Am. Ceram. Soc. 1999, 82, 1064–1066. [Google Scholar] [CrossRef]
- Badapanda, T.; Senthil, V.; Rana, D.K.; Panigrahi, S.; Anwar, S. Relaxor Ferroelectric Behavior of “a” Site Deficient Bismuth Doped Barium Titanate Ceramic. J. Electroceramics 2012, 29, 117–124. [Google Scholar] [CrossRef]
- Buscaglia, M.T.; Buscaglia, V.; Viviani, M.; Nanni, P.; Hanuskova, M. Influence of Foreign Ions on the Crystal Structure of BaTiO3. J. Eur. Ceram. Soc. 2000, 20, 1997–2007. [Google Scholar] [CrossRef]
- Jing, W.A.; Ng, B.; Xu, G.; Liu, Y.; Liu, X.I.; Li, Ã.; Zhao, M. Influence of Doping on Humidity Sensing Properties of Nanocrystalline BaTiO3. J. Mater. Sci. Lett. 1998, 17, 857–859. [Google Scholar]
- Strathdee, T.; Luisman, L.; Feteira, A.; Reichmann, K. Ferroelectric-to-Relaxor Crossover in (1 − x)BaTiO3-xBiYbO3 (0 ≤ x ≤ 0.08) Ceramics. J. Am. Ceram. Soc. 2011, 94, 2292–2295. [Google Scholar] [CrossRef]


| Sample | Hydrothermal Treatment | Doping * | Annealing |
|---|---|---|---|
| BT | - | - | - |
| BT_900 | - | - | 900 °C, 4 h |
| BT_H | 200 °C, 2 h | - | - |
| BT_H_900 | 200 °C, 2 h | - | 900 °C, 4 h |
| BT_H4h_900 | 200 °C, 4 h | - | 900 °C, 4 h |
| BT_H6h_900 | 200 °C, 6 h | - | 900 °C, 4 h |
| BT_H8h_900 | 200 °C, 8 h | - | 900 °C, 4 h |
| BT_H_Na_900 | 200 °C, 2 h | Na (10% mol.) | 900 °C, 4 h |
| BT_H_Ca_900 | 200 °C, 2 h | Ca (10% mol.) | 900 °C, 4 h |
| BT_H_Bi_900 | 200 °C, 2 h | Bi (10% mol.) | 900 °C, 4 h |
| BT_H_NaBi_900 | 200 °C, 2 h | Na (5% mol.); Bi (5% mol.) | 900 °C, 4 h |
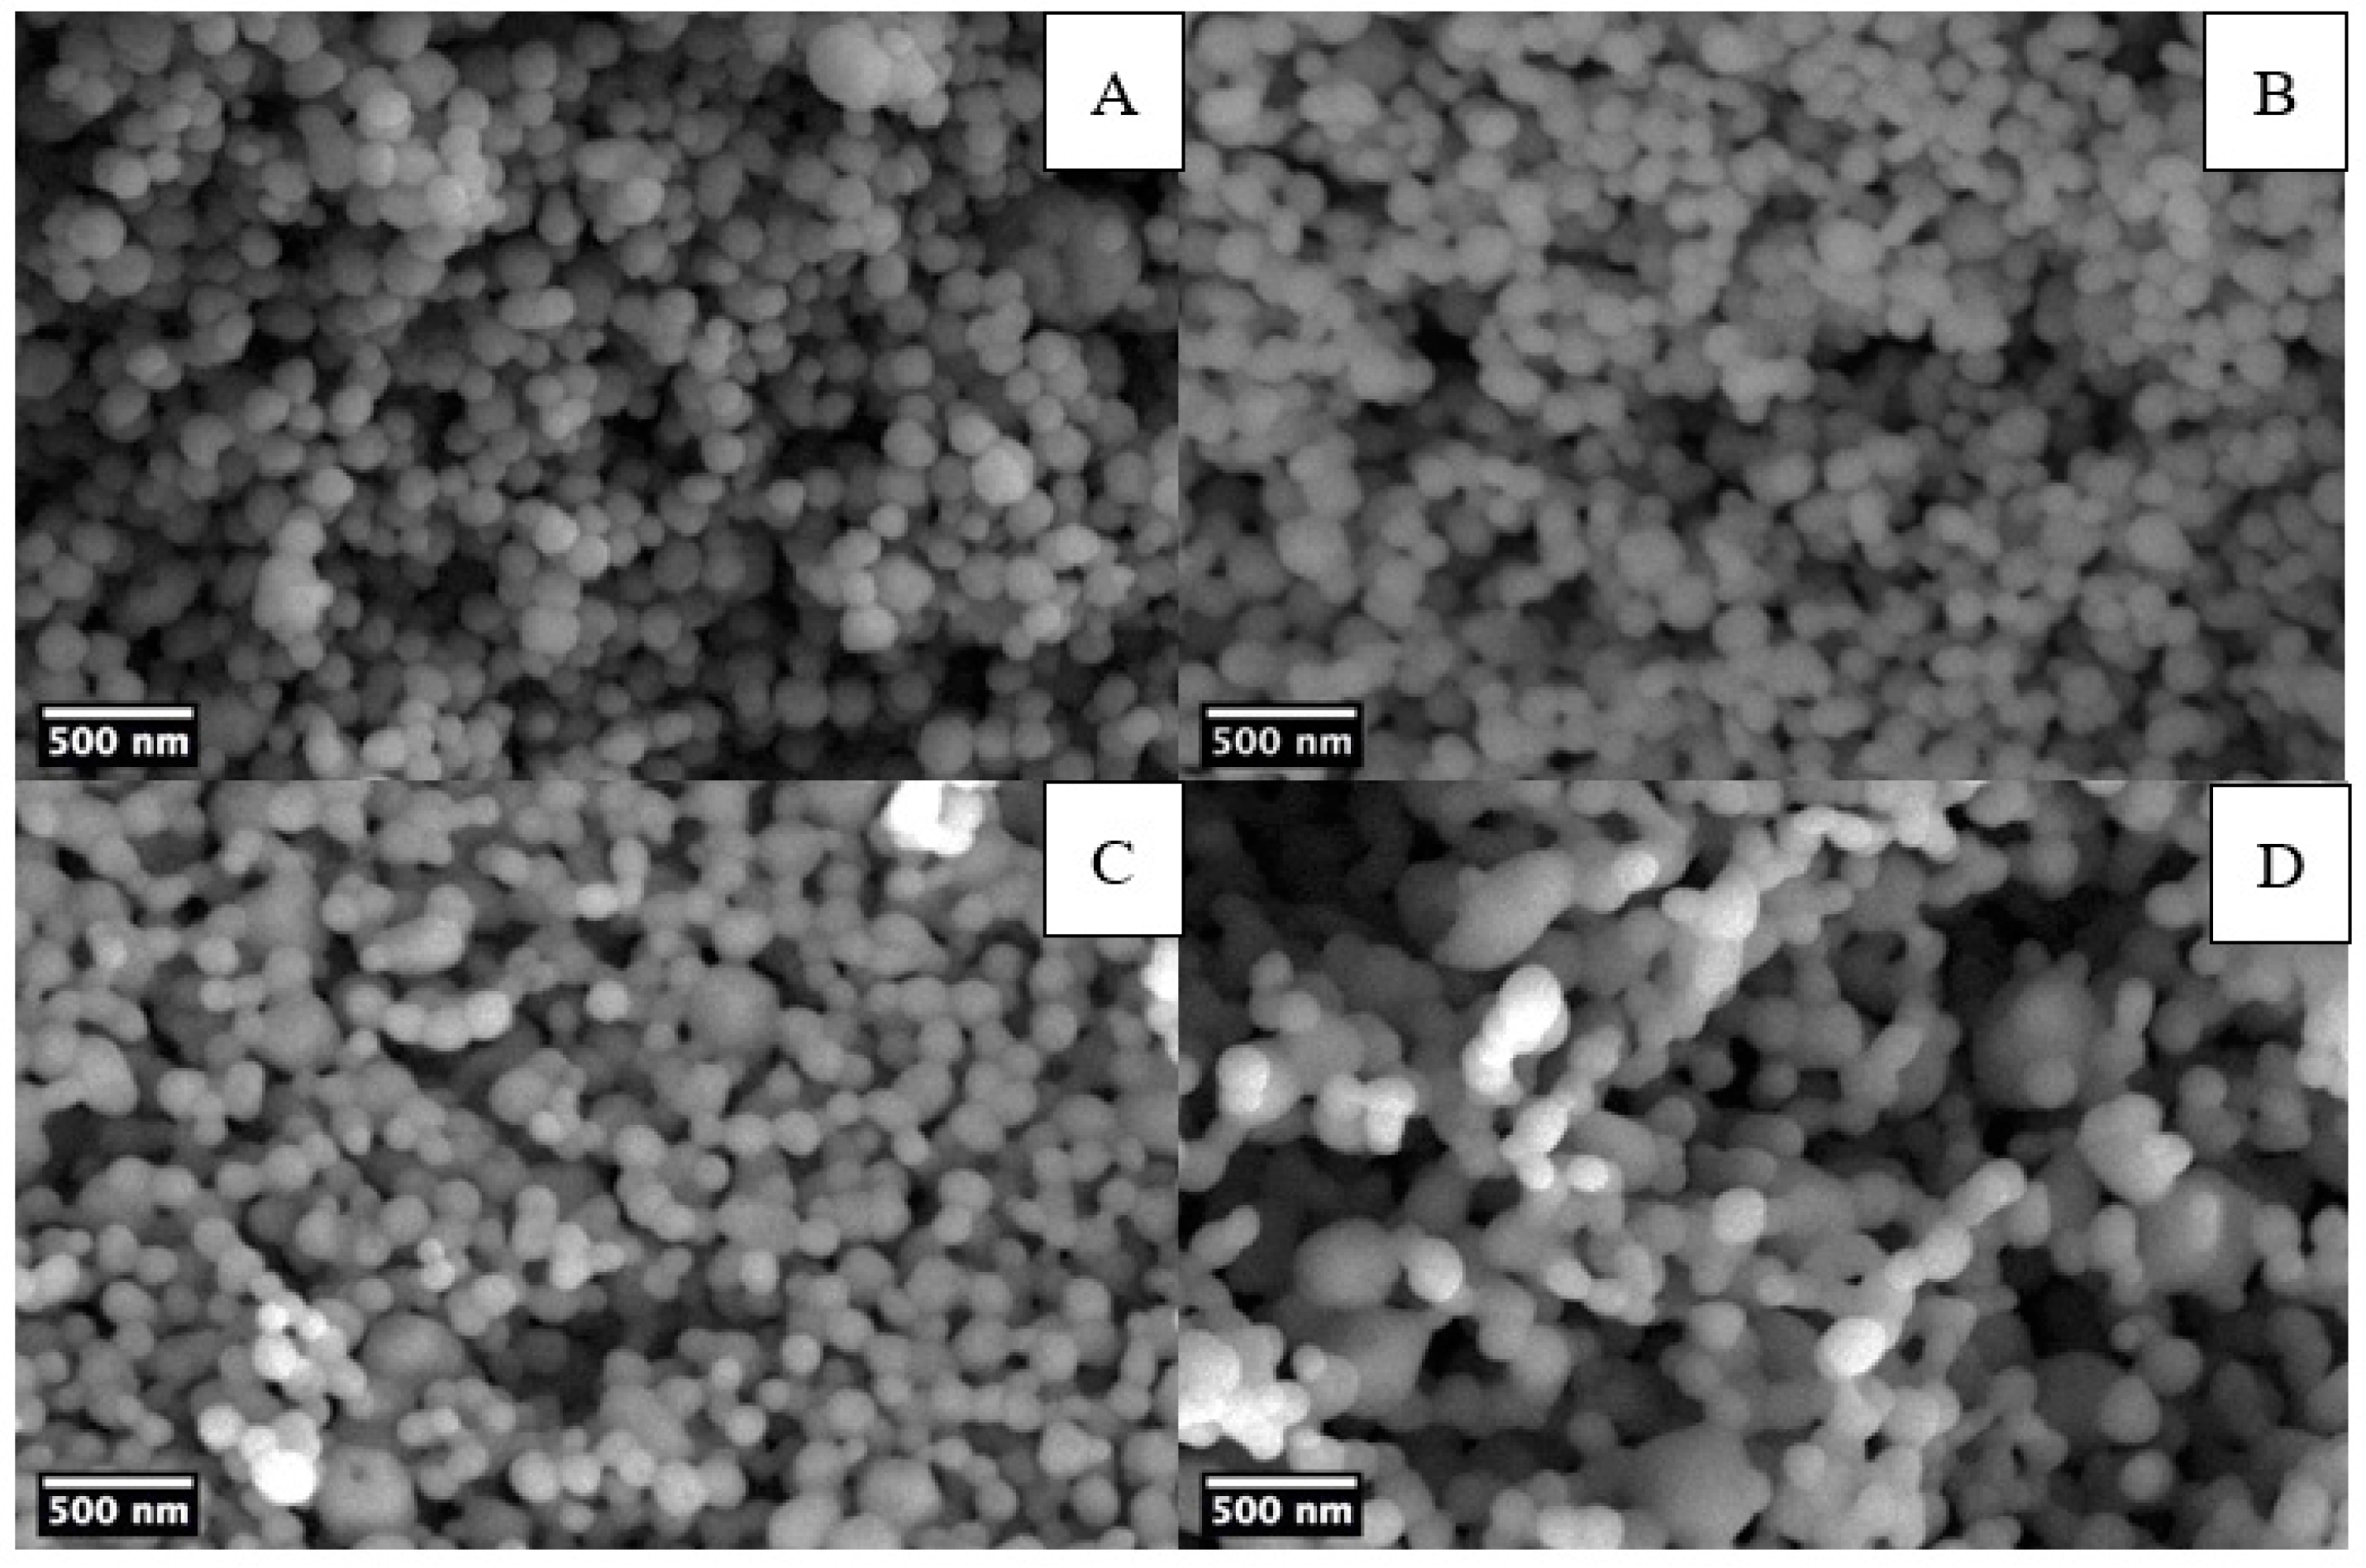
| BT_comm | BT_900 | BT_H_900 | BT_H4h_900 | BT_H6h_900 | BT_H8h_900 | |
|---|---|---|---|---|---|---|
| Mean (nm) | 496 ± 178 | 376 ± 99 | 117 ± 27 | 127 ± 31 | 131 ± 40 | 162 ± 56 |
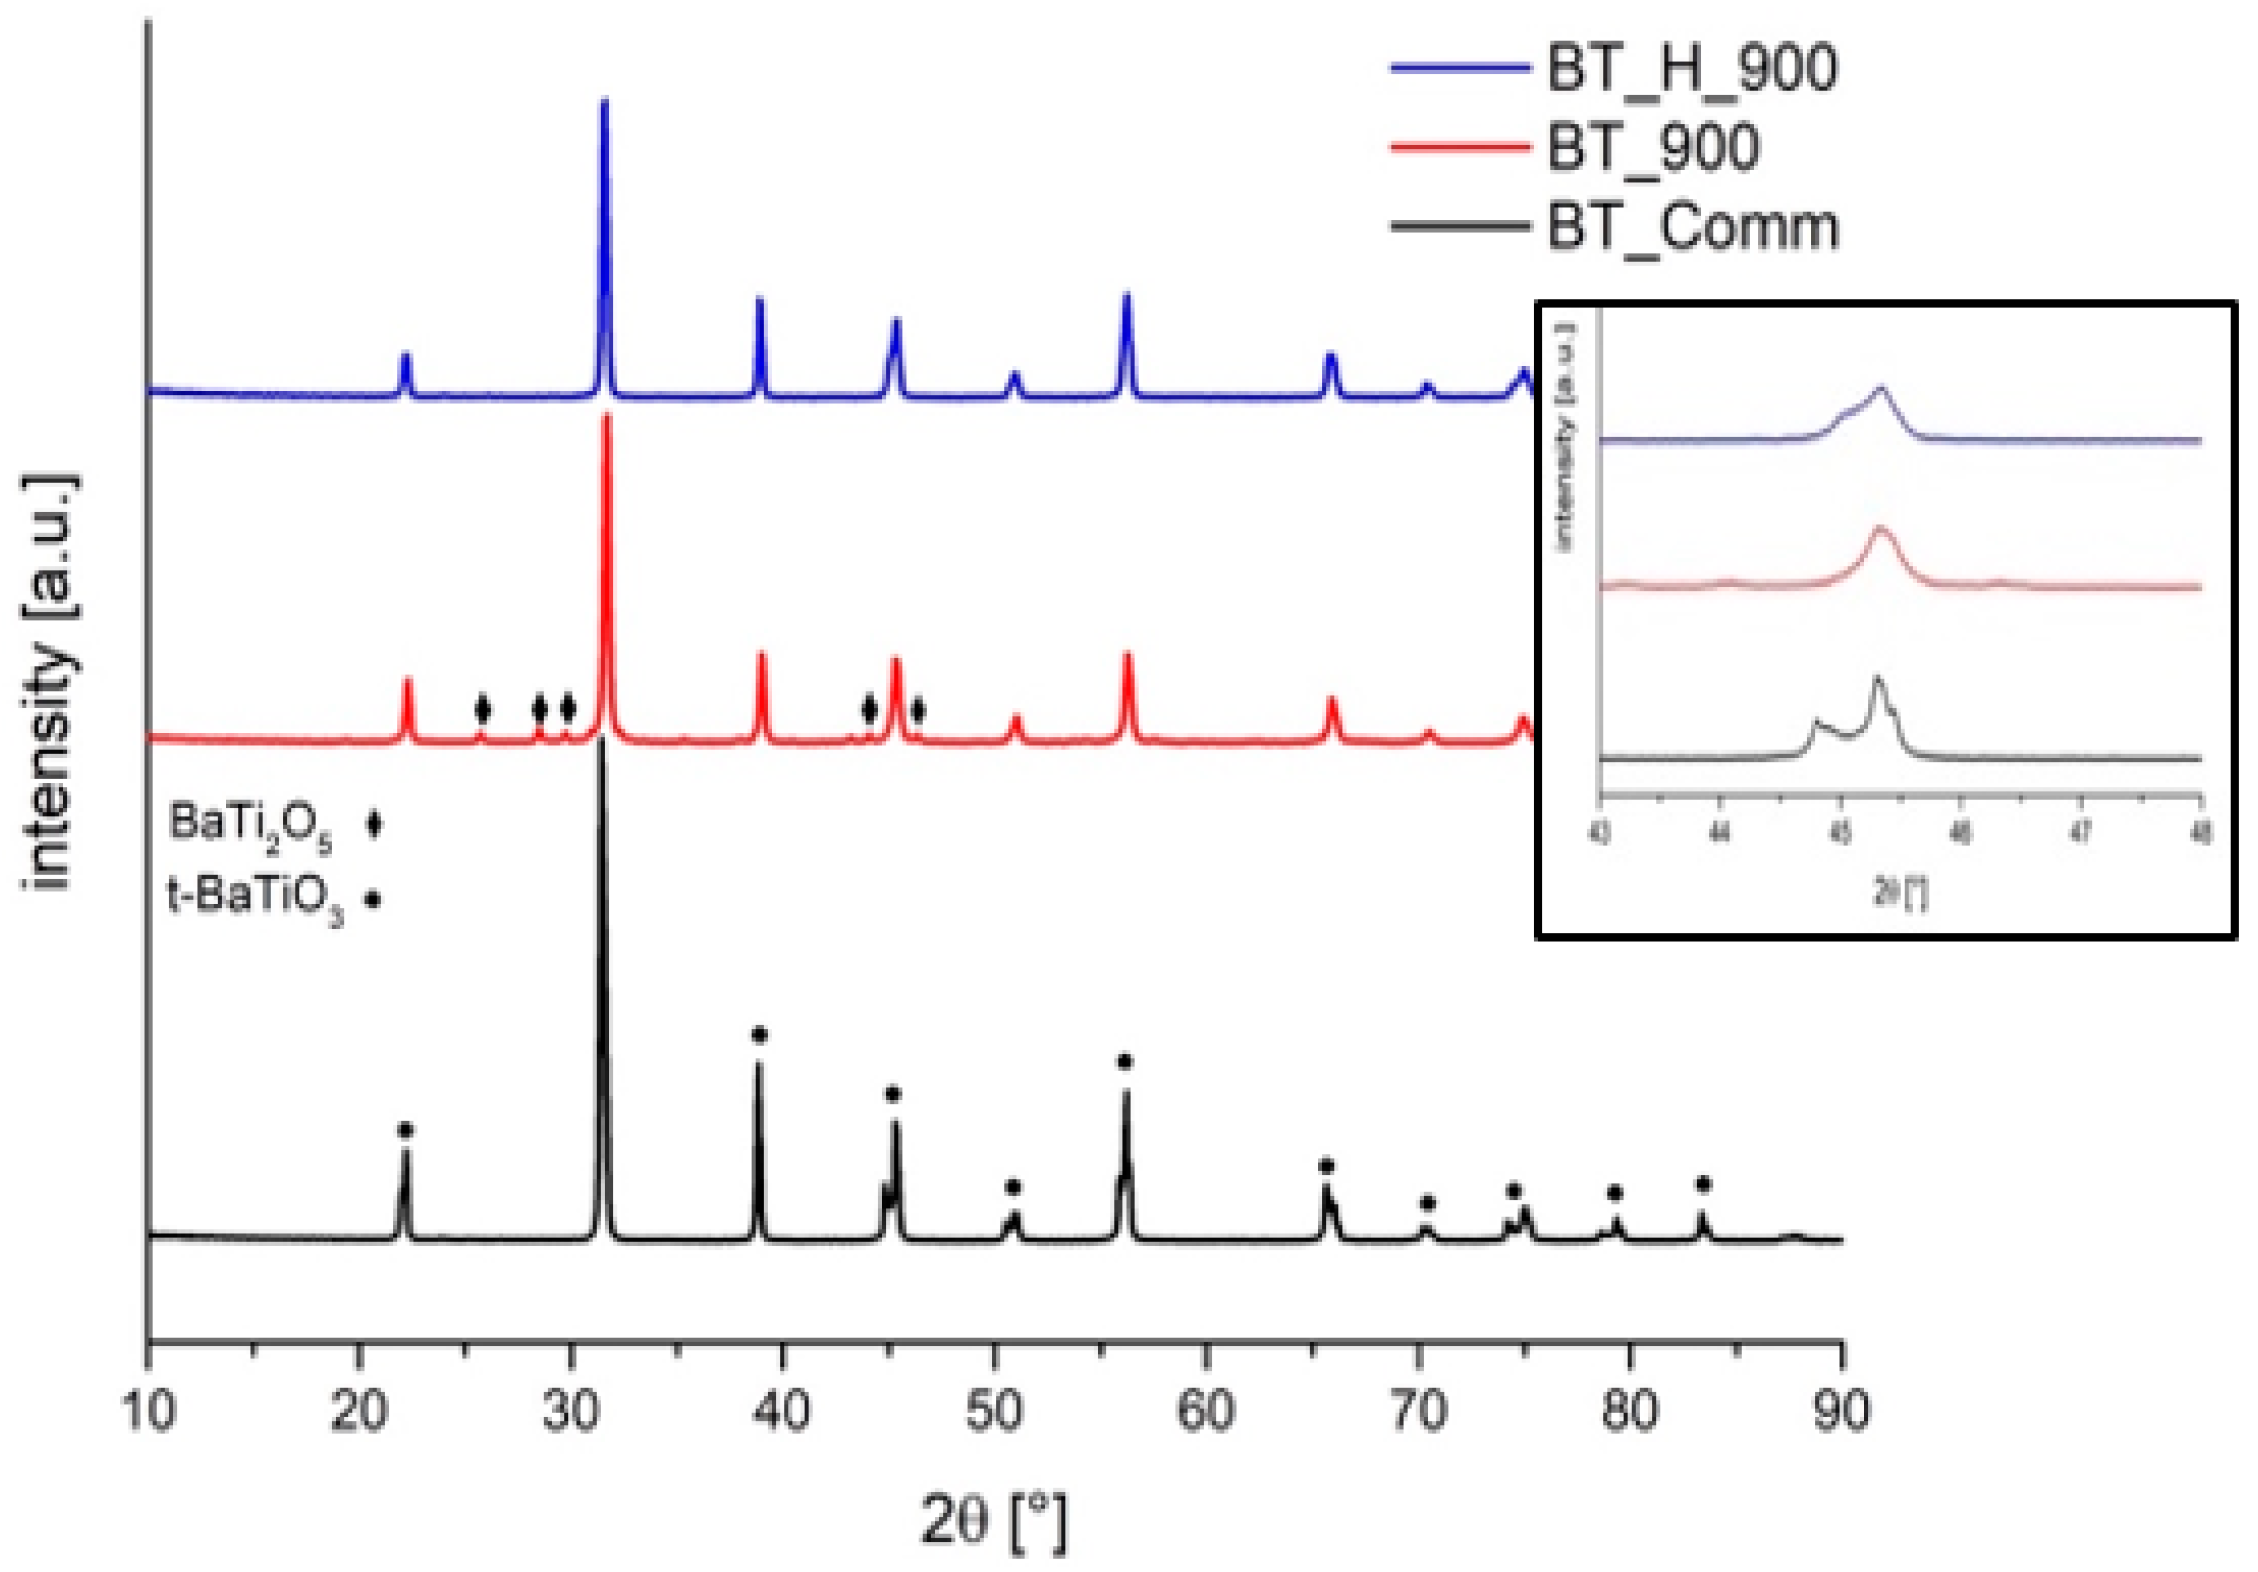
| Sample | BT_comm | BT_900 | BT_H_900 | BT_H4h_900 | BT_H6h_900 | BT_H8h_900 |
|---|---|---|---|---|---|---|
| Phase [wt.%] | Tetra | Tetra–Other | Tetra–Cubic | Tetra–Cubic | Tetra–Cubic | Tetra–Cubic |
| 100 | 85(2)–15(2) | 75(1)–25(1) | 73(3)–27(3) | 74(3)–26(3) | 78(2)–22(2) | |
| Crystallite (std.dev) [nm] | 114(1) | 46(1)–na | 77(4)–82(14) | 75(1)–114(18) | 73(3)–92(16) | 75(4)–171(46) |
| a [Å] (tetra) | 3.9995 | 4.0105 | 4.0039 | 4.0053 | 4.0049 | 4.0042 |
| c [Å] (tetra) | 4.0393 | 4.0239 | 4.0333 | 4.0305 | 4.0318 | 4.0342 |
| t = c/a (tetra) | 1.010 | 1.0033 | 1.0074 | 1.0063 | 1.0069 | 1.0075 |
| Rwp [%] | 15.09 | 12.94 | 18.05 | 20.00 | 16.04 | 15.43 |
| Ba/Ti mol Ratio | mol% Ba | mol% Ti | mol K% | mol Na% | mol Ca% | mol Bi% | |
|---|---|---|---|---|---|---|---|
| BT_H_900 | 0.86 | 45.1 | 52.2 | 2.6 | 0.1 | - | - |
| BT_H_Na_900 | 0.76 | 40.0 | 52.6 | 5.5 | 1.9 | - | - |
| BT_H_Ca_900 | 0.74 | 38.6 | 52.1 | 0.2 | 1.7 | 7.6 | - |
| BT_H_Bi_900 | 0.82 | 37.9 | 46.3 | 10.1 | 3.4 | - | 2.3 |
| BT_H_NaBi_900 | 0.81 | 41.7 | 51.6 | 0.3 | 2.0 | - | 4.4 |
| BT_H_Na_900 | BT_H_Ca_900 | BT_H_Bi_900 | BT_H_NaBi_900 | |
|---|---|---|---|---|
| Mean (nm) | 134 ± 37 | 149 ± 33 | 146 ± 39 | 141 ± 37 |
| Sample | BT_H_900 | BT_H_Na_900 | BT_H_Ca_900 | BT_H_Bi_900 | BT_H_NaBi_900 |
|---|---|---|---|---|---|
| Phase [wt.%] | Tetra–Cubic | Tetra–Cubic | Tetra–Cubic | Tetra–Cubic | Tetra–Cubic |
| 75(1)–25(1) | 56(2)–44(2) | 76(2)–24(2) | 84(4)–16(3) | 90(1)–10(1) | |
| Crystallite (std.dev) [nm] | 77(4)–82(14) | 27(1)–57(1) | 62(1)–112(30) | 47(2)–12(1) | 60(1)–7(1) |
| a [Å] (tetra) | 4.0039 | 4.0101 | 4.0007 | 4.0020 | 4.0101 |
| c [Å] (tetra) | 4.0333 | 4.0331 | 4.0286 | 4.0155 | 4.0221 |
| t = c/a (tetra) | 1.0074 | 1.0057 | 1.0070 | 1.0034 | 1.0030 |
| Rwp [%] | 18.05 | 17.00 | 21.49 | 14.89 | 17.89 |
Publisher’s Note: MDPI stays neutral with regard to jurisdictional claims in published maps and institutional affiliations. |
© 2021 by the authors. Licensee MDPI, Basel, Switzerland. This article is an open access article distributed under the terms and conditions of the Creative Commons Attribution (CC BY) license (https://creativecommons.org/licenses/by/4.0/).
Share and Cite
Zamperlin, N.; Ceccato, R.; Fontana, M.; Pegoretti, A.; Chiappini, A.; Dirè, S. Effect of Hydrothermal Treatment and Doping on the Microstructural Features of Sol-Gel Derived BaTiO3 Nanoparticles. Materials 2021, 14, 4345. https://doi.org/10.3390/ma14154345
Zamperlin N, Ceccato R, Fontana M, Pegoretti A, Chiappini A, Dirè S. Effect of Hydrothermal Treatment and Doping on the Microstructural Features of Sol-Gel Derived BaTiO3 Nanoparticles. Materials. 2021; 14(15):4345. https://doi.org/10.3390/ma14154345
Chicago/Turabian StyleZamperlin, Nico, Riccardo Ceccato, Marco Fontana, Alessandro Pegoretti, Andrea Chiappini, and Sandra Dirè. 2021. "Effect of Hydrothermal Treatment and Doping on the Microstructural Features of Sol-Gel Derived BaTiO3 Nanoparticles" Materials 14, no. 15: 4345. https://doi.org/10.3390/ma14154345
APA StyleZamperlin, N., Ceccato, R., Fontana, M., Pegoretti, A., Chiappini, A., & Dirè, S. (2021). Effect of Hydrothermal Treatment and Doping on the Microstructural Features of Sol-Gel Derived BaTiO3 Nanoparticles. Materials, 14(15), 4345. https://doi.org/10.3390/ma14154345