2. Materials and Methods
General. All reagents were ACS grade and were used without further purification. ACS glacial acetic acid and anhydrous N-Methyl Pyrrolidone (NMP) were used as received; DMF was purified before use. 1H and 13C NMR spectra were recorded with deuterated solvents using Bruker 400 or 600 MHz NMR spectrometers, calibrated using the stated residual protonated solvent as an internal reference. Chemical shifts (δ) are reported in parts per million (ppm) and coupling constants (J.) are measures in hertz (Hz). Fourier-transform infrared (FT-IR) spectroscopy was performed with a Perkin Elmer Spectrum One spectrometer.
Synthesis of (2) via Hydrogenation. A Parr reactor was purged with argon then loaded with 3 (384 mg, 1.00 mmol), 10% Pd(OH)2/C (10 mg) and EtOH (10 mL). The reactor was pressurized to 120 psi with H2 and heated at 100 °C in an oil bath for 40 h. After cooling to room temperature (RT), the solution was vacuum filtered through celite with hot EtOH and the filtrate concentrated under vacuum to give a brown solid (293 mg, 99% yield), which was placed under argon and used immediately. 13C NMR (100 MHz, DMSO-d6; ppm): 143.1, 96.0. IR (cm−1): 3136, 1546.
Synthesis of COF 4. To a round-bottom flask equipped with stir bar and condenser were added 3 (1.07 g, 2.79 mmol), Zinc (2.70 g, 41.28 mmol), AcOH (30 mL) and 3 drops of H2O. The mixture was heated with stirring at 60 °C for 6 h, cooled and filtered, washing the solids with AcOH. The AcOH was removed under vacuum and the solid purged with argon. NMP (5 mL), hexaketocyclohexane 8 H2O (2.79 mmol) and 3 drops of H2SO4 were added and the mixture was heated at 175 °C for 24 h. The mixture was cooled to RT and the black solid was crashed out with ether. Soxhlet extraction with H2O (12 h) then EtOH (12 h) followed by drying under high vacuum for 3 days gave 604 mg of black solid. Alternatively, 2 from the hydrogenation procedure above was used in replace at equal molar equivalent to 1.
Synthesis of COF 5. To a glass Parr reactor was added 4 (400 mg), K2CO3 (335 mg, 2.40 mmol), PdCl2(PPh3)2 (65 mg, 0.09 mmol), DMF (5 mL) and H2O (2 mL). The mixture was purged 3× with CO and then pressurized to 50 psi followed by heating with stirring at 50 °C for days. The mixture was cooled to RT, filtered, Soxhlet extracted with H2O (22 h) then EtOH (9 h) followed by drying under high vacuum for 3 days to give 300 mg of a black solid.
Characterization methods. An amount of 1.25 mg of COF
5 was initially dispersed in 20 mL of 10 mM NaOH solution to convert the group to COONa by sonicating the mixture for 24 h. The COO- ions in the solution were then analyzed with 0.020021 M HCl solution (standardized by tris(hydroxymethyl) aminomethane, 99.9%, Sigma). The amount of COOH groups in the COF samples were calculated from the consumption of the standardized HCl solution, which equals to VHCl × CHCl, where VHCl is the titrant volume (mL) and CHCl is the molar concentration of the titrant, respectively. Powder X-ray diffraction (XRD) was carried out using a Rigaku Smart Lab X-ray diffractometer (XRD, with Cu Kα radiation source (λ = 1.544 A). Using peak positions, d-spacing was calculated based on Bragg’s law using peak positions. The morphology of COF films was analyzed by SEM (FEI Quanta FEG 450 FESEM. All the samples were coated with carbon. For cross-sectional imaging, the films were immersed in liquid nitrogen and were then snapped with flat tweezers. TEM was performed using a FEI Tecnai G2 F20 200 kV TEM. TEM grids of the as-prepared samples were prepared by drop-casting the dispersed COF solution onto holey carbon film TEM grids and then wicking away excess solution after several seconds. Thermal gravimetric analyses (TGA) were performed in a TA Instruments SDT Q600 thermogravimetric analyzer for temperatures ranging from 25 to 1200 °C, with a heating rate of 3 °C/min under air and argon, respectively (
Figure S9).
Membrane fabrication. Graphene oxide (GO) films were prepared by conventional doctor blade casting of a viscous GO ink (~40 mg/mL) onto a track-etched polycarbonate membrane (TEPC, pore size: 0.2 μm). Resulting hybrid films were dried overnight under ambient lab conditions (Akbari et al., 2017). Using the same solution preparation procedure as for titration tests, COF 5 was sufficiently exfoliated in basic water (10 mM NaOH) by ultra-sonication for 24 h. Sequentially, COF 5 films were fabricated by drop-casting the dispersed COF 5 solution onto a TEPC support followed by drying overnight in a vacuum oven at 60 °C.
Cation selectivity. The apparatus for ion selectivity measurement consists of a U-shaped tube with a diameter of 1.6 cm, which was divided by a membrane into two compartments, referred to as feed and permeate side, respectively. The feed compartment was filled with 0.1 M of different ammonium solutes in ethanol. The permeate side was filled with pure ethanol. Both sides were filled to a constant level of 10 cm. Each side has a platinum electrode that is connected to a potentiostat (Ivium Technologies). Ion transport can be probed by monitoring electrical current of the whole setup under a wide voltage range (0–2 V). Ethanol was chosen as the electrolyte since COF 5 membrane dissolves in water, possibly due to the -COOH groups.
The cation selectivity of COF
5 and GO membranes were examined by evaluating their conductivity towards various organic ammonium salts, with anion being the same (p-toluenesulfonate, pTSO). The radii and hydrated radii of the organic ammonium cations used are summarized in
Table S1 of the SI.
3. Results
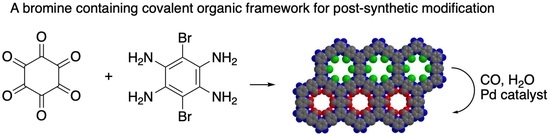
Synthesis of COF 4 and 5. Synthesis of a bromine containing COF involved condensation of hexaketocyclohexane (HKH)
1 [
19,
20] with dibromotetraamine
2 using conditions reported by Baek and co-workers (
Figure 1) [
12]. Dibromo tetraamine
2 is typically prepared from benzothiadiazole
3 [
21,
22] by zinc reduction in acetic acid and used without isolation by filtration and subsequent reaction in the acetic acid [
21,
23,
24]. We found that the use of the higher boiling
N-Methyl Pyrrolidone (NMP) as a solvent was necessary and thus the acetic acid was removed in-vacuum after filtration of
2. Condensation of
1 and
2 in NMP with trace H
2SO
4 at 175 °C for 24 h produces a black solid. Characterization of
4 indicated a dependence on both solvent and temperature of the condensation reaction as noted in the
supplementary information. For example, lower temperatures gave rise to amorphous materials. We also developed an alternative reduction in
3 using hydrogenation over Pd(OH)
2/C in ethanol that produces tetraamine
2 as a brown solid in 99% yield. We found this to be a significantly easier method for the preparation of
2; however, as the free-base it had to be used immediately otherwise inferior samples of COF
4 were produced. Alternatively, the use of
2 from the zinc reduction consistently produced quality COF as determined by TEM studies (see
Figure S8 in the Supplementary Materials for a comparison of TEM images).
Two methods for post-synthetic modification were studied. The incorporation of bromines into the pores of
4 provides for a convenient method for metal-catalyzed substitutions. Thus, transformation of COF
4 into the carboxylic acid
5 was performed next. COF
4 was treated with PdCl
2(PPh
3)
2, K
2CO
3, 1 atm CO, in H
2O/DMF at 90 °C for three days. Upon filtration and Soxhlet extraction of the black solid, the IR displayed a C=O stretch at 1680 cm
−1 and a broad OH stretch from 3300 to 3000 cm
−1 both consistent with carboxylic acid COF
5 (see
Supplementary Figure S4 for comparison of
4 and
5).
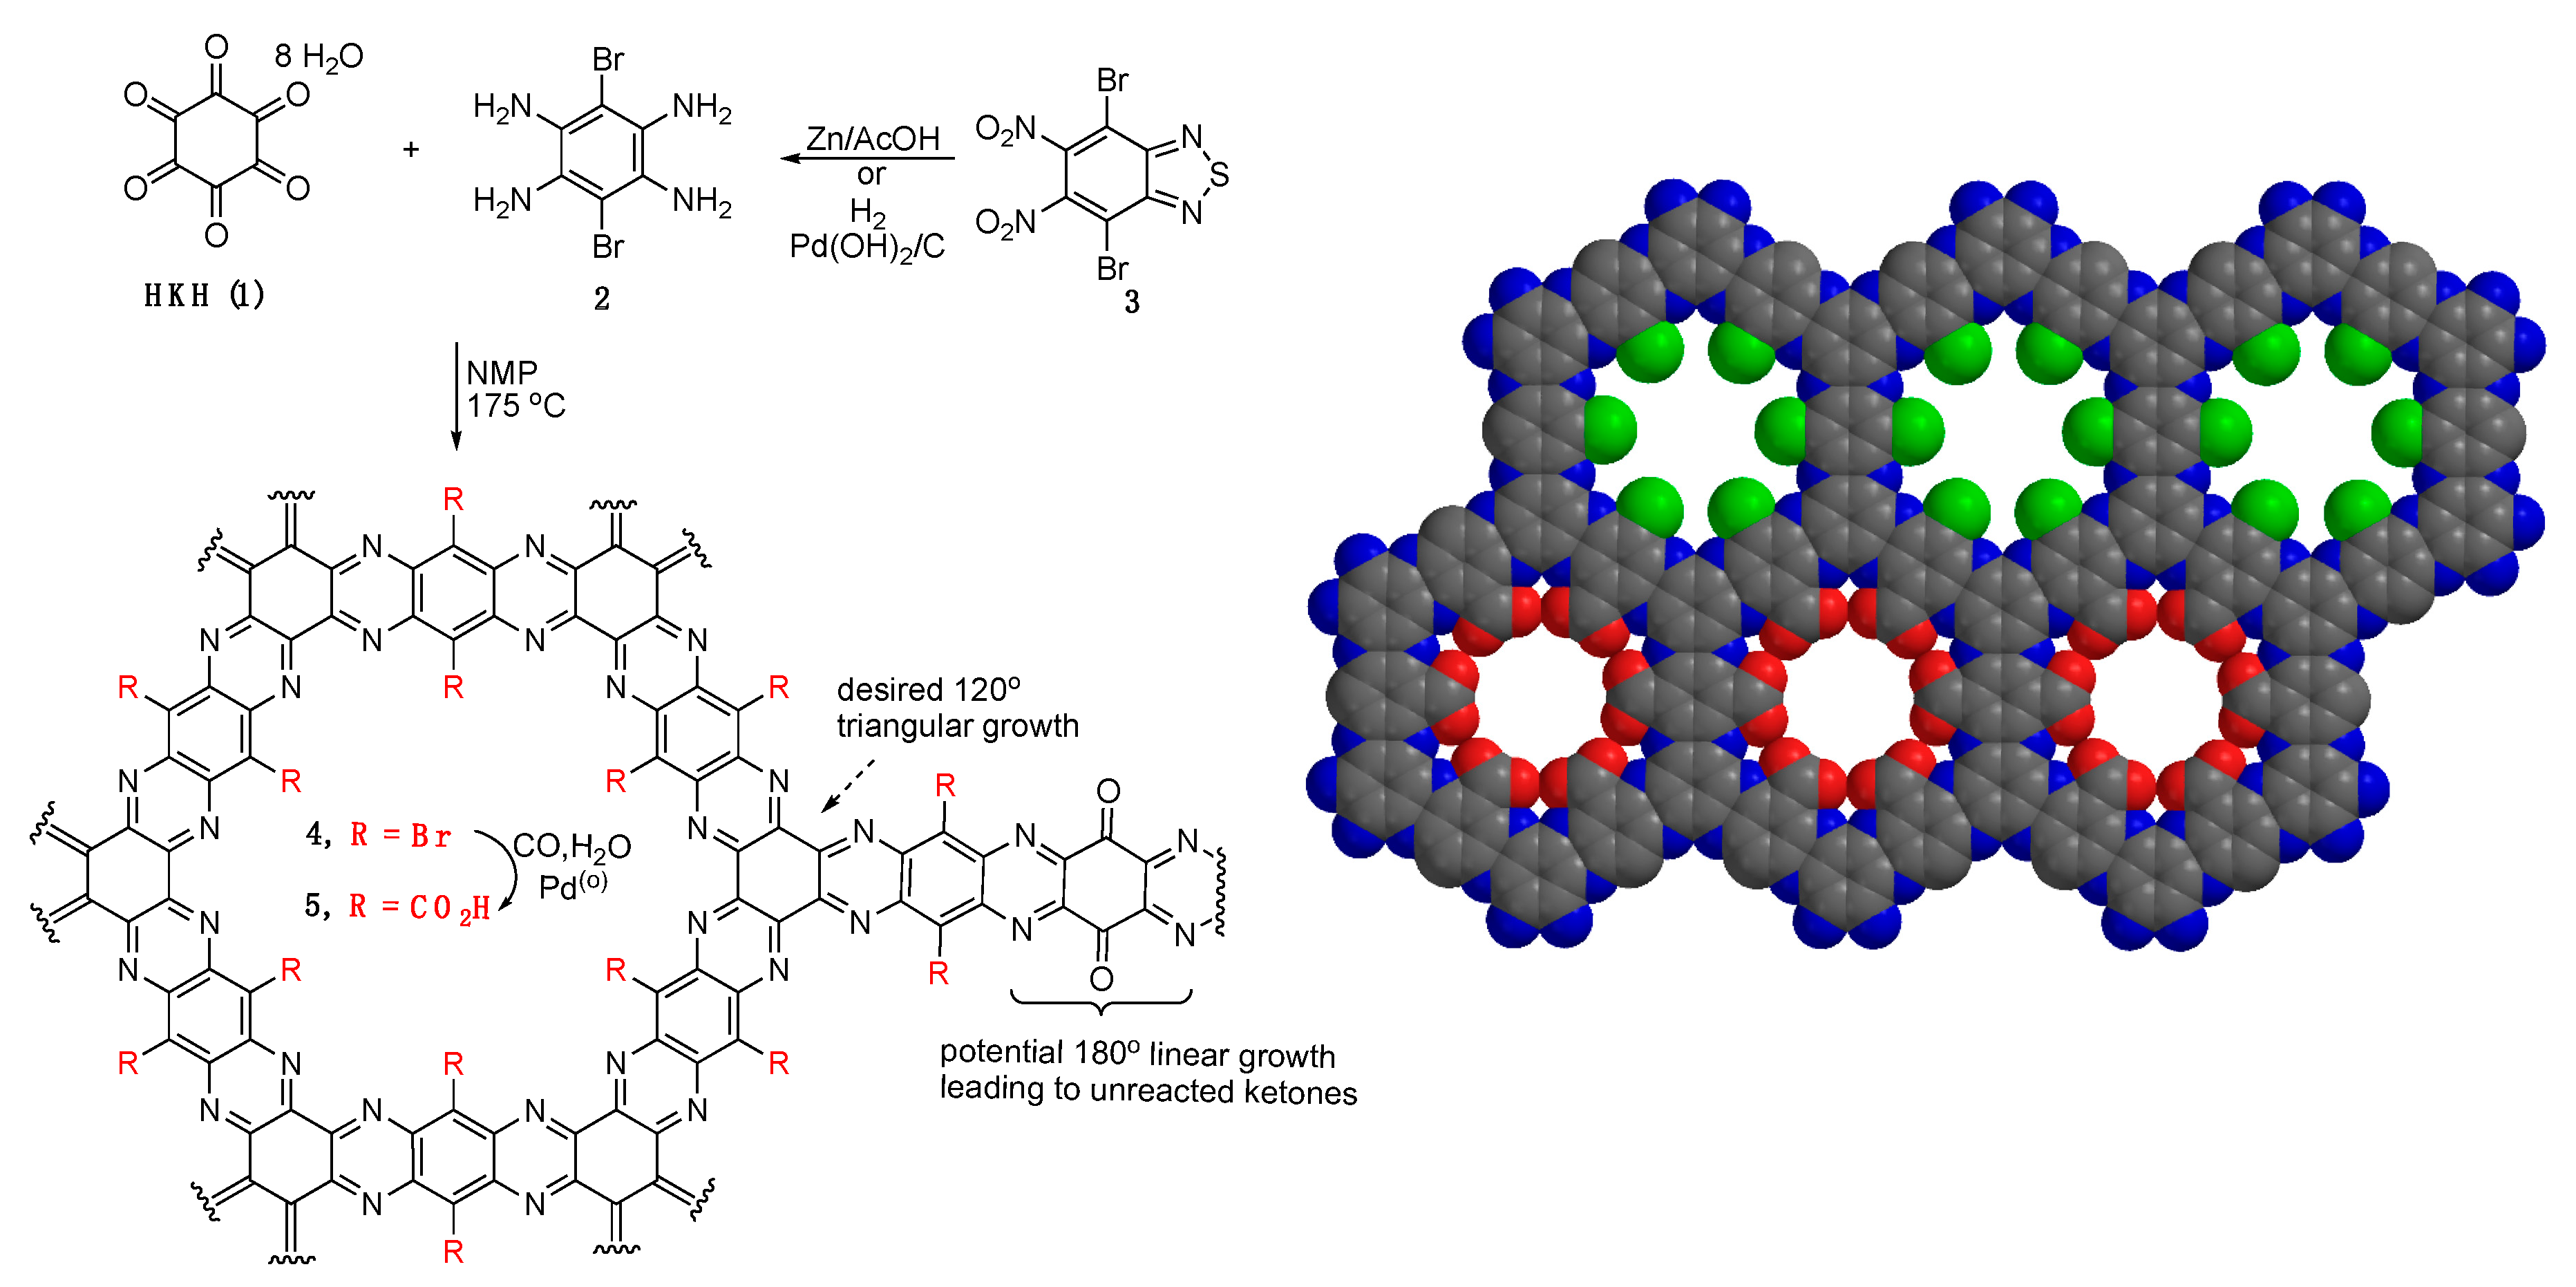
Additional characterization of both
4 and
5 further established the structures. TEM images were obtained for COF
4 as higher contrast images are more easily obtained on the brominated structure due to the presence of the highly electron scattering bromine atoms (
Figure 2). We were able to locate regions that did show crystallites with stacked near hexagonal nanocrystallites (
Figure 2A) as expected given the hexagonal symmetry of the COF. Higher magnification TEM images as shown in
Figure 2B show lattice periodicity on the periphery of the flakes. The periodicity of these linear and hexagonal structures ranges from about 3.2 to more than 5 nm, which was larger than the pore spacing measured from the molecular modeling of 1.66 nm of the single layer structure. Since these distances are observed on areas where there are multiple COF layers, they are probably due to Moiré patterns from selected areas of multilayers each with some order. Electron diffraction of the COF flakes illustrated an inconsistent hexagonal pattern as was more routinely observed in TEM images of COFs from our previously published work.
13 Rather more random diffraction spots or diffraction rings were measured that are typical of either less ordered or amorphous materials (
Figure 2C). The powder X-ray diffraction results of COFs
4 and
5 reveals a main broad peak at 2θ = 24°, which is attributed to the stacking arising from the (002) plane (see
Supplementary Figure S5), corresponding to interlayer d-spacing of about 0.37 nm. The width of this peak indicates the COF is semi-crystalline but not highly ordered.
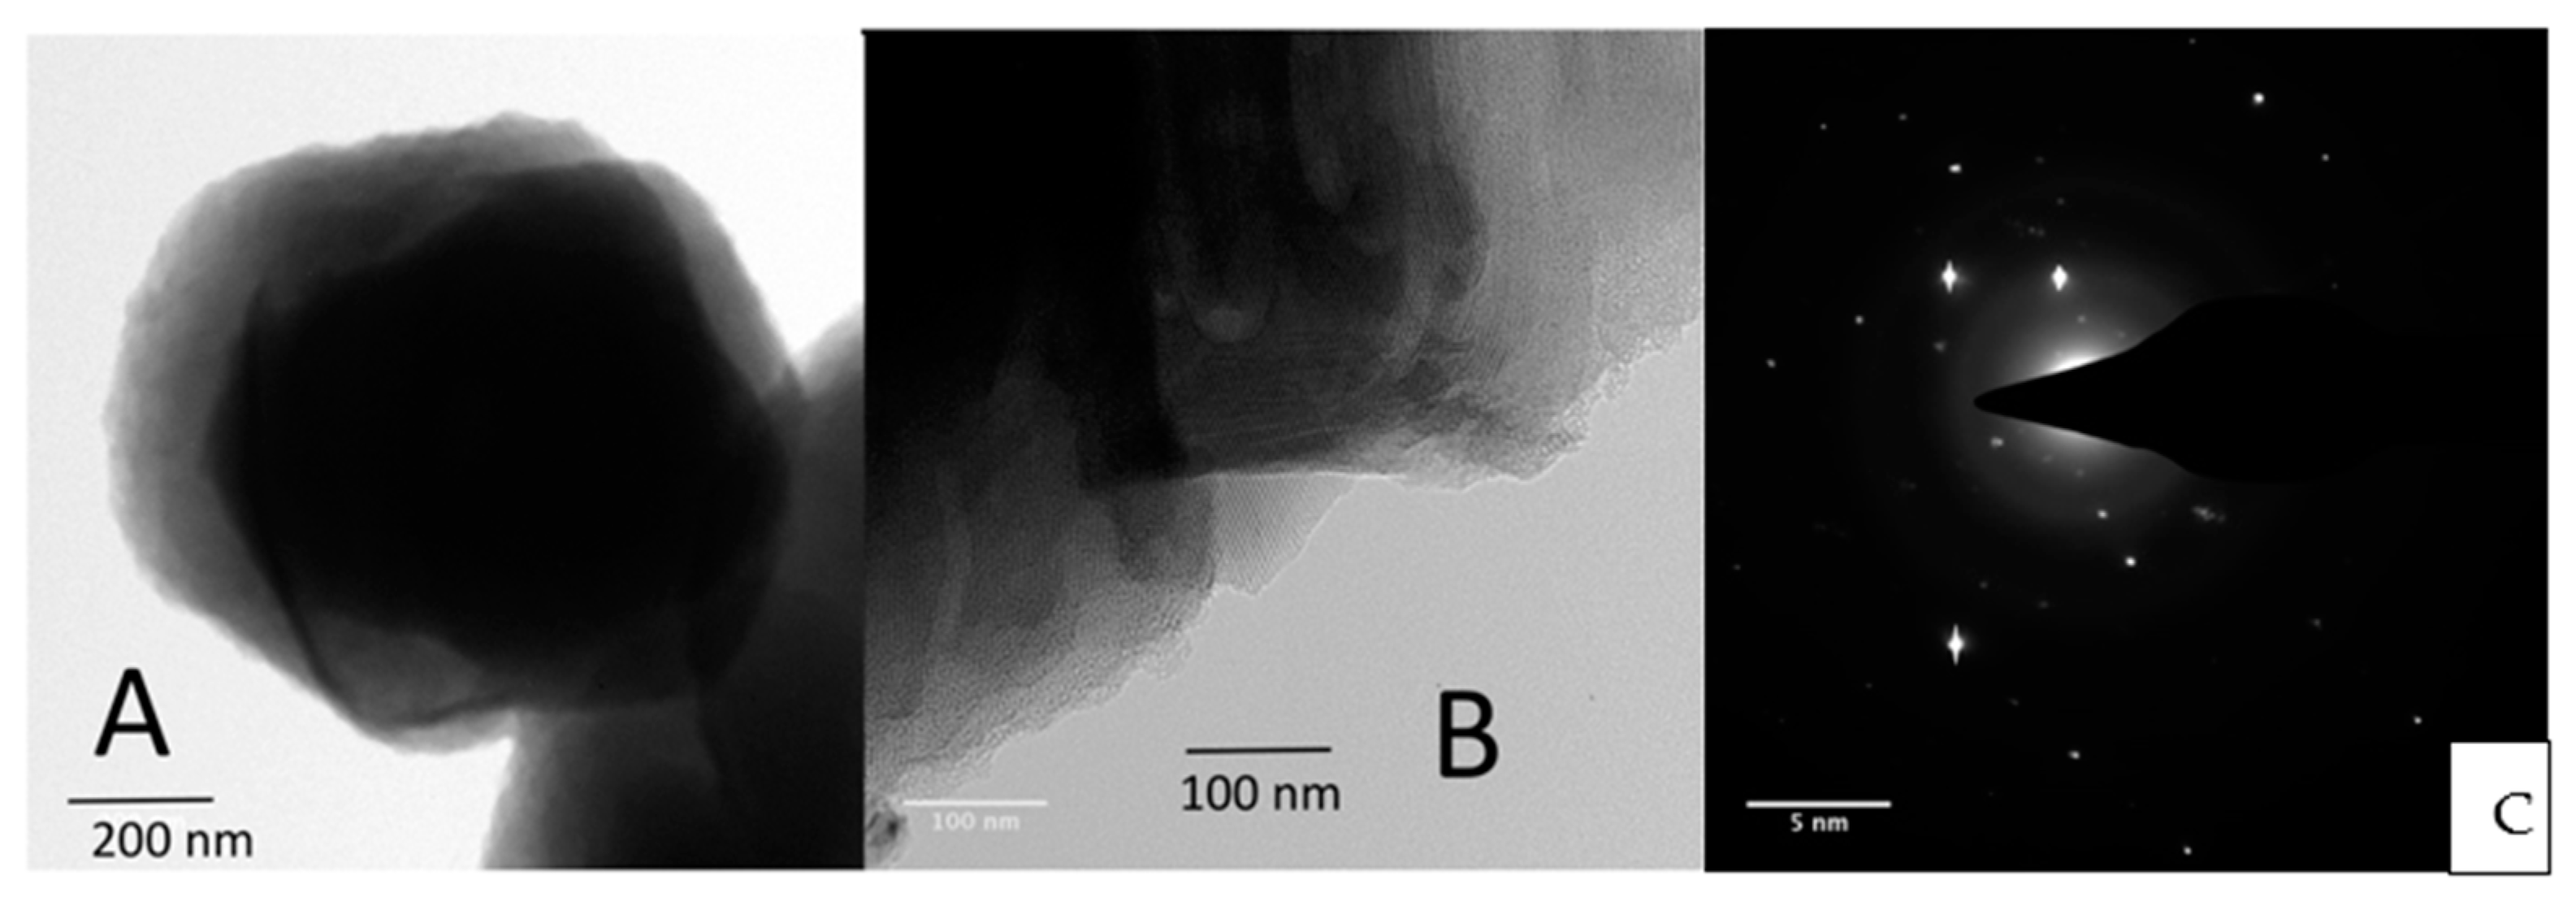
Next, we carried out acid-base titration experiments to measure the amount of -COOH groups in the carboxylated COF samples. COF
5 was dispersed in a 10 mM aqueous NaOH solution and sequentially titrated by standardized 20.02 mM HCl solution. The titration assumed two reaction steps as shown in the
Figure 3, where HCl first neutralized the excess NaOH, followed by the protonation of -COONa in the COF.
Figure 3 shows that simulated titration curves matched the experimental titration curve as expected. The following calculation was based on the two reactions. The amount of the COOH groups the sample of COF was calculated to be 11.6 × 10
−6 moles (see Experimental Section for detail). However, the theoretical amount of COOH in 1.25 mg of COF is 9.77 × 10
−6 moles indicating that the experimental COOH amount is ~16% higher than the theoretical amount. This result indicates that the synthesized COF is not perfectly ordered, due to potential linear defects in its structure as shown in
Figure 1. The fact that the experimental result is higher may be due to the fact that this calculation requires both the molecular weight of the COF be known as well as the particle size. The molecular weight of the ordered COF is precise however since the disorder can result in both open space and extra functional groups in the pores from defects above or below a given layer this results in an unknown molecular weight and thus number of actual carboxylates in the structure is also not precise. The termination of the edges of COF flakes by either amine or ketone moieties will also influence both the measurement of free ketone groups and carboxylates (in COF
5), however, this effect is not significant with flake sizes of about 100 nm or greater since a 100 nm 2D-COF flake has at most about 6% terminating groups that could be divided between amines and ketones.
The second post-modification reaction was performed by converting unreacted COF carbonyls to imines with the use of a primary amine. To demonstrate this, a sample of COF
4 was placed in an NMR tube loaded with DMSO-d
6, isopropyl amine, cyclohexane and sealed under argon. The mixture was heated to 100 °C and the disappearance of the amine was monitored by
1H NMR using cyclohexane as a standard. In multiple experiments, the disappearance of the amine was observed in all cases along with the appearance of a broad peak shifted 0.1 ppm downfield of the amine methyl group (see
Supplementary Figure S6). Filtration of the COF through silica followed by
1H NMR of the filtrate displayed only the cyclohexane standard, thus verifying the incorporation of the isopropyl amine into the COF. The molar amount of isopropyl amine reacted corresponds less than the number of ketone groups expected with the possible termination of all 2D COF flakes with unreacted keto groups even if it had no defects due to the existence of the linear defects in
Figure 1. Most importantly, this experiment demonstrates a facile method for post COF synthesis to modify edge sites in a COF sample and may be useful to stabilize the edges, passivate defects or even cross-link smaller COF flakes into larger aggregates using branched diamines.
Ion-sieving measurements. Given the small pores of these 2D-COFs, we next used our previously published ion-sieving method to investigate the ion conductivity of a COF
5 membrane [
13]. This work demonstrated that a more highly ordered 2D-COF with carboxylated pores, synthesized using precursors that eliminated the possibility of the linear defects in their structure, rejects tetraalkyl ammonium cations of a size larger than the COF pore diameter. In that case R
4N
+ ions (R = linear alkyl chains of various lengths) that are smaller than the COF pore diameter passed through that COF membrane and provided a measurement of ion conductivity based on pore size, i.e., smaller sized ions pass through an ordered COF membrane whereas larger ones are almost completely rejected. In this study, COF
5 and GO hybrid membranes were made by vacuum filtration using track-etched polycarbonate (TEPC) as a membrane support. GO membranes were used for comparison given their proposed use as size-selective ion transport membranes [
25].
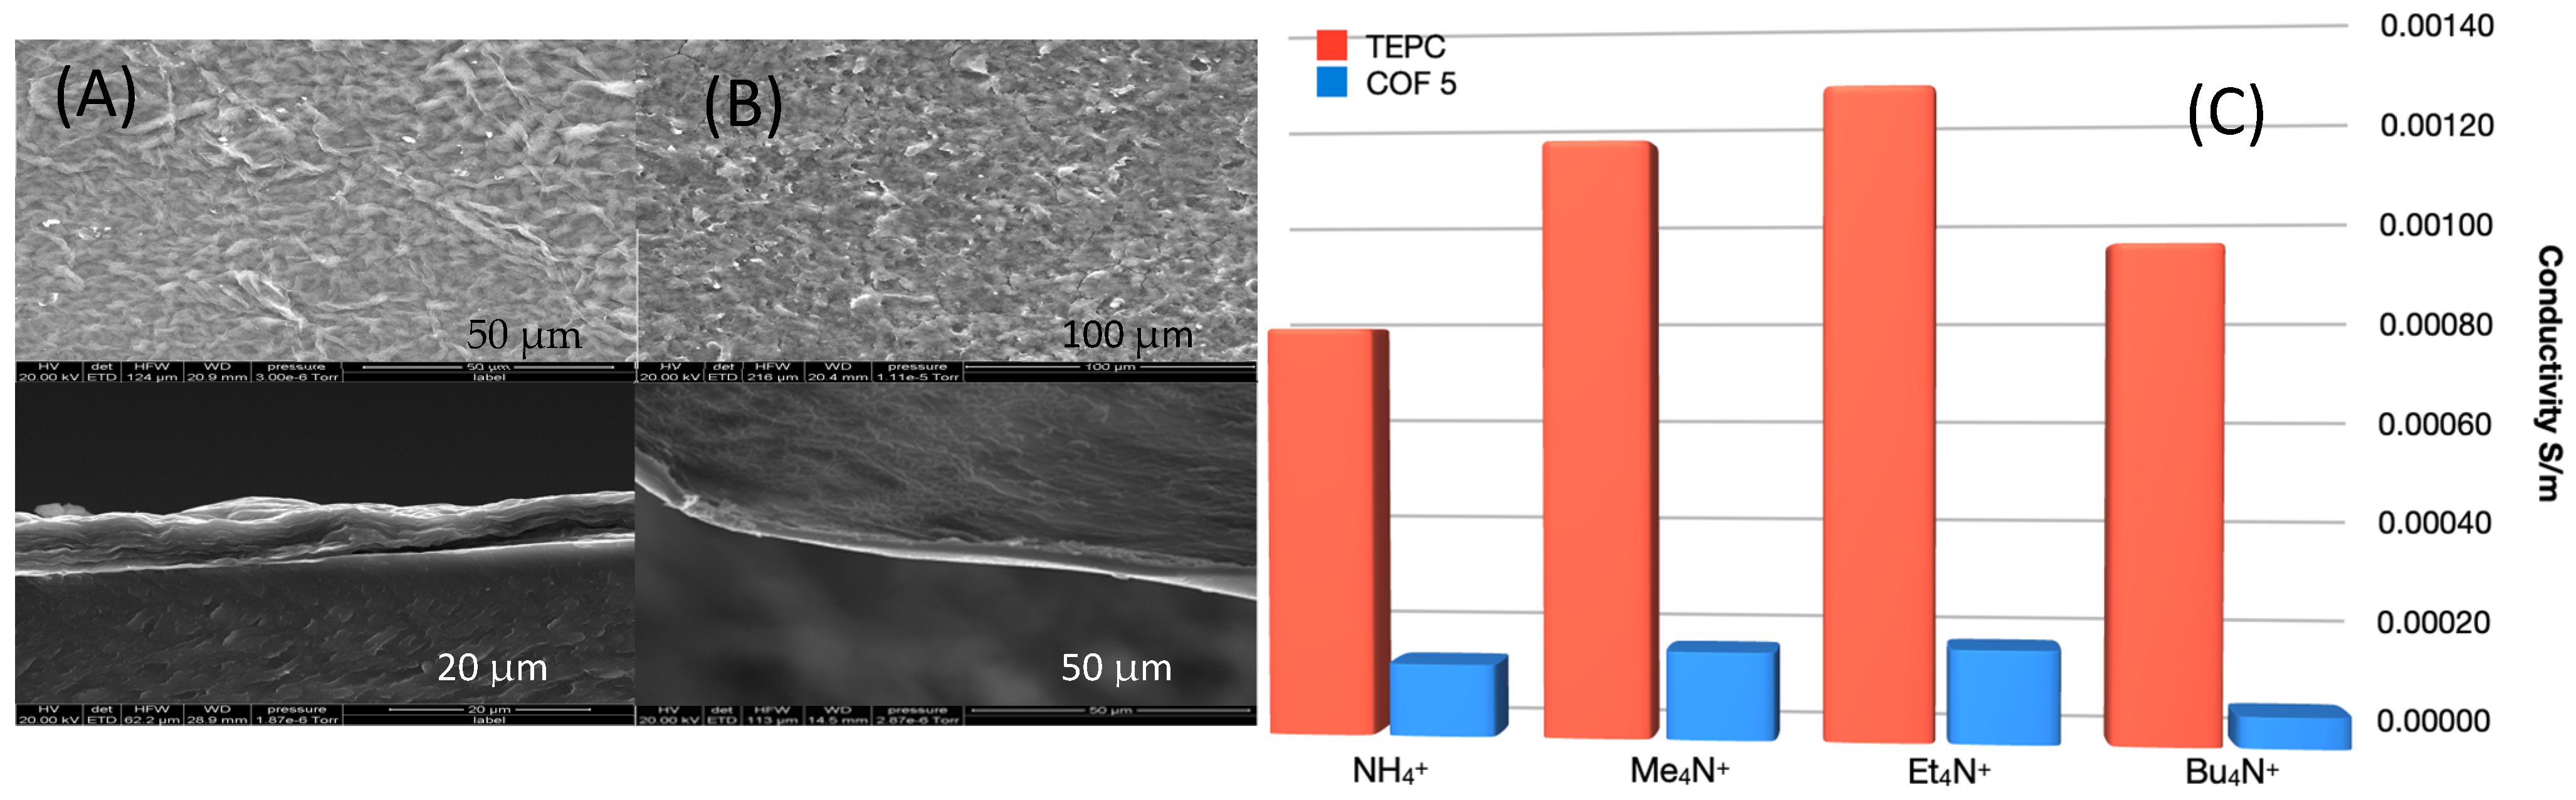
Figure 4A,B illustrates the top surface SEM images of the COF membranes that show a similar morphology to GO membranes. While GO cross-sectional images display the well-known layered structure, COF cross-sections presented a continuous, dense layer on top of the TEPC substrate.
Figure 4C illustrates the results from the conductivity measurements. As expected, GO membranes show nearly no ion conductivity as ion transport can occur only via the tortuous path in the thin spaces between the layers that are much smaller than the ions used in this study. Moreover, the TEPC control possess the expected high ion conductivity due to its pore size being much larger than the ions. The COF
5/TEPC-supported membrane showed the lowest conductivity for Bu
4N
+ compared to the other smaller tetraalkyl ammonium ions. However, the Bu
4N
+ ion has ionic radii of more than twice that of COF
5′s pore diameter suggesting that disorder in COF
5 can result in a pore structure with larger pores as can be seen in the simulations presented below, which was also confirmed with Brunauer-Emmett-Teller (BET) analysis (
Supplementary Figure S10). The lower conductivity of NH
4+ compared to Me
4N
+ and Et
4N
+ in both the control TEPC and COF membrane may be attributed to the fact that the NH
4+ is prone to form hydrogen bonds to hydrophilic groups, resulting in larger ion radius in ethanol than its intrinsic radius. R
4N
+ ions (R = alkyl) become less hydrophilic as the chain length of R increases, causing the ionic radius to be closer to their intrinsic one. The trade-off between the increased ion size and decreased hydrophilicity likely explains the slightly higher conductivity in Et
4N
+ than Me
4N
+. Even so, COF
5 does illustrate the ability to inhibit transfer of ions with a specific size threshold.
Growth Mechanism Simulation. The condensation reaction between HKH
1 and tetraamine
2 can result in either the preferred reaction of three tetra-amines around one HKH (120° triangular growth) or a linear 180° condensation leaving two unreacted ketone groups, as illustrated in
Figure 1. It is often presumed that since these Schiff base type condensation reactions are reversible, the COF forming condensation reactions will reach an equilibrium where highly ordered materials are the thermodynamic product and will eventually form. However, equilibrium in this case can be difficult to achieve due to the multiple imine bonds formed in these double condensation reactions making dissociation reactions more unlikely due to a chelate effect. This leads to uncorrected errors that, even if they are as low as one percent, this small level can affect the structure and perhaps the performance of the final materials. Disorder in other 2D-COFs has been noted as Nguyen and Grunwald reported on the origins of disorder in the formation of boronate ester COFs that can be formed closer to equilibrium conditions than these double condensation reactions [
26]. Furthermore, the issues in reversibility and crystallinity in COFs have recently been reviewed that highlight the issues with engineering error-free COFs [
27].
Accordingly, we wanted to develop a convenient method for the visualization of this possibility as it is worthwhile to remember that, unlike most organic synthetic reactions where a crystalline product is formed from nucleation and growth of a crystal from small molecules, formation of highly crystalline 2D-COFs is highly dependent on the initial nucleation since small nuclei are not consumed to promote the growth of larger crystallites as in the Ostwald ripening process. The covalent bonding of COF growth can also result in small nuclei aggregating in random ways via crosslinking reactions. These aggregates may promote further disorder by not stacking properly into ordered multilayers. Additionally, aggregation of small flakes, and the linear errors discussed above, could result in “orphan bonds” as discussed below that may be either amine or keto terminated and thus not accessible to larger monomers or small aggregates to continue growth.
Thus, to better visualize the growth mechanism of these 2D COFs and visualize the 2D and 3D COF structures, we developed a Monte Carlo simulation to help envision the effects the linear addition of the tetra amine on the final 2D and 3D structure of the polymer. Included, and equally important, is the influence of grain boundaries on the growth of even linear defect-free platelets. The simulation allows for controlling the probability of forming the linear structure vs. the desired triangular growth around the core of HKH as the various possible unreacted sites are interrogated and subsequent reaction probabilities are applied. It also allows for multiple nucleation sites that would occur if two small growing platelets come together shortly after nucleation and then, if the growing lattices are out of phase, form grain boundaries either in a linear error-free fashion or with incorporation of the linear defects. The simulation starts with a lattice of symmetry related points, including the midpoint of the pore that would be occupied only when linear defects occur. The rules of the simulation are that when a 2D propagating structure encounters a point where there is no possibility of connecting to an unreacted diketone site on the same layer, it has a 50% probability of continuing to grow on a layer either above or below that layer. If that layer is already blocked by growth, it will have a 100% probability of continued growth on the unblocked layer. There is also a possibility of “orphan bonds” where there is no possibility of propagating on either above or below layers. These orphan bonds are either single or multiple depending on whether further growth is blocked on that layer in only one or both directions. This growth mechanism is related to the growth mechanism of other 2D solid-state materials where crystals thicker than the monolayer are usually formed by so-called screw dislocations since edge growth is favored over nucleation and growth of a new layer on a van der Waals surface. The simulation also allows for simulating up to 15 layers above and below the nucleation plane to allow examination of the propagation of these defects throughout a more 3D platelet. The simulation is available online for readers to experiment showing the implications on the final structure of the materials based on the probability of forming the linear defects (
https://chemicallattice.firebaseapp.com). Parameters such as the statistical number of linear defects, the size of the lattice in both 2D and 3D and the number of nucleation sites can be varied to see their influence on the final structure. The simulation also assumes that the pores are aligned between the layers. We have some evidence in these materials from the TEM images that this is true on both Br substituted and carboxylated pores due to the van der Waals forces between bromines and hydrogen bonding interactions between carboxyl groups controlling the layer stacking.
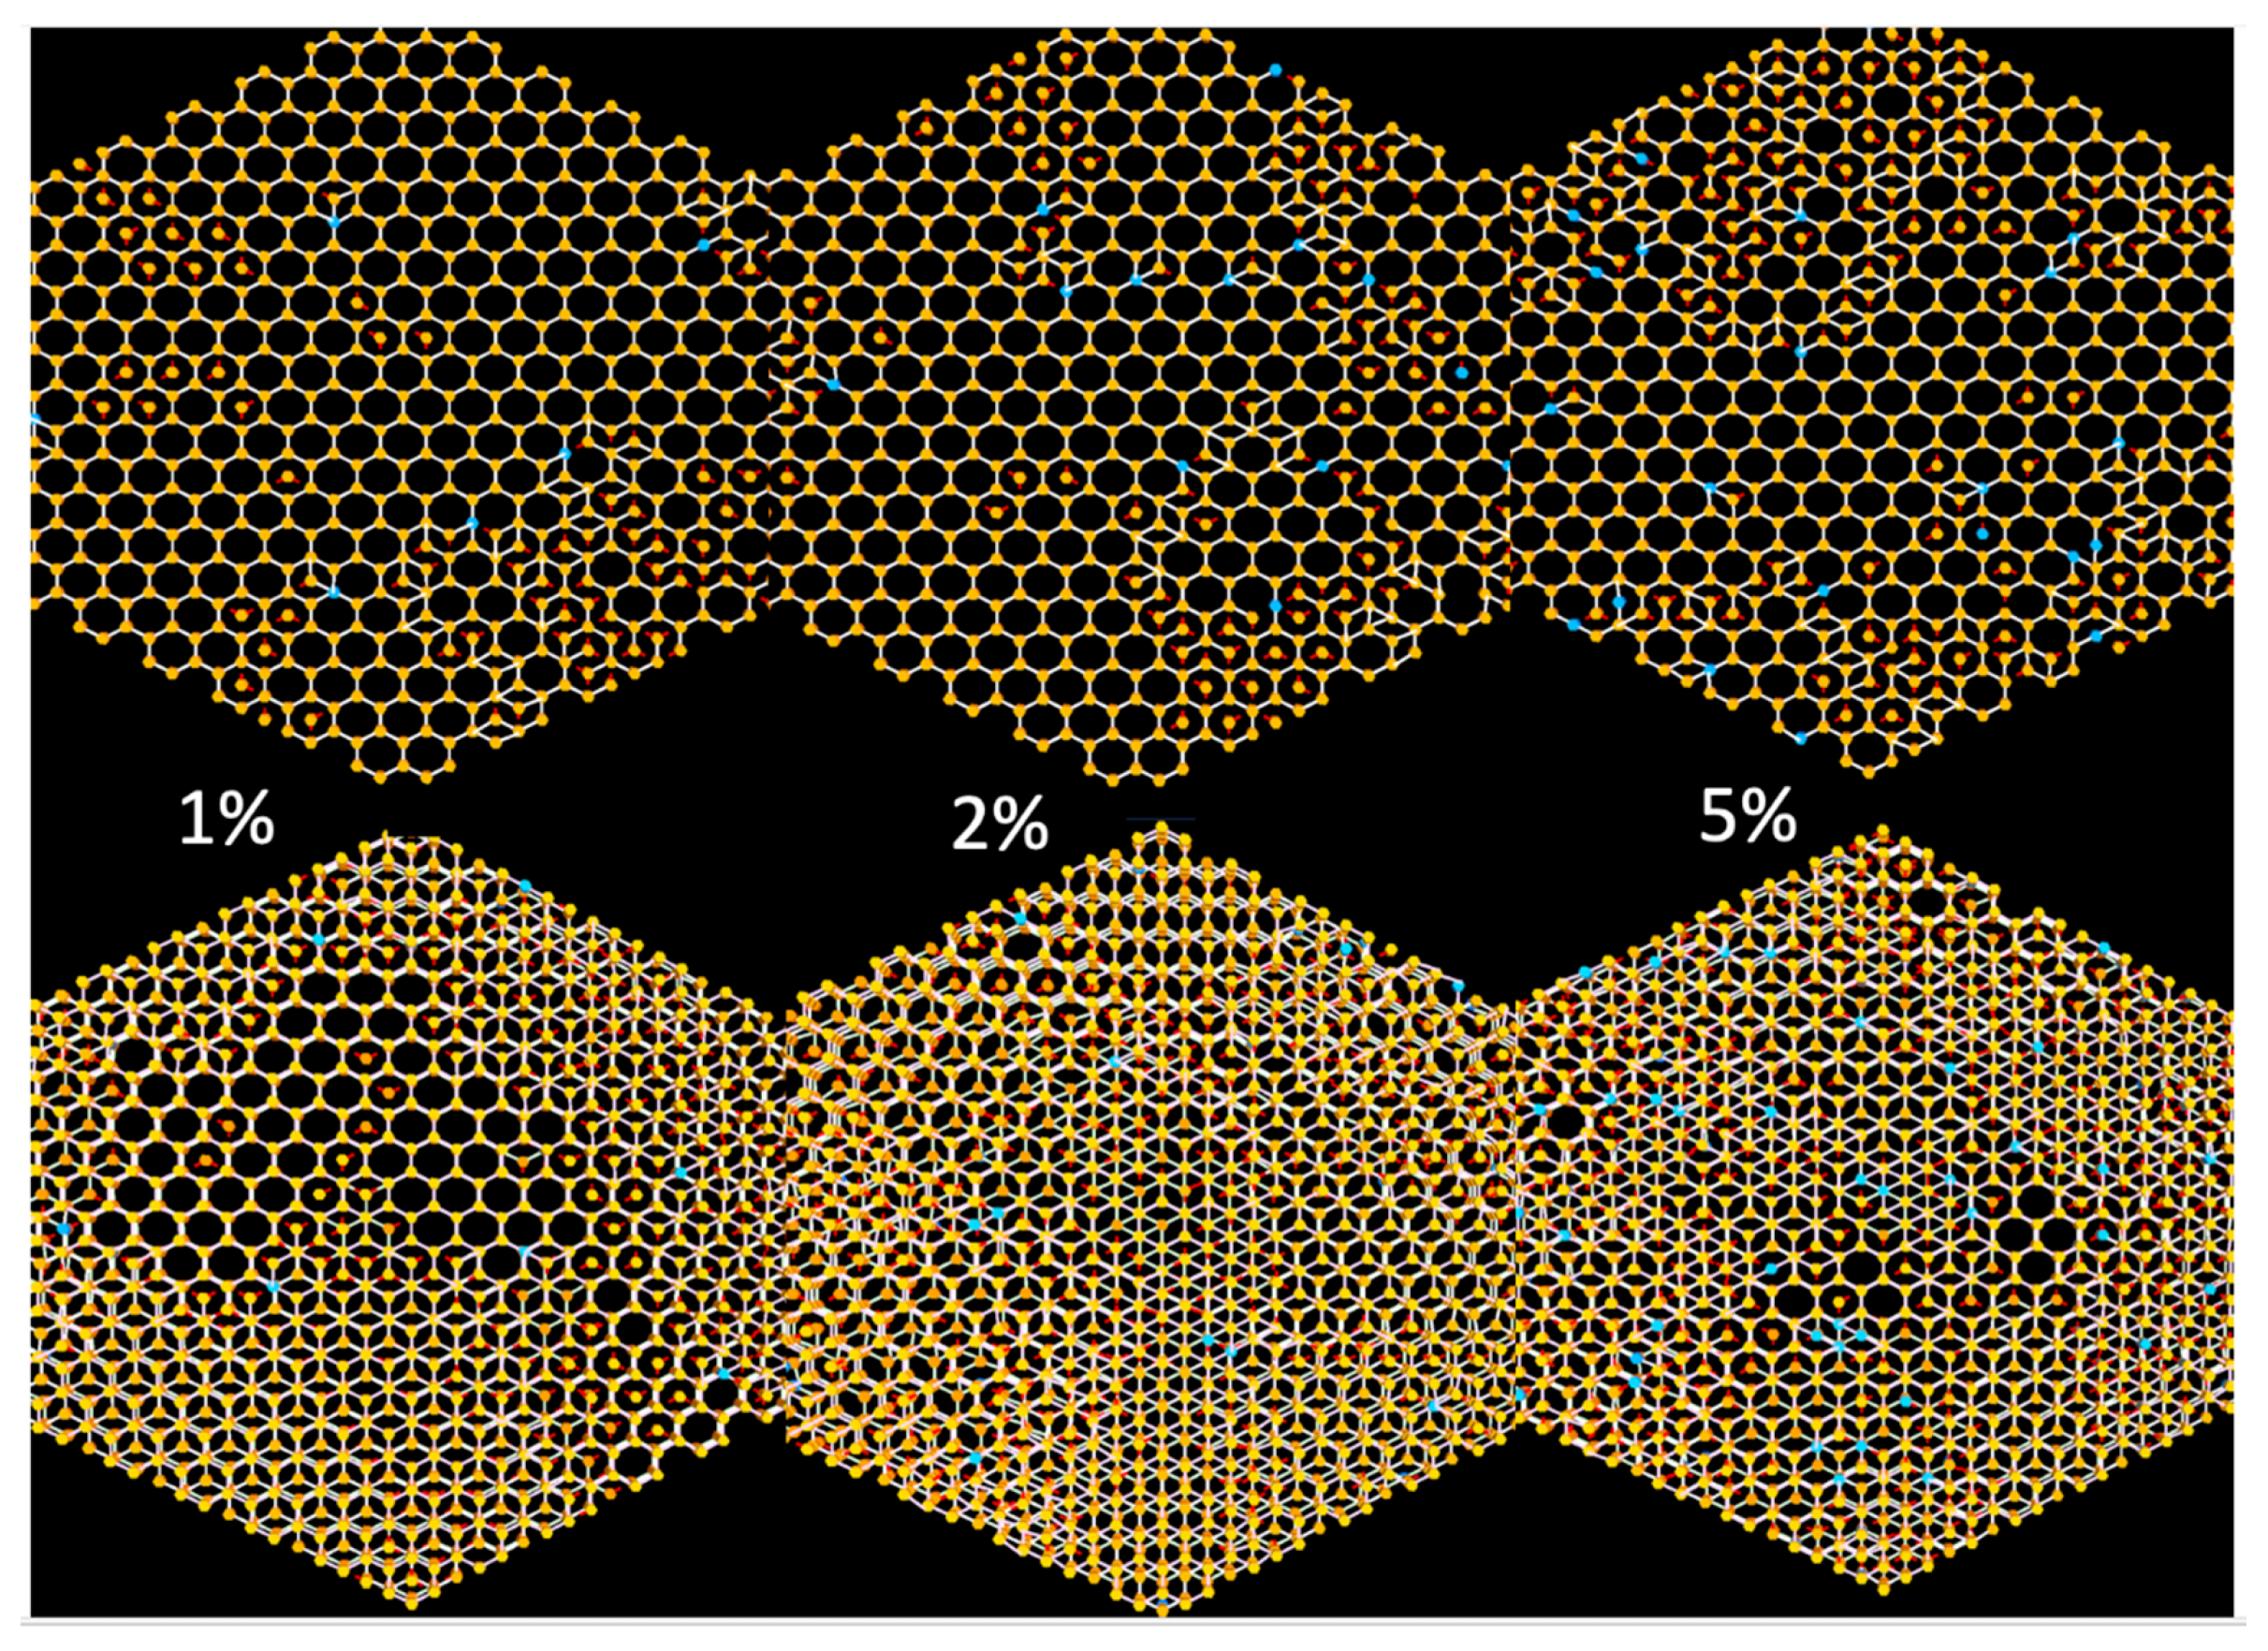
The top row of
Figure 5 shows images of single layer slices generated by the simulation with low probabilities (1, 2 and 5%, respectively) of producing the linear defects as well as the bordering layers above and below this layer in the bottom half of the figure. The linear defects produce multilayer lattices, via the screw dislocation-like growth mechanism, that will eventually have many of these lattice points not on the same plane when viewed down the c-axis of the structure. The simulation also allows for increasing the layer separation so that you can easily see all of the interlayer connections when rotating the original view. This program does not verify or establish disorder in a COF but conveniently allows researchers to see the effects prior to selecting COF reactants.

 ,
, 


