Effect of Cast Defects on the Corrosion Behavior and Mechanism of UNS C95810 Alloy in Artificial Seawater

 ,
,
Abstract
1. Introduction
2. Experiment
2.1. Materials and Corrosive Medium
2.2. Preparation of Test Specimens
2.2.1. Specimens for Electrochemical Tests
2.2.2. Specimens for the Corrosion Test and Microstructure Analysis
2.3. Measurement and Characterization
2.3.1. Weight Loss
2.3.2. Microstructure Analysis and Corrosion Morphology Observation
2.3.3. XRD
2.3.4. Electrochemical Test
3. Result
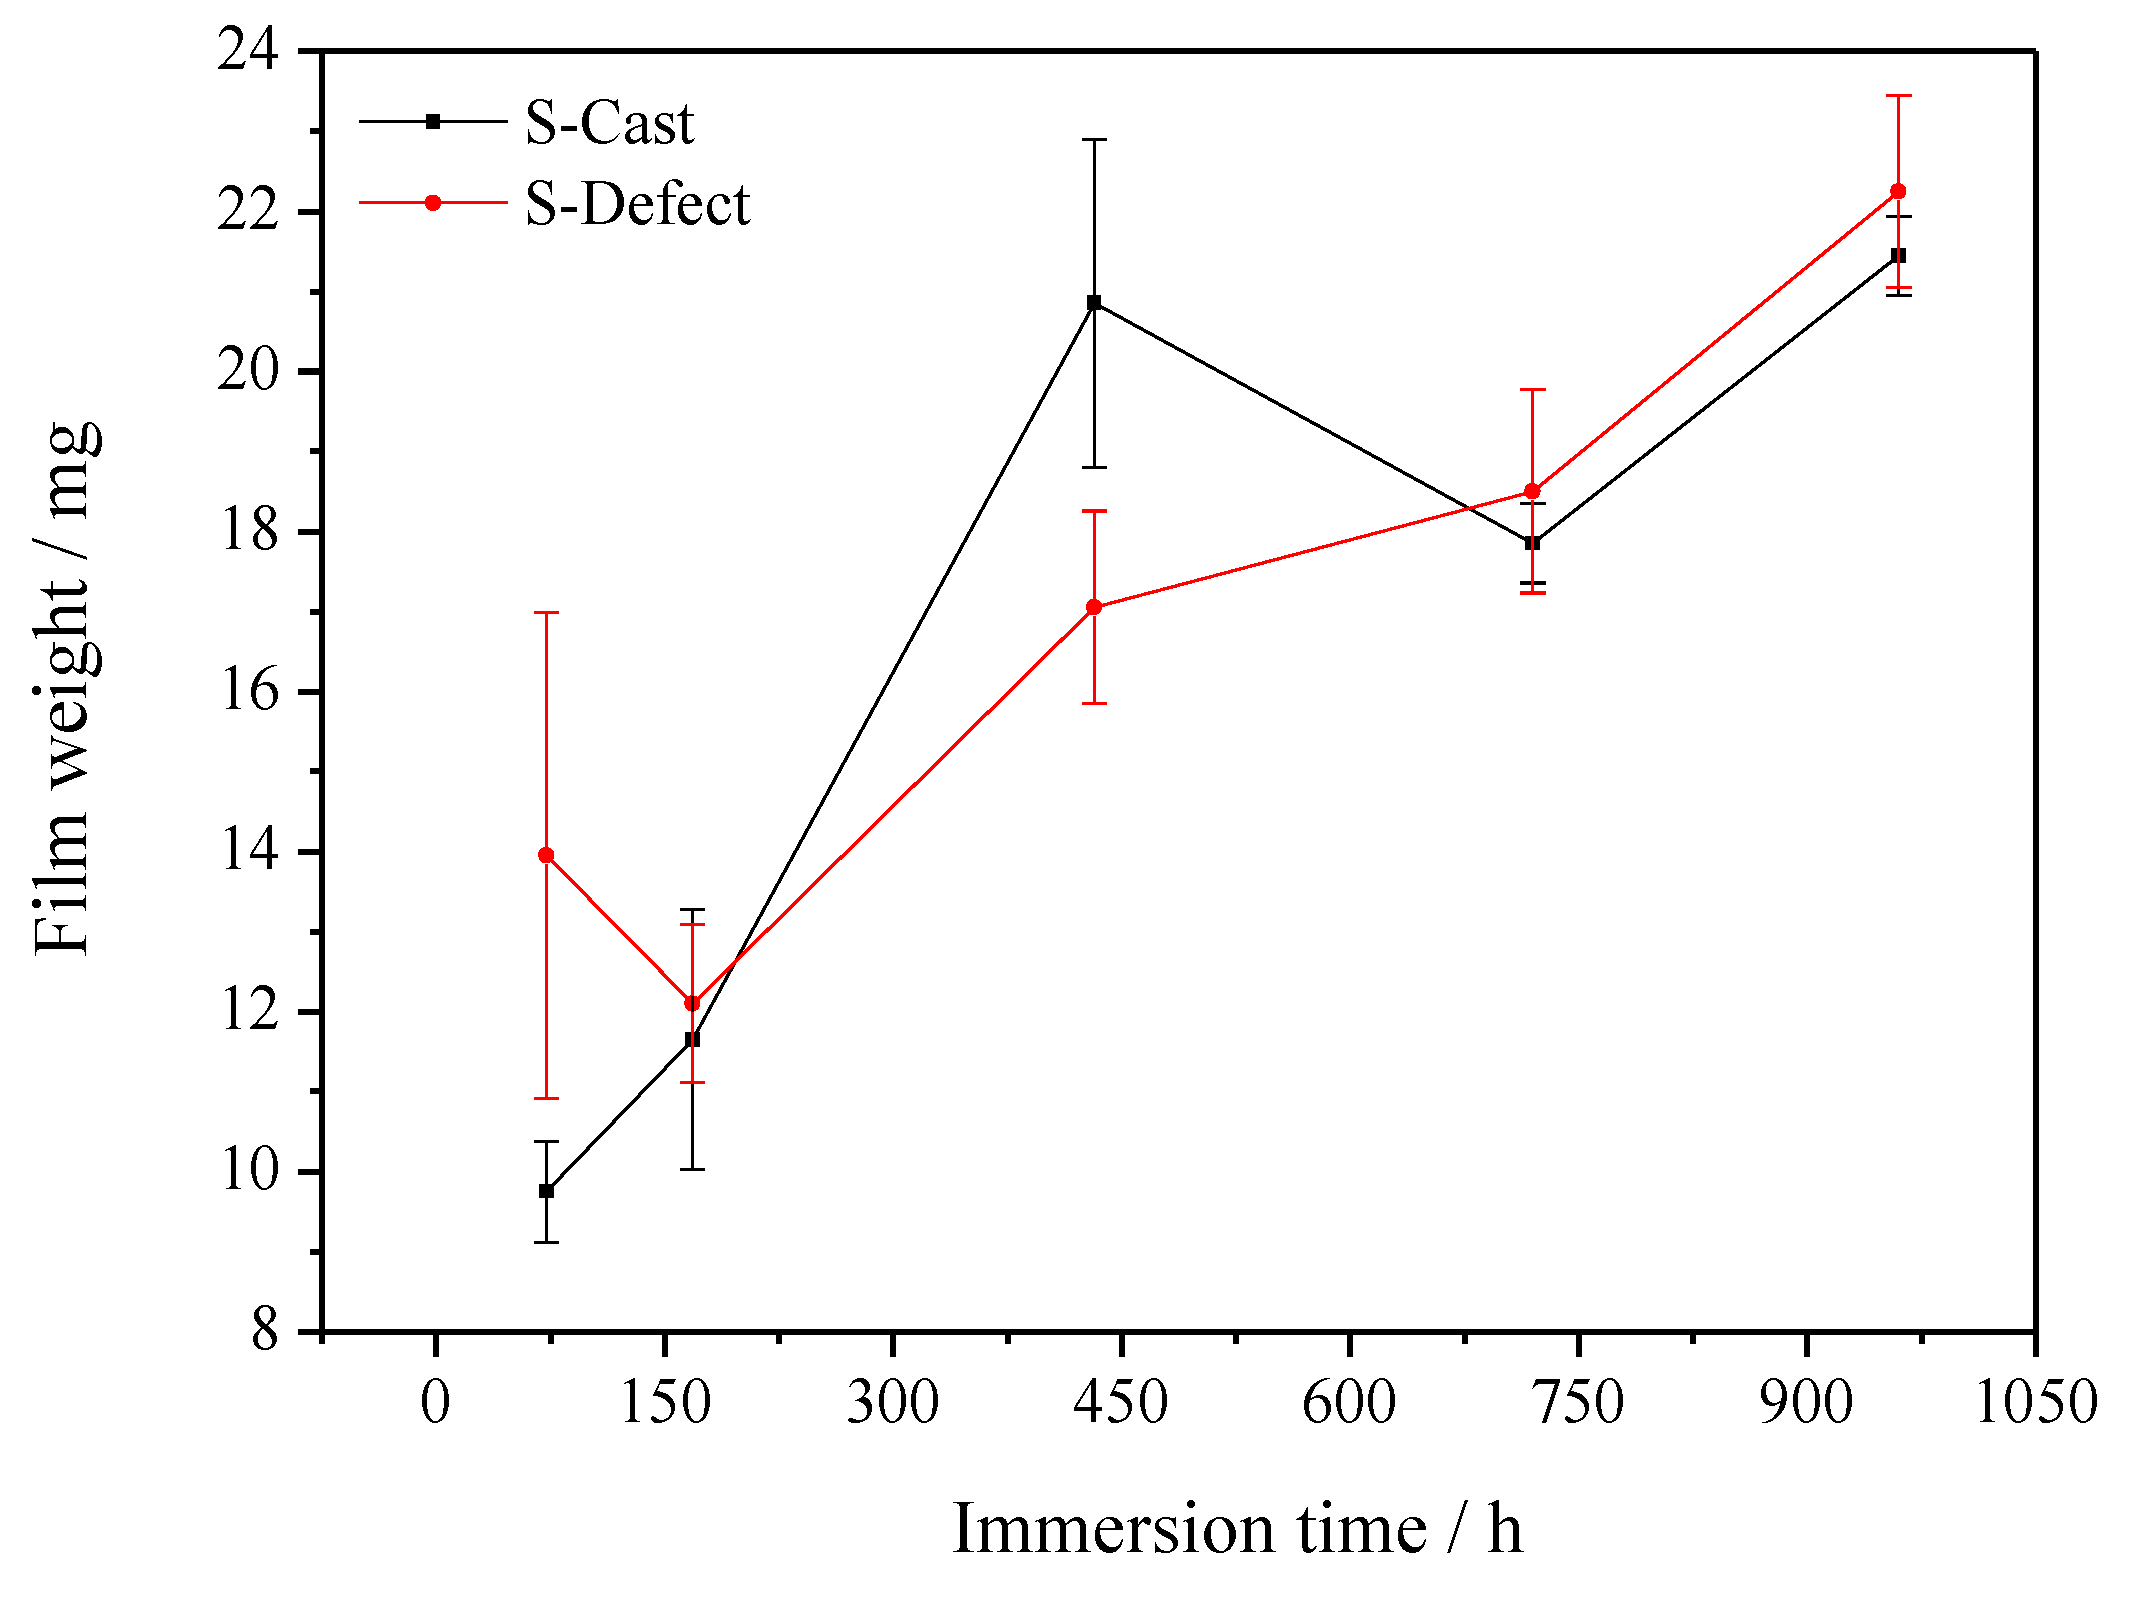
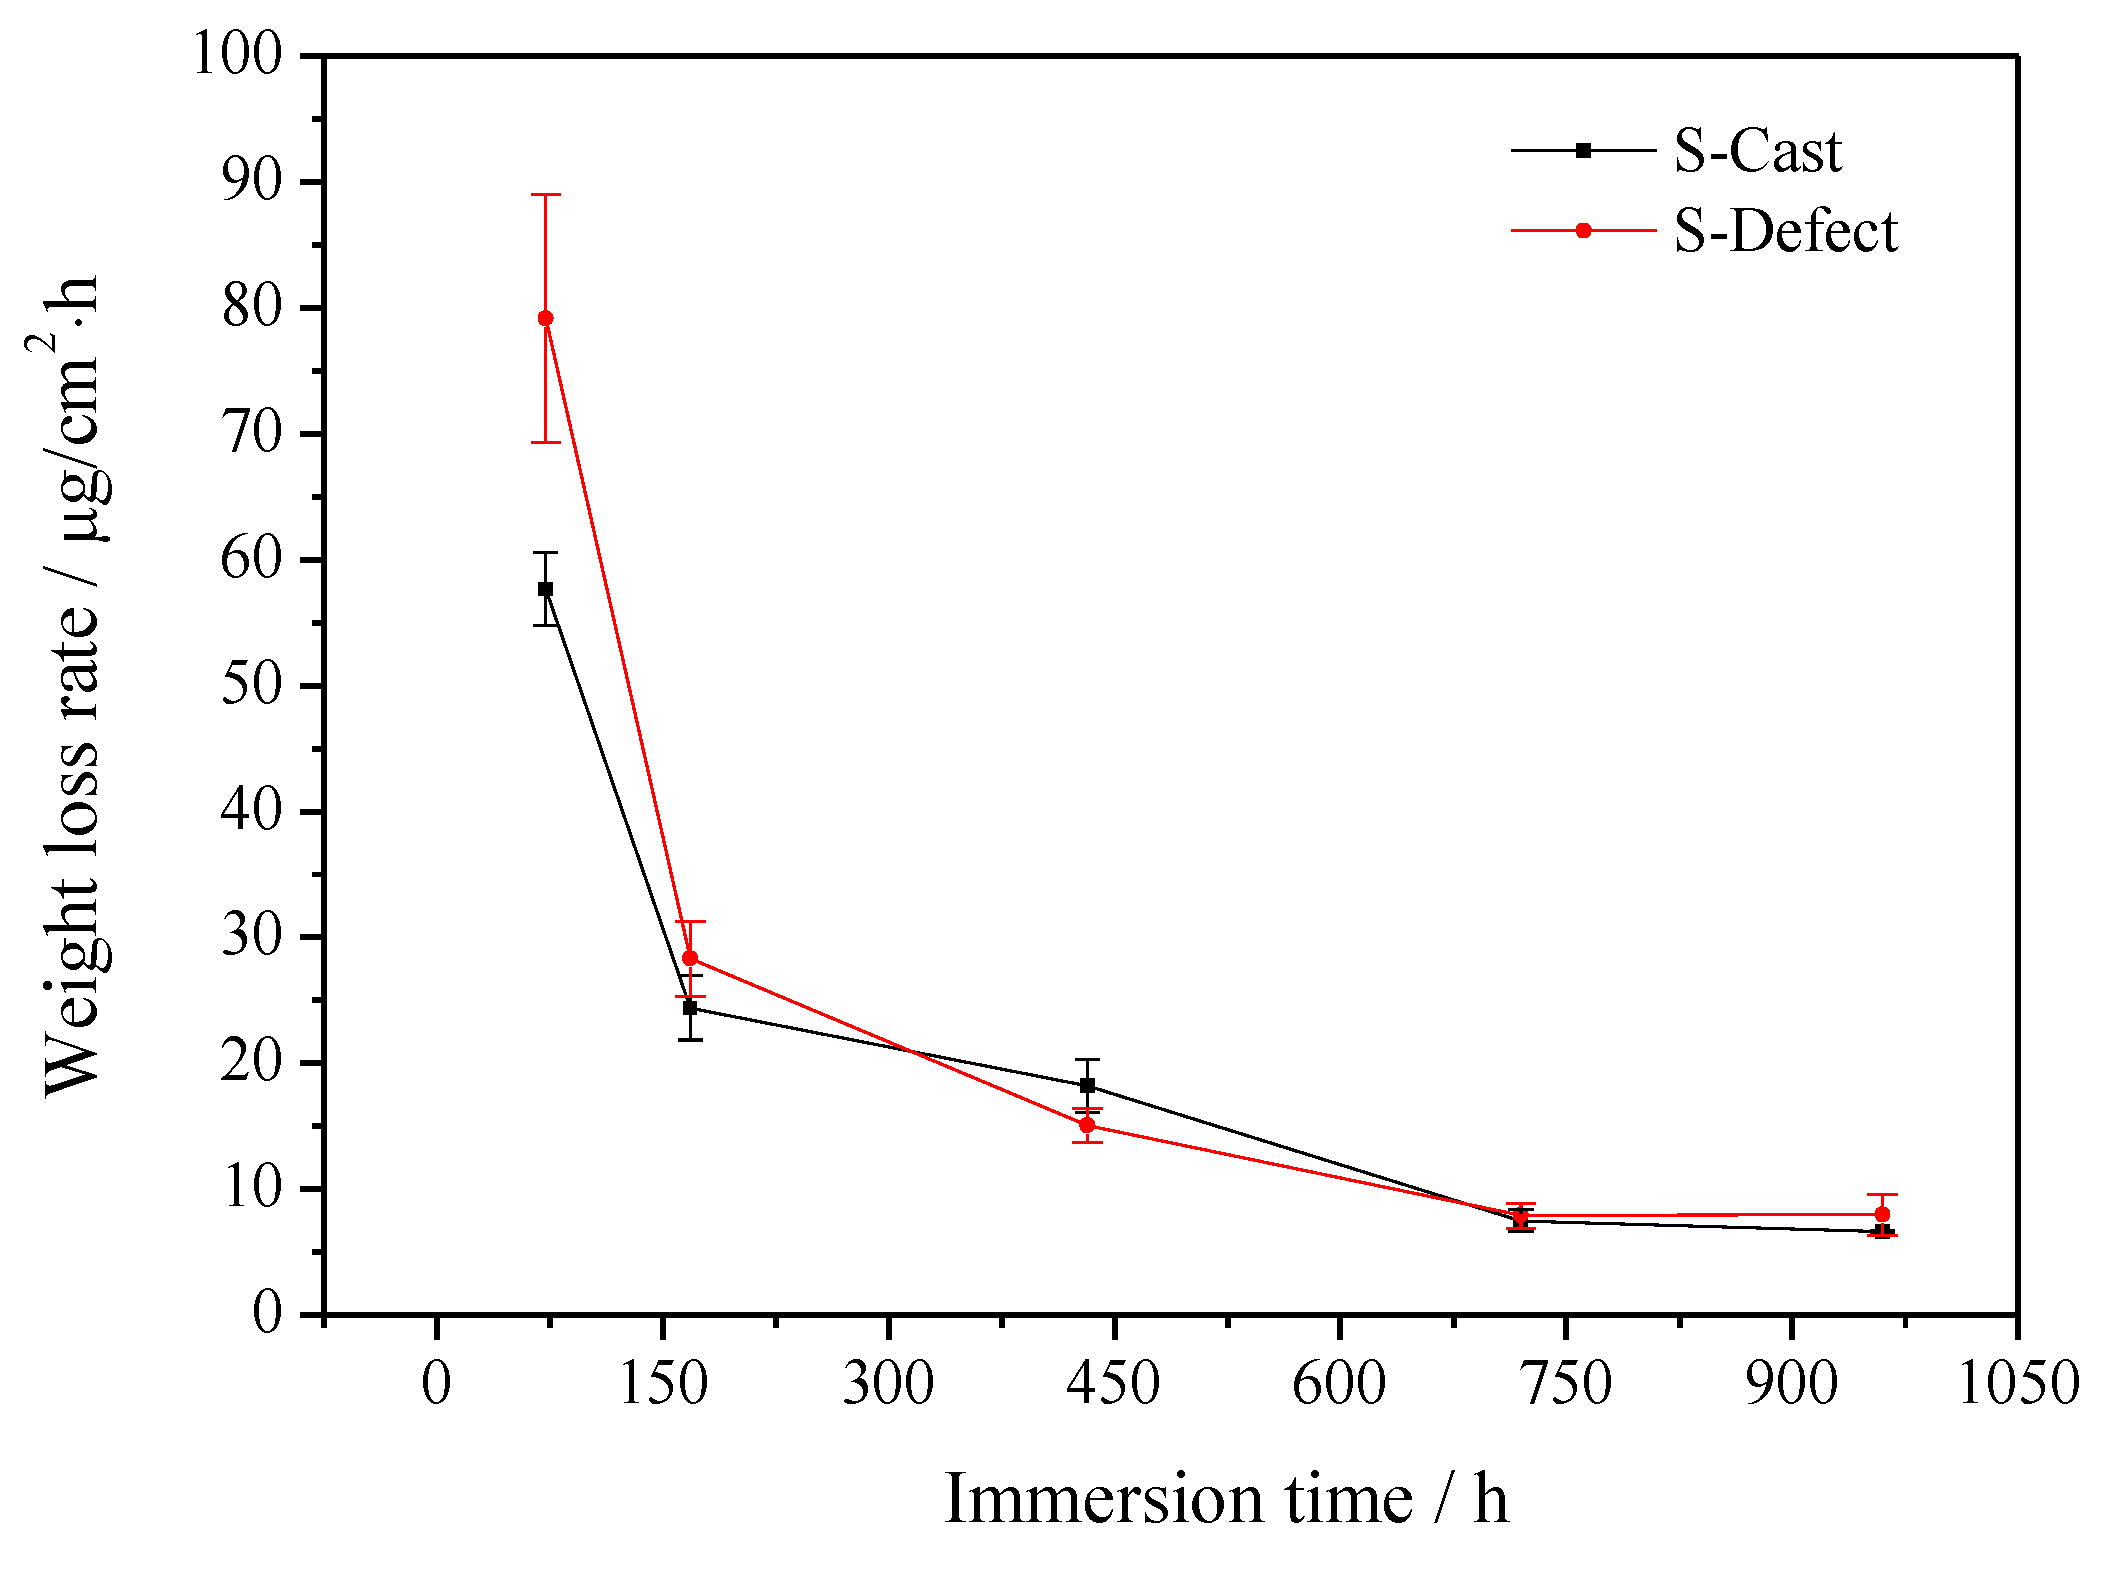
3.1. Weight Loss
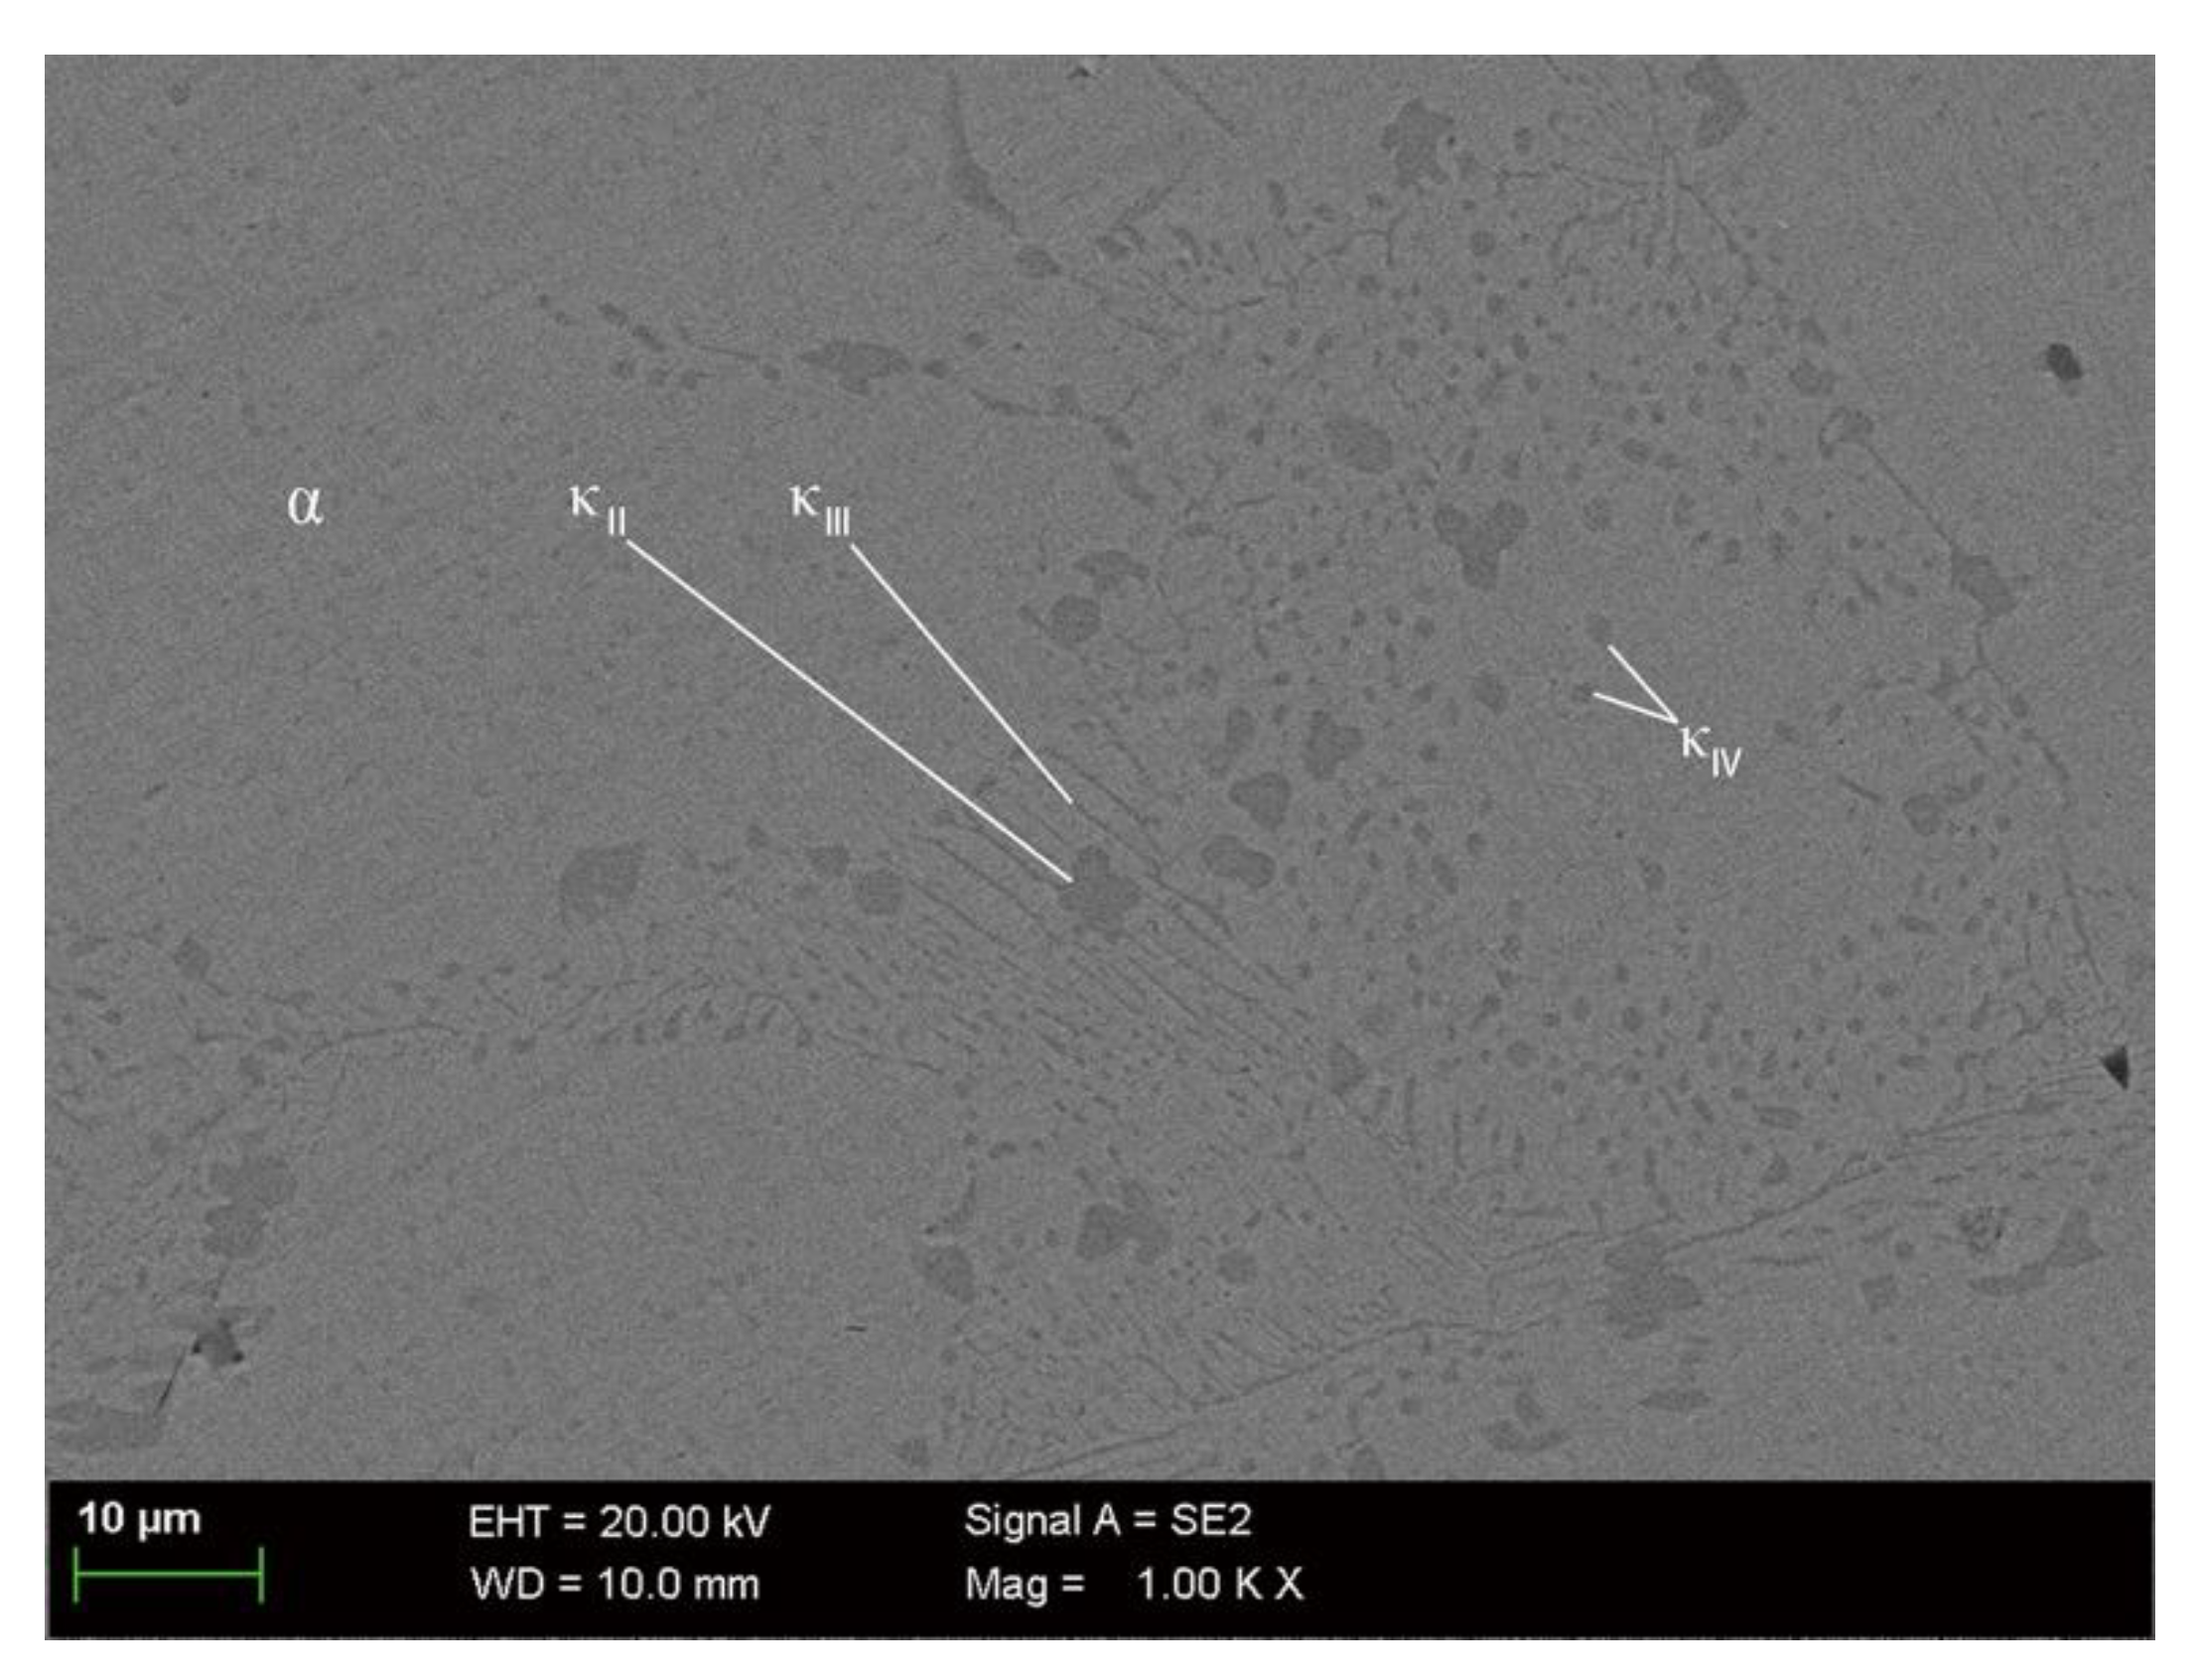
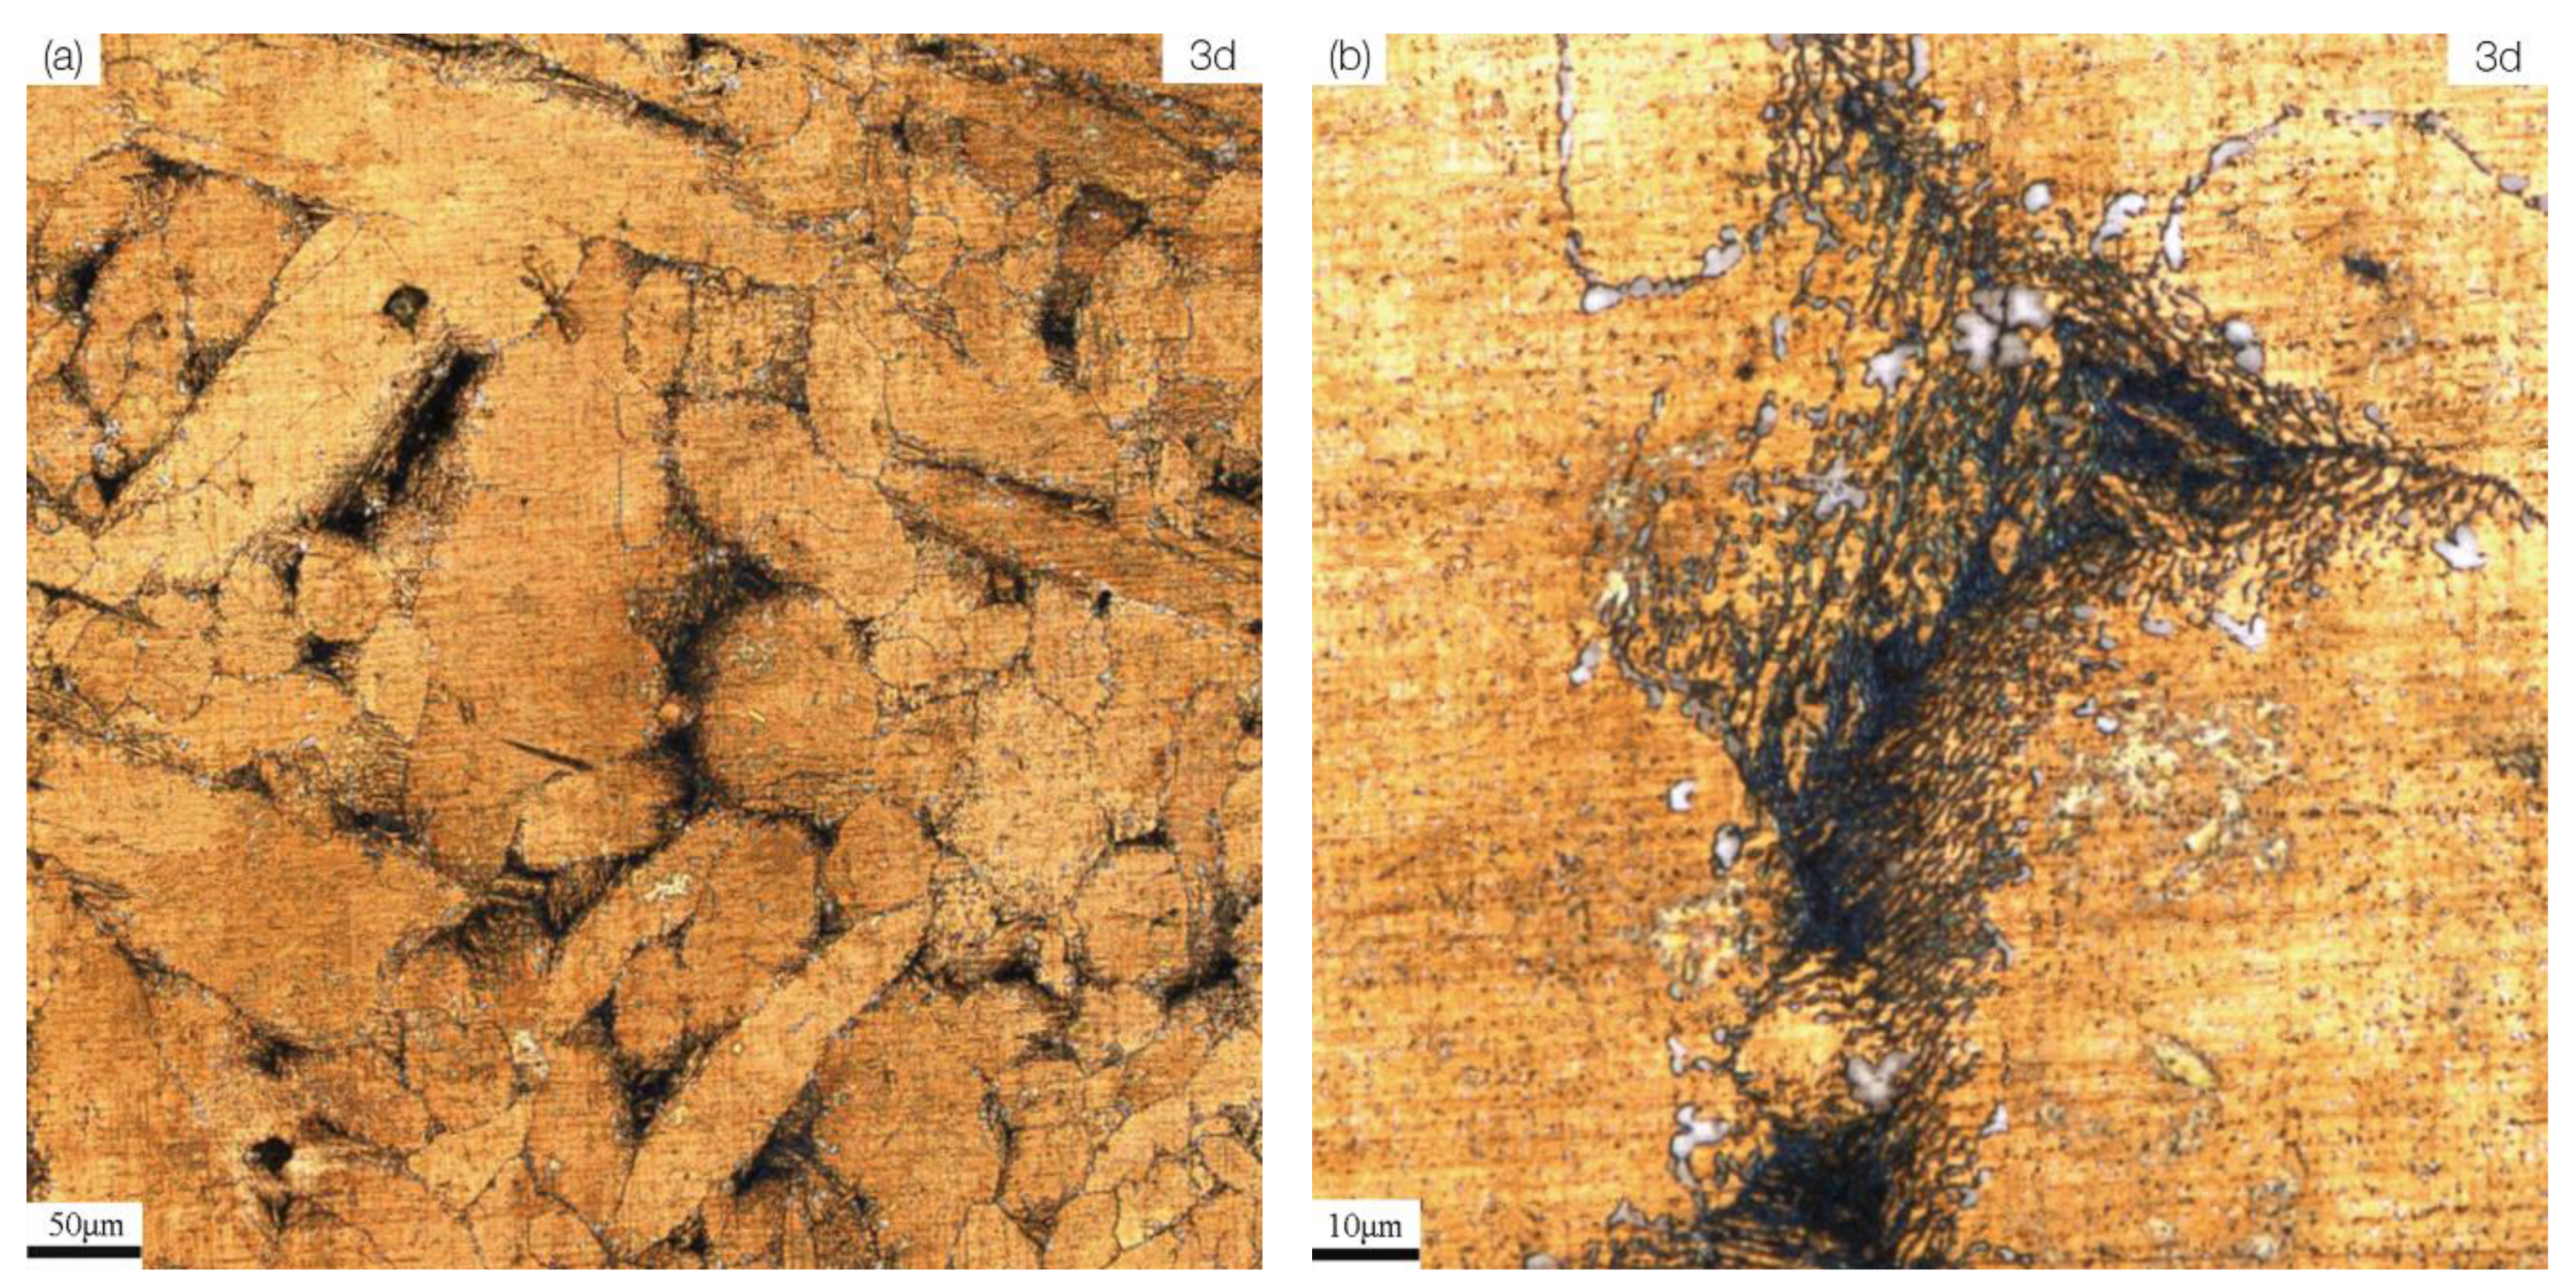
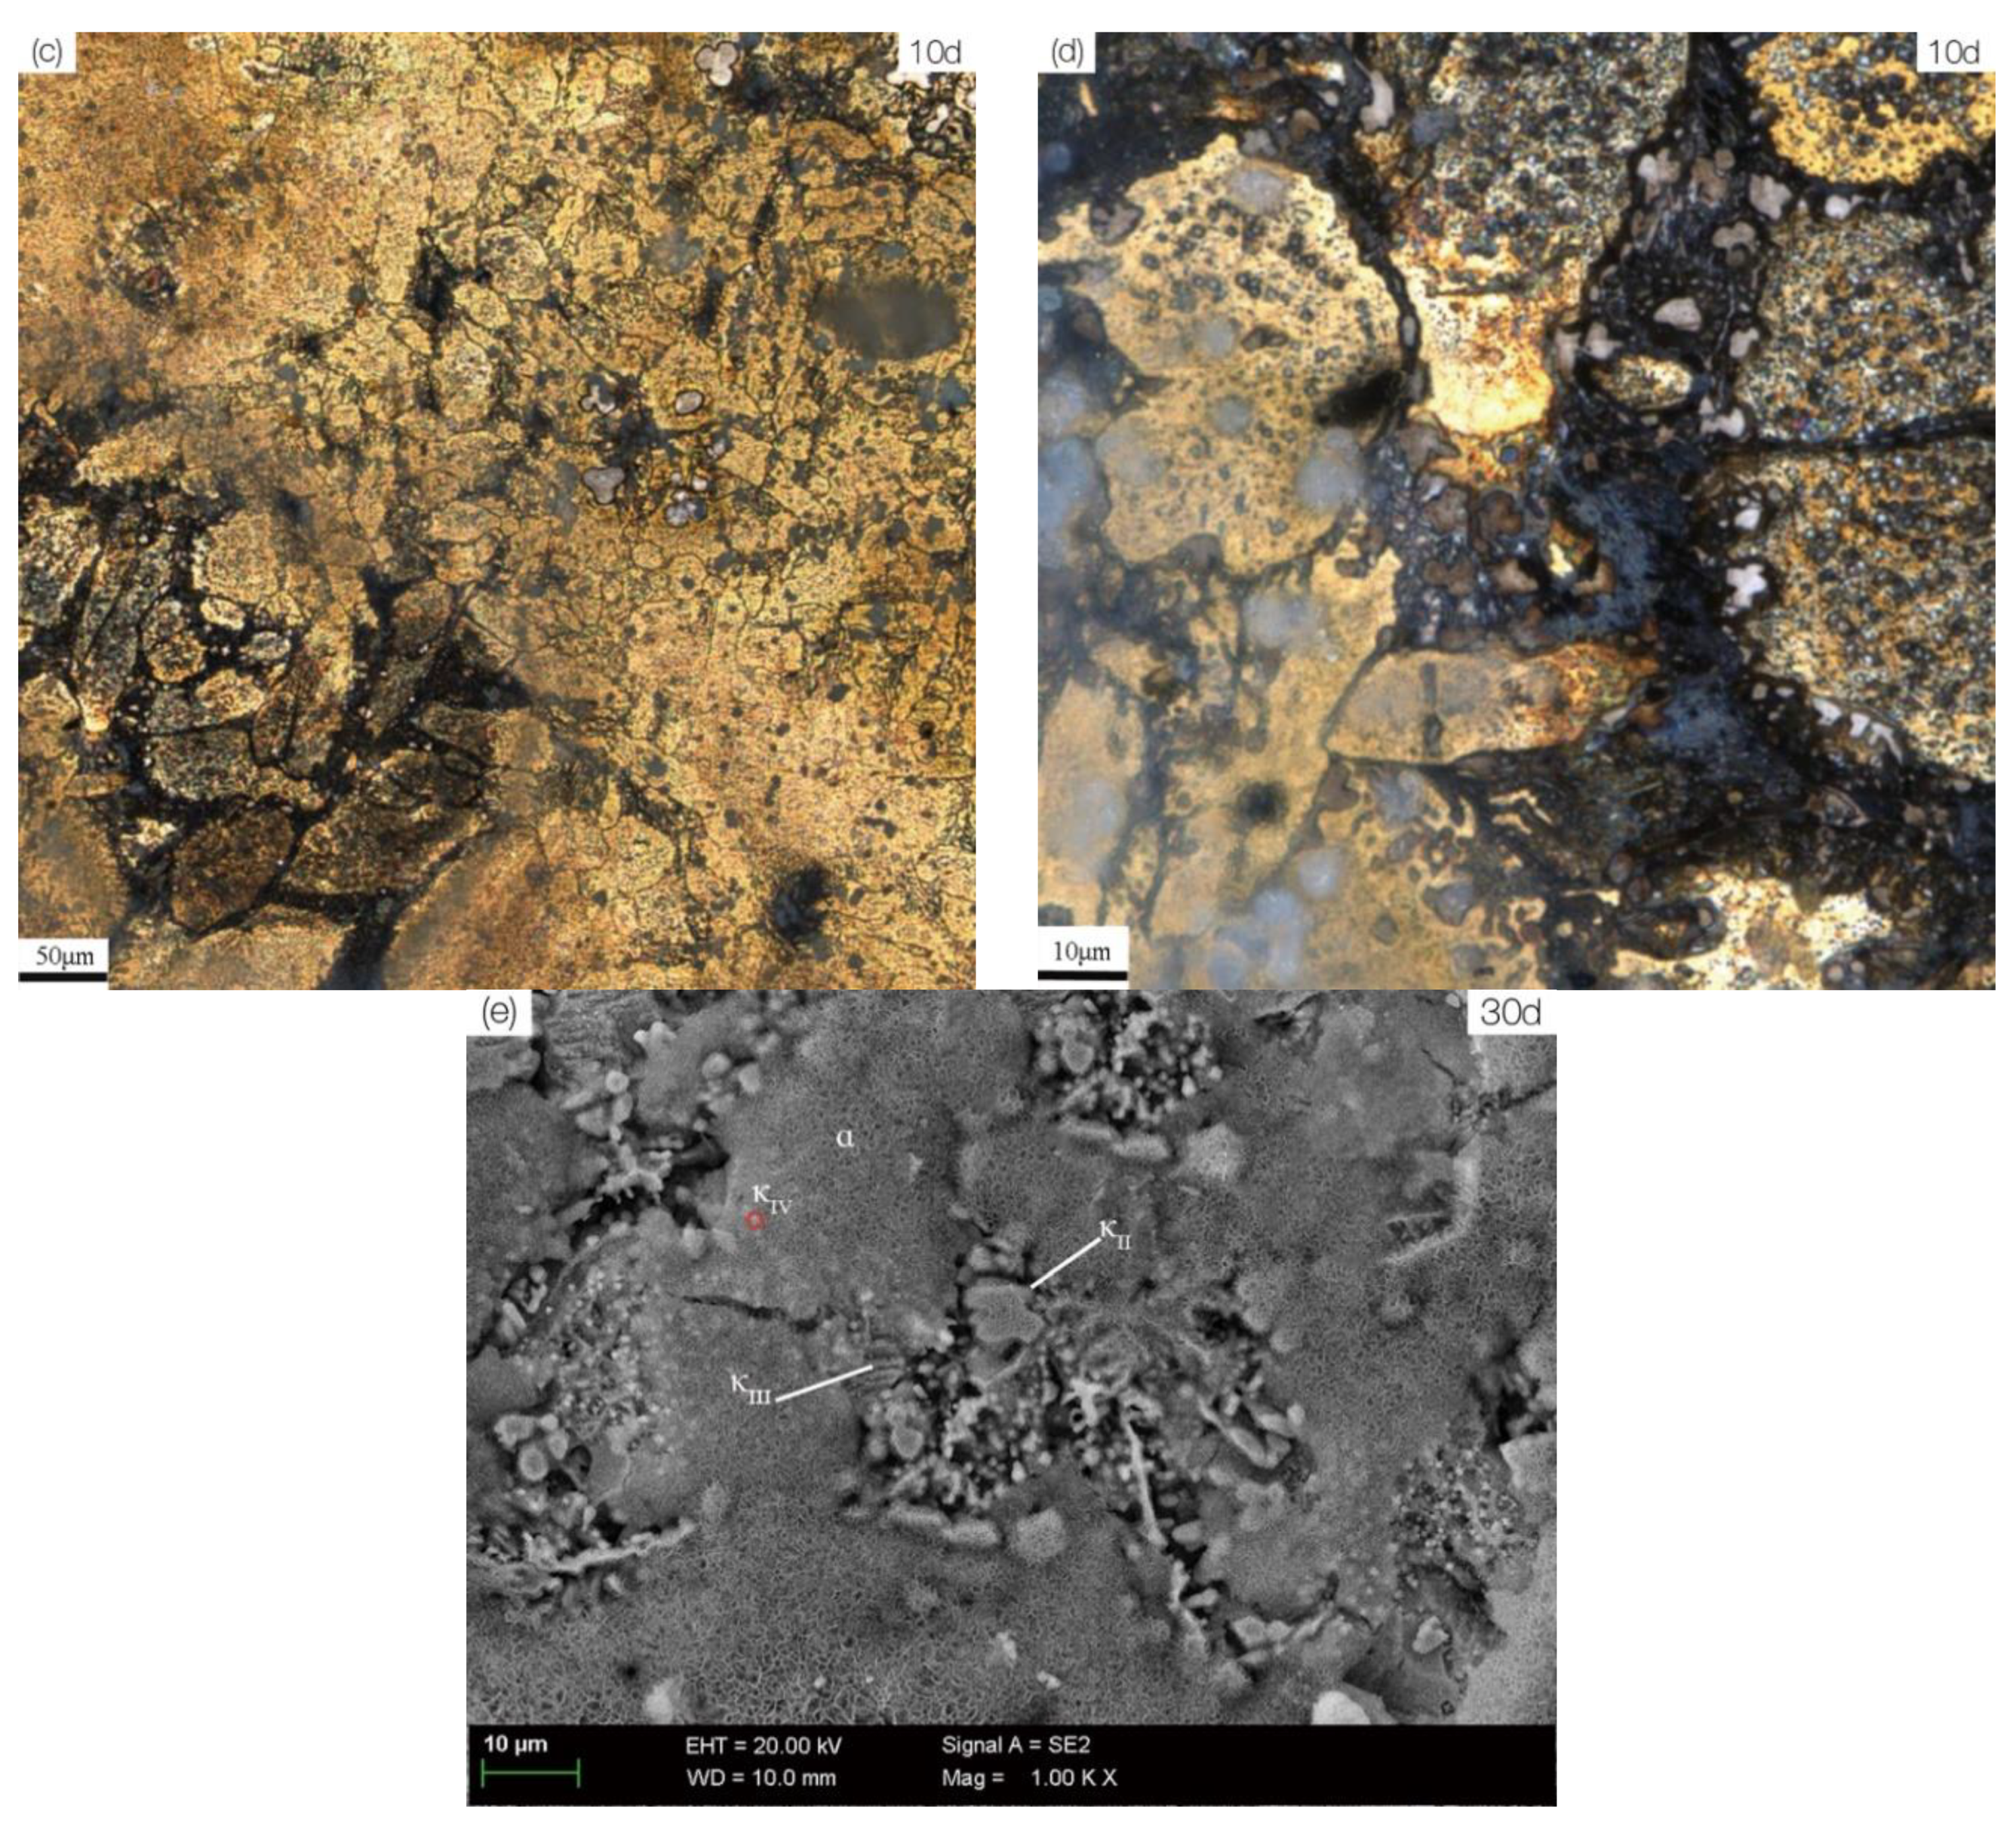
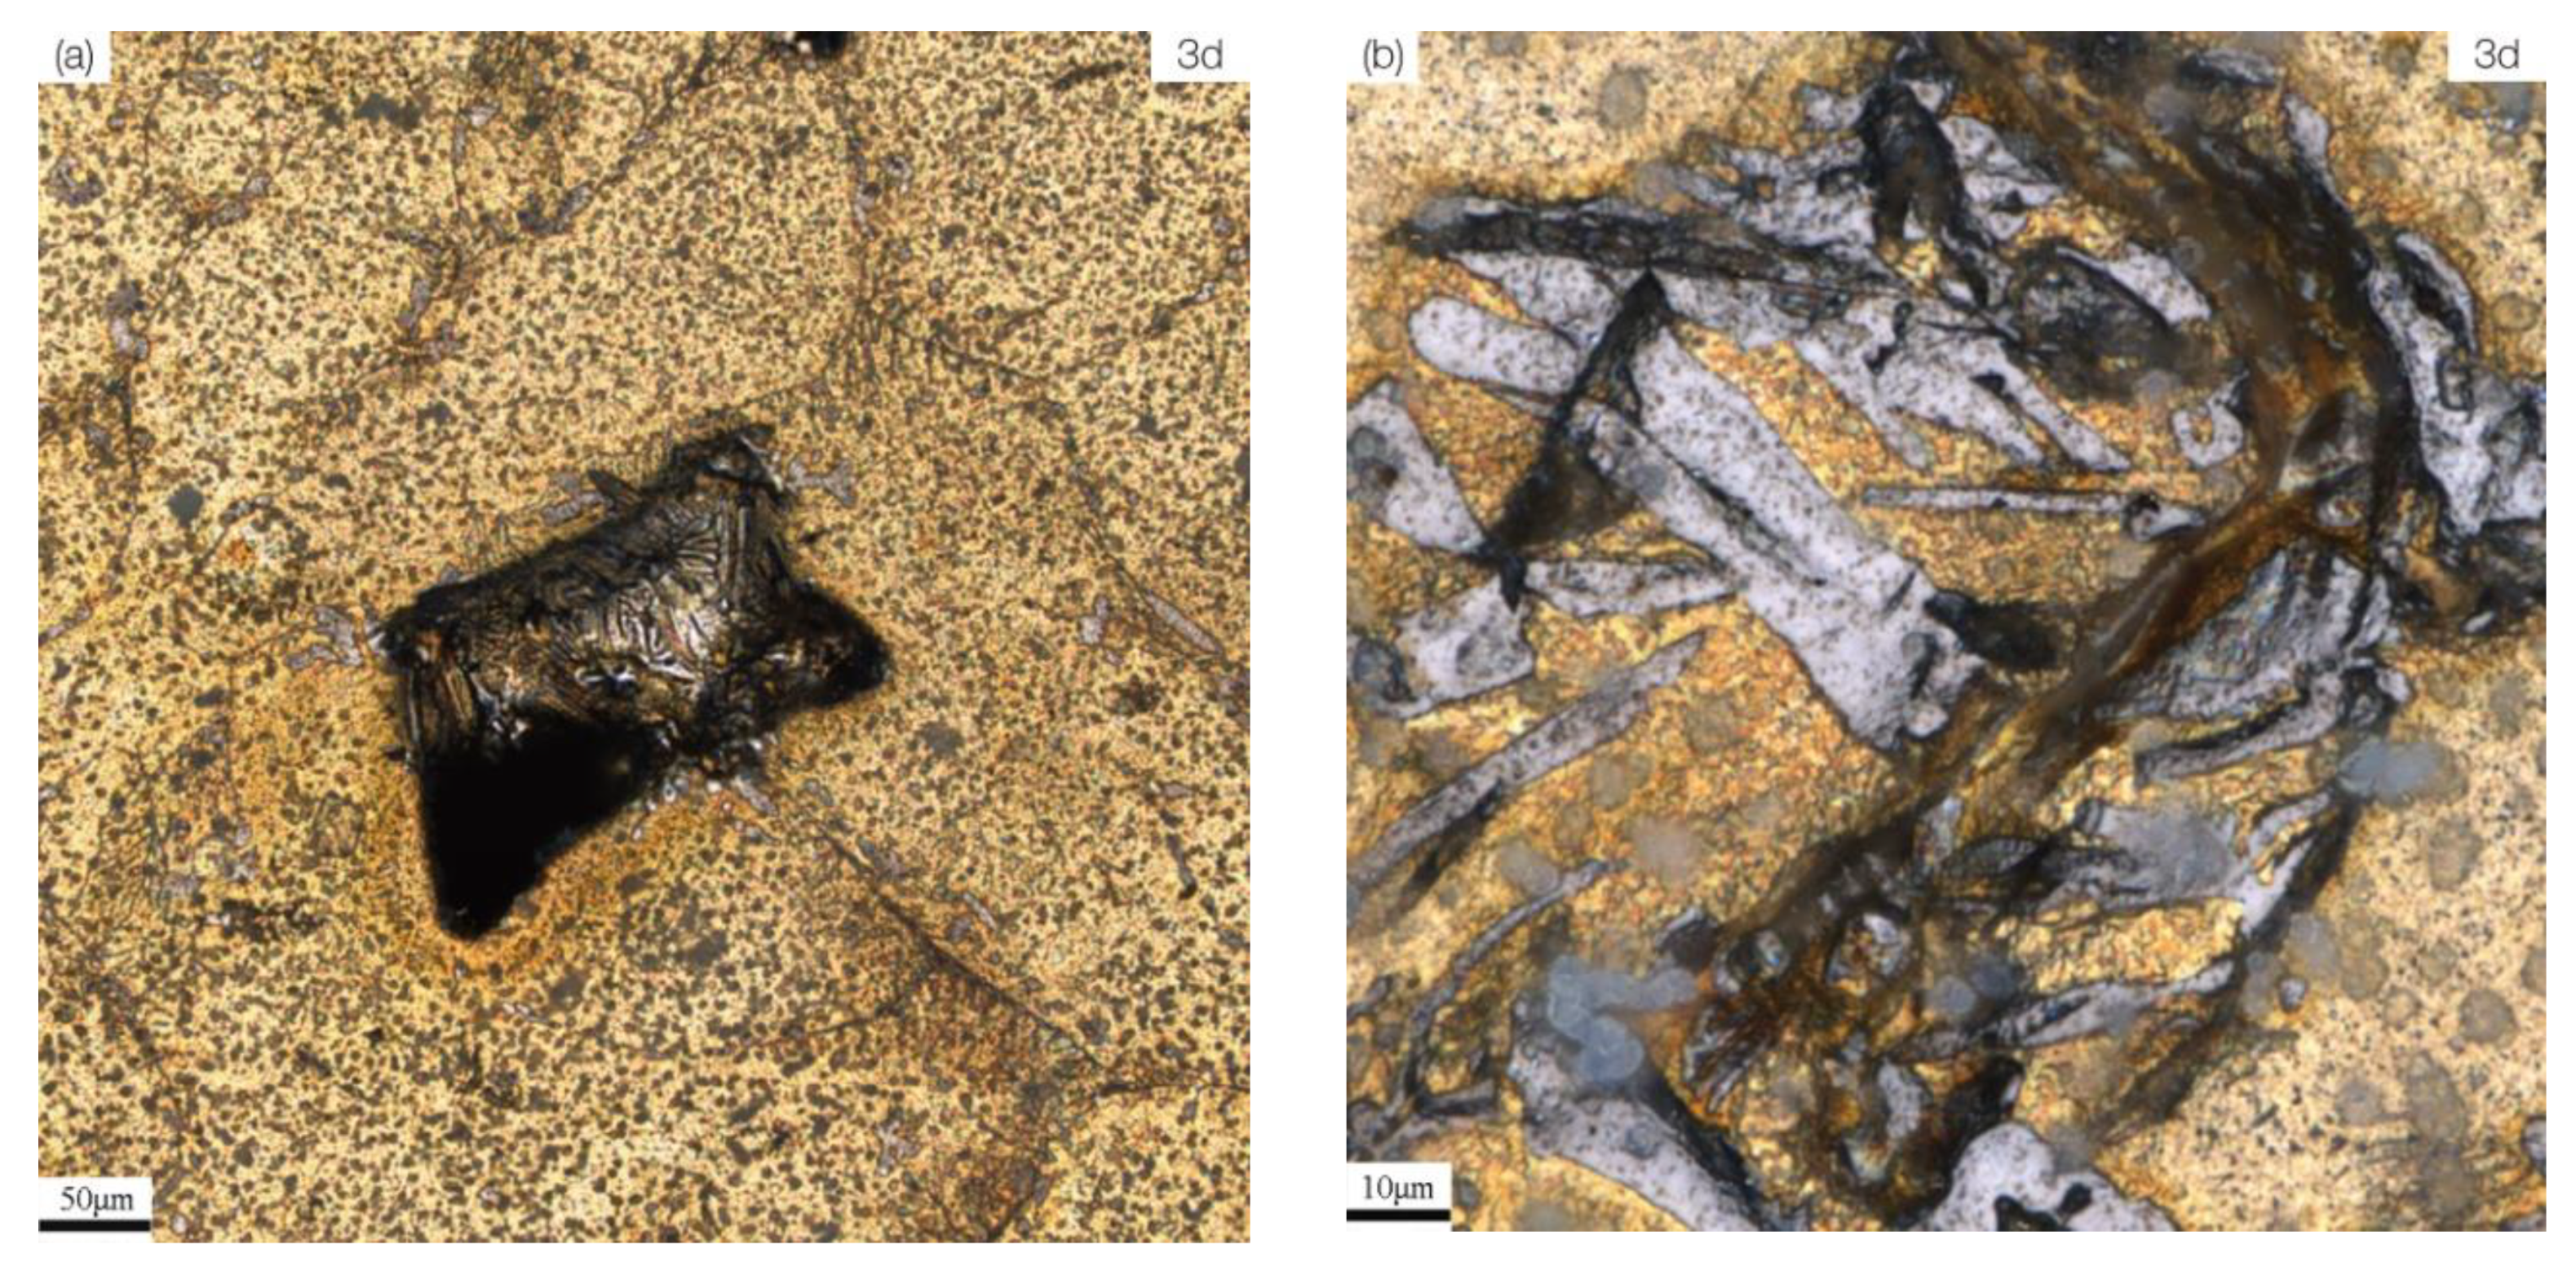
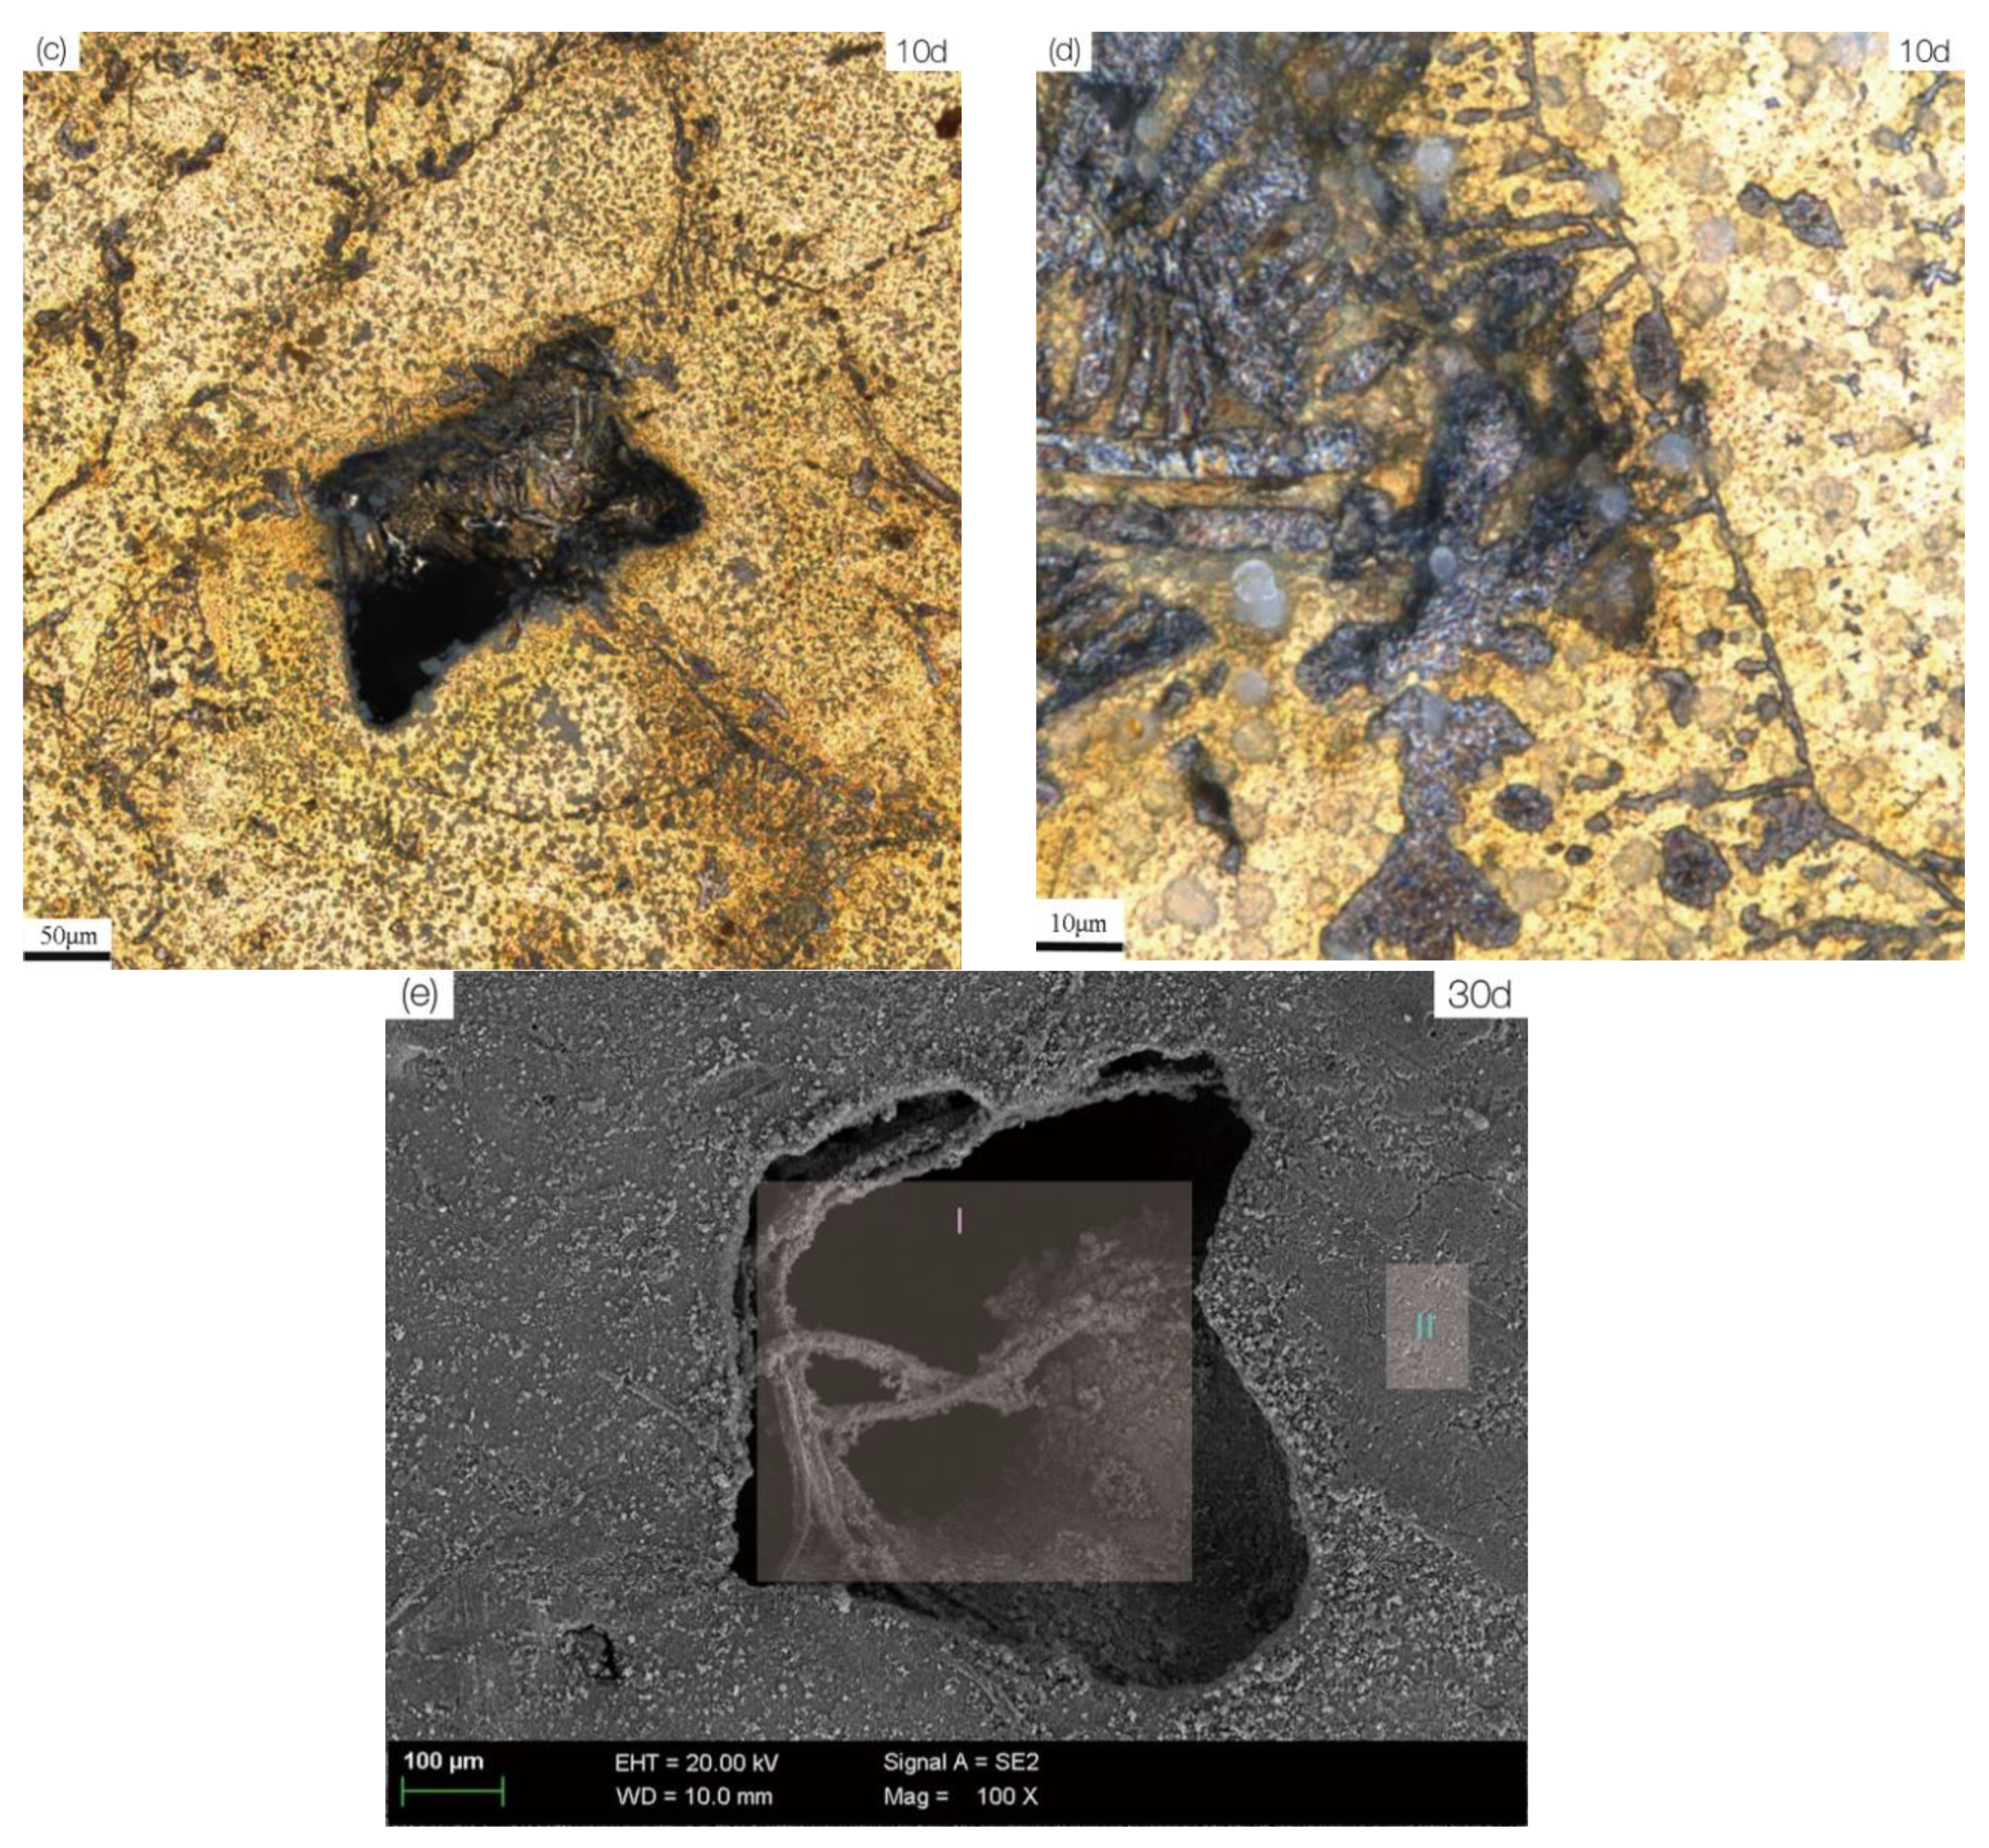
3.2. Microstructure and Corrosion Morphology
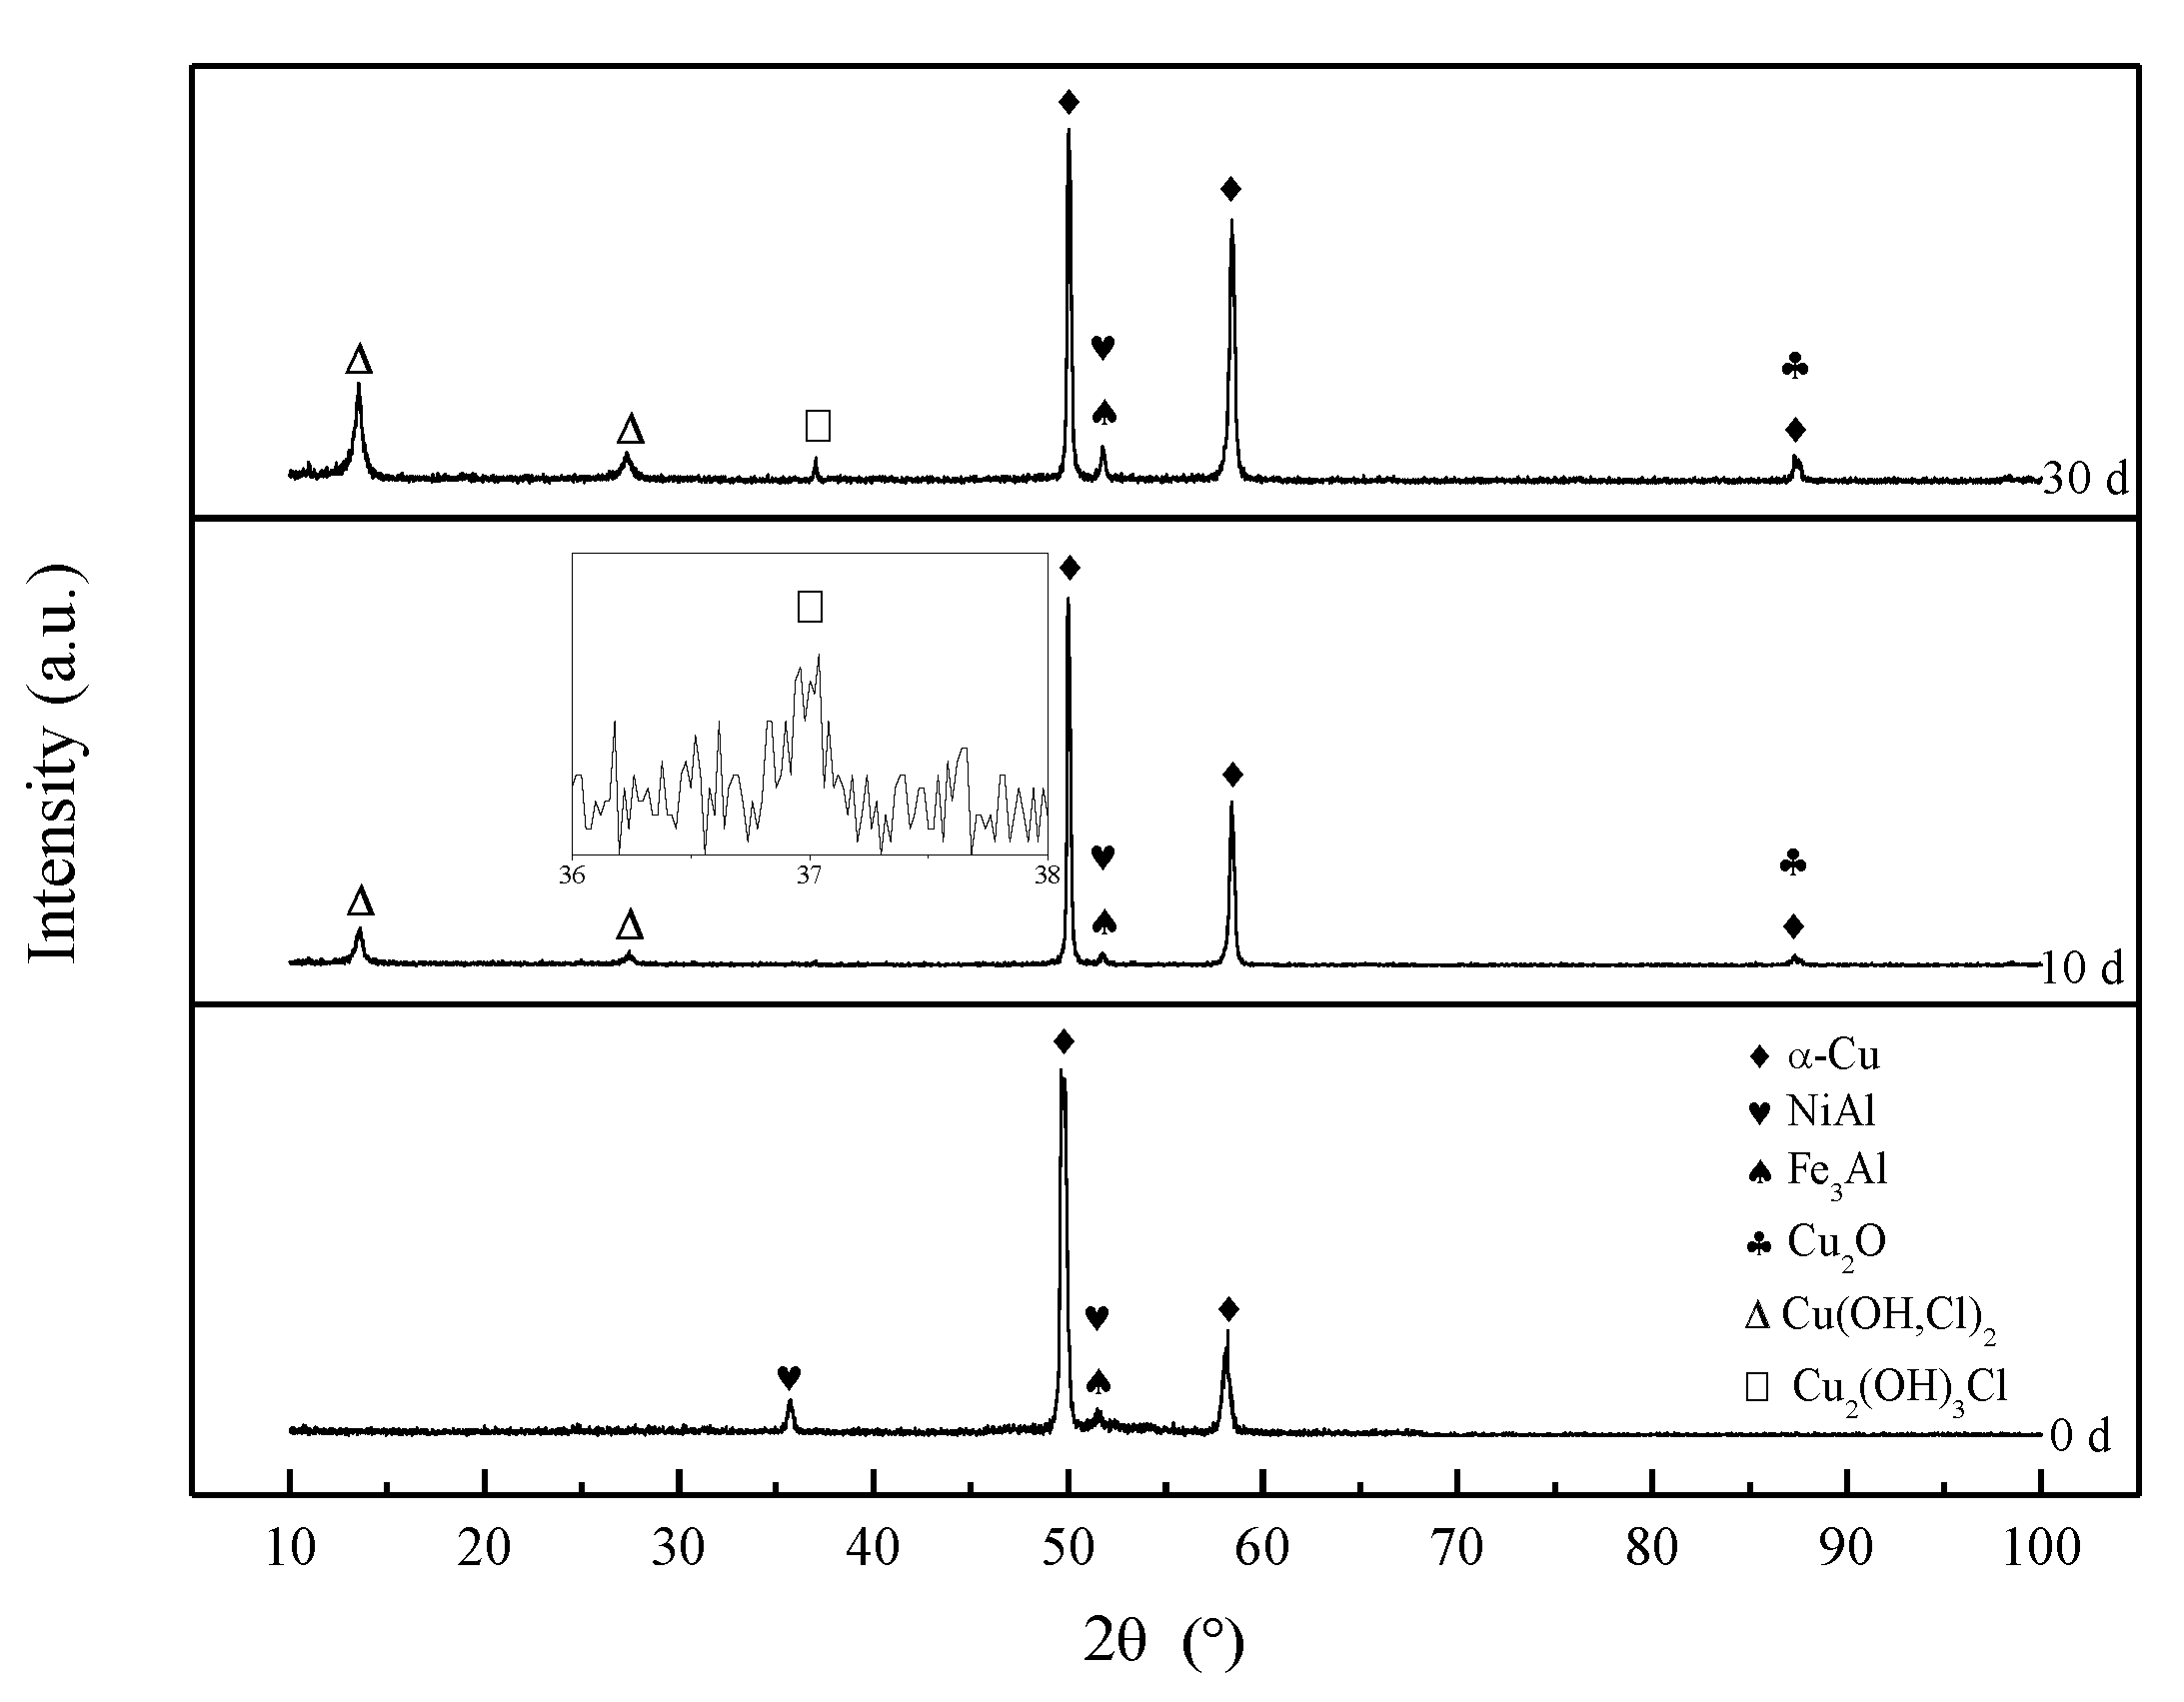
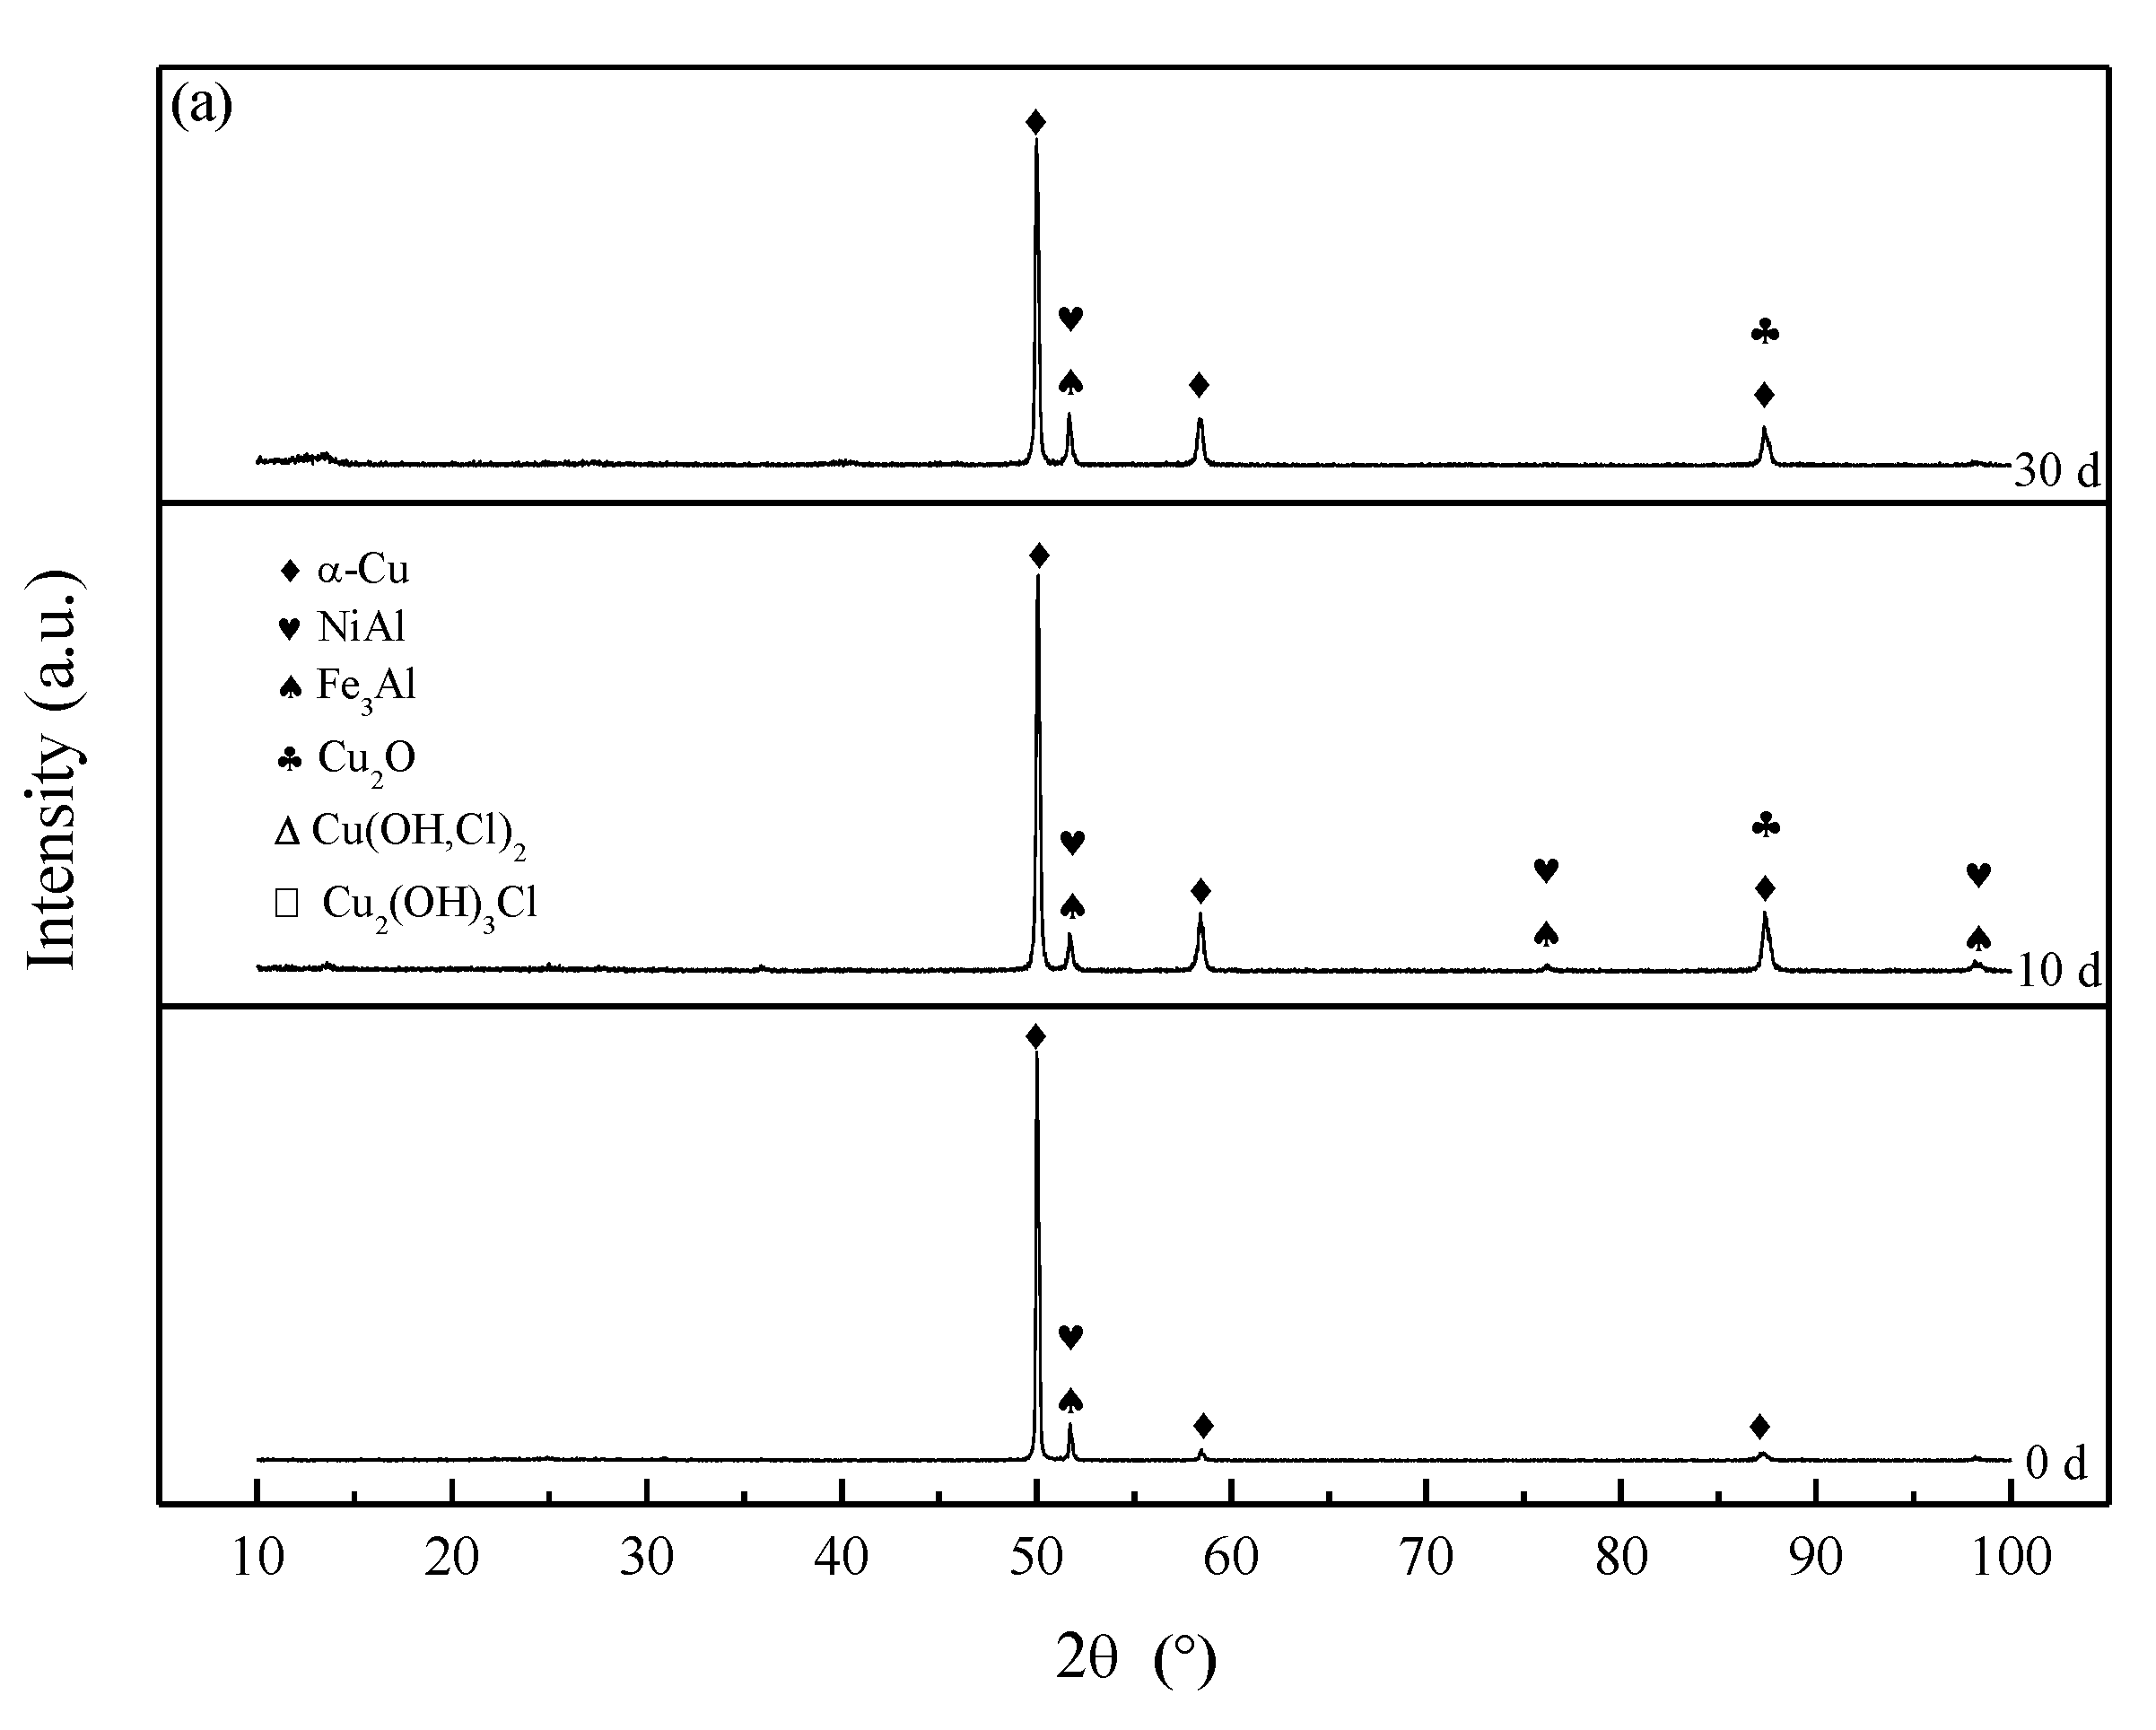
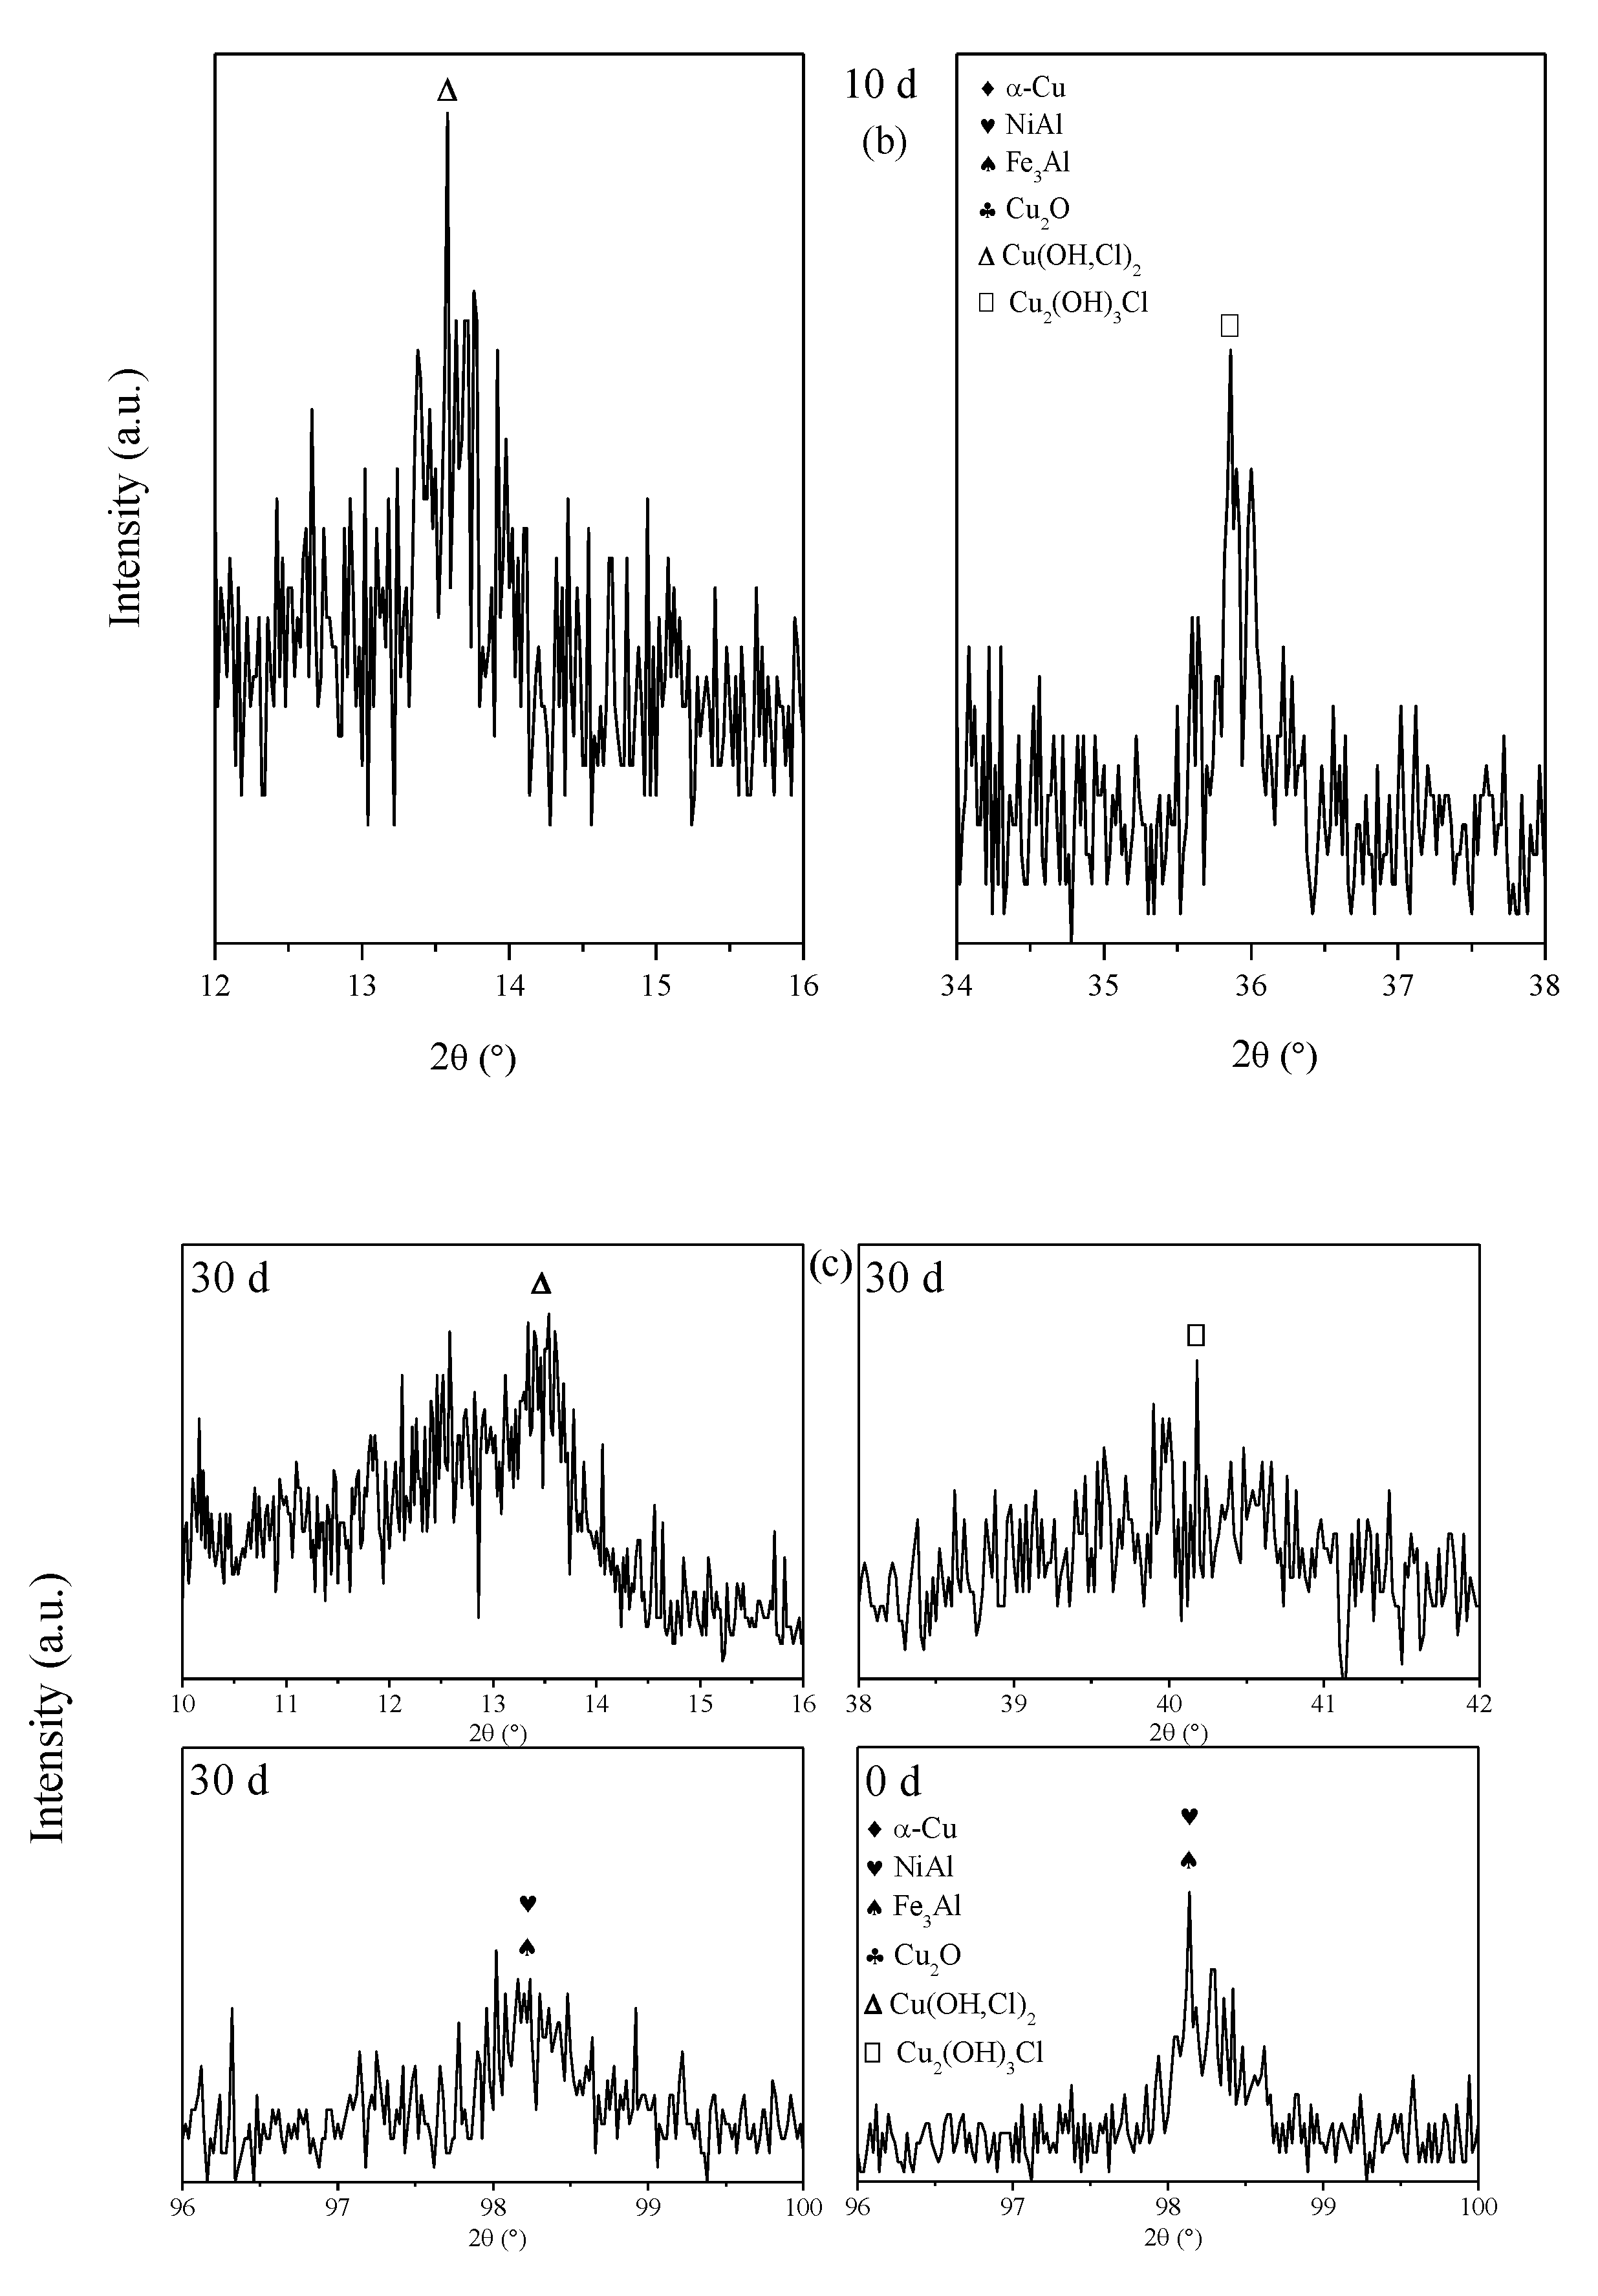
3.3. Corrosion Product Film
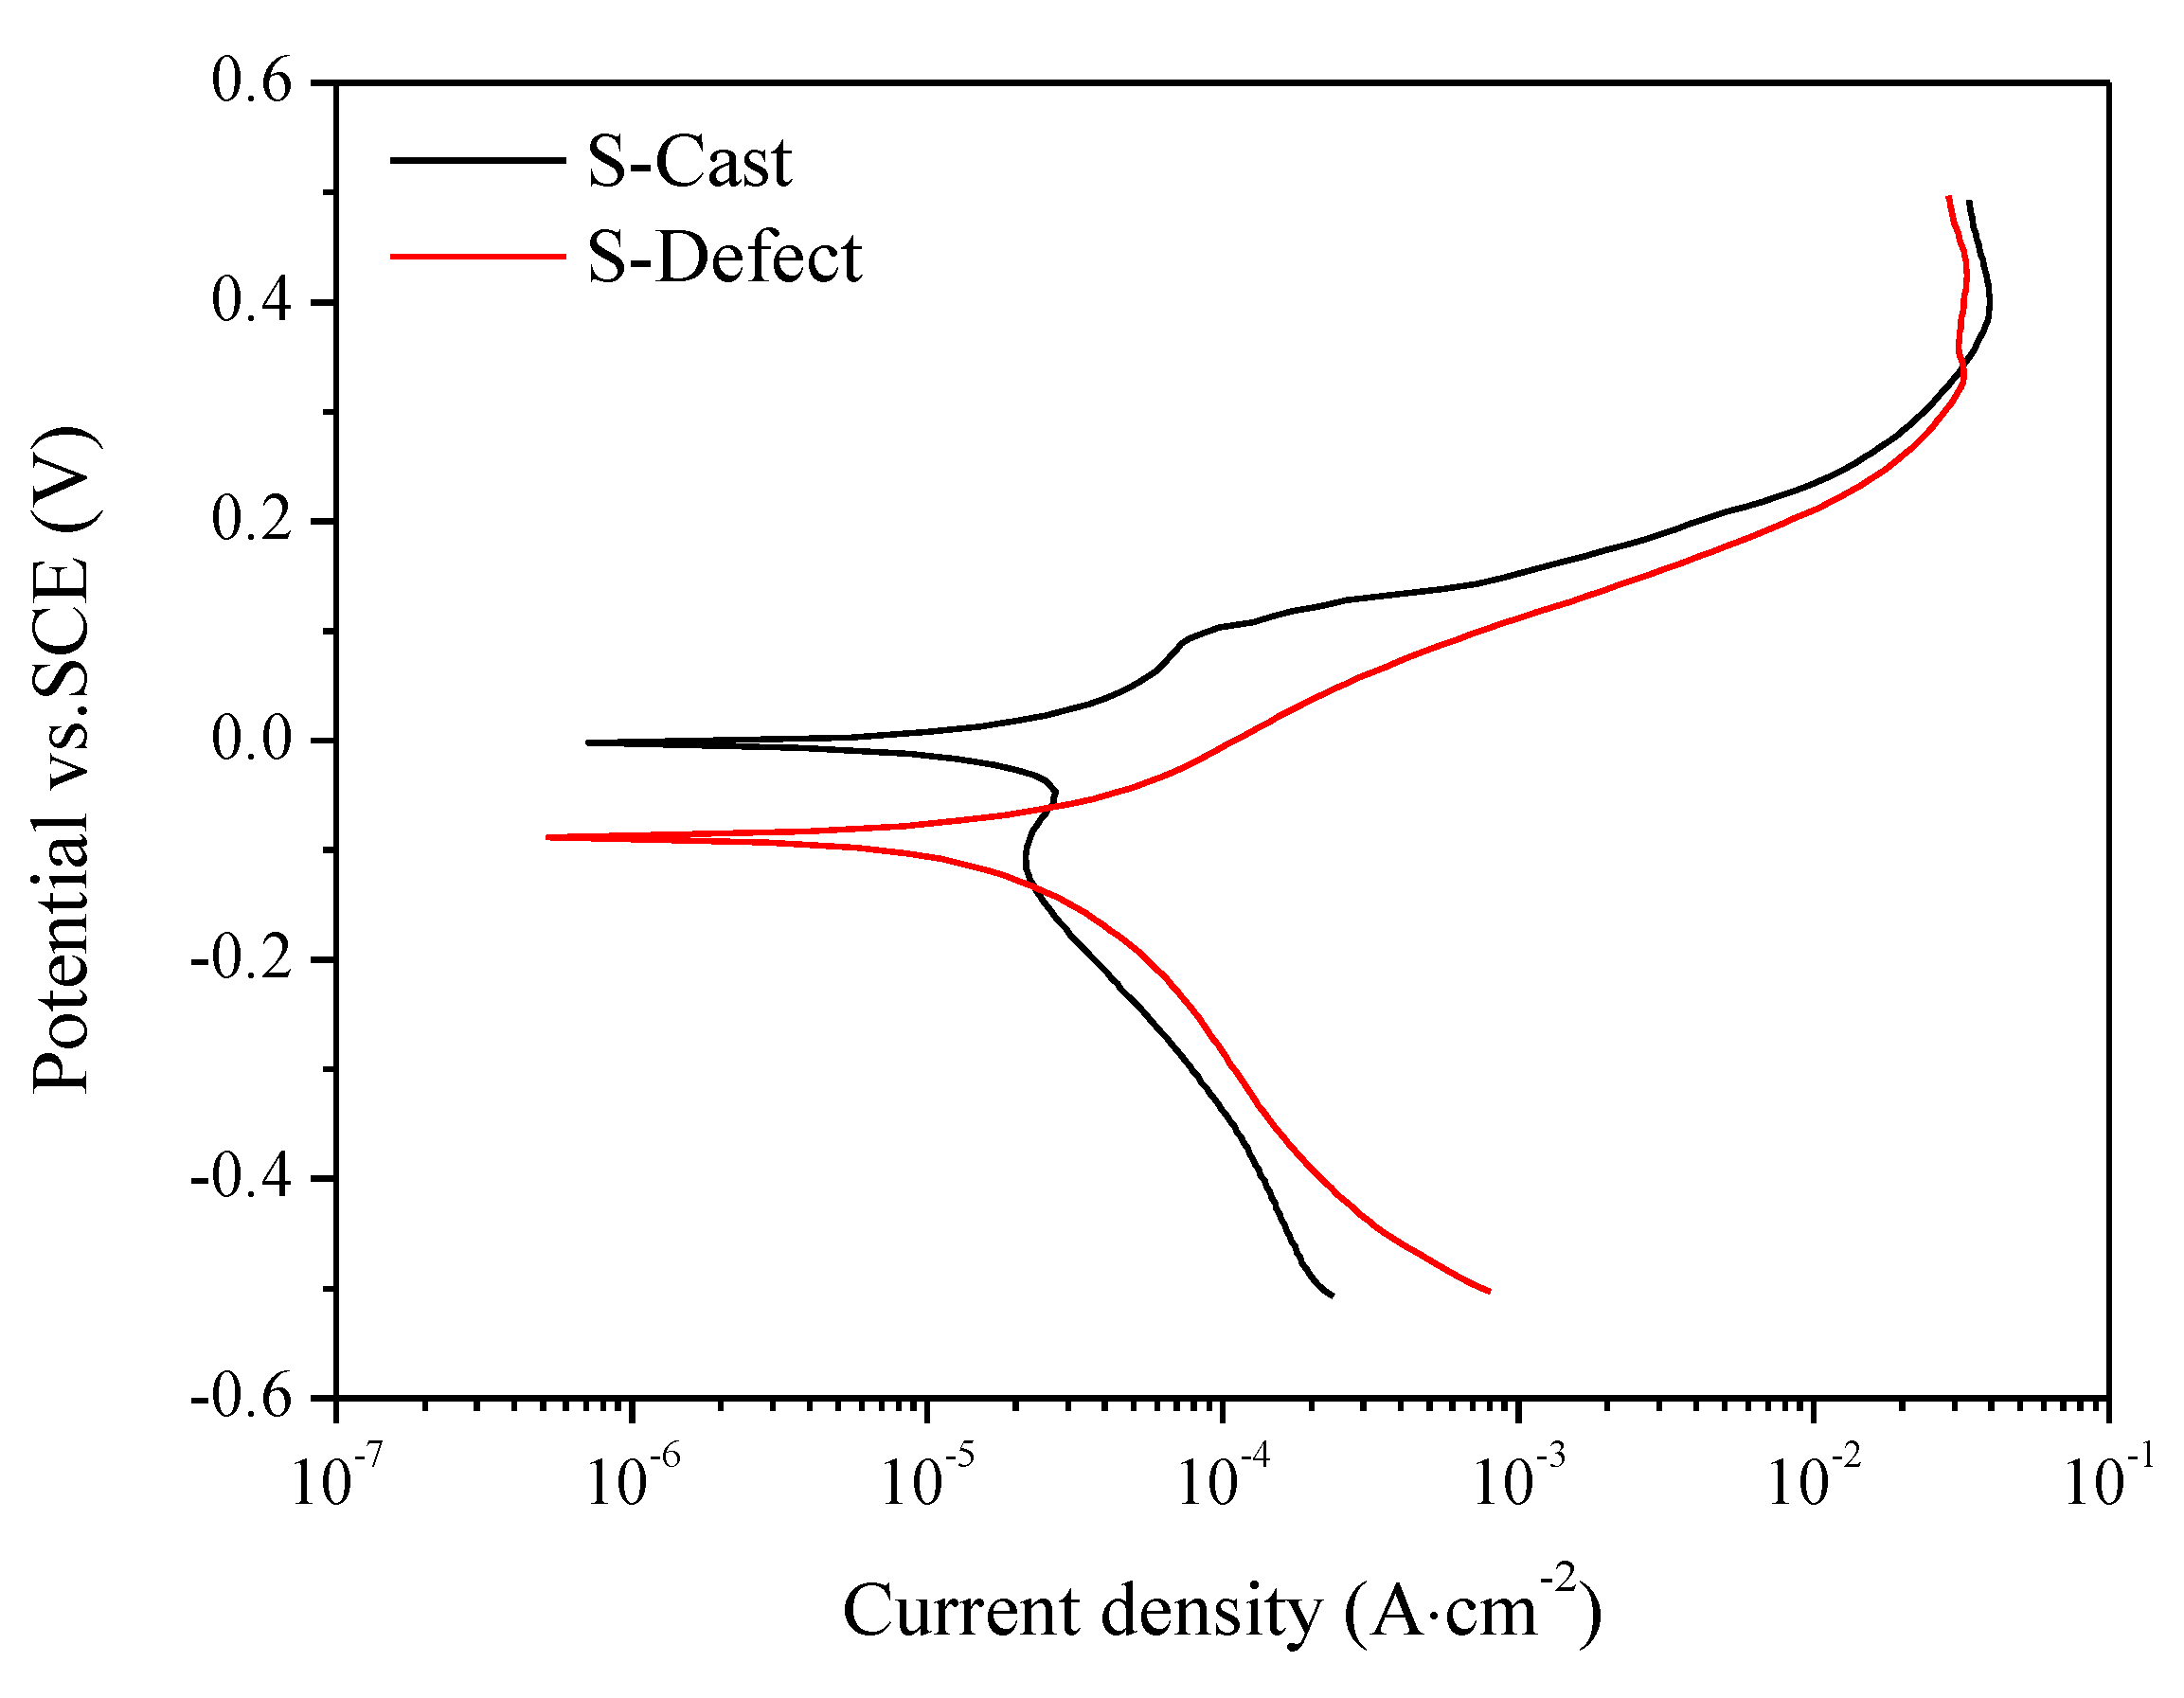
3.4. Electrochemistry
4. Discussion
4.1. Corrosion Rate of UNS C95810
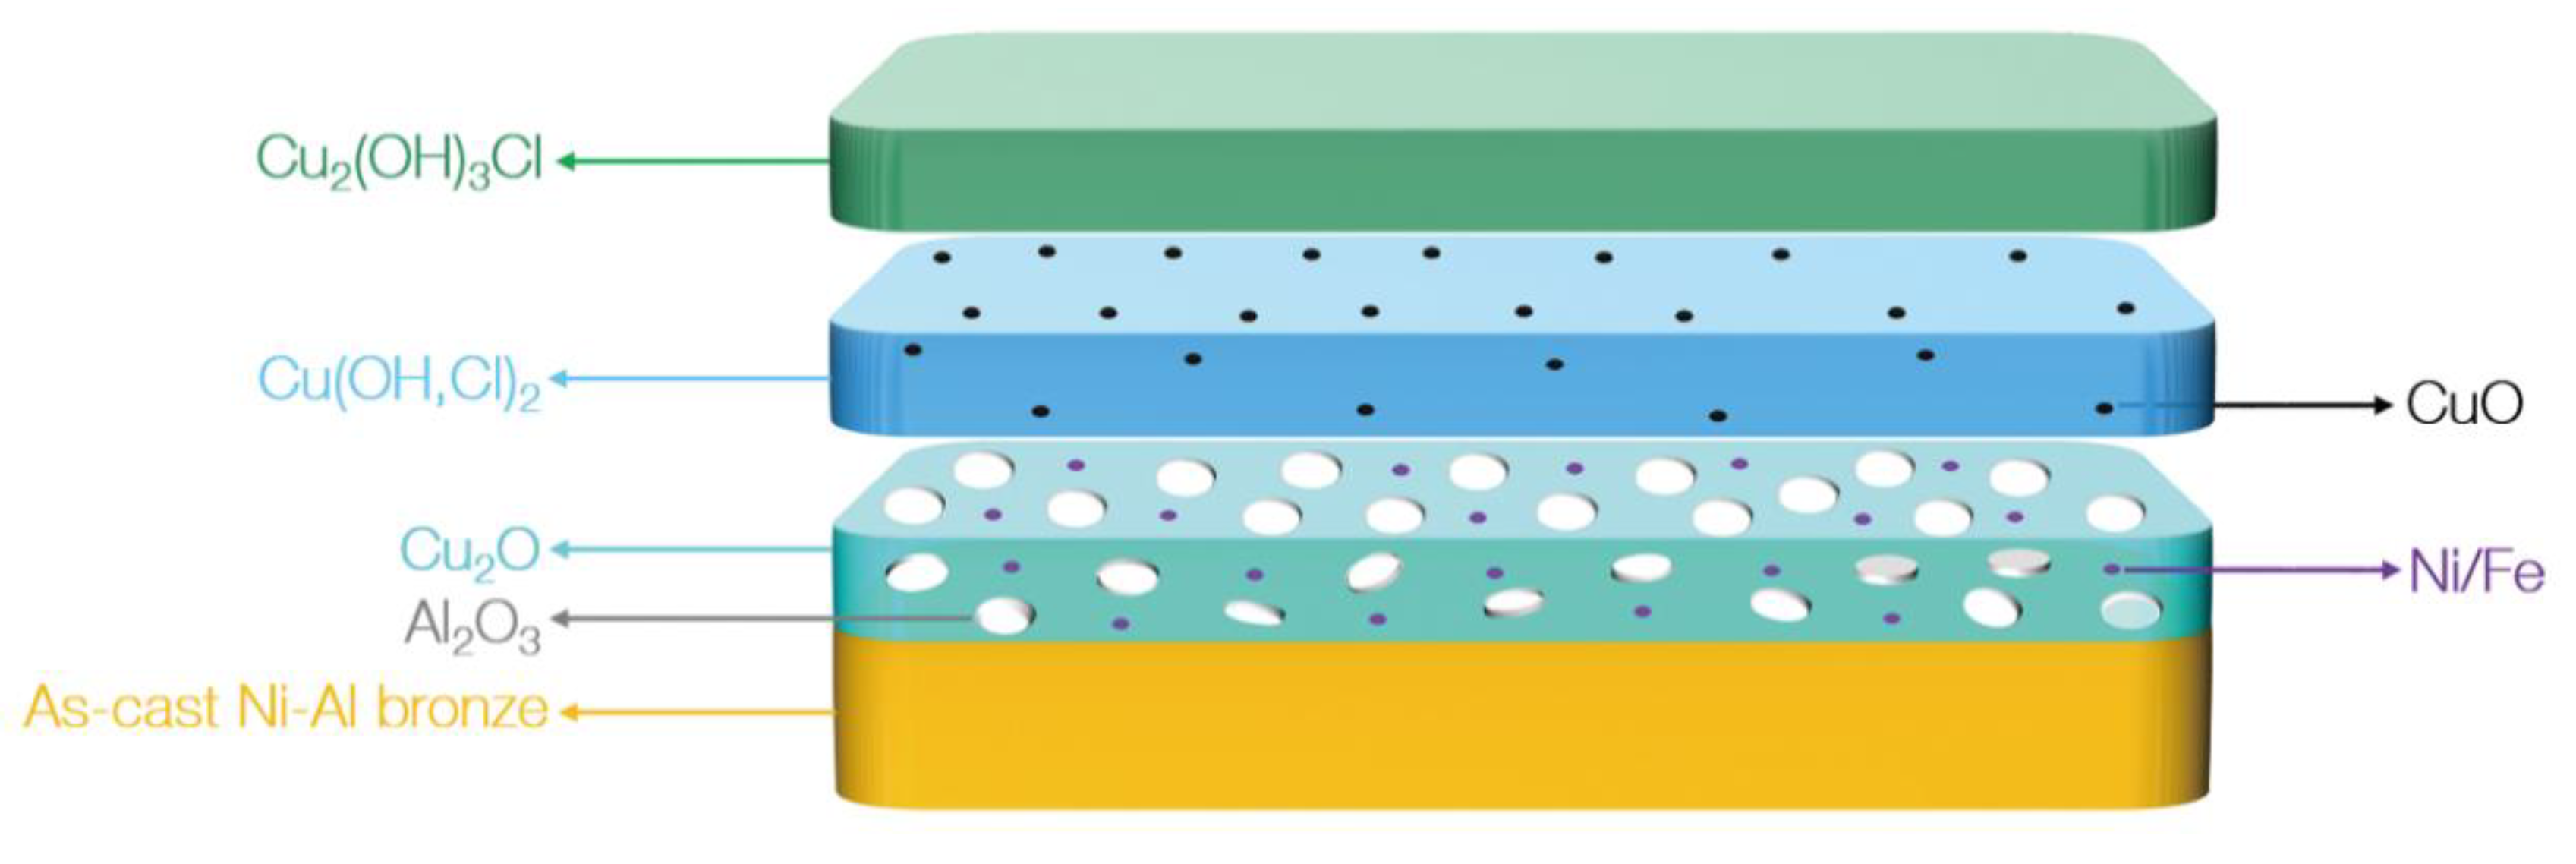
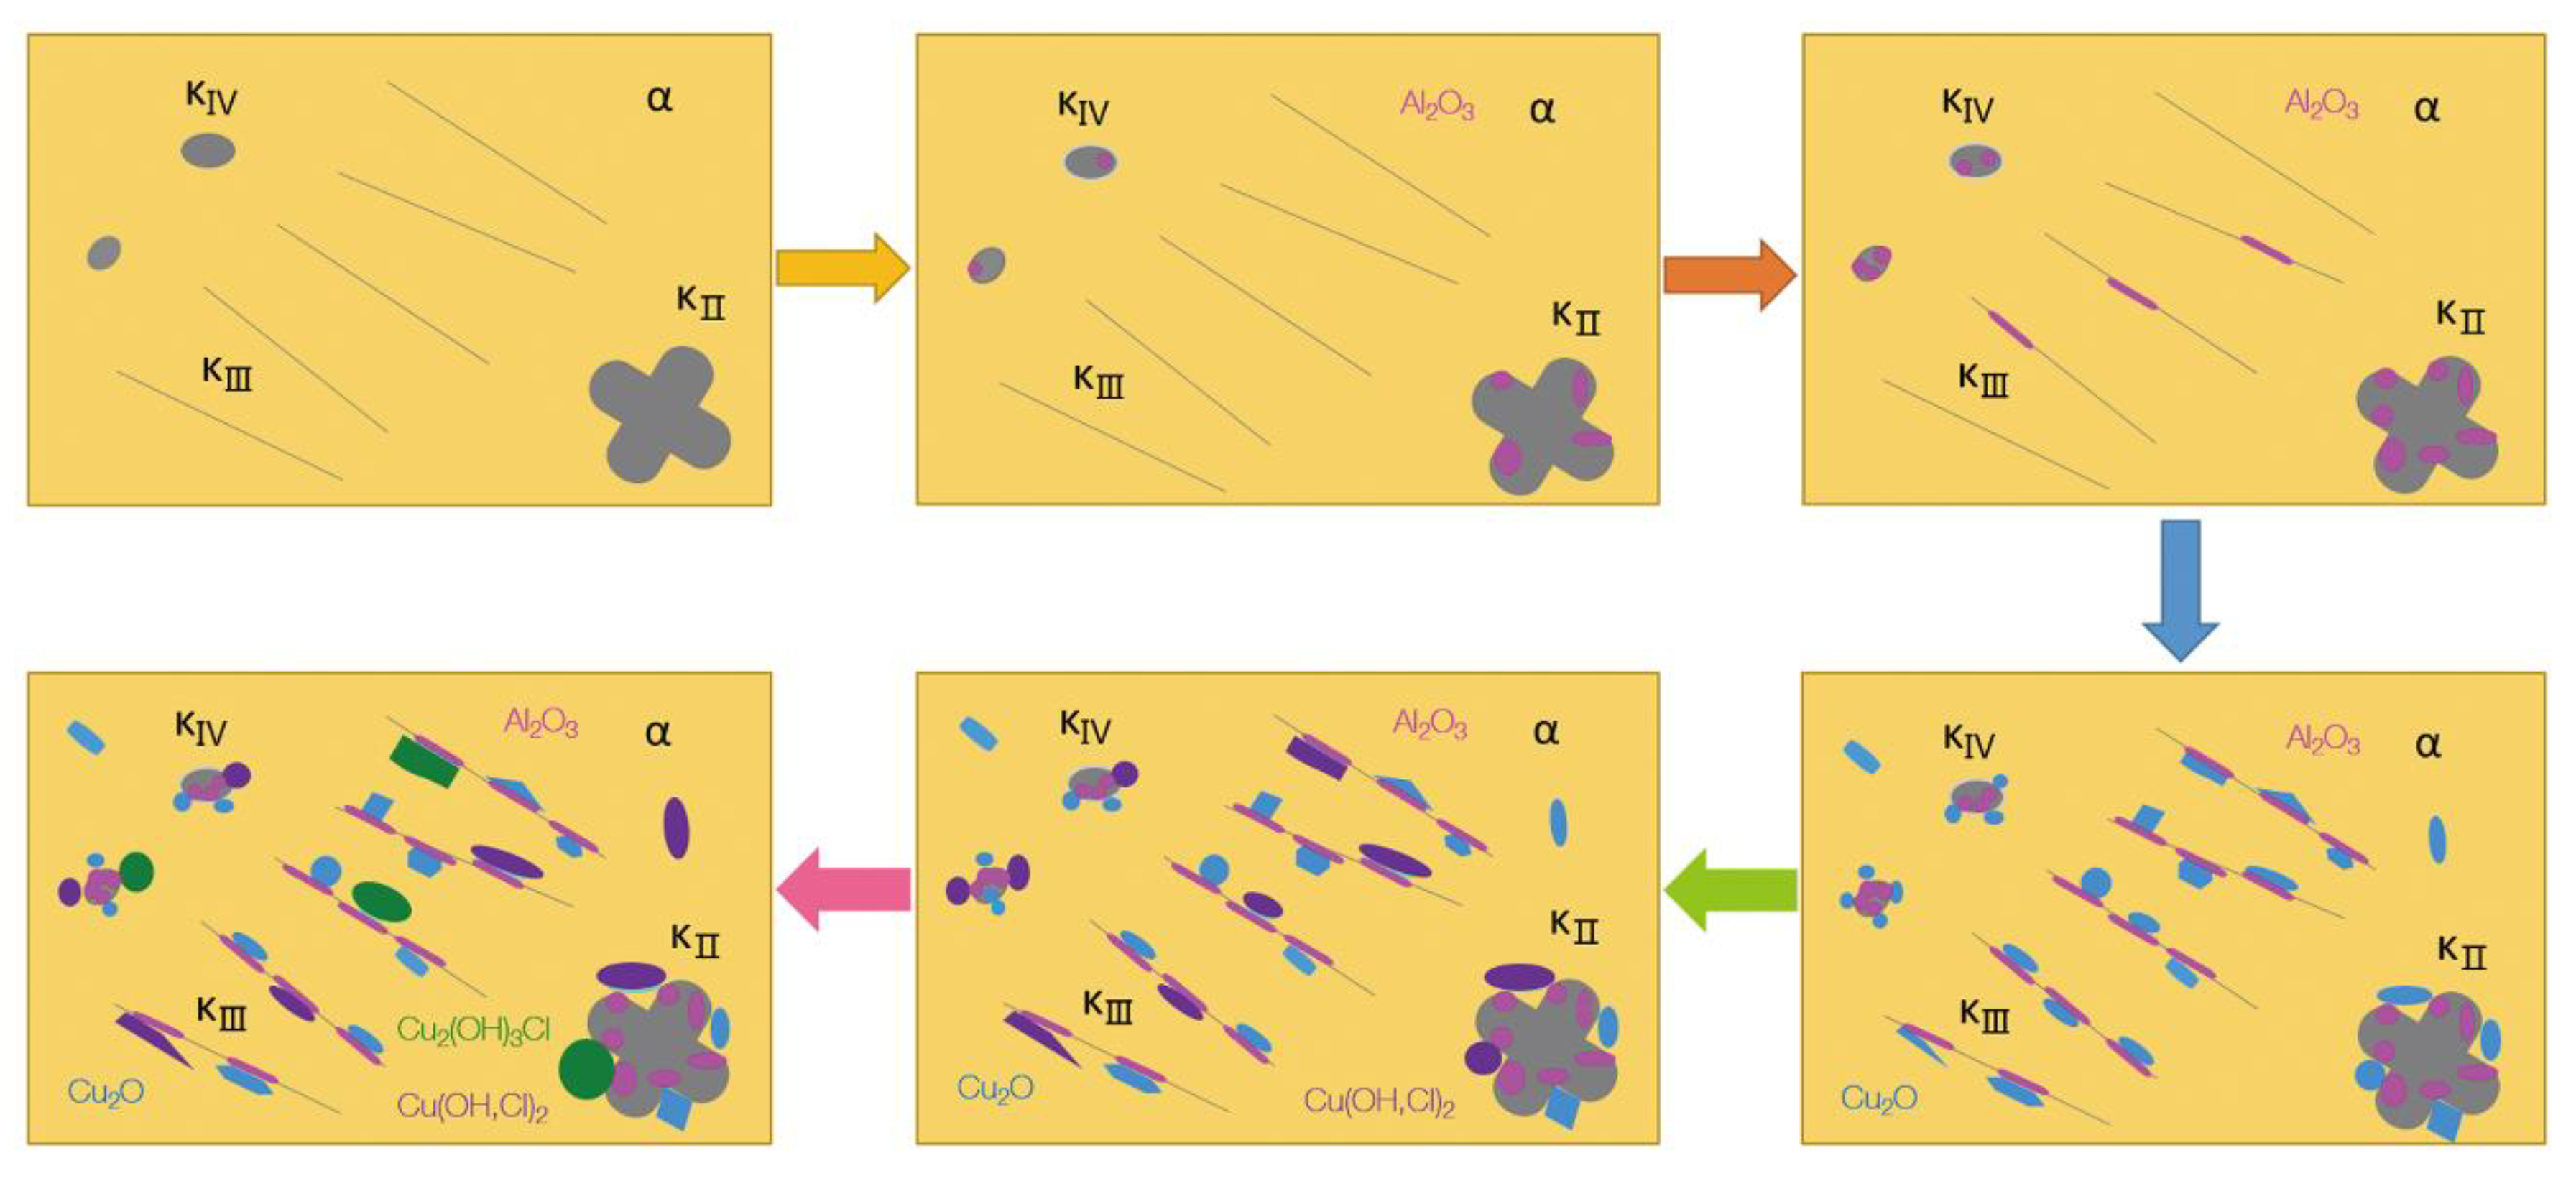
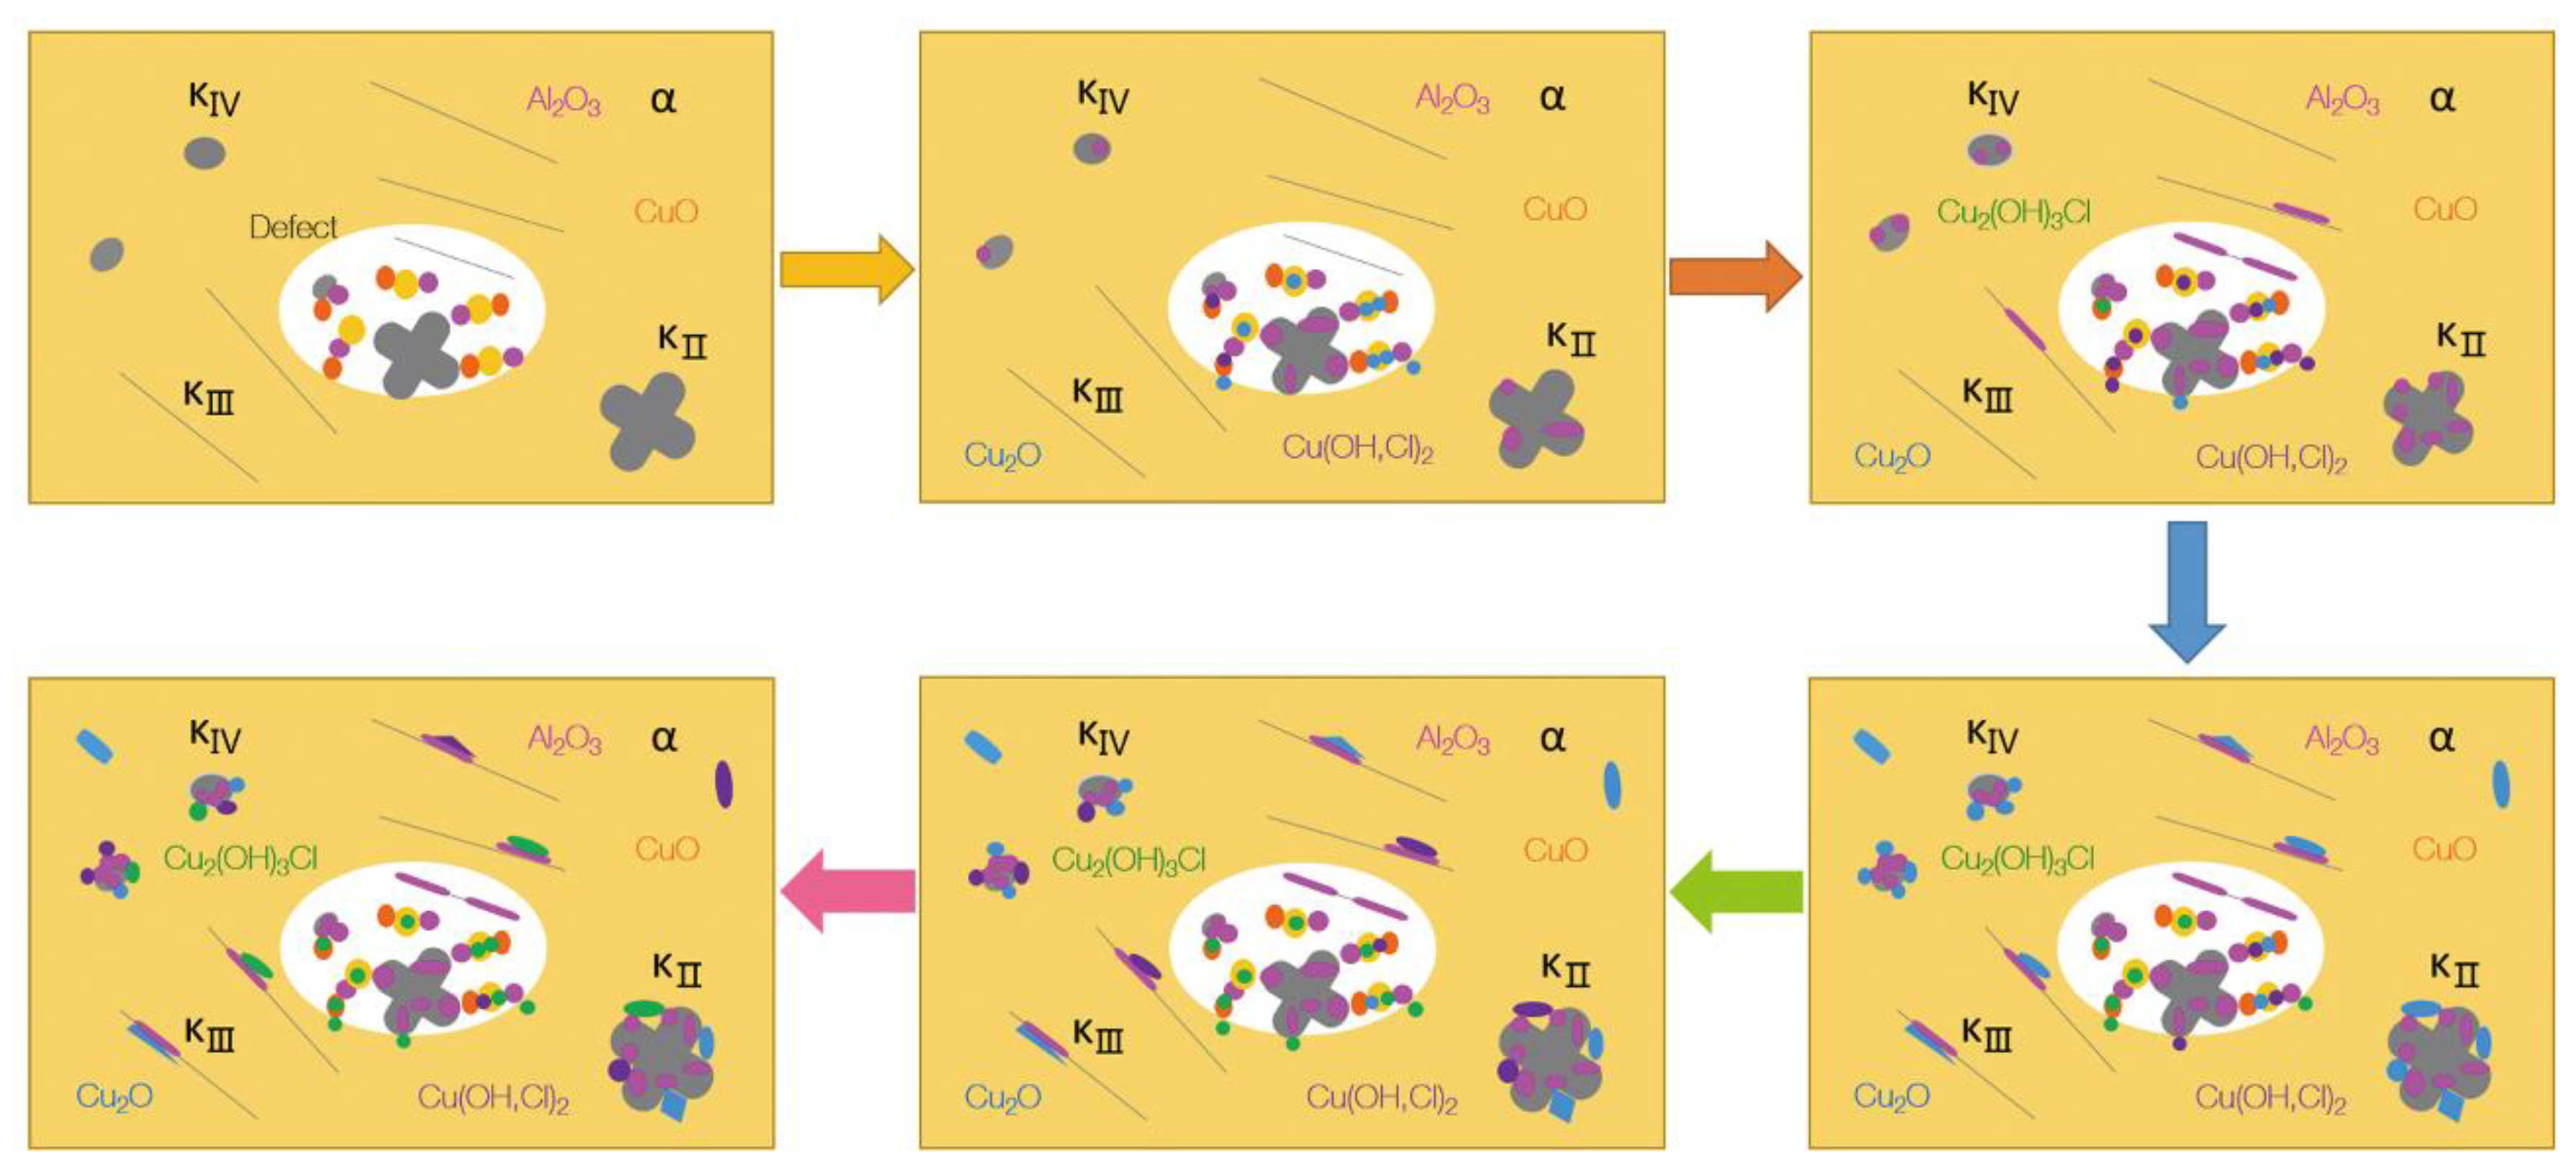
4.2. Corrosion Product Film Structure of S-Defect
4.3. Microstructure and Corrosion Behavior of UNS C95810
4.4. Corrosion Mechanism of UNS C95810
5. Conclusions
- 1)
- The microstructure of the UNS C95810 alloy consists of an α phase and a κ phase. Except for these cast phases, there are oxides of copper and aluminum, along with pure copper in defects.
- 2)
- Compared to those of S-Cast, S-Defect has a thicker corrosion product film, more negative corrosion potential and greater corrosion current density.
- 3)
- The corrosion product film of both S-Defect and S-cast consists of three layers. The inner layer is Al2O3 and Cu2O with the incorporation of Fe and Ni, the middle layer is Cu(OH,Cl)2 or CuO, and the outer layer is Cu2(OH)3Cl. The defects do not affect the phase composition of the corrosion products, but they have an effect on the amount of the specific phase in the corrosion products.
Author Contributions
Funding
Acknowledgments
Conflicts of Interest
References
- Culpan, E.A.; Rose, G. Corrosion Behaviour of Cast Nickel Aluminium Bronze in Sea Water. Br. Corros. J. 2014, 14, 160–166. [Google Scholar] [CrossRef]
- Al-Hashem, A.; Caceres, P.G.; Shalaby, H.M.; Riad, W.T. Cavitation Corrosion Behavior of Cast Nickel-Aluminum Bronze in Seawater. Corrosion 1995, 51, 331–342. [Google Scholar] [CrossRef]
- Wharton, J.A.; Barik, R.C.; Kear, G.; Wood, R.J.K.; Stokes, K.R.; Walsh, F.C. The corrosion of nickel–aluminium bronze in seawater. Corros. Sci. 2005, 47, 3336–3367. [Google Scholar] [CrossRef]
- Schüssler, A.; Exner, H.E. The corrosion of nickel-aluminium bronzes in seawater—I. Protective layer formation and the passivation mechanism. Corros. Sci. 1993, 34, 1793–1802. [Google Scholar] [CrossRef]
- Schüssler, A.; Exner, H.E. The corrosion of nickel-aluminium bronzes in seawater—II. The corrosion mechanism in the presence of sulphide pollution. Corros. Sci. 1993, 34, 1803–1811. [Google Scholar] [CrossRef]
- Ferrara, R.J.; Caton, T.E. Review of dealloying of cast aluminum bronze and nickel-aluminum bronze alloys in sea water service. Mater. Perform. 1982, 21, 30–34. [Google Scholar]
- Neodo, S.; Carugo, D.; Wharton, J.A.; Stokes, K.R. Electrochemical behaviour of nickel–aluminium bronze in chloride media: Influence of pH and benzotriazole. J. Electroanal. Chem. 2013, 695, 38–46. [Google Scholar] [CrossRef]
- Lorimer, G.W.; Hasan, F.; Iqbal, J.; Ridley, N. Observation of microstructure and corrosion behaviour of some aluminium bronzes. Br. Corros. J. 2013, 21, 244–248. [Google Scholar] [CrossRef]
- Hasan, F.; Jahanafrooz, A.; Lorimer, G.W.; Ridley, N. The morphology, crystallography, and chemistry of phases in as-cast nickel-aluminum bronze. Metall. Trans. A 1982, 13, 1337–1345. [Google Scholar] [CrossRef]
- Weill-Couly, P.; Arnaud, D. Effect of the Composition and Structure of Aluminum Bronzes on their Behavior in Service. Fonderie 1973, 123–135. [Google Scholar]
- Tuthill, A.H. Guidelines for the use of copper alloys in seawater. Mater. Perform. 1987, 26, 12–22. [Google Scholar]
- Ateya, B.G.; Ashour, E.A.; Sayed, S.M. Corrosion of αAl bronze in saline water. J. Electrochem. Soc. 1994, 141, 71–77. [Google Scholar] [CrossRef]
- Kato, C.; Castle, J.E.; Ateya, B.G.; Pickering, H.W. On the mechanism of corrosion of Cu-9.4Ni-1.7Fe alloy in air saturated aqueous NaCl solution 2. Composition of the protective surface layer. J. Electrochem. Soc. 1980, 127, 1897–1903. [Google Scholar] [CrossRef]
- North, R.F.; Pryor, M.J. The influence of corrosion product structure on the corrosion rate of Cu-Ni alloys. Corros. Sci. 1970, 10, 297–311. [Google Scholar] [CrossRef]
- Sabbaghzadeh, B.; Parvizi, R.; Davoodi, A.; Moayed, M.H. Corrosion evaluation of multi-pass welded nickel–aluminum bronze alloy in 3.5% sodium chloride solution: A restorative application of gas tungsten arc welding process. Mater. Des. 2014, 58, 346–356. [Google Scholar] [CrossRef]
- Hanke, S.; Fischer, A.; Beyer, M.; Santos, J.D. Cavitation erosion of NiAl-bronze layers generated by friction surfacing. Wear 2011, 273, 32–37. [Google Scholar] [CrossRef]
- Ni, D.R.; Xiao, B.L.; Ma, Z.Y.; Qiao, Y.X.; Zheng, Y.G. Corrosion properties of friction–stir processed cast NiAl bronze. Corros. Sci. 2010, 52, 1610–1617. [Google Scholar] [CrossRef]
- Wang, J.; Yan, F.; Xue, Q. Tribological behaviors of some polymeric materials in sea water. Sci. Bull. 2009, 54, 4541–4548. [Google Scholar] [CrossRef]
- Cao, C.N. Principles of Electrochemistry of Corrosion, 3rd ed.; Chemical Industry Press: Beijing, China, 2008. [Google Scholar]
- Song, Q.N.; Zheng, Y.G.; Ni, D.R.; Ma, Z.Y. Characterization of the Corrosion Product Films Formed on the As-Cast and Friction-Stir Processed Ni-Al Bronze in a 3.5 wt% NaCl Solution. Corrosion 2015, 71, 606–614. [Google Scholar] [CrossRef]
- Song, Q.N. Effect of Friction Stir Processing on the Cavitation Erosion and Corrosion Behaviors of As-Cast Ni-Al Bronze. Ph.D. Thesis, University of Chinese Academy of Sciences, Beijing, China, 2015. [Google Scholar]
- Du, C.Y. Research on Corrosion Resistance of the Nickel-Aluminum Bronze and the Surface Treatment on It. Master’s Thesis, Jiangsu University of Science and Technology, Zhenjiang, China, 2014. [Google Scholar]
- Badawy, W.A.; Al-Kharafi, F.M.; El-Azab, A.S. Electrochemical behaviour and corrosion inhibition of Al, Al-6061 and Al–Cu in neutral aqueous solutions. Corros. Sci. 1999, 41, 709–727. [Google Scholar] [CrossRef]
- Nady, H.; Helal, N.H.; El-Rabiee, M.M.; Badawy, W.A. The role of Ni content on the stability of Cu–Al–Ni ternary alloy in neutral chloride solutions. Mater. Chem. Phys. 2012, 134, 945–950. [Google Scholar] [CrossRef]
- Mansfeld, F.; Liu, G.; Xiao, H.; Tsai, C.H.; Little, B.J. The corrosion behavior of copper alloys, stainless steels and titanium in seawater. Corros. Sci. 1994, 36, 2063–2095. [Google Scholar] [CrossRef]
- Popplewell, J.M.; Hart, R.J.; Ford, J.A. The effect of iron on the corrosion characteristics of 90-10 cupro nickel in quiescent 3·4%NaCl solution. Corros. Sci. 1973, 13, 295–309. [Google Scholar] [CrossRef]
- Milošev, I.; Metikoš-Huković, M. The behaviour of Cu-xNi (x = 10 to 40 wt%) alloys in alkaline solutions containing chloride ions. Electrochim. Acta 1997, 42, 1537–1548. [Google Scholar] [CrossRef]
- Lenglet, M.; Lopitaux, J.; Leygraf, C.; Odnevall, I.; Carballeira, M.; Noualhaguet, J.C.; Guinement, J.; Gautier, J.; Boissel, J. Analysis of corrosion products formed on copper in Cl2/H2S/NO2 exposure. J. Electrochem. Soc. 1995, 142, 3690–3696. [Google Scholar] [CrossRef]
- Li, M.; Guo, L.Q.; Qiao, L.J.; Bai, Y. The mechanism of hydrogen-induced pitting corrosion in duplex stainless steel studied by SKPFM. Corros. Sci. 2012, 60, 76–81. [Google Scholar] [CrossRef]
- Li, W.; Li, D.Y. Variations of work function and corrosion behaviors of deformed copper surfaces. Appl. Surf. Sci. 2005, 240, 388–395. [Google Scholar] [CrossRef]
- Wharton, J.A.; Stokes, K.R. The influence of nickel–aluminium bronze microstructure and crevice solution on the initiation of crevice corrosion. Electrochim. Acta 2008, 53, 2463–2473. [Google Scholar] [CrossRef]


| Elements | Cu | Mn | Fe | Al | Ni | Zn, Sn, Pb, C, Si, P, Sb |
|---|---|---|---|---|---|---|
| UNS C95810 (wt.%) | 79.9 | 1.39 | 4.8 | 9.24 | 4.43 | Trace |
| Components | NaCl | MgCl2 | Na2SO4 | CaCl2 | KCl | NaHCO3 | KBr | H3BO3 | SrCl2 | NaF |
|---|---|---|---|---|---|---|---|---|---|---|
| Mass Concentration (g/L) | 24.53 | 5.2 | 4.09 | 1.16 | 0.695 | 0.201 | 0.101 | 0.027 | 0.025 | 0.003 |
| Content of Element (atom.%) | |||||||
|---|---|---|---|---|---|---|---|
| Specimen | O | Al | Si | S | Cl | Fe | Cu |
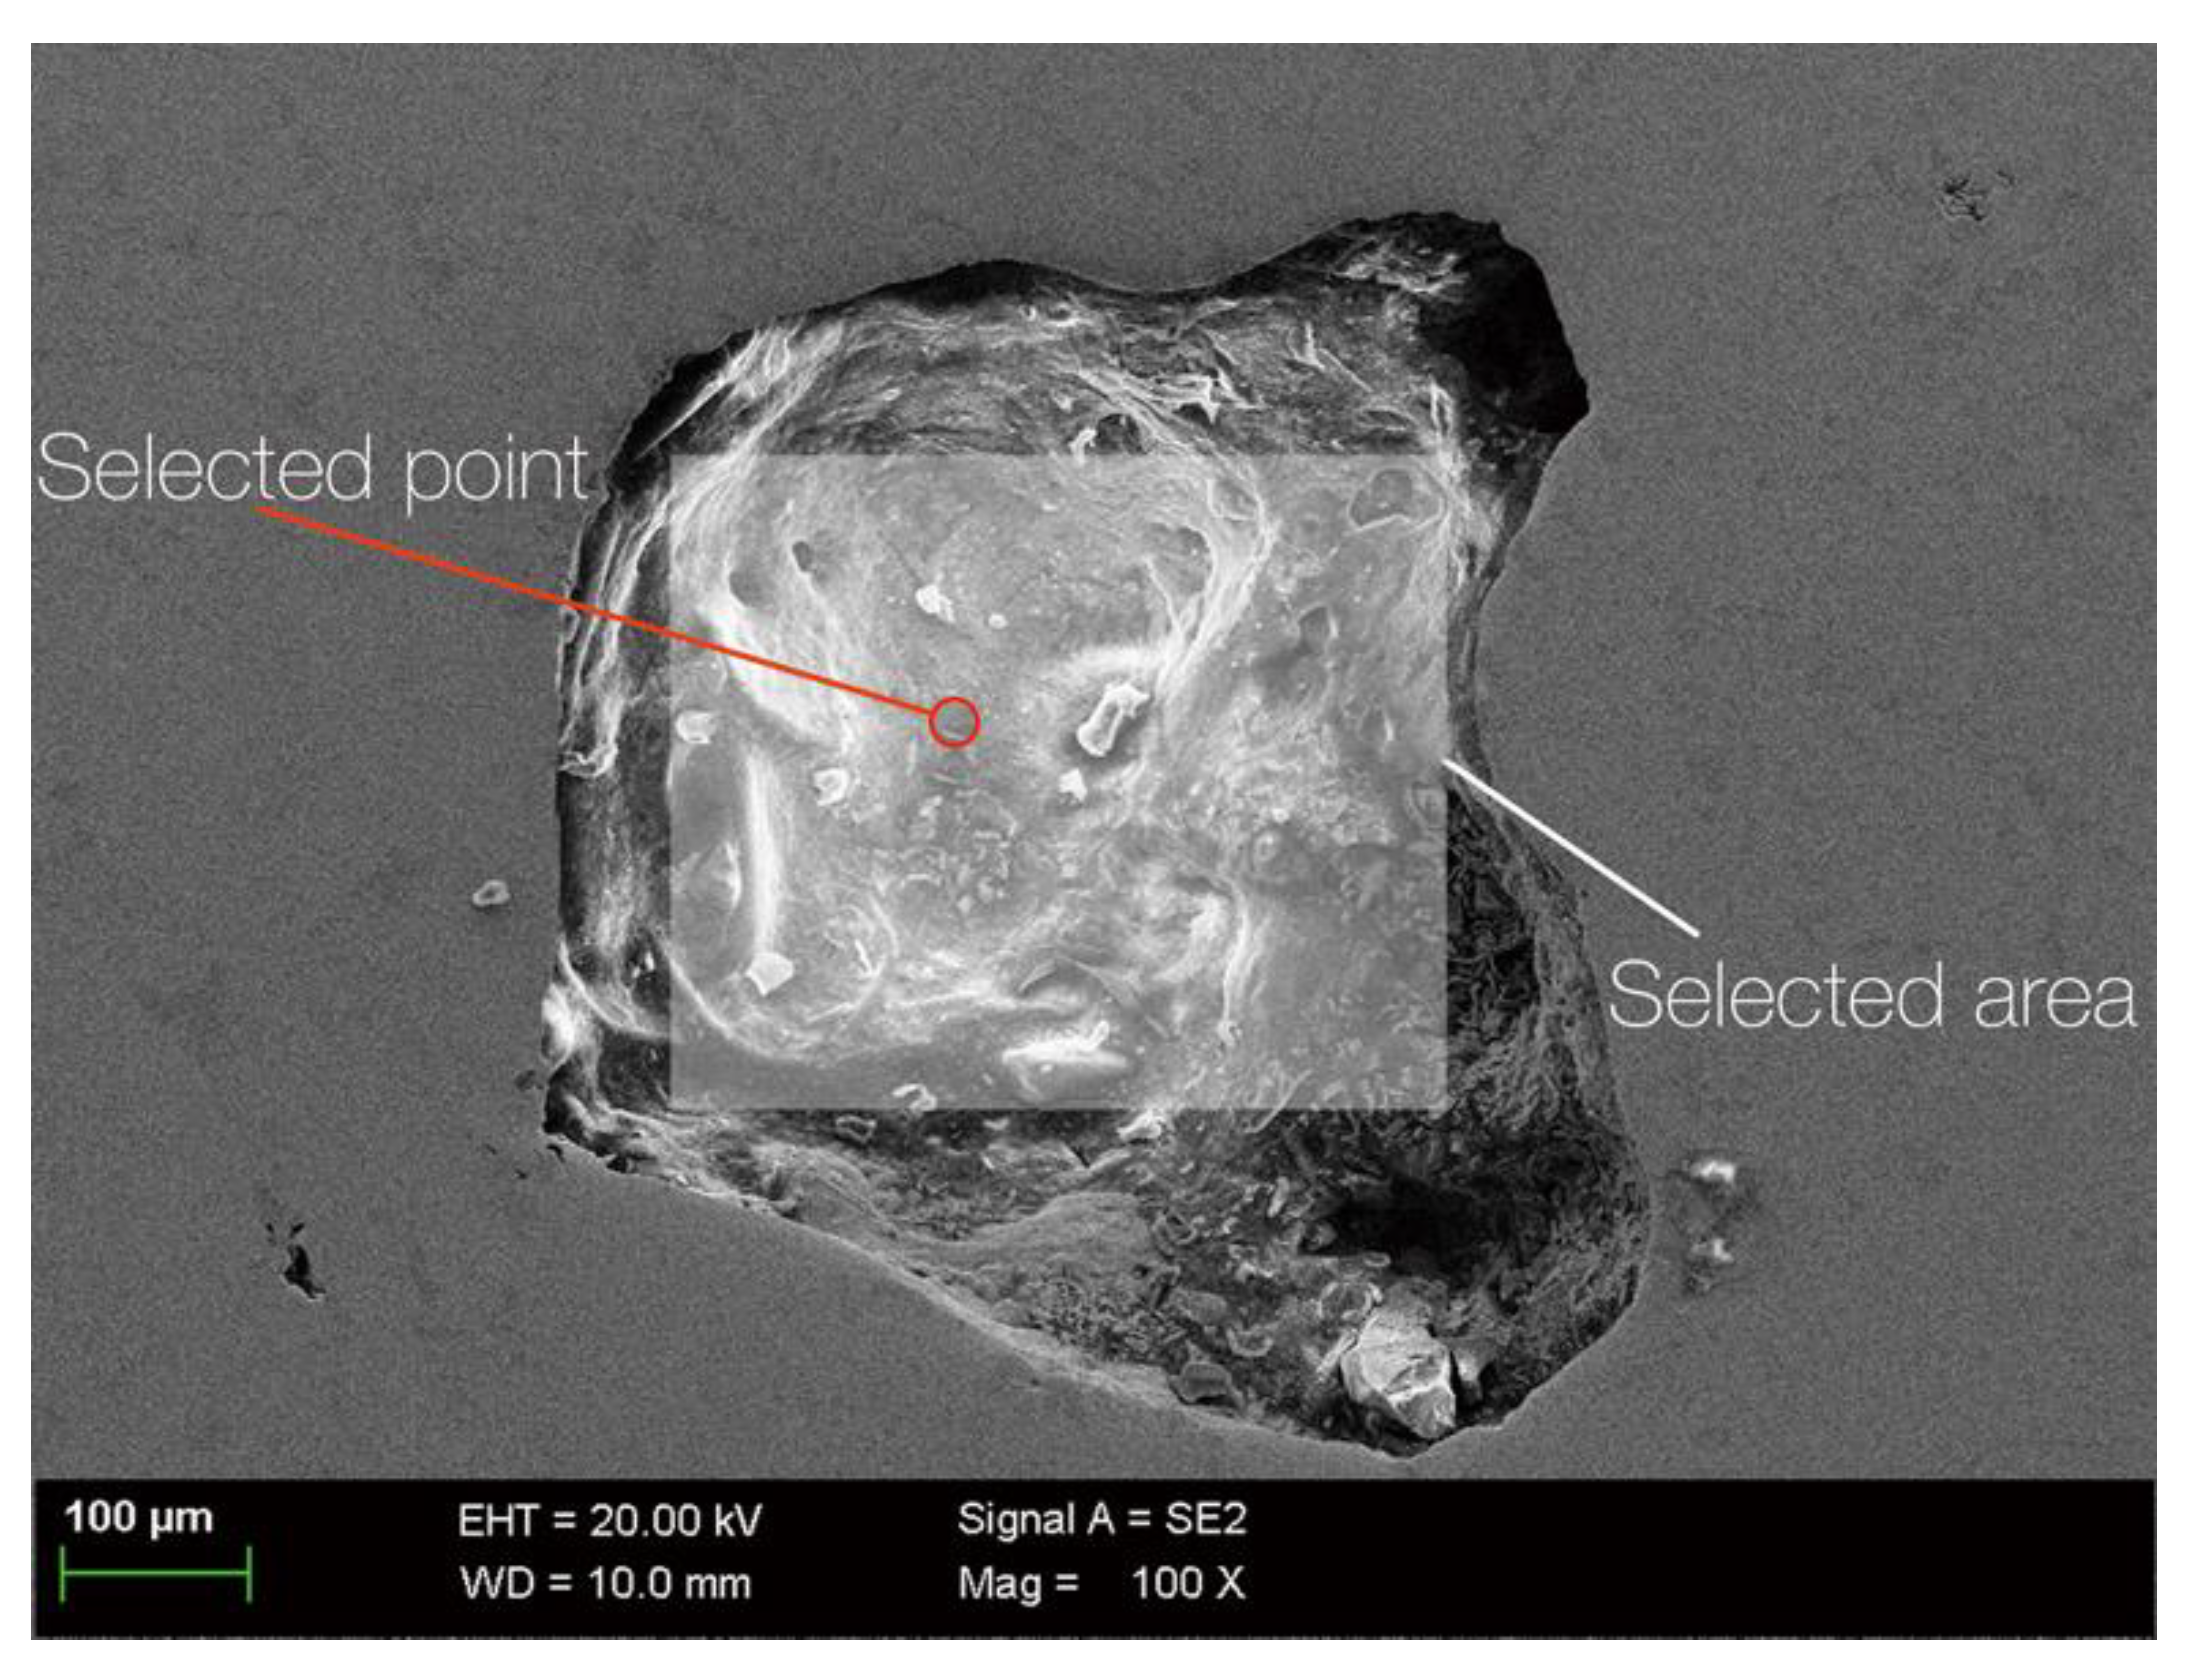
| Selected point in Figure 5 | 100 | ||||||
| Selected area in Figure 5 | 59.29 | 13.39 | 4.09 | 1.68 | 1.59 | 1.64 | 18.32 |
| Content of Element (atom.%) | |||||||||
|---|---|---|---|---|---|---|---|---|---|
| Position | O | Mg | Al | S | Cl | Ca | Fe | Ni | Cu |
| Zone I in Figure 7e | 78.79 | 2.99 | 1.30 | 3.43 | 0.85 | 0.85 | 11.79 | ||
| Zone II in Figure 7e | 72.01 | 2.31 | 6.62 | 1.38 | 3.67 | 0.29 | 0.47 | 1.13 | 12.12 |
| Sample | Mean (Standard Deviation) | ||
|---|---|---|---|
| Potential vs. SCE (mV) | Current Density (μA⋅cm−2) | Rp (kΩ⋅cm2) | |
| S-Cast | -3.83 (1.93) | 0.228 (0.12) | 18.9 (2.12) |
| S-Defect | -86.31 (3.62) | 0.23 (0.22) | 14.9 (2.89) |
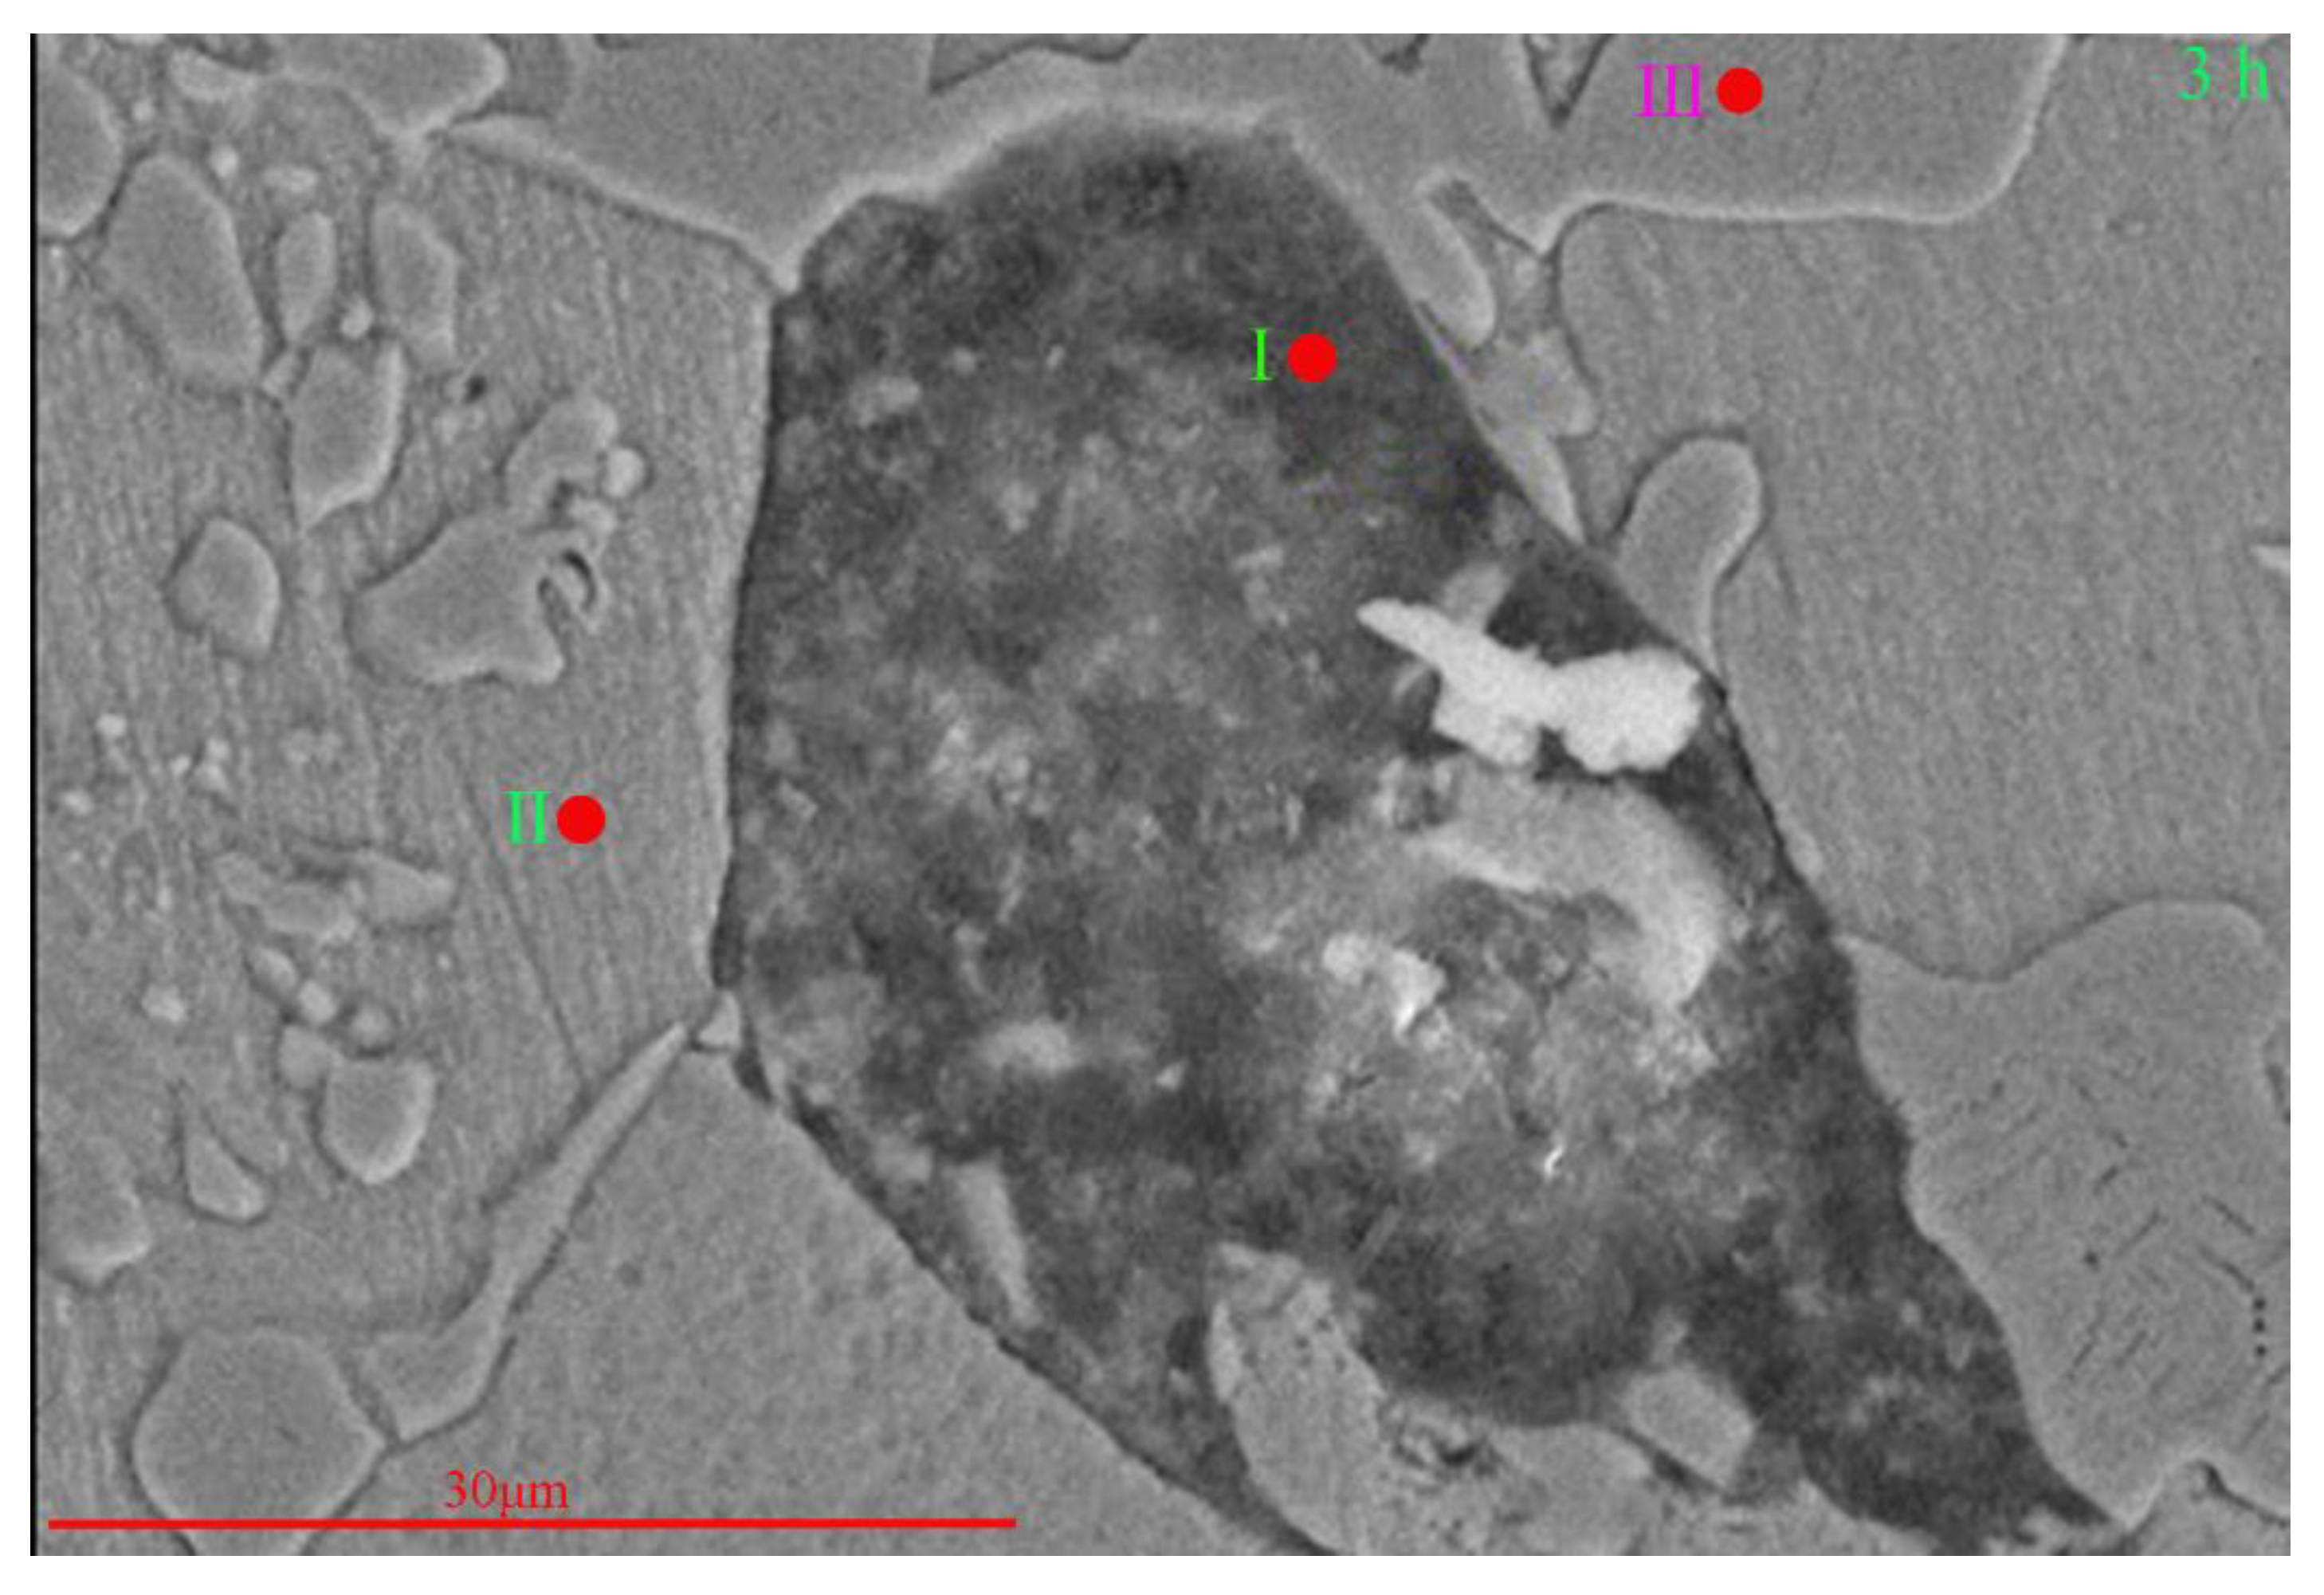
| Content of Element (atom.%) | |||||||
|---|---|---|---|---|---|---|---|
| Specimen | O | Al | Mn | Cl | Fe | Ni | Cu |
| Position I | 73.30 | 3.33 | - | 2.13 | 2.90 | 1.44 | 16.90 |
| Position II | - | 15.07 | 1.41 | - | 2.65 | 2.33 | 78.54 |
| Position III | - | 29.27 | 2.6 | - | 46.35 | 12.96 | 8.82 |
© 2020 by the authors. Licensee MDPI, Basel, Switzerland. This article is an open access article distributed under the terms and conditions of the Creative Commons Attribution (CC BY) license (http://creativecommons.org/licenses/by/4.0/).
Share and Cite
Zhao, X.; Qi, Y.; Wang, J.; Zhang, Z.; Zhu, J.; Quan, L.; He, D. Effect of Cast Defects on the Corrosion Behavior and Mechanism of UNS C95810 Alloy in Artificial Seawater. Materials 2020, 13, 1790. https://doi.org/10.3390/ma13071790
Zhao X, Qi Y, Wang J, Zhang Z, Zhu J, Quan L, He D. Effect of Cast Defects on the Corrosion Behavior and Mechanism of UNS C95810 Alloy in Artificial Seawater. Materials. 2020; 13(7):1790. https://doi.org/10.3390/ma13071790
Chicago/Turabian StyleZhao, Xu, Yuhong Qi, Jintao Wang, Zhanping Zhang, Jing Zhu, Linlin Quan, and Dachuan He. 2020. "Effect of Cast Defects on the Corrosion Behavior and Mechanism of UNS C95810 Alloy in Artificial Seawater" Materials 13, no. 7: 1790. https://doi.org/10.3390/ma13071790
APA StyleZhao, X., Qi, Y., Wang, J., Zhang, Z., Zhu, J., Quan, L., & He, D. (2020). Effect of Cast Defects on the Corrosion Behavior and Mechanism of UNS C95810 Alloy in Artificial Seawater. Materials, 13(7), 1790. https://doi.org/10.3390/ma13071790