Capillary Uptake Monitoring in Lime-Hemp-Perlite Composite Using the Time Domain Reflectometry Sensing Technique for Moisture Detection in Building Composites


Abstract
1. Introduction
2. Materials and Methods
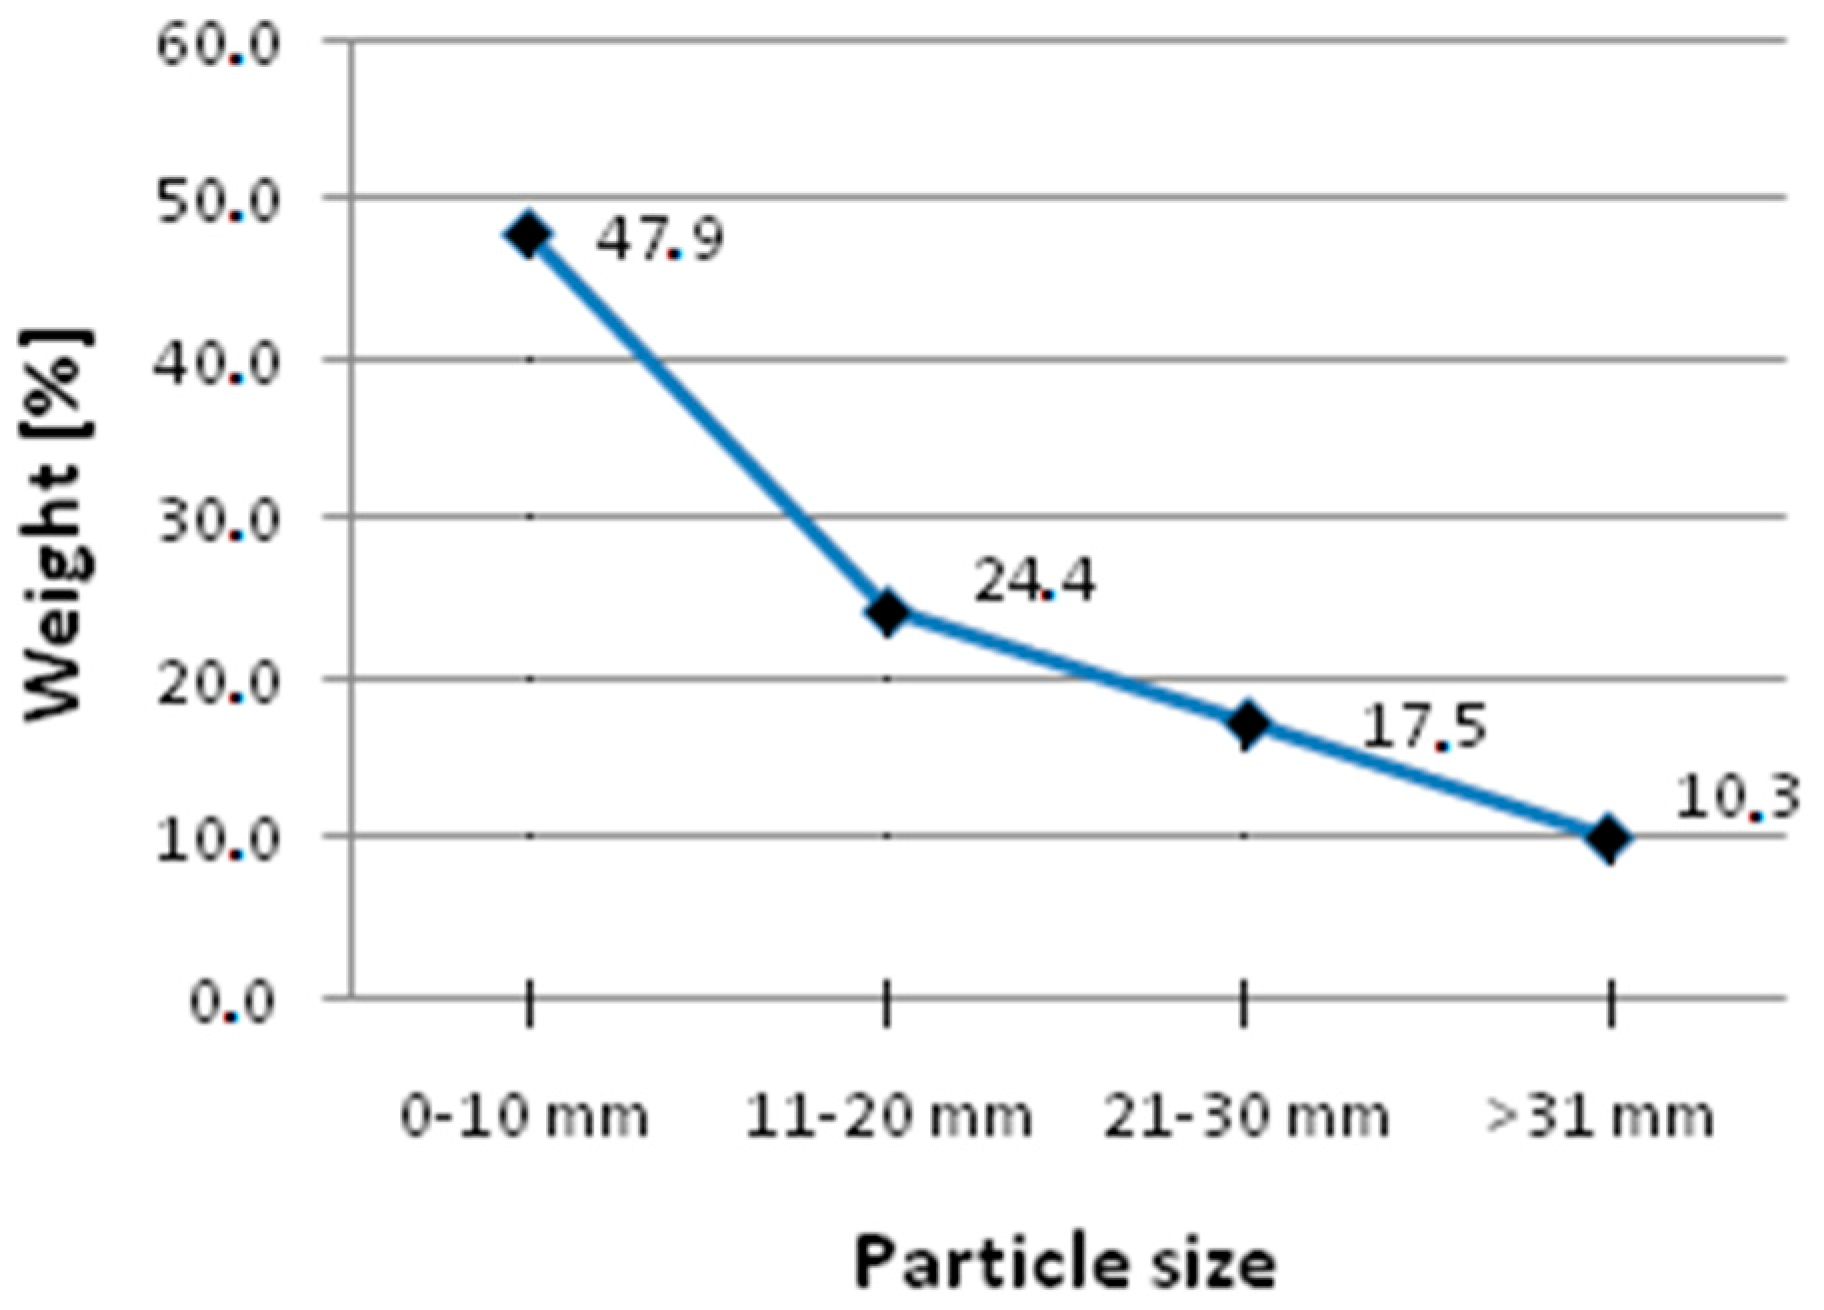
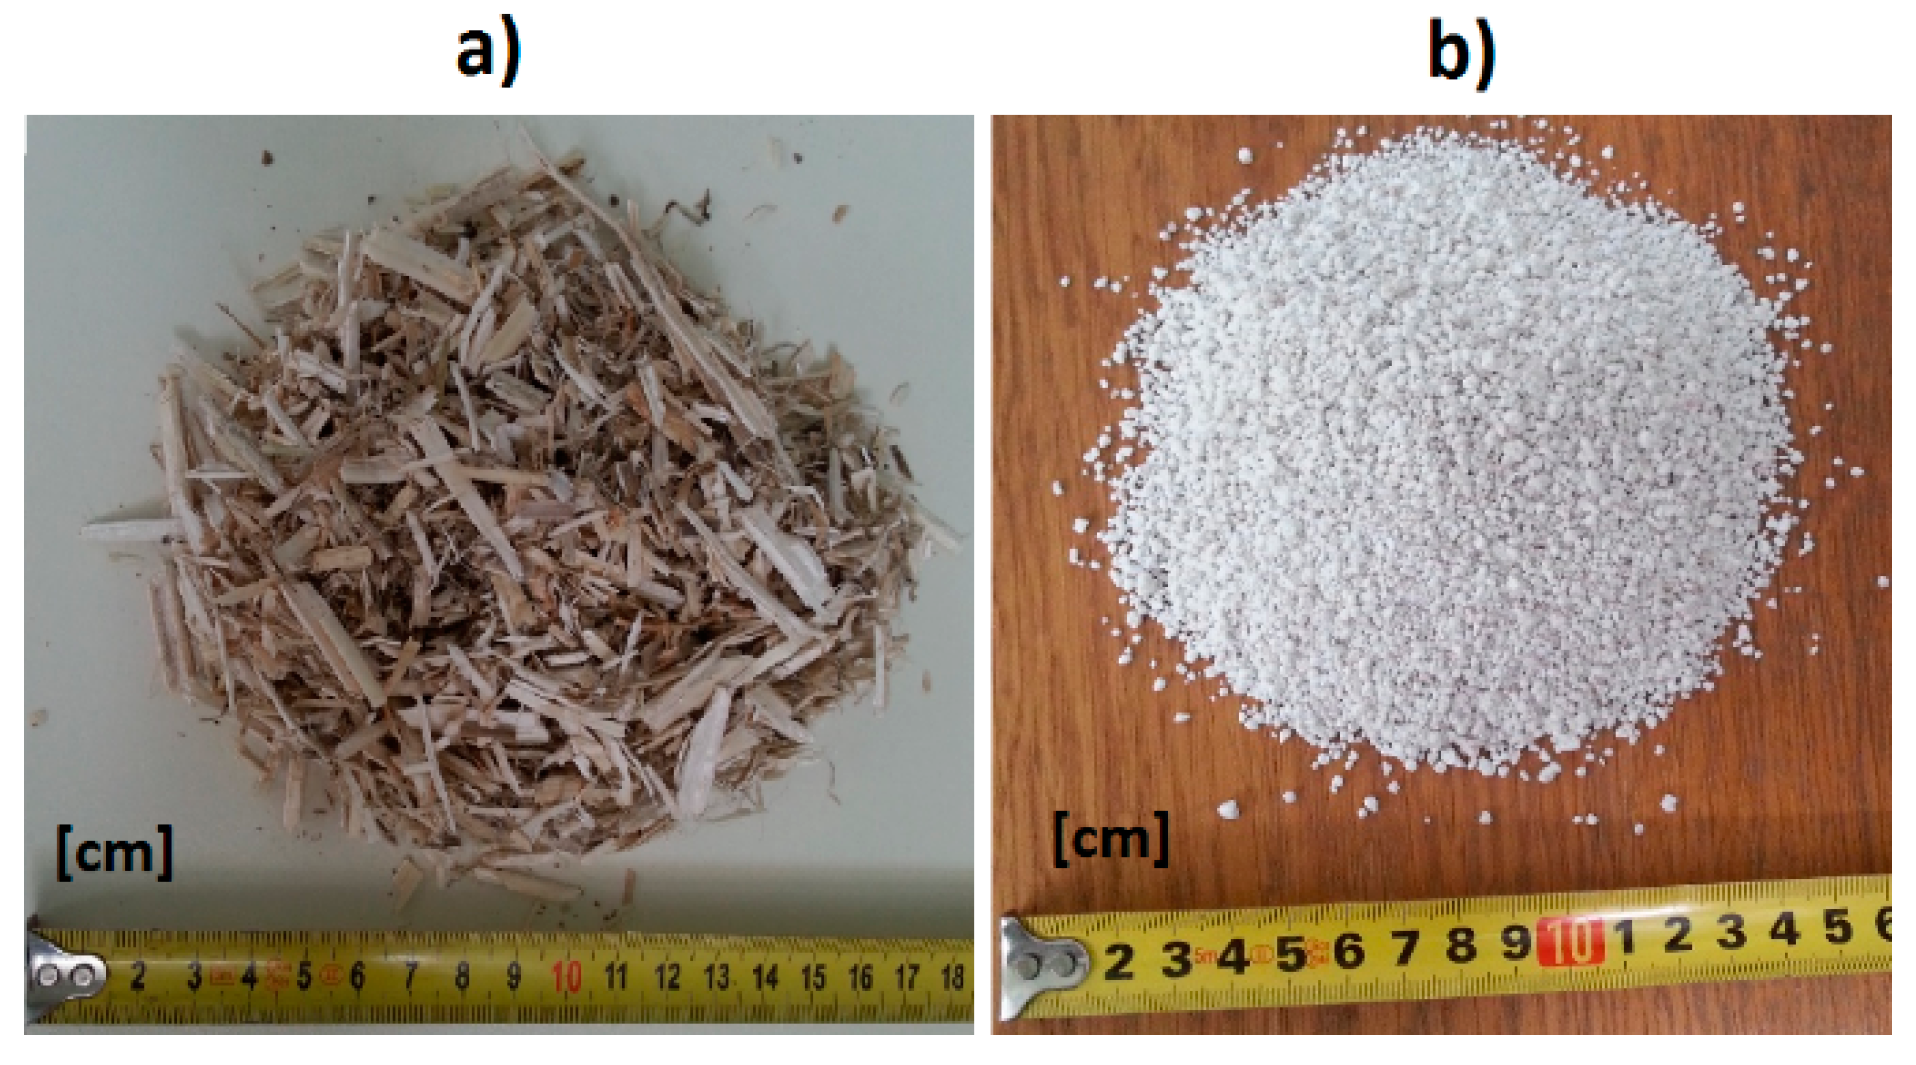
2.1. Description of Materials
2.2. Sample Production Process
2.3. Determination of Composite Parameters
2.3.1. Apparent Density and Porosity
2.3.2. Flexural and Compressive Strength
2.3.3. Thermal Conductivity
2.3.4. Mass Absorptivity
2.3.5. Capillary Uptake (Standard Method)
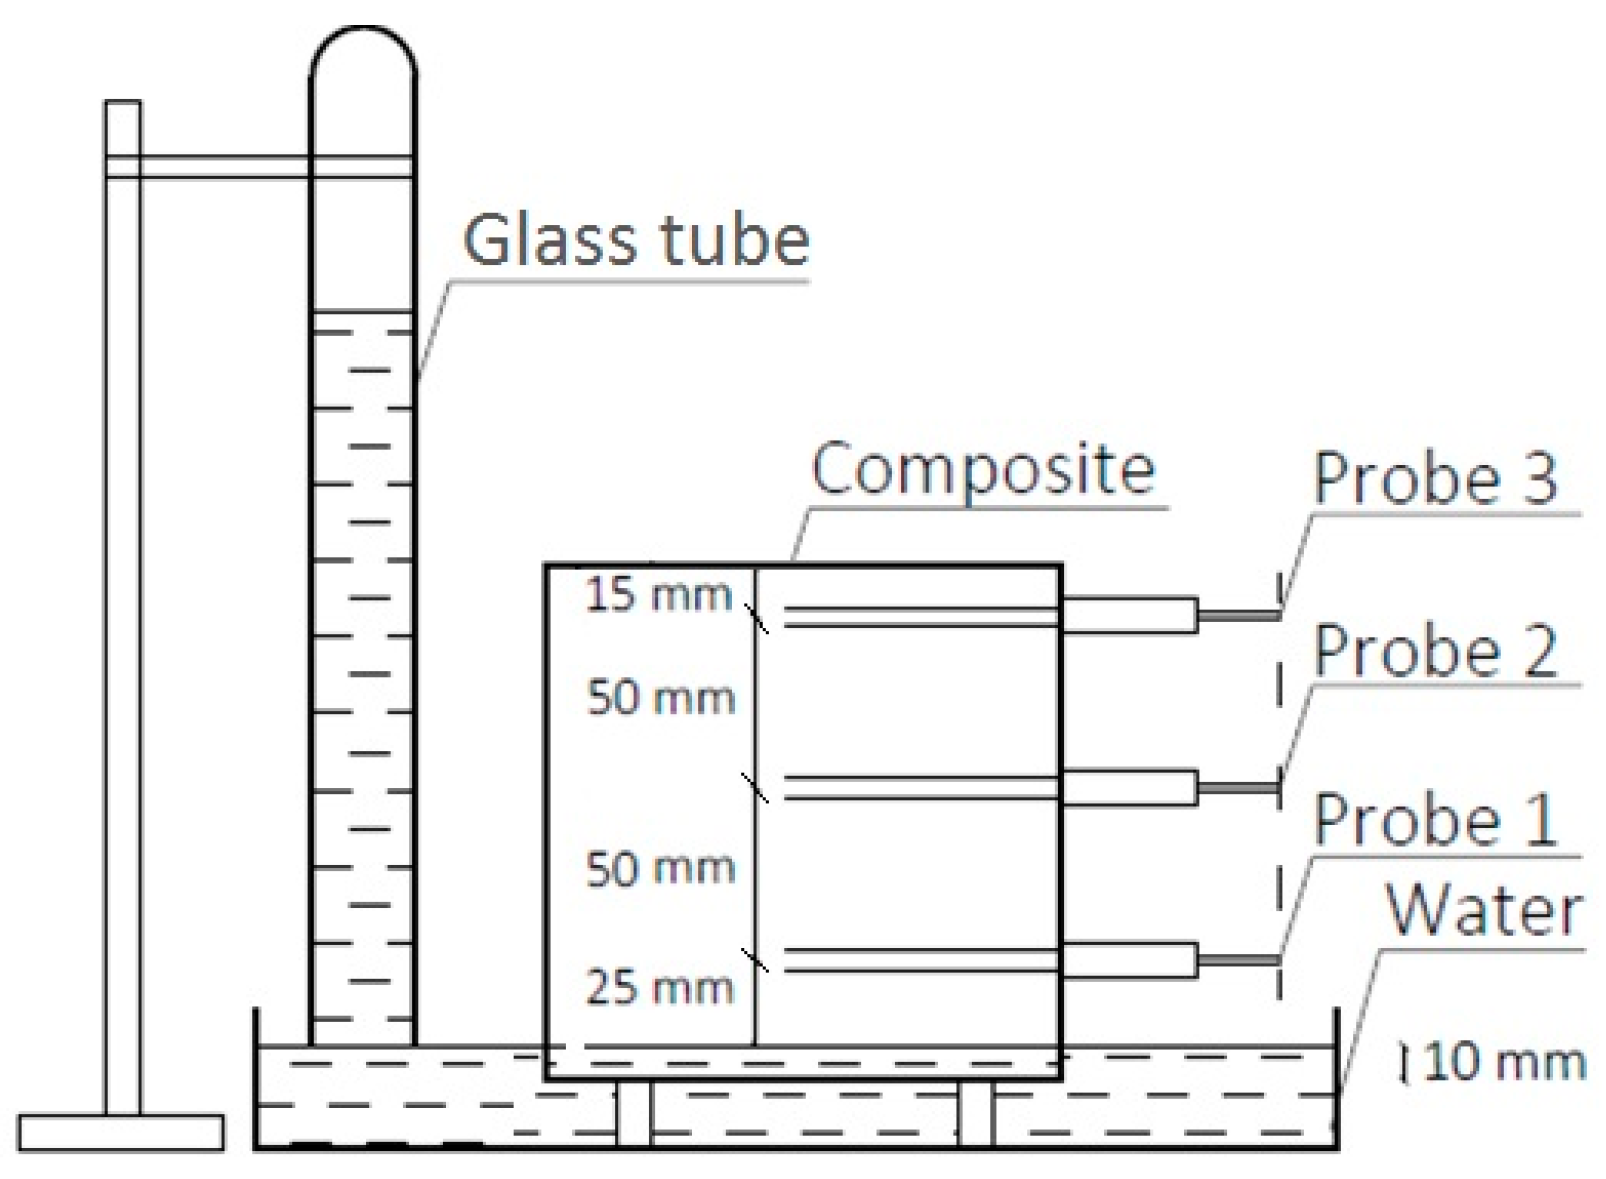
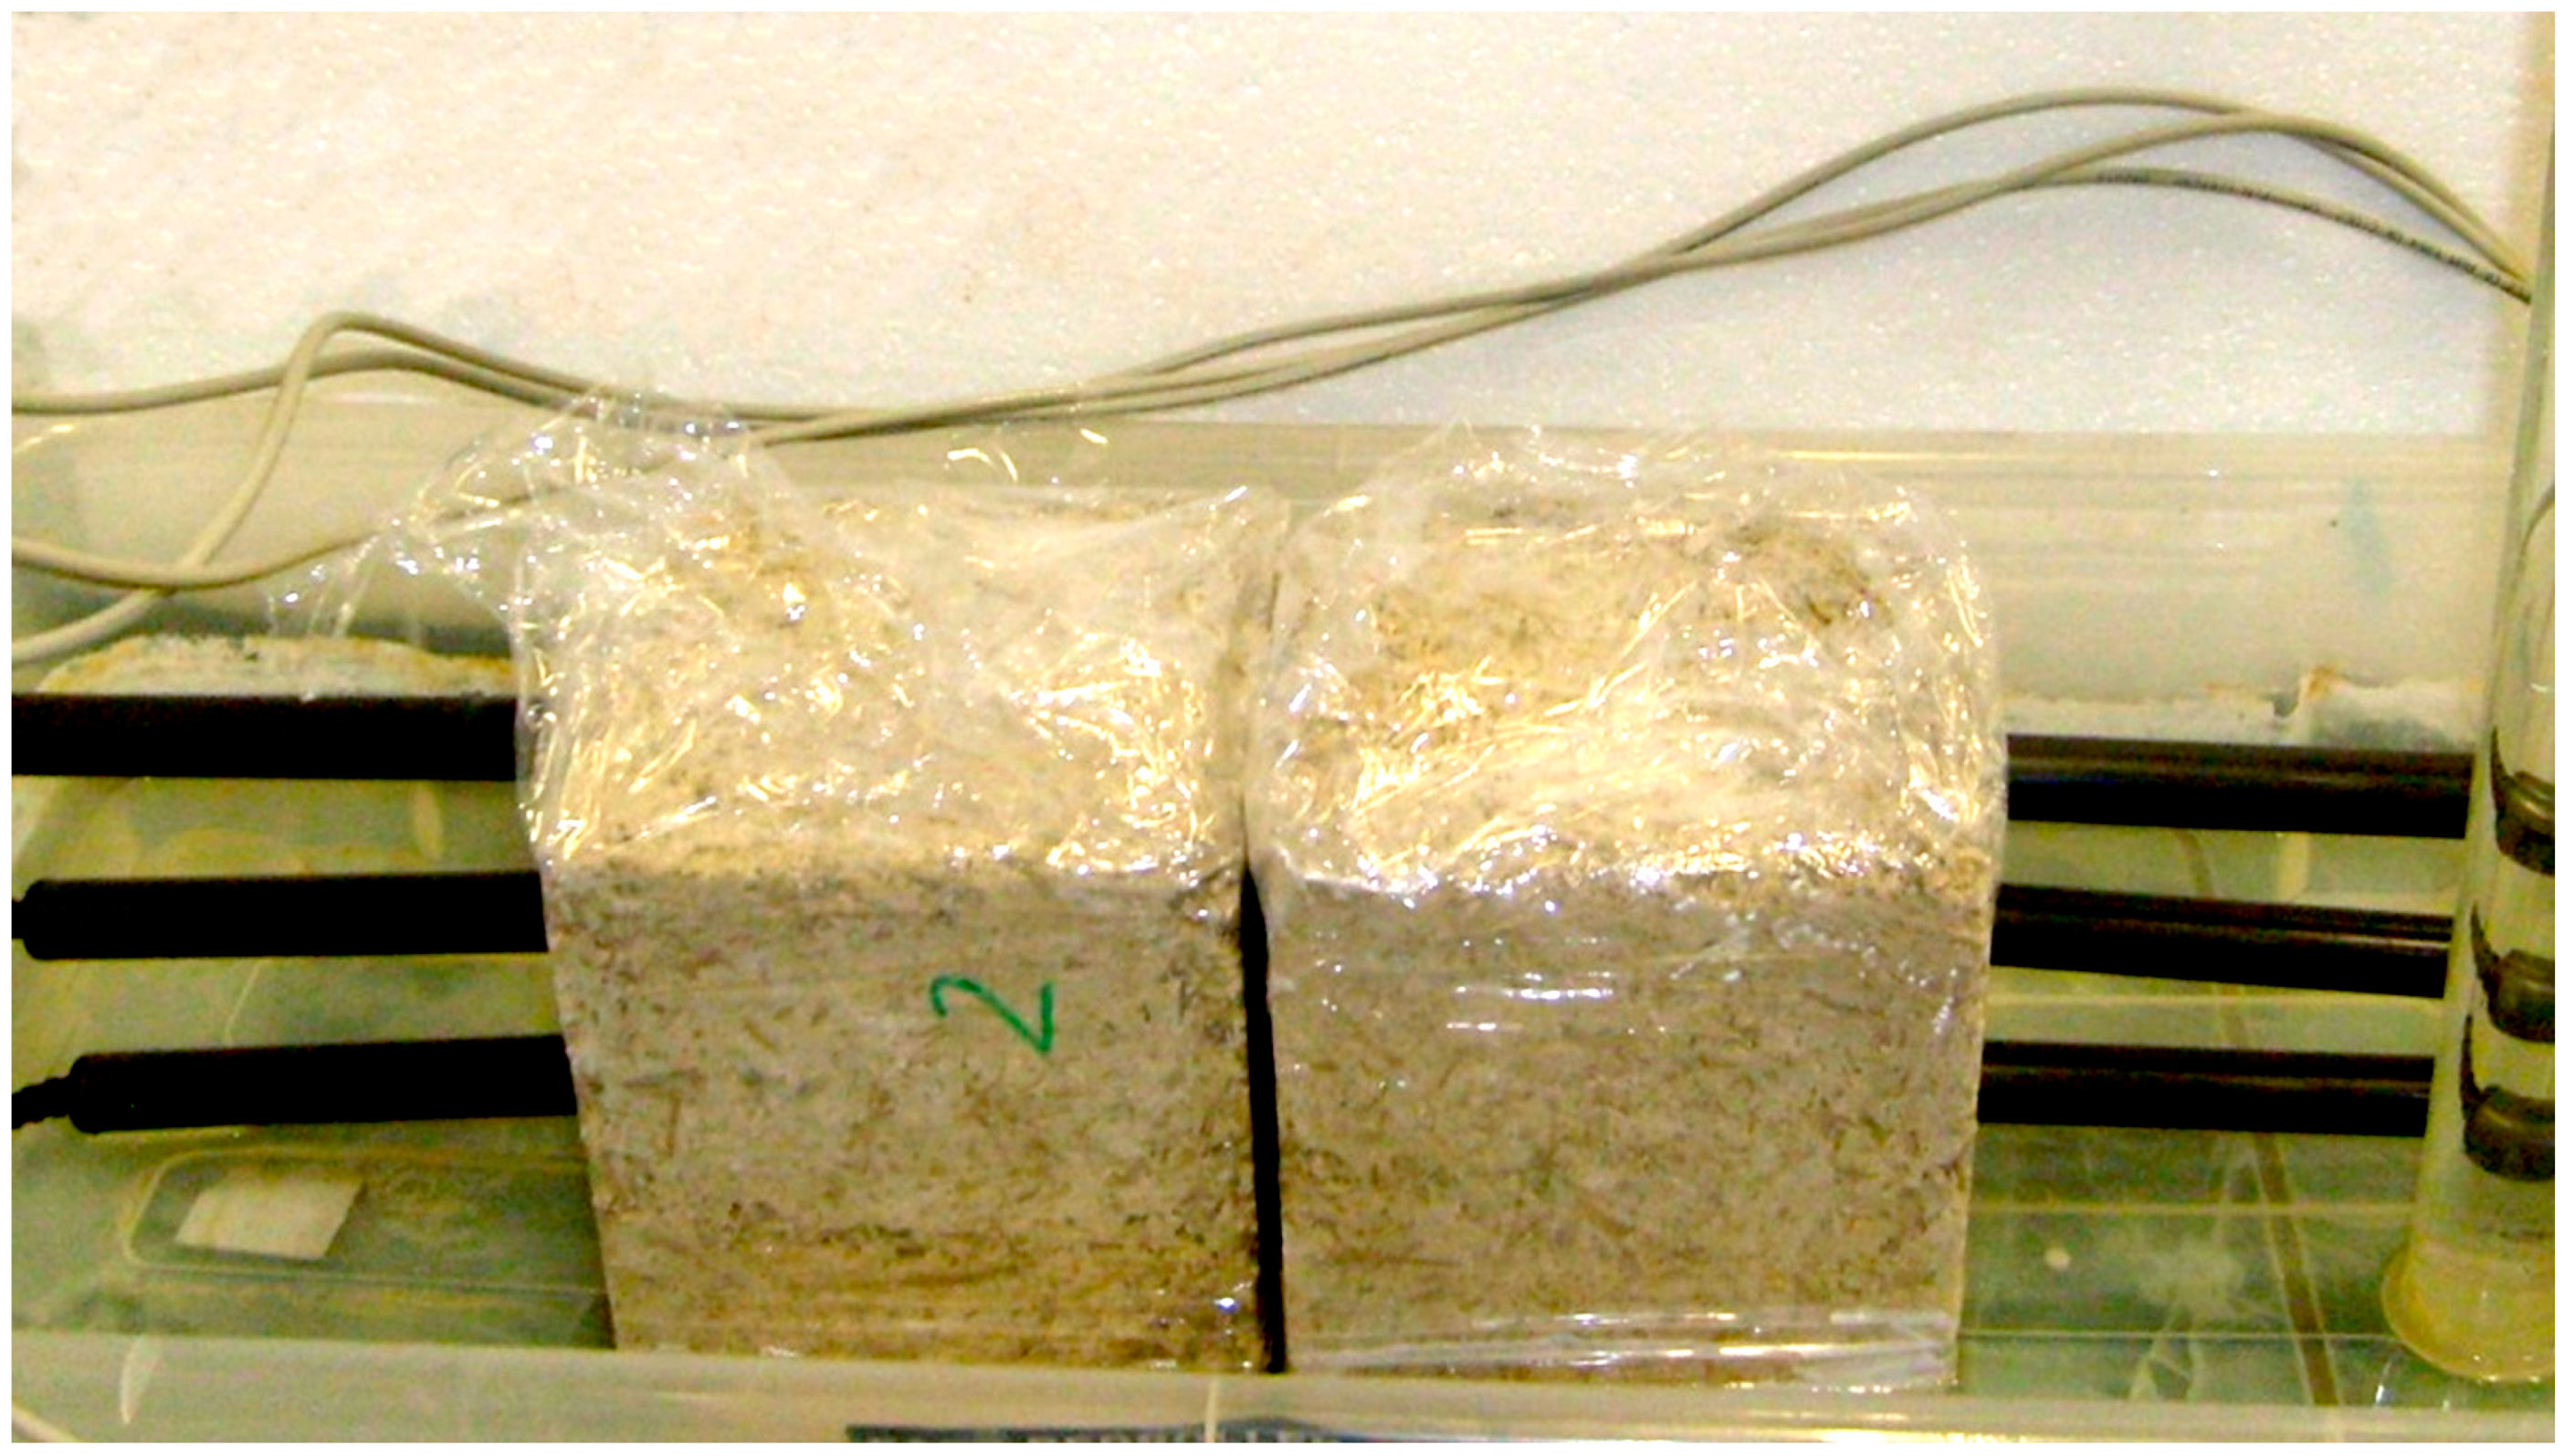
2.3.6. Capillary Uptake (TDR Method)
- Set of TDR field probes for moisture determination (FP/mts, EasyTest, Lublin, Poland),
- TDR multimeter with multiplexer (LOM, EasyTest, Lublin, Poland),
- PC for multimeter control and data processing,
- Software to control TDR multimeter and post-process the obtained data,
- Dryer (Memmert VO-500),
- Water container,
- Samples of the examined composite with the dimensions of 150 × 150 × 150 mm.
3. Results and Discussion
3.1. Apparent Density and Porosity
3.2. Flexural and Compressive Strength
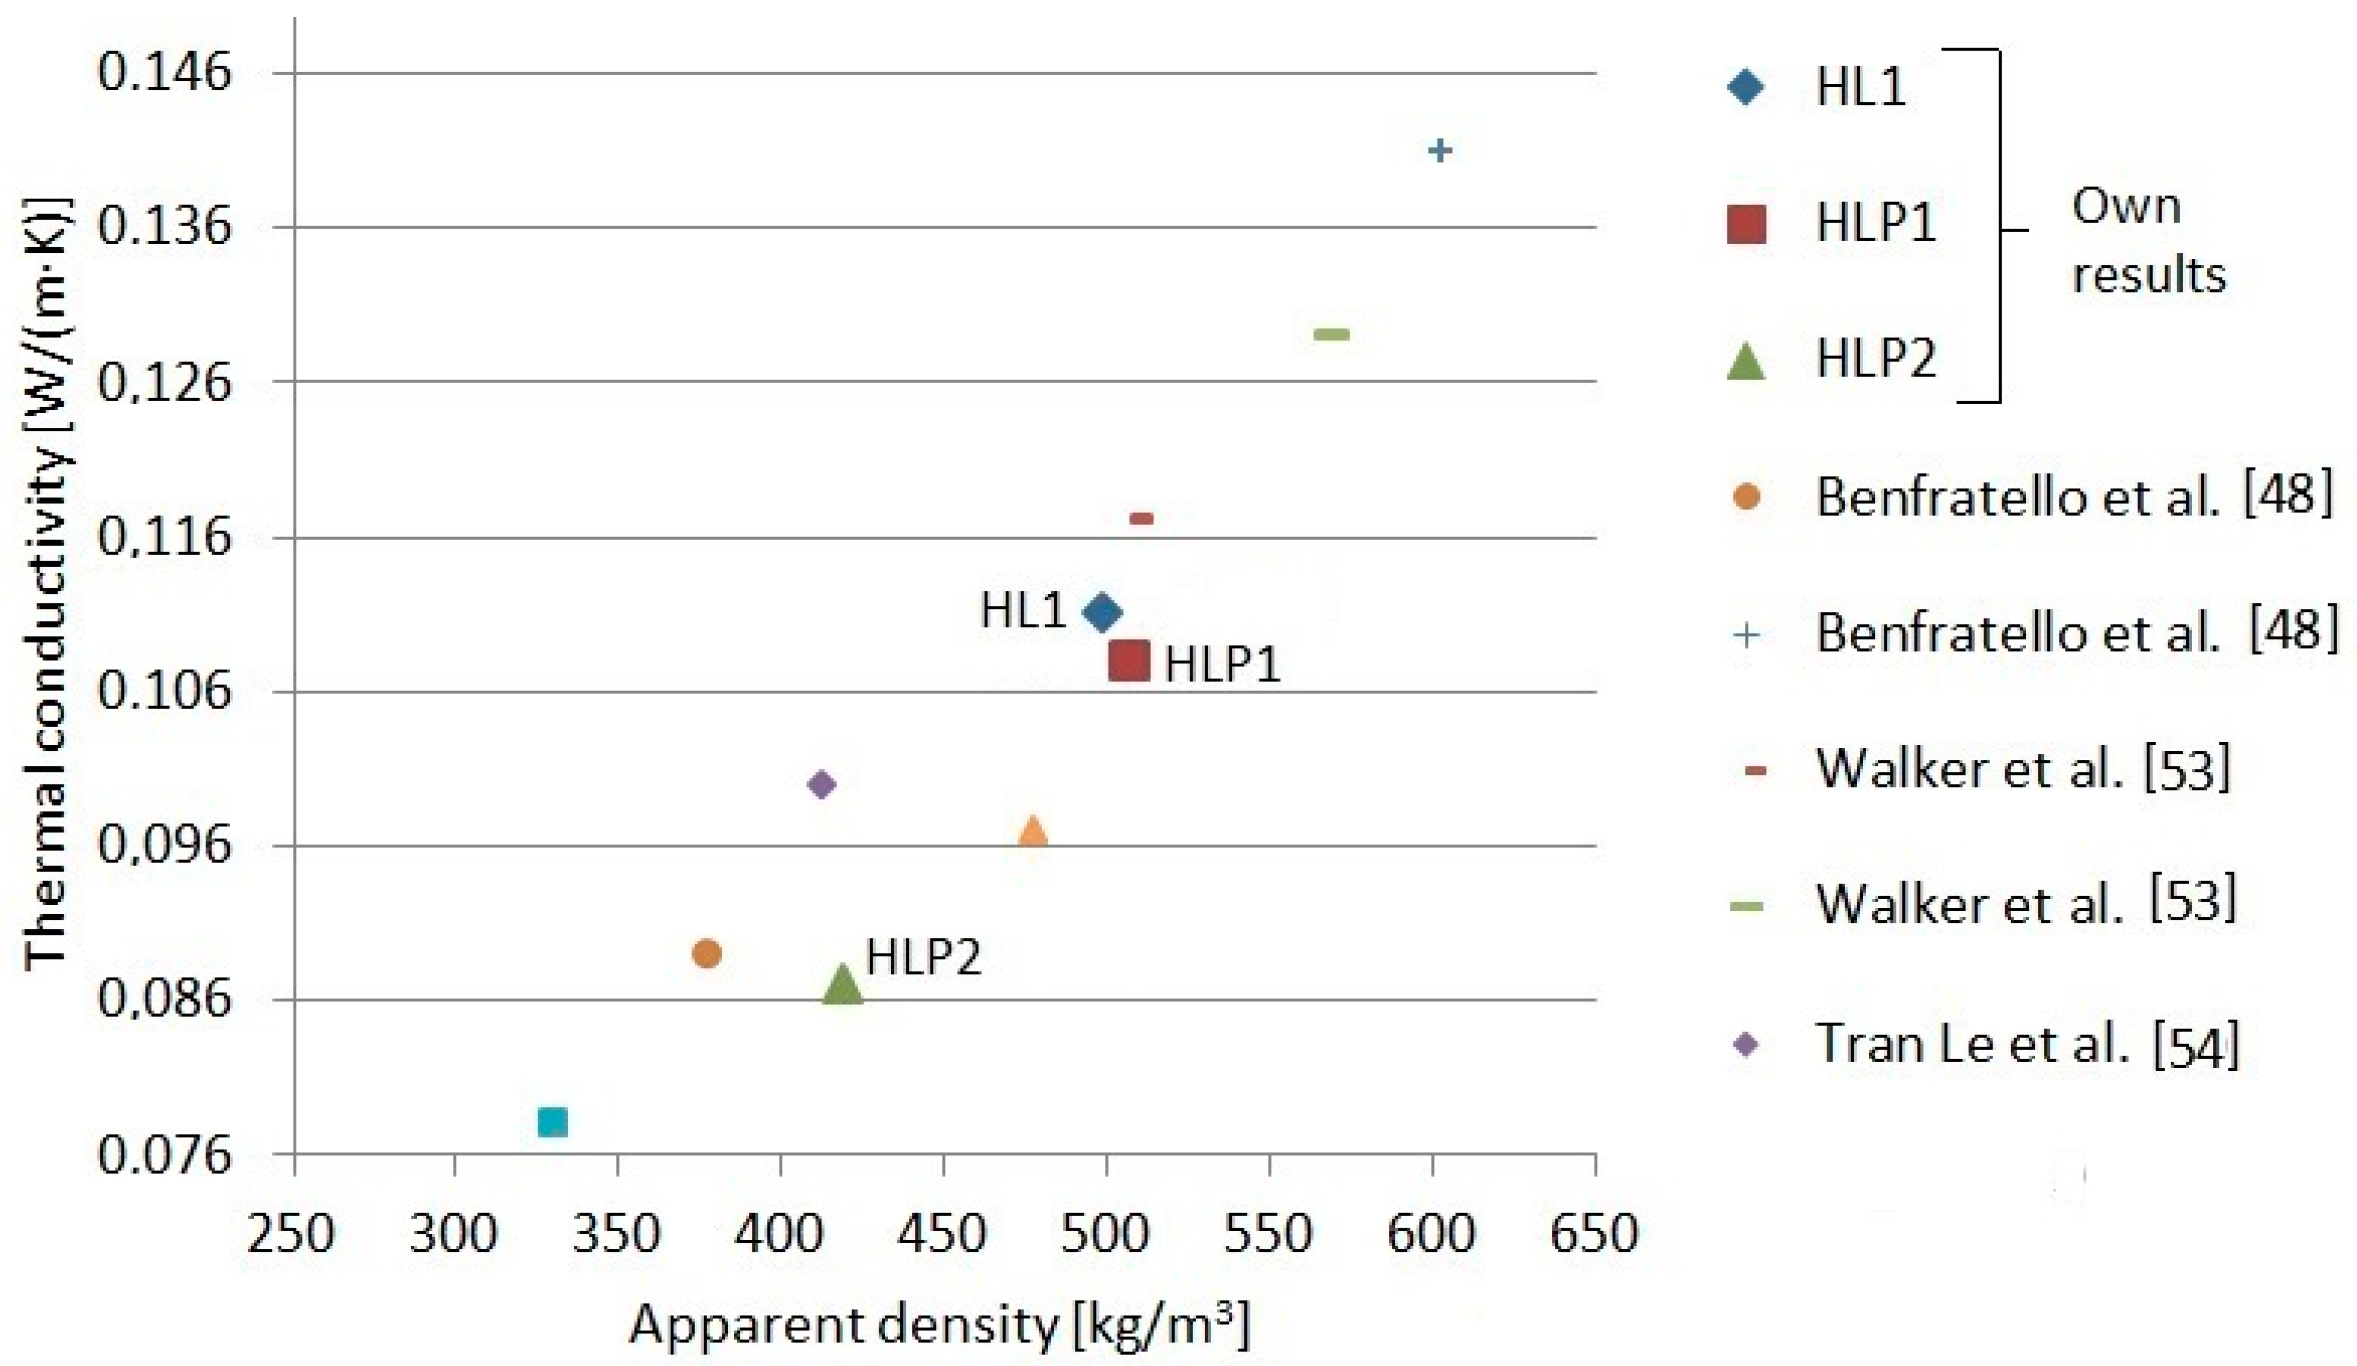
3.3. Thermal Conductivity
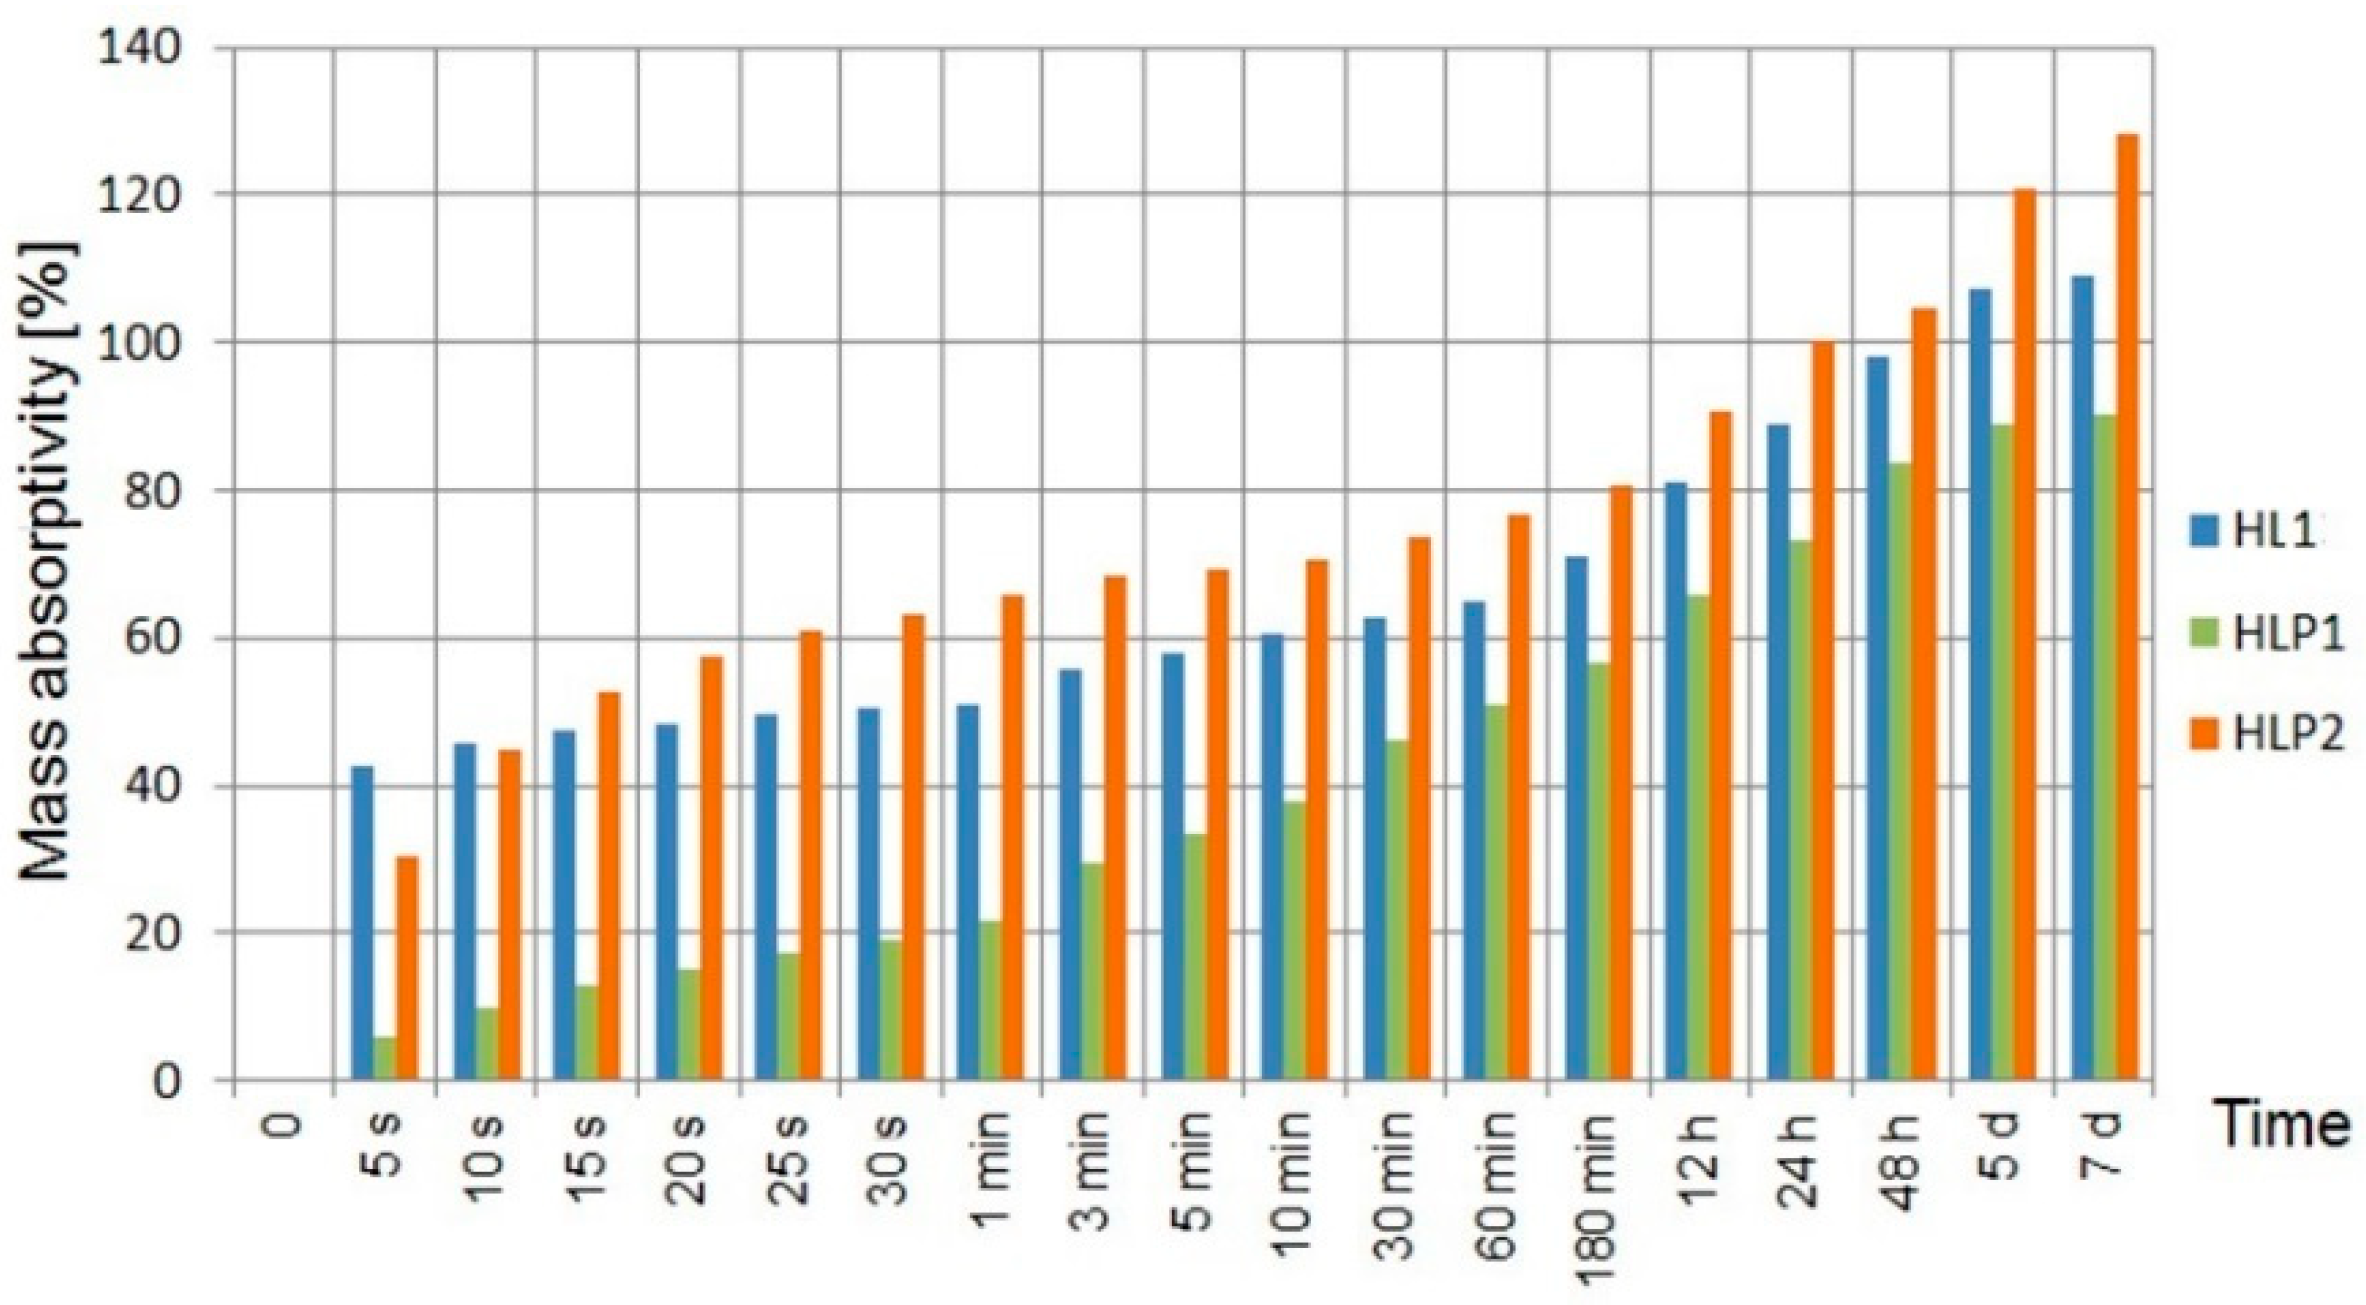
3.4. Mass Absorptivity
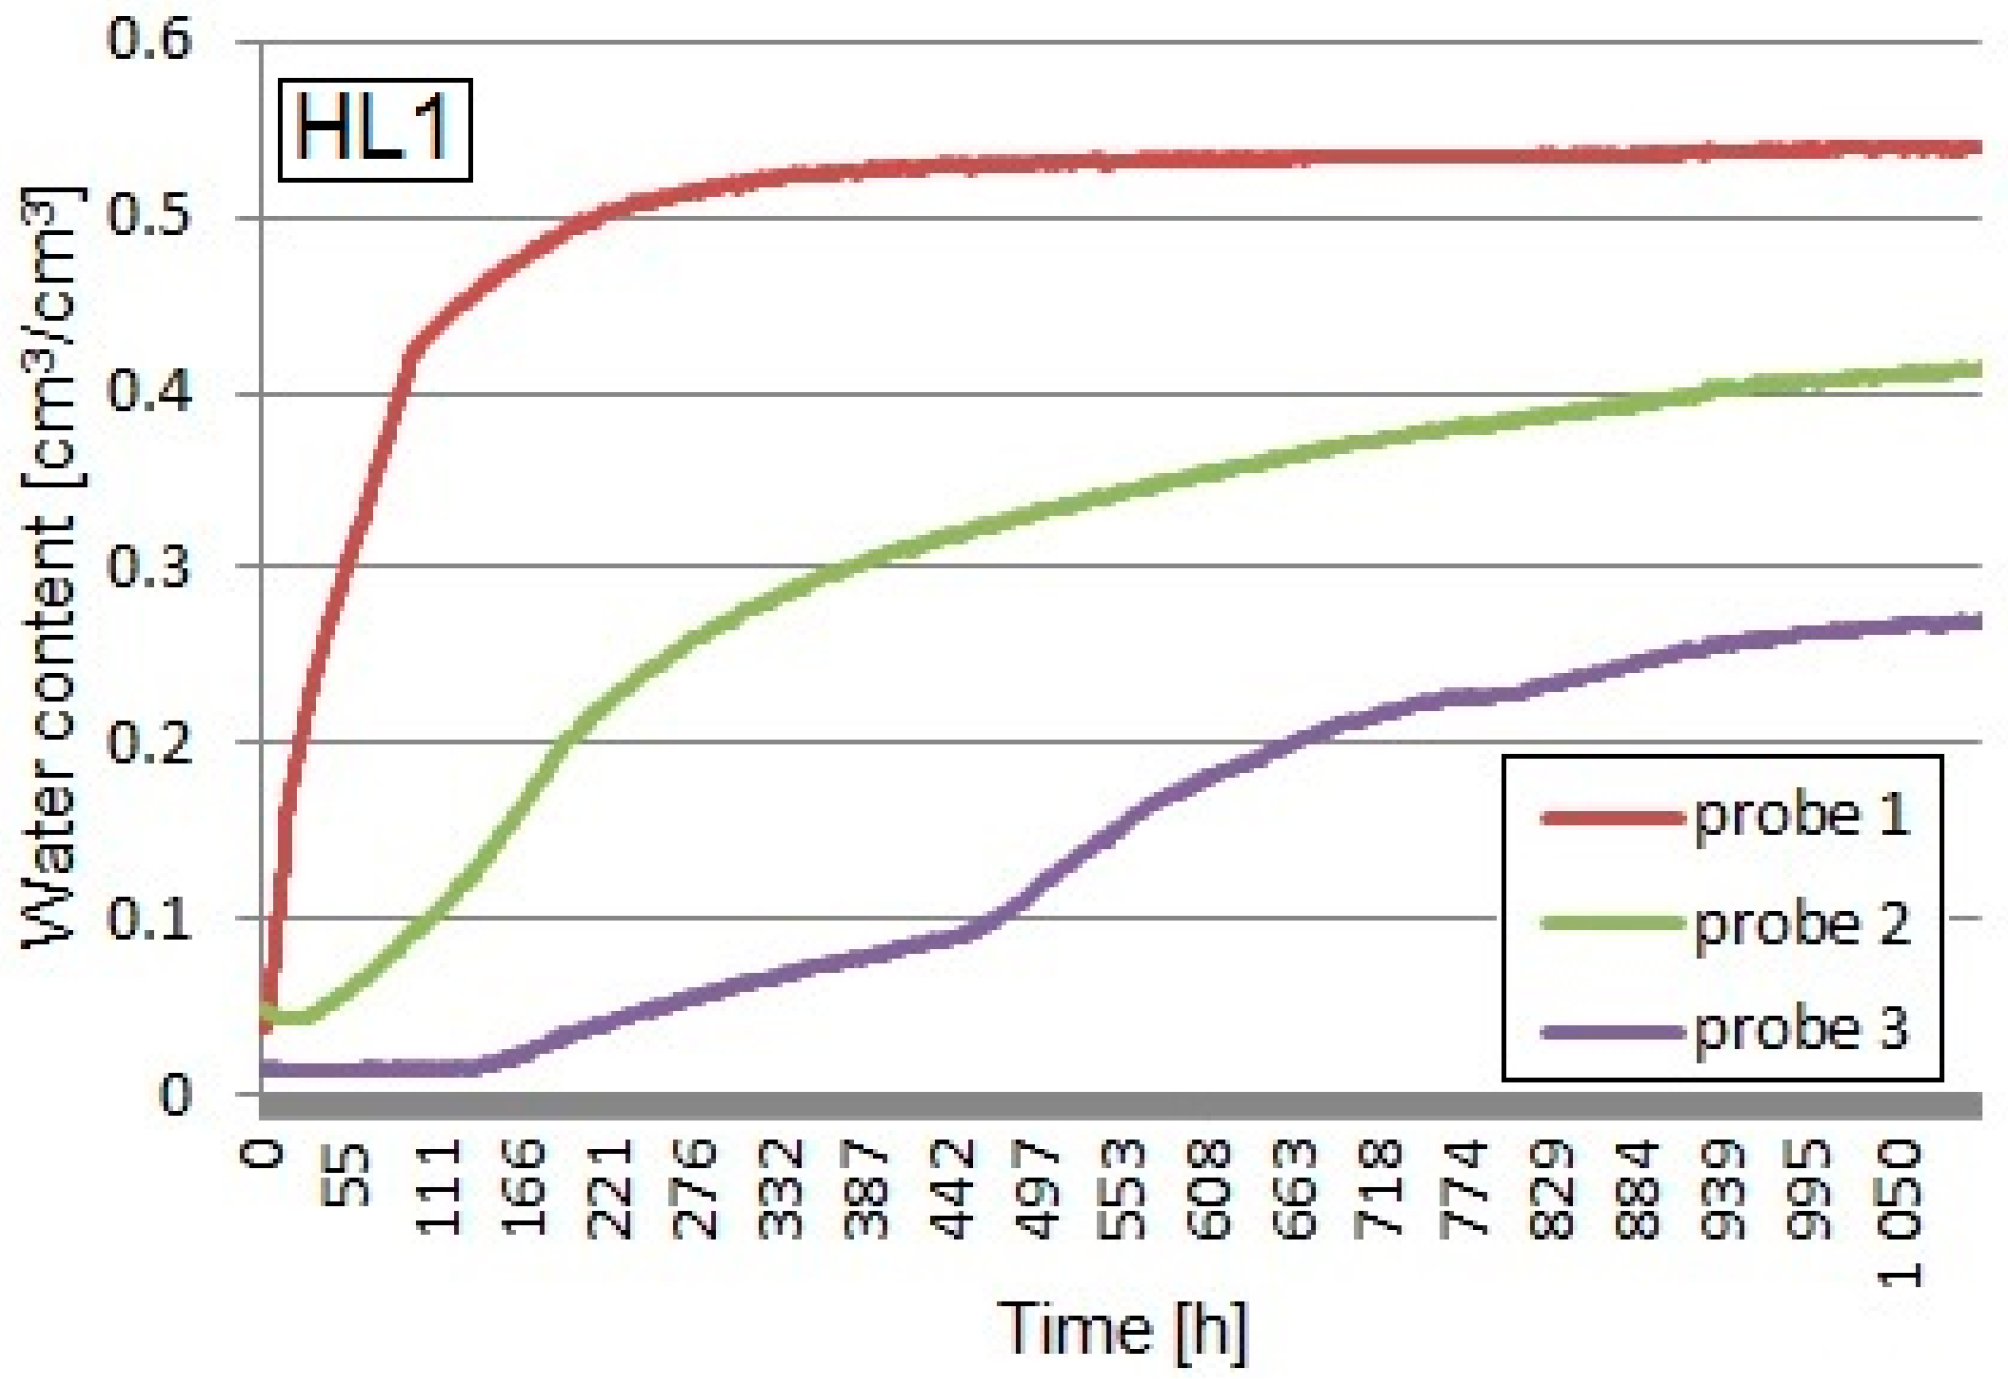
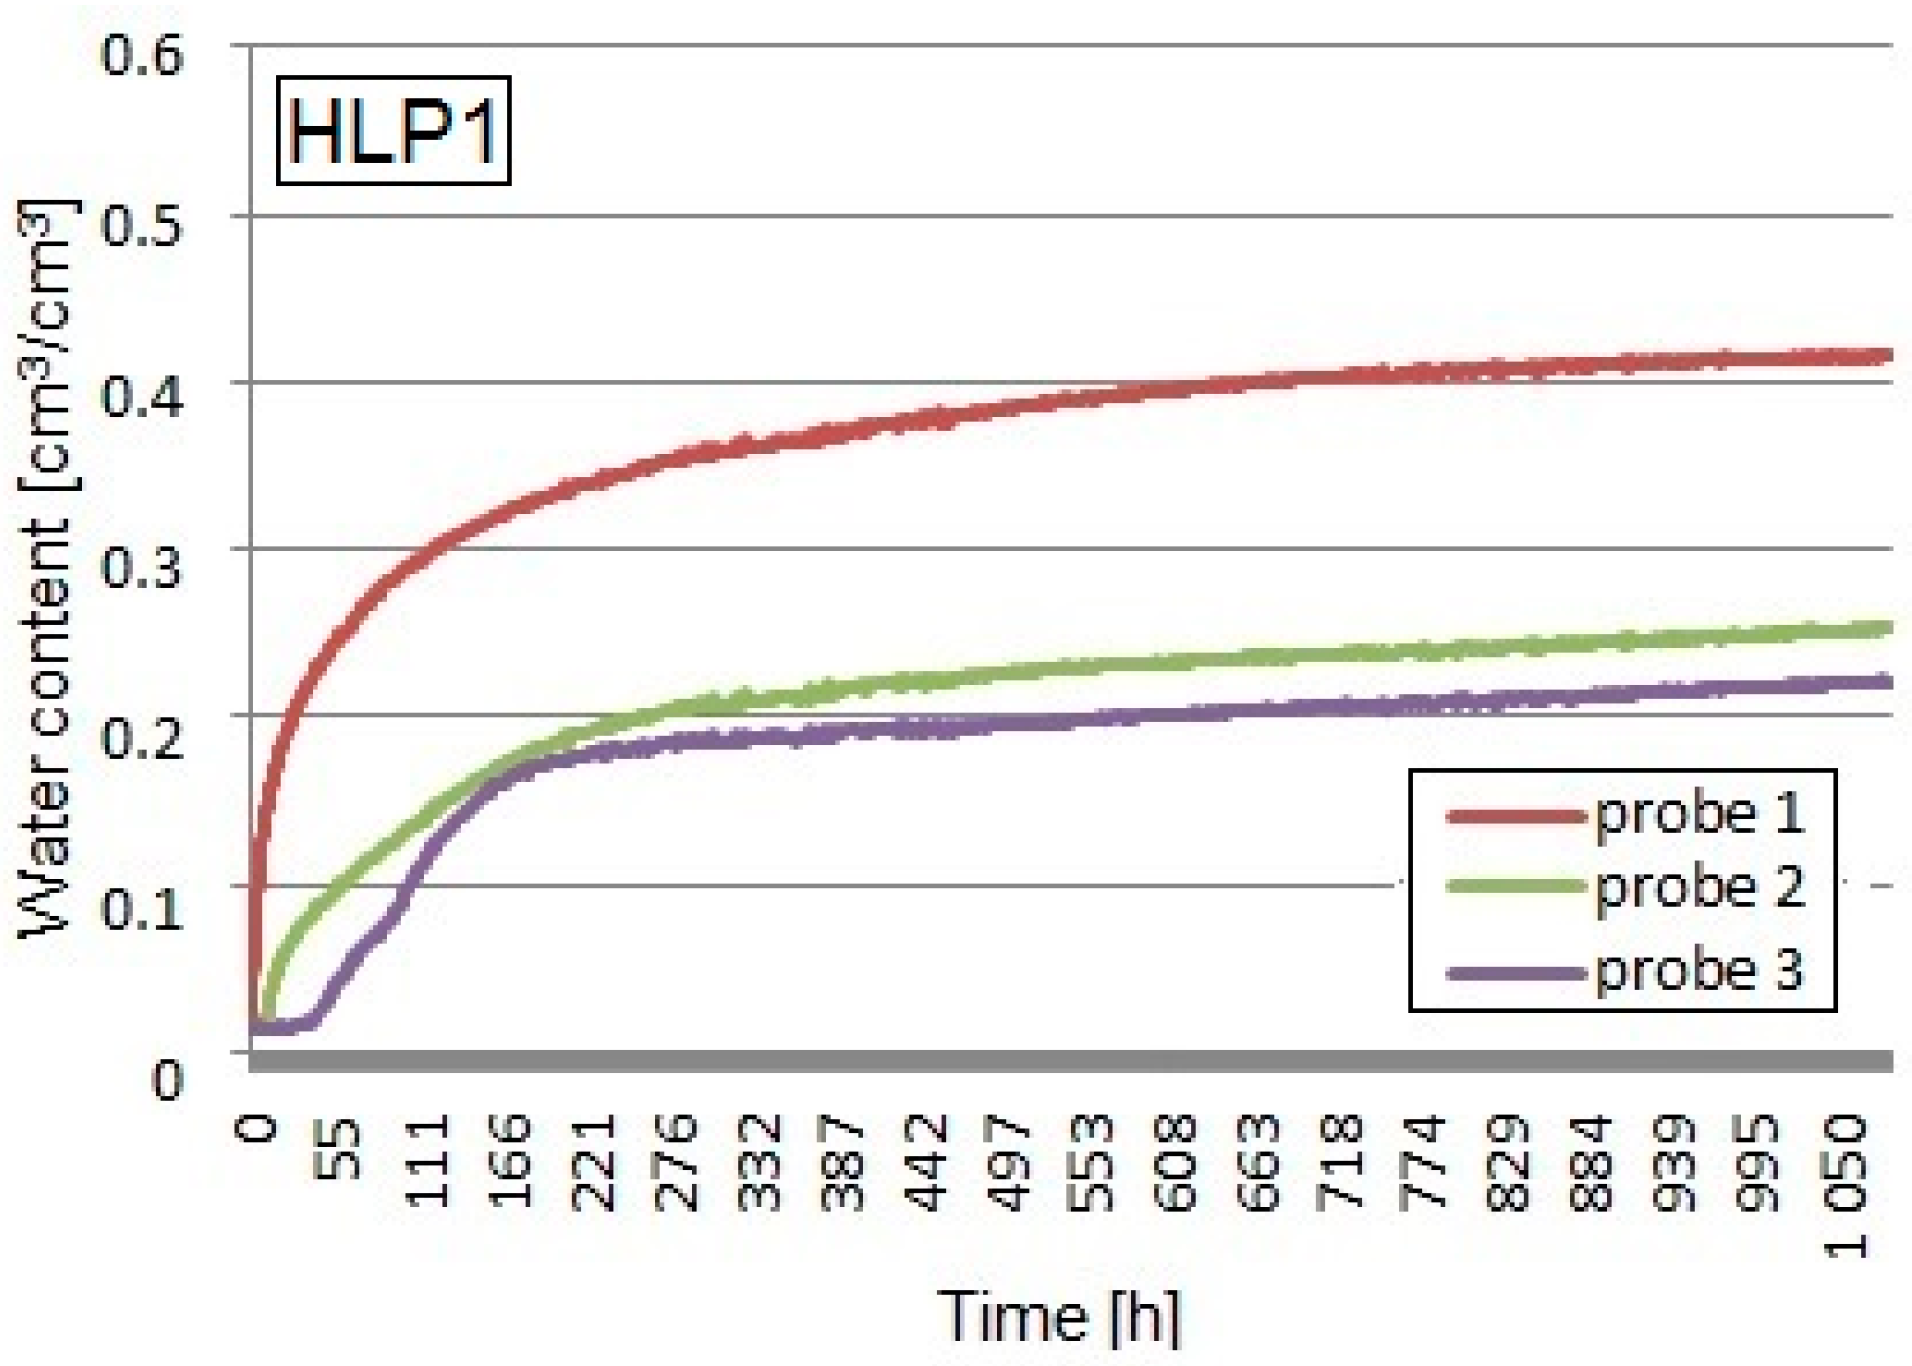
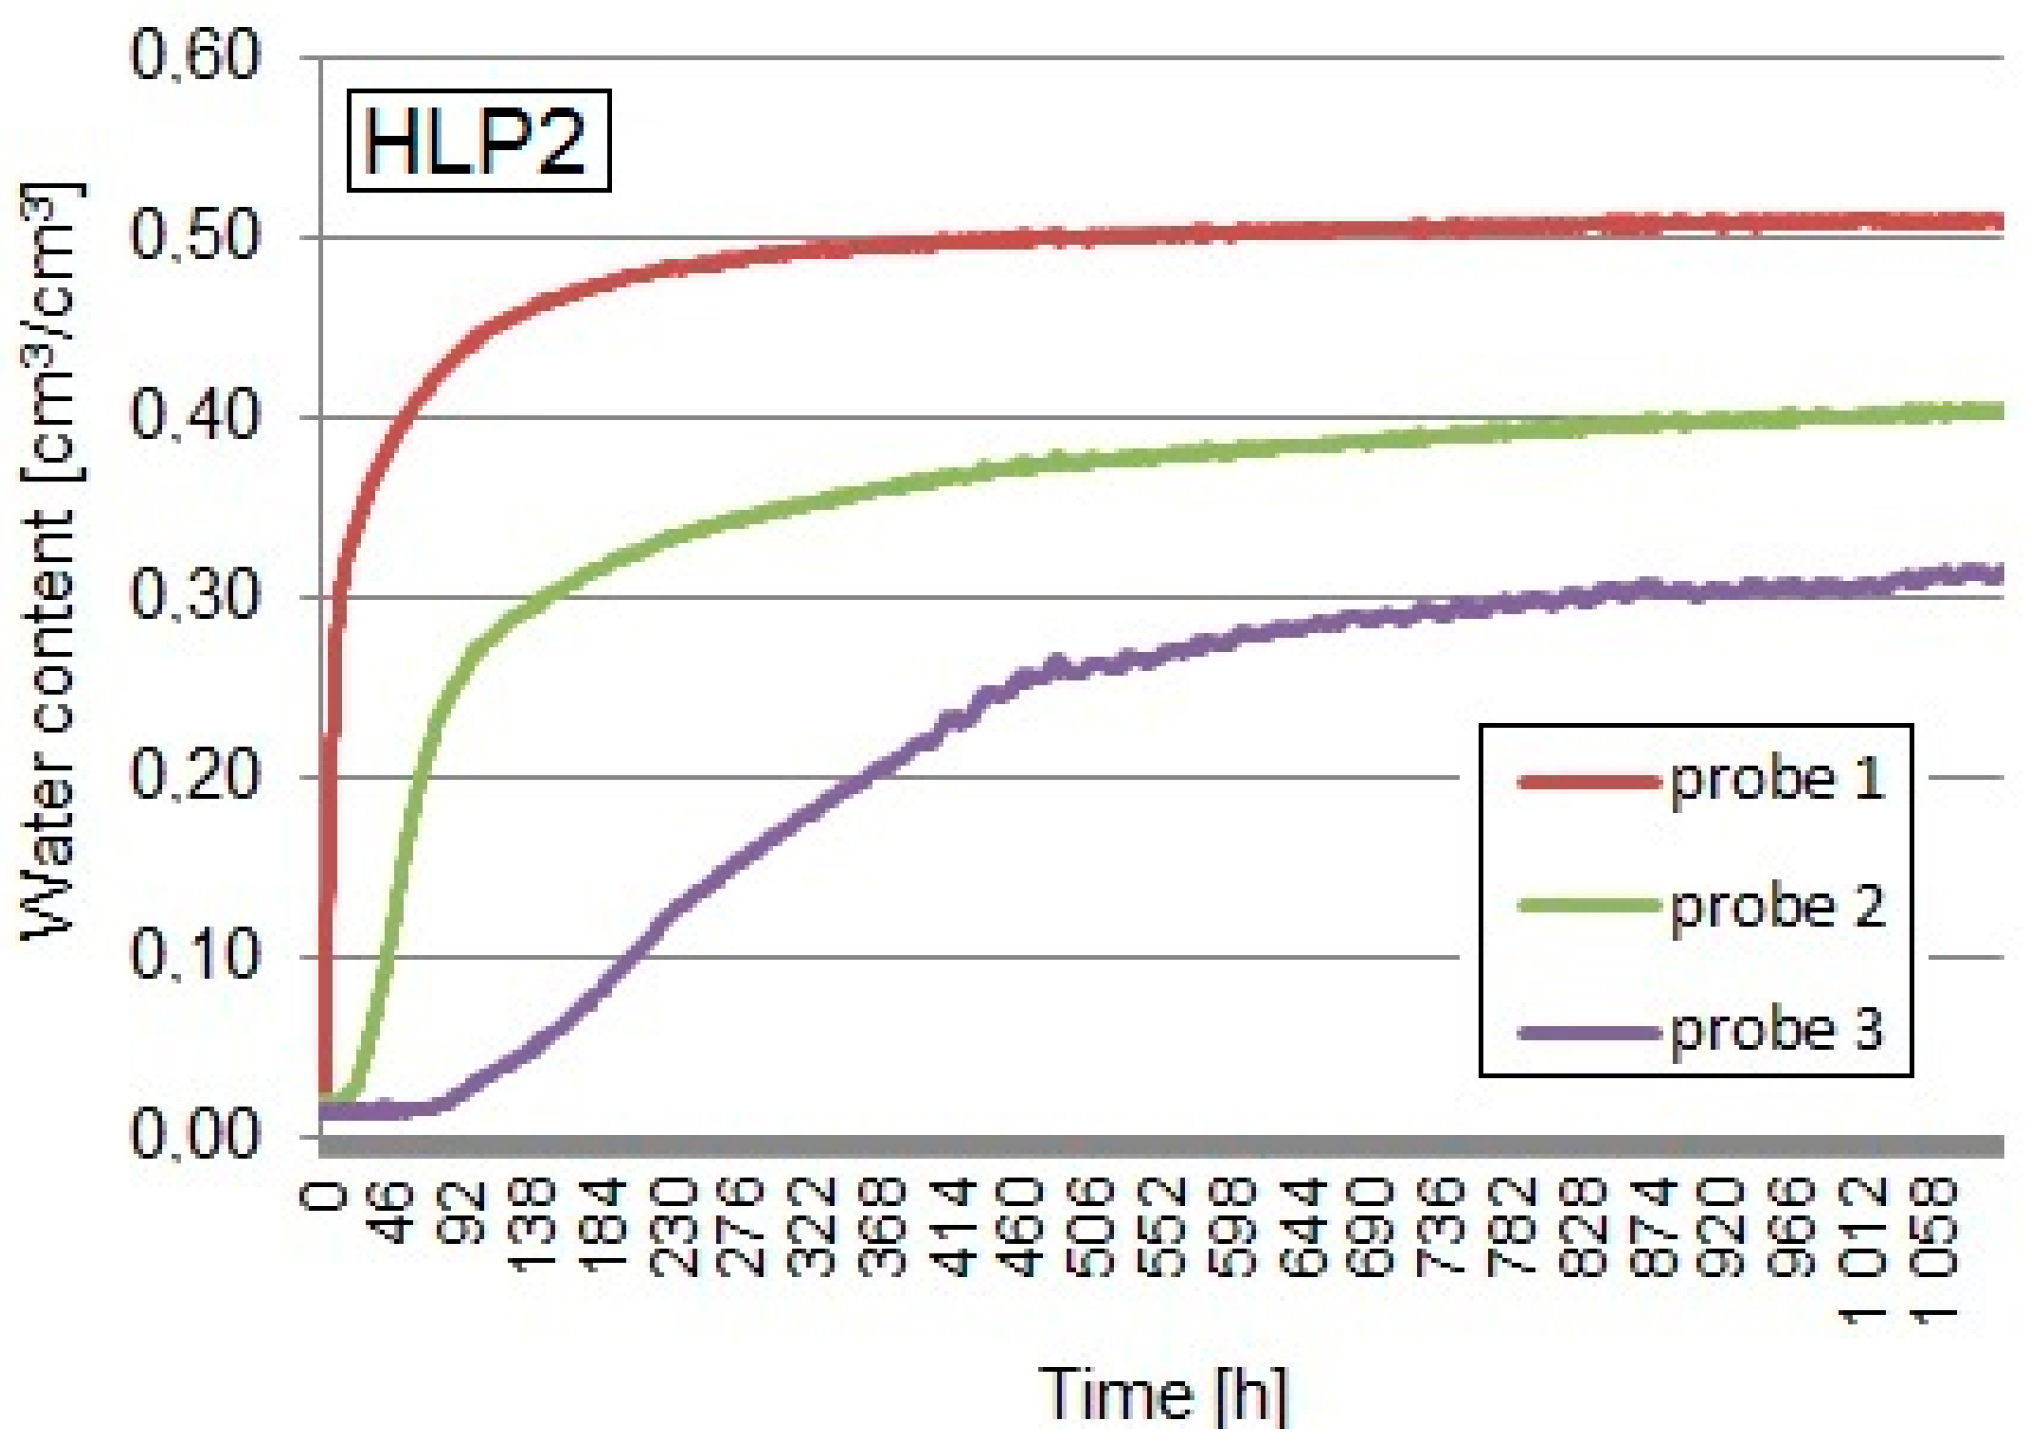
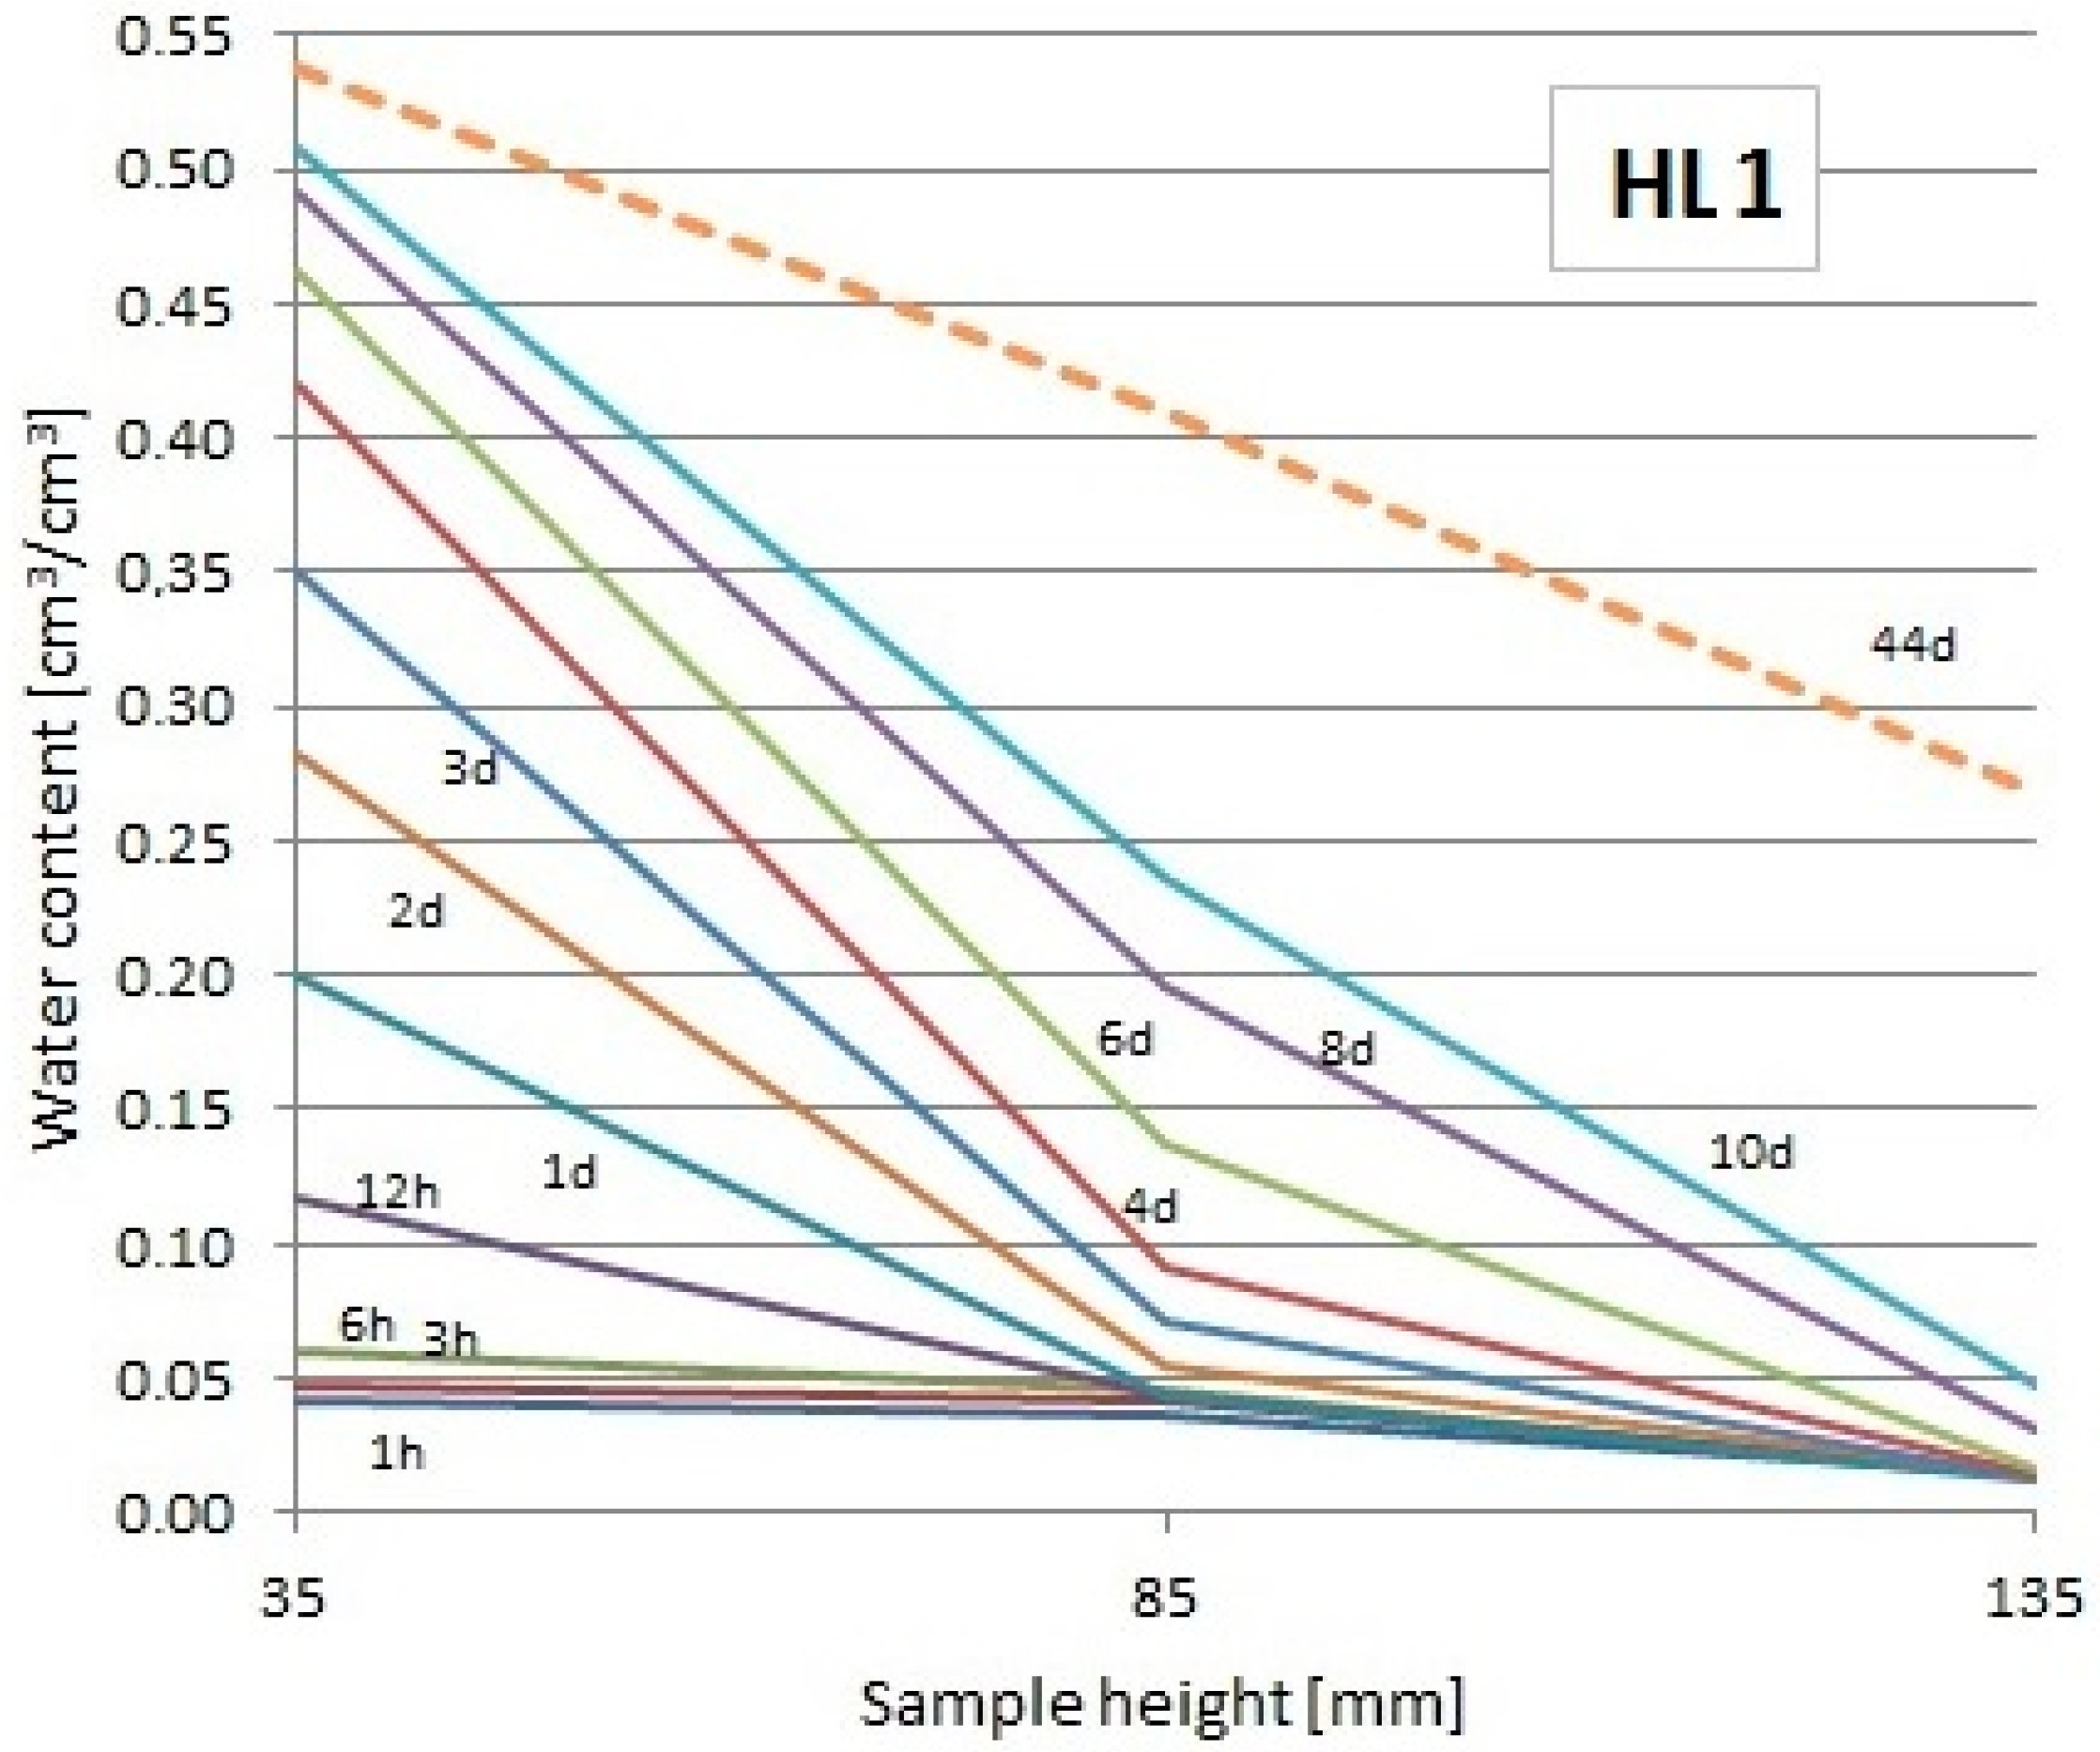
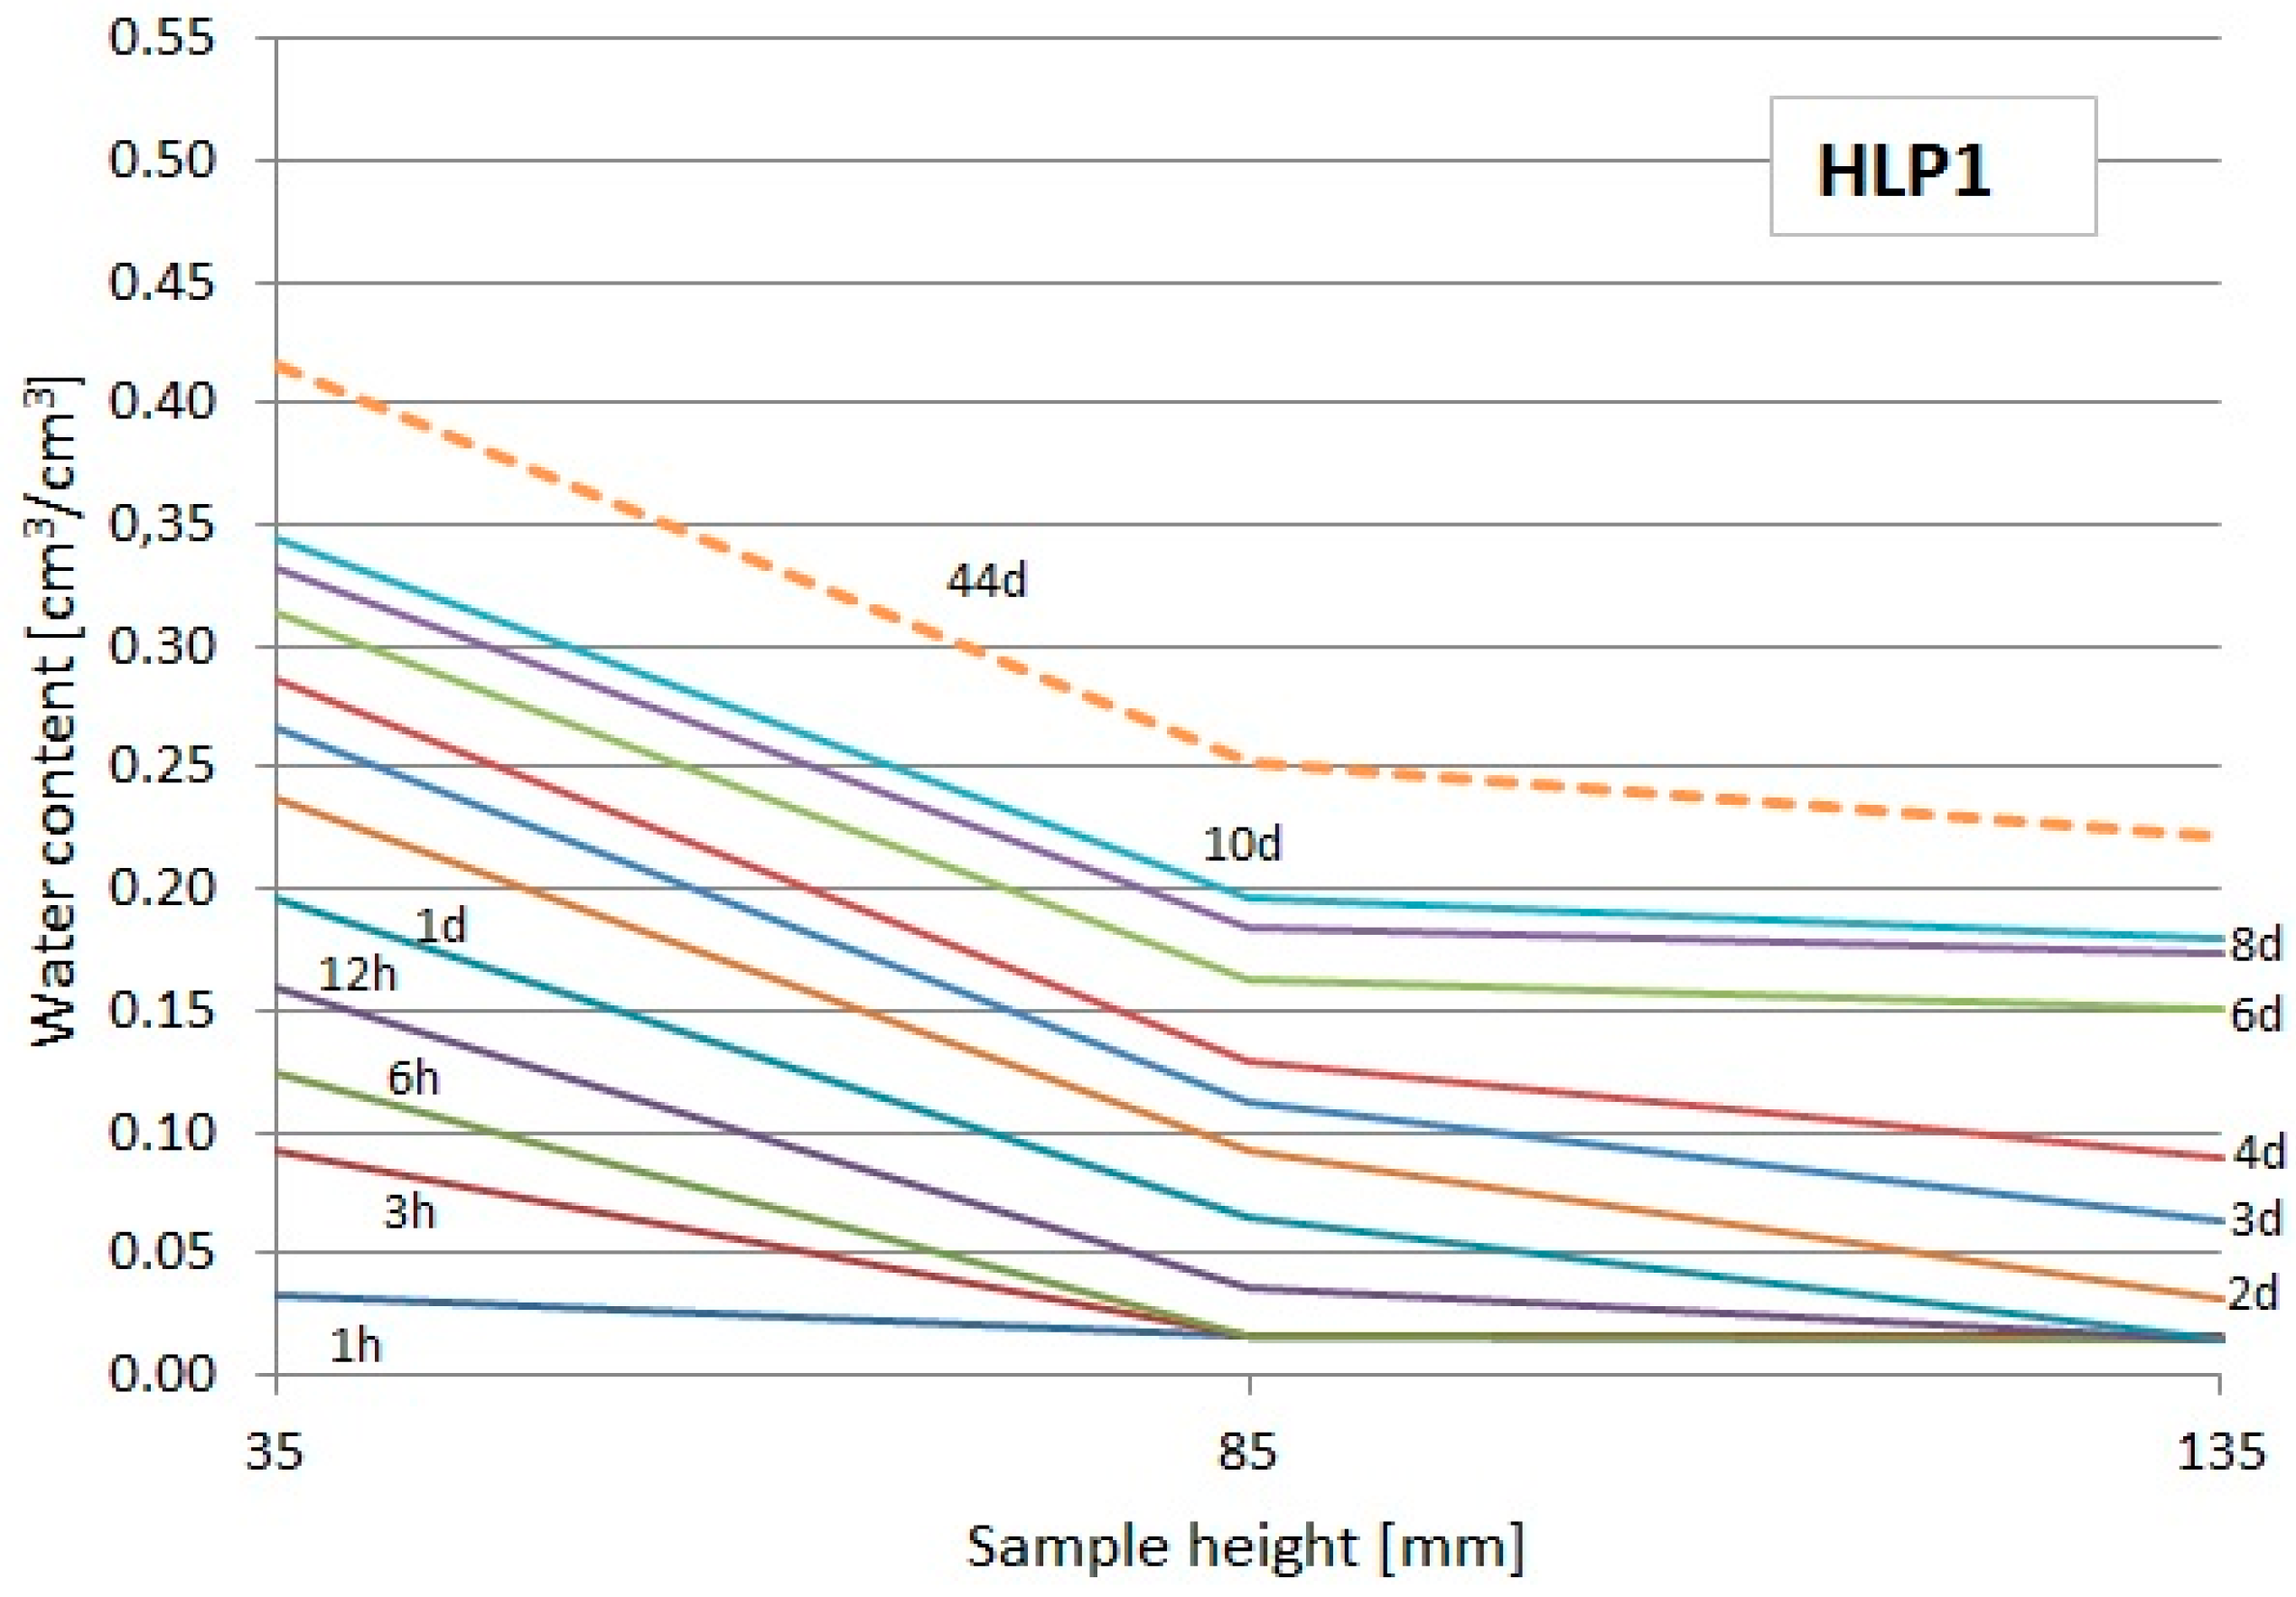
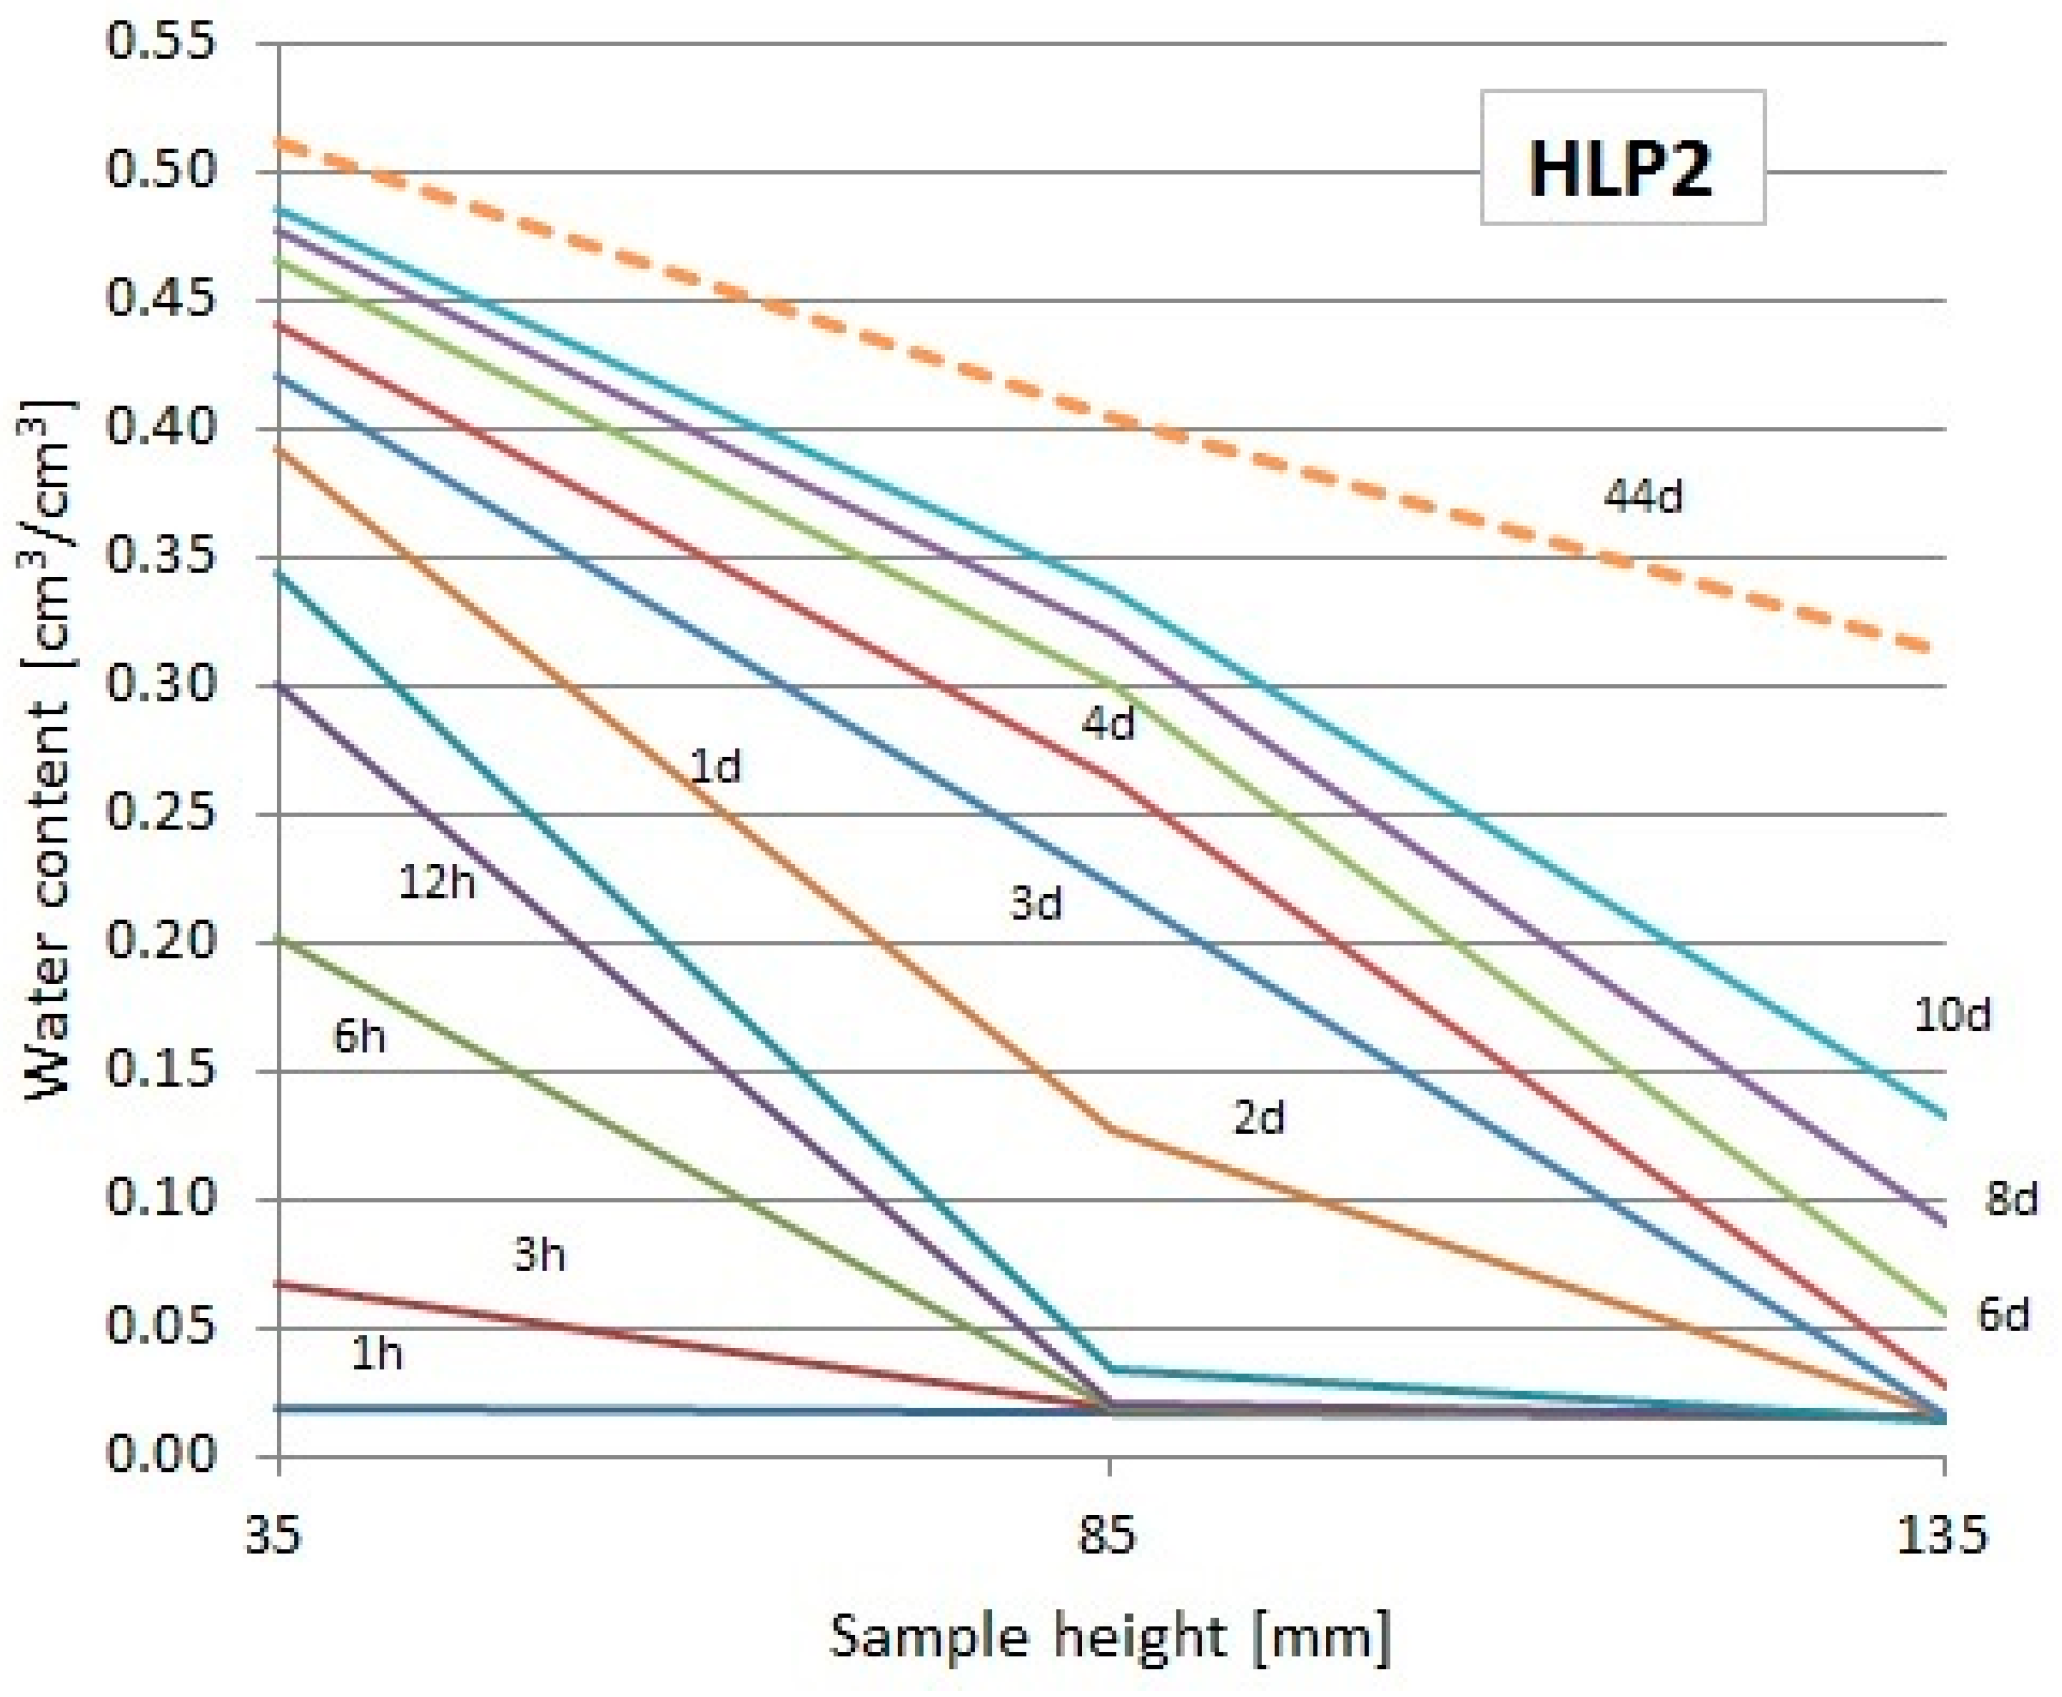
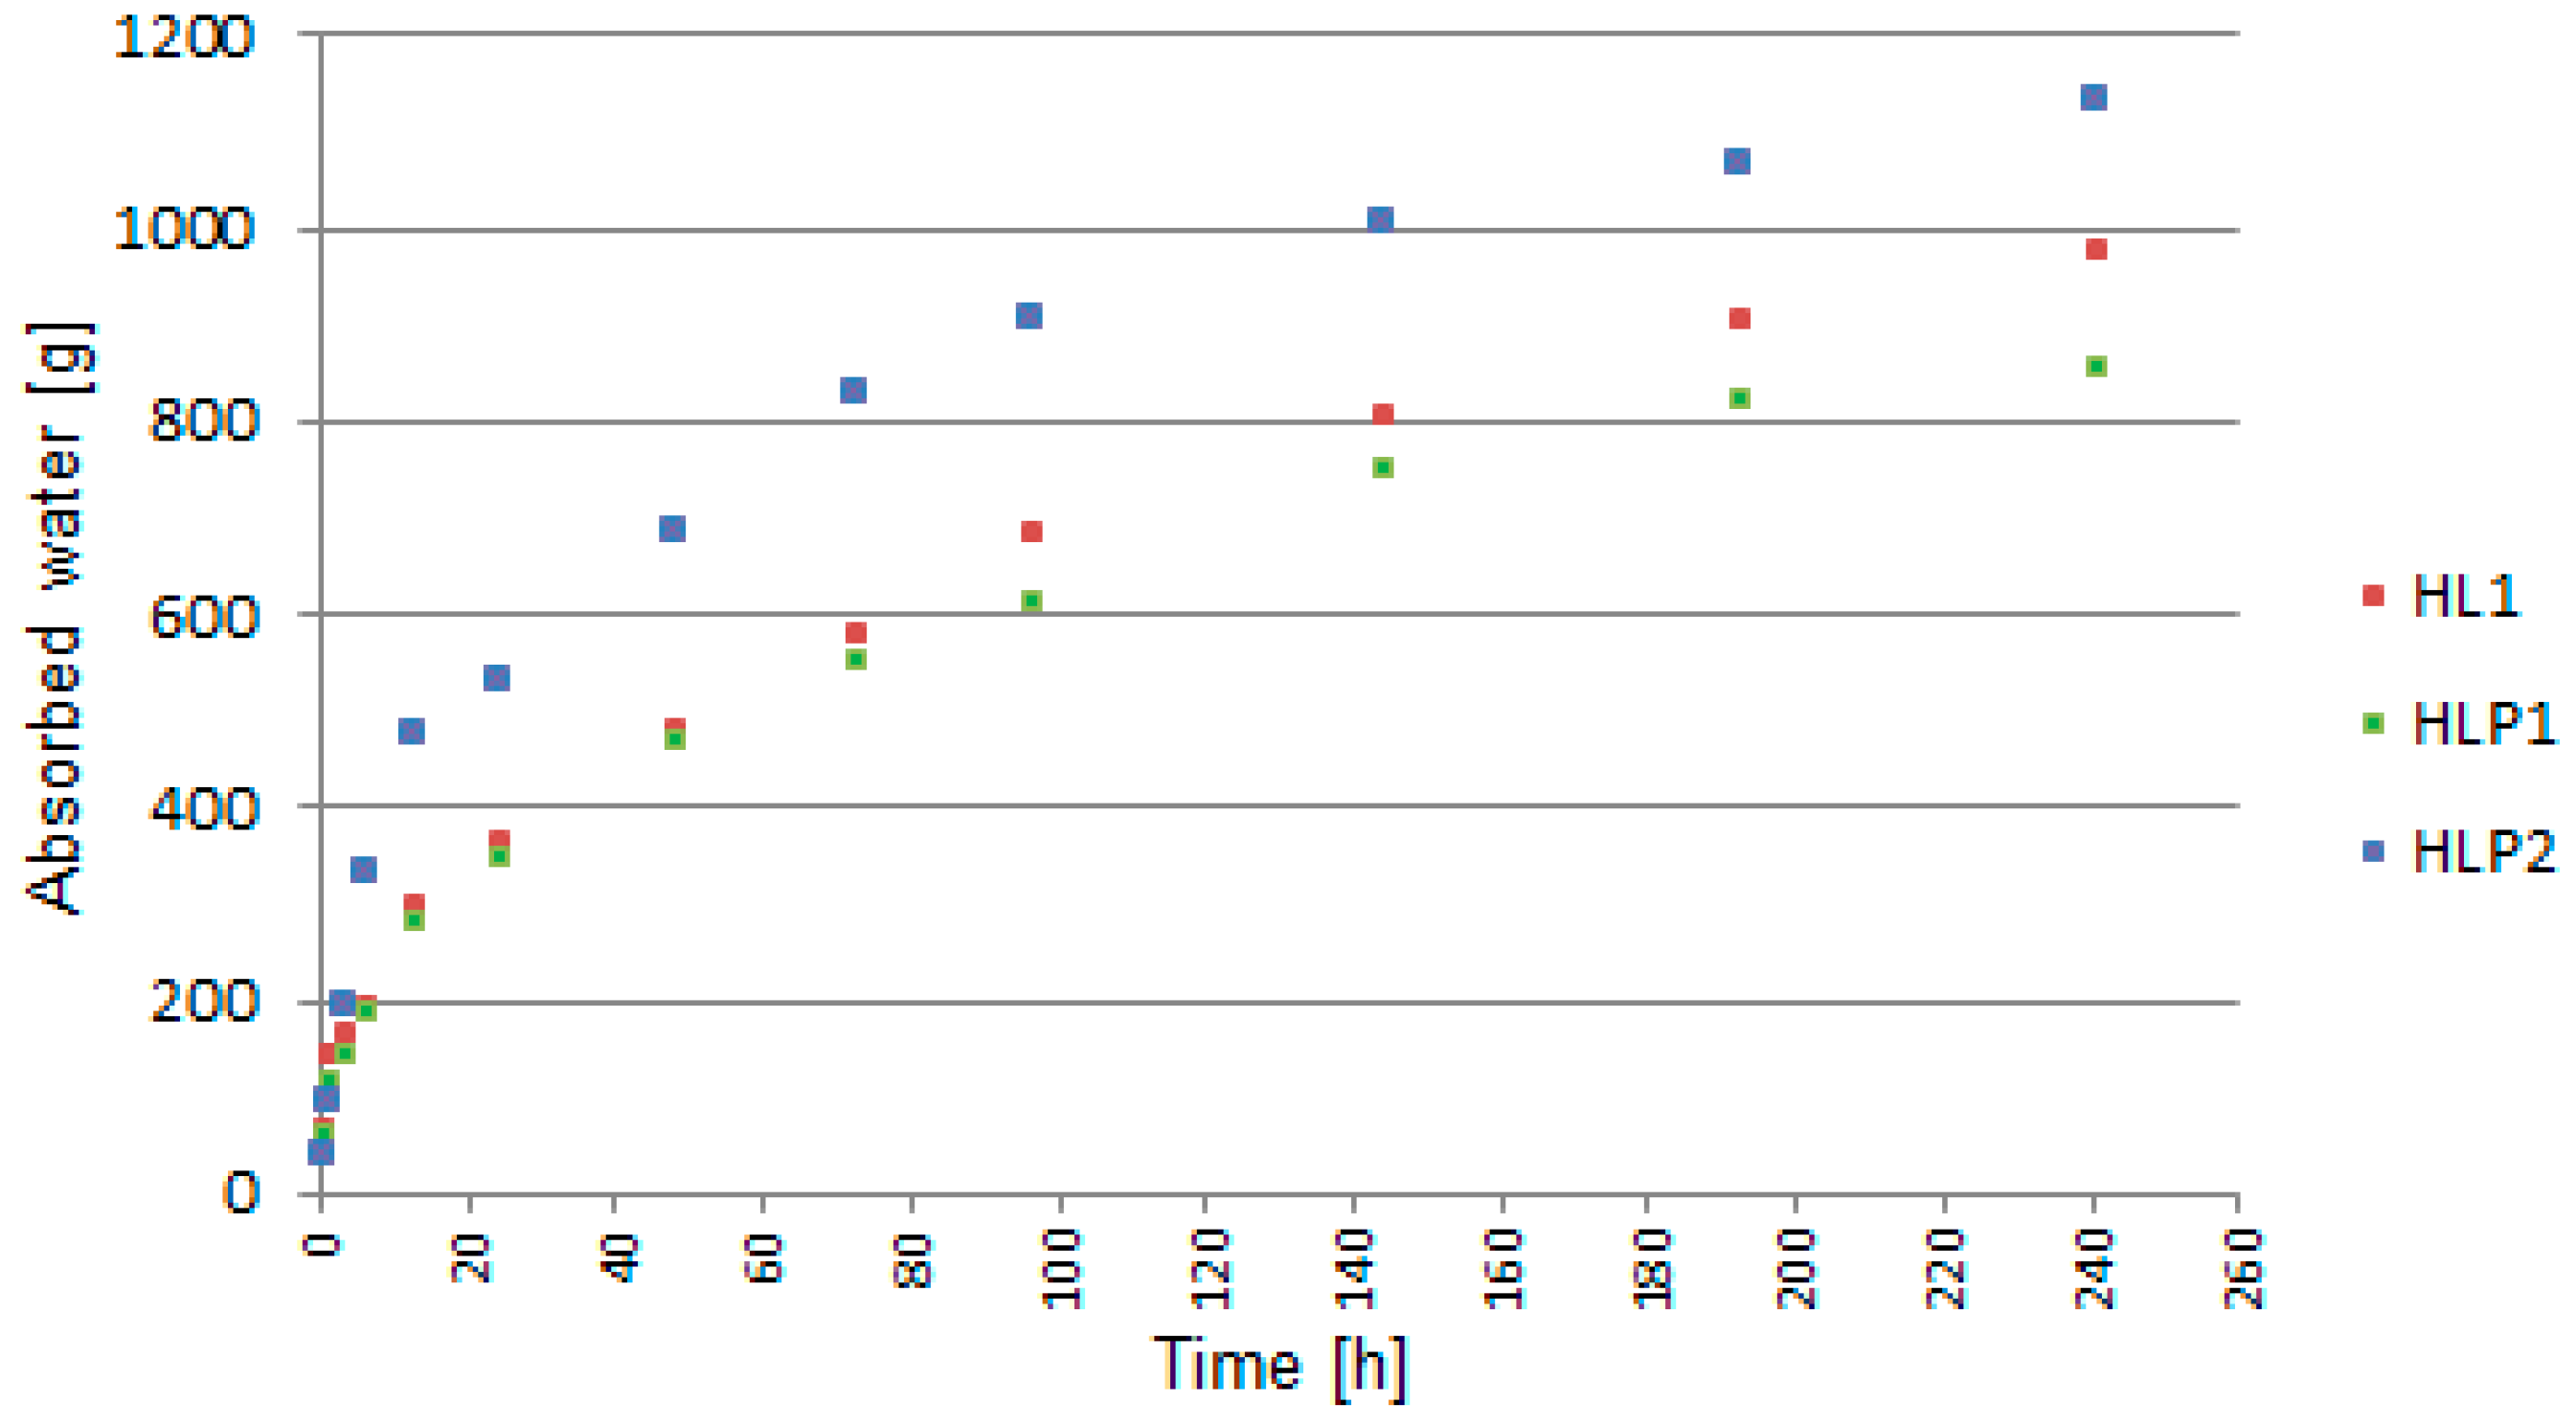
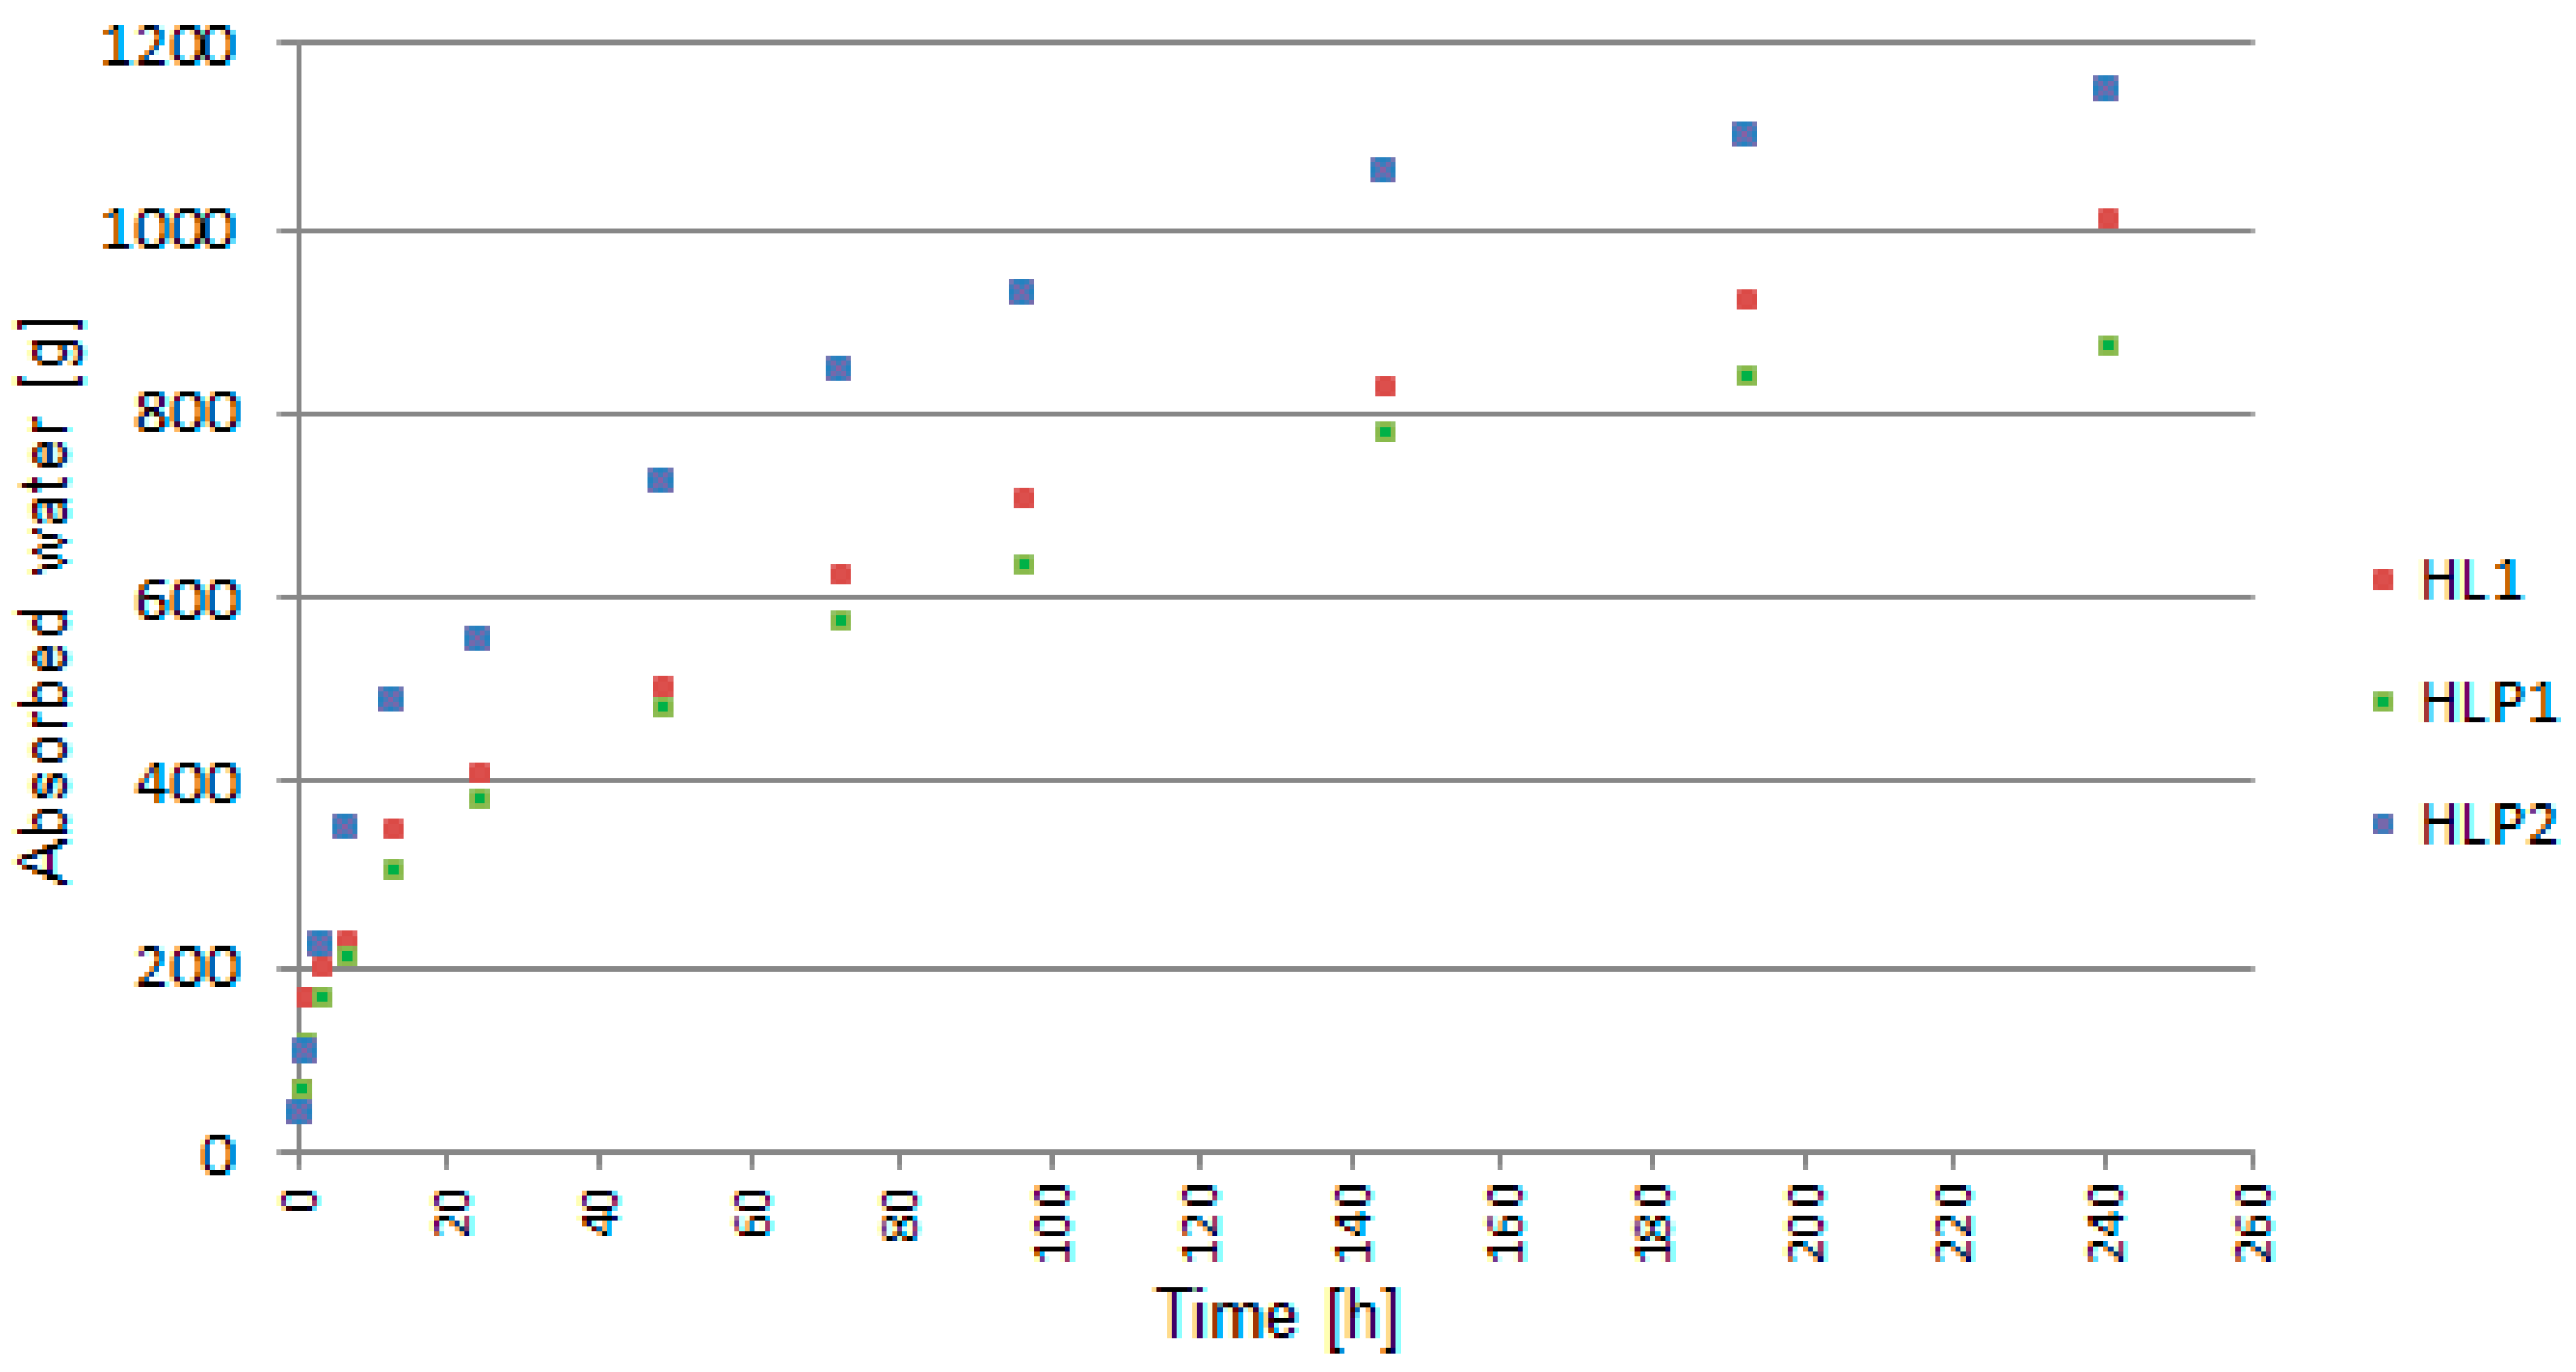
3.5. Capillary Uptake Test Results by the TDR Equipment
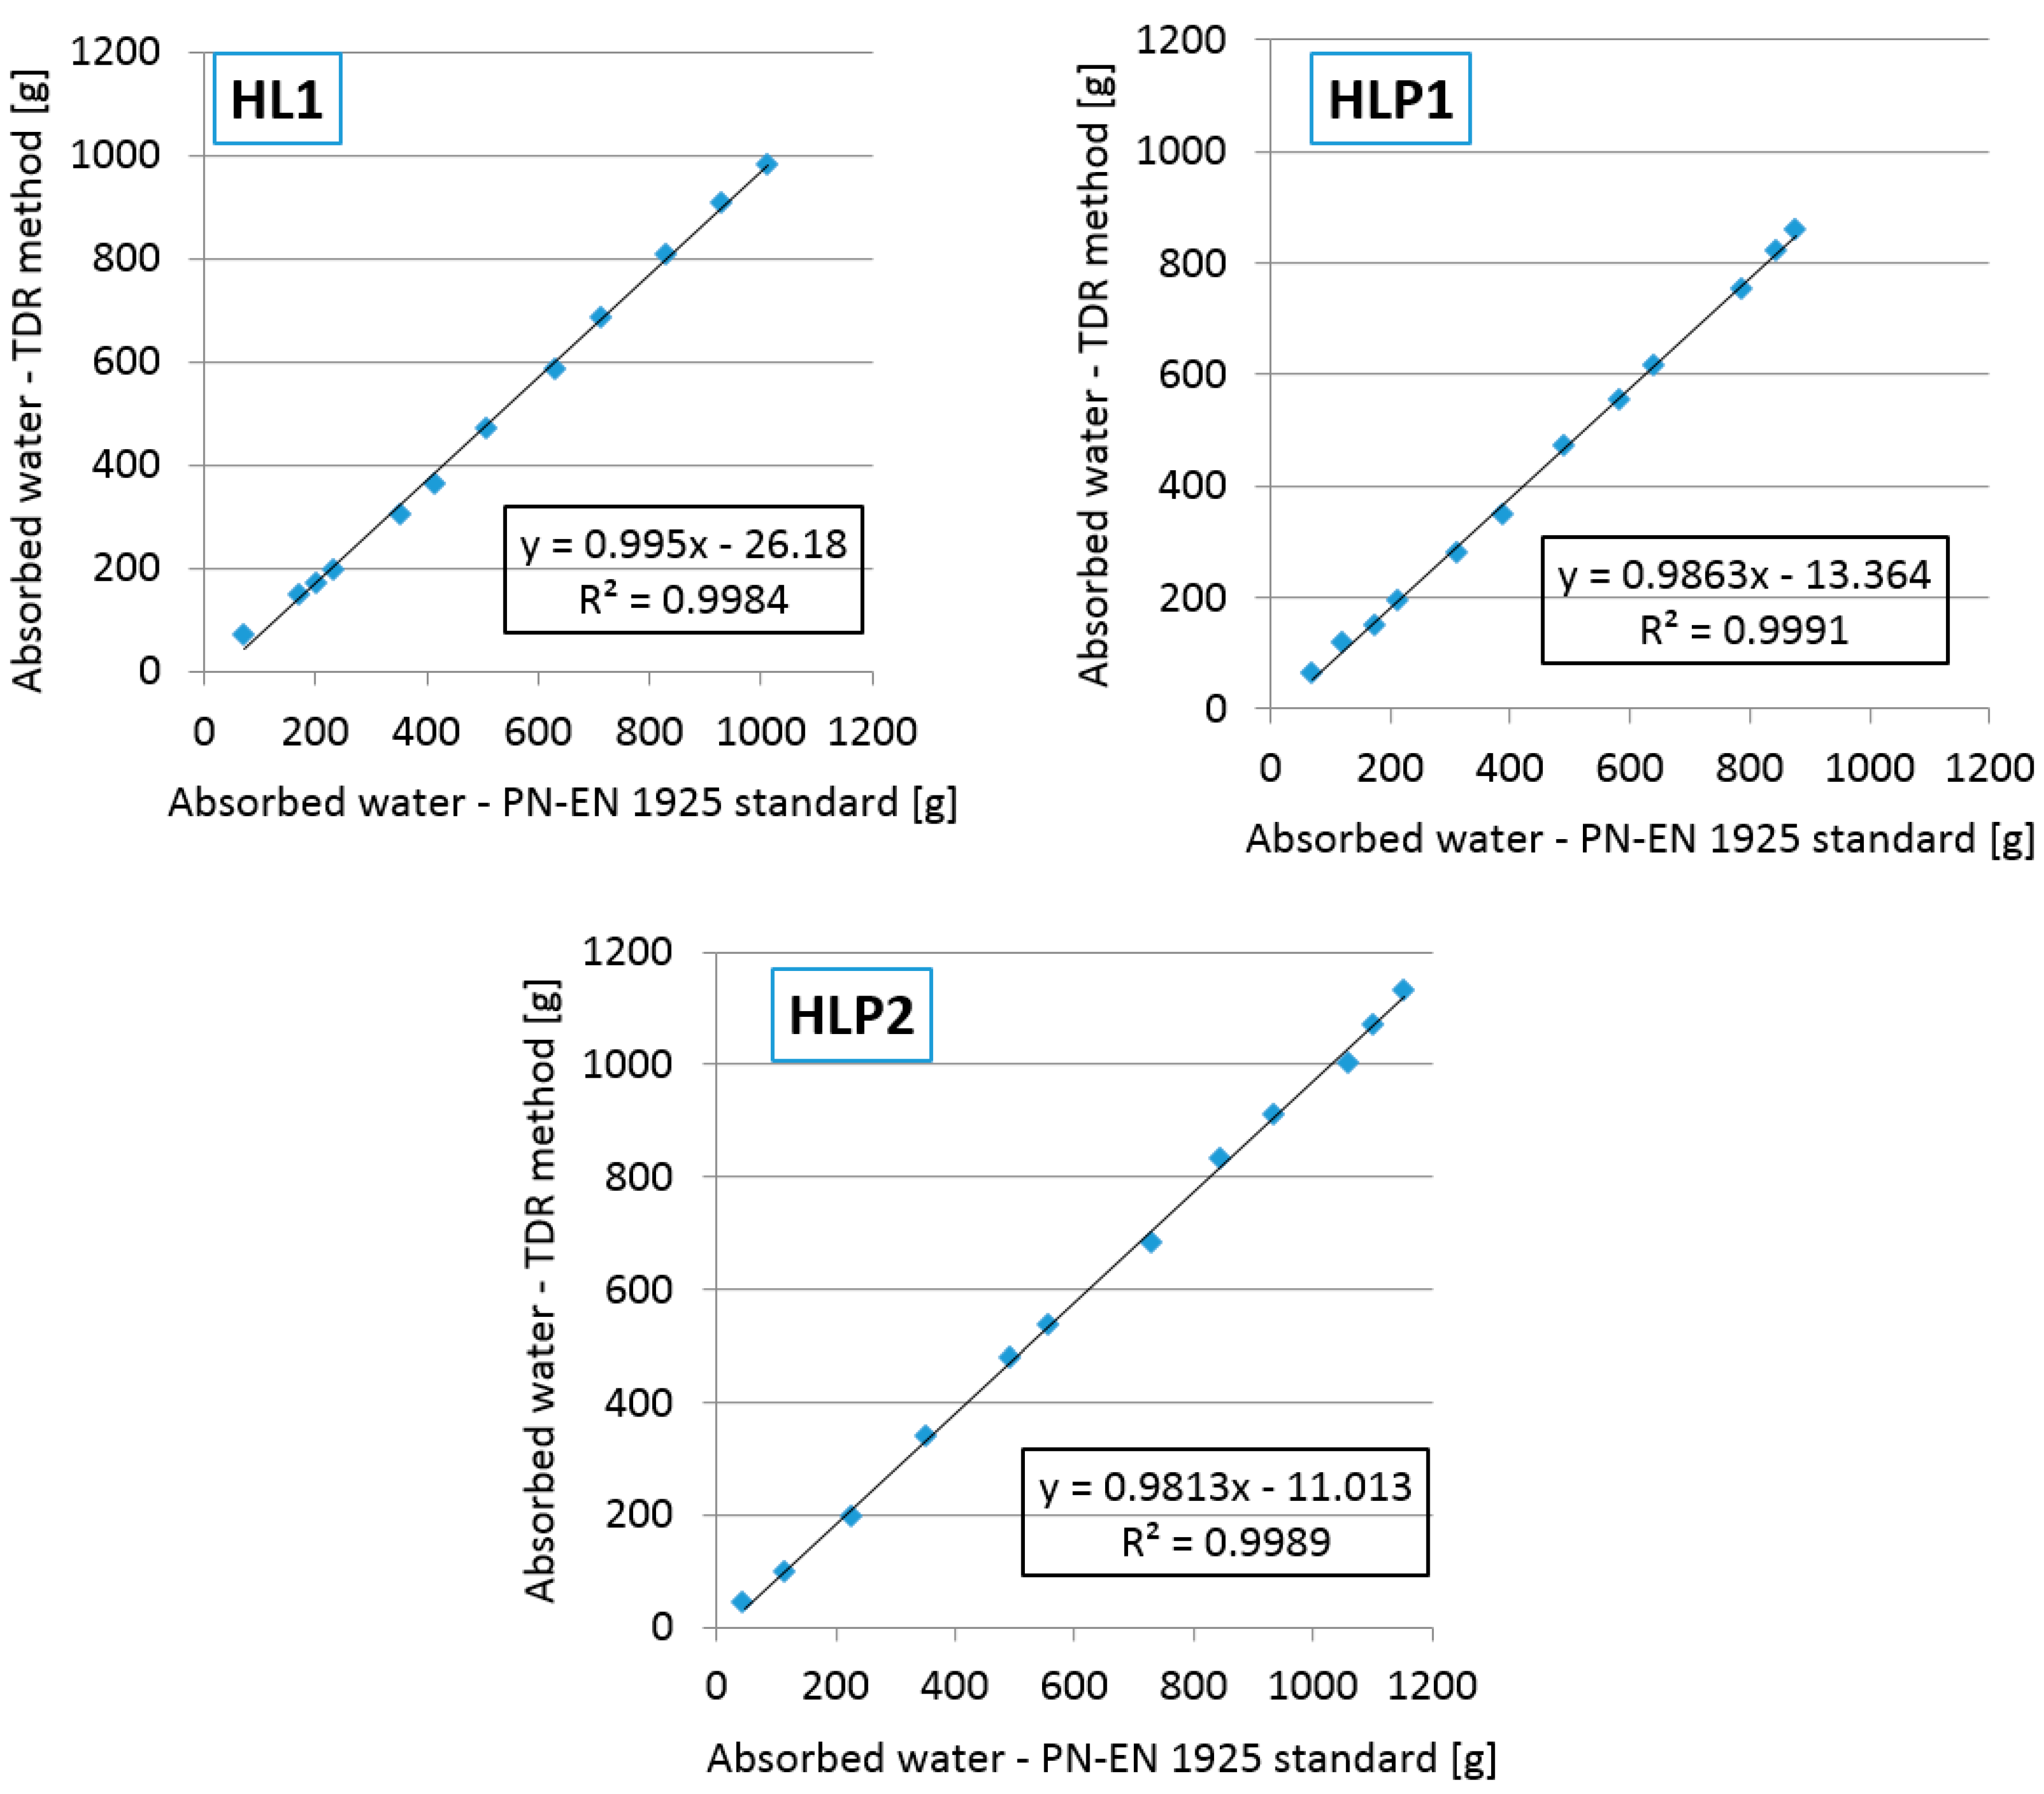
3.6. Evaluation of Water Absorption Coefficient Using Standard and Reflectometric Technique
4. Conclusions
- The maximum volumetric water content in the tested composites was from 41.4 to 54.2 cm3/cm3 (based on the TDR method). The highest volumetric water content of the sample was demonstrated by the HL1 composite, while the smallest by the HLP1 composite.
- The maximum volumetric water content measured using the TDR equipment nearly reached the value of volume absorptivity of all samples determined in pre-tests. On average, the reflectometric readouts were underestimated for 2.5–3.5% (HLP2 and HL1 samples) and for 9.4% (HLP1 sample).
- Mass of the absorbed water determined with the gravimetric method was higher by 1.3–3.0% in comparison with the results obtained using the TDR method. The HL1 sample showed the largest differences, whereas HLP2 showed the smallest.
- In general, the Time Domain Reflectometry readouts of the moisture properties of the examined composites were underestimated for about 2% compared to the gravimetric evaluation. This could be the consequence of the applied universal calibration model but also measuring uncertainty.
- The ratio of binder to filler had a greater effect on limiting the water absorption due to the capillary uptake than the kind of filler.
- Comparing composites with the same ratio of binder to filler (HL1 and HLP1), less water absorption due to the capillary uptake was exhibited by the composite containing expanded perlite (about 14.5% lower).
- The HL1 and HLP1 composites were characterized by similar values of the water absorption coefficient values (2.62–2.76 kg/m2h1/2 based on both methods of testing). In the case of the HLP2 composite, the coefficient value was significantly higher and amounted to over 4 kg/m2h1/2.
- The mass absorptivity of composites was 90.1–127.8%. The most dynamic water absorption occurred in the first seconds after the immersion of samples in water. The absorptivity of the HL1 sample after 5 s was 42.7%. The presence of expanded perlite resulted in a reduction of the initial water absorption.
- Composites had an apparent density of 417.5–503.1 kg/m3. Partial replacement of hemp shives with perlite reduced the density by about 1%. Lowering the proportion of binder to filler from 2:1 to 1.5:1 reduced the density by 20.5%.
- Composites were characterized by low values of flexural (0.16–0.23 MPa) and compressive strength (0.55–0.78 MPa). The highest parameters were shown by the HLP1 composite, while the smallest by the HLP2 composite. Partial replacement of the shives with perlite resulted in an increase in the strength parameters.
- Hemp-lime composites were characterized by the thermal conductivity in the range of 0.087–0.111 W/(m·K). Partial replacement of hemp shives with perlite affected the difference in the thermal conductivity coefficient of the HL1 sample to a limited extent; the sample had an average lambda value lower by 2.8% than HLP1.
Author Contributions
Funding
Conflicts of Interest
References
- Collet, F.; Pretot, S. Thermal conductivity of hemp concretes: Variation with formulation, density and water content. Constr. Build. Mater. 2014, 65, 612–619. [Google Scholar] [CrossRef]
- Binici, H.; Eken, M.; Dolaz, M.; Aksogan, O.; Kara, M. An environmentally friendly thermal insulation material from sunflower stalk, textile waste and stubble fibres. Constr. Build. Mater. 2014, 51, 24–33. [Google Scholar] [CrossRef]
- Izquierdo, I.S.; Ramalho, M.A. Elements of structural masonry reinforced with sisal fibers. J. Civ. Eng. Archit. 2013, 7. [Google Scholar] [CrossRef]
- Sam-Brew, S.; Smith, G.D. Flax and Hemp fiber-reinforced particleboard. Ind. Crop. Prod. 2015, 77, 940–948. [Google Scholar] [CrossRef]
- Mostefai, N.; Hamzaoui, R.; Guessasma, S.; Aw, A.; Nouri, H. Microstructure and mechanical performance of modified hemp fibre and shiv mortars: Discovering the optimal formulation. Mater. Des. 2015, 84, 359–371. [Google Scholar] [CrossRef]
- Kymalainen, H.R.; Sjoberg, A.M. Flax and hemp fibres as raw materials for thermal insulations. Build. Environ. 2008, 43, 1261–1269. [Google Scholar] [CrossRef]
- Grudzińska, M.; Brzyski, P. The Occurrence of Thermal Bridges in Hemp-Lime Construction Junctions. Period. Polytech. Civ. Eng. 2019, 63, 377–387. [Google Scholar] [CrossRef]
- Sinka, M.; Bajare, D.; Gendelis, S.; Jakovics, A. In-situ measurements of hemp-lime insulation materials for energy efficiency improvement. Energy Procedia 2018, 147, 242–248. [Google Scholar] [CrossRef]
- Lawrence, M.; Heath, A.; Walker, P. Determining moisture levels in straw bale construction. Constr. Build. Mater. 2009, 23, 2763–2768. [Google Scholar] [CrossRef]
- Minke, G.; Mahlke, F. Building with Straw; Birkhauser: Basel, Switzerland, 2005. [Google Scholar]
- Rirsch, E.; Zhang, Z. Rising damp in masonry walls and the importance of mortar properties. Constr. Build. Mater. 2010, 24, 1815–1820. [Google Scholar] [CrossRef]
- Hoła, J.; Matkowski, Z.; Schabowicz, K. Tomografia zawilgoconych murów ceglanych. Czas. Tech. B 2007, 104, 73–81. [Google Scholar]
- Jerman, M.; Keppert, M.; Výborný, J.; Černý, R. Hygric, thermal and durability properties of autoclaved aerated concrete. Constr. Build. Mater. 2013, 41, 352–359. [Google Scholar] [CrossRef]
- PN-EN 1925:1999. Natural stone test methods. In Determination of Water Absorption Coefficient by Capillarity; Polish Committee for Standardization: Warsaw, Poland, 1999. [Google Scholar]
- Topp, G.C.; Davis, J.L.; Annan, A.P. Electromagnetic determination of soil water content: Measurements in coaxial transmission lines. Water Resour. Res. 1980, 16, 574–582. [Google Scholar] [CrossRef]
- Noborio, K. Mesurement of soil water content and electrical conductivity by time domain reflectometry: A review. Comput. Electron. Agric. 2001, 31, 213–237. [Google Scholar] [CrossRef]
- Wiener, O. Die Theorie des Mischkoerpers fuer das Feld der sta-tionaeren Stroemung. Abandlungen Math. 1912, 32, 509–604. [Google Scholar]
- Polder, D.; Van Santen, J.H. The effective permeability of mixtures of sol-ids. Physica 1946, 12, 257–271. [Google Scholar] [CrossRef]
- De Loor, G.P. Dielectric properties of heterogeneous mixtures contain-ing water. J. Microw. Power 1968, 3, 67–73. [Google Scholar] [CrossRef]
- Tinga, W.R.; Voss, W.A.G.; Blossey, D.F. Generalized approach to multiphase dielectric mixture theorie. J. Appl. Phys. 1973, 44, 3897–3902. [Google Scholar] [CrossRef]
- Birchak, J.R.; Gardner, C.G.; Hipp, J.E.; Victor, J.M. High dielectric constant microwave probes for sensing soil moisture. Proc. IEEE 1974, 62, 93–98. [Google Scholar] [CrossRef]
- Roth, K.; Schulin, R.; Flühler, H.; Attinger, W. Calibration of time do-main reflectometry for water content measurement using a composite die-lectric approach. Water Resour. Res. 1990, 26, 2267–2273. [Google Scholar]
- Malicki, M.A.; Plagge, R.; Roth, C.H. Improving the calibration of dielectric TDR soil moisture determination taking into account the solid soil. Eur. J. Soil Sci. 1996, 47, 357–366. [Google Scholar] [CrossRef]
- Davis, J.L.; Annan, A.P. Ground-penetrating radar for high-resolution mapping of soil and rock stratigraphy. Geophys. Prospect. 1989, 37, 351–551. [Google Scholar] [CrossRef]
- Malicki, M.A.; Skierucha, W.M. A manually controlled TDR soil moisture meter operating with 300ps rise-time needle pulse. Irrig. Sci. 1989, 10, 153–163. [Google Scholar] [CrossRef]
- Korhonen, C.J.; Janoo, V.C.; Berini, C.M. Time-Domain Reflectometry of Water Content in Portland Cement Concrete; Cold Regions Research & Engineering Laboratory: Hanover, NH, USA, 1997. [Google Scholar]
- Skierucha, W.; Wilczek, A.; Alokhina, O. Calibration of a TDR probe for low soil water content measurements. Sensors and Actuators A 2008, 147, 544–552. [Google Scholar] [CrossRef]
- De Hansen, E.J.P.; Hansen, M.H. TDR measurement of moisture content in aerated concrete. In 6th Symposium on Building Physics in the Nordic Countries; Norwegian University of Science and Technology: Trondheim, Norway, 2002; pp. 381–388. [Google Scholar]
- Pavlík, Z.; Cerný, R. Application of TDR measurement technology for construction materials in semi-scale experiments. Int. Agrophysics 2004, 18, 249–252. [Google Scholar]
- Pavlík, Z.; Fiala, L.; Černý, R. Determination of Moisture Content of Hygroscopic Building Materials Using Time Domain Reflectometry. J. Appl. Sci. 2008, 8, 1732–1737. [Google Scholar] [CrossRef]
- Chabriac, P.A.; Fabbri, A.; Morel, J.C.; Laurent, J.P.; Blanc-Gonnet, J. A Procedure to Measure the in-Situ Hygrothermal Behavior of Earth Walls. Materials 2014, 7, 3002–3020. [Google Scholar] [CrossRef]
- Barnat-Hunek, D.; Smarzewski, P.; Suchorab, Z. Effect of hydrophobisation on durability related properties of ceramic brick. Constr. Build. Mater. 2016, 111, 275–285. [Google Scholar] [CrossRef]
- Suchorab, Z.; Jedut, A.; Sobczuk, H. Water content measurement in building barriers and materials using surface TDR probe. Proc. Ecopole 2008, 2, 123–127. [Google Scholar]
- Suchorab, Z.; Widomski, M.K.; Łagód, G.; Barnat-Hunek, D.; Majerek, D. A Noninvasive TDR Sensor to Measure the Moisture Content of Rigid Porous Materials. Sensors 2018, 18, 3935. [Google Scholar] [CrossRef]
- Brzyski, P.; Łagód, G. Physical and mechanical properties of composites based on hemp shives and lime. E3s Web Conf. 2018, 49. [Google Scholar] [CrossRef]
- Rahim, M.; Douzane, O.; Tran Le, A.D.; Promis, G.; Laidoudi, B.; Crigny, A.; Dupre, B.; Langlet, T. Characterization of flax lime and hemp lime concretes: Hygric properties and moisture buffer capacity. Energy Build. 2015, 88, 91–99. [Google Scholar] [CrossRef]
- Perlit-Polska Website Dedicated to Building & Constructions. Available online: http://perlit-polska.pl (accessed on 14 March 2020).
- Hirst, E.; Walker, P.; Paine, K.; Yates, T. Characterisation of low density hemp-lime composite building materials under compression loading. In Proceedings of the 2nd International Conference on Sustainable Construction Materials and Technologies, Ancona, Italy, 28–30 June 2010. [Google Scholar]
- Gourlay, E.; Arnaud, L. Comportementhygrothermique des murs de béton de chanvre. In Proceedings of the Actes du Congrès SFT, Le Touquet, France, 25–28 May 2010. [Google Scholar]
- Cerezo, V. Propriétésmécaniques, Thermiquesetacoustiques d’un Matériau à Base de Particulesvégétales: Approcheéxpérimentale et Modélisationthéorique; L’Institut National des Sciences Appliquées de Lyon: Saint Valérien, France, 2005. [Google Scholar]
- Nguyen, T. Contribution à L’étude de la Formulation et du Procédé de Fabrication D’éléments de Construction Enbéton de Chanvre. Ph.D. Thesis, Université de Bretagne Sud, Morbihan, France, 2010. [Google Scholar]
- PN-EN 12390-3:2019-07. Testing hardened concrete—Part 7: Density of Hardened Concrete; Polish Committee for Standardization: Warsaw, Poland, 2019. [Google Scholar]
- PN-EN 13755:2008. Natural Stone Test Methods Determination of Water Absorption at Atmospheric Pressure; Polish Committee for Standardization: Warsaw, Poland, 2008. [Google Scholar]
- Amato, M.; Ritchie, J.T. Small spatial scale soil water content measurement with time-domain reflectometry. Soil Sci. Soc. Am. J. 1995, 59, 325–329. [Google Scholar] [CrossRef]
- Vett, S.R. Soil Water Measurement by Time Domain Reflectometry; Dekker, M., Ed.; Encyclopedia of Water Science, Inc.: New York, NY, USA, 2003; pp. 894–898. [Google Scholar]
- Černý, R. Time-domain reflectometry method and its application for measuring moisture content in porous materials: A review. Measurement 2009, 42, 329–336. [Google Scholar] [CrossRef]
- Arnaud, L.; Gourlay, E. Experimental study of parameters influencing mechanical properties of hemp concretes. Constr. Build. Mater. 2012, 28, 50–56. [Google Scholar] [CrossRef]
- Benfratello, S.; Capitano, C.; Peri, G.; Rizzo, G.; Scaccianoce, G.; Sorrentino, G. Thermal and structural properties of a hemp–lime biocomposite. Constr. Build. Mater. 2013, 48, 745–754. [Google Scholar] [CrossRef]
- Elfordy, S.; Lucas, F. Mechanical and thermal properties of lime and hemp concrete (“hempcrete”) manufactured by a projection process. Constr. Build. Mater. 2008, 22, 2116–2123. [Google Scholar] [CrossRef]
- Rahim, M.; Douzane, O.; Tran Le, A.D.; Promis, G.; Langlet, T. Characterization and comparison of hygric properties of rape straw concrete and hemp concrete. Constr. Build. Mater. 2016, 102, 679–687. [Google Scholar] [CrossRef]
- Barclay, M.; Holcroft, N.; Shea, A.D. Methods to determine whole building hygrothermal performance of hemp-lime buildings. Build. Environ. 2014, 80, 204–212. [Google Scholar] [CrossRef]
- Gross, C.; Walker, P. Racking performance of timber studwork and hemp-lime walling. Constr. Build. Mater. 2014, 66, 429–435. [Google Scholar] [CrossRef]
- Walker, R.; Pavía, S. Moisture transfer and thermal properties of hemp–lime concretes. Constr. Build. Mater. 2014, 64, 270–276. [Google Scholar] [CrossRef]
- Tran Le, A.; Maalouf, C.; Mai, T.H.; Wurtz, E.; Collet, F. Transient hygrothermal behaviour of a hemp concrete building envelope. Energy Build. 2010, 42, 1797–1806. [Google Scholar] [CrossRef]
- Chabannes, M.; Garcia-Diaz, E.; Clerc, L.; Bénézet, J.C. Effect of curing conditions and Ca(OH)2-treated aggregates on mechanical properties of rice husk and hemp concretes using a lime-based binder. Constr. Build. Mater. 2016, 102, 821–833. [Google Scholar] [CrossRef]
- Brzyski, P.; Widomski, M. The Influence of Partial Replacement of Hemp Shives by Expanded Perlite on Physical Properties of Hemp-Lime Composite. Aip Conf. Proc. 2017, 1866. [Google Scholar] [CrossRef]
- Stevulova, N.; Kidalova, L.; Cigasova, J.; Junak, J.; Sicakova, A.; Terpakova, E. Lightweight Composites Containing Hemp Hurds. Procedia Eng. 2013, 65, 69–74. [Google Scholar] [CrossRef]
- Sassoni, E.; Manzi, S.; Motori, A.; Montecchi, M.; Canti, M. Novel sustainable hemp-based composites for application in the building industry: Physical, thermal and mechanical characterization. Energy Build. 2014, 77, 219–226. [Google Scholar] [CrossRef]
- Suchorab, Z.; Majerek, D.; Brzyski, P.; Sobczuk, H.; Raczkowski, A. Estimation of water absorption coefficient using the TDR method. Aip Conf. Proc. 2017, 1866, 040038. [Google Scholar] [CrossRef]
- Suchorab, Z.; Brzyski, P.; Raczkowski, A.; Garbacz, M.; Życzyńska, A. Laboratory Determination of Hygric and Thermal Anisotropy of Aerated Concrete. Aip Conf. Proc. 2018, 1988, 020045. [Google Scholar] [CrossRef]
- Paiva, H.; Esteves, L.P.; Cachim, P.B.; Ferreira, V.M. Rheology and hardened properties of single-coat render mortars with different types of water retaining agents. Constr. Build. Mater. 2009, 23, 1141–1146. [Google Scholar] [CrossRef]
- Brigitte de Bruijn, P.; Jeppsson, K.H.; Sandin, K.; Nilsson, C. Mechanical properties of lime–hemp concrete containing shives and fibres. Biosyst. Eng. 2009, 103. [Google Scholar] [CrossRef]


| Material | Binder | Hemp Shives | Expanded Perlite | Water |
|---|---|---|---|---|
| symbol/unit | (kg/m3) | (kg/m3) | (kg/m3) | (kg/m3) |
| HL1 | 284.44 | 142.22 | - | 412.44 |
| HLP1 | 334.44 | 101.33 | 65.87 | 484.88 |
| HLP2 | 250.80 | 101.33 | 65.87 | 413.82 |
| Material/Symbol | Binder | Hemp Shives | Expanded Perlite | Binder: Water Ratio |
|---|---|---|---|---|
| HL1 | 2 | 1 | - | 1.45 |
| HLP1 | 2 | 0.6 | 0.4 | 1.45 |
| HLP2 | 1.5 | 0.6 | 0.4 | 1.65 |
| Recipe Symbol | Flexural Strength | Compressive Strength | Apparent Density | Total Porosity | Open Porosity | Mass Absorptivity | Volume Absorptivity | Thermal Conductivity Coefficient |
|---|---|---|---|---|---|---|---|---|
| (MPa) | (MPa) | (kg/m3) | (%) | (%) | (%) | (%) | (W/(m·K)) | |
| HL1 | 0.18 | 0.66 | 497.9 | 74.4 | 57.8 | 112.6 | 56.1 | 0.108 |
| ±0.018 | ±0.019 | ±5.25 | ±0.451 | ±0.251 | ±4.52 | ±2.35 | ±0.004 | |
| HLP1 | 0.23 | 0.78 | 503.1 | 75.6 | 49.9 | 90.1 | 45.3 | 0.111 |
| ±0.026 | ±0.025 | ±6.35 | ±0.491 | ±0.203 | ±3.93 | ±2.02 | ±0.005 | |
| HLP2 | 0.16 | 0.55 | 417.5 | 79.3 | 54.3 | 127.8 | 53.4 | 0.087 |
| ±0.013 | ±0.014 | ±5.80 | ±0.547 | ±0.242 | ±5.48 | ±2.37 | ±0.002 |
© 2020 by the authors. Licensee MDPI, Basel, Switzerland. This article is an open access article distributed under the terms and conditions of the Creative Commons Attribution (CC BY) license (http://creativecommons.org/licenses/by/4.0/).
Share and Cite
Brzyski, P.; Suchorab, Z. Capillary Uptake Monitoring in Lime-Hemp-Perlite Composite Using the Time Domain Reflectometry Sensing Technique for Moisture Detection in Building Composites. Materials 2020, 13, 1677. https://doi.org/10.3390/ma13071677
Brzyski P, Suchorab Z. Capillary Uptake Monitoring in Lime-Hemp-Perlite Composite Using the Time Domain Reflectometry Sensing Technique for Moisture Detection in Building Composites. Materials. 2020; 13(7):1677. https://doi.org/10.3390/ma13071677
Chicago/Turabian StyleBrzyski, Przemysław, and Zbigniew Suchorab. 2020. "Capillary Uptake Monitoring in Lime-Hemp-Perlite Composite Using the Time Domain Reflectometry Sensing Technique for Moisture Detection in Building Composites" Materials 13, no. 7: 1677. https://doi.org/10.3390/ma13071677
APA StyleBrzyski, P., & Suchorab, Z. (2020). Capillary Uptake Monitoring in Lime-Hemp-Perlite Composite Using the Time Domain Reflectometry Sensing Technique for Moisture Detection in Building Composites. Materials, 13(7), 1677. https://doi.org/10.3390/ma13071677