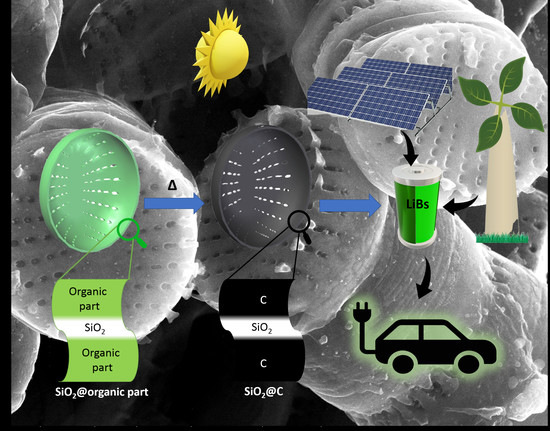
Diatoms Biomass as a Joint Source of Biosilica and Carbon for Lithium-Ion Battery Anodes

 ,
,  ,
, 
 ,
, 
Abstract
1. Introduction
2. Materials and Methods
3. Results and Discussion
4. Conclusions
Author Contributions
Funding
Conflicts of Interest
References
- Arrhenius, S. XXXI. On the influence of carbonic acid in the air upon the temperature of the ground. Lond. Edinb. Dublin Philos. Mag. J. Sci. 1896, 41, 237–276. [Google Scholar] [CrossRef]
- Islam, M.S.; Bruce, P.G.; Richard, C.A.; Nelson, J. Energy materials for a low carbon future. Philos. Trans. R. Soc. A 2019, 377, 20190219. [Google Scholar] [CrossRef] [PubMed]
- Prochowicz, D.; Saski, M.; Yadav, P.; Grätzel, M.; Lewiński, J. Mechanoperovskites for Photovoltaic Applications: Preparation, Characterization, and Device Fabrication. Acc. Chem. Res. 2019, 52, 3233–3243. [Google Scholar] [CrossRef] [PubMed]
- Ji, X. A paradigm of storage batteries. Energy Environ. Sci. 2019, 12, 3203–3224. [Google Scholar] [CrossRef]
- Brédas, J.-L.; Buriak, J.M.; Caruso, F.; Choi, K.-S.; Korgel, B.A.; Palacin, M.R.; Persson, K.; Reichmanis, E.; Schüth, F.; Seshadri, R.; et al. An Electrifying Choice for the 2019 Chemistry Nobel Prize: Goodenough, Whittingham, and Yoshino. Chem. Mater. 2019, 31, 8577–8581. [Google Scholar] [CrossRef]
- Mizushima, K.; Jones, P.C.; Wiseman, P.J.; Goodenough, J.B. LixCoO2 (0 < x < −1): A new cathode material for batteries of high energy density. Mater. Res. Bull. 1980, 15, 783–789. [Google Scholar]
- Mizushima, K.; Jones, P.C.; Wiseman, P.J.; Goodenough, J.B. LixCoO2 (0 < x ≤ 1): A new cathode material for batteries of high energy density. Solid State Ion. 1981, 4, 171–174. [Google Scholar]
- Whittingham, M.S. Electrical Energy Storage and Intercalation Chemistry. Science 1976, 192, 1126–1127. [Google Scholar] [CrossRef]
- Whittingham, M.S. Chemistry of intercalation compounds: Metal guests in chalcogenide hosts. Prog. Solid State Chem. 1978, 12, 41–99. [Google Scholar] [CrossRef]
- Nowak, A.P. Composites of tin oxide and different carbonaceous materials as negative electrodes in lithium-ion batteries. J. Solid State Electrochem. 2018, 22, 2297–2304. [Google Scholar] [CrossRef]
- Reddy, M.V.; Rao, G.V.S.; Chowdari, B.V.R. Metal Oxides and Oxysalts as Anode Materials for Li Ion Batteries. Chem. Rev. 2013, 113, 5364–5457. [Google Scholar] [CrossRef] [PubMed]
- Liu, J.; Kopold, P.; van Aken, P.A.; Maier, J.; Yu, Y. Energy Storage Materials from Nature through Nanotechnology: A Sustainable Route from Reed Plants to a Silicon Anode for Lithium-Ion Batteries. Angew. Commun. 2015, 54, 9632–9636. [Google Scholar] [CrossRef] [PubMed]
- Guo, B.; Shu, J.; Wang, Z.; Yang, H.; Shi, L.; Liu, Y.; Chen, L. Electrochemistry Communications Electrochemical reduction of nano-SiO2 in hard carbon as anode material for lithium ion batteries. Electrochem. Commun. 2008, 10, 1876–1878. [Google Scholar] [CrossRef]
- Lener, G.; Garcia-Blanco, A.A.; Furlong, O.; Nazzarro, M.; Sapag, K.; Barraco, D.E.; Leiva, E.P.M. A silica/carbon composite as anode for lithium-ion batteries with a large rate capability: Experiment and theoretical considerations. Electrochim. Acta 2018, 279, 289–300. [Google Scholar] [CrossRef]
- Liu, Z.; Yu, Q.; Zhao, Y.; He, R.; Xu, M.; Feng, S.; Li, S.; Zhou, L.; Mai, L. Silicon oxides: A promising family of anode materials for lithium-ion batteries. Chem. Soc. Rev. 2019, 48, 285–309. [Google Scholar] [CrossRef]
- Lisowska-Oleksiak, A.; Wicikowska, B.; Nowak, A.P.; Olejniczak, Z. Preparation and Characterization of Nanomaterial Consisting of Silica Aerogel & Carbon Tested as an Electrode in Non-Aqueous Media Containing Lithium Salt. Int. J. Electrochem. Sci. 2017, 11, 1997–2017. [Google Scholar]
- Chang, W.-S.; Park, C.-M.; Kim, J.-H.; Kim, Y.-U.; Jeong, G.; Sohn, H. Quartz (SiO2): A new energy storage anode material for Li-ion batteries. Energy Environ. Sci. 2012, 5, 6895–6899. [Google Scholar] [CrossRef]
- Jeffryes, C.; Campbell, J.; Li, H.; Jiao, J.; Rorrer, G. The potential of diatom nanobiotechnology for applications in solar cells, batteries, and electroluminescent devices. Energy Environ. Sci. 2011, 4, 3930–3941. [Google Scholar] [CrossRef]
- Sun, X.W.; Zhang, Y.X.; Losic, D. Diatom silica, an emerging biomaterial for energy conversion and storage. J. Mater. Chem. A 2017, 5, 8847–8859. [Google Scholar] [CrossRef]
- Nowak, A.P.; Sprynskyy, M.; Brzozowska, W.; Lisowska-oleksiak, A. Electrochemical behavior of a composite material containing 3D-structured diatom biosilica. Algal Res. 2020, 41, 101538. [Google Scholar] [CrossRef]
- Ratyński, M.; Hamankiewicz, B.; Krajewski, M.; Czerwinski, A. The effect of compressive stresses on a silicon electrode’s cycle life in a Li-ion battery. RSC Adv. 2018, 8, 22546–22551. [Google Scholar] [CrossRef]
- Fu, C.; Xu, L.; Aquino, F.W.; Cresce, A.V.; Gobet, M.; Greenbaum, S.G.; Xu, K.; Wong, B.M.; Guo, J. Correlating Li+-Solvation Structure and its Electrochemical Reaction Kinetics with Sulfur in Subnano Confinement. J. Phys. Chem. Lett. 2018, 9, 1739–1745. [Google Scholar] [CrossRef] [PubMed]
- Fu, C.; Oviedo, M.B.; Zhu, Y.; Von Wald Cresce, A.; Xu, K.; Li, G.; Itkis, M.E.; Haddon, R.C.; Chi, M.; Han, Y.; et al. Confined Lithium-Sulfur Reactions in Narrow-Diameter Carbon Nanotubes Reveal Enhanced Electrochemical Reactivity. ACS Nano 2018, 12, 9775–9784. [Google Scholar] [CrossRef] [PubMed]
- Wicikowska, B. Otrzymywanie I Właściwości Materiałów Anodowych Zawierających Nanokompzyty Krzemionkowo-Węglowe Do Ogniw Litowo-Jonowych. Ph.D. Thesis, Gdańsk University of Technology, Gdańsk, Poland, 2017. [Google Scholar]
- Xia, X.; Afshar, A.; Yang, H.; Portela, C.M.; Kochmann, D.M.; Claudio, V.; Leo, D.; Greer, J.R. Electrochemically reconfigurable architected materials. Nature 2019, 573, 205–213. [Google Scholar] [CrossRef]
- Luo, S.; Greer, J.R. Bio-Mimicked Silica Architectures Capture Geometry, Microstructure, and Mechanical Properties of Marine Diatoms. Adv. Eng. Mater. 2018, 20, 1800301. [Google Scholar] [CrossRef]
- Chepurnov, V.A.; Mann, D.G.; Von Dassow, P.; Vanormelingen, P.; Gillard, J.; Inze, D. In search of new tractable diatoms for experimental biology. BioEssays 2008, 30, 692–702. [Google Scholar] [CrossRef]
- Żak, A.; Kosakowska, A. The influence of extracellular compounds produced by selected Baltic cyanobacteria, diatoms and dinoflagellates on growth of green algae Chlorella vulgaris. Estuar. Coast. Shelf Sci. 2015, 167, 113–118. [Google Scholar] [CrossRef]
- Lisowska-Oleksiak, A.; Nowak, A.P.; Wicikowska, B. Aquatic biomass containing porous silica as an anode for lithium ion batteries. RSC Adv. 2014, 4, 40439–40443. [Google Scholar] [CrossRef]
- Nowak, A.P.; Lisowska-Oleksiak, A. Red Algae–An Alternative Source of Carbon Material for Energy Storage Application. Int. J. Electrochem. Sci. 2014, 9, 3715–3724. [Google Scholar]
- Nowak, A.P.; Lisowska-Oleksiak, A.; Wicikowska, B.; Gazda, M. Biosilica from sea water diatoms algae—Electrochemical impedance spectroscopy study. J. Solid State Electrochem. 2017, 21, 2251–2258. [Google Scholar] [CrossRef]
- Lisowska-Oleksiak, A.; Nowak, A.P.; Wicikowska, B. Sposób Otrzymania Anod Ogniw Litowo-Jonowych. Polish Patent Application No. 413911, 2015. [Google Scholar]
- Norberg, A.N.; Wagner, N.P.; Kaland, H.; Vullum-bruer, F.; Svensson, A.M. Silica from diatom frustules as anode material for Li-ion batteries. RSC Adv. 2019, 9, 41228–41239. [Google Scholar] [CrossRef]
- Sprynskyy, M.; Pomastowski, P.; Hornowska, M.; Król, A.; Rafińska, K.; Buszewski, B. Naturally organic functionalized 3D biosilica from diatom microalgae. Mater. Des. 2017, 132, 22–29. [Google Scholar] [CrossRef]
- Biernacki, J.J.; Wotzak, G.P. Stoichiometry of the C+ SiO2 Reaction. J. Am. Ceram. Soc. 1989, 72, 122–129. [Google Scholar] [CrossRef]
- Ibrahim, S.S.; Selim, A.Q. Heat treatment of natural diatomite. Physicochem. Probl. Miner. Process. 2012, 48, 413–424. [Google Scholar]
- DeMaster, D.J. The Diagenesis of Biogenic Silica: Chemical Transformations Occurring in the Water Column, Seabed, and Crust. Treatise Geochem. 2003, 7, 87–98. [Google Scholar]
- Kumar, V.; Kashyap, M.; Gautam, S.; Shukla, P.; Joshi, K.B.; Vinayak, V. Fast Fourier infrared spectroscopy to characterize the biochemical composition in diatoms. J. Biosci. 2018, 43, 717–729. [Google Scholar] [CrossRef]
- Heredia, A.; Figueira, E.; Rodrigues, C.T.; Rodríguez-galván, A.; Basiuk, V.A.; Vrieling, E.G.; Almeida, S.F.P. Cd2+ affects the growth, hierarchical structure and peptide composition of the biosilica of the freshwater diatom Nitzschia palea (Kützing) W. Smith. Phycol. Res. 2012, 60, 229–240. [Google Scholar] [CrossRef]
- Wang, X.; Kong, R.; Pan, X.; Xu, H.; Xia, D.; Shan, H.; Lu, J.R. Role of Ovalbumin in the Stabilization of Metastable Vaterite in Calcium Carbonate Biomineralization. J. Phys. Chem. B 2009, 113, 8975–8982. [Google Scholar] [CrossRef]
- Rickert, D.; Schlüter, M.; Wallmann, K. Dissolution kinetics of biogenic silica from the water column to the sediments. Geochim. Cosmochim. Acta 2002, 66, 439–455. [Google Scholar] [CrossRef]
- Gendron-Badou, A.; Coradin, T.; Maquet, J.; Fröhlich, F.; Livage, J. Spectroscopic characterization of biogenic silica. J. Non Cryst. Solids 2003, 316, 331–337. [Google Scholar] [CrossRef]
- Bouregba, A.; Diouri, A. Potential formation of hydroxyapatite in total blood and dicalcium silicate elaborated from shell and glass powders. Mater. Lett. 2016, 183, 405–407. [Google Scholar] [CrossRef]
- Lee, B.-S.; Lin, H.-P.; Chan, J.C.-C.; Wang, W.-C.; Tsai, Y.-H.; Lee, Y.-L. A novel sol-gel-derived calcium silicate cement with short setting time for application in endodontic repair of perforations. Int. J. Nanomed. 2018, 13, 261–271. [Google Scholar] [CrossRef] [PubMed]
- Cabrera, A.B.; Mendoza, M.E. Lamellar ceramics of Ca2SiO4 prepared by mechanical activation of powders. Rev. Mex. Fis. 2006, 52, 346–351. [Google Scholar]
- Tuinstra, F.; Koenig, J.L. Raman Spectrum of Graphite Raman Spectrum of Graphite. J. Chem. Phys. 1970, 1126, 1126–1130. [Google Scholar] [CrossRef]
- Wang, Y.; Alsmeyer, D.C.; Mccreery, R.L. Raman Spectroscopy of Carbon Materials: Structural Basis of Observed Spectra. Chem. Mater. 1990, 2, 557–563. [Google Scholar] [CrossRef]
- Ferrari, A.C.; Robertson, J. Resonant Raman spectroscopy of disordered, amorphous, and diamondlike carbon. Phys. Rev. B 2001, 64, 075414. [Google Scholar] [CrossRef]
- Sze, S.; Siddique, N.; Sloan, J.J.; Escribano, R. Raman spectroscopic characterization of carbonaceous aerosols. Atmos. Environ. 2001, 35, 561–568. [Google Scholar] [CrossRef]
- Nowak, A.P.; Hagberg, J.; Leijonmarck, S.; Schweinebarth, H.; Baker, D.; Uhlin, A. Lignin-based carbon fibers for renewable and multifunctional lithium-ion battery electrodes. Holzforschung 2018, 72, 81–90. [Google Scholar] [CrossRef]
- Sadezky, A.; Muckenhuber, H.; Grothe, H.; Niessner, R.; Pöschl, U. Raman microspectroscopy of soot and related carbonaceous materials: Spectral analysis and structural information. Carbon 2005, 43, 1731–1742. [Google Scholar] [CrossRef]
- Ferrari, A.C.; Robertson, J. Interpretation of Raman spectra of disordered and amorphous carbon. Phys. Rev. B 2000, 61, 14095–14107. [Google Scholar] [CrossRef]
- Hemley, R.J.; Mao, H.K.; Bell, P.M.; Mysen, B.O. Raman Spectroscopy of SiO2 Glass at High Pressure. Phys. Rev. Lett. 2000, 57, 747–750. [Google Scholar] [CrossRef] [PubMed]
- Yuan, P.; He, H.P.; Wu, D.Q.; Wang, D.Q.; Chen, L.J. Characterization of diatomaceous silica by Raman spectroscopy. Spectrochim. Acta Part A 2004, 60, 2941–2945. [Google Scholar] [CrossRef] [PubMed]
- Kingma, K.J.; Hemley, R.J. Raman spectroscopic study of microcrystalline silica. Am. Mineral. 1994, 79, 269–273. [Google Scholar]
- Lee, E.L.; Wachs, I.E. In Situ Spectroscopic Investigation of the Molecular and Electronic Structures of SiO2 Supported Surface Metal Oxides. J. Phys. Chem. C 2007, 111, 14410–14425. [Google Scholar] [CrossRef]
- Galeener, F.L. Planar rings in glasses. Solid State Commun. 1982, 44, 1037–1040. [Google Scholar] [CrossRef]
- Shoval, S.; Boudeulle, M.; Yariv, S.; Lapides, I.; Panczer, G. Micro-Raman and FT-IR spectroscopy study of the thermal transformations of St. Claire dickite. Opt. Mater. 2001, 16, 319–327. [Google Scholar] [CrossRef]
- Fuchs, I.; Aluma, Y.; Ilan, M.; Mastai, Y. Induced Crystallization of Amorphous Biosilica to Cristobalite by Silicatein. J. Phys. Chem. B 2014, 118, 2104–2111. [Google Scholar] [CrossRef]
- Hutchison, S.G.; Richardson, L.S.; Wai, C.M. Carbothermic Reduction of Silicon Dioxide. Metall. Trans. B 1988, 19, 249–253. [Google Scholar] [CrossRef]
- Peled, E. The Electrochemical Behavior of Alkali and Alkaline Earth Metals in Nonaqueous Battery Systems—The Solid Electrolyte Interphase Model. J. Electrochem. Soc. 1979, 126, 2047–2051. [Google Scholar] [CrossRef]
- Li, H.-H.; Wu, X.-L.; Sun, H.-Z.; Wang, K.; Fan, C.-Y.; Zhang, L.-L.; Yang, F.-M.; Zhang, J.-P. Dual-Porosity SiO2/C Nanocomposite with Enhanced Lithium Storage Performance. J. Phys. Chem. C 2015, 119, 3495–3501. [Google Scholar] [CrossRef]
- Dahn, J.R.; Zheng, T.; Liu, Y.; Xue, J.S. Mechanisms for Lithium Insertion in Carbonaceous Materials. Science 1995, 270, 590–594. [Google Scholar] [CrossRef]
- Yan, N.; Wang, F.; Zhong, H.; Li, Y.; Wang, Y.; Hu, L.; Chen, Q. Hollow Porous SiO2 Nanocubes Towards High-performance Anodes for Lithium-ion Batteries. Sci. Rep. 2013, 3, 1568. [Google Scholar] [CrossRef] [PubMed]


| Treatment Diatom Biomass | C | O | Si | Ca | P | Fe | S | Mg | K | Cl |
|---|---|---|---|---|---|---|---|---|---|---|
| 600 °C | 24.79 | 37.14 | 15.12 | 18.37 | 1.85 | 1.26 | 0.07 | 0.25 | 1.08 | 0.07 |
| 800 °C | 22.12 | 36.53 | 18.30 | 18.69 | 1.19 | 1.46 | 0.18 | 0.34 | 1.13 | 0.06 |
| 1100 °C | 15.14 | 29.01 | 12.37 | 39.77 | 1.59 | 1.01 | 0.15 | 0.48 | 0.38 | 0.01 |
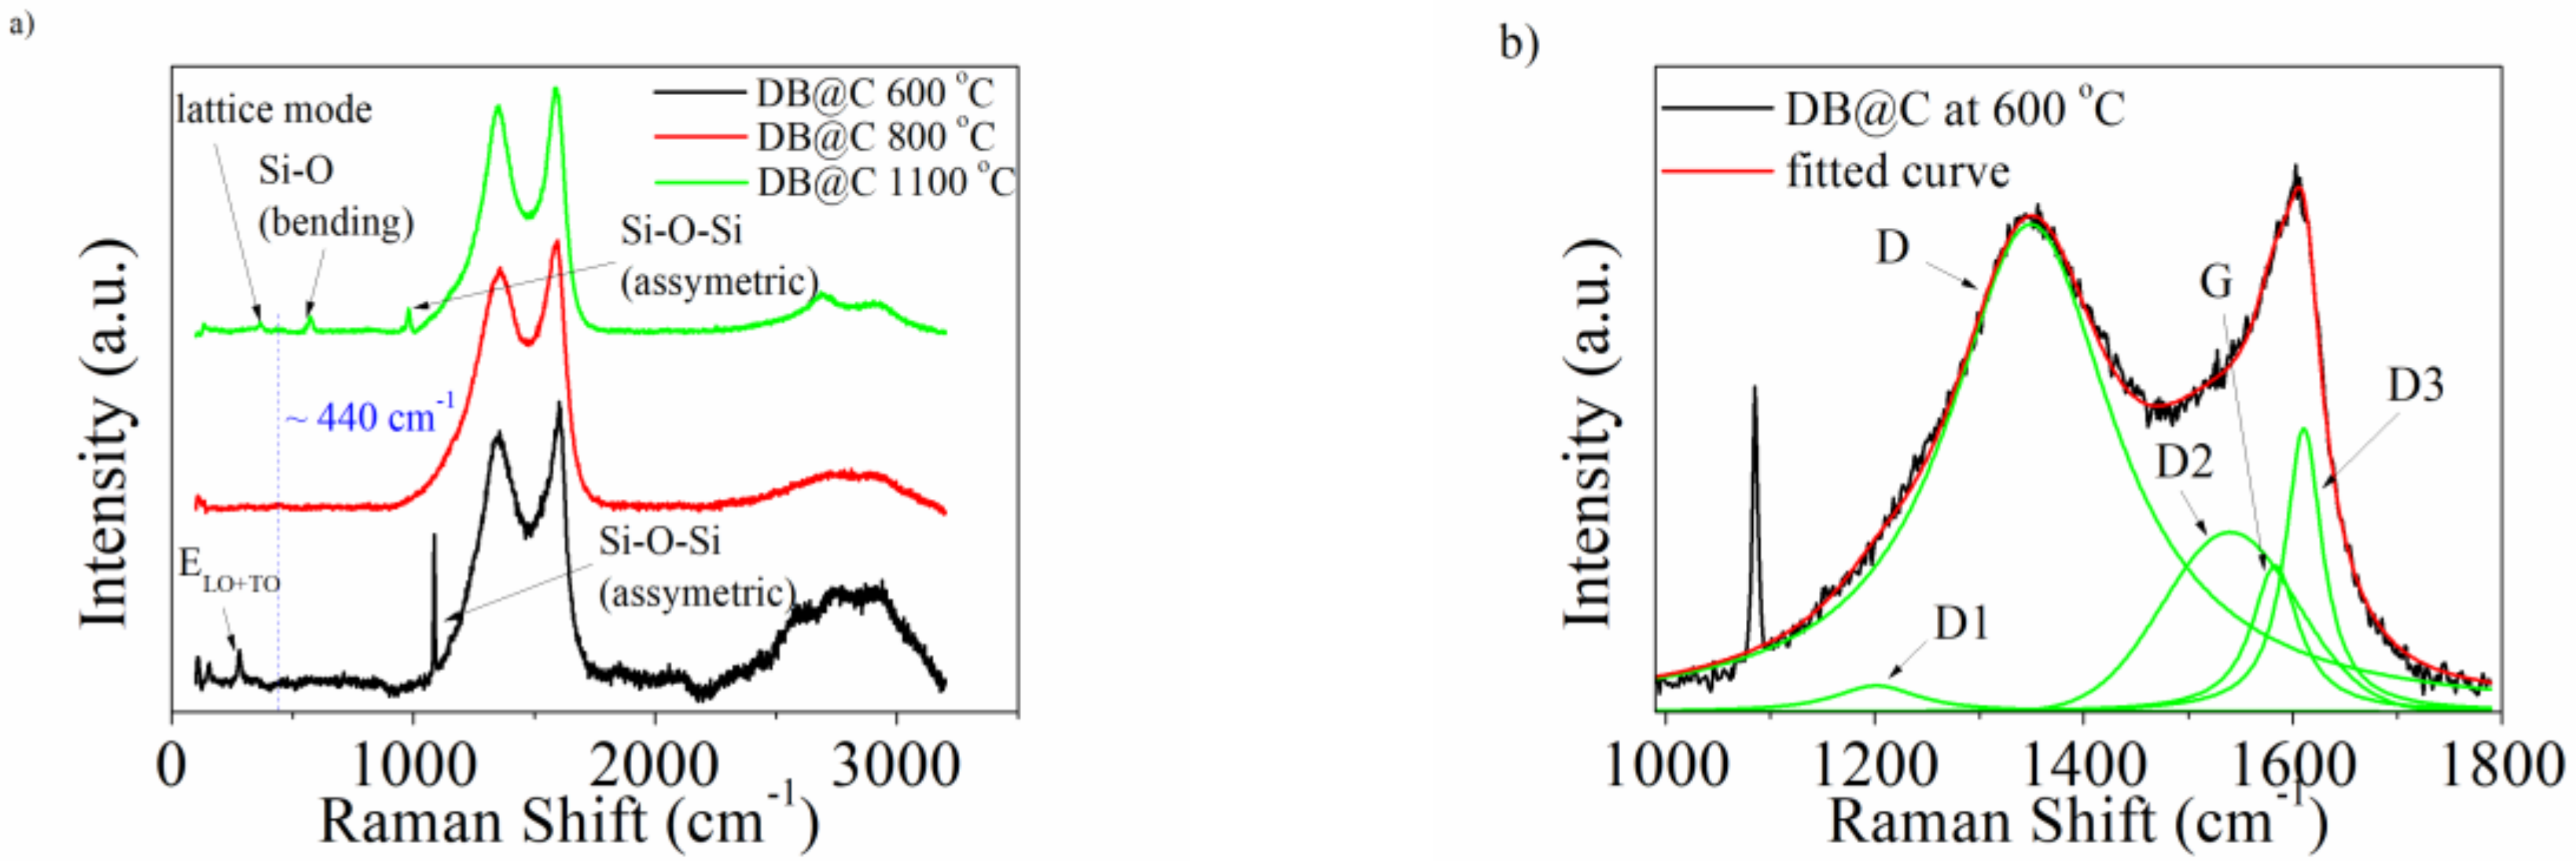
| Band | Raman Shift (cm−1) | Vibration Mode |
|---|---|---|
| D1 | ~1200 | In-plane, due to disorder or/and impurities (A1g symmetry) |
| D | ~1350 | Disordered graphitic lattice (A1g symmetry) |
| D2 | ~1500 | Amorphous/diamond like carbon (sp3 hybridized carbon) |
| G | ~1500 | In-plane, C-C stretch. (E2g symmetry) |
| D3 | ~1610 | Disordered graphitic lattice (E2g symmetry) |
| Electrode Material | Band (cm−1) | La (nm) | ||||
|---|---|---|---|---|---|---|
| D1 | D | D2 | G | D3 | ||
| DB@C at 600 °C | 1201 | 1349 | 1540 | 1583 | 1610 | 2.2 |
| DB@C at 800 °C | 1195 | 1347 | 1529 | 1578 | 1609 | 2.0 |
| DB@C at 1100 °C | 1183 | 1347 | 1535 | 1581 | 1611 | 1.7 |
| Material | Final Discharge Capacity at Current Density | |||
|---|---|---|---|---|
| 40 mA g−1 | 100 mA g−1 | 500 mA g−1 | 40 mA g−1 | |
| DB@C at 600 °C | 450 | 340 | 240 | 460 |
| DB@C at 800 °C | 350 | 240 | 160 | 350 |
| DB@C at 1100 °C | 340 | 230 | 150 | 320 |
© 2020 by the authors. Licensee MDPI, Basel, Switzerland. This article is an open access article distributed under the terms and conditions of the Creative Commons Attribution (CC BY) license (http://creativecommons.org/licenses/by/4.0/).
Share and Cite
Nowak, A.P.; Sprynskyy, M.; Wojtczak, I.; Trzciński, K.; Wysocka, J.; Szkoda, M.; Buszewski, B.; Lisowska-Oleksiak, A. Diatoms Biomass as a Joint Source of Biosilica and Carbon for Lithium-Ion Battery Anodes. Materials 2020, 13, 1673. https://doi.org/10.3390/ma13071673
Nowak AP, Sprynskyy M, Wojtczak I, Trzciński K, Wysocka J, Szkoda M, Buszewski B, Lisowska-Oleksiak A. Diatoms Biomass as a Joint Source of Biosilica and Carbon for Lithium-Ion Battery Anodes. Materials. 2020; 13(7):1673. https://doi.org/10.3390/ma13071673
Chicago/Turabian StyleNowak, Andrzej P., Myroslav Sprynskyy, Izabela Wojtczak, Konrad Trzciński, Joanna Wysocka, Mariusz Szkoda, Bogusław Buszewski, and Anna Lisowska-Oleksiak. 2020. "Diatoms Biomass as a Joint Source of Biosilica and Carbon for Lithium-Ion Battery Anodes" Materials 13, no. 7: 1673. https://doi.org/10.3390/ma13071673
APA StyleNowak, A. P., Sprynskyy, M., Wojtczak, I., Trzciński, K., Wysocka, J., Szkoda, M., Buszewski, B., & Lisowska-Oleksiak, A. (2020). Diatoms Biomass as a Joint Source of Biosilica and Carbon for Lithium-Ion Battery Anodes. Materials, 13(7), 1673. https://doi.org/10.3390/ma13071673