Material Analysis of Steel Fibre Reinforced High-Strength Concrete in Terms of Flexural Behaviour. Experimental and Numerical Investigation


Abstract
1. Introduction
2. Experimental Research
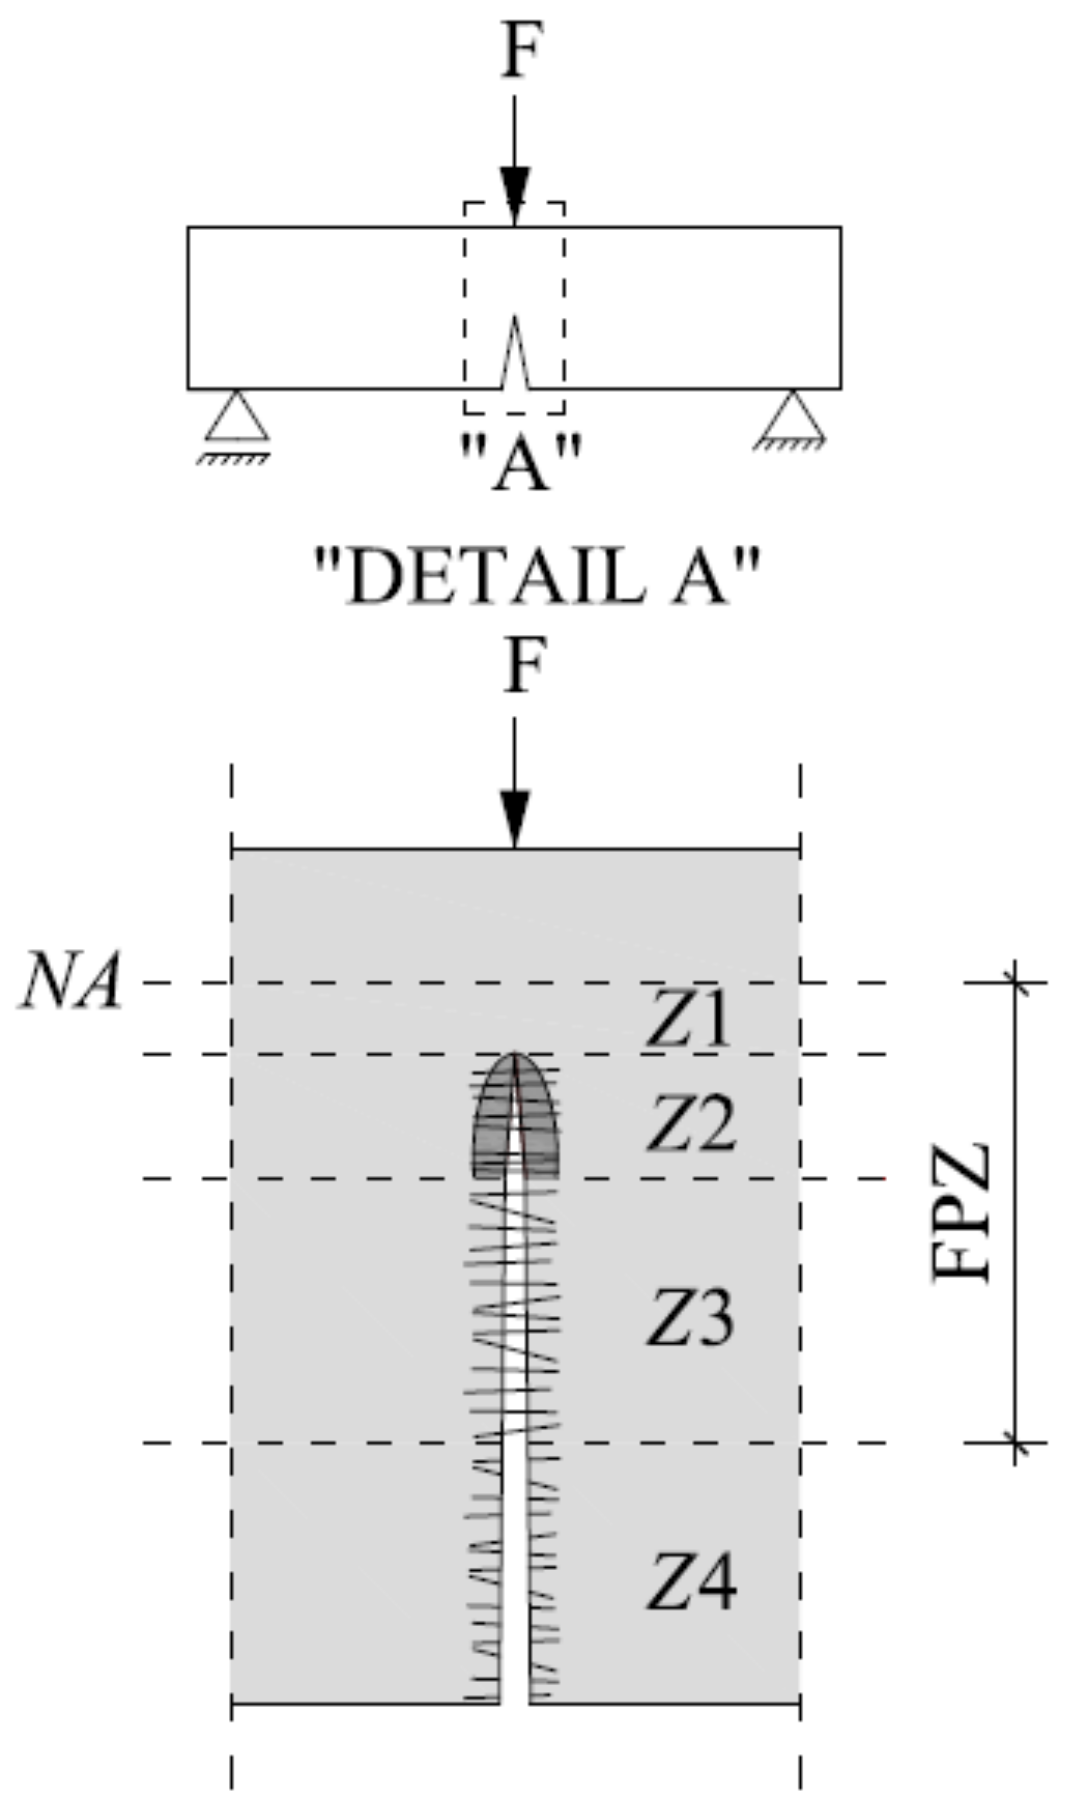
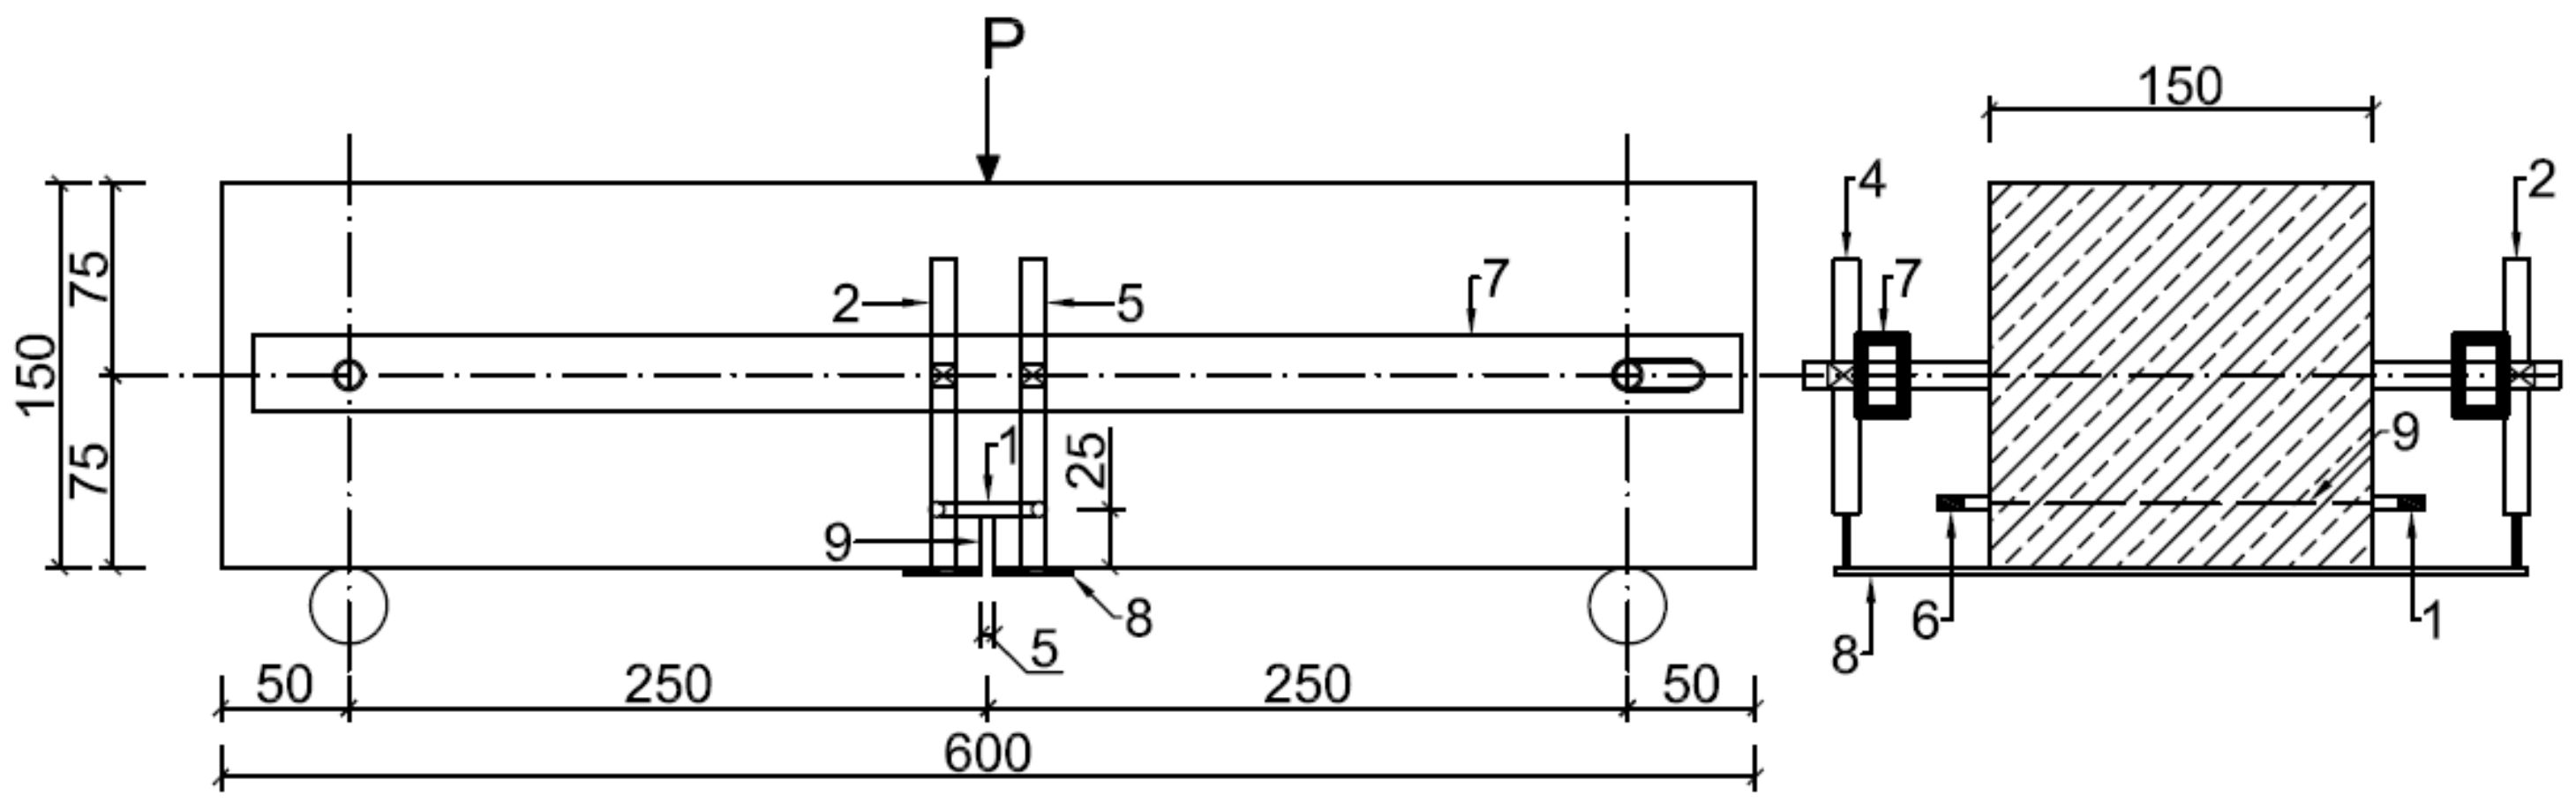
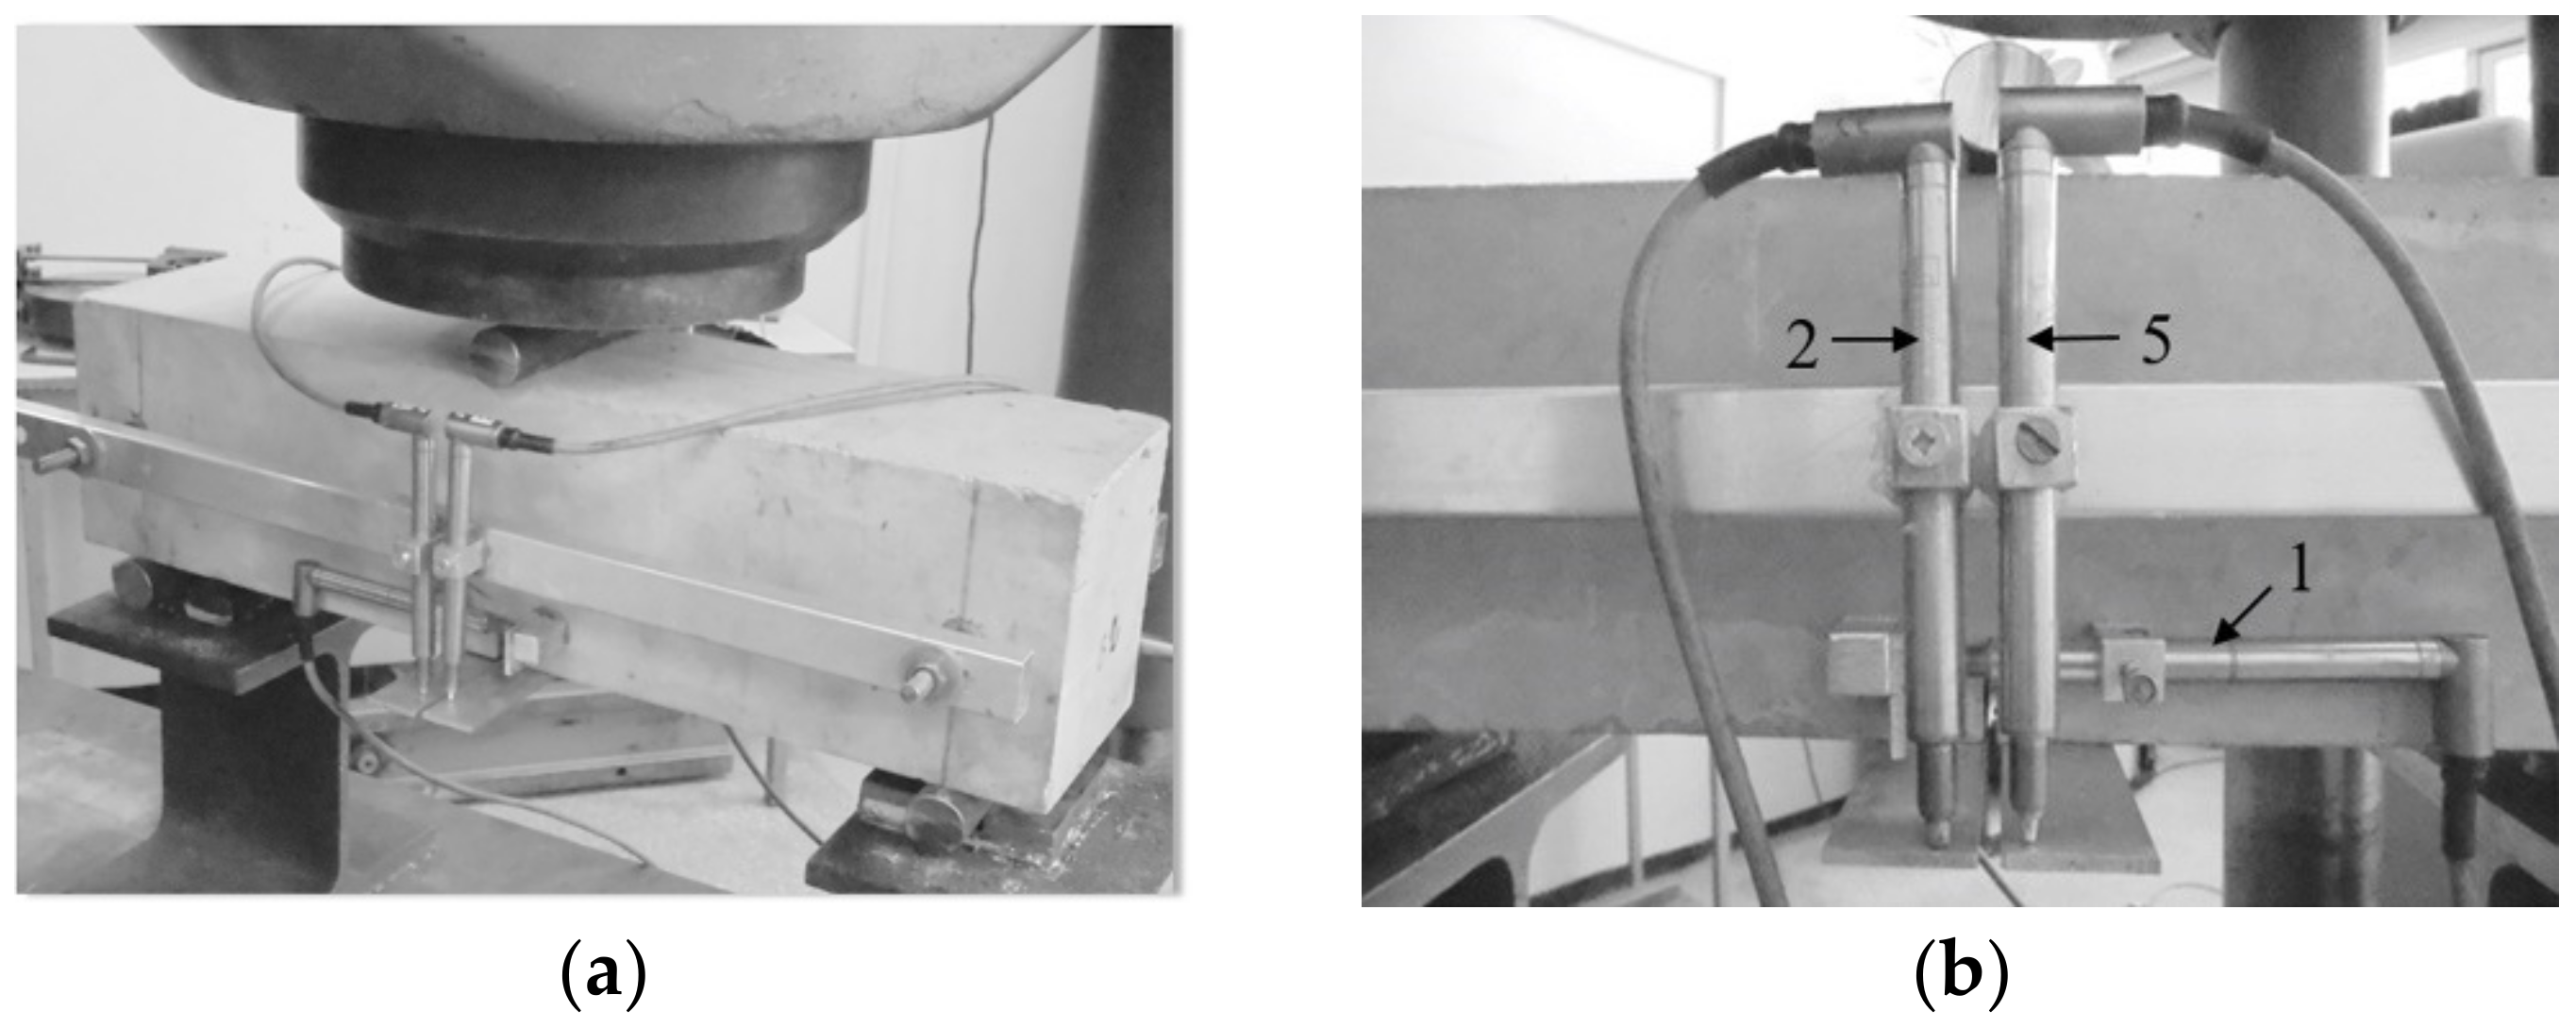
2.1. Materials and Methods
- l—beam span;
- b—beam width; and,
- hsp—beam height less notch height.
2.2. Experimental Results and Discussion
2.2.1. Results of Tests for Mechanical Features
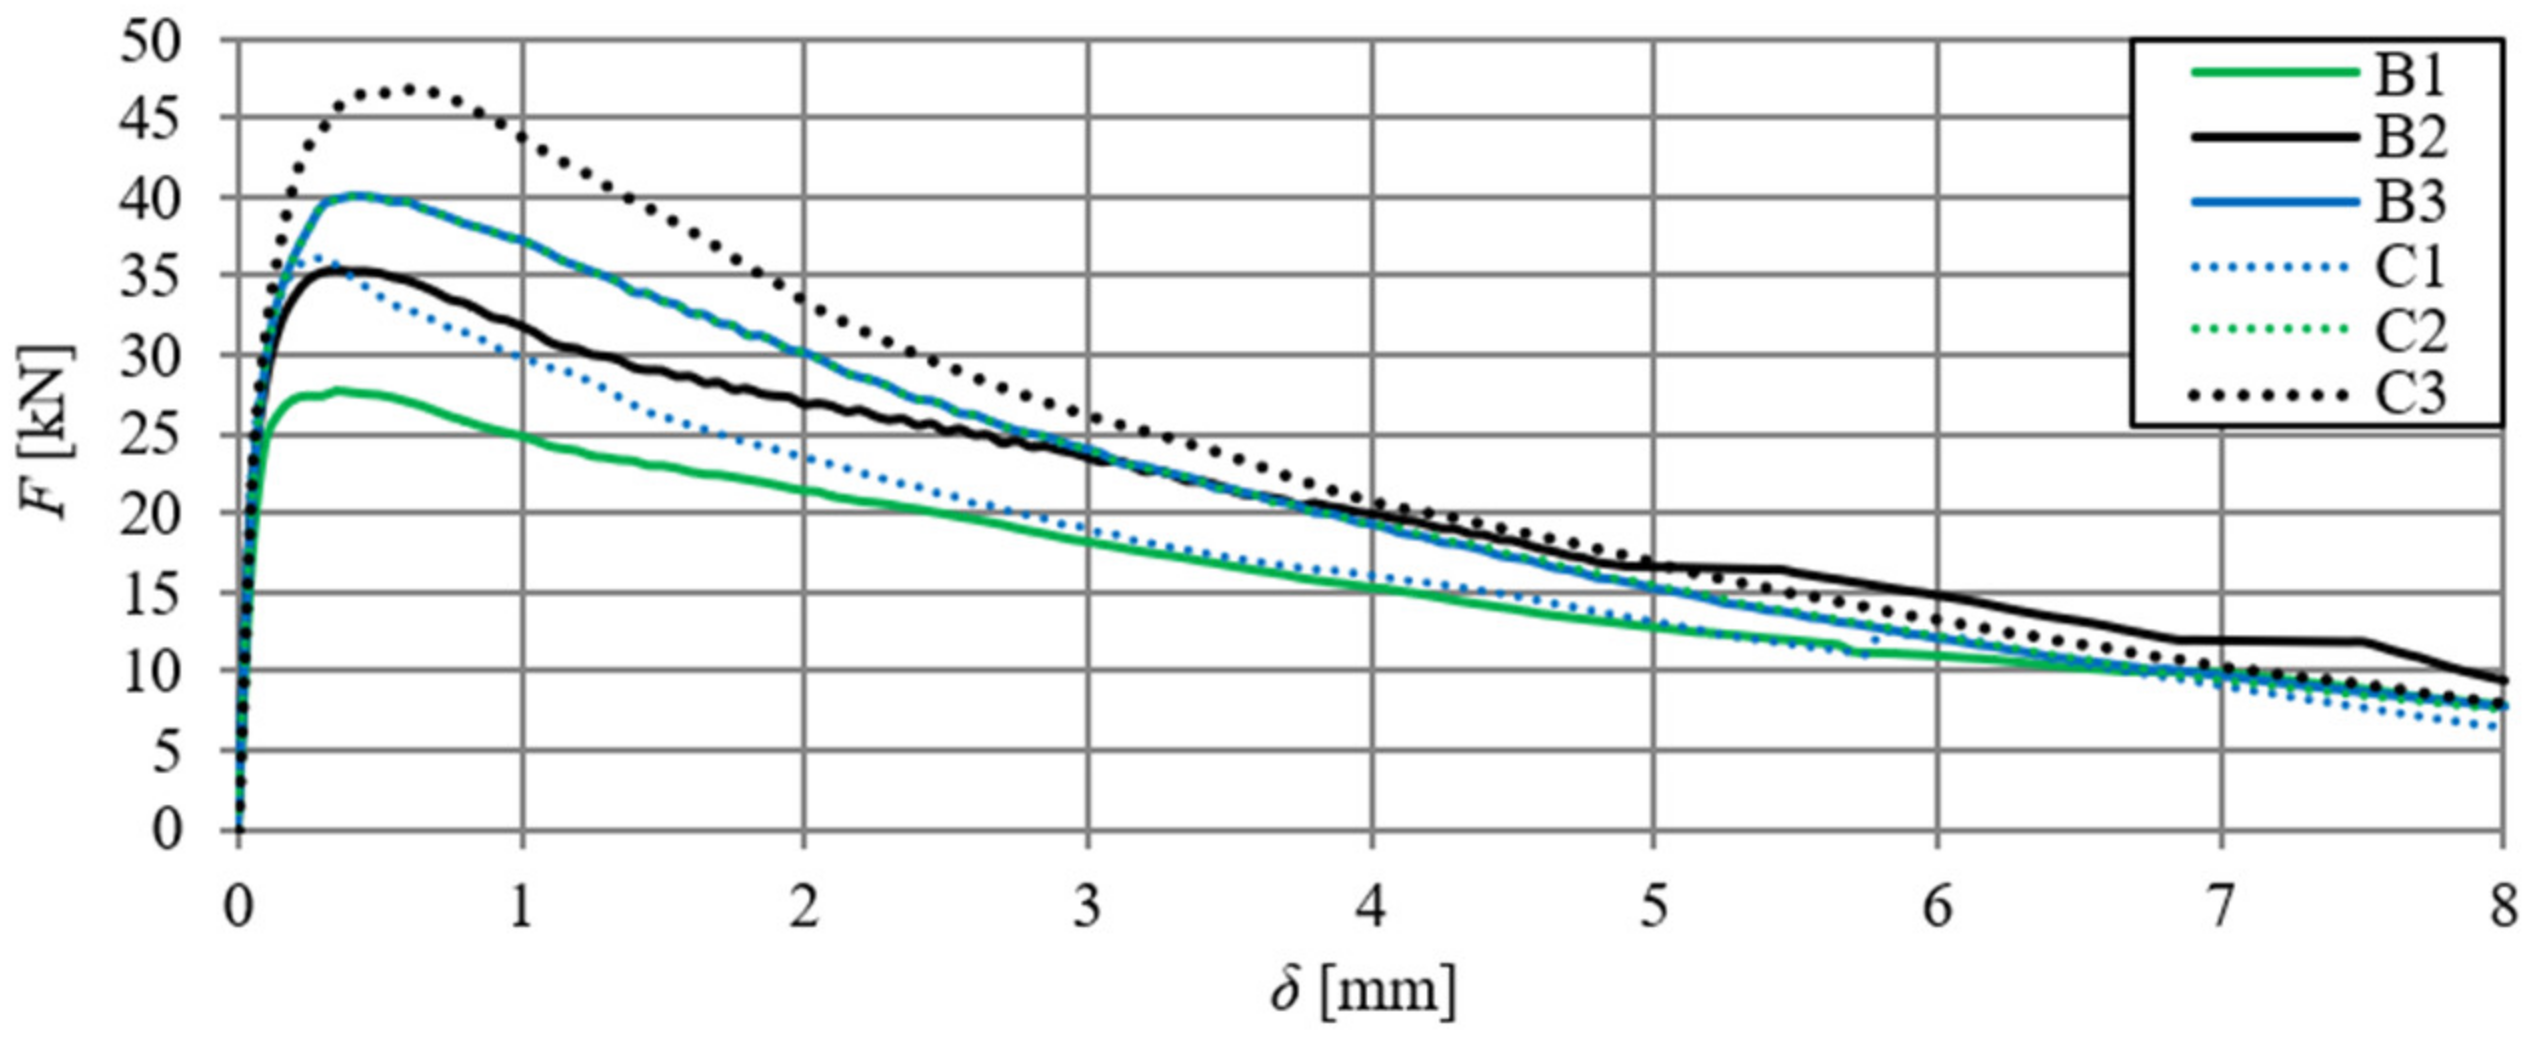
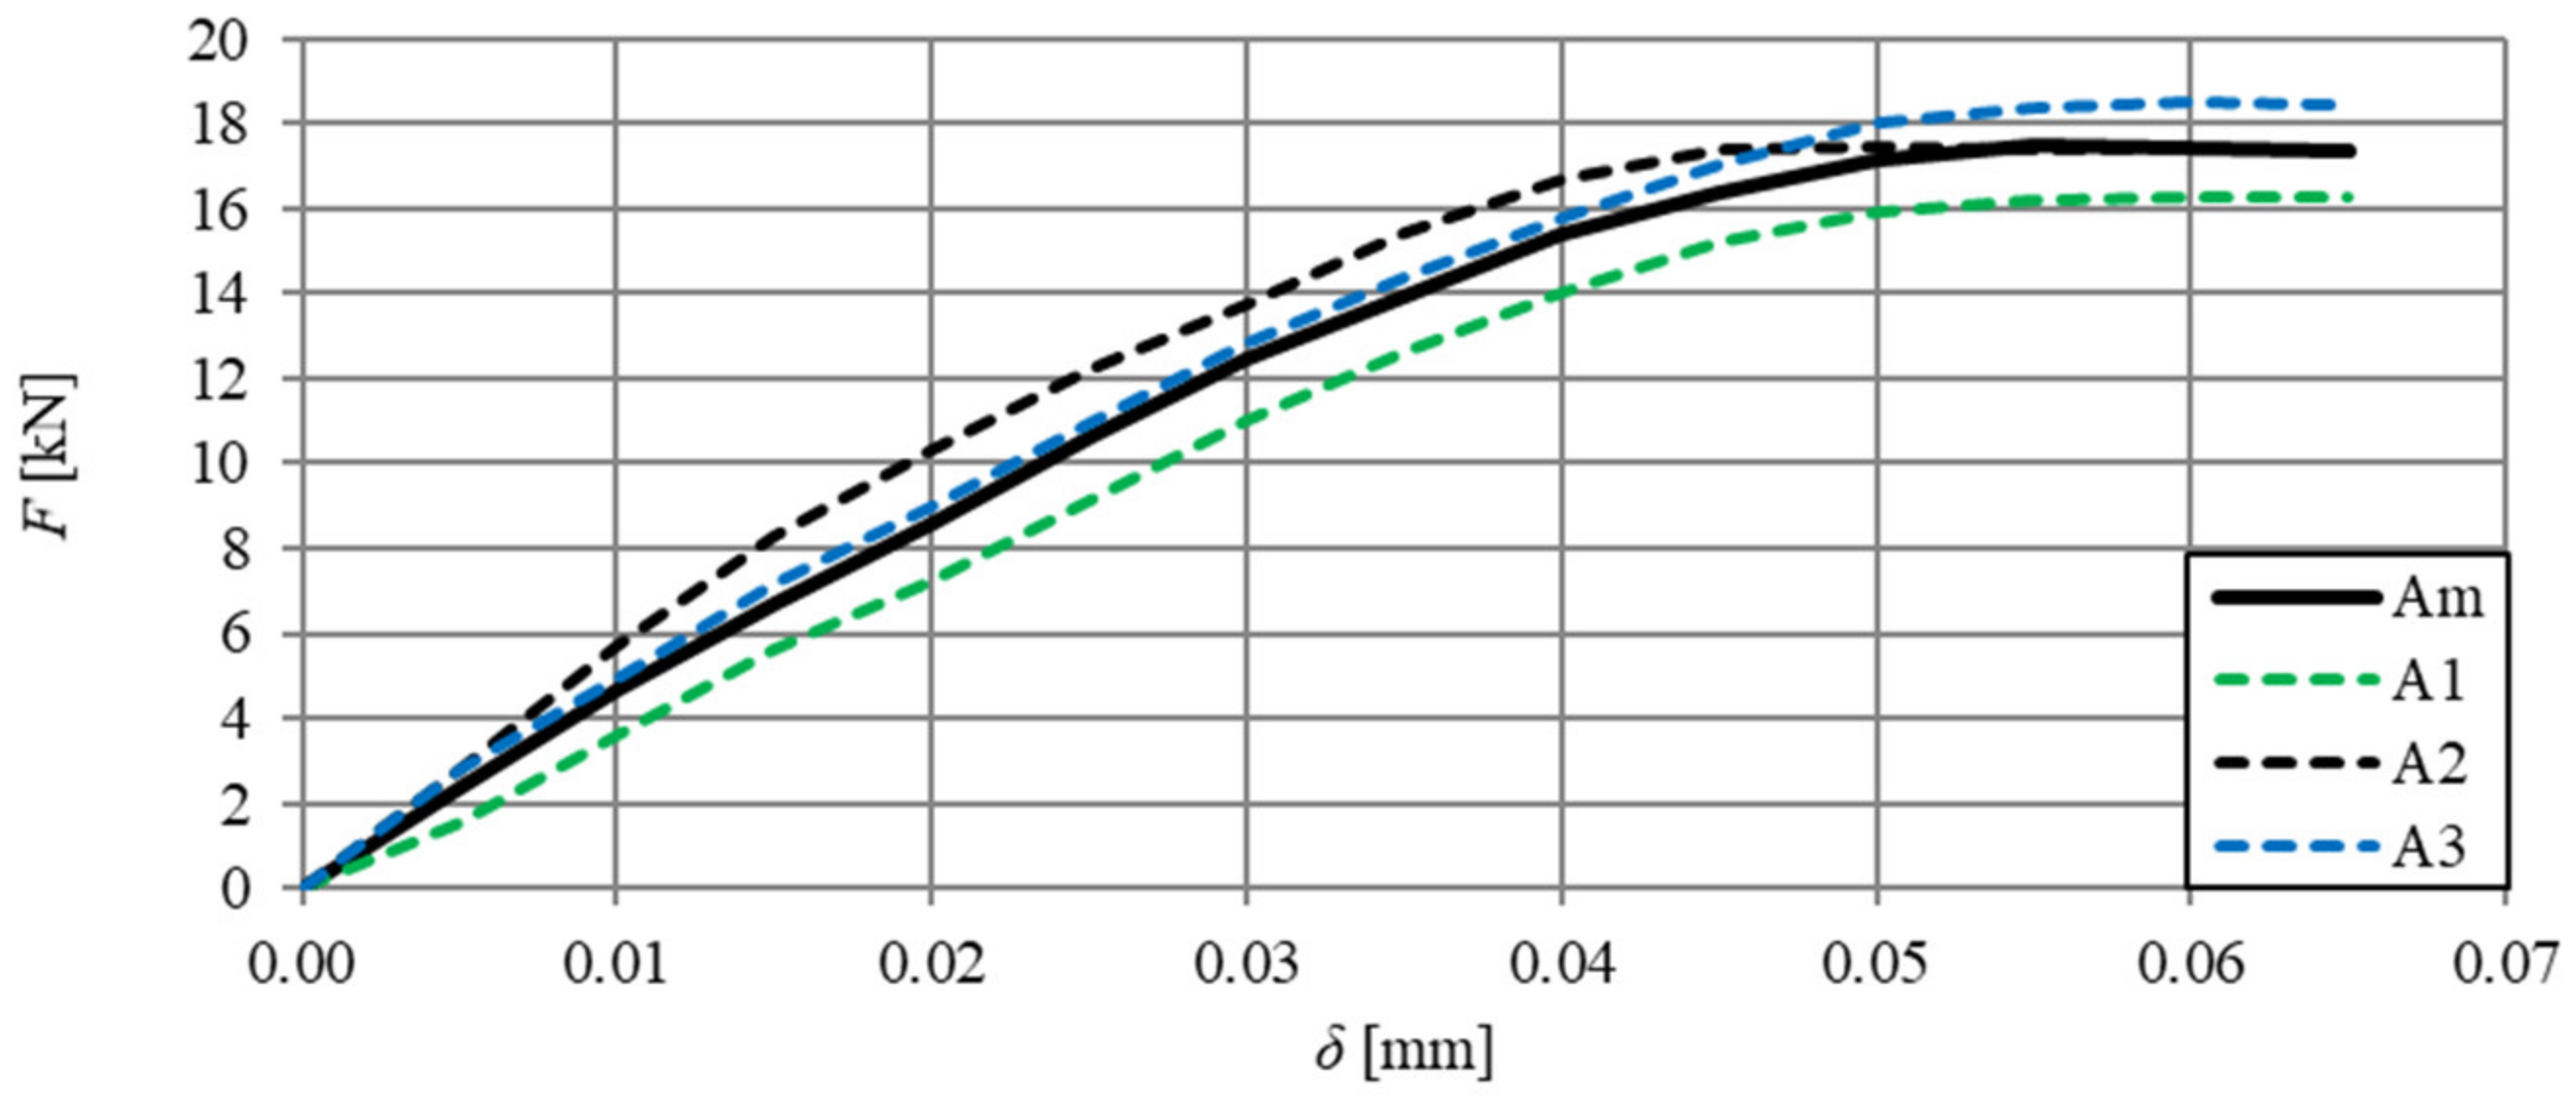
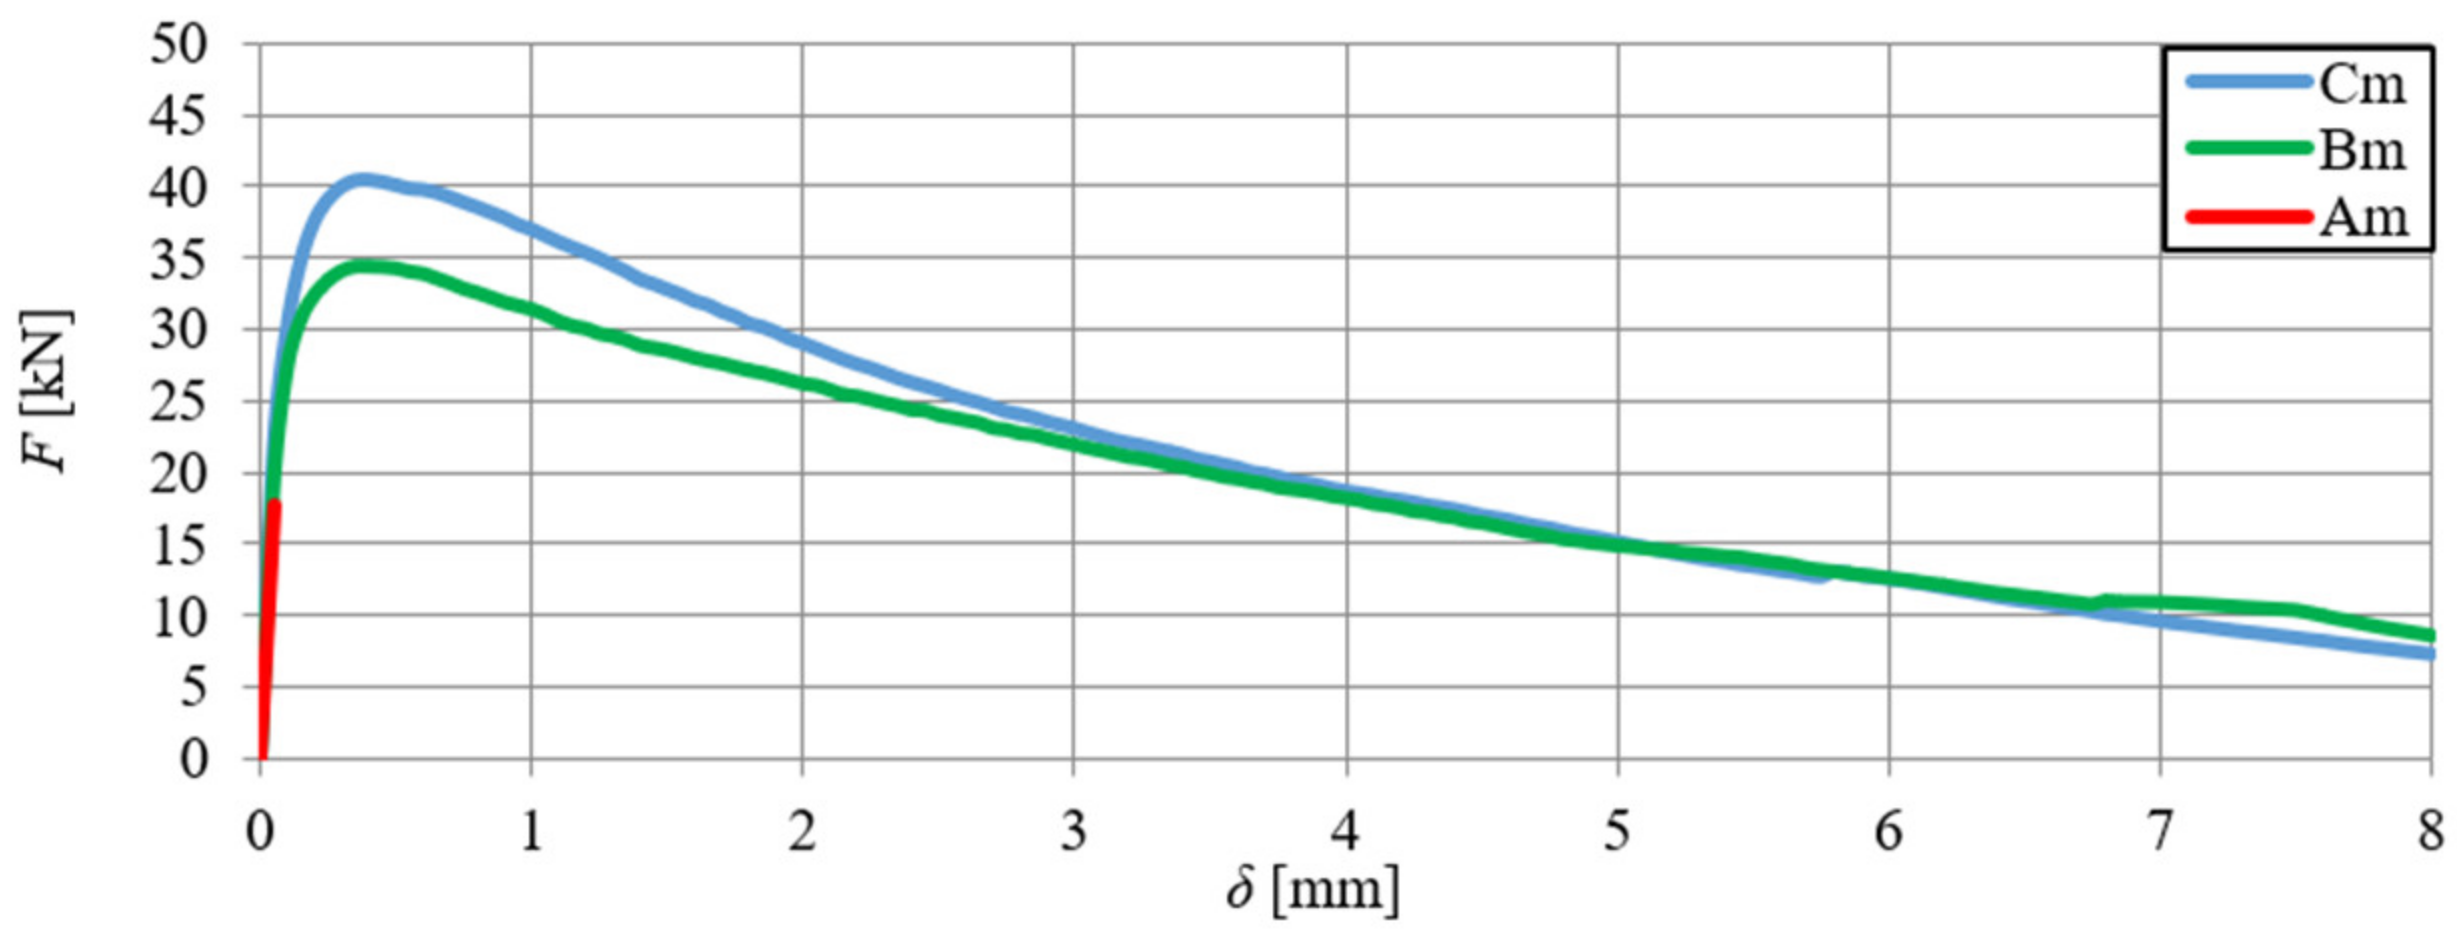
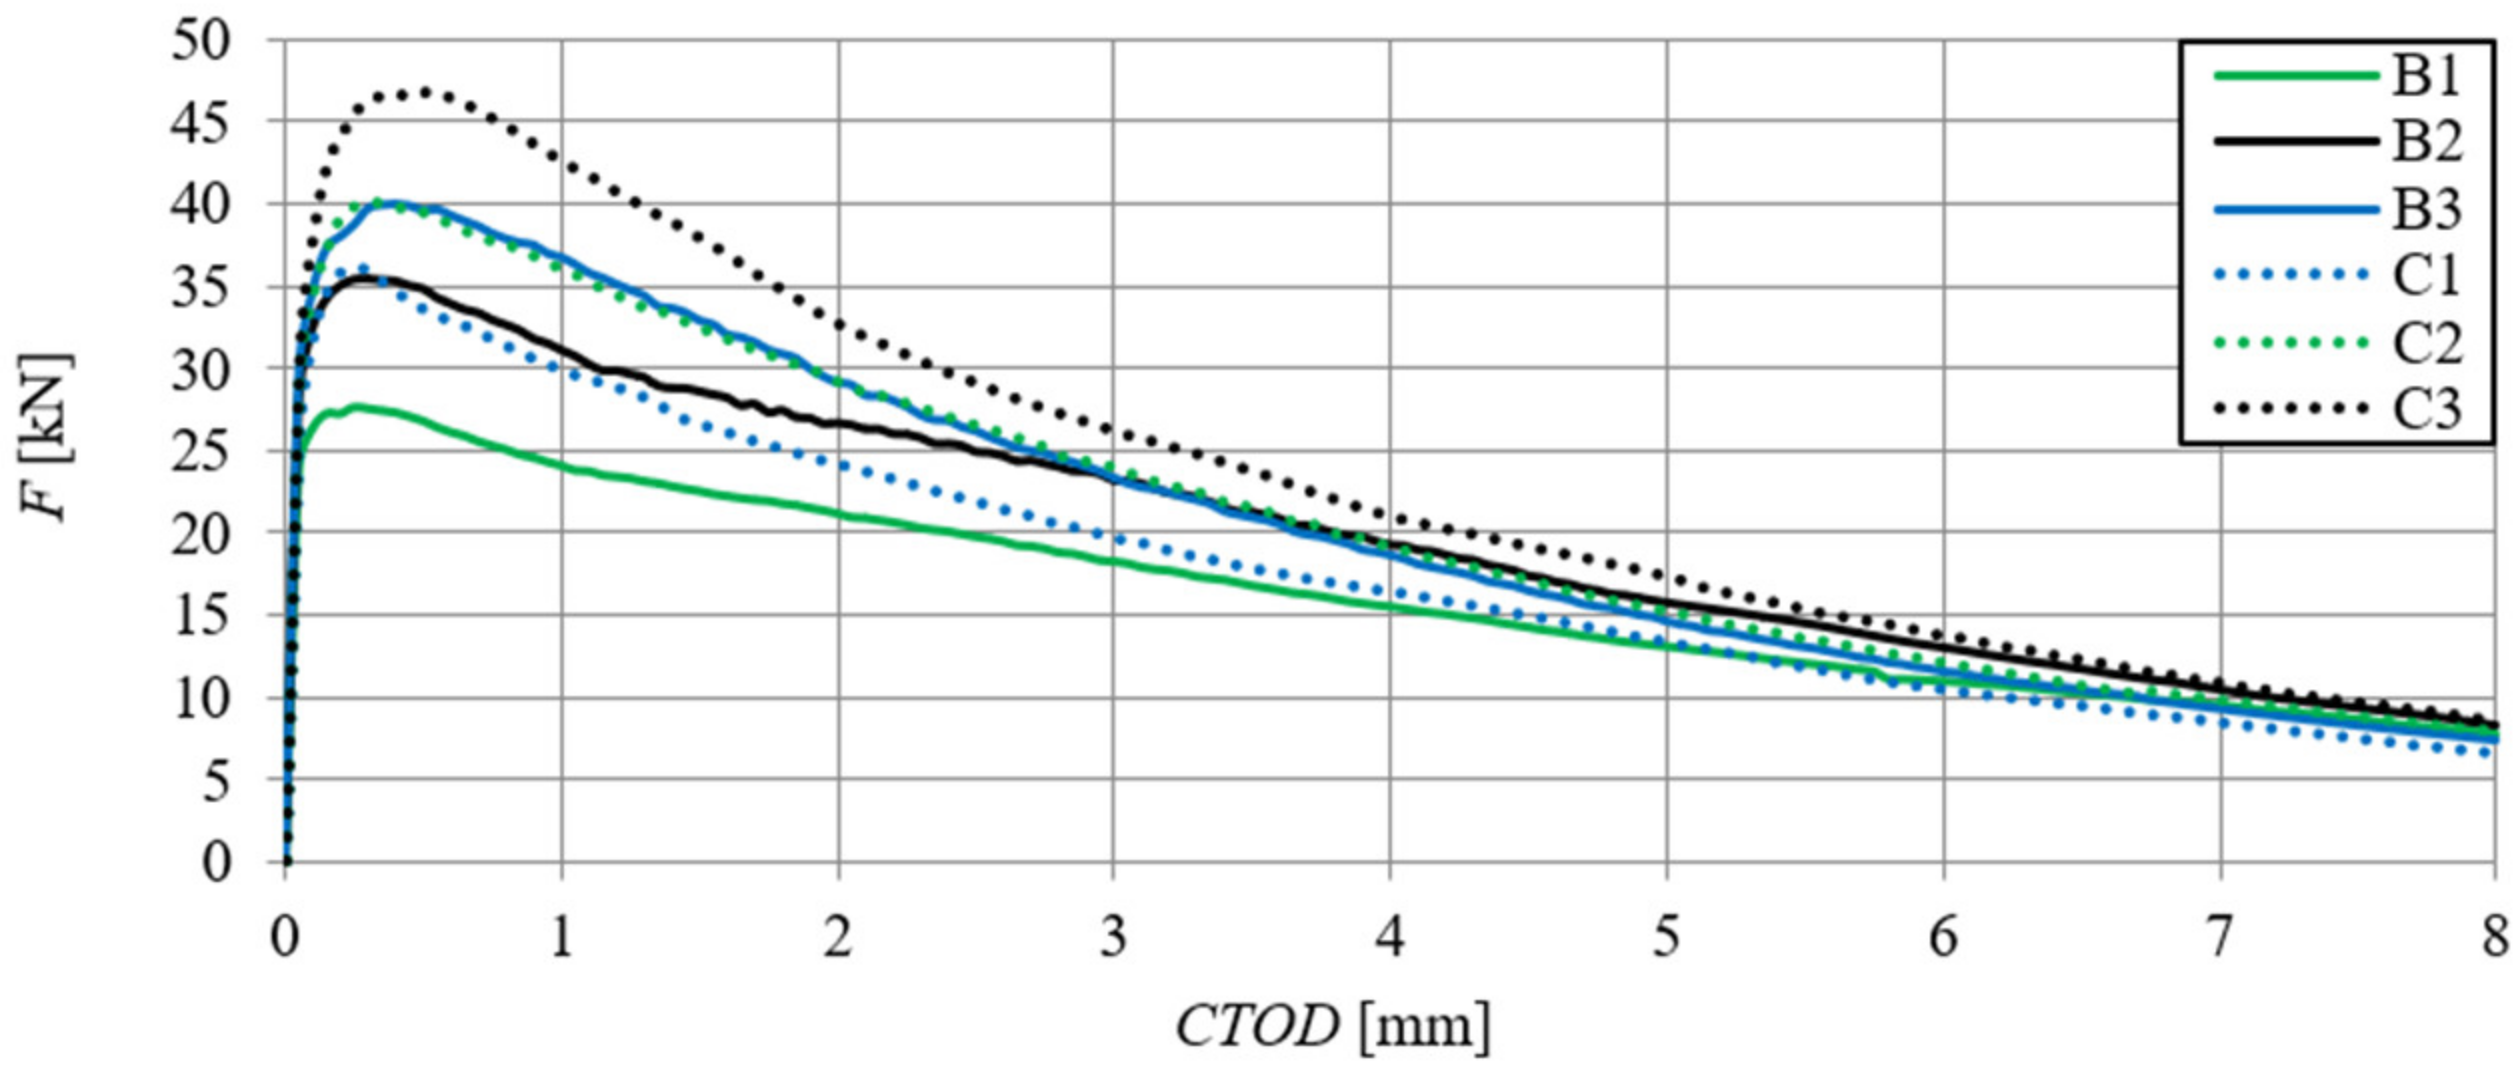
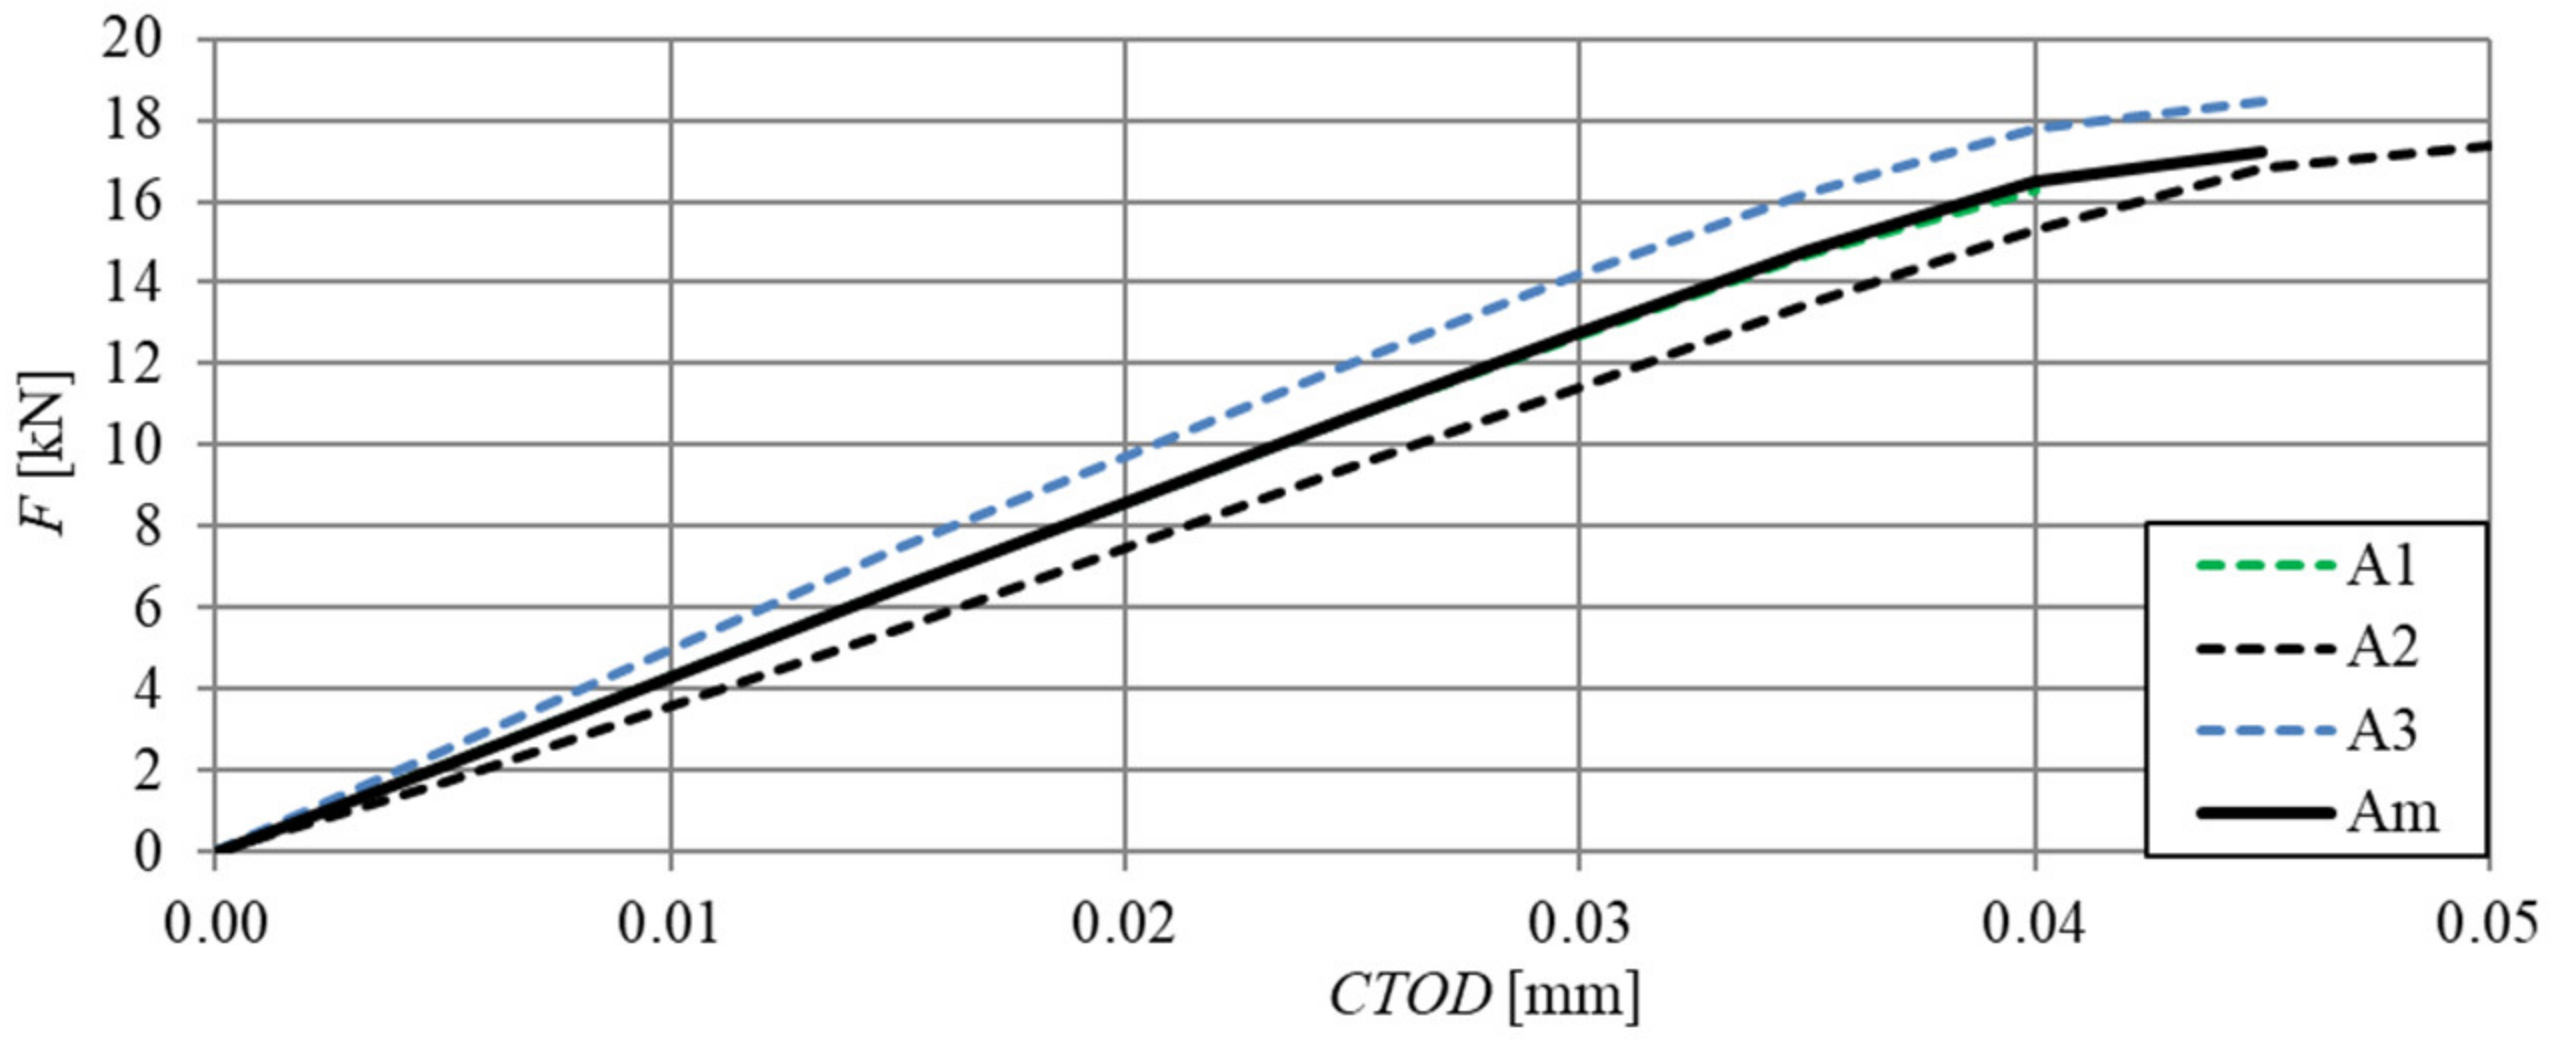
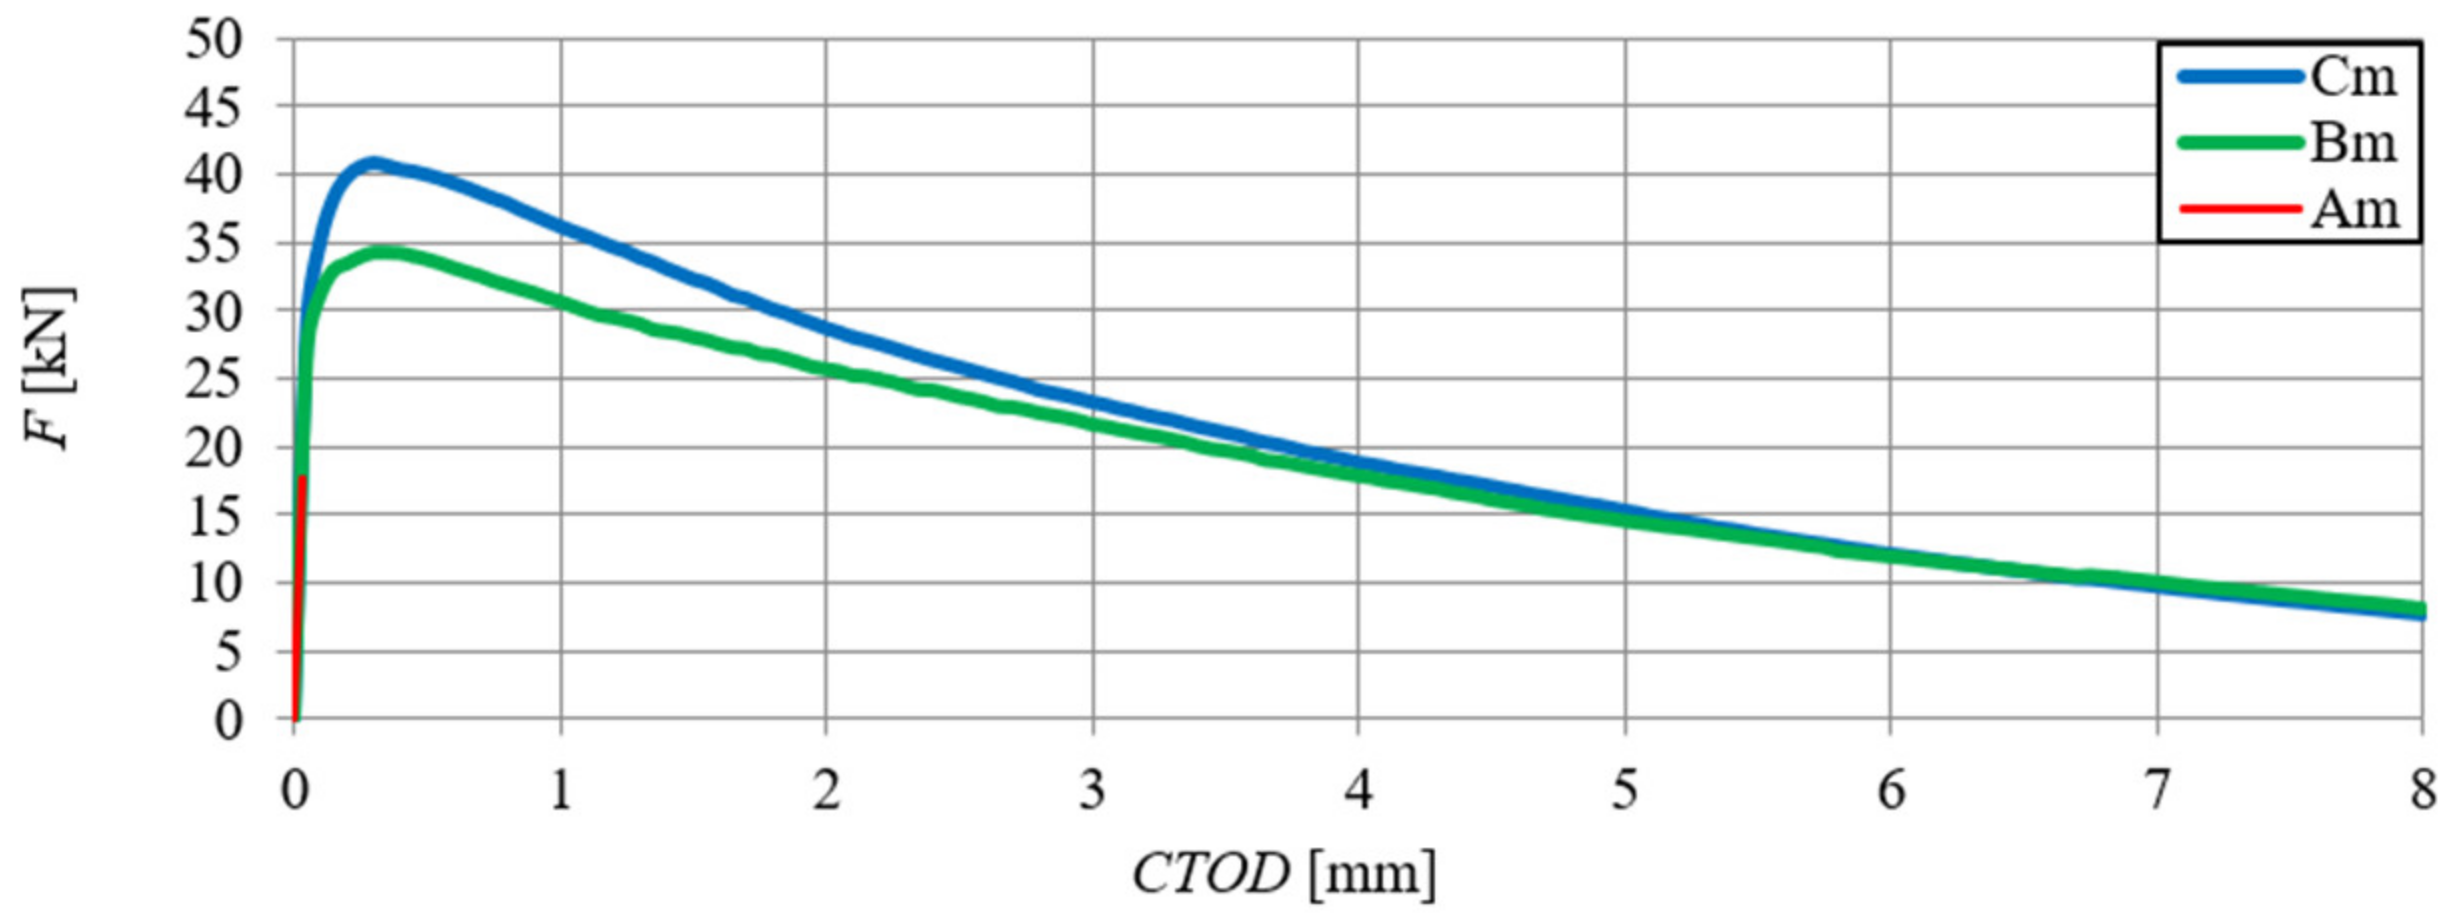
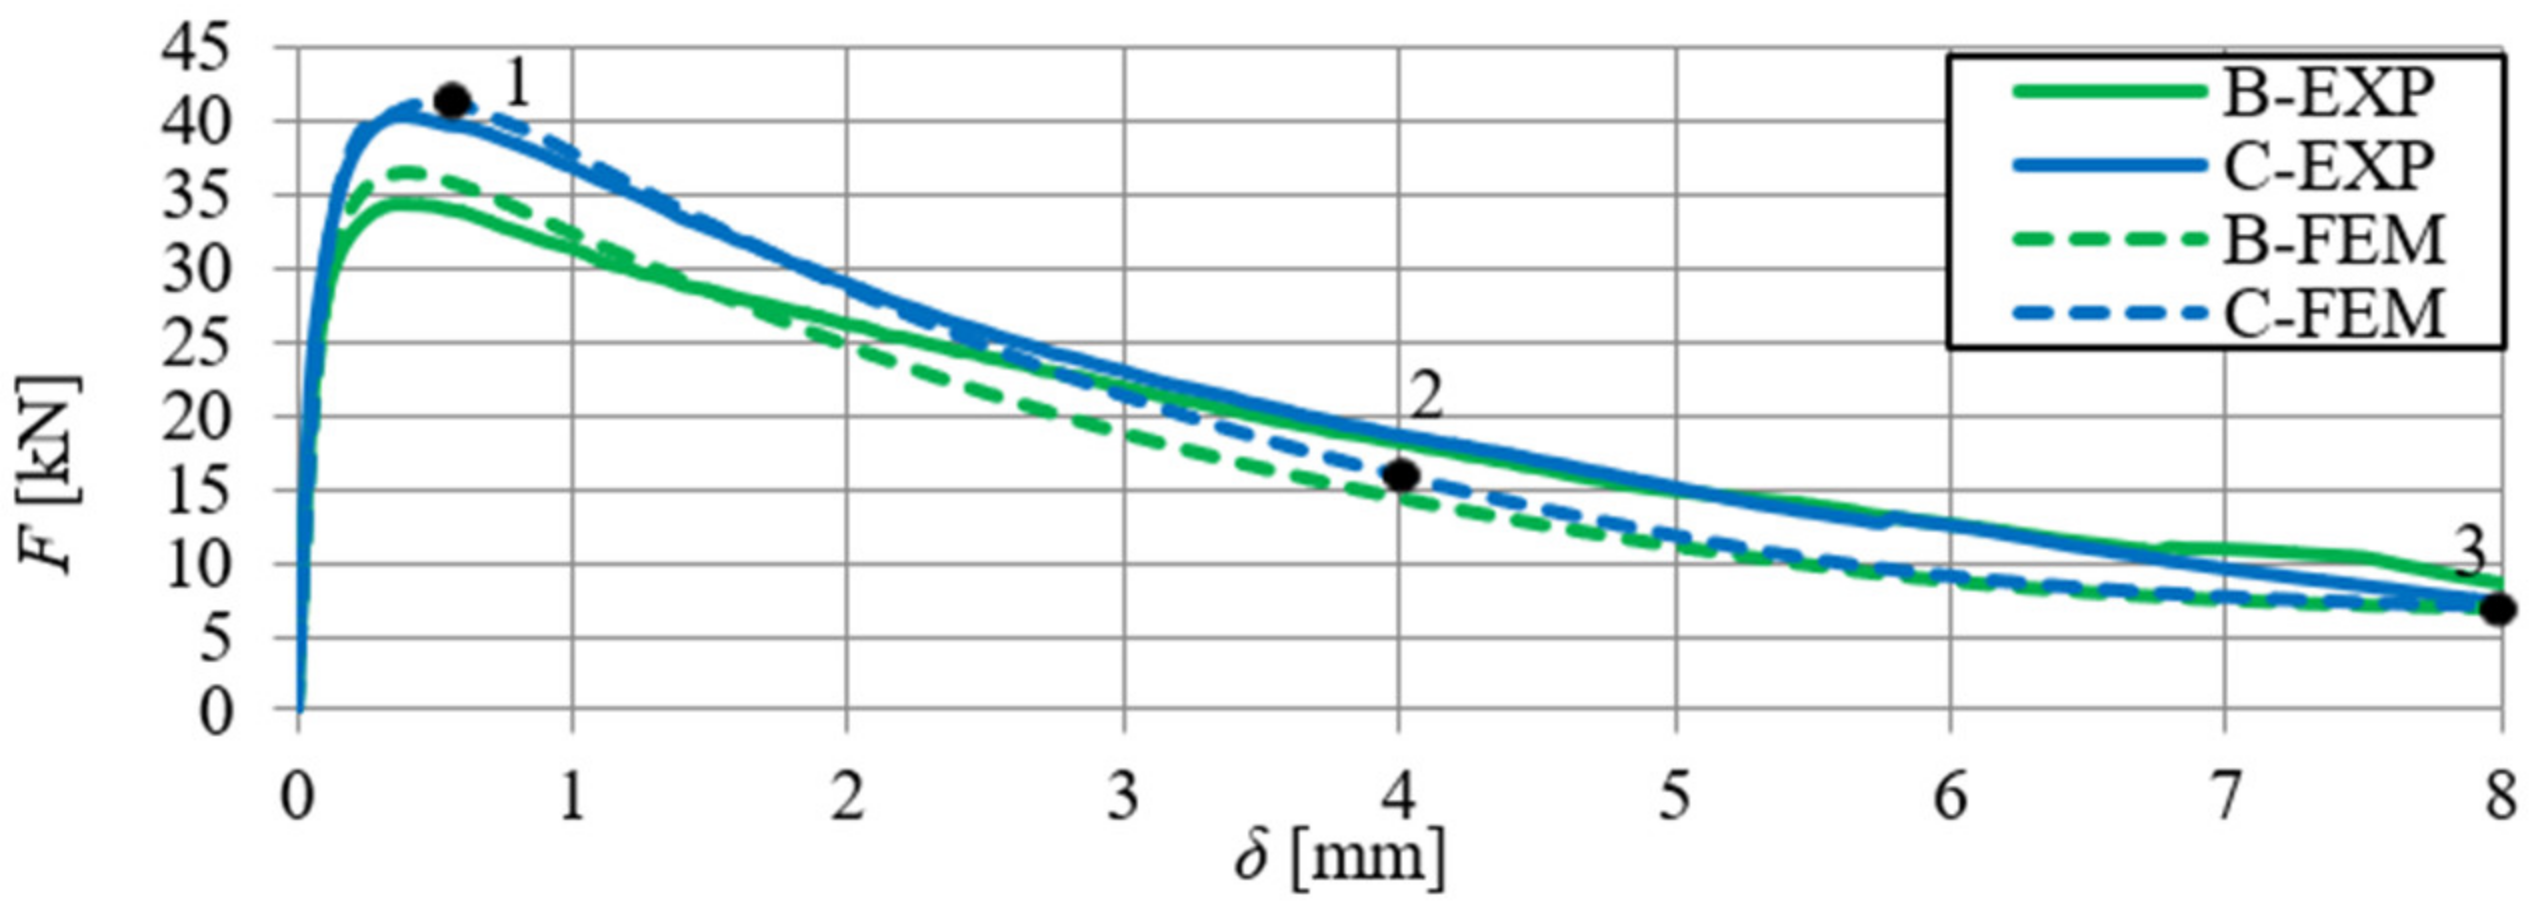
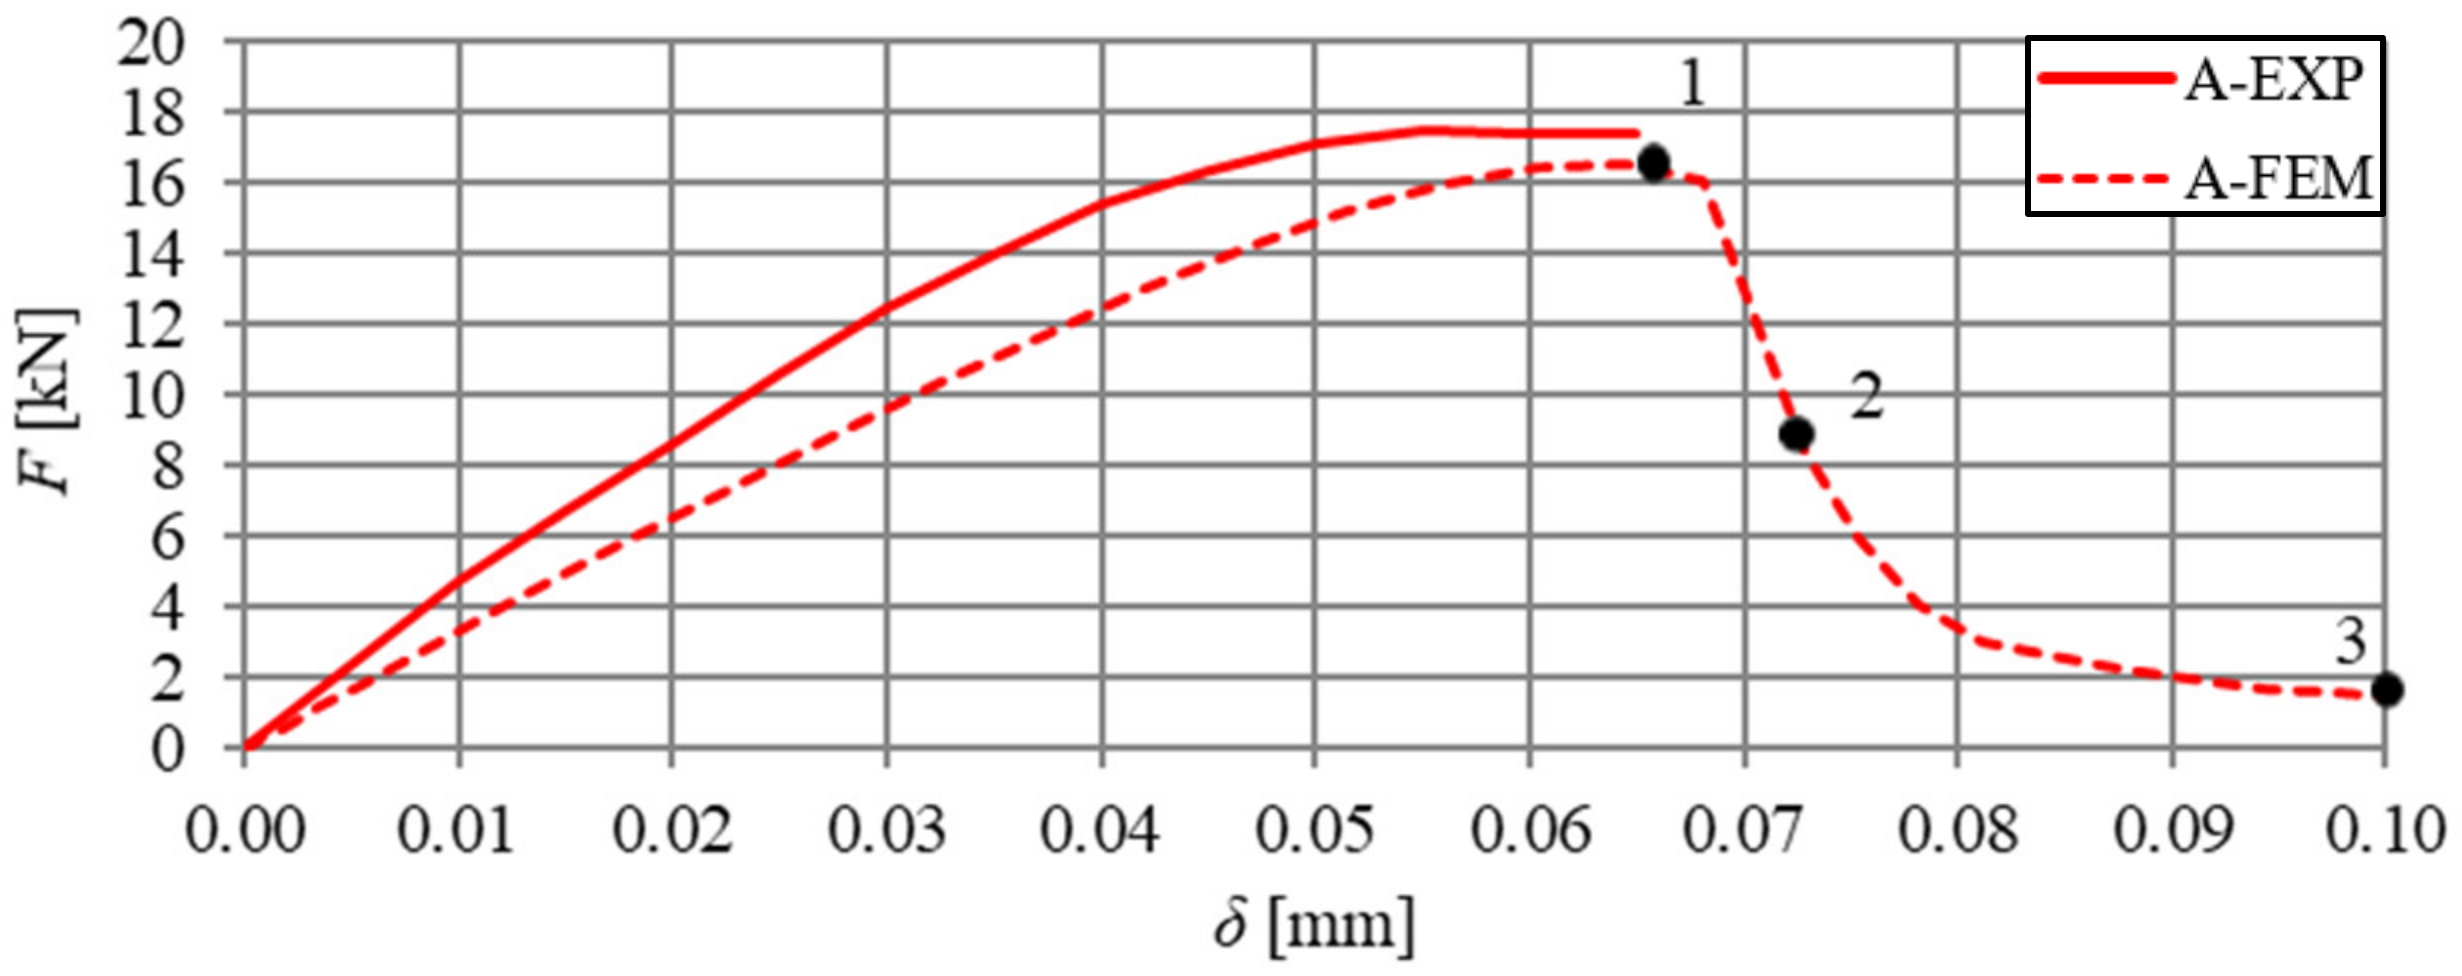
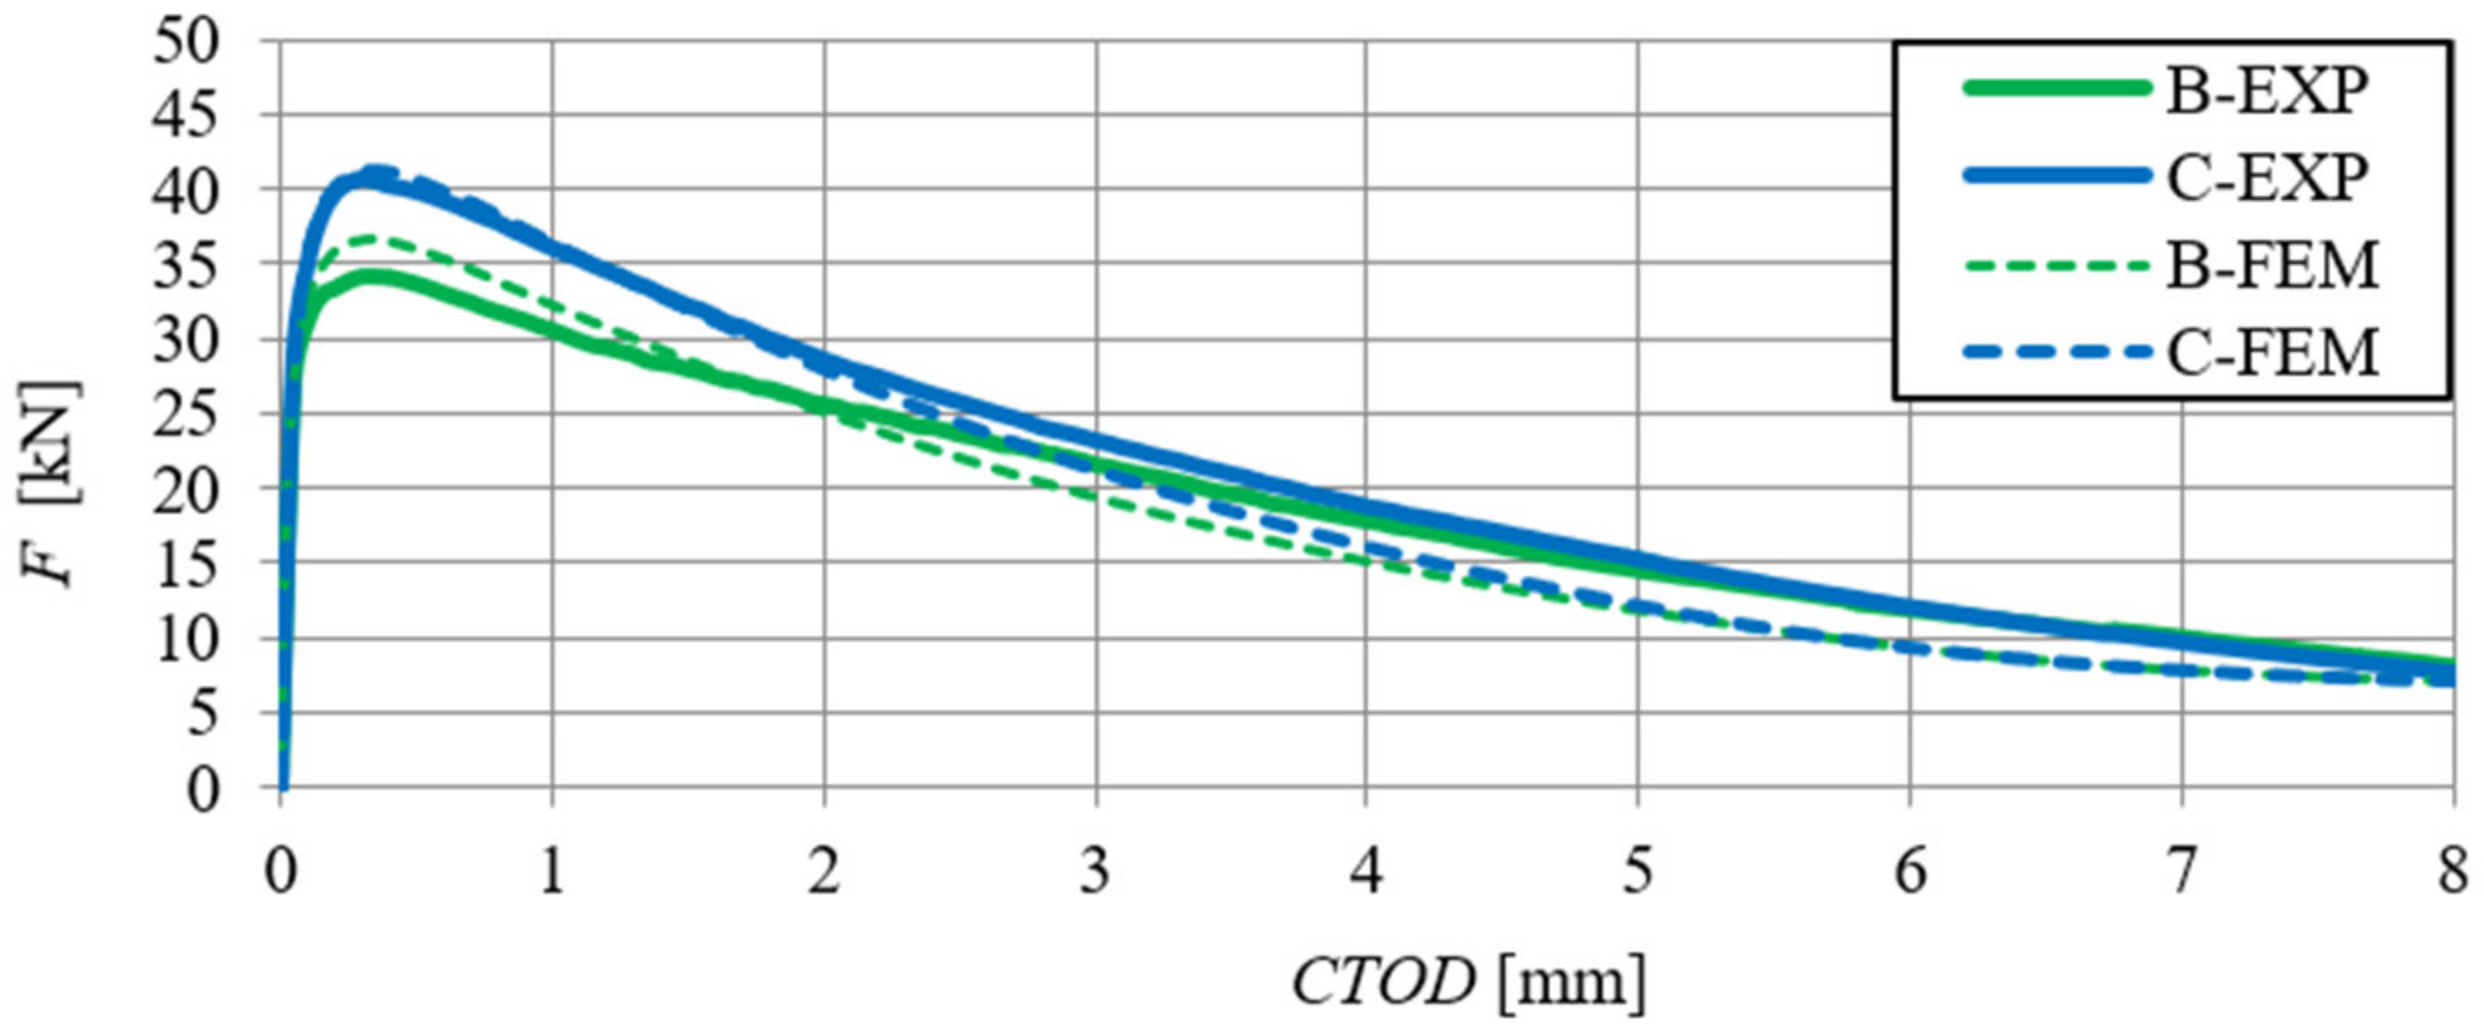
2.2.2. F–δ and F–CTOD Relationship
2.2.3. Fracture energy of HSC and SFRHSC
3. Numerical Analysis of Beams
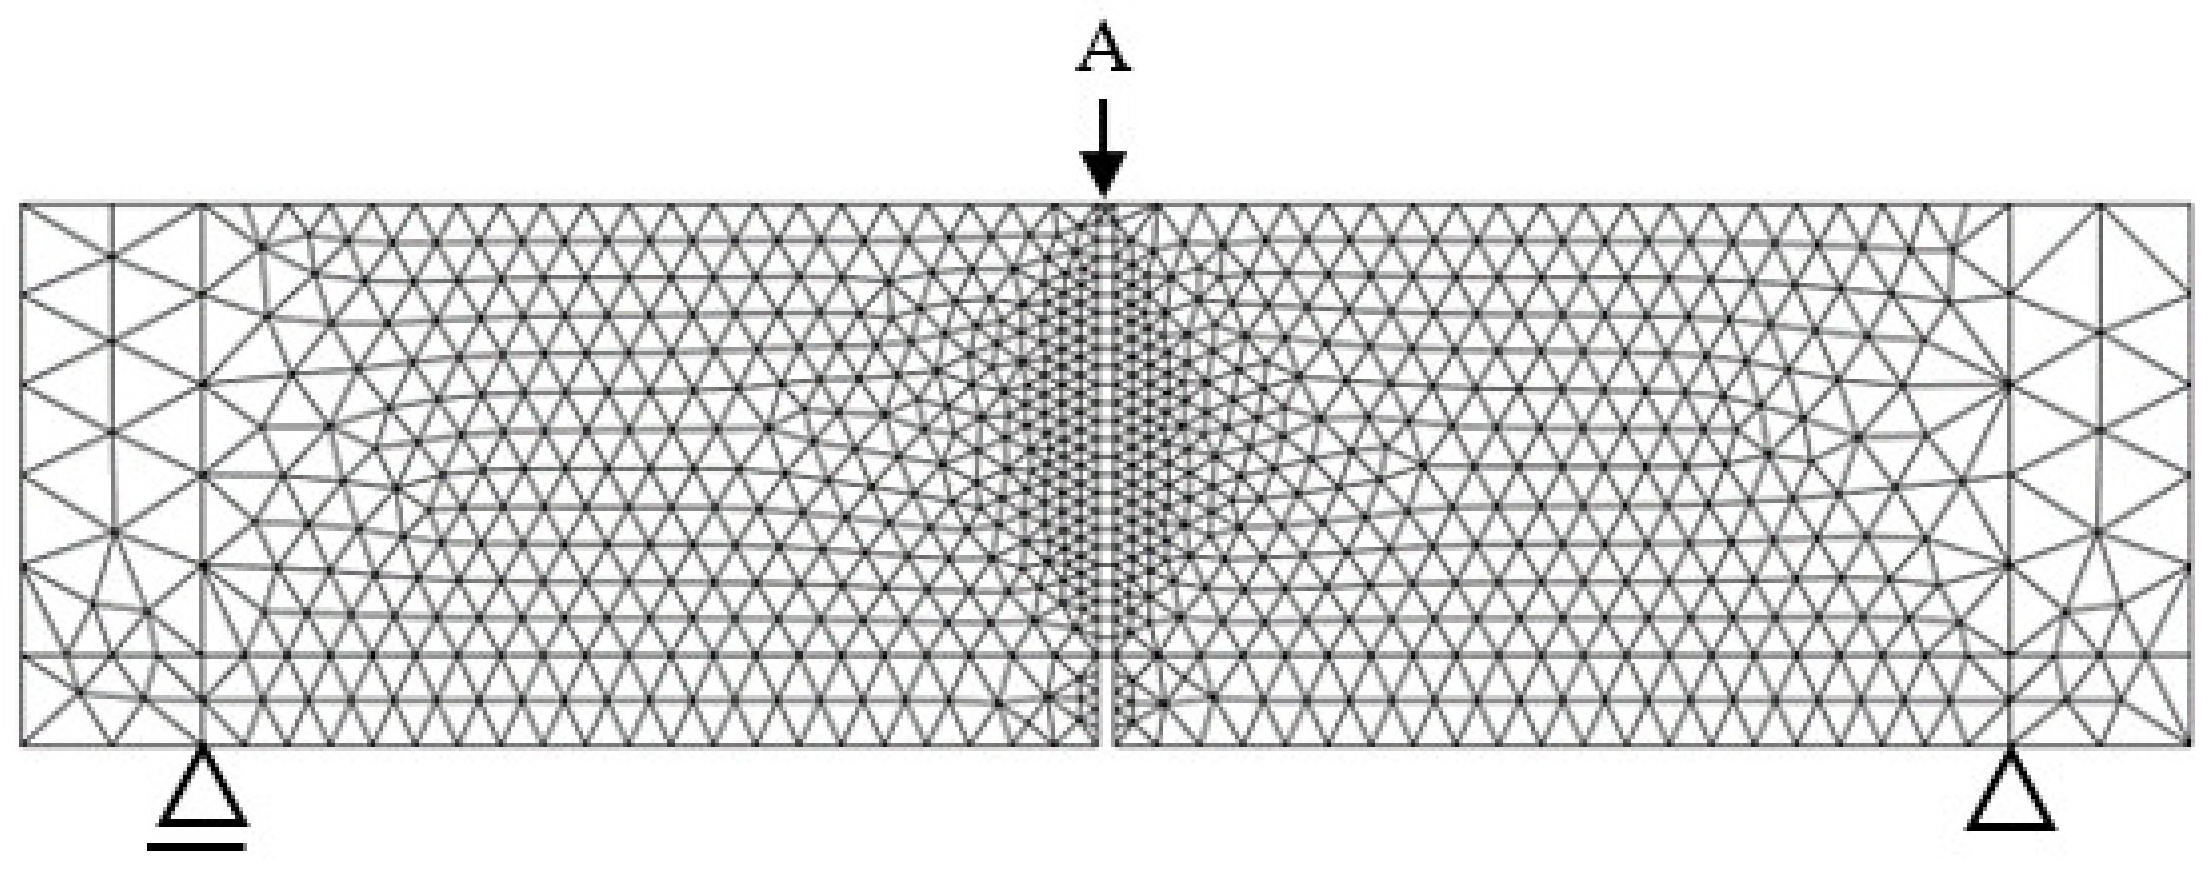
3.1. Assumptions for the Numerical Model and Geometrical Model
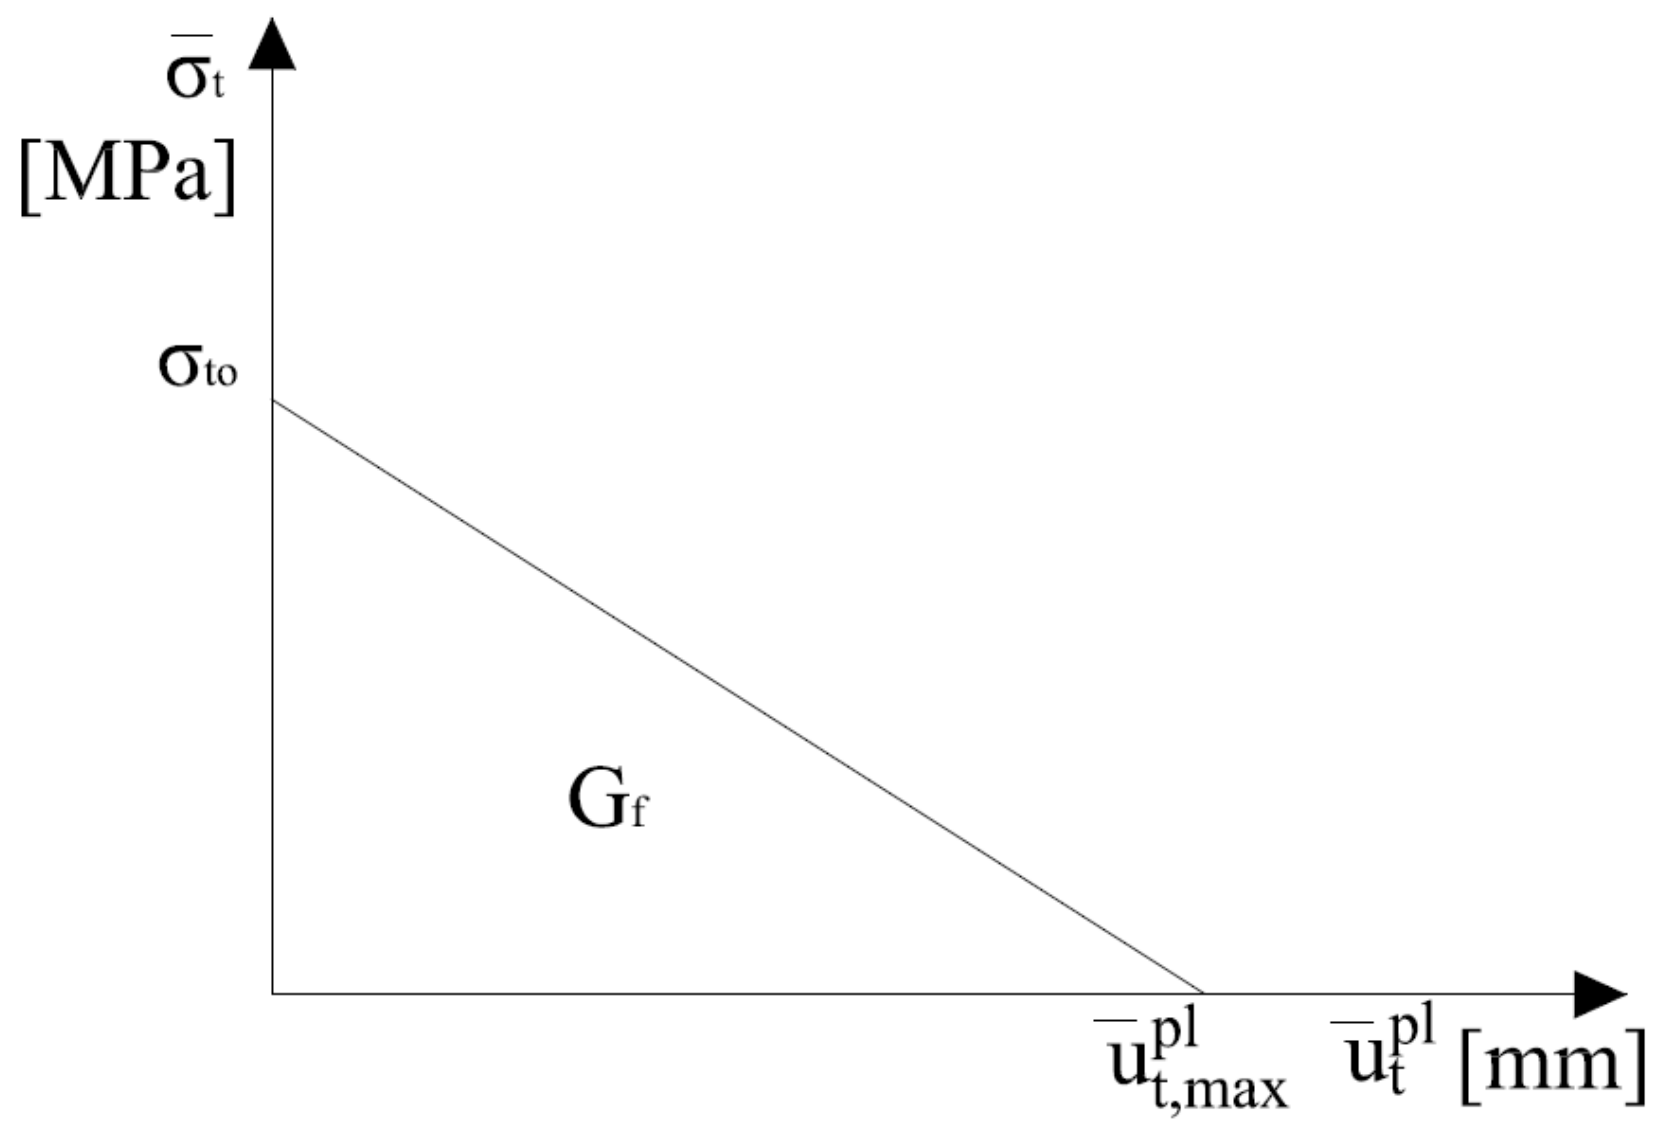
3.2. Material Model
3.3. Results of Numerical Analyses
4. Final Conclusions
- –
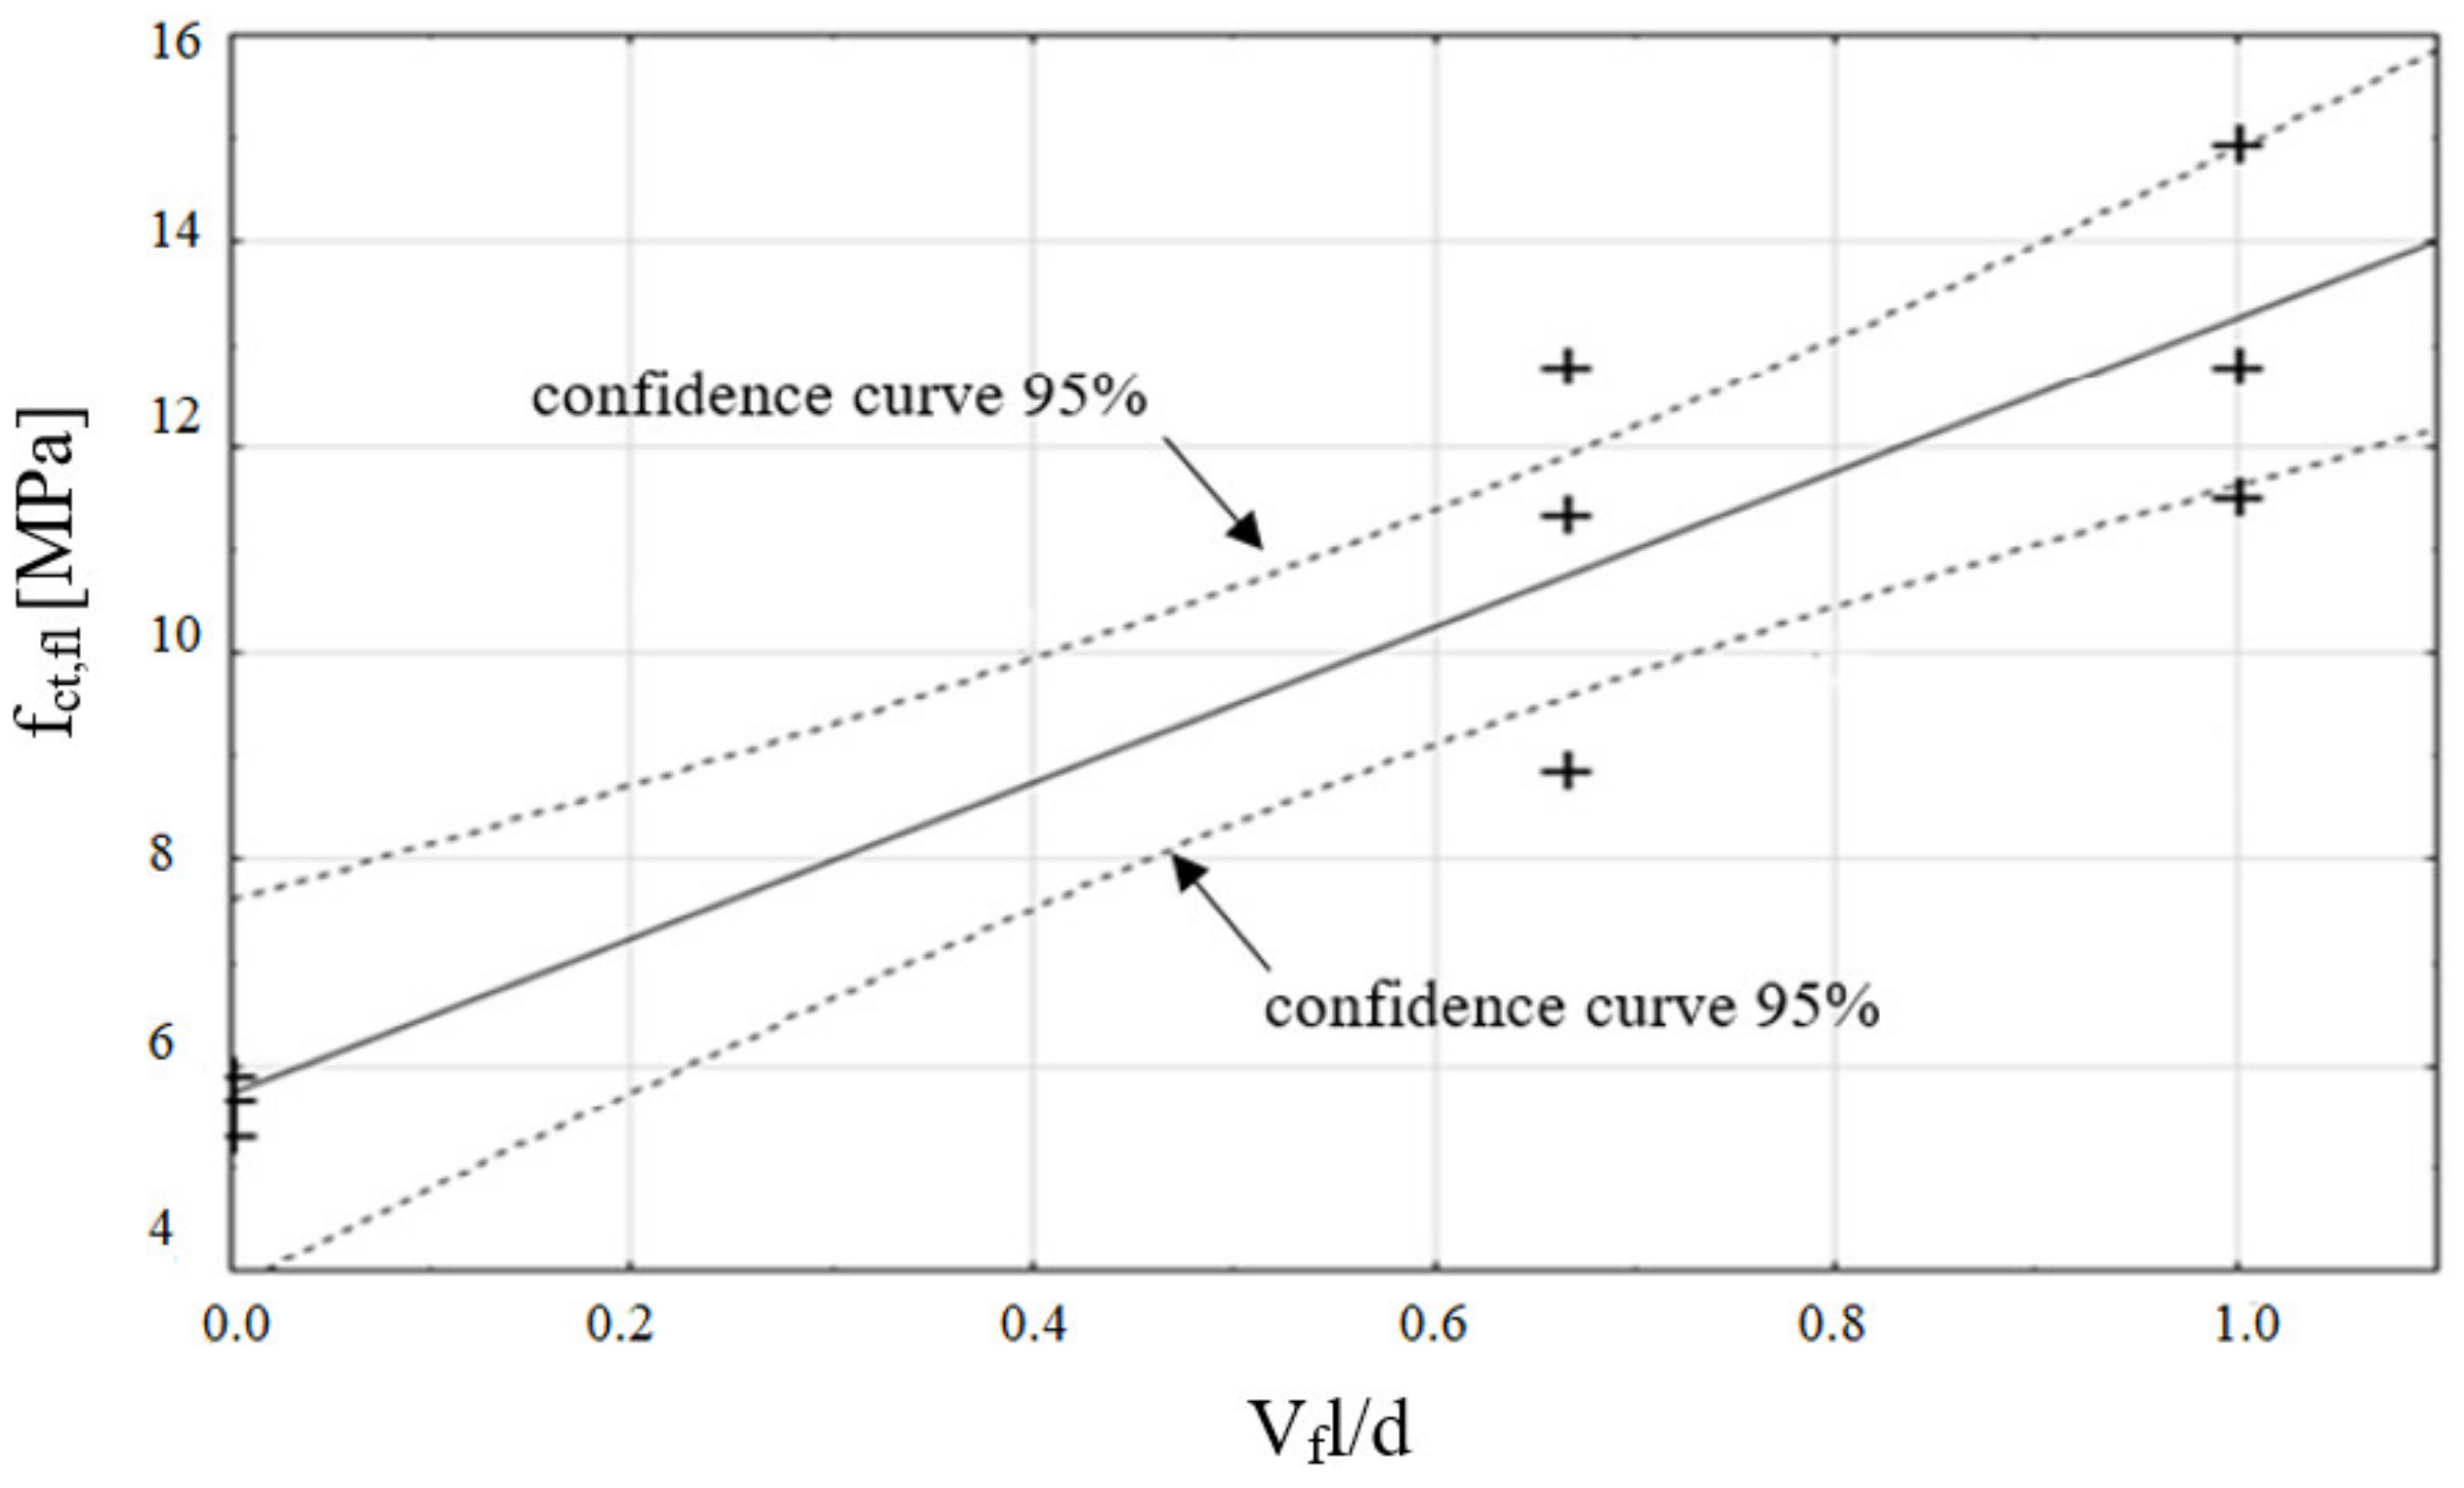
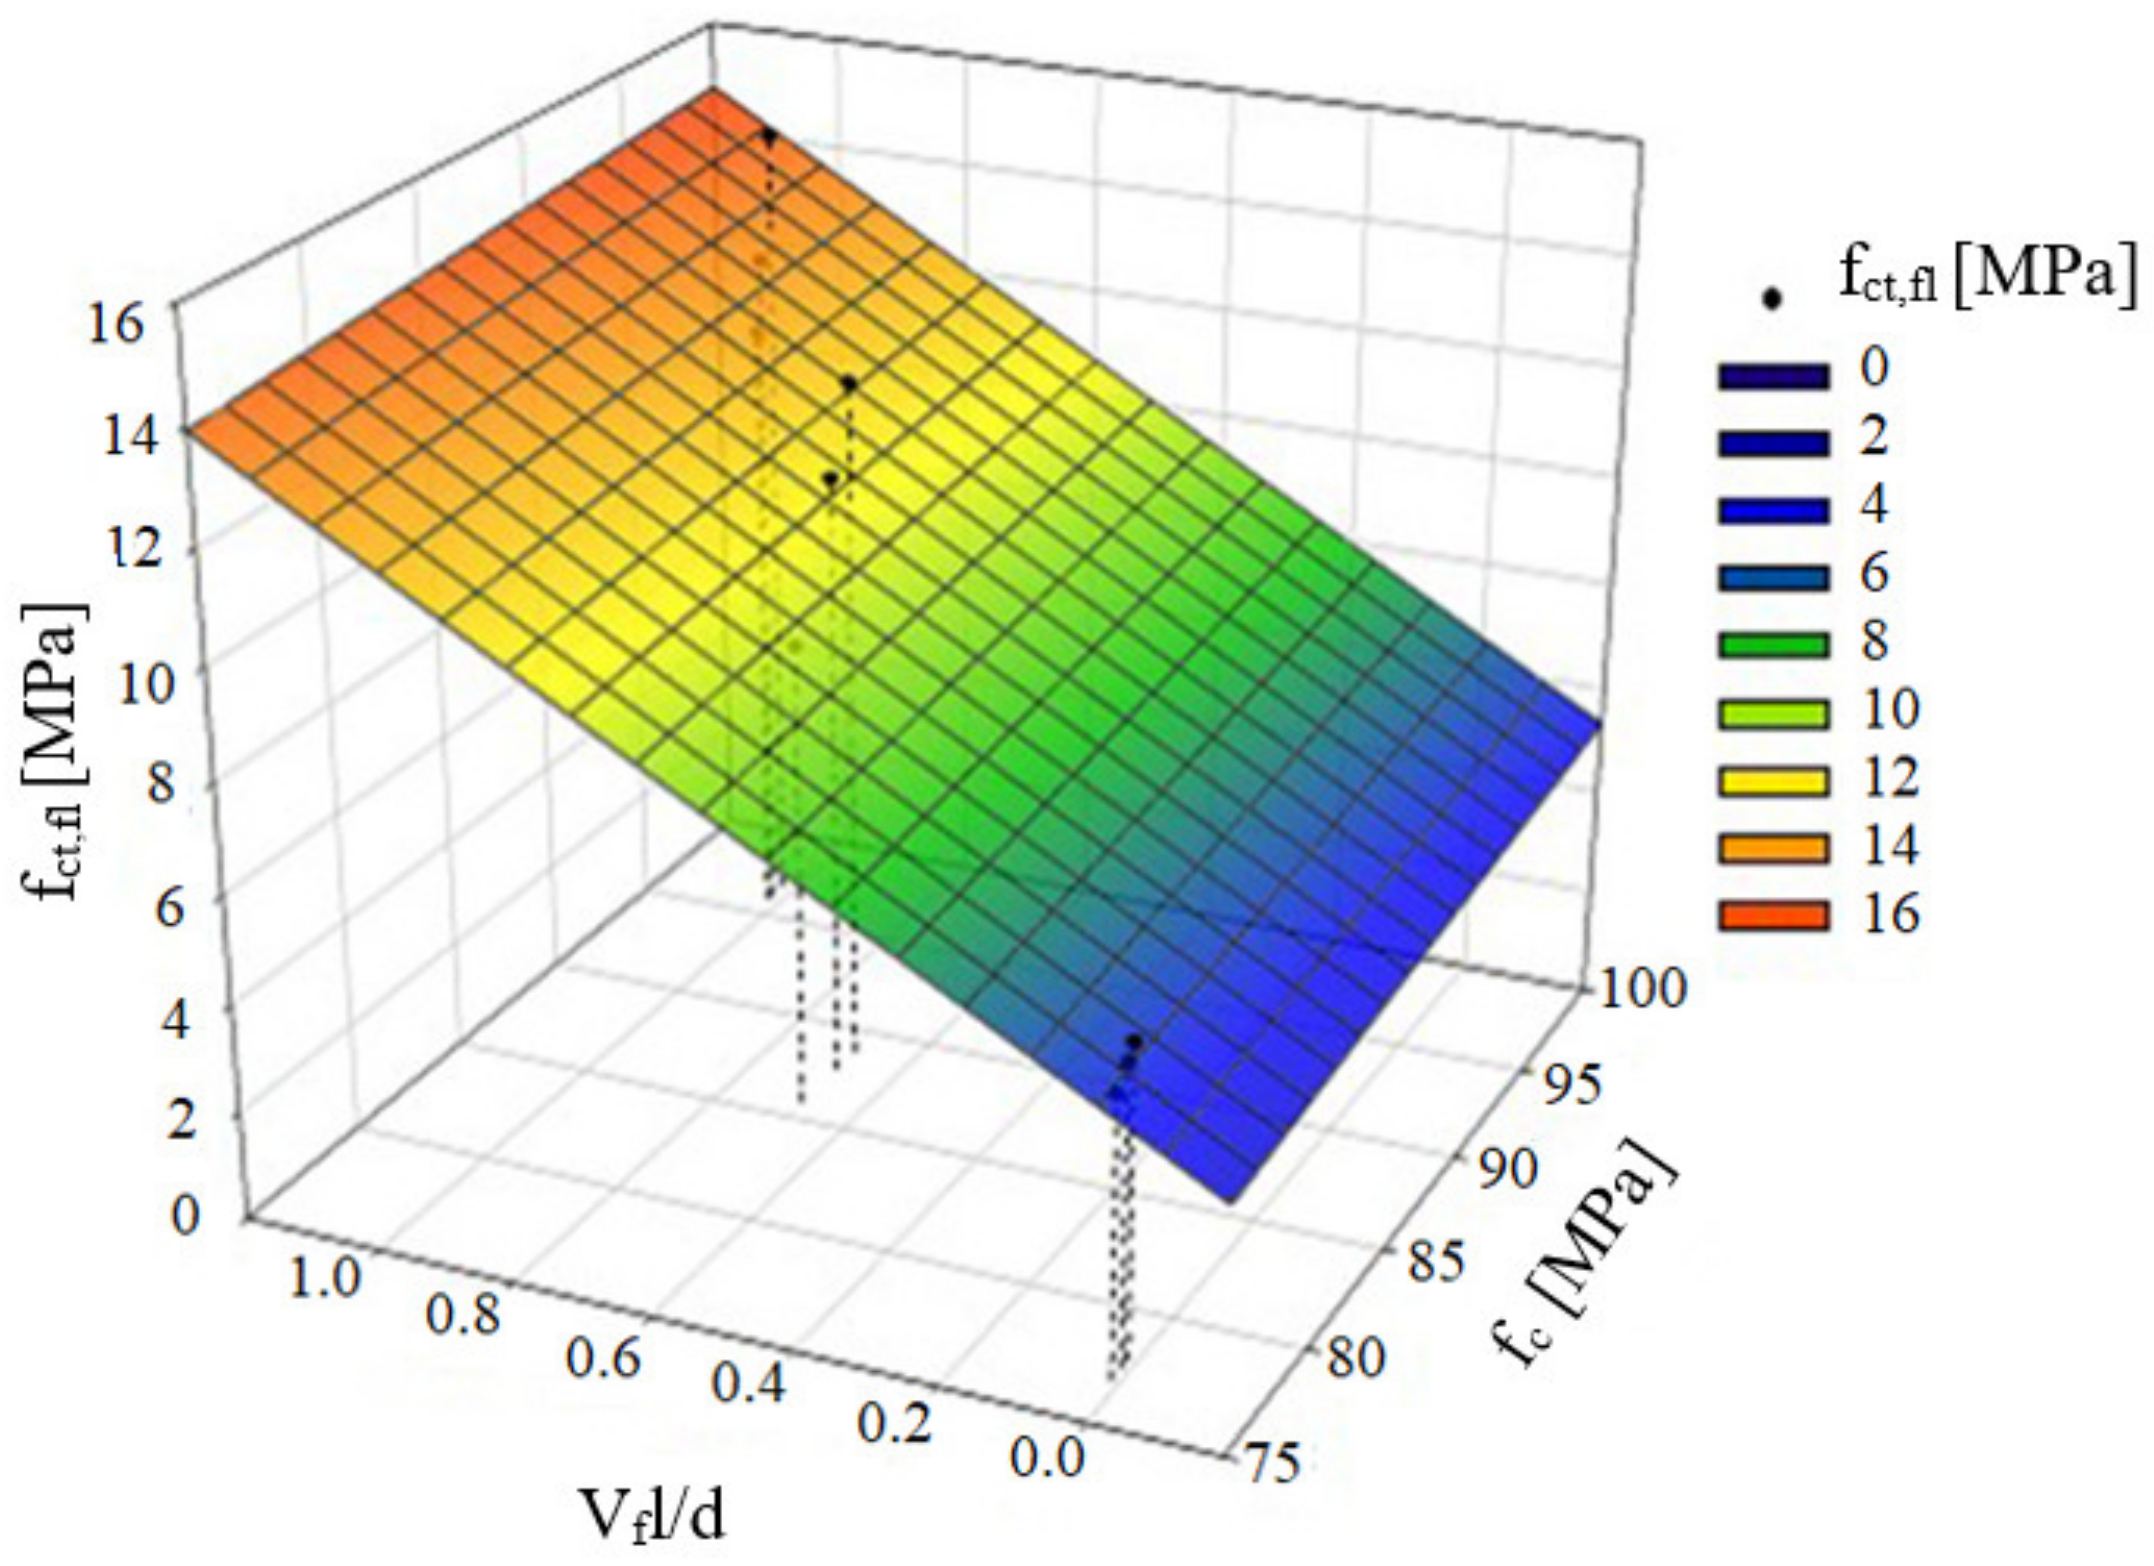
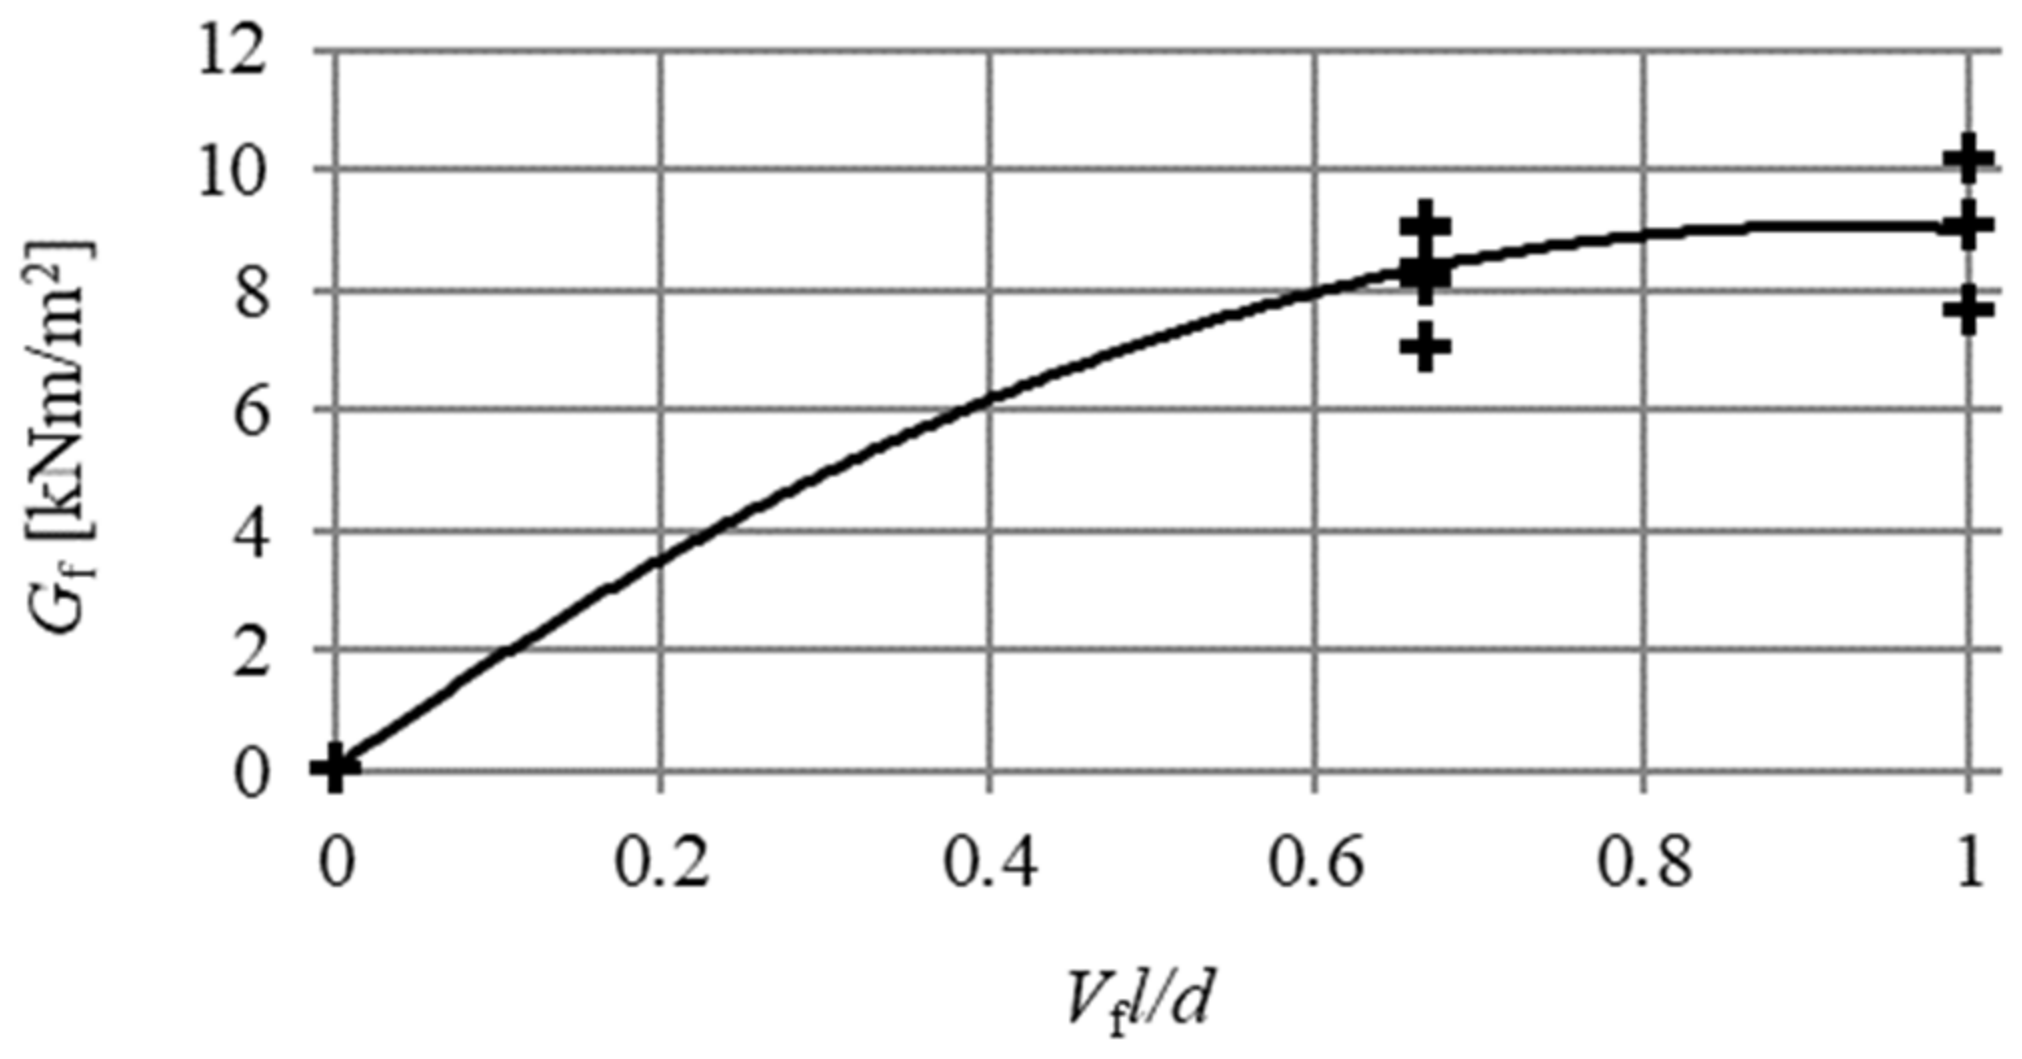
- The tests that were carried out on beams have shown that together with the increase in the volumetric amount of fibres (Vf) in the beam, flexural tensile strength increases considerably (fct,fl).
- –
- Laboratory tests carried out showed considerably higher (over two hundred times) fracture energy (Gf) in the case of SFRHSC beam as opposed to HSC beams.
- –
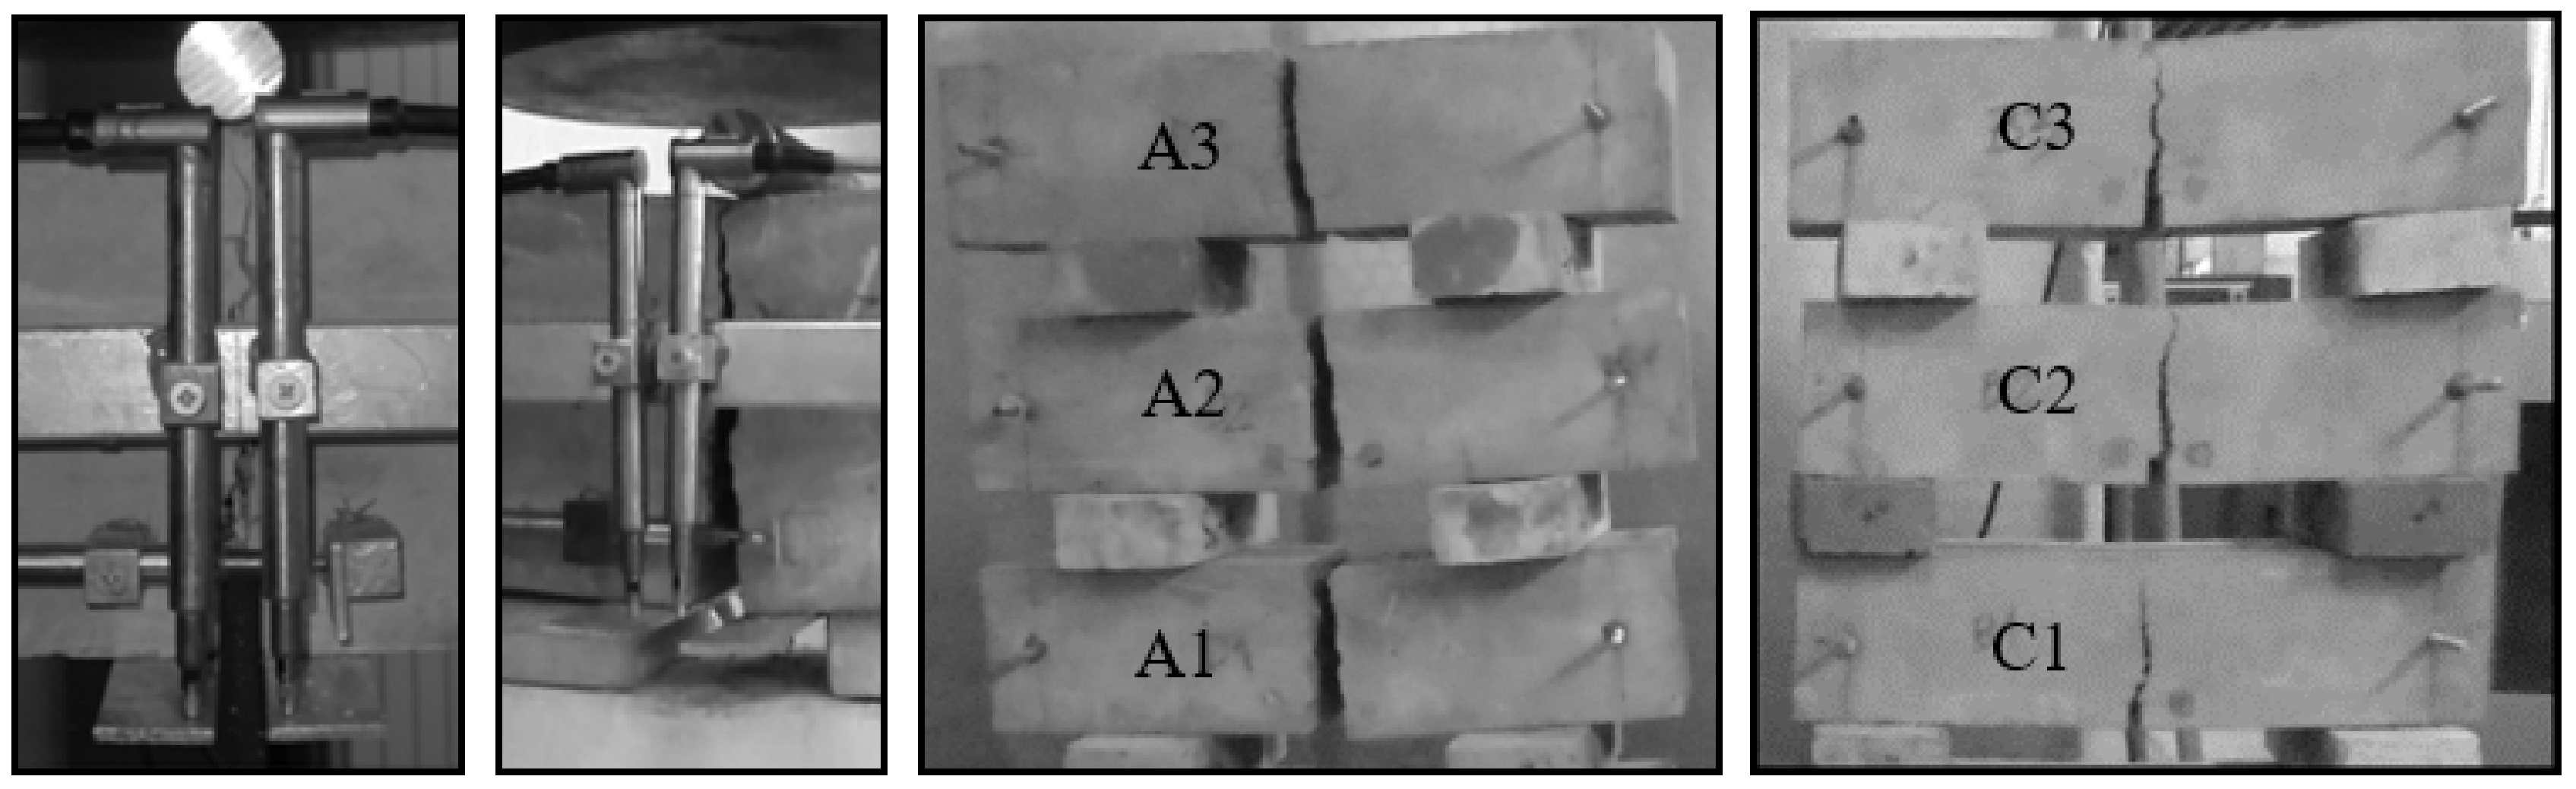
- The presence of fibres affects the destruction characteristics of SFRHSC beams, which do not suddenly divide in contrast to HSC ones. After they are “destroyed”, the SFRHSC beams are able to carry a set load (usually smaller than the breaking load) until the broken parts are “separated”.
- –
- Regression Equations (2), (3), and (7) with determination coefficients R2 > 85% and statistically significant structural parameters were obtained as a result of statistical analysis of the test results (fct,fl, fc and Gf). These equations can be used to estimate the flexural tensile strength (fct,fl) and fracture energy (Gf) for SFRHSC beams. In view of the sample size (≤9), the proposed regression equations should be verified in the future by performing experimental tests on a larger number of samples.
- –
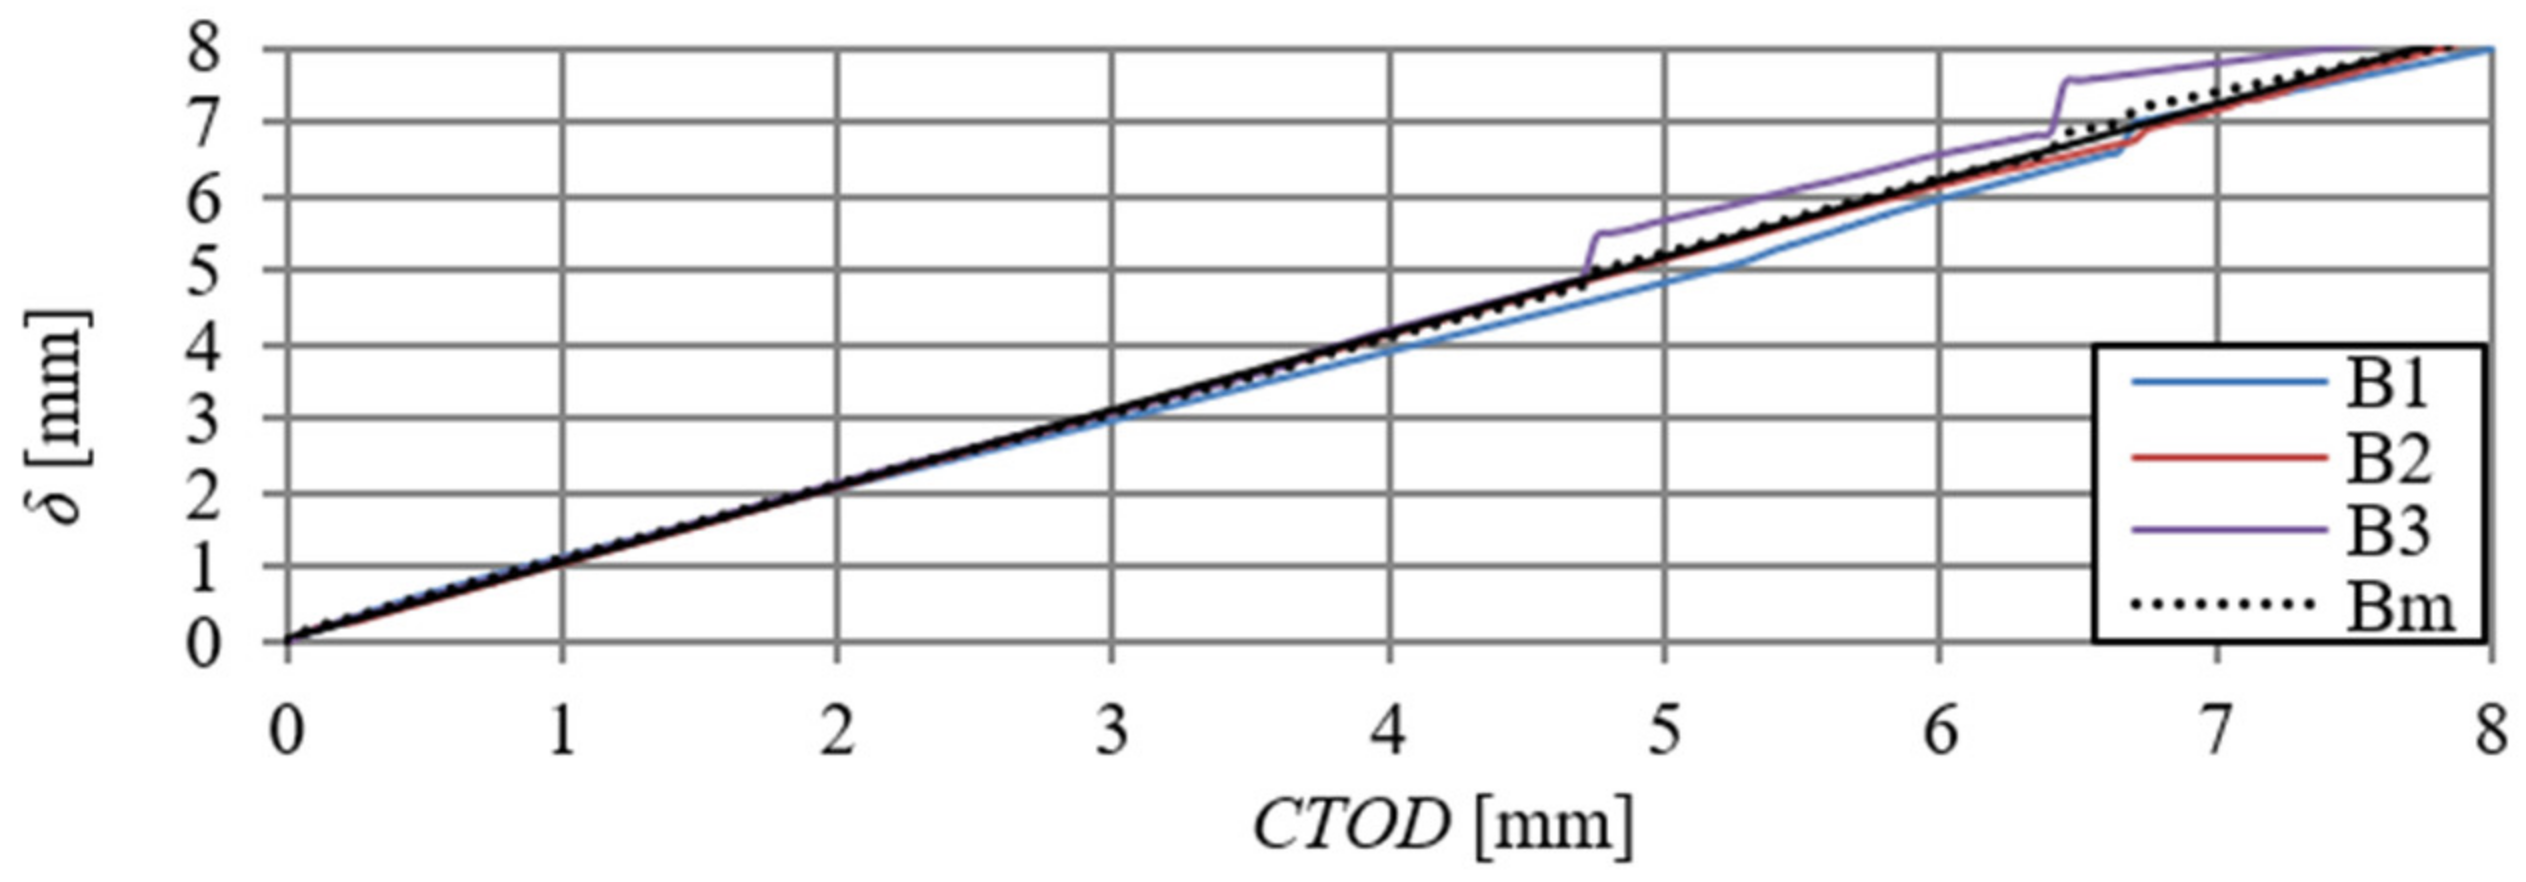
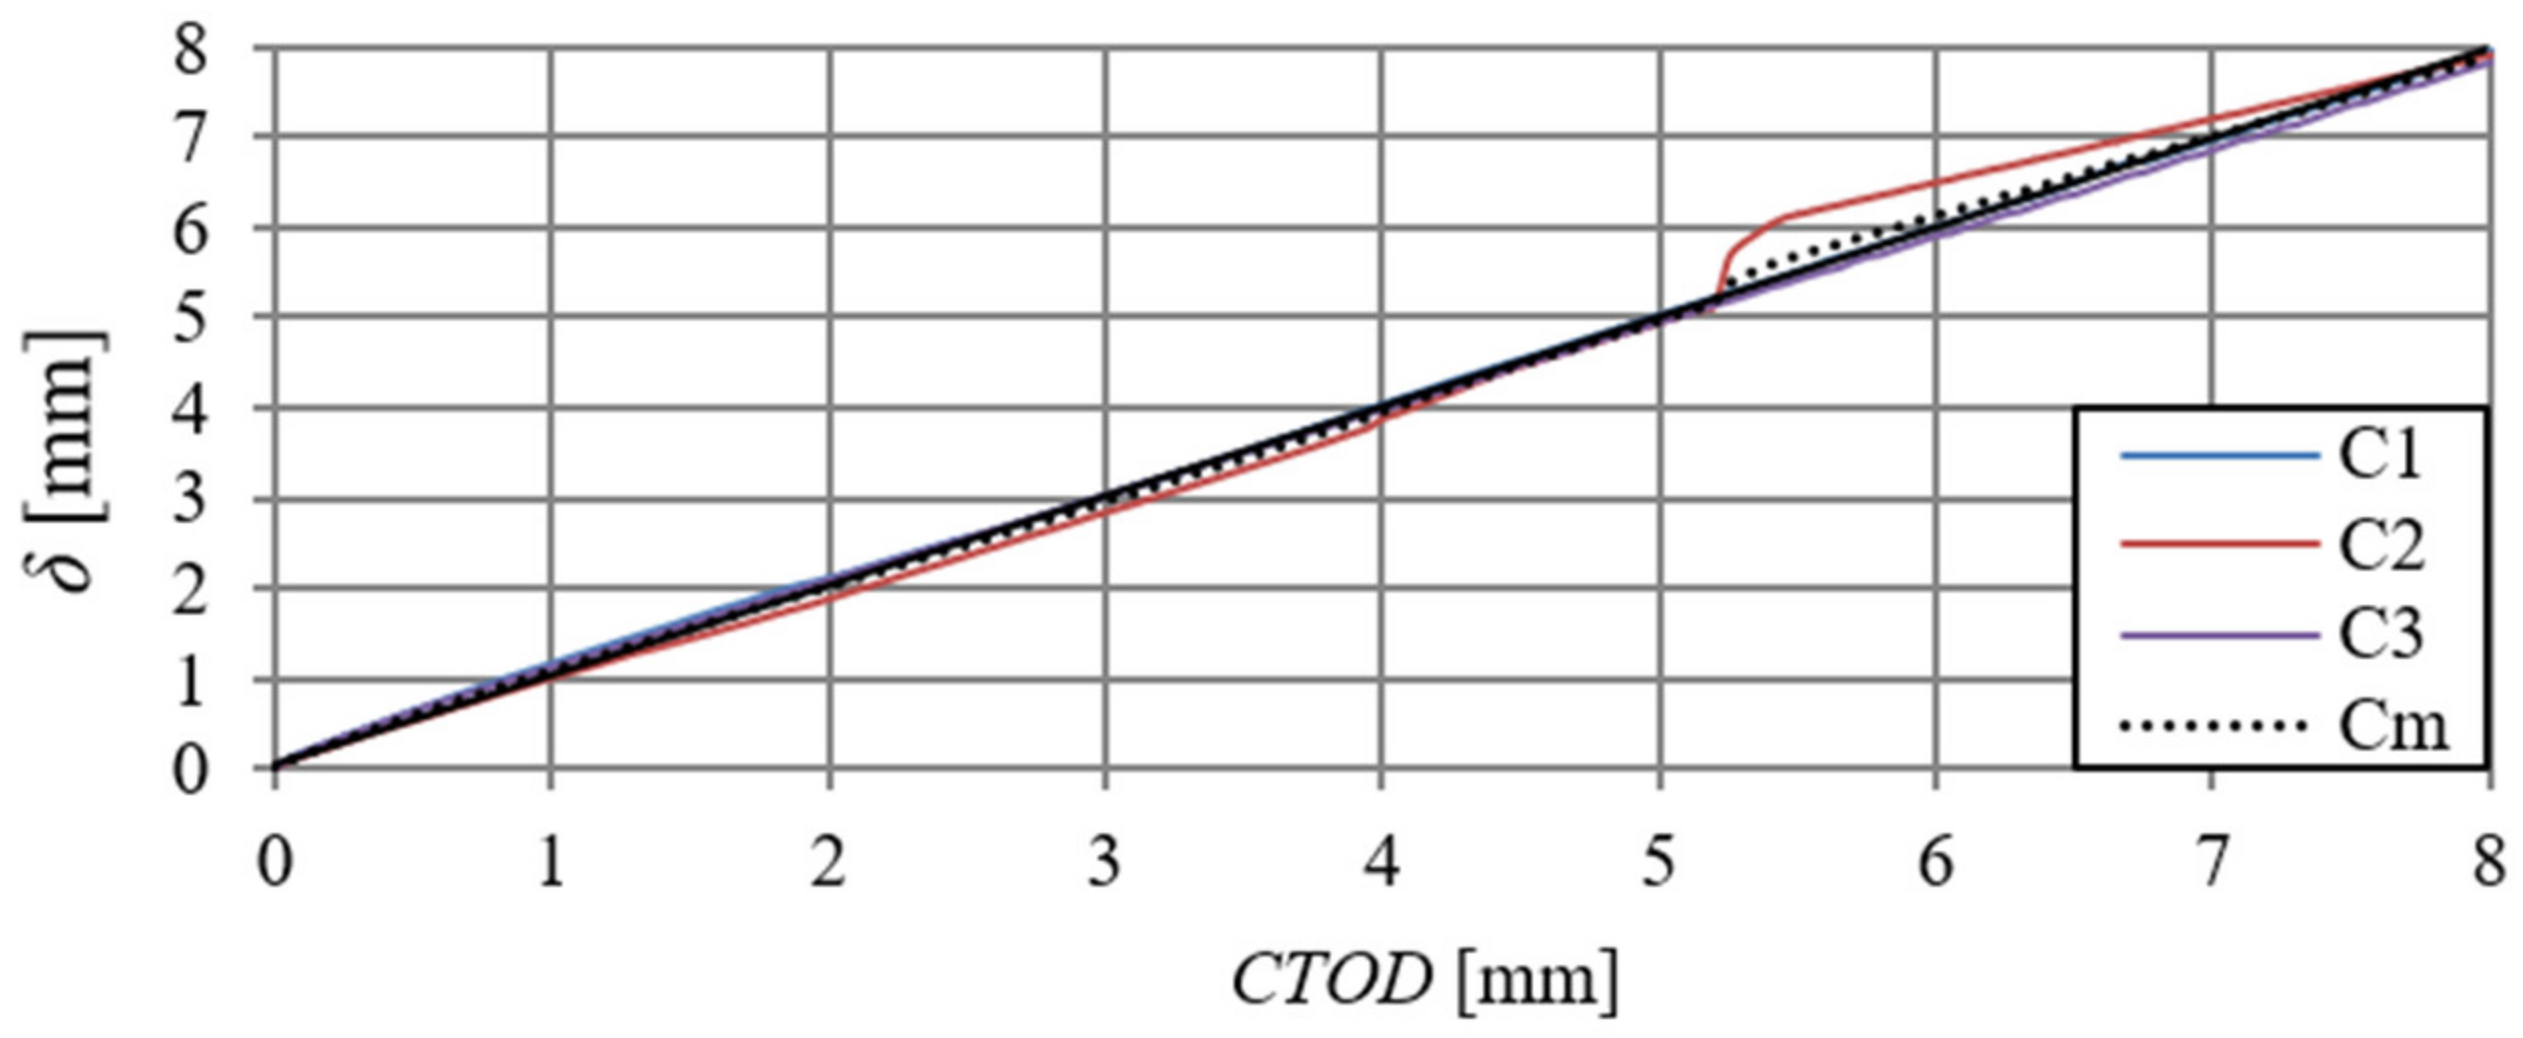
- For SFRHSC beams, the force–deflection (F–δ) and force-crack tip opening displacement (F–CTOD) relationships were almost identical (shape and area under the graph). The relationship between the deflection and crack tip opening displacement (δ–CTOD) obtained for the mean results of B- and C-series beams is described by linear regression Equations (4) and (5). These equations could be a contribution to the extension of the standard [15], which now allow for approximating the deflections (δ) of steel-fibre-modified beams only as a function of crack mouth opening displacement (CMOD).
- –
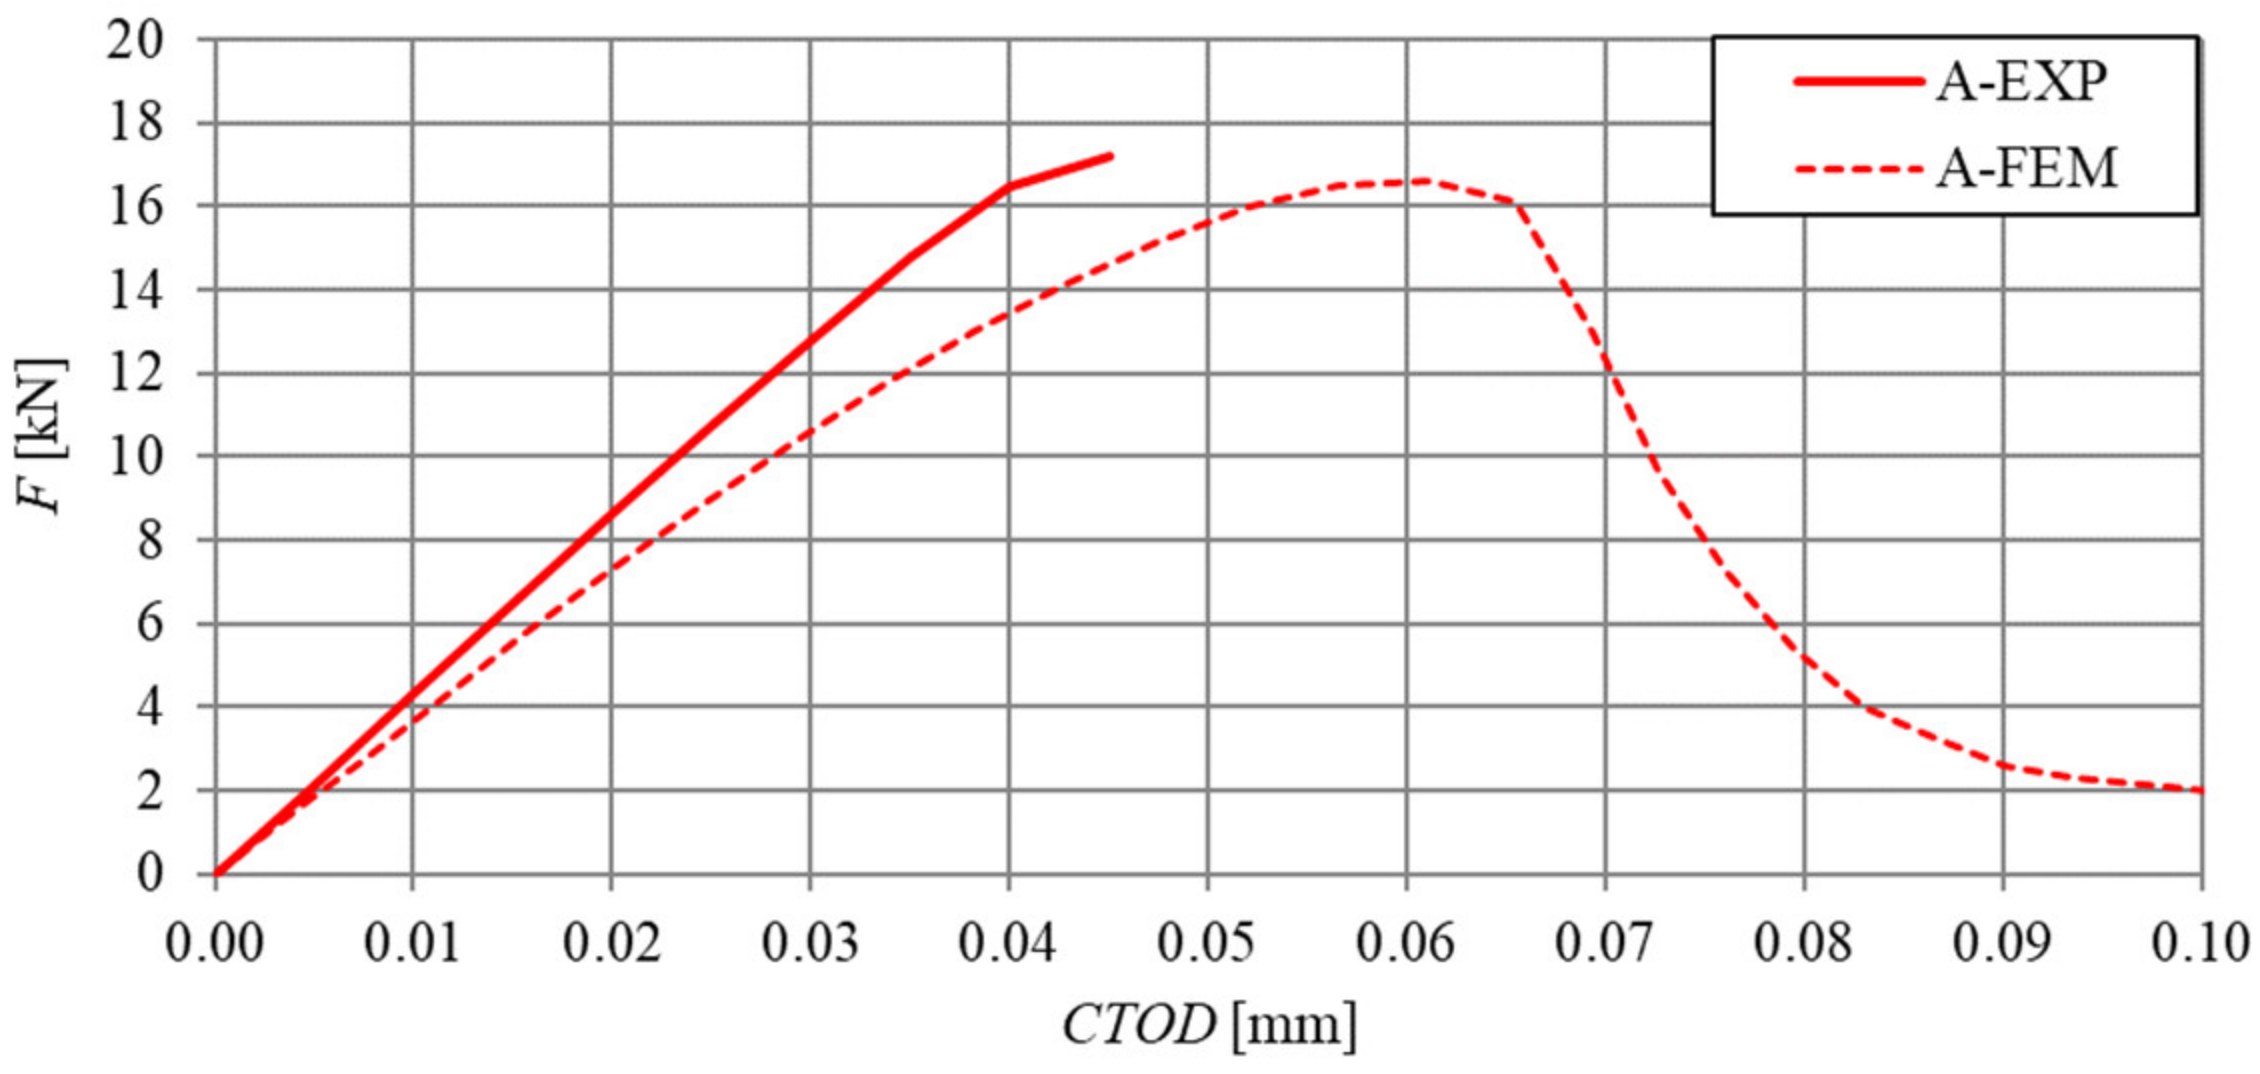
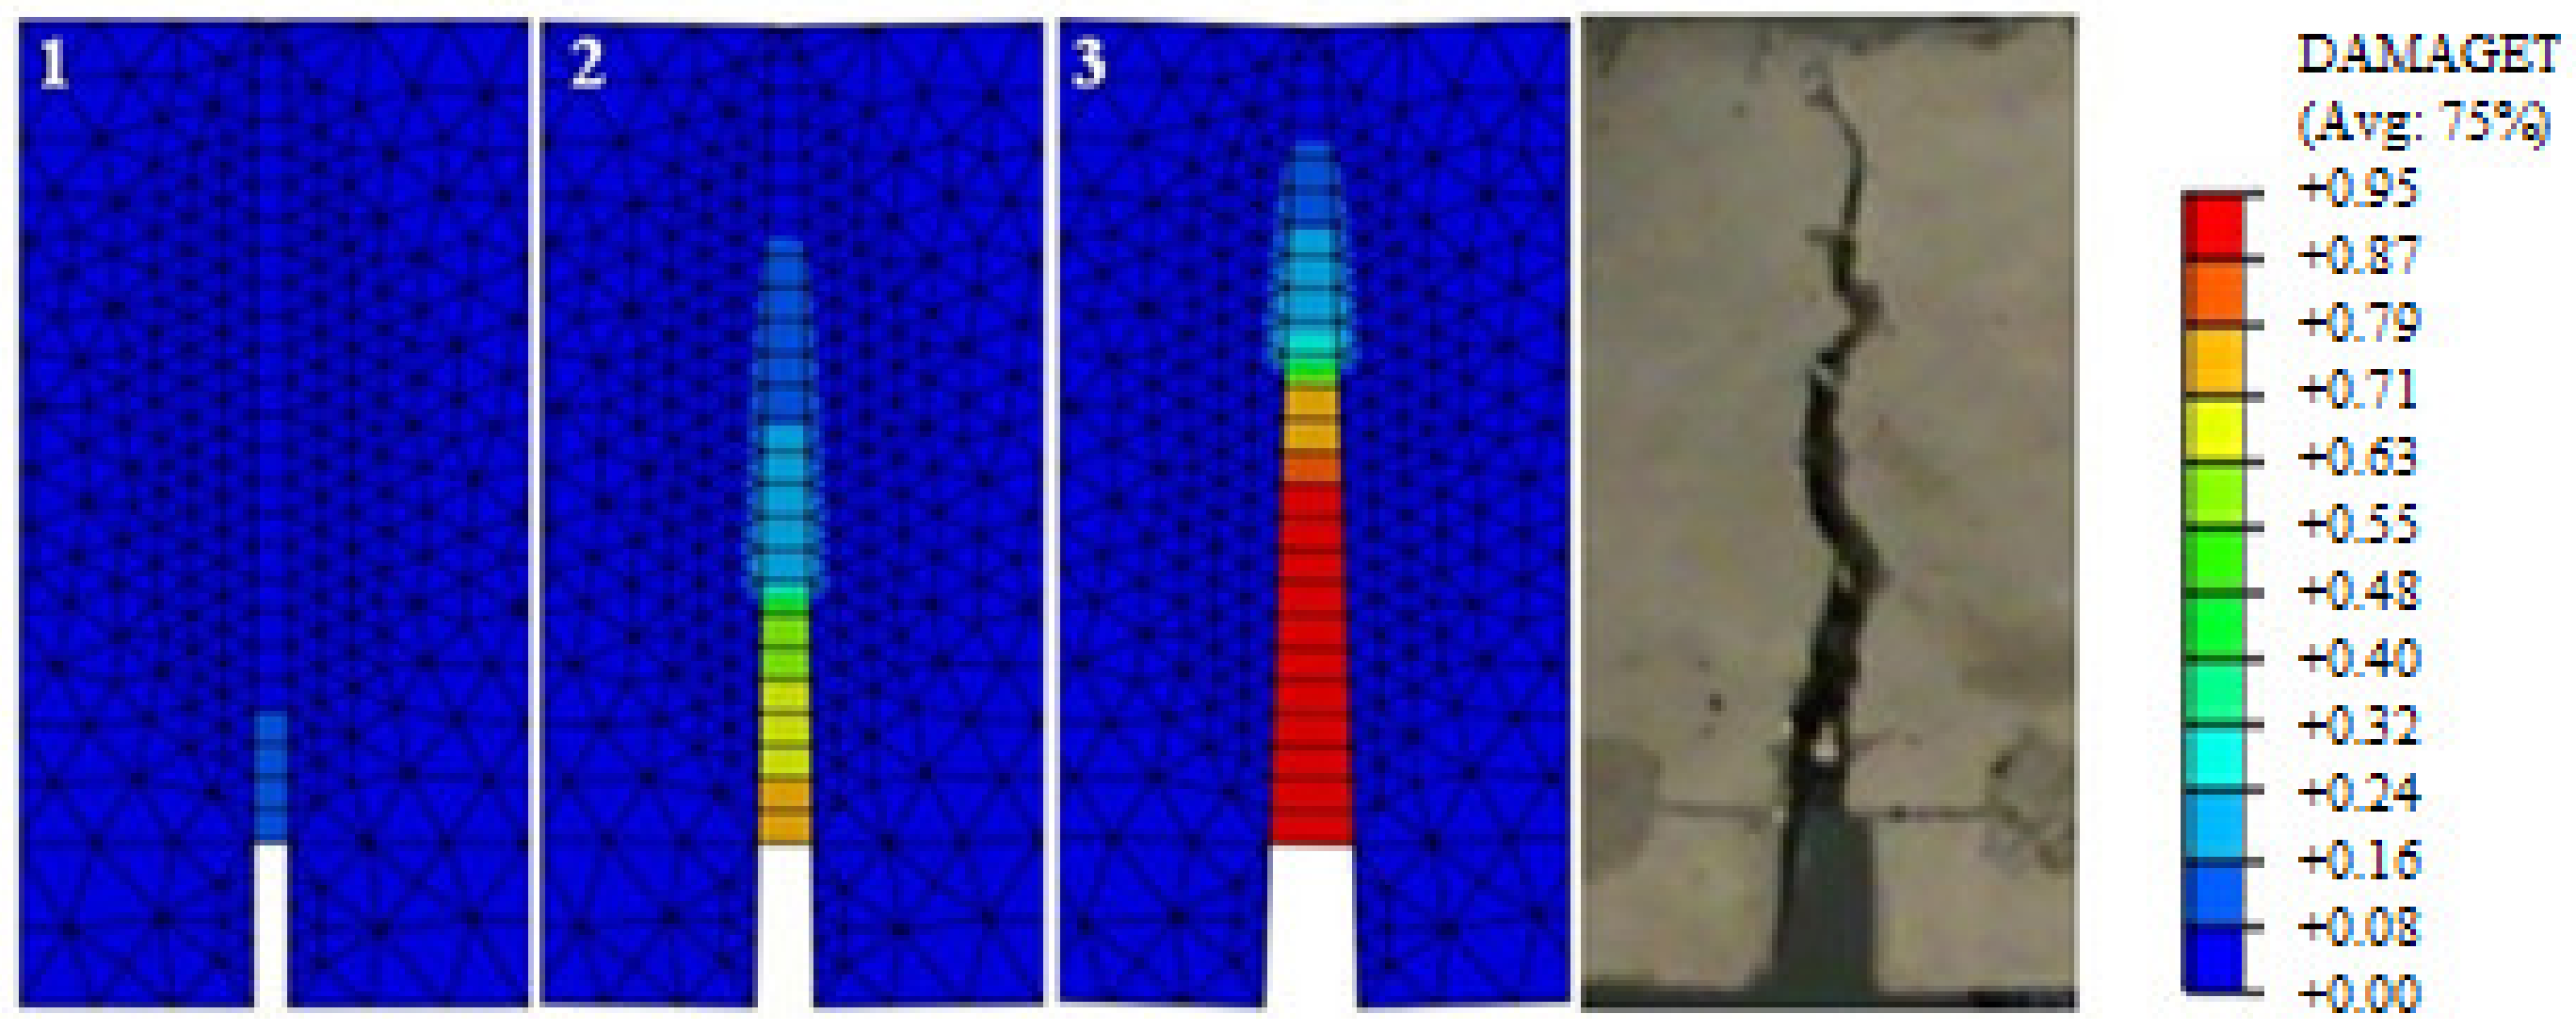
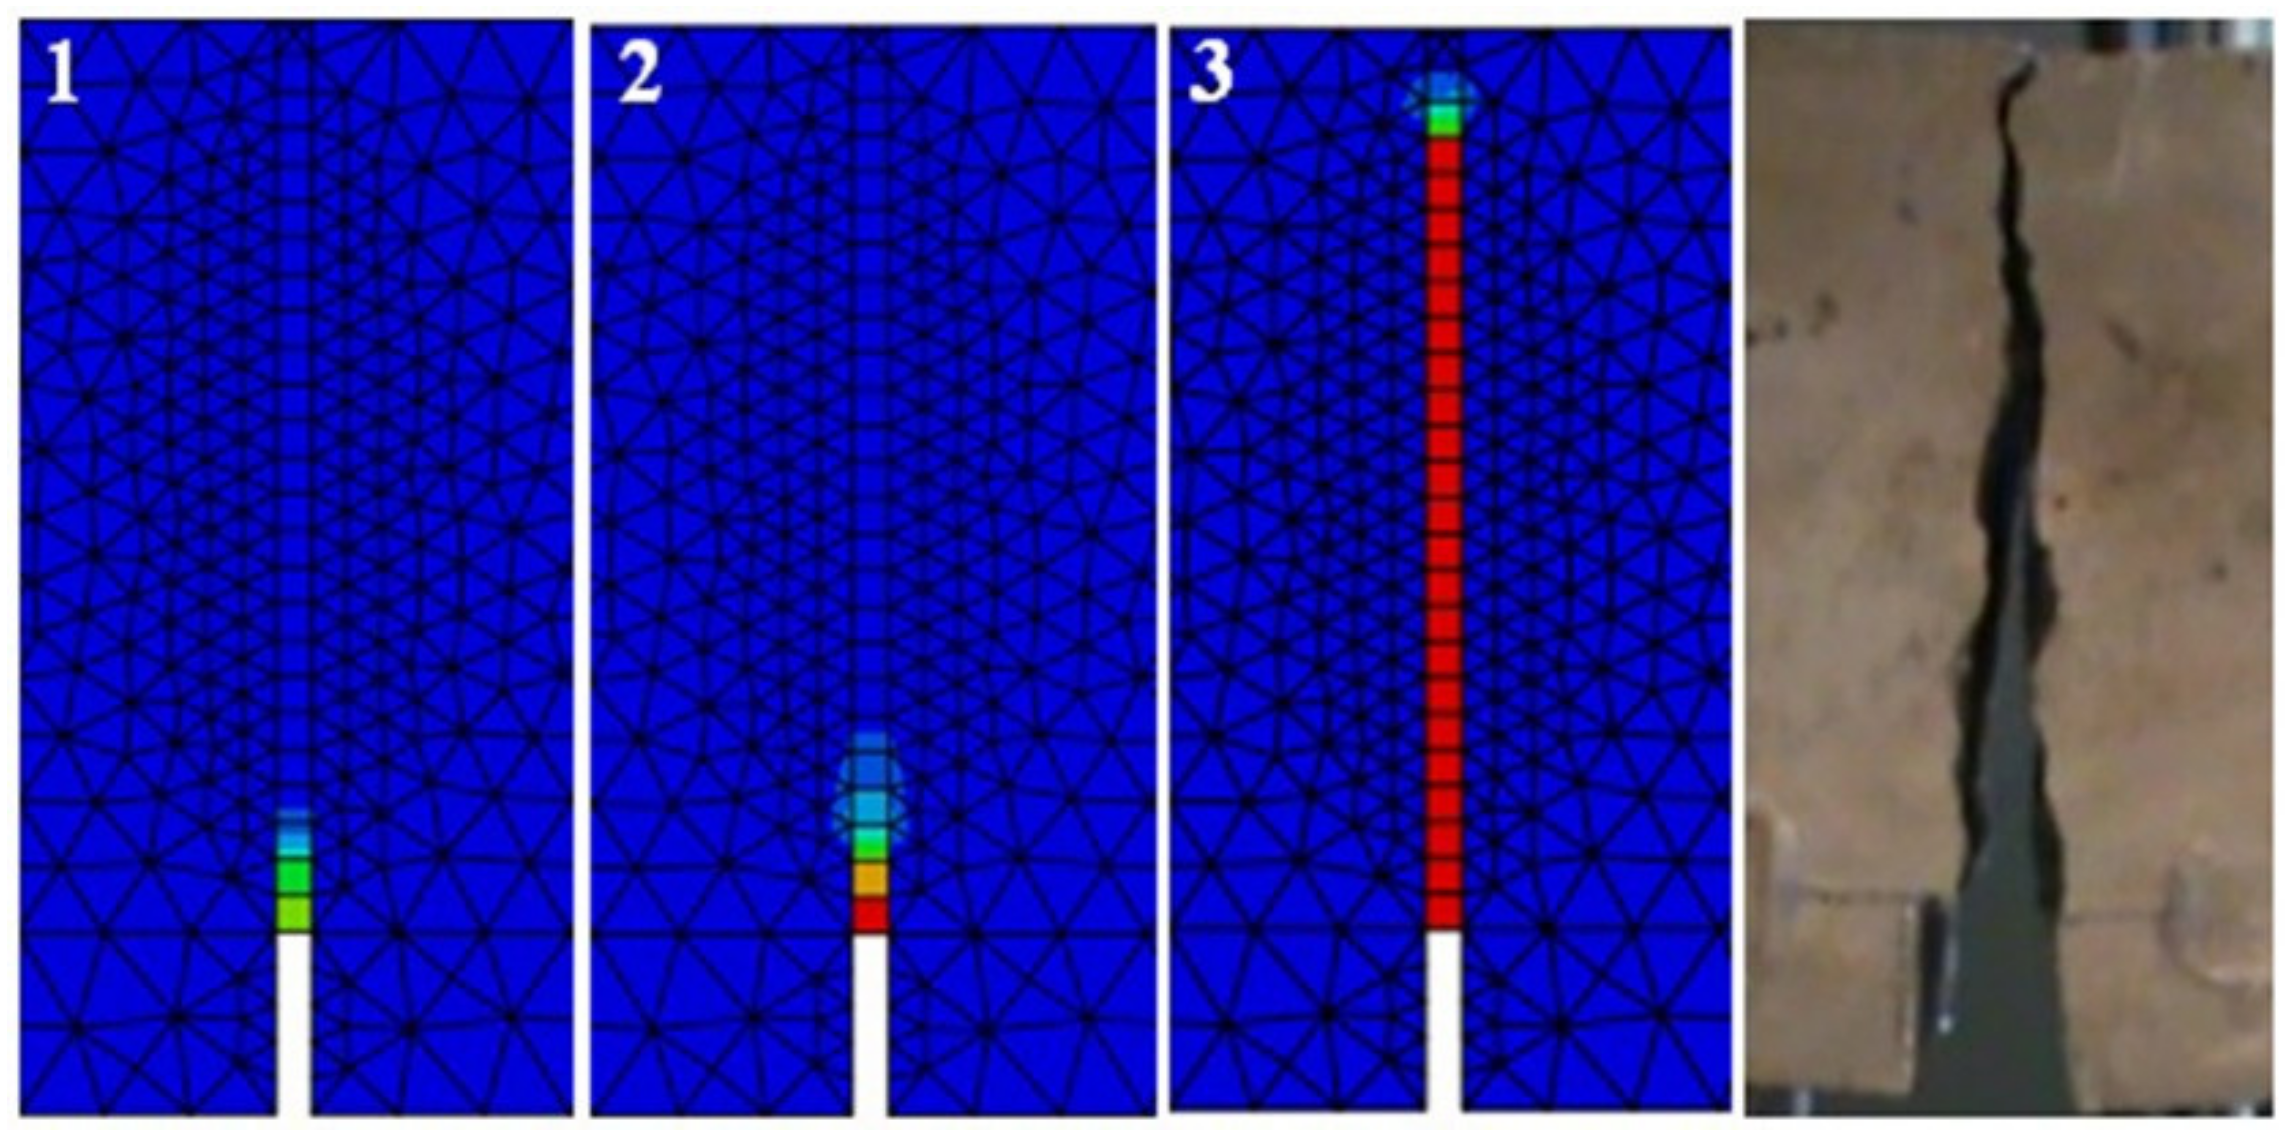
- Numerical analysis of HSC and SFRHSC beams with the use of the CDP model showed high compliance with the experimental results in terms of quantity (conformity of the F–δ and F–CTOD relationships) and quality (image of the cracking).
- –
- Minor differences between the results of laboratory tests and numerical analyses of HSC and SFRHSC beams confirm the reliability of the parameters adopted, experimentally and theoretically determined, and describing the elastic-plastic material model used in numerical simulations.
- –
- The basic material parameter used in numerical simulations (CDP model), which is employed to describe the behaviour of SFRHSC beams in the beyond-elastic range is the fracture energy (Gf), takes into account the presence of fibres in the composite. To determine the energy, it is necessary to know, for example, the relationship: F–δ, F–CMOD or F–CTOD.
Author Contributions
Funding
Conflicts of Interest
References
- Mudadu, A.; Tiberti, G.; Germano, F.; Plizzari, G.; Morbi, A. The effect of fiber orientation on the post-Cracking behavior of steel fiber reinforced concrete under bending and uniaxial tensile tests. Cem. Concr. Compos. 2018, 93, 274–288. [Google Scholar] [CrossRef]
- Prebhakumari, K.; Jayakumar, P. Fracture Parameters of Steel Fibre Reinforced High Strength Concrete by Size Effect Method. Int. J. Sci. Eng. Res. 2013, 4, 254–259. [Google Scholar]
- Fantilli, A.; Chiaia, B.; Gorino, A. Fiber volume fraction and ductility index of concrete beams. Cem. Concr. Compos. 2016, 65, 139–149. [Google Scholar] [CrossRef]
- Lantsoght, E. How do steel fibers improve the shear capacity of reinforced concrete beams without stirrups? Compos. Part B Eng. 2019, 175, 107079. [Google Scholar] [CrossRef]
- Berkowski, P.; Kosior-Kazberuk, M. Effect of Fiber on the Concrete Resistance to Surface Scaling Due to Cyclic Freezing and Thawing. Procedia Eng. 2015, 111, 121–127. [Google Scholar] [CrossRef]
- Eik, M.; Puttonen, J.; Herrmann, H. An orthotropic material model for steel fibre reinforced concrete based on the orientation distribution of fibres. Compos. Struct. 2015, 121, 324–336. [Google Scholar] [CrossRef]
- Tlemat, H.; Pilakoutas, K.; Neocleus, K. Modelling of SFRC using Inverse Finite Element Analysis. Mater. Struct. 2006, 39, 197–207. [Google Scholar] [CrossRef]
- Ezeldin, A.; Balaguru, P. Normal and high strength fiber reinforced concrete under compression. J. Mater. Civil Eng. 1992, 4, 415–429. [Google Scholar] [CrossRef]
- Abbass, W.; Khan, M.; Mourad, S. Evaluation of mechanical properties of steel fiber reinforced concrete with different strengths of concrete. Constr. Build. Mater. 2018, 168, 556–569. [Google Scholar] [CrossRef]
- Sivaraja, M.; Kandasamy, S.; Thirumurugan, A. Mechanical strength of fibrous concrete with waste rural materials. J. Sci. Ind. Res. 2010, 69, 308–312. [Google Scholar]
- Kazmierowski, M. Deflections of Double-Span Reinforced Concrete Beams Made of High-Strength Concrete Modified with Steel Fibers. Ph.D. Thesis, Wroclaw University of Technology, Wroclaw, Poland, July 2019. [Google Scholar]
- Banthia, N. Fiber Reinforced Cements and Concretes. Can. J. Civ. Eng. 2001, 28, 879–880. [Google Scholar]
- Hameed, R.; Turatsinze, A.; Duprat, F.; Sellier, A. Metallic fiber reinforced concrete: Effect of fiber aspect ratio on the flexural properties. J. Eng. Appl. Sci. 2009, 4, 67–72. [Google Scholar]
- Bencardino, F. Mechanical Parameters and Post-Cracking Behaviour of HPFRC according to Three-Point and Four-Point Bending Test. Adv. Civ. Eng. 2013. [Google Scholar] [CrossRef]
- European Committee for Standardization. Test Method for Metallic Fibered Concrete–Measuring the Flexural Tensile Strength (Limit of Proportionality (LOP), Residual); EN 14651:2005; European Committee for Standardization: Brussels, Belgium, 2005. [Google Scholar]
- National Research Council. Guide for the Design and Construction of Fiber-Reinforced Concrete Structures; CNR-DT 204/2006; National Research Council: Rome, Italy, 2007. [Google Scholar]
- European Committee for Standardization. Testing Hardened Concrete, Part 2: Making and Curing Specimens for Strength Tests; EN 12390-2:2000; European Committee for Standardization: Brussels, Belgium, 2000. [Google Scholar]
- Polish Committee for Standardization. Eurocode 2: Design of Concrete Structures-Part 1-1: General Rules and Rules for Buildings; PN-EN 1992-1-1: 2008; Polish Committee for Standardization: Warsaw, Poland, 2010. [Google Scholar]
- European Committee for Standardization. Fly Ash for Concrete–Part 1: Definitions, Specifications and Conformity Criteria; EN 450-1: 2012; European Committee for Standardization: Brussels, Belgium, 2012. [Google Scholar]
- European Committee for Standardization. Testing Fresh Concrete, Part 2: Slump-Test; EN 12350-2:2009; European Committee for Standardization: Brussels, Belgium, 2009. [Google Scholar]
- European Committee for Standardization. Testing Hardened Concrete, Part 3: Compressive Strength of Test Specimens; EN 12390-3:2009; European Committee for Standardization: Brussels, Belgium, 2009. [Google Scholar]
- European Committee for Standardization. Testing Hardened Concrete, Part 13: Determination of Secant Modulus of Elasticity in Compression; EN 12390-13:2013; European Committee for Standardization: Brussels, Belgium, 2013. [Google Scholar]
- Lambrechts, A. Performance classes for steel fibre reinforced concrete: Be critical. In Proceedings of the BEFIB 2008: 7th RILEM International Symposium on Fibre Reinforced Concrete, Chennai, India, 17–19 September 2008. [Google Scholar]
- Ponikiewski, T.; Katzer, J. Mechanical Properties and Fibre Density of Steel Fibre Reinforced Self-Compacting Concrete Slabs by Dia and Xct Approaches. J. Civ. Eng. Manag. 2017, 23, 604–612. [Google Scholar] [CrossRef]
- Wafa, F.; Ashour, S. Mechanical Properties of High-Strength Fiber Reinforced Concrete. ACI Mater. J. 1992, 89, 449–455. [Google Scholar]
- Kaiss, S.; Al-Azzawi, K. Mechanical Properties of High-Strength Fiber Reinforced Concrete. Eng. Technol. J. 2010, 28, 2442–2453. [Google Scholar]
- Sumathi, A.; Saravana, K. Strength Predictions of Admixed High Performance Steel Fiber Concrete. ChemTech 2014, 6, 4729–4736. [Google Scholar]
- Eren, O.; Marrar, K.; Celik, T. Effect of Silica Fume and Steel Fibers on Some Properties of High-Strength Concrete. Constr. Build. Mater. 1997, 11, 373–382. [Google Scholar] [CrossRef]
- Lin, W.; Wu, Y.; Cheng, A.; Chao, S.; Hsu, H. Engineering Properties and Correlation Analysis of Fiber Cementitious Materials. Materials 2014, 7, 7423–7435. [Google Scholar] [CrossRef]
- Gao, J.; Sun, W.; Morino, K. Mechanical properties of steel fibre reinforced high strength light weight concrete. Cem. Concr. Compos. 1997, 19, 307–313. [Google Scholar] [CrossRef]
- Bayramov, F.; Tasdemir, C.; Tasdemir, M. Optimisation of steel fibre reinforced concretes by means of statistical response surface method. Cem. Concr. Compos. 2004, 26, 665–675. [Google Scholar] [CrossRef]
- Bae, B.; Choi, H.; Choi, C. Correlation Between Tensile Strength and Compressive Strength of Ultra High Strength Concrete Reinforced with Steel Fiber. J. Korea Concr. Inst. 2015, 27, 253–263. [Google Scholar] [CrossRef]
- Hillerborg, A.; Modéer, M.; Petersson, P. Analysis of crack formation and crack growth in concrete by means of fracture mechanics and finite elements. Cem. Concr. Res. 1976, 6, 773–780. [Google Scholar] [CrossRef]
- RILEM TC-FMC. Determination of fracture energy of mortar and concrete by means of three-Point bend test on notched beams. Mater. Struct. 1985, 18, 285–290. [Google Scholar] [CrossRef]
- Spagnoli, A.; Carpinteri, A.; Ferretti, D.; Vantadori, S. An experimental investigation on the quasi-Brittle fracture of marble rocks. Fatigue Fract. Eng. Mater. Struct. 2016, 8, 956–968. [Google Scholar] [CrossRef]
- Abaqus User’s Manual; Version 6.14; Dassault Systèmes Simulia Corp: Johnston, RI, USA, 2014.
- Pamin, J.; Winnicki, A. Computational models of materials: Damage, strain localization, applications. In Modern Structural Mechanics with Applications to Civil Engineering; Polish Academy of Sciences: Warsaw, Poland, 2015; pp. 259–278. [Google Scholar]
- Diana Finite Element Analysis User’s Manual. Theory; Release 9.6; TNO DIANA BV: Delft, The Netherlands, 2014.
- Wosatko, A.; Genikomsou, A.; Pamin, J.; Polak, M.A.; Winnicki, A. Examination of two regularized damage-plasticity models for concrete with regard to crack closing. Eng. Fract. Mech. 2018, 194, 190–211. [Google Scholar] [CrossRef]
- Wosatko, A.; Winnicki, A.; Polak, M.A.; Pamin, J. Role of dilatancy angle in plasticity-Based models of concrete. Arch. Civ. Mech. Eng. 2019, 19, 1268–1283. [Google Scholar] [CrossRef]
- Jankowiak, T. Failure Criteria for Concrete under Quasi-Static and Dynamic Loadings, 1st ed.; Politechnika Poznanska: Poznan, Poland, 2011; pp. 47–96. ISBN 978-83-7143-981-0. [Google Scholar]
- Raphael, J. Tensile strength of concrete. Concr. Int. 1984, 81, 158–165. [Google Scholar]
- Sledziewski, K. Experimental and numerical studies of continuous composite beams taking into consideration slab cracking. Maint. Reliab. 2016, 18, 578–589. [Google Scholar] [CrossRef]


| Measured Parameter | Sample Type | Sample Dimensions (mm) | Series | Total | ||
|---|---|---|---|---|---|---|
| A | B | C | ||||
| fct,fl, fct,fl,L | beam | 150 × 150 × 600 | 3 | 3 | 3 | 9 |
| fc | cube | 150 × 150 × 150 | 3 | 3 | 3 | 9 |
| Ec | cylinder | 150 × 300 | 5 | 5 | 5 | 15 |
| Material | Series | |||
|---|---|---|---|---|
| A | B | C | ||
| Steel fibres | kg/m3 | 0 | 78 | 118 |
| % (Vf) * | 0 | 1.0 | 1.5 | |
| Superplasticizer | kg/m3 | 8.25 | 9.65 | 10.80 |
| Cement-CEM I 52.5R | kg/m3 | 550 | ||
| Sand 0–2 mm | kg/m3 | 600 | ||
| Granite aggregate 2–8 mm | kg/m3 | 490 | ||
| Granite aggregate 8–16 mm | kg/m3 | 590 | ||
| Fly ash | kg/m3 | 30 | ||
| Coefficient w/c | - | 0.30 | ||
| Series | fct,fl (MPa) | fct,fl,L (MPa) | fc (MPa) | Ec (GPa) | ||||||||
|---|---|---|---|---|---|---|---|---|---|---|---|---|
| Result | x | s | Result | x | s | Result | x | s | Result | x | s | |
| A | 5.64 | 0.30 | - | - | 76.91 | 0.47 | 34.50 | 35.68 | 1.64 | |||
| 5.32 | - | 76.41 | 36.90 | |||||||||
| 5.69 | - | 76.97 | 33.47 | |||||||||
| 5.91 | - | 77.34 | 36.17 | |||||||||
| 37.35 | ||||||||||||
| B | 11.00 | 1.99 | 6.14 | 0.70 | 86.84 | 1.52 | 40.35 | 41.08 | 1.21 | |||
| 8.86 | 5.34 | 85.19 | 41.07 | |||||||||
| 11.34 | 6.42 | 87.16 | 39.80 | |||||||||
| 12.79 | 6.65 | 88.17 | 42.99 | |||||||||
| 41.20 | ||||||||||||
| C | 13.09 | 1.74 | 7.01 | 0.51 | 95.56 | 0.44 | 37.77 | 41.76 | 2.36 | |||
| 11.52 | 6.42 | 95.19 | 41.61 | |||||||||
| 12.80 | 7.27 | 95.44 | 43.73 | |||||||||
| 14.96 | 7.33 | 96.04 | 42.56 | |||||||||
| 43.12 | ||||||||||||
| Beam | Result | x | s |
|---|---|---|---|
| A1 | 0.036 | 0.0412 | 0.004 |
| A2 | 0.043 | ||
| A3 | 0.044 | ||
| B1 | 7.051 | 8.394 | 1.16 |
| B2 | 9.033 | ||
| B3 | 9.098 | ||
| C1 | 7.688 | 8.996 | 1.26 |
| C2 | 9.103 | ||
| C3 | 10.195 |
| Name of Parameter | β | є | f | Kc | μ |
|---|---|---|---|---|---|
| Value | 36° | 0.1 | 1.16 | 0.667 | 0 |
| The Law of Strengthening in Compression | The Law of Weakening in Tension | ||||
|---|---|---|---|---|---|
| Series | σc (MPa) | σt (MPa) | (mm) | dt | |
| A | 46.15 | 1.29 | 4.23 | 0 | 0 |
| 76.91 | 1.50 | 0.042 | 0.04 | 0.95 | |
| B | 52.10 | 1.27 | 4.60 | 0 | 0 |
| 86.84 | 1.50 | 0.046 | 3.648 | 0.95 | |
| C | 57.34 | 1.37 | 5.25 | 0 | 0 |
| 95.56 | 1.50 | 0.053 | 3.424 | 0.95 | |
© 2020 by the authors. Licensee MDPI, Basel, Switzerland. This article is an open access article distributed under the terms and conditions of the Creative Commons Attribution (CC BY) license (http://creativecommons.org/licenses/by/4.0/).
Share and Cite
Bywalski, C.; Kaźmierowski, M.; Kamiński, M.; Drzazga, M. Material Analysis of Steel Fibre Reinforced High-Strength Concrete in Terms of Flexural Behaviour. Experimental and Numerical Investigation. Materials 2020, 13, 1631. https://doi.org/10.3390/ma13071631
Bywalski C, Kaźmierowski M, Kamiński M, Drzazga M. Material Analysis of Steel Fibre Reinforced High-Strength Concrete in Terms of Flexural Behaviour. Experimental and Numerical Investigation. Materials. 2020; 13(7):1631. https://doi.org/10.3390/ma13071631
Chicago/Turabian StyleBywalski, Czesław, Maciej Kaźmierowski, Mieczysław Kamiński, and Michał Drzazga. 2020. "Material Analysis of Steel Fibre Reinforced High-Strength Concrete in Terms of Flexural Behaviour. Experimental and Numerical Investigation" Materials 13, no. 7: 1631. https://doi.org/10.3390/ma13071631
APA StyleBywalski, C., Kaźmierowski, M., Kamiński, M., & Drzazga, M. (2020). Material Analysis of Steel Fibre Reinforced High-Strength Concrete in Terms of Flexural Behaviour. Experimental and Numerical Investigation. Materials, 13(7), 1631. https://doi.org/10.3390/ma13071631