Article

Numerical Simulation of the Behavior of Hydrogen Source in a Novel Welding Process to Reduce Diffusible Hydrogen

1
Joining and Welding Research Institute, Osaka University, Osaka 5670047, Japan
2
Kobe Steel, Ltd., Kanagawa 251-8551, Japan
3
CSIRO Manufacturing, Lindfield, NSW 2070, Australia
*
Author to whom correspondence should be addressed.
Materials 2020, 13(7), 1619; https://doi.org/10.3390/ma13071619
Submission received: 26 February 2020 / Revised: 23 March 2020 / Accepted: 24 March 2020 / Published: 1 April 2020
(This article belongs to the Collection Welding and Joining Processes of Materials)

Abstract

:
This study aims to reduce the diffusible hydrogen content in deposited metal during gas metal arc welding (GMAW) and flux-cored arc welding (FCAW) which induces cold cracking. To achieve this, a novel welding torch with a dual gas nozzle has been developed. This special welding torch decreases the hydrogen source gas evaporated from a welding wire by the suction from the inner gas nozzle. In order to improve the suction efficiency of this evaporated gas, precise control of the suction gas flow is indispensable. In this paper, a simplified numerical simulation model of this process has been described. This model can take account of the evaporation of the hydrogen source gas from the wire while simulating the behavior of the shielding gas and the arc. Using this model, the effect of suction nozzle structure and torch operating conditions on suction gas flow pattern and suction efficiency was also investigated to understand the process mechanism. Furthermore, the diffusible hydrogen content in deposited metal was measured by chromatography as a validation step. Results show that some of the shielding gas introduced from a shielding nozzle was drawn inward and also branched into an upward flow that was sucked into the suction nozzle and a downward flow to a base metal. This branching height was defined as the suction limit height, which decisively governed the suction efficiency. As a result, in order to reduce the diffusible hydrogen, it was suggested that the suction limit height should be controlled towards below the wire position, where the evaporation rate of the hydrogen source gas peaks through optimization of the suction nozzle design and the torch operating conditions.

1. Introduction

In order to meet the demand for higher efficiency in various industries, the size of structures such as buildings is increasing day by day. Generally, in order to improve the strength and rigidity of the components, the approach taken is to increase the thickness and strength of the steel material. However, the use of these materials leads to problems, such as difficulty in controlling the welding process due to cold cracking.
The causes of cold cracking are generally related to four factors: base metal composition, diffusible hydrogen, residual stress and thermal history [1,2]. There are several technologies for preventing cold cracking.
For example, as a material technology, a Thermo-Mechanical Control Process (TMCP)-type high-tensile steel has been developed and is now widely used. This material can prevent a hardened structure occurring in a weld heat-affected zone. Other methods often involve diffusible hydrogen. The most common method is to preheat and postheat the work piece to increase the diffusivity of hydrogen in the steel and to release it from the base metal and weld metal. However, heat management such as preheating and postheating requires a great deal of workload and energy consumption, and there are also serious safety and health issues such as working in high temperature. Therefore, attention is focused on the diffusible hydrogen content in deposited metal. Hereinafter, the diffusible hydrogen content in deposited metal is referred to as the diffusible hydrogen content for omission. Decreasing this diffusible hydrogen will also aid in to lighten the heat management, as a measure for welding construction management of large structures.
For these reasons, much work has been carried out to reduce the diffusible hydrogen content for many years. The most basic technique to reduce the diffusible hydrogen content is to select low-hydrogen consumables and apply appropriate storage conditions [3]. Optimization is possible depending on welding parameters. For example, Kawabe et al. measured the diffusible hydrogen content of flux-cored arc welding (FCAW) under a constant welding current of 270 A with varying contact tip-to-work distances (CTWDs) [4]. Further, they found that the diffusible hydrogen content decreased with an increase in CTWDs despite the increased wire feeding speed (WFS). In cases with long CTWDs, a large part of the hydrogen source gas is considered to evaporate from a higher wire position due to enhanced wire temperature by Joule heating. Thus, the great part of this gas spreads out with shielding gas to the surroundings without entering the weld pool. Mukai et al. reported the diffusible hydrogen content increased almost in proportion to welding current under a constant CTWD, which is thought to be caused by an increase in WFS [5]. The relevance of the effect of main welding parameters on the diffusible hydrogen content was summarized by Fydrych et al. [6]. These results show that the diffusible hydrogen content can be reduced to some extent by optimizing welding parameters. However, in general, this optimization is severely limited due to the requirement to obtain a sound weld bead. Moreover, in order to prevent cold cracking, a more dramatic reduction of the diffusible hydrogen content is expected.
There are also many studies on improving welding materials, the oldest being on covered electrodes. Hydrogen reduction methods include raw material selection and treatment technology to reduce the amount of water (water-containing minerals, etc.) in the flux, and design technology to reduce the hydrogen partial pressure in the arc atmosphere with a gas-generating agent (without hydrogen) [7,8]. In order to reduce hydrogen in flux-cored wire, production technology for wire annealing in the manufacturing process is being studied. In this case, one paper is reported. The paper reports that the diffusible hydrogen content can be reduced to the level of 0.5 ml/100 g [9]. It was also reported that the diffusible hydrogen was considerably reduced by adding yttrium or neodymium as ferro powders in the metal core of welding consumables [10]. Retained austenite in the weldment also acts as hydrogen trap and reduces the diffusible hydrogen content [11]. The diffusible hydrogen can be manipulated through flux modification, which can be brought on by fluoride additions in the cored flux [12]. The paper concludes that a careful addition of oxidizing ingredients such as fluoride or calcite reduces the diffusible hydrogen.
Aside from welding materials, a welding method to reduce the diffusible hydrogen content using a special shielding gas has been studied [13], and it is reported that the diffusible hydrogen content in the weld metal is reduced by mixing CF4 in the shielding gas. However, there are still many issues to be considered, such as the safety of the above gas, instability of the arc, etc.
As a method for reducing the diffusible hydrogen content by using welding equipment, a novel welding torch with a dual gas nozzle, which enables suctioning the hydrogen source gas evaporated from a wire, has been developed. This torch was based on the results of the study on the evaporation of moisture and other hydrogen sources as well as its penetration route to the weld pool. Then, the feasibility of reducing the diffusible hydrogen content during gas metal arc welding (GMAW) and FCAW was discussed [4,14]. As a result, this torch was found to be effective for both GMAW and FCAW. Furthermore, in GMAW of high-tensile thick plates, cold cracking was successfully prevented [15]. In order to improve the suction efficiency of this welding torch, the design and operating conditions must be optimized based on a deep understanding of the process mechanism. In the previous paper [16], as a first step of the research, ignoring the evaporation of the hydrogen source gas from the wire, basic parametric investigation on suction gas flow pattern was carried out through numerical simulation. In this paper, a simplified numerical simulation model of this process has been described. This model can take account of the evaporation of the hydrogen source gas from the wire while simulating the behavior of the shielding gas and the arc. Using this model, the effect of suction nozzle structure and torch operating conditions on suction gas flow pattern and suction efficiency was mainly investigated to understand the process mechanism. The process mechanism is thought to be basically similar to GMAW and FCAW, and so only FCAW is addressed in this paper.

2. Simulation Model

2.1. Arc Model

We have developed a 3D numerical simulation model of FCAW using a novel torch to reduce the diffusible hydrogen content. In this model, the grade of the hydrogen source gas is assumed to be H2O. This arc model is coupled with a simplified evaporation model of H2O from the wire described in the next subsection. The arc model is conventionally used in the arc welding field [17]. Here, three levels of the suction nozzle length, the shielding gas flow rate and the suction gas rate are calculated for a parametric study.
Figure 1 shows a 3D simulation region with a width X of 40.0 mm, a length Y of 20.0 mm and a height Z of 56.5 mm, which consists from the region of a wire, a contact tip, a suction nozzle, a shielding nozzle and a gas. In order to reduce the computational load, a plane symmetrical region is assumed, and only one side of the region is calculated. The mesh size is non-uniform and approximately 0.1 mm at a minimum. The wire diameter is 1.2 mm and the contact tip-to-work distance (CTWD) is 25.0 mm. The inner diameter of the suction nozzle is 4.0 mm. The length of the suction nozzle is defined as the distance between the contact tip and the tip of the suction nozzle. The standard length is 12.0 mm. Two types of length are calculated—4.5 or 14.5 mm—against the standard length. The inner diameter of the shielding nozzle is 16.0 mm. The arc length is 4.0 mm. The contact tip region, the suction gas outlet region, the suction nozzle region, the shielding gas inlet region, the shielding nozzle region and the gas region are defined on the top boundary. The base metal surface is defined on the bottom boundary. The inside of the base metal is not considered in this simulation. The gas region is defined on the side boundary. The polarity and welding current is DC+ and 280 A, respectively. The shielding gas is CO2 and its flow rates are 15, 25 or 35 l/min, with 25 l/min as the standard condition. The suction rates are 3, 5 or 10 l/min, with 5 l/min as the standard condition. The suction rate of 0 corresponding to the conventional process was unavoidably omitted due to the difficulty in converging the calculations. In the initial condition, the simulation region is filled with nitrogen gas-simulating air in order to investigate effect of the gas suction on shielding effect. Based on the obtained distribution of nitrogen mole fraction, the shielding effect can be evaluated. Table 1 shows the simulation conditions.
In this simulation, distributions of the temperature, flow, CO2 mole fraction, etc., are obtained by solving the following equations assuming steady state.
Mass conservation:
· ( ρ u ) = S H 2 O
Momentum conservation:
· ( ρ u u ) = p + · τ + ρ g + j × B
Energy conservation:
· ( ρ h u ) = · ( k T ) + j · E R l o s s
Mass conservation of CO2:
· ( ρ Y C O 2 u ) = · ( ρ D C O 2 Y C O 2 )
Mass conservation of H2O:
· ( ρ Y H 2 O u ) = · ( ρ D H 2 O Y H 2 O ) + S H 2 O
Current conservation:
· σ Φ = 0
Ohm’s law:
j = σ Φ = σ E
Vector potential:
2 A = μ 0 j
Magnetic field:
B = × A
where ρ is the mass density, u is the velocity, SH2O is the source term relating to H2O evaporation from the wire, p is the pressure, τ is the viscosity, g is the gravity, j is the current density, B is the magnetic field, h is the enthalpy, k is the thermal conductivity, T is the temperature, E is the electric field, Rloss is the arc radiation loss, YCO2 is the CO2 mass fraction, DCO2 is the diffusion coefficient of CO2 in N2, YH2O is the H2O mass fraction, DH2O is the diffusion coefficient of H2O in CO2, σ is the electrical conductivity, Φ is the electric potential, A is the vector potential, and μ 0 is the permeability of vacuum. The diffusion coefficients are obtained by solving the viscosity approximation equation [18].
Table 2 shows the boundary conditions. The gauge pressure of the outer boundary in contact with the gas region is 0. The specified mass flow rates to the suction gas outlet and the shielding gas inlet are given. The temperature of 300 K on the outer boundary is given. The constant temperature of 300 K inside the contact tip is set for simplicity. In the wire, the temperature is 300 K just below the contact tip and 1800 K at the wire tip, and the temperature rises linearly from the contact tip to the wire tip. On the boundaries in contact with the gas region except for the shielding gas inlet, two types of conditions are given. The gradient of mass fraction of CO2 and H2O is 0 where the gas flows out, and the mass fraction of CO2 and H2O is 0 where the gas flows in. The mass fraction of CO2 is 1 and that of H2O is 0 on the shielding gas inlet. The current is given inside the contact tip region on the top boundary and conducts to the bottom boundary, where the potential is set to 0. The vector potential is 0 on the side boundary and the gradient of potential is 0 on the top and bottom boundaries.
The thermodynamic and transport properties of the arc as functions of temperature and CO2 mole fraction are calculated [19,20,21] under the local thermodynamic equilibrium assumption [22]. The effect of the contamination of H2O into CO2 or N2 on the thermodynamic and transport properties is ignored, because the maximum mole fraction of H2O is only below 10−3% as presented in Section 3. Metal vapor evaporation from a droplet and metal transfer are not considered for simplicity. The calculation is carried out using ANSYS Fluent 18.1 (Ansys, Inc., Canonsburg, PA, USA).

2.2. Simplified Evaporation Model of the Hydrogen Source Gas

The model in simulation described the evaporation process of H2O, which is considered as the major hydrogen source gas in a flux-cored wire. H2O is thought to be mainly contained in fluxes. The evaporation process is very complex and is extremely difficult to model accurately. Here, the source term, SH2O, in Equation (1) and in Equation (5), is assumed to be obtained taking into account the evaporation rate per unit volume, Reva, being the Arrhenius type function as presented in Equation (10). SH2O is determined so that the volume integration of Reva inside the wire at a certain height agrees with the area integration of evaporation flux on the wire surface calculated from SH2O.
R e v a = A exp ( E a R T w ) × Y H 2 O W × M w i r e
where A is the constant, Ea is the activation energy (mole evaporation enthalpy at 100 ℃: 40.7 kJ/mol), R is the gas constant, Tw is the wire temperature, YH2OW is H2O content (mass fraction) in the wire, and Mwire is the mass density of the wire material. The constant A is determined taking into account experimental measurement of the diffusible hydrogen content as follows.
Equation (11) is a mass conservation equation of H2O in the wire. u w i r e is the wire feeding speed. The source term, SH2OW, related to the H2O consumption in the wire by evaporation is also calculated form Reva. SH2OW is only given to cells adjacent to the surface. DH2OW is the diffusion coefficient virtually defined for providing H2O around the wire center to the wire surface.
· ( ρ Y H 2 O W u w i r e ) = · ( ρ D H 2 O W Y H 2 O W ) S H 2 O W
The H2O content is set to 400 ppm at the bottom of the contact tip, which is a typical value of flux-cored wire. H2O in the wire is transported to the wire tip end at a wire feeding speed of 15.0 m/min, and its content is gradually decreased due to the evaporation.
In order to determine A, the diffusible hydrogen content was experimentally measured as a function of the suction nozzle length. The experimental method is described in Section 3. Figure 2 shows the suction nozzle design and the measured diffusible hydrogen content. The result for suction nozzle lengths of 4.5, 7.0, 9.5 and 12.0 mm was presented together with that for conventional torch. For the former, an approximated straight line is also presented due to large variations in the plot. As the suction nozzle length increased, the diffusible hydrogen content decreased almost linearly. The straight line shows that the diffusible hydrogen content at 12.0 mm decreases to approximately 65% of that at 4.5 mm. From the comparison with the diffusible hydrogen content in the case of the conventional torch, the suction was found to enable effectively reducing the diffusible hydrogen content.
Figure 3 shows the horizontal distribution of the H2O mole fraction over base metal surface, when A is 10,000. The results for suction nozzle lengths of 4.5 and 12.0 mm were compared. The weld pool width observed in the experiment was approximately 15 mm. It is assumed that the average value of the H2O mole fraction over the weld pool surface, which is defined as XH2Oave, is reflected in the amount of hydrogen absorbed in the weld pool and is finally correlated with the diffusible hydrogen content. From the comparison between two cases, when the suction nozzle length was extended from 4.5 to 12.0 mm, the average value of the H2O mole fraction over the weld pool surface decreased to 63%, which almost correlated with the decrease in the diffusible hydrogen content of 65% obtained through the experiment. Therefore, an A of 10,000 was determined to be used in this calculation. Details of the above calculation results are given in Section 4.
Finally, Figure 4 shows the axial distribution of the H2O content in the wire, wire temperature and H2O evaporation rate. As described above, it is assumed that the wire temperature rises linearly from the contact tip towards the wire tip. The evaporation rate, Reva, increased with wire temperature and the H2O content gradually decreased due to evaporation. Following this, the evaporation rate decreased below the peak at a distance of 15 mm from the contact tip. At the wire tip, H2O content became 40 ppm, but this was finally emitted from the wire tip to the arc.
As described above, since it is extremely difficult to model the H2O evaporation process from the wire strictly, the evaporation model was constructed under some assumptions.

3. Diffusible Hydrogen Content Measurement

The amount of the diffusible hydrogen content in the weld metal was measured by the gas chromatography method according to JIS Z 3118 (2007). This measuring method has good correlation with the mercury method. However, there are different opinions about the constant of proportionality. It has been said that the same level of measurement results can be obtained by both methods [23]. JIS Z 3118 is based on this point. A comprehensive review of several other reports suggests that the value of JIS Z 3118 is approximately 0.7 times larger than the measured value of the mercury method [24,25,26]. In any case, however, it was considered to be effective as an experimental value used for relative comparison with the simulation. The outline of measurement is as follows.

3.1. Preparation of Measurement Samples

A test plate (JIS G 3106 (2015) SM400B (400 MPa class steel): 12 mm × 25 mm × 40 mm) and two end tabs (12 mm × 25 mm × 45 mm) that were subjected to hydrogen removal treatment in advance were welded. End tabs were arranged at both ends of the test plate so that the start and end of welding do not affect the measurement. After welding, the test plate was quenched in iced water and stored in dry ice-saturated alcohol solution after removing the end tabs.

3.2. Collection of Diffusible Hydrogen

The prepared measurement sample was inserted into a dedicated collection vessel and held at 45 °C for 72 hours to release diffusible hydrogen from the inside of the sample into the vessel.

3.3. Measurement of Amount of Hydrogen

The collection vessel was connected to a measuring device, and hydrogen was separated and determined by a column while flowing Ar was used as a carrier gas. The determined amount of hydrogen was converted to the amount per mass of the deposited metal measured from the weight change in the test plate and treated as the amount of the diffusible hydrogen content in the weld metal.
In this test, a welding wire with a diameter of 1.2 mm was applied according to JIS Z 3313 T 49J 0 T1-1 C A-U (Flux-cored wire for 490 MPa class steel). Welding was carried out by changing parameters as in the above-mentioned simulation. The arc voltage was 32 V and the welding speed was 350 mm/min, and both were kept constant. This measurement was performed at least three times under each condition.

4. Results and Discussion

Figure 5 shows 2D distributions of temperature, flow velocity and the mole fraction of nitrogen on the symmetry plane in the standard condition.
Figure 5a indicated that the arc temperature reached approximately 30,000 K at the maximum around the wire tip due to strong Joule heating by the high current density. The metal vapor evaporation was not considered in this simulation as explained above. When the metal vapor is considered, it is said that the arc temperature will become lower, because the current flow path is thought to expand by the change of the thermophysical property of arc plasma due to mixing of the metal vapor and shielding gas [27].
Figure 5b shows path lines of the gas flow colored by the flow velocity overwritten on the mesh of the torch and base metal. Although the flow velocity increased up to 200 m/s near the wire tip due to a large Lorenz force, the maximum value of the scale range was set to 30 m/s because the flow velocity around the suction nozzle tip was especially important. Some of the shielding gas introduced from the shielding nozzle was drawn inward and branched into an upward flow that was sucked into the suction nozzle and a downward flow to the base metal approximately 3 mm below the suction nozzle. This branching height is defined as the suction limit height.
Figure 5c shows the distribution of nitrogen mole fraction. The blue region shows a region where the CO2 mole fraction is high, and the shielding effect is good. However, this region slightly narrows towards the center when approaching from the shielding nozzle exit to the base metal. The weld pool, with width of approximately 15 mm, was covered with the shielding gas. Furthermore, nitrogen penetration into the weld pool during arc welding especially dominates in the region where molecules are dissociated by high-temperature arc plasma [27,28]. Nitrogen dissociation occurs above approximately 4000 K [29]. In this model, which does not consider the metal vapor, this high temperature range corresponded to a diameter of 12 mm. Since the nitrogen mole fraction was sufficiently low in the above region, the effect of gas suction from the nozzle on the shielding effect was thought to be very small.
Figure 5d shows the H2O concentration in the wire. H2O decreased from 400 ppm at the bottom of the contact tip with decreasing height.
Figure 5e shows the mole fraction of H2O in the gas. ηsc is the suction efficiency obtained by dividing the suction rate of H2O by the total evaporation rate of H2O. The total evaporation rate is defined as area integration of the evaporation flux on the wire surface. The result indicated that almost half of the H2O evaporated from the wire was sucked by the suction nozzle in the standard condition.
Considering the effect of torch operating conditions on distributions of the suction gas flow and the mole fraction of H2O, simulations are shown in Figure 6, Figure 7, Figure 8 and Figure 9. These figures show the effect of the shielding gas flow rate. The results at 15 and 35 l/min are presented in Figure 6 and Figure 8. Figure 7 shows a 1D distribution of Z component flow velocity along the line expressed as “velocity monitor” in Figure 1, where positive and negative values correspond to upward and downward velocities, respectively. A change in the sign of the velocity was seen at a distance of approximately 15 mm from the contact tip, corresponding to the suction limit height. It is expected that the lower suction limit height enables sucking the H2O evaporated from the wire into a wider region, which can contribute to the reduction of the diffusible hydrogen content. The gas flow velocity in the vicinity of the shielding nozzle and the suction nozzle increased with the shielding gas flow rate. It was also found that the suction limit height became lower with the increase in the shielding gas flow rate. Figure 8 shows that with a higher shielding gas flow rate of 35 l/min, ηsc was 55.8%, which was higher than 48.2% at 15 l/min. As a result of higher ηsc, XH2Oave became lower. From this result, the evaluation based on the suction limit height defined here is considered to be appropriate. Figure 9 shows the measured diffusible hydrogen content and XH2Oave as a function of the shielding gas flow rate. The diffusible hydrogen content was found to decrease with the shielding gas flow rate, which was in line with the tendency of change in XH2Oave in the simulation result.
Figure 10, Figure 11, Figure 12 and Figure 13 show the effect of the suction rate. In Figure 10 and Figure 12, the results at 3 and 10 l/min are presented. The gas flow velocity in the vicinity around the suction nozzle largely rose as the suction gas rate increased. In addition, the suction limit height lowered when the suction gas rate was 3 l/min. Figure 12 indicated that even if the higher suction gas rate is set, the higher ηsc does not obtained. At a suction gas rate of 10 l/min, ηsc was 48.8% against 59.6% at a suction gas rate of 3 l/min, and thus this leads to a difference of XH2Oave between two suction rate cases. The H2O in the gas was transported by advection and diffusion, as presented in Equation (5). If diffusion plays an important role in the transport process of H2O, the increase in the gas flow velocity in the vicinity around the suction nozzle is thought to increase ηsc. However, such a tendency was not seen in the result. This implies that the advection dominates the transport process. Figure 13 shows the measured diffusible hydrogen content and XH2Oave as a function of the suction rate. The diffusible hydrogen content was found to increase with a suction rate above 3 l/min and then become almost constant, which was also in line with the tendency of XH2Oave.
Considering the results from Figure 10, Figure 11, Figure 12 and Figure 13 together with the shielding gas flow rate dependency shown in Figure 6, Figure 7, Figure 8 and Figure 9, the relative strength of the shielding gas flow and suction gas flow around the vicinity of the suction nozzle is thought to govern the suction limit height. When the effect of the shielding gas flow is stronger than that of the suction gas, the suction limit height moves to a lower location, leading to a smaller XH2Oave. This implies that an optimal control of the shielding gas flow rate and suction rate enables reducing the diffusible hydrogen content to some extent.
Finally, the effect of suction nozzle structure on distributions of the suction gas flow and mole fraction of H2O is discussed in this paragraph. Figure 14, Figure 15, Figure 16 and Figure 17 show the effect of the suction nozzle length. In Figure 14 and Figure 16, the results at a suction nozzle length of 4.5 and 14.5 mm are presented. Although the suction limit height greatly lowered with the increase in the suction nozzle length, the relative distance from the suction nozzle tip to the suction limit height was almost a constant value of approximately 3 mm under any conditions. This relative distance was hardly influenced by the suction nozzle length. Figure 17 shows the measured the diffusible hydrogen content and XH2Oave as a function of the shielding gas flow rate. It was difficult to carry out the experiment for a suction nozzle length of 14.5 mm, due to the too short distance between the suction nozzle tip and the arc causing the attachment of spatters to the nozzle, and so only experimental results suction nozzle lengths between 4.5 and 12.0 mm were presented. For a nozzle length of 4.5 mm, ηsc was only 3.5%, which indicated that the suction effect was weak. When the suction nozzle length was extended to 14.5 mm, ηsc was increased to 76.0% and XH2Oave was decreased to 4.53 × 10⁻⁵%, which was less than half of that in the case of 4.5 mm. As presented in Figure 4, the evaporation rate of H2O was predicted to peak at a distance of 15 mm from the contact tip. Accordingly, a suction nozzle length of 14.5 mm is considered to be the most effective at to enable to sucking the H2O effectively.
The changes in the H2O mole fraction on the weld pool surface in numerical simulation results were compared with the change in the diffusible hydrogen content in experimental results for all the parameters. From the approximate agreement between both the tendencies, the simulation result is considered to almost correctly reflect the behavior of the hydrogen source gas. In this study, only the behavior of the hydrogen source gas in a gas phase was evaluated. However, in the future, the hydrogen diffusion process in deposited metal [30] should be also taken into account in the simulation for direct comparison with the diffusible hydrogen content obtained in the experiment.
Consequently, in order to reduce the diffusible hydrogen content, it was suggested that the suction limit height should be controlled towards below the wire position, the peak of the hydrogen source gas evaporation rate. These two locations can be changed by controlling the suction nozzle design and the torch operating conditions. Furthermore, optimization of the current waveform or adequately designed long suction nozzles have the possibility to decrease the diffusible hydrogen content further. The former is one idea to shift the peak evaporation location upward by enhancing Joule heating of the wire. The latter was found to be particularly effective, but it needs further development of the suction nozzle to prevent spatter attachment.

5. Conclusions

In order to reduce the amount of the diffusible hydrogen content in GMAW and FCAW, a novel torch equipped with a dual gas nozzle capable of suctioning the hydrogen source gas desorbed from the wire has been developed. In this paper, the effect of suction nozzle structure and torch operating conditions on suction gas flow pattern and suction efficiency was clarified. The main conclusions are as follows.
(1)
Some of the shielding gas introduced from a shielding nozzle was drawn inward and branched into an upward flow that was sucked into the suction nozzle and a downward flow to a base metal. This branching height was defined as the suction limit height, which decisively governed the suction efficiency.
(2)
The effect of gas suction from the nozzle on the shielding effect of the welding was shown to be small.
(3)
In order to reduce the diffusible hydrogen, it was suggested that the suction limit height should be controlled towards below the wire position, where the evaporation rate of the hydrogen source gas peaks through optimization of the suction nozzle design and the torch operating conditions.
(4)
The relative relationship between shielding gas flow and suction gas flow around the vicinity of the suction nozzle were thought to govern the suction limit height. When the effect of the shielding gas flow was stronger than that of the suction gas, the suction limit height moved to a lower location, leading to a smaller XH2Oave.
(5)
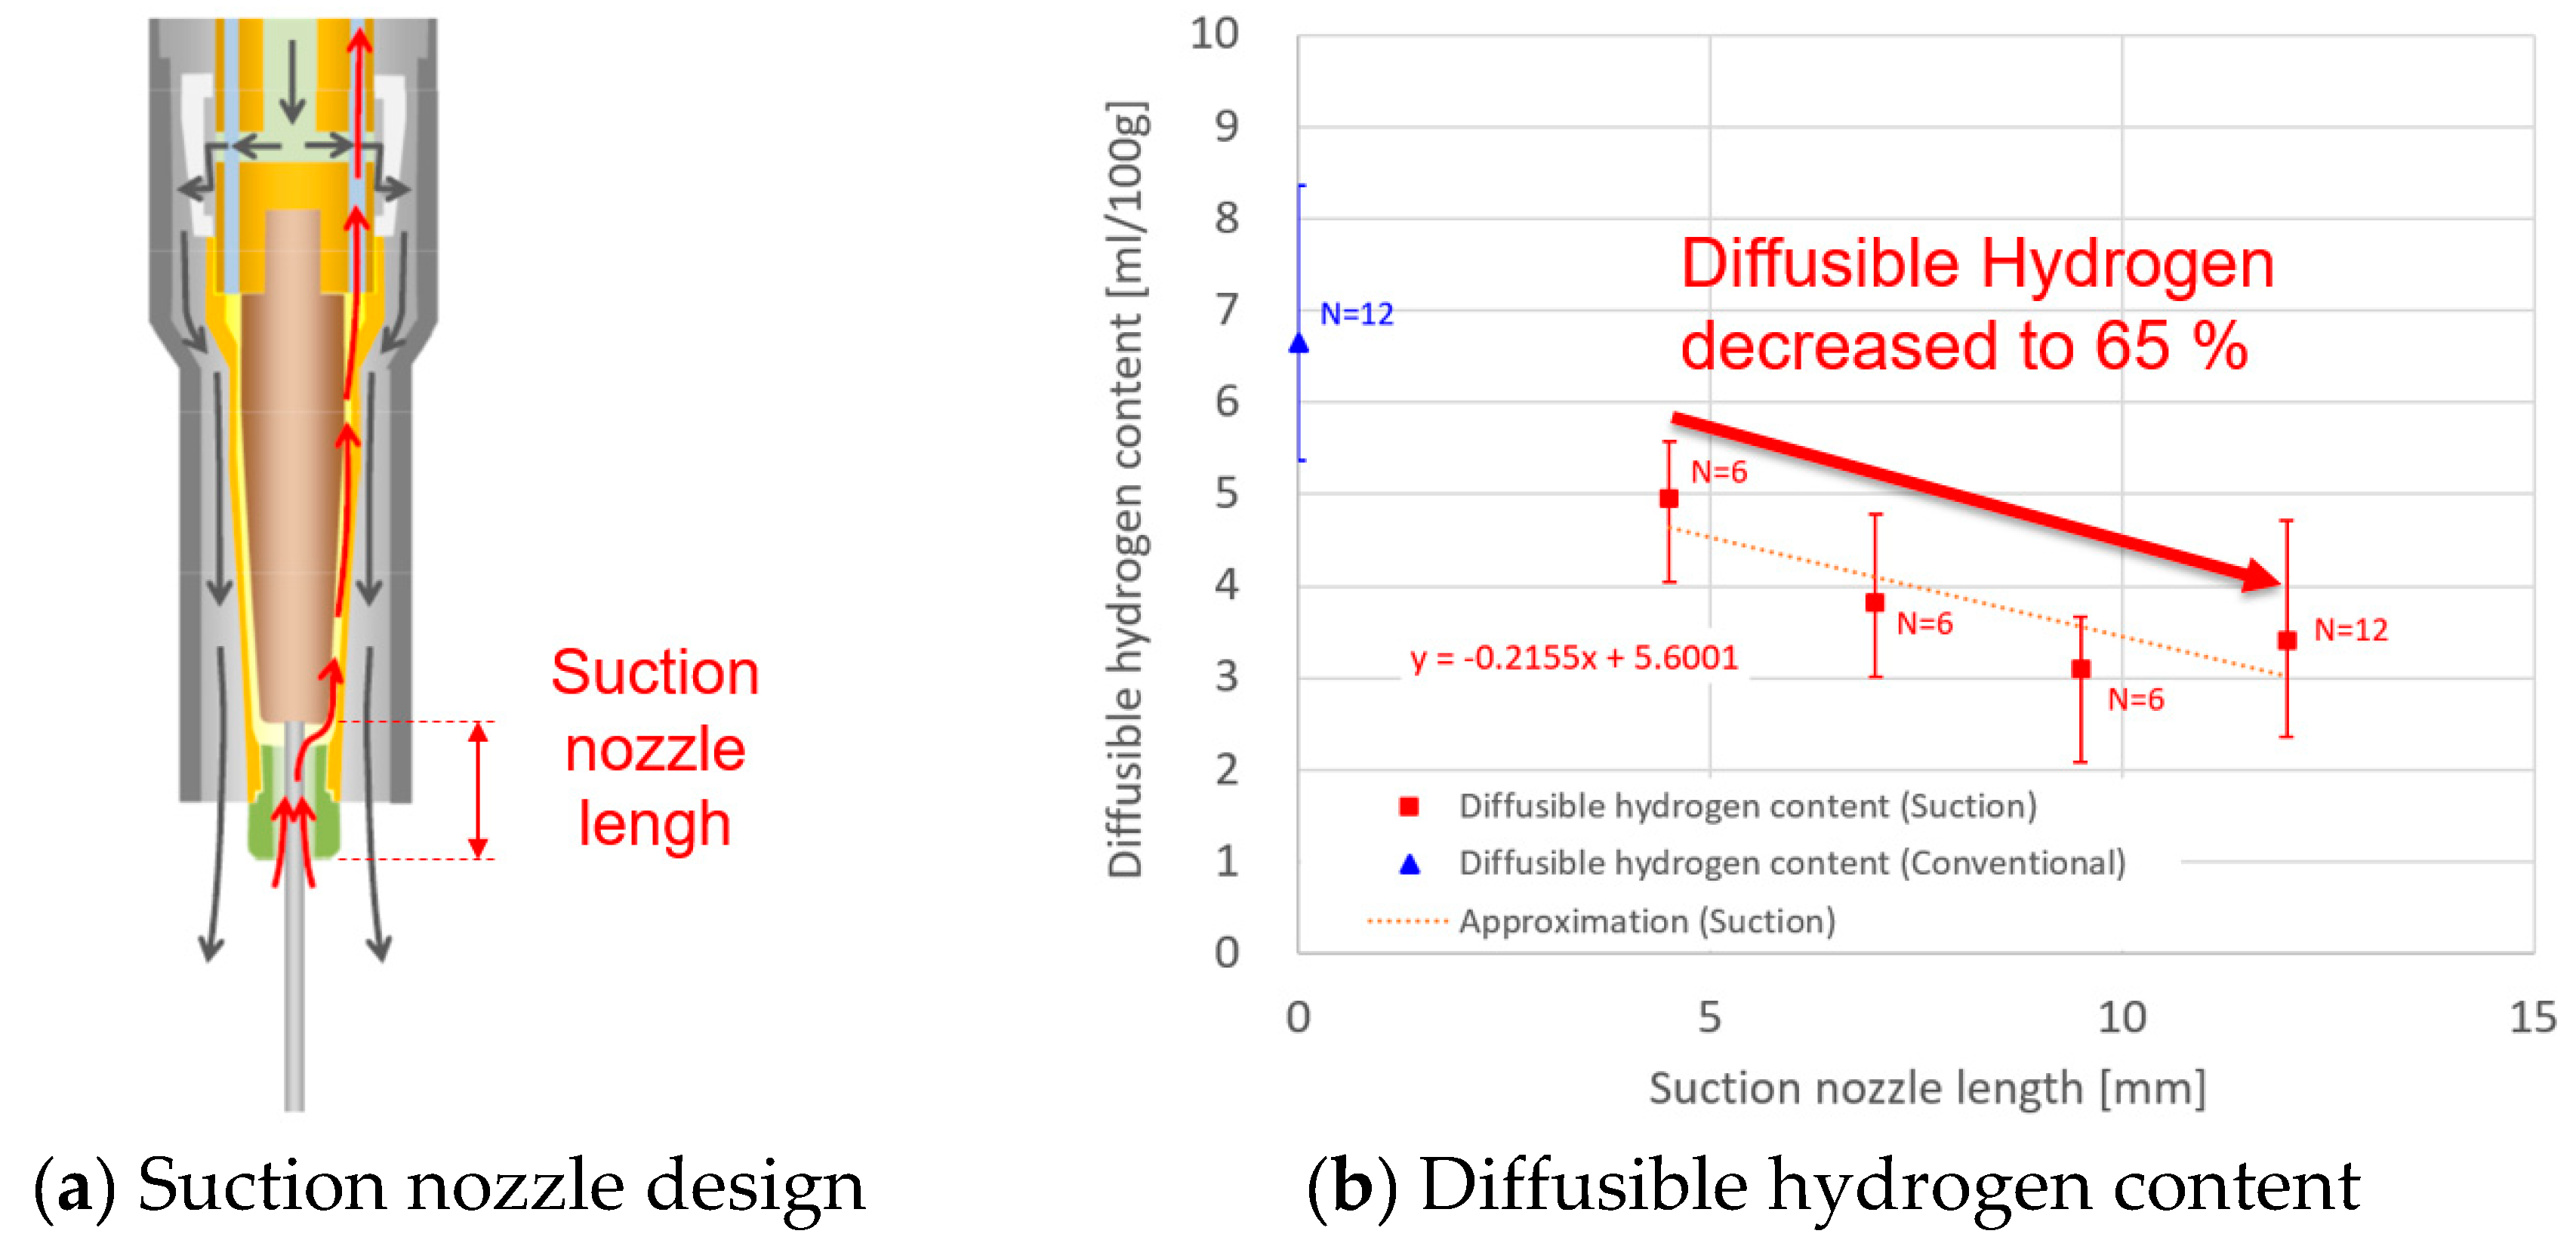
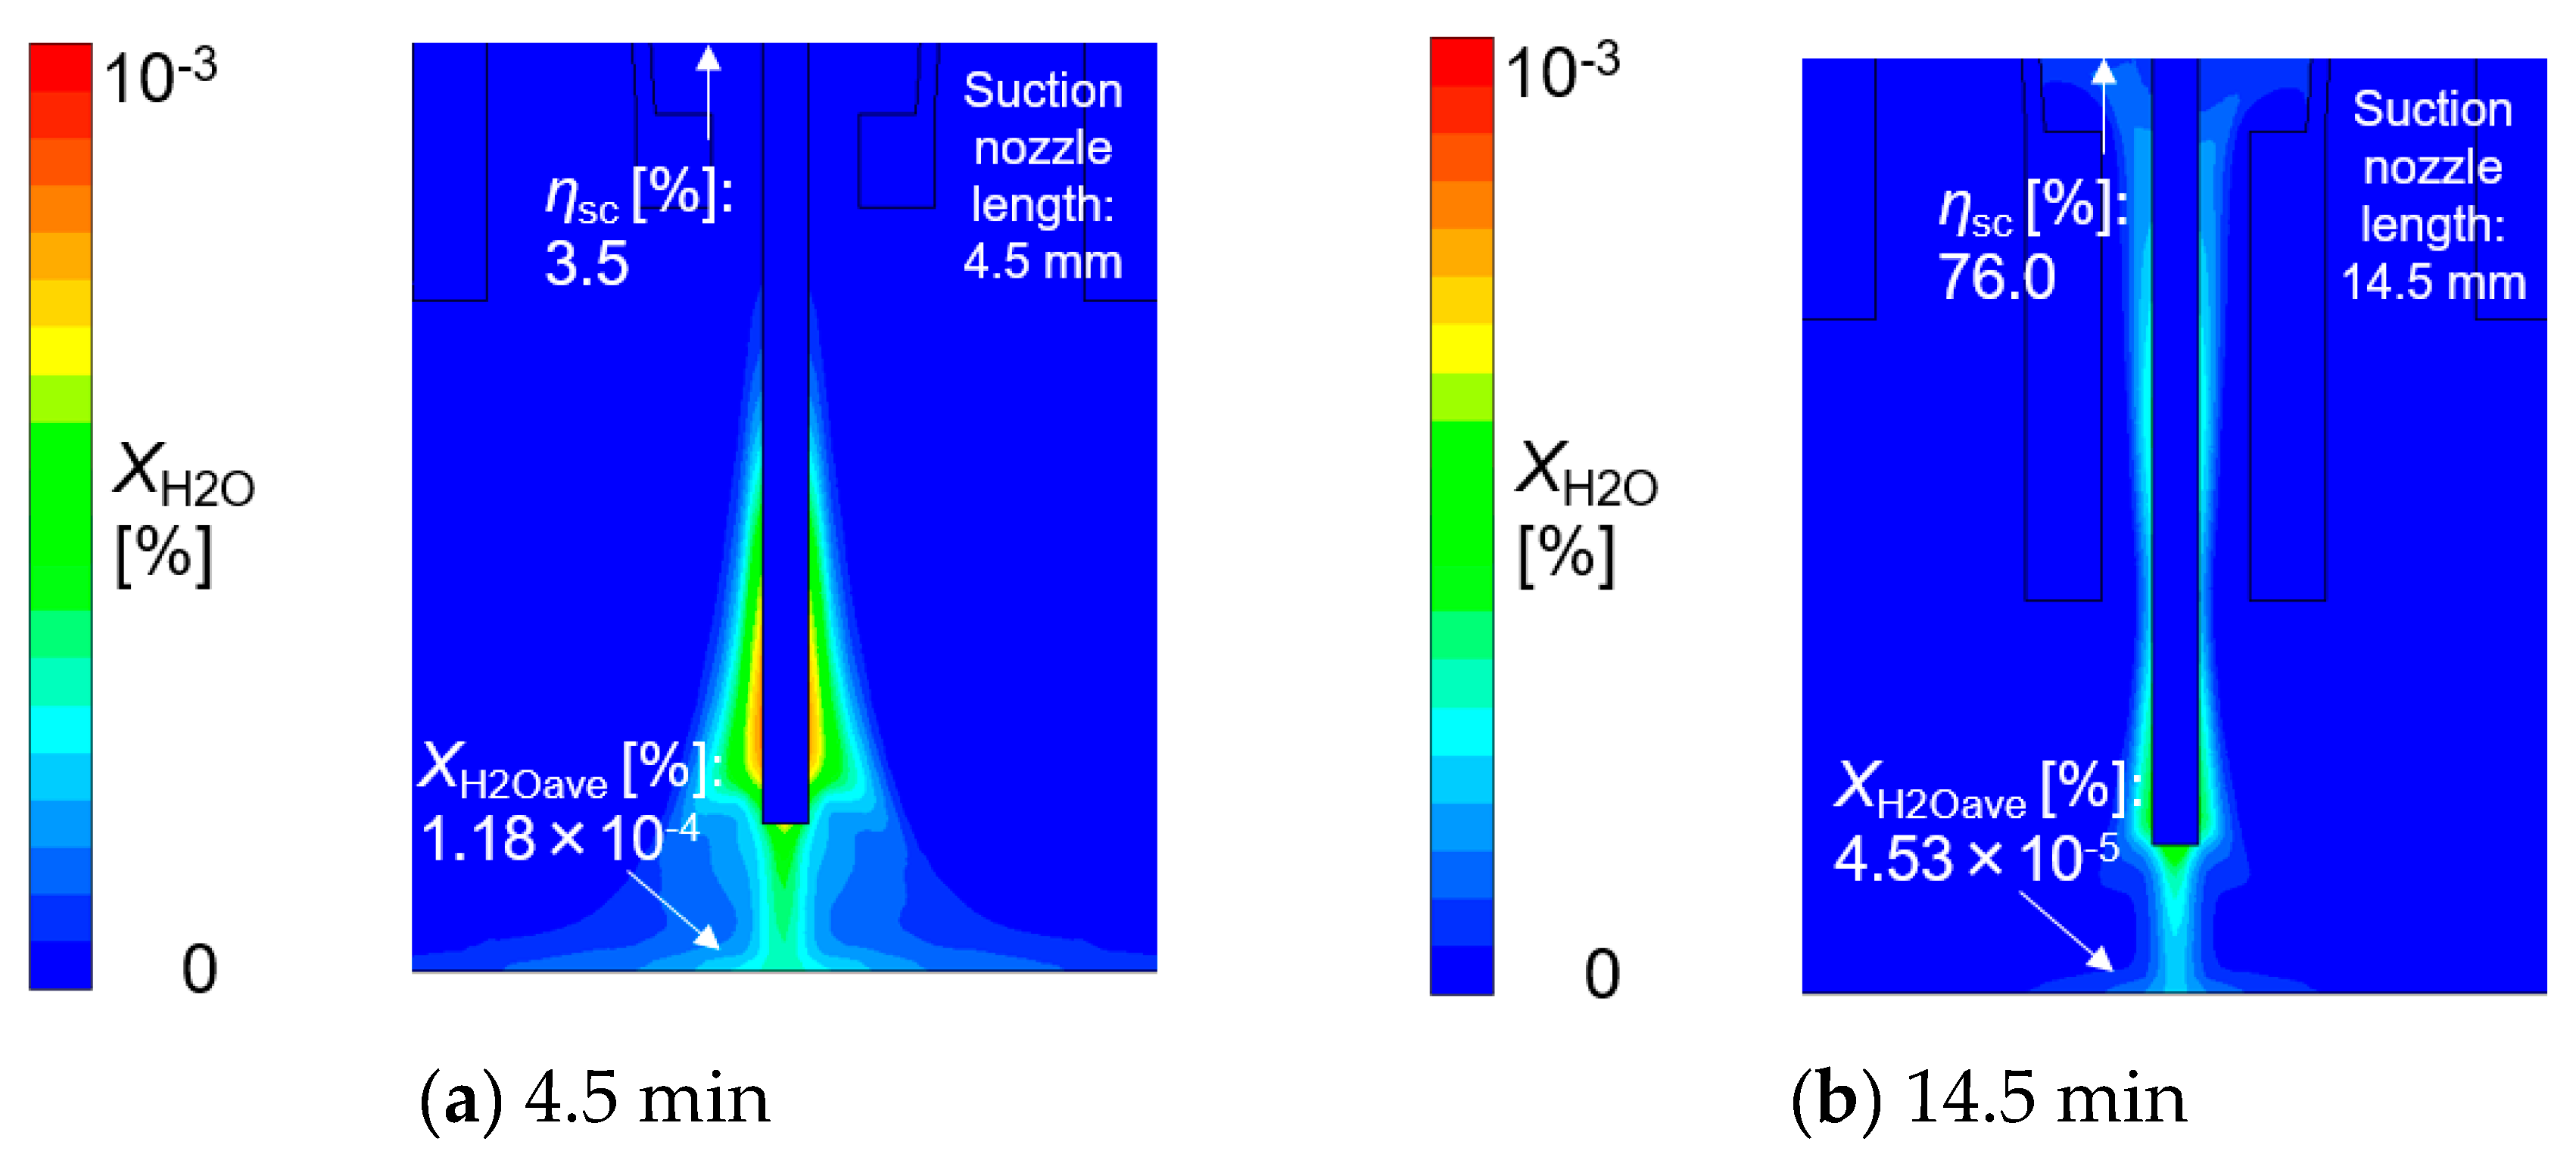
This method was suggested to be particularly effective for reducing the diffusible hydrogen content to extend the suction nozzle length. However, further development to prevent spatter attachment to the nozzle is required.

Author Contributions

S.T. performed all the calculations and wrote this manuscript. N.M. carried out all the experiments. A.B.M. calculated the thermodynamic and transport properties of gas. Y.I., T.S. and M.T. participated in the discussion of the results. All authors have read and agreed to the published version of the manuscript.

Funding

This research received no external funding.

Conflicts of Interest

The authors declare no conflict of interest.

References

  1. Kasuya, T. Cold Cracking Assessment of Steel by Experiments and Numerical Simulations. J. Jpn. Weld. Soc. 2015, 84, 45–50. [Google Scholar] [CrossRef]
  2. Yurioka, N.; Kasuya, T. A Chart Method to Determine Necessary Preheat Temperature in Steel Welding. Q. J. Jpn. Weld. Soc. 1995, 13, 347–357. [Google Scholar] [CrossRef] [Green Version]
  3. Swierczynska, A. Effect of Storage Conditions of Rutile Flux Cored Welding Wires on Properties of Welds. Adv. Mater. Sci. 2019, 19, 46–56. [Google Scholar] [CrossRef] [Green Version]
  4. Kawabe, N.; Maruyama, T.; Yamazaki, K.; Suzuki, R. Development of low hydrogen welding process for gas shielded arc welding. Weld. World 2016, 60, 383–392. [Google Scholar]
  5. Mukai, N.; Suzuki, R. Research on the Effects of Welding-wire-related Factors Affecting Diffusible Hydrogen Content. Q. J. Jpn Weld. Soc. 2017, 35, 102–109. [Google Scholar] [CrossRef] [Green Version]
  6. Fydrych, D.; Świerczyńska, A.; Tomków, J. Diffusible hydrogen control in flux cored arc welding process. Key Eng. Mater. 2014, 597, 171–178. [Google Scholar] [CrossRef]
  7. Godai, T.; Sugino, M. The Hydrogen Sources in Covered Arc Welding. J. Jpn. Weld. Soc. 1976, 45–47, 14–20. [Google Scholar]
  8. Yamane, K. Low Hydrogen Type Electrode. J. Jpn. Weld. Soc. 1999, 68, 18–24. [Google Scholar] [CrossRef]
  9. Kasuya, T.; Simura, R.; Totsuka, Y. Annealing of flux cored wires and its effect on diffusible hydrogen content. Prepr. Natl. Meet. Jpn. Weld. Soc. 2009, 84, 311–312. [Google Scholar]
  10. Lensing, C.A.; Park, Y.D.; Maroef, I.S.; Olson, D.L. Yttrium Hydrogen Trapping to Manage Hydrogen in HSLA Steel Welds. Weld. J. 2004, 83–89, 254s–266s. [Google Scholar]
  11. Park, Y.D.; Maroef, I.S.; Landau, A.; Olson, D.L. Retained Austenite as a Hydrogen Trap in Steel Welds. Weld. J. 2002, 81–82, 27s–35s. [Google Scholar]
  12. Mathushita, M.; Liu, S. Hydrogen Control in Steel Weld Metal by Means of Fluoride Additions in Welding Flux. Weld. J. 2000, 80, 295s–303s. [Google Scholar]
  13. Fiore, S.; Barhorst, S.; Amata, M.; Bundy, J. A new method for reducing diffusible hydrogen in weld metal. IIW Doc. XII-2103-12. 2012. [Google Scholar]
  14. Mukai, N.; Maruyama, T.; Suzuki, R. Research and Development on the Welding Process for Reducing Diffusible Hydrogen. Q. J. Jpn Weld. Soc. 2018, 36, 86–93. [Google Scholar] [CrossRef]
  15. Mukai, N.; Inoue, Y.; Sasakura, S.; Kinoshita, Y. Prevention of Cold Cracking by the Welding Process for Reducing Diffusible Hydrogen in High-Tensile Thick Plate Welding. Q. J. Jpn Weld. Soc. 2020, 38, 41–51. [Google Scholar] [CrossRef] [Green Version]
  16. Tashiro, S.; Mukai, N.; Inoue, Y.; Murphy, A.B.; Suga, T.; Tanaka, M. Numerical Simulation of Gas Flow in a Novel Torch for Reducing Diffusible Hydrogen. J. Smart Process. 2019, 8, 219–224. [Google Scholar] [CrossRef] [Green Version]
  17. Tanaka, M.; Lowke, J.J. Predictions of weld pool profiles using plasma physics. J. Phys. D Appl. Phys. 2007, 40, R1–R23. [Google Scholar] [CrossRef]
  18. Wilke, C.R. A Viscosity Equation for Gas Mixtures. J. Chem. Phys. 1950, 18, 517–519. [Google Scholar] [CrossRef]
  19. Murphy, A.B.; Arundell, C.J. Transport coefficients of argon, nitrogen, oxygen, argon-nitrogen and argon-oxygen plasmas. Plasma Chem. Plasma Process. 1994, 14, 451–490. [Google Scholar] [CrossRef]
  20. Murphy, A.B. Transport coefficients of air, argon-air, nitrogen-air and oxygen-air plasmas. Plasma Chem. Plasma Process. 1995, 15, 279–307. [Google Scholar] [CrossRef]
  21. Murphy, A.B. The effect of metal vapour in arc welding. J. Phys. D Appl. Phys. 2010, 43, 434001. [Google Scholar] [CrossRef]
  22. Boulos, M.I.; Fauchais, P.; Pfender, E. Thermal Plasmas: Fundamentals and Applications; Springer: New York, NY, USA, 1994; pp. 4–5. [Google Scholar]
  23. Subcommittee No.2, Technical Committee, Welding Rod Division, Japan Welding Engineering Society Method for Measurement of Hydrogen Evolved Gas Shielded Arc Welds. IIW Doc. II-A-561-82. 1982.
  24. de Abreu, L.C.; Modenesi, P.J.; Villani-Marques, P. Comparative study of methods for determining the diffusible hydrogen content in welds. Weld. Int. 2009, 9, 26–31. [Google Scholar] [CrossRef]
  25. Kannengiesser, T.; Tiersch, N. Comparative Study between Hot Extraction Methods and Mercury Method-A National Round Robin Test. Weld. World 2010, 54, R108–R114. [Google Scholar] [CrossRef]
  26. Padhy, G.K.; Komizo, Y. Diffusible Hydrogen in Steel Weldments. Trans. JWRI 2013, 42, 39–62. [Google Scholar]
  27. Tashiro, S.; Murphy, A.B.; Tanaka, M. Numerical simulation of fume formation process in GMA welding. Weld. World 2018, 62, 1331–1339. [Google Scholar] [CrossRef]
  28. Uda, M.; Ohno, S.; Wada, T. Solubility of Nitrogen in Arc- and Levitation-Melted Iron Alloys. J. Jpn. Weld. Soc. 1969, 38, 382–392. [Google Scholar] [CrossRef]
  29. Kodama, S.; Sugiura, K.; Nakanishi, S.; Tsujimura, Y.; Tanaka, M.; Murphy, A.B. Nitrogen Absorption Phenomenon of GTA Welding with Nitrogen Mixed Shielding Gases. Q. J. Jpn. Weld. Soc. 2013, 31, 41–47. [Google Scholar] [CrossRef]
  30. Xiong, Z.; Zheng, W.; Tang, L.; Yang, J. Self-Gathering Effect of the Hydrogen Diffusion in Welding Induced by the Solid-State Phase Transformation. Materials 2019, 12, 2897. [Google Scholar] [CrossRef] [Green Version]
Figure 1. Schematic illustration of the simulation region.
Materials 13 01619 g001
Figure 2. Diffusible hydrogen content measurement: (a) suction nozzle design; (b) diffusible hydrogen content measured as a function of contact tip-to-suction nozzle distance.
Materials 13 01619 g002
Figure 3. Horizontal distribution of the H2O mole fraction over base metal surface.
Materials 13 01619 g003
Figure 4. Axial distribution of the H2O content in wire, wire temperature and H2O evaporation rate.
Materials 13 01619 g004
Figure 5. An example of the results in the standard condition: (a) temperature, (b) flow velocity and (c) mole fraction of N2, (d) H2O concentration in the wire and (e) mole fraction of H2O in the gas.
Materials 13 01619 g005
Figure 6. The effect of the shielding gas flow rate on gas flow velocity: (a) 15 l/min, (b) 35 l/min.
Materials 13 01619 g006
Figure 7. Axial distribution of Z component flow velocity as a function of the shielding gas flow rate.
Materials 13 01619 g007
Figure 8. The effect of the shielding gas flow rate on the mole fraction of H2O: (a) 15 l/min, (b) 35 l/min.
Materials 13 01619 g008
Figure 9. The measured diffusible hydrogen content and the averaged H2O mole fraction as a function of the shielding gas flow rate.
Materials 13 01619 g009
Figure 10. The effect of the suction rate on gas flow velocity: (a) 3 l/min, (b) 10 l/min.
Materials 13 01619 g010
Figure 11. Axial distribution of Z component flow velocity as a function of the suction rate.
Materials 13 01619 g011
Figure 12. The effect of the suction rate on the mole fraction of H2O: (a) 3 l/min, (b) 10 l/min.
Materials 13 01619 g012
Figure 13. The measured diffusible hydrogen content and the averaged H2O mole fraction as a function of the suction rate.
Materials 13 01619 g013
Figure 14. The effect of suction nozzle length on gas flow velocity: (a) 4.5 mm, (b) 14.5 mm.
Materials 13 01619 g014
Figure 15. Axial distribution of Z component flow velocity as a function of suction nozzle length.
Materials 13 01619 g015
Figure 16. The effect of suction nozzle length on the mole fraction of H2O: (a) 4.5 mm, (b) 14.5 mm.
Materials 13 01619 g016
Figure 17. The measured diffusible hydrogen content and the averaged H2O mole fraction as a function of suction nozzle length.
Materials 13 01619 g017
Table 1. Simulation conditions.
Region Size40.0 mm(X) × 20.0 mm(Y) × 56.5 mm(Z)
Shielding gasCO2
Shielding gas flow rate15, 25, or 35 l/min (25 l/min is the standard condition)
Suction nozzle length4.5, 12, or 14.5 mm (12 mm is the standard condition)
Suction nozzle diameter4 mm
Suction rate3, 5, or 10 l/min (5 l/min is the standard condition)
Contact tip-to-work distance (CTWD)25 mm
Arc length4 mm
Welding currentDC280 A
Table 2. Boundary conditions.
BoundaryVelocityMass Fraction of CO2Mass Fraction of H2OEnergyElectric PotentialVector Potential
TopShielding gas inlet u = u shieldYCO2 = 1YH2O = 0300 K∂Φ/∂n = 0∂Ai/∂n = 0
Suction gas outlet u = u suction∂YCO2/∂n = 0∂YH2O/∂n = 0300 K∂Φ/∂n = 0∂Ai/∂n = 0
Nozzles 300 K∂Φ/∂n = 0∂Ai/∂n = 0
Contact tip 300 Kσ∂Φ/∂n = jgiven∂Ai/∂n = 0
GasP = 0YCO2 = 0 (inflow)
YCO2/∂n = 0 (outflow)
YH2O = 0 (inflow)
YH2O/∂n = 0 (outflow)
300 K∂Φ/∂n = 0∂Ai/∂n = 0
SideGasP = 0YCO2 = 0 (inflow)
YCO2/∂n = 0 (outflow)
YH2O = 0 (inflow)
YH2O/∂n = 0 (outflow)
300 K∂Φ/∂n = 0Ai = 0
BottomBase metal u = 0∂YCO2/∂n = 0∂YH2O/∂n = 0300 KΦ = 0∂Ai/∂n = 0

