Experimental Examination of Electrical Characteristics for Portland Cement Mortar Frost Damage Evaluation


Abstract
1. Introduction
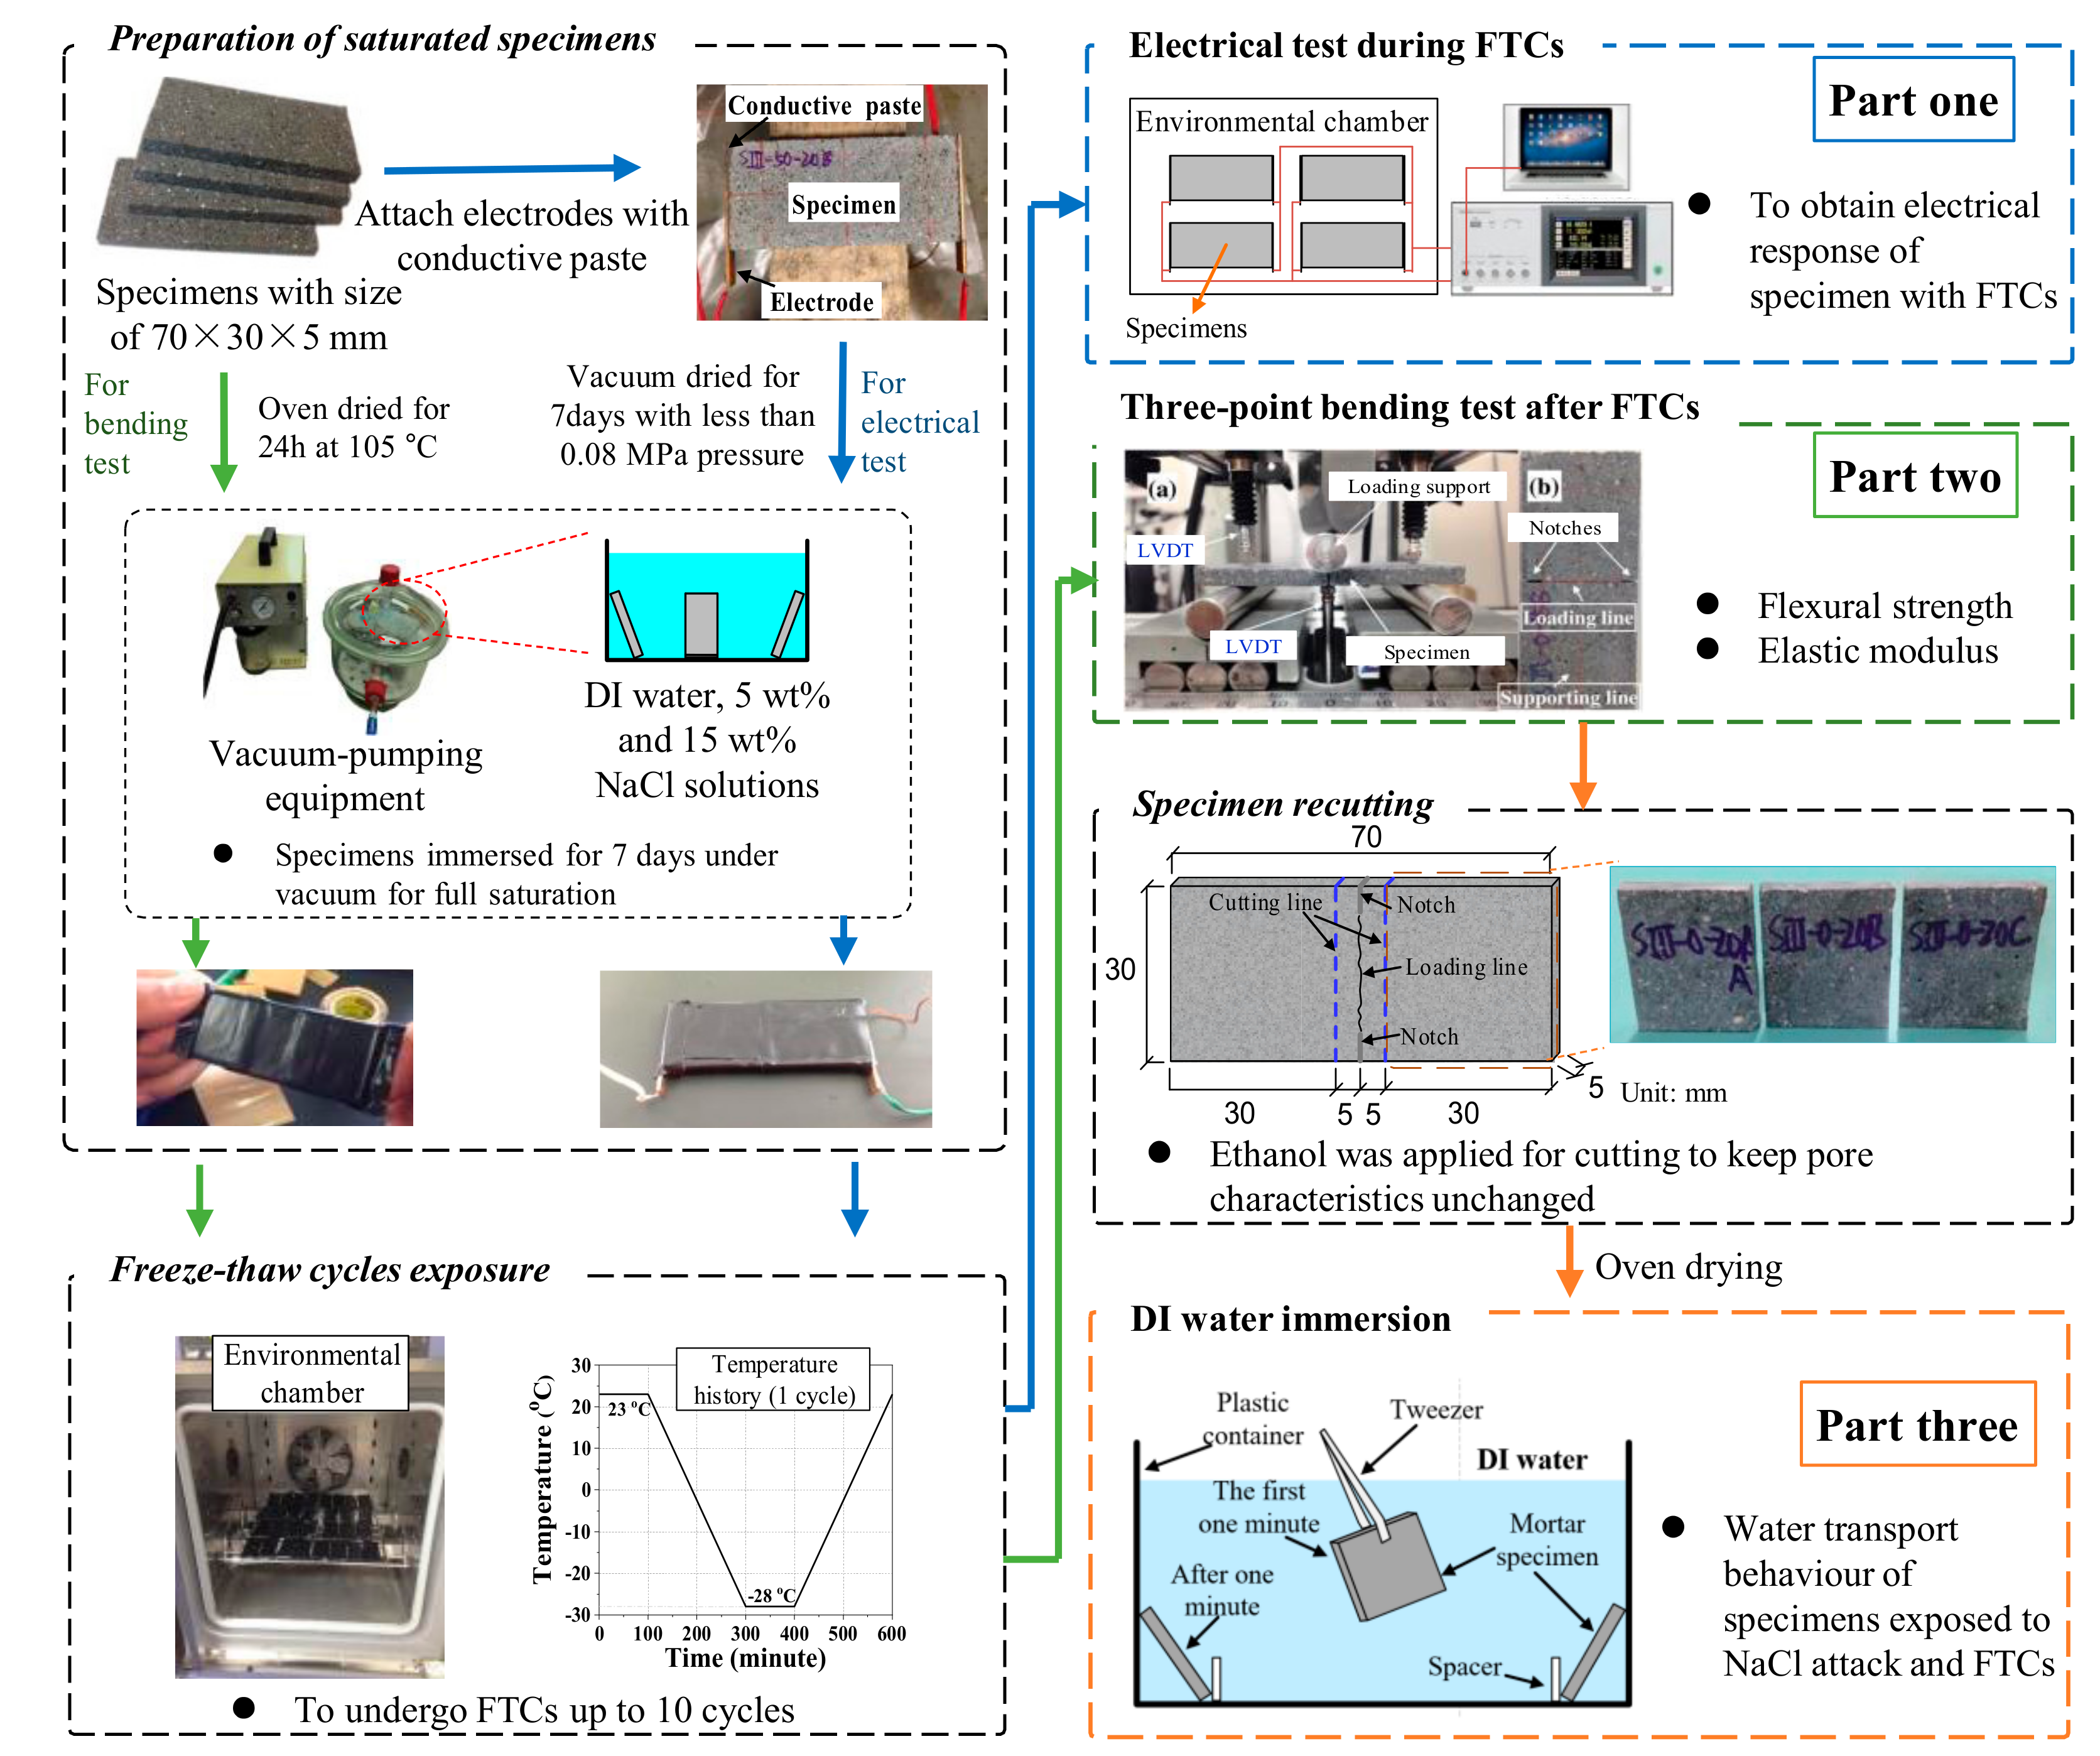
2. Test Programs
3. Test Results and Discussion
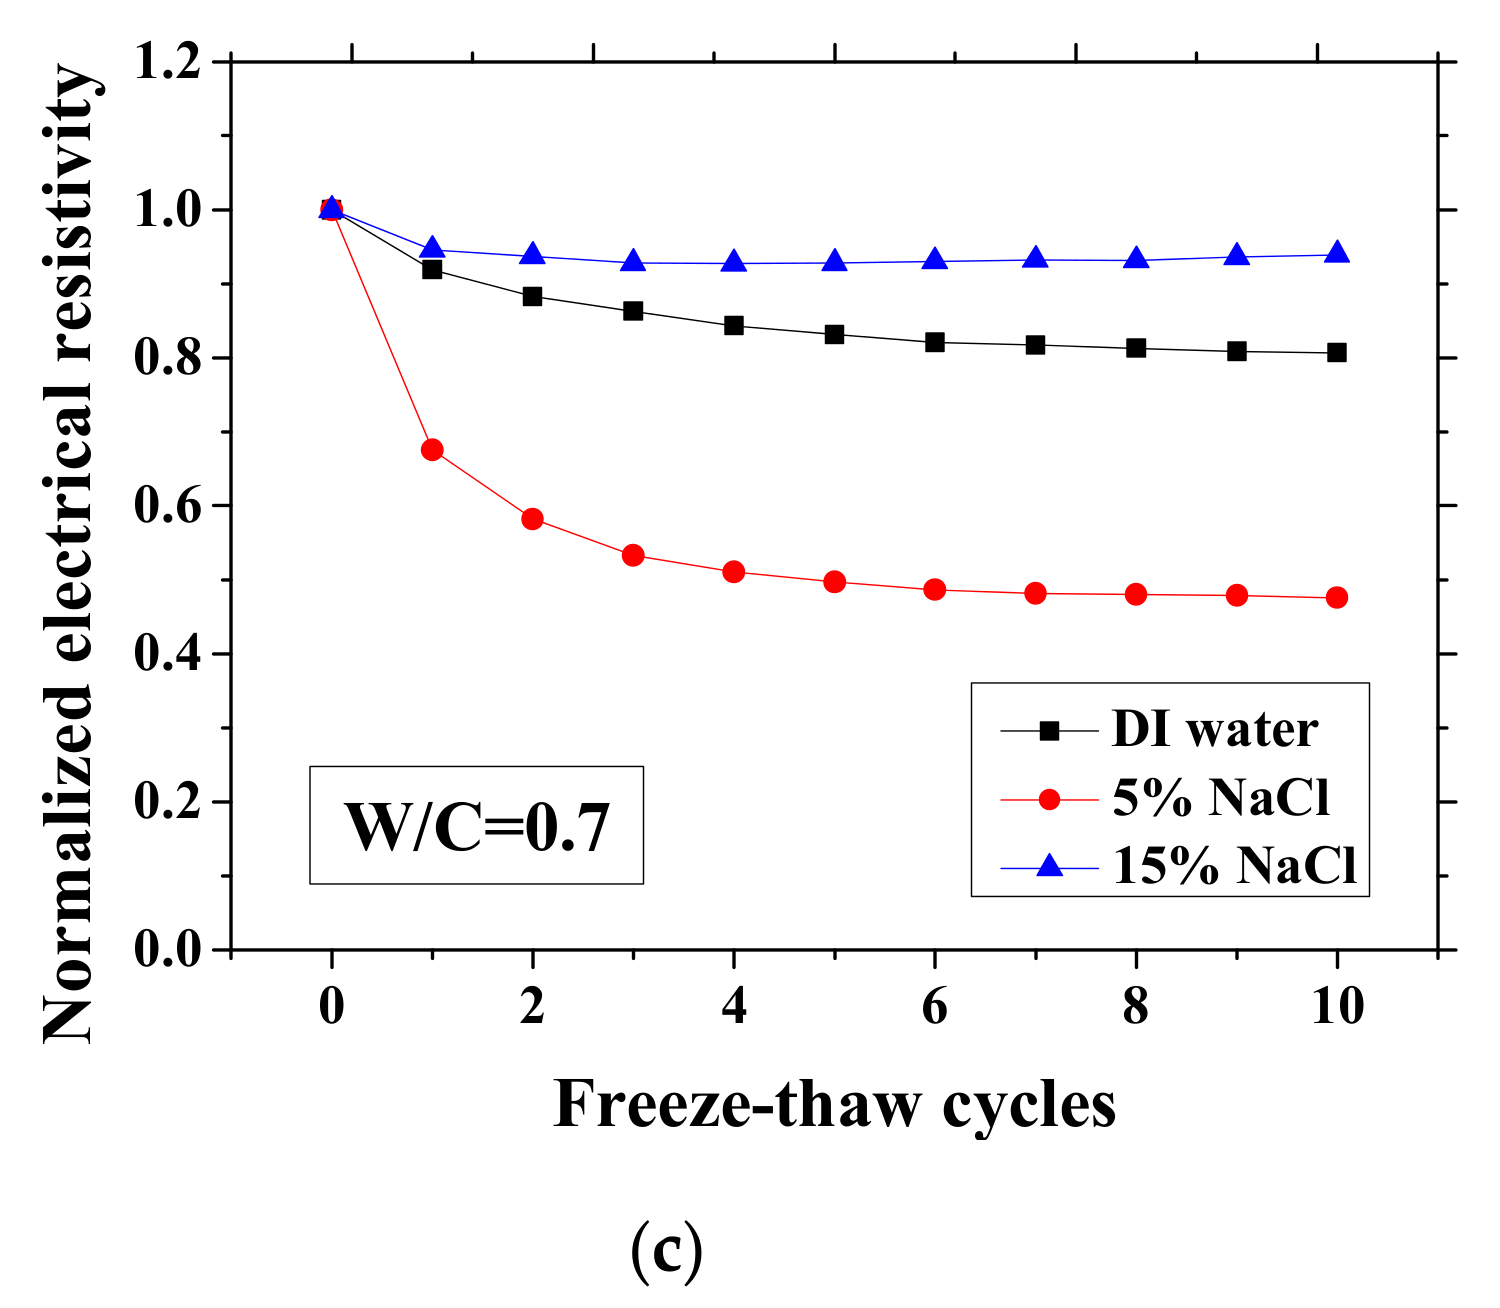
3.1. Electrical Resistivity Values at Reference Temperature and Lowest Temperature
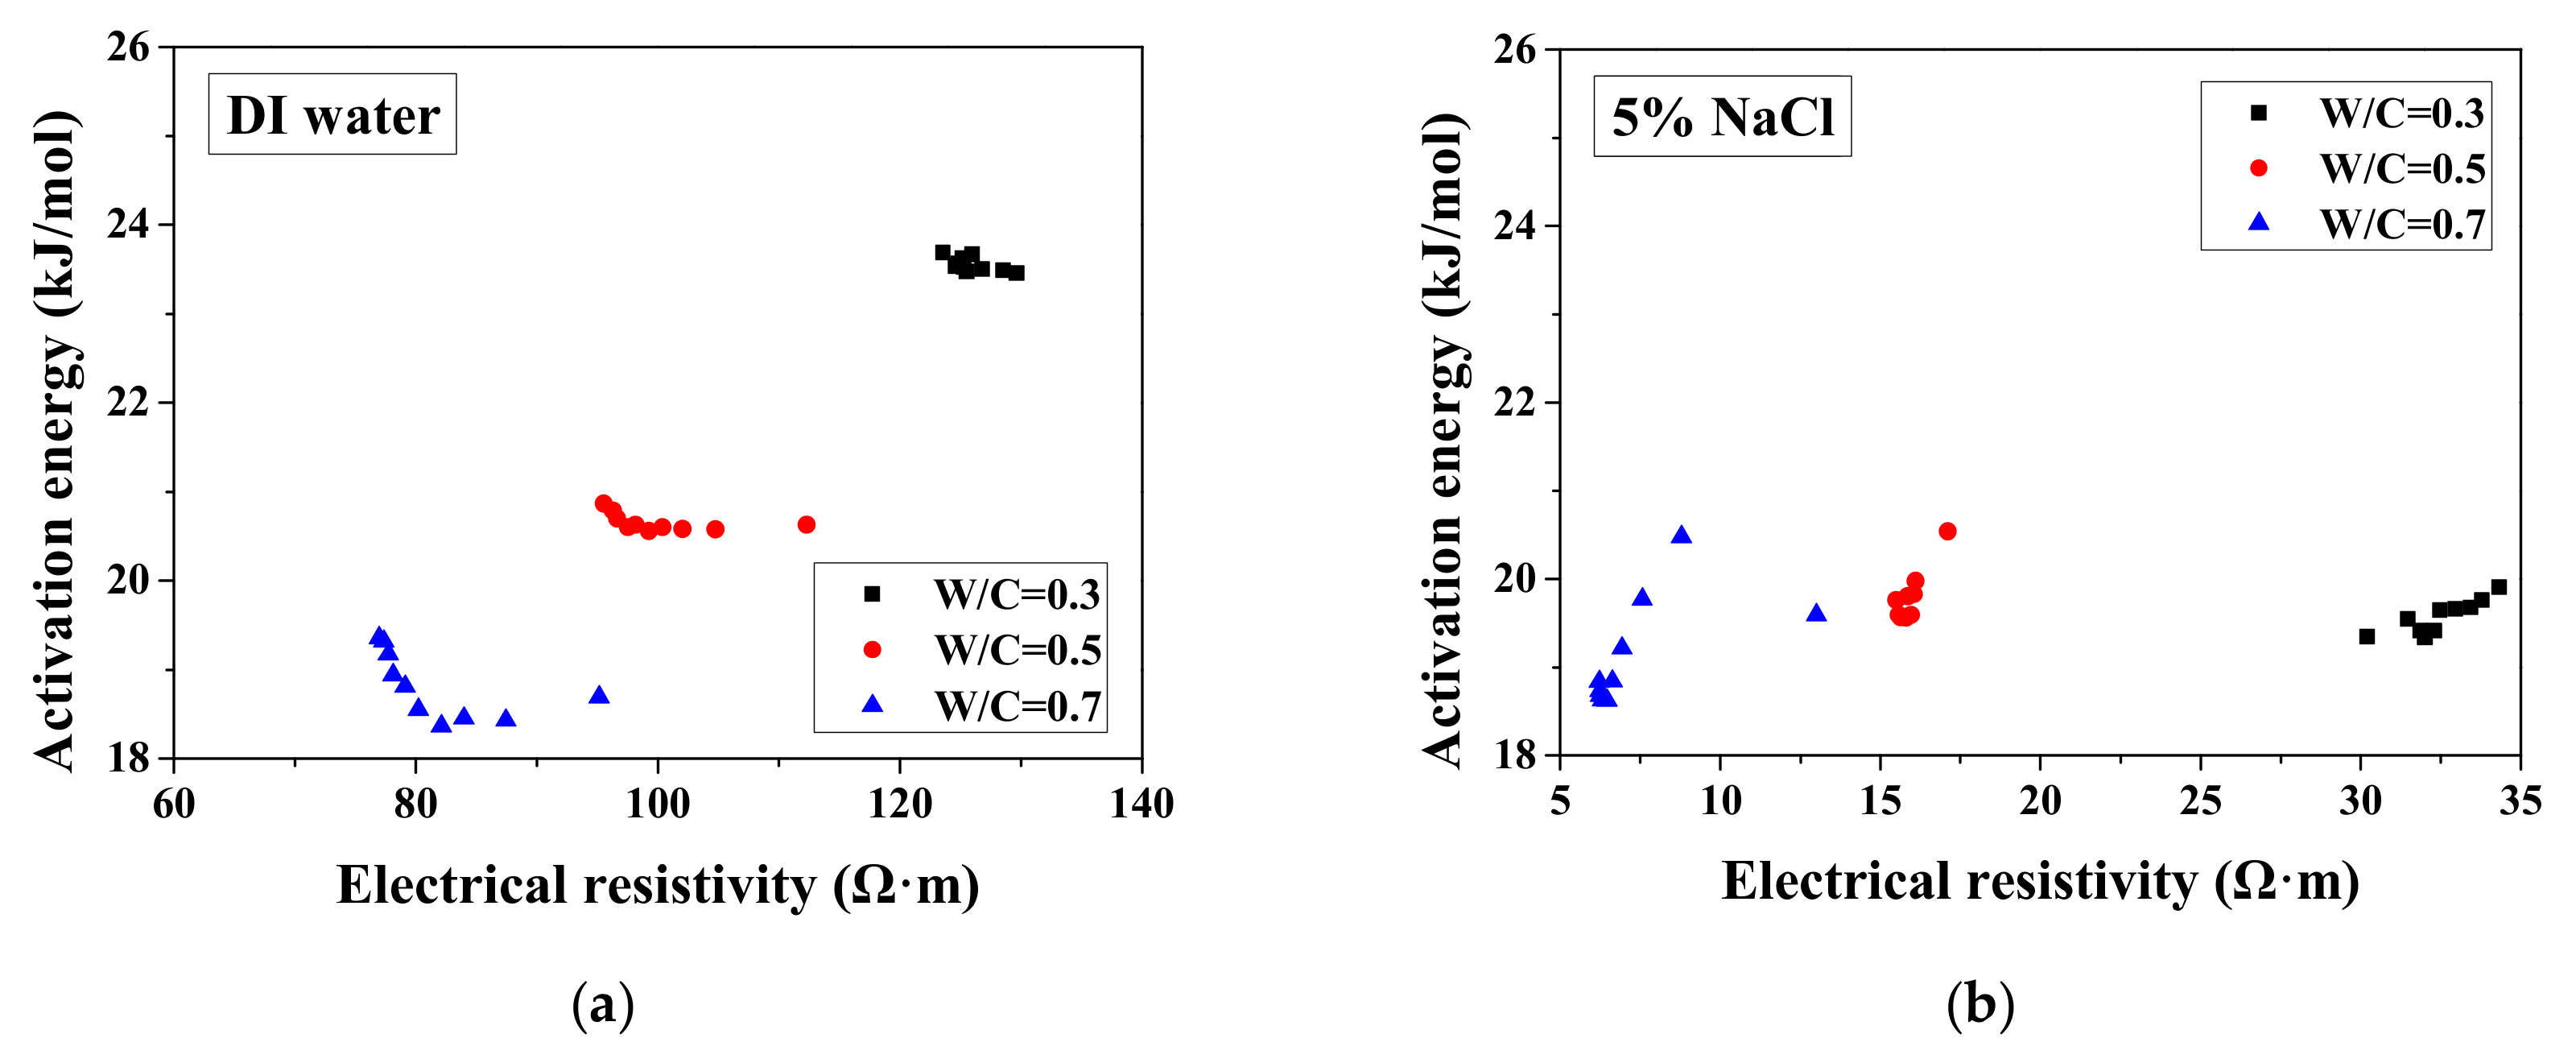
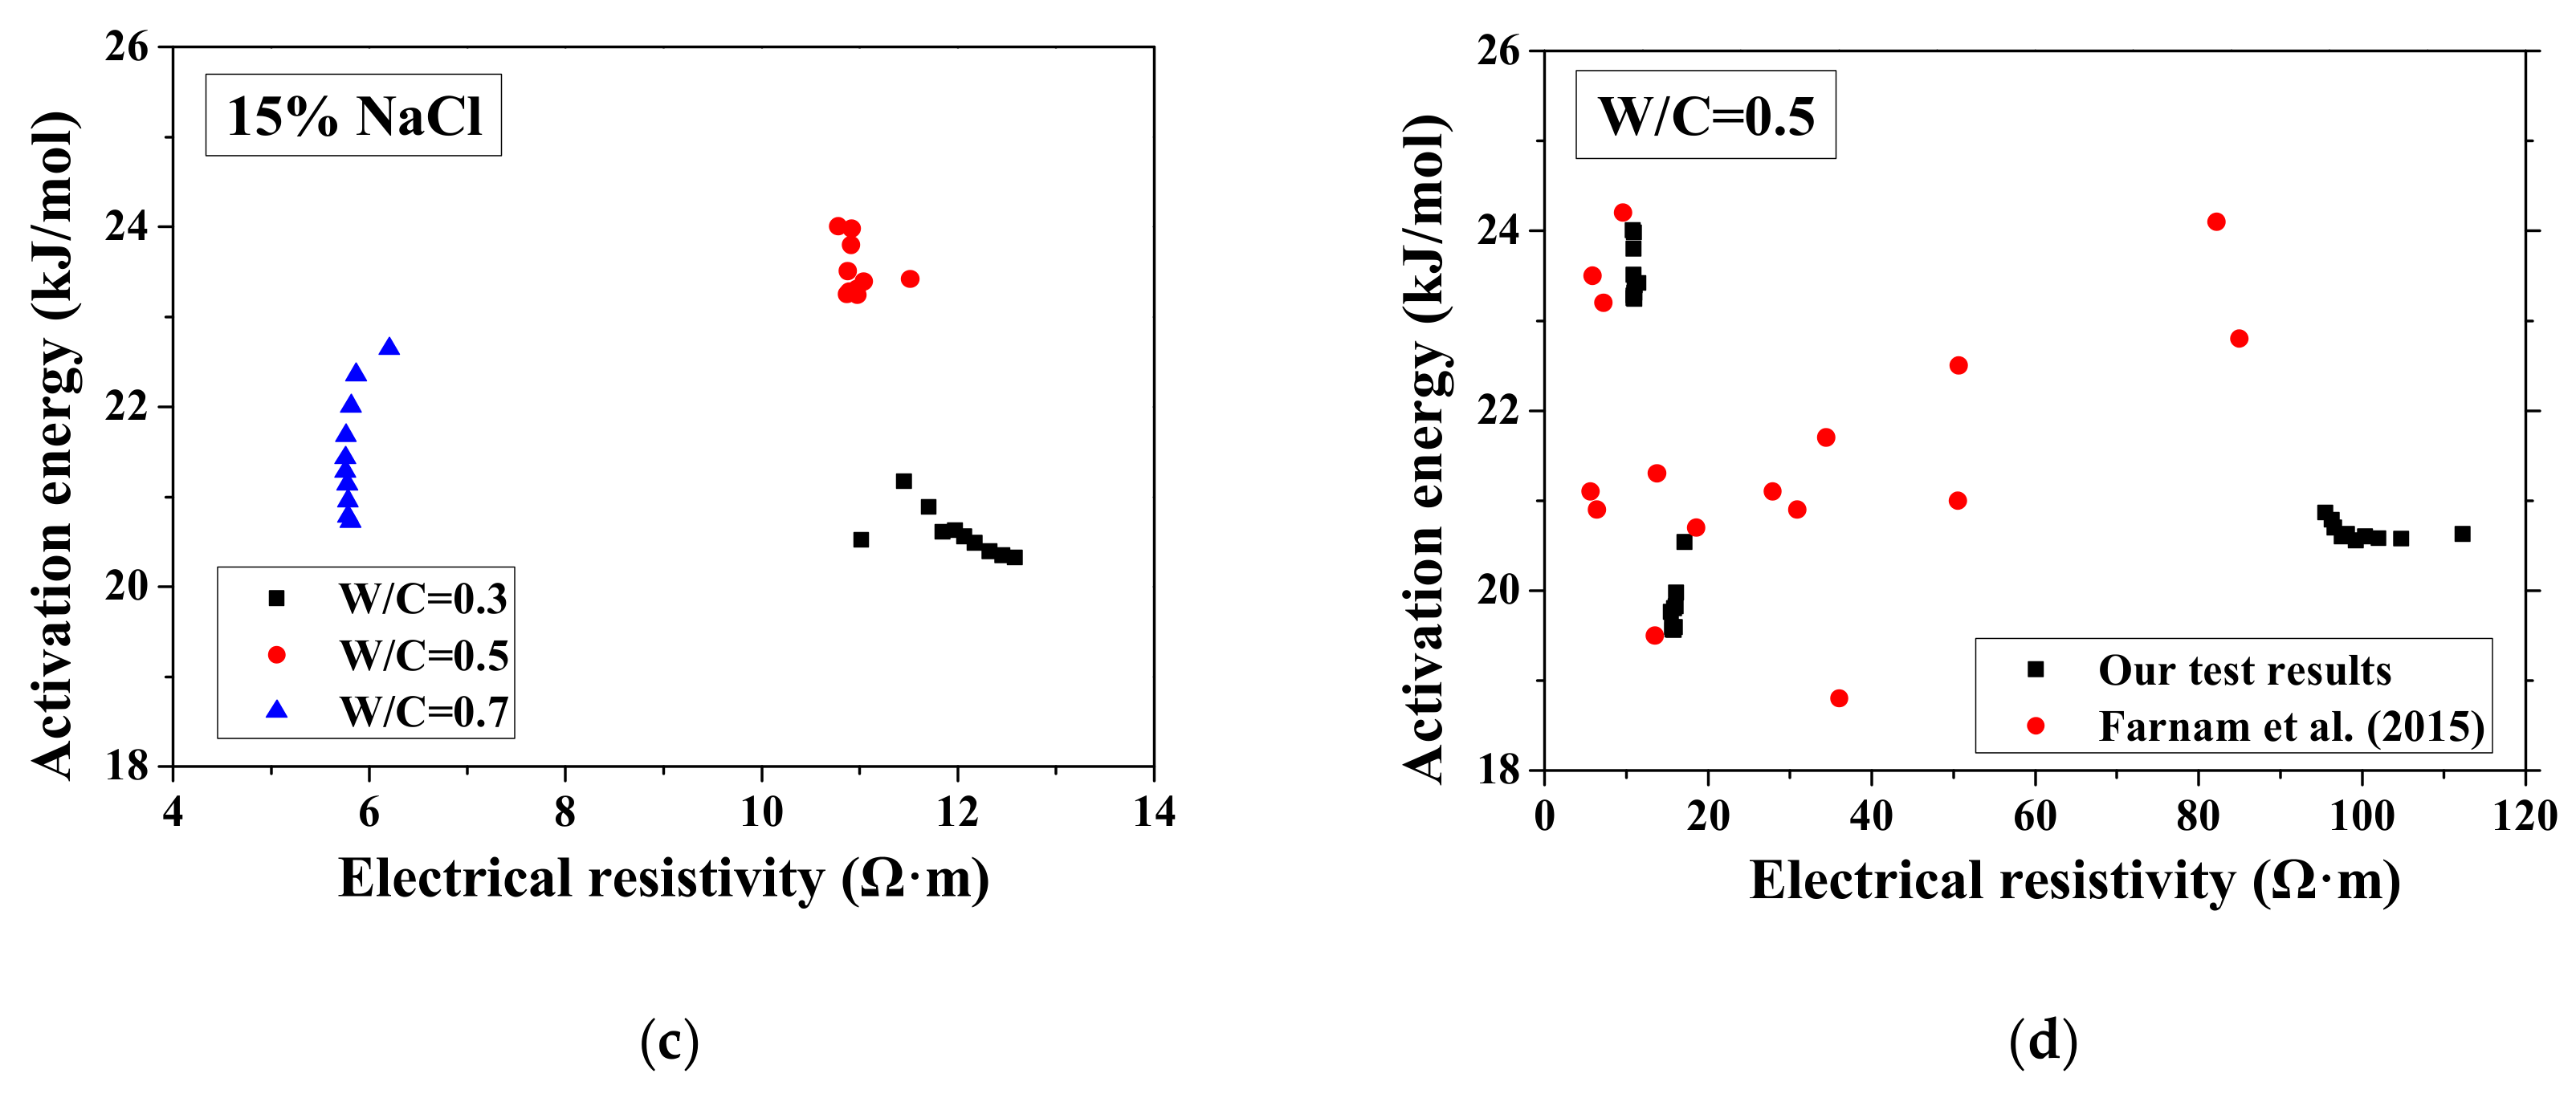
3.2. Activation Energy Changes with FTCs
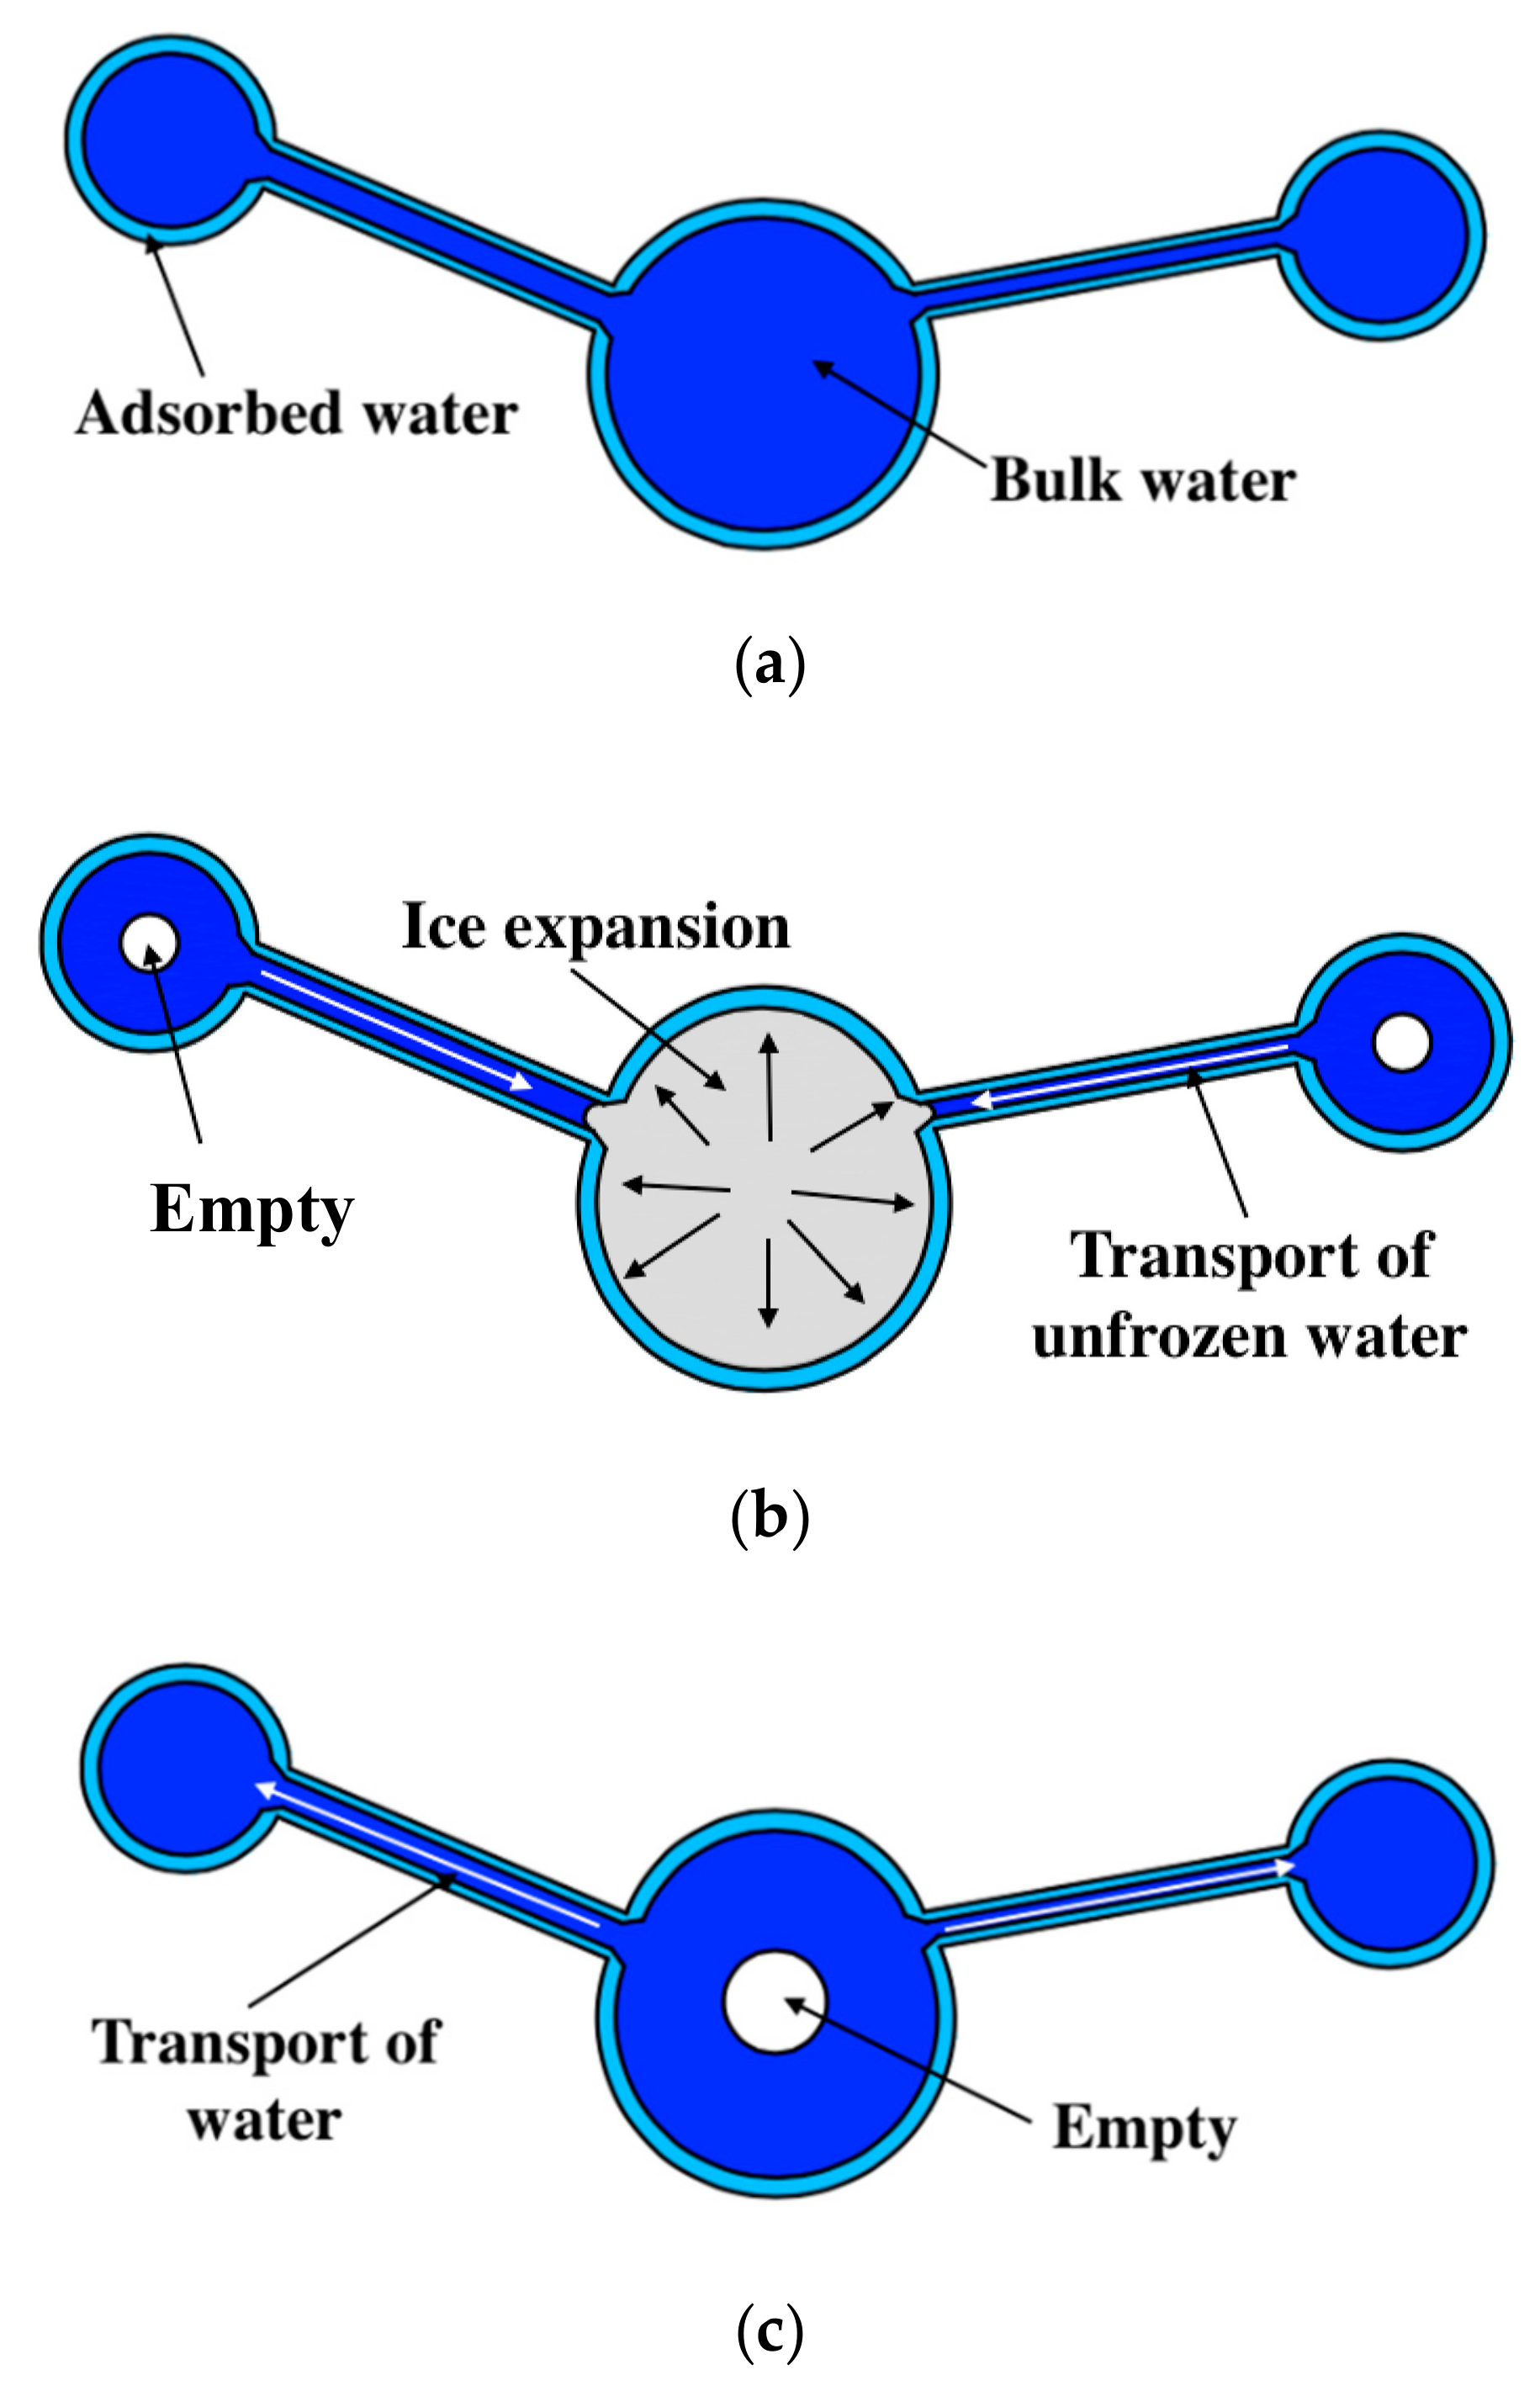
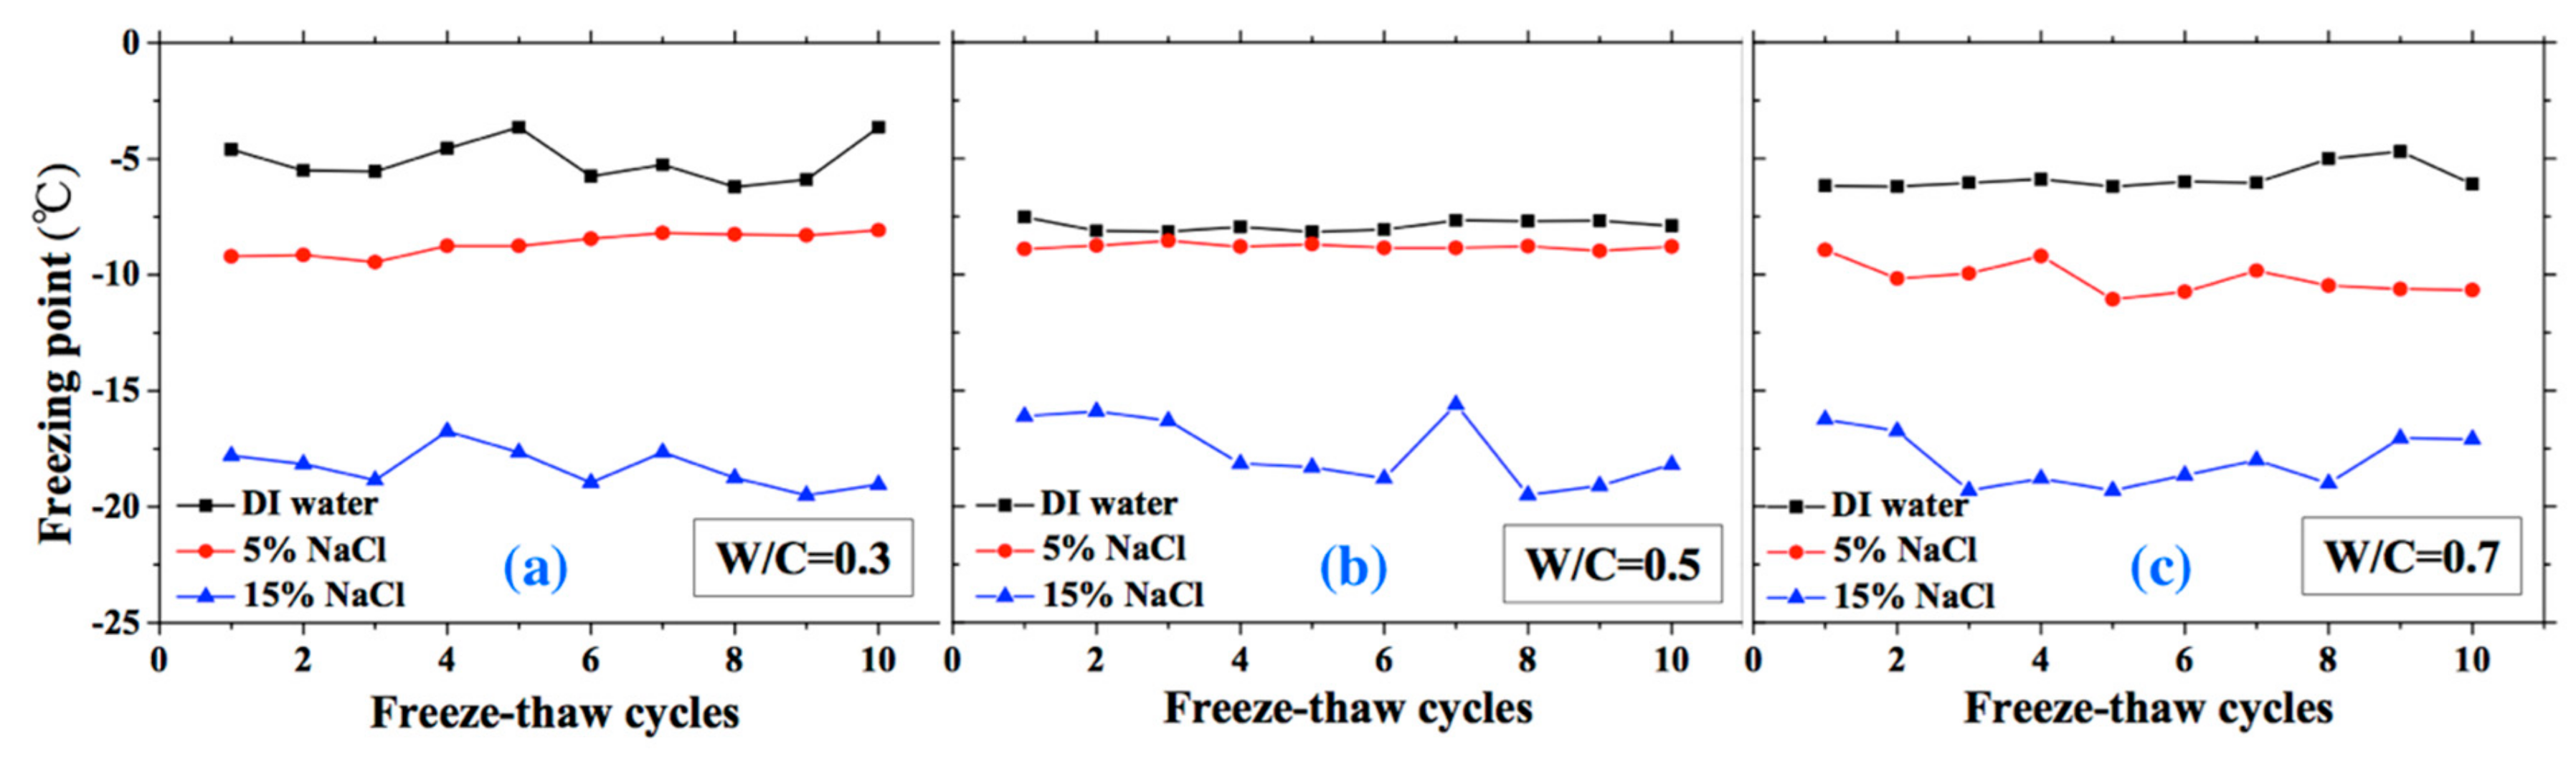
3.3. Change in Freezing and Thawing Points with FTCs
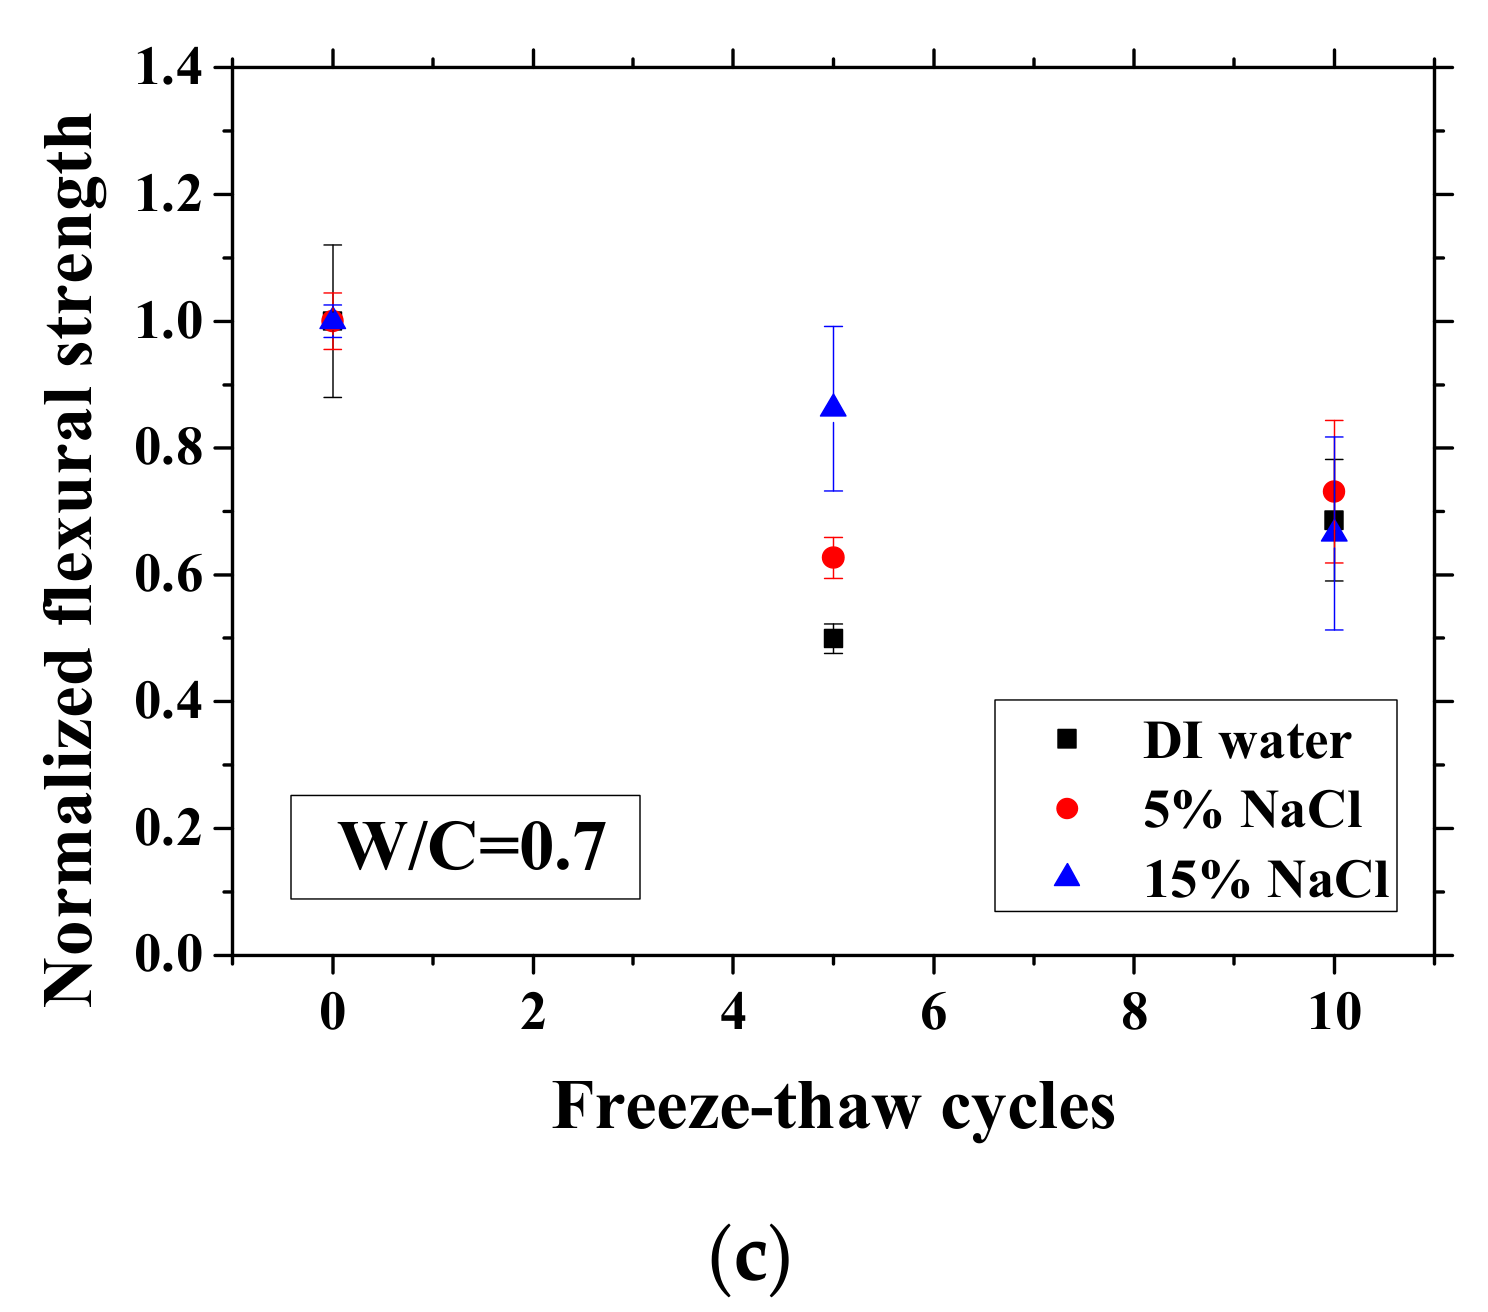
3.4. Mechanical Properties Change with FTCs
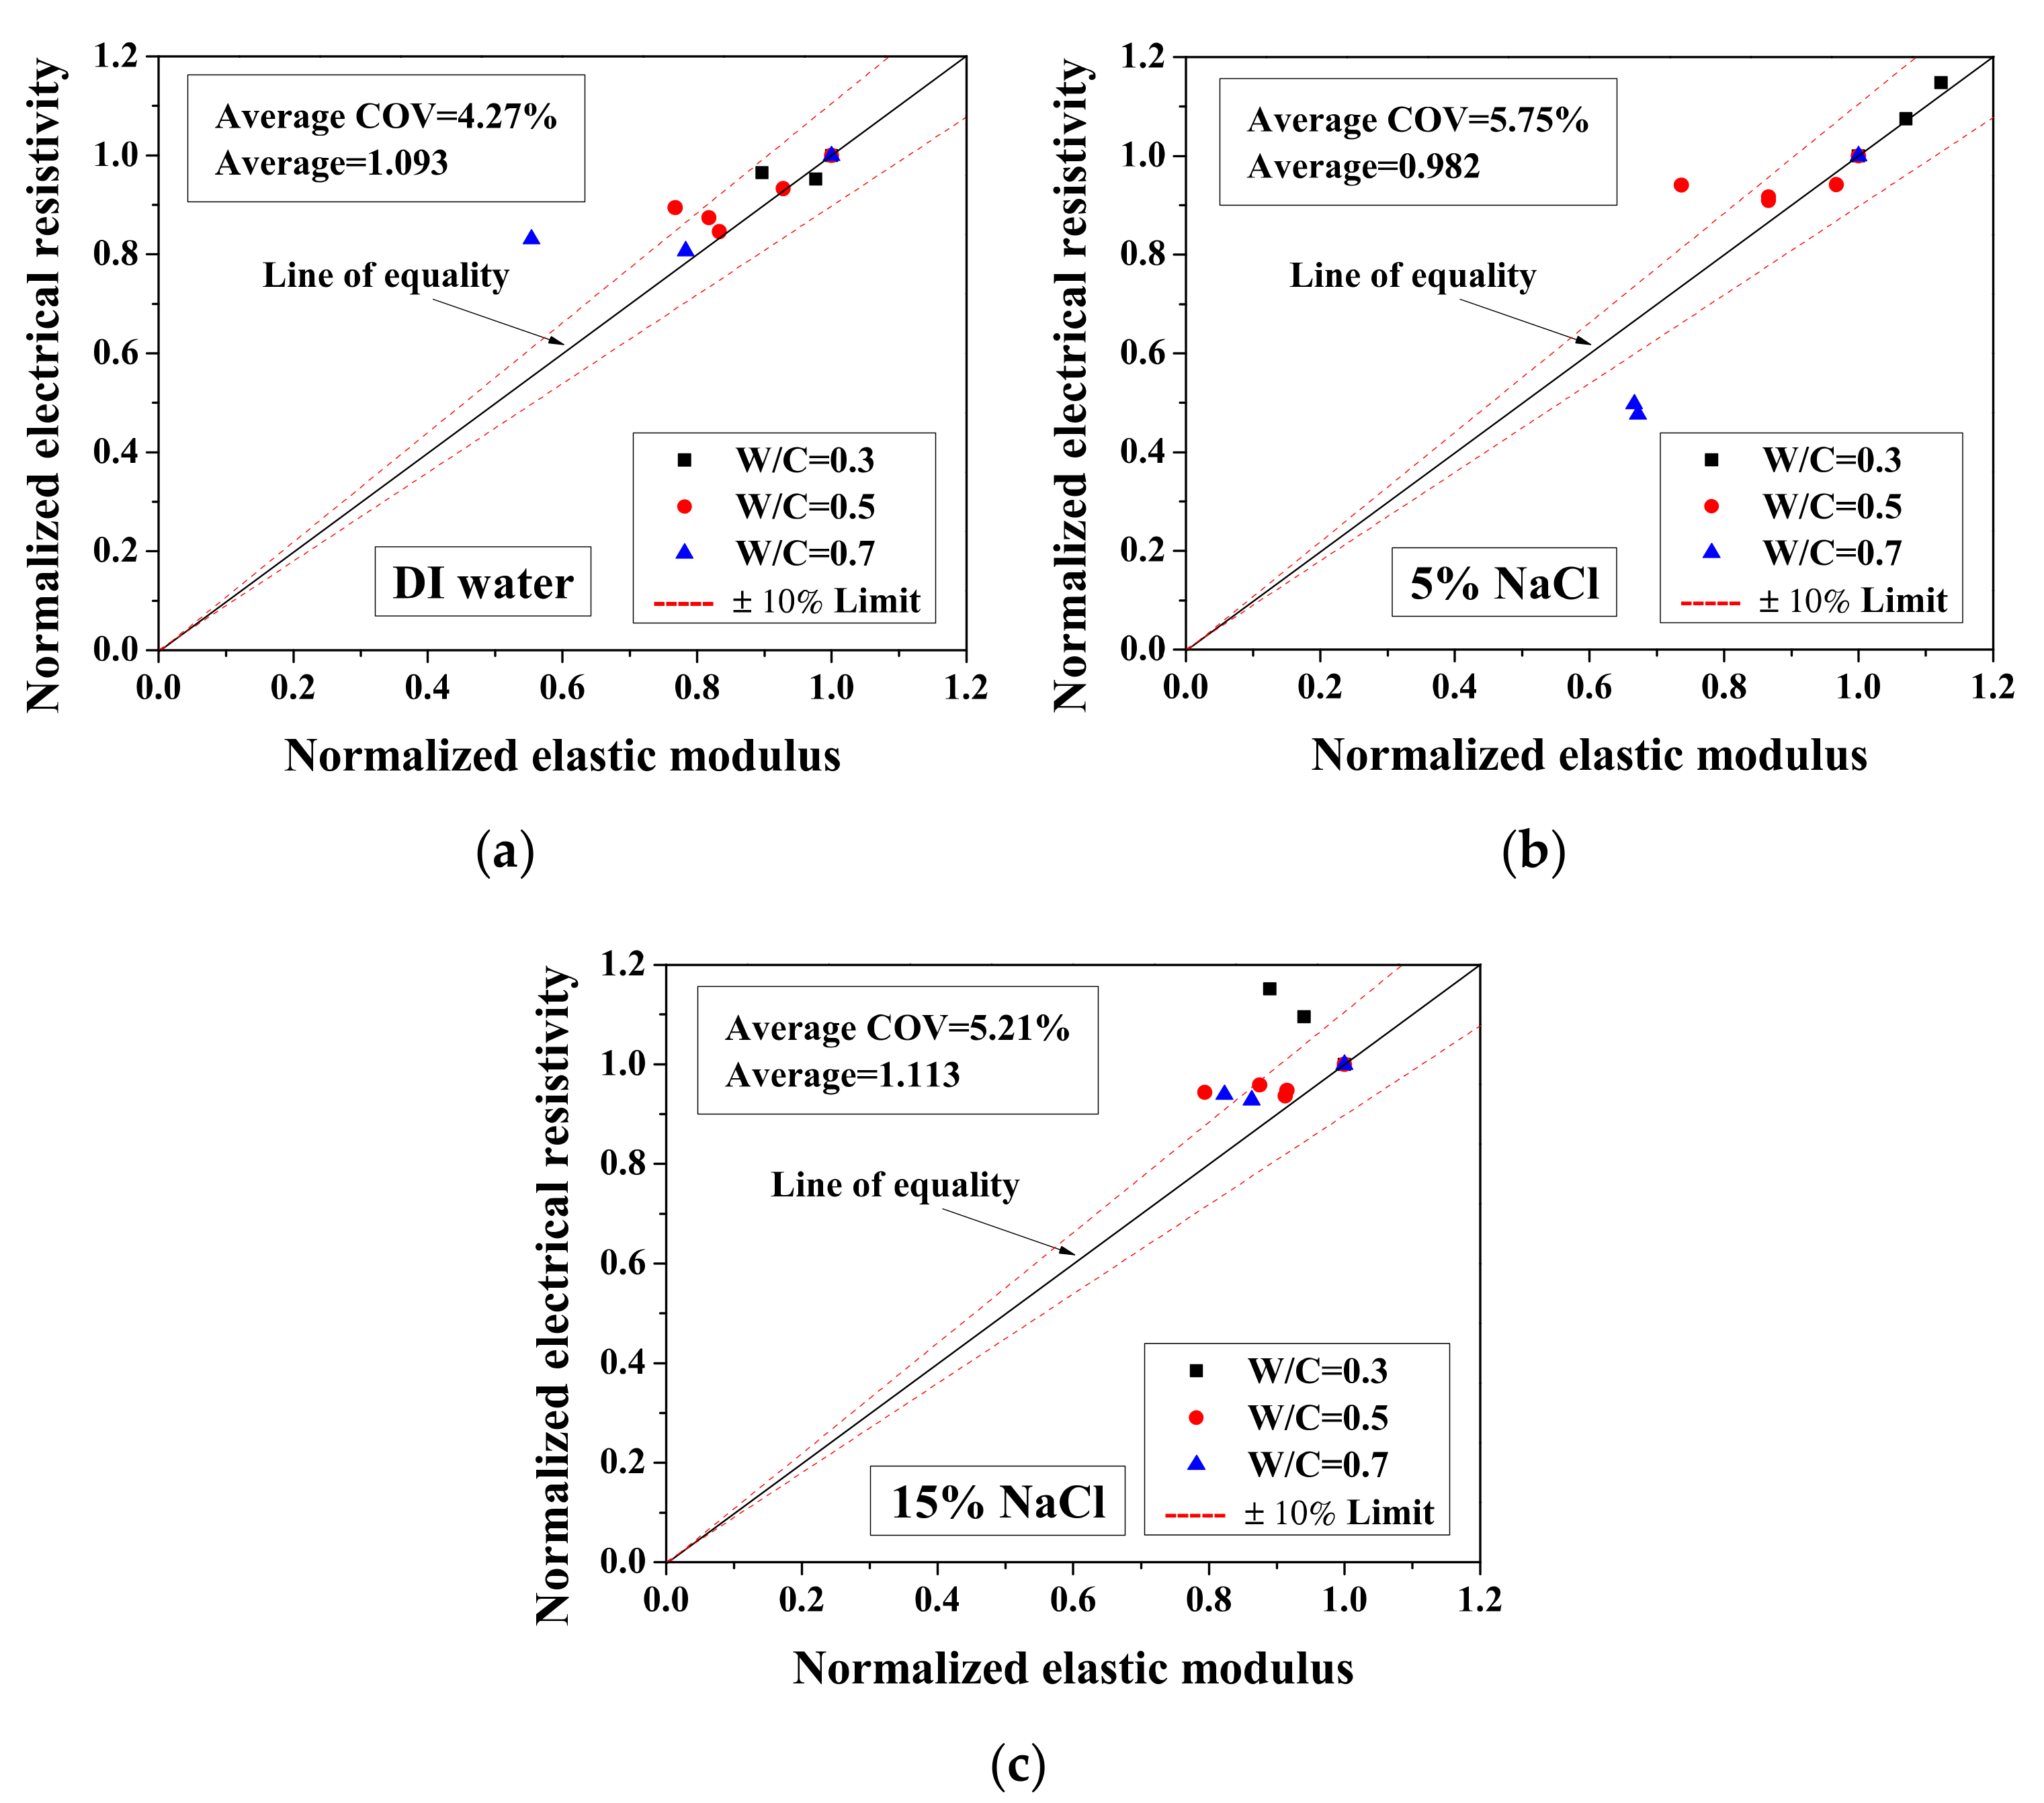
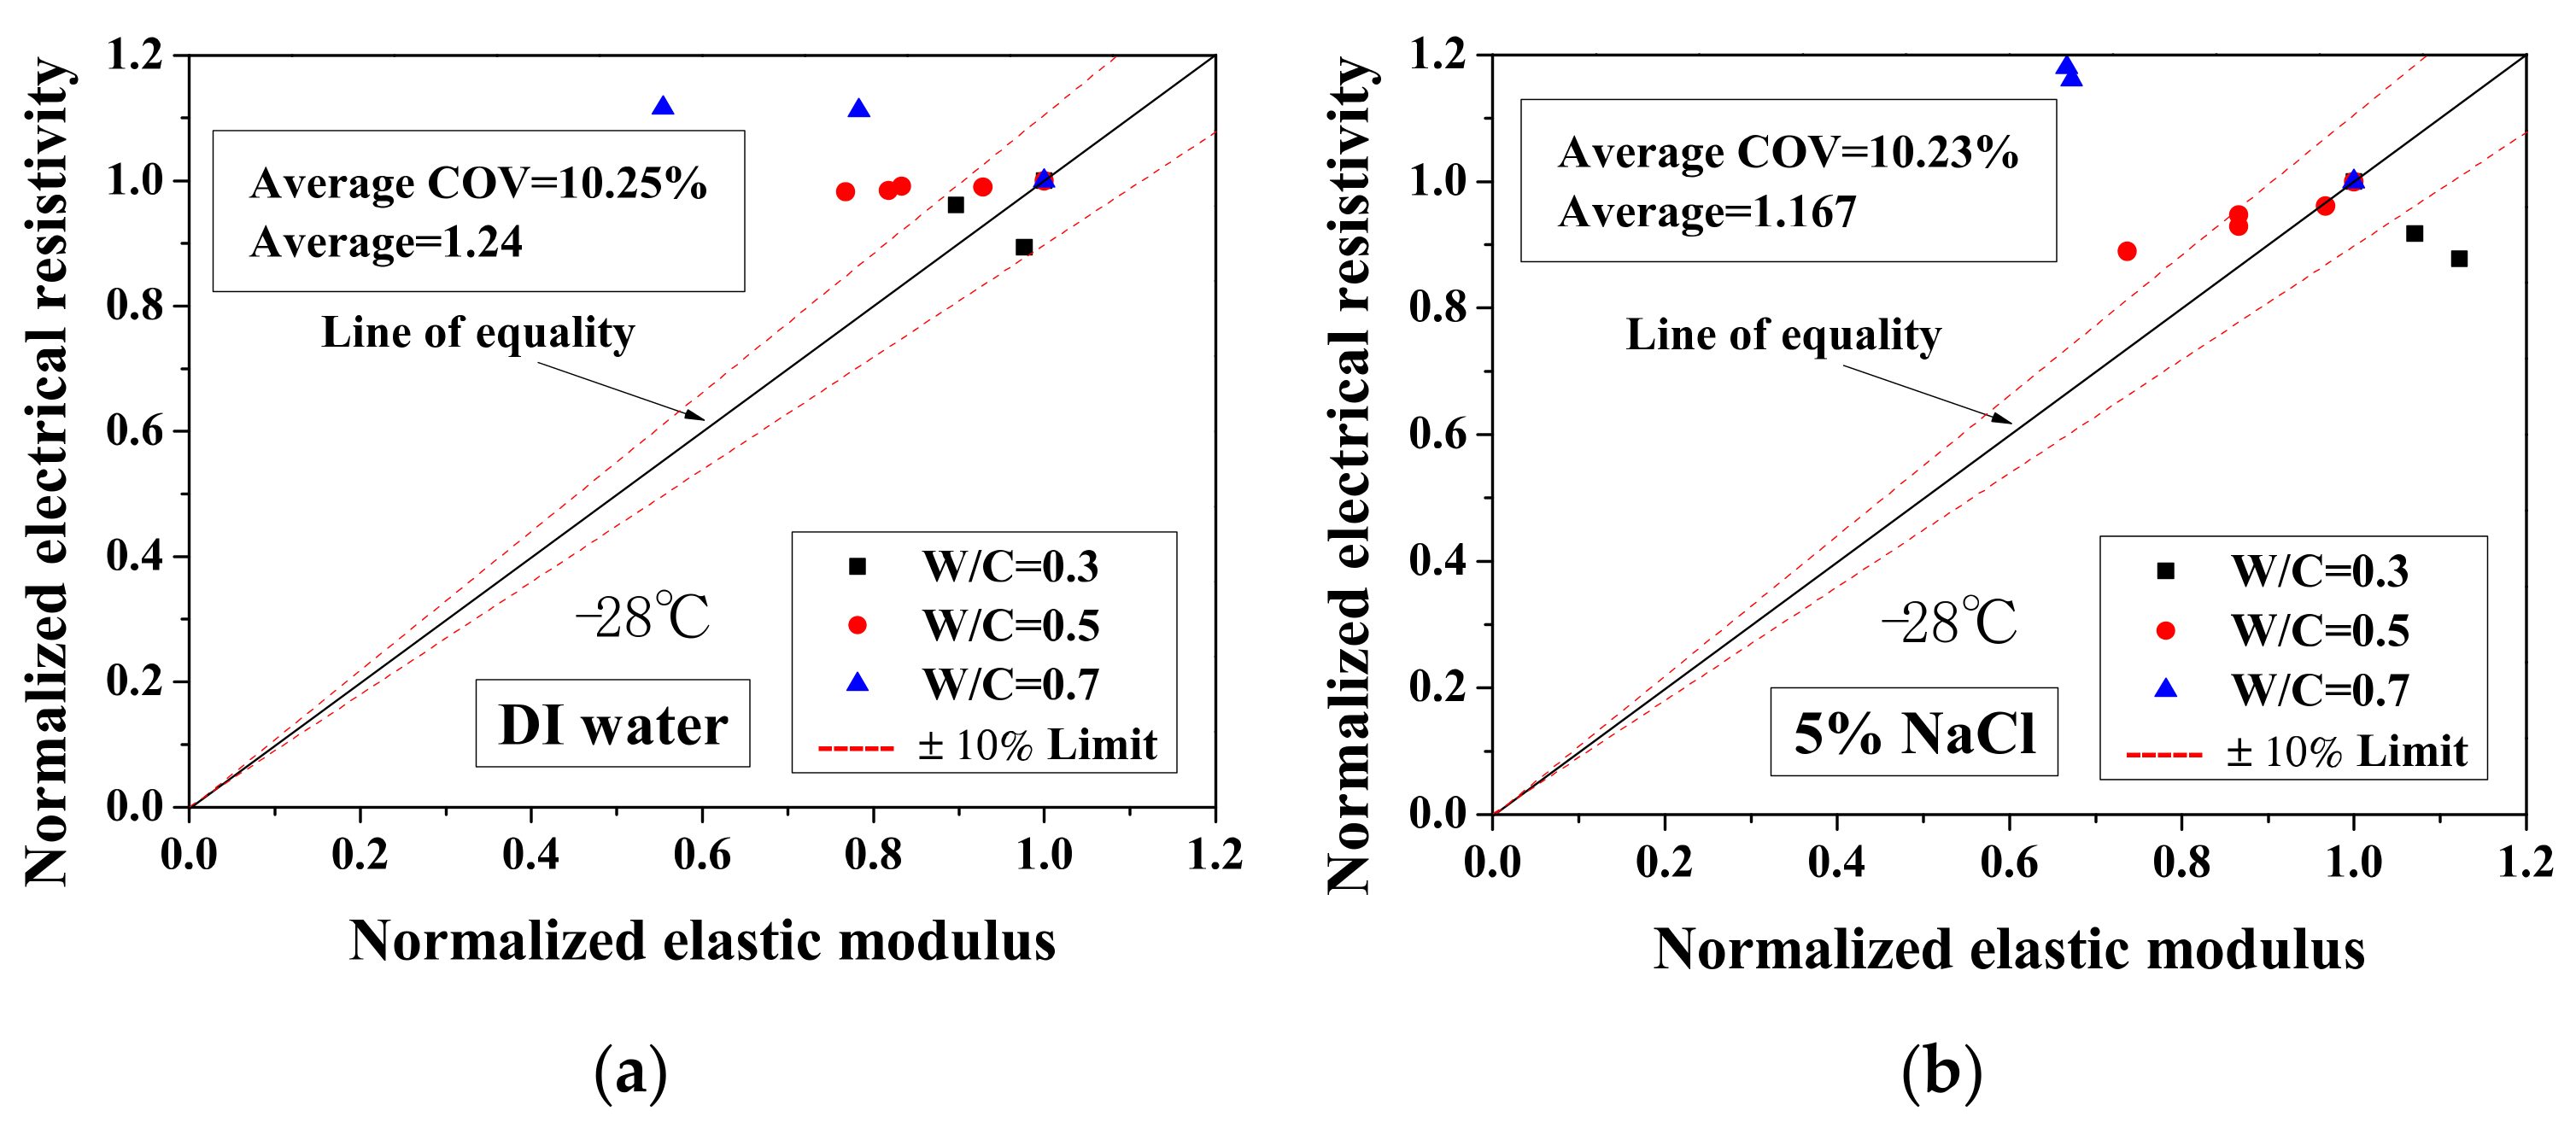
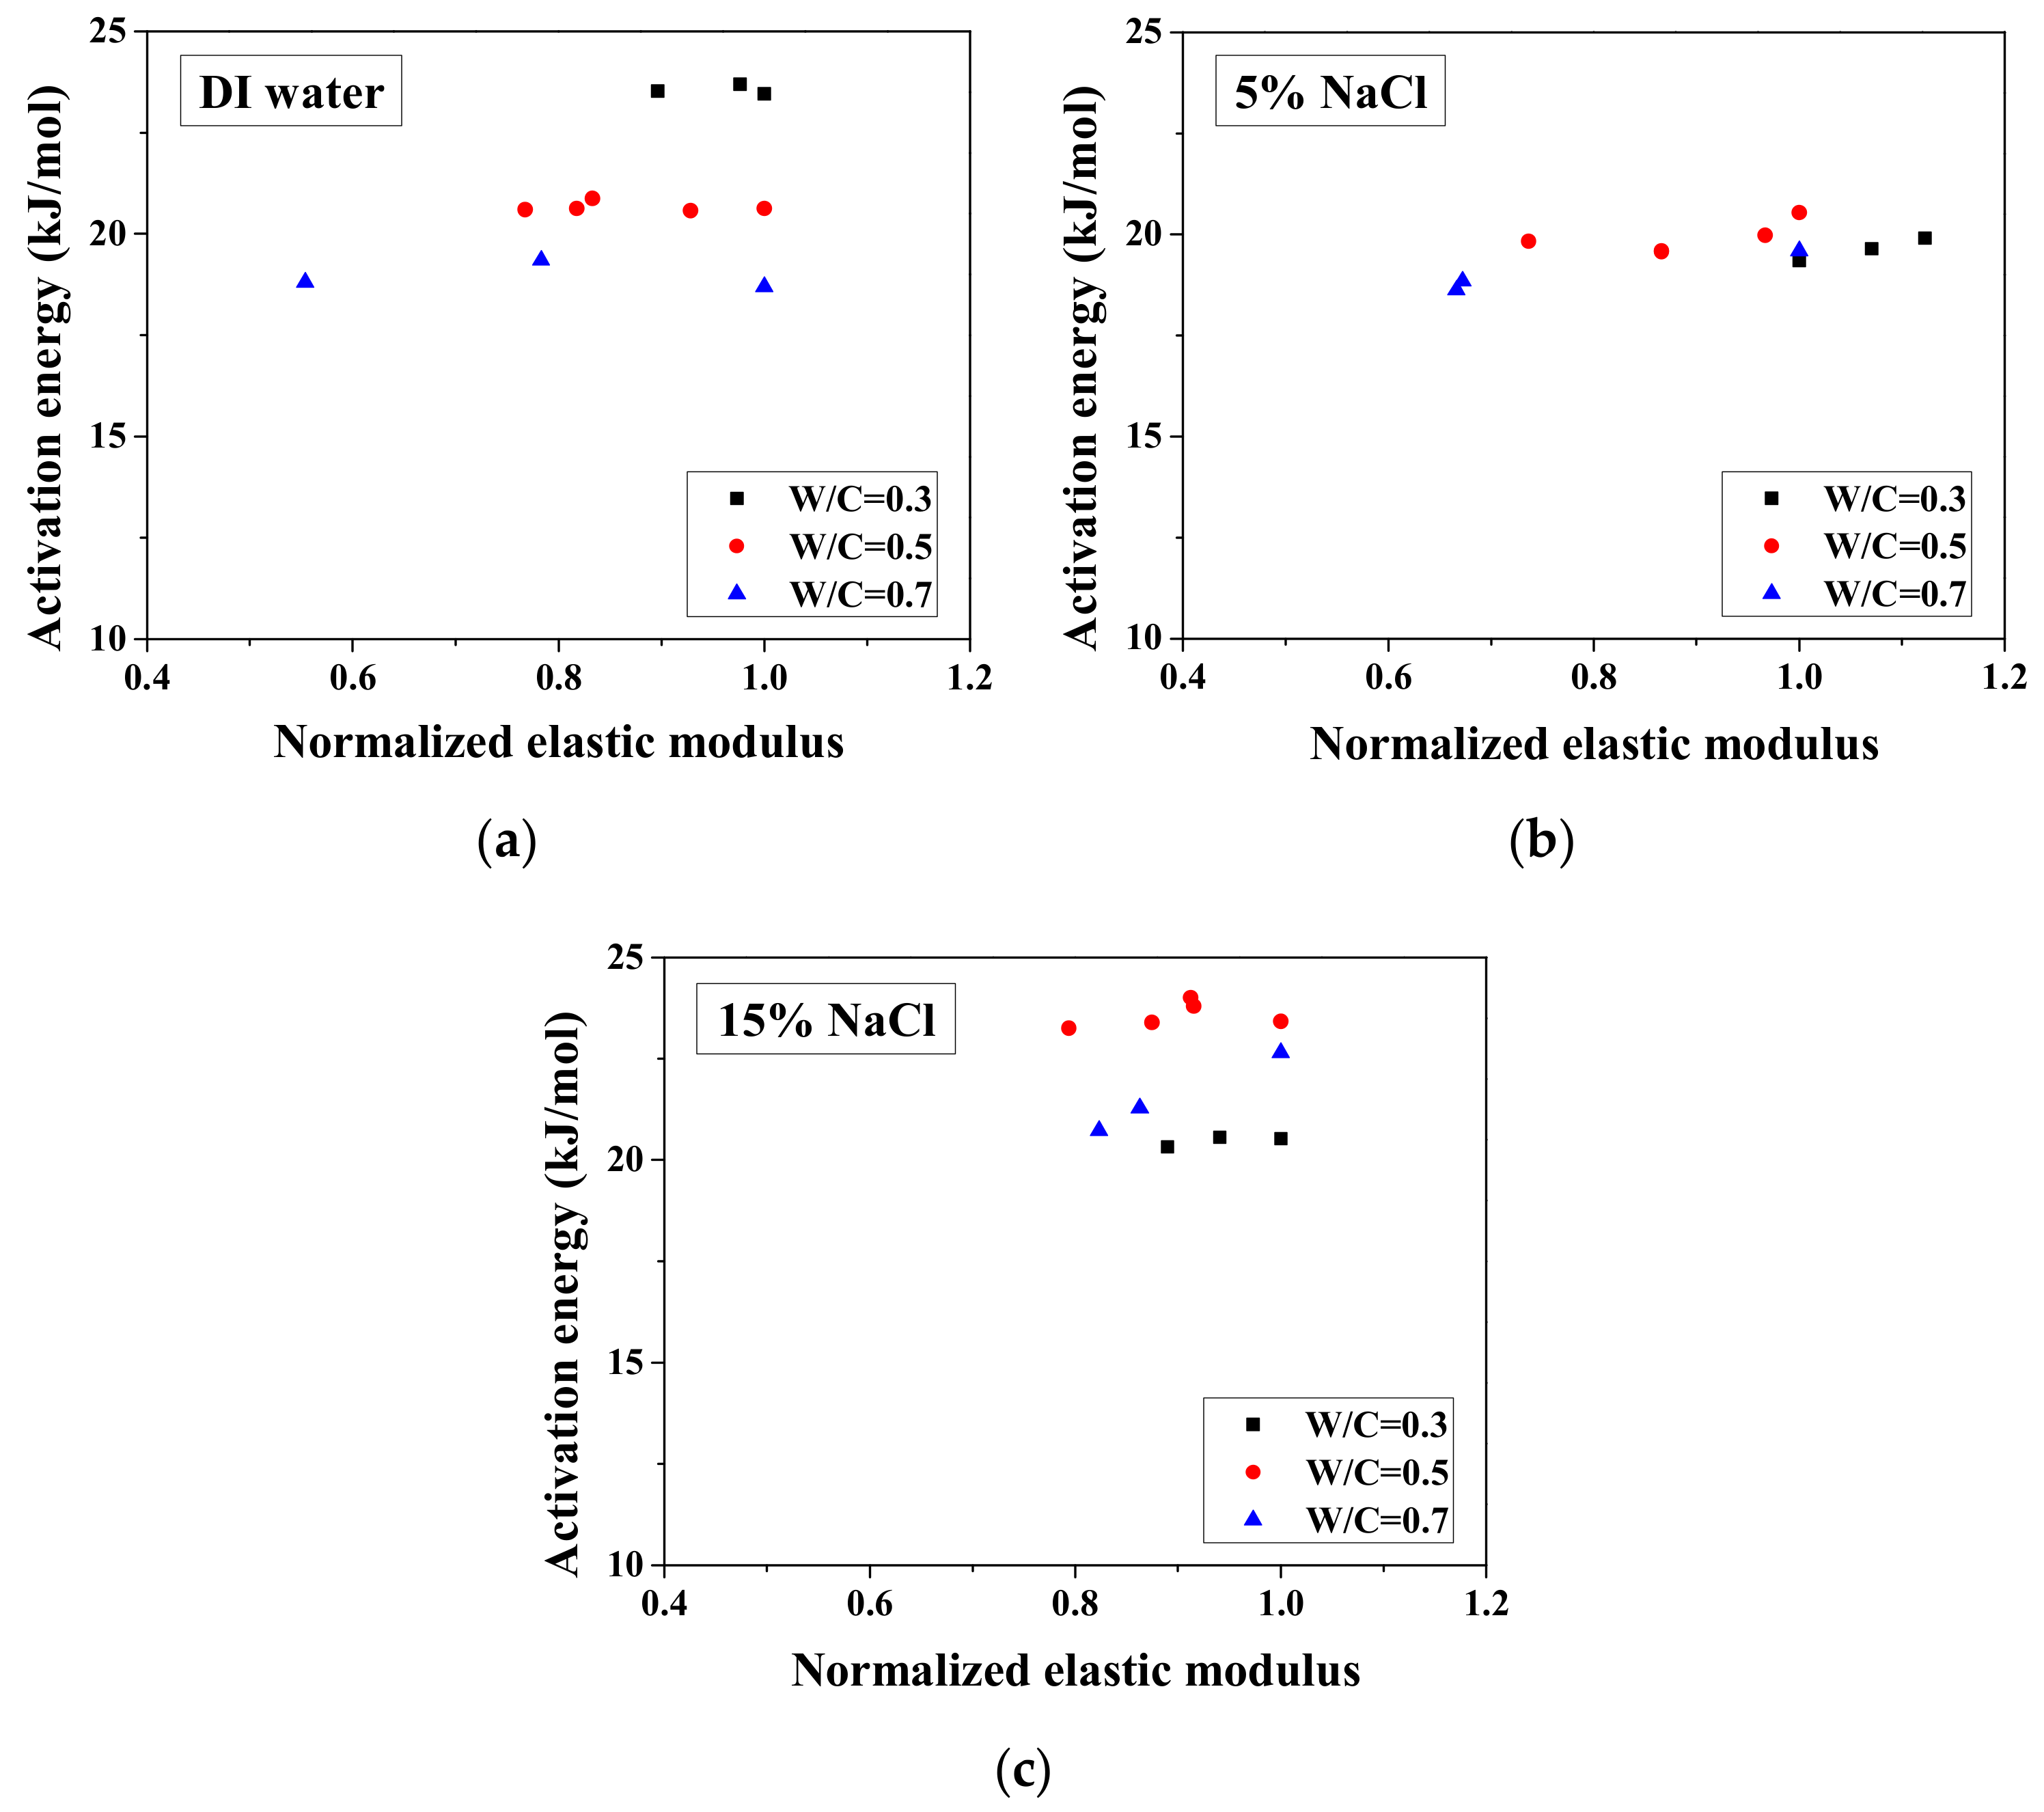
3.5. Relationships between Normalized Elastic Modulus and Normalized Electrical Resistivity (23 °C) and between Normalized Electrical Resistivity (−28 °C) and Activation Energy
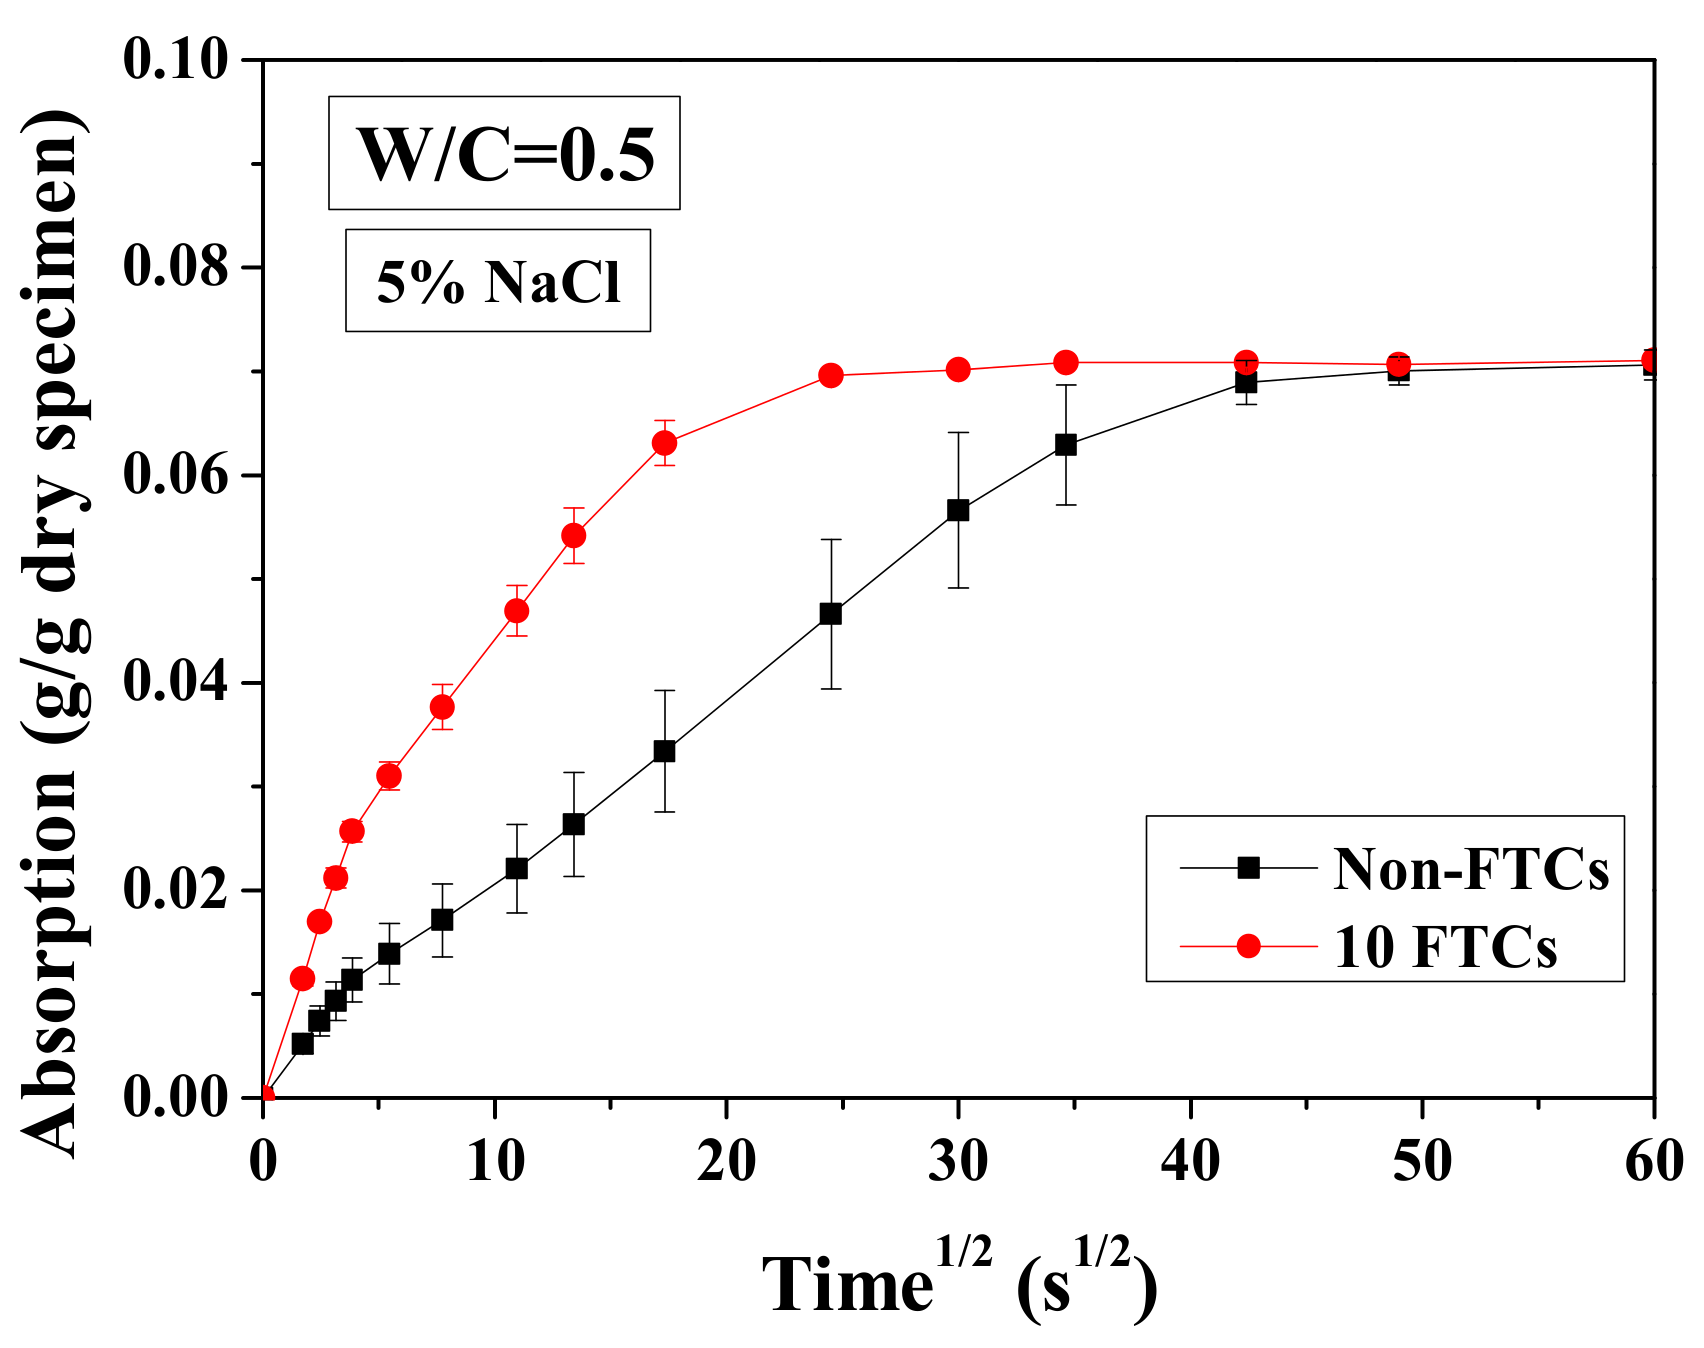
3.6. Water Absorption Test Results
4. Comparison of the Damage Index and Change in the Mechanical Properties with FTCs
5. Conclusions
- (1)
- Based on the examination of the relationship between electrical characteristics and mechanical property degradation, a damage evaluation model was developed and the electrical resistivity at reference temperature was the input. An acceptable agreement was reached between the proposed damage index from electrical analysis and the change in mechanical properties obtained from three-point bending tests, which preliminarily verified the reliability of the developed model.
- (2)
- In the sealed condition under the FTCs, the specimens saturated with NaCl solutions could be severely damaged. The electrical resistivity values at both the highest and lowest temperatures change with the damage development. However, they show different tendency compared with previous studies due to the existing NaCl and smaller specimen dimension. The reduction in the electrical resistivity at the lowest temperature was not consistent with that of the elastic modulus and the flexural strength, due to the contradictory effects of connectivity and ice content increase, thus cannot be an efficient index for frost damage evaluation.
- (3)
- The activation energy of mortar is not steady with frost damage development and the variation is insignificant, which is different from the observations from specimens with large size in a previous study [35]. Since a clear reduction tendency was not observed from the test results, it may not be an appropriate index for mechanical property-degradation evaluation.
- (4)
- From the absorption test results, after the FTCs, there was insignificant change in the porosity, but the connectivity clearly increased. It reveals that severe frost damage can affect the pore size distribution, but does not necessarily have a large influence on the total porosity.
- (5)
- Freezing and thawing points were detected from the relationship between the electrical resistivity and temperature. From the previous report, the freezing point increases with FTCs. However, in our meso-scale test results such a trend was not observed. The frost damage degree cannot simply be evaluated based on freezing and thawing points.
Author Contributions
Funding
Conflicts of Interest
References
- Litvan, G.G. Frost action in cement in the presence of de-icers. Cem. Concr. Res. 1976, 6, 351–356. [Google Scholar] [CrossRef]
- Valenza, J.J.; Scherer, G.W. A review of salt scaling: Ii. Mechanisms. Cem. Concr. Res. 2007, 37, 1022–1034. [Google Scholar] [CrossRef]
- Li, B.; Mao, J.; Shen, W.; Liu, H.; Liu, X.; Xu, G. Mesoscopic cracking model of cement-based materials subjected to freeze-thaw cycles. Constr. Build. Mater. 2019, 211, 1050–1064. [Google Scholar] [CrossRef]
- Gong, F.; Ueda, T.; Zhang, D. Two-dimensional rigid body spring method based micro-mesoscale study of mechanical strengthening/damaging effects to concrete by frost action. Struct. Concr. 2018, 19, 1131–1145. [Google Scholar] [CrossRef]
- Sun, Z.; Scherer, G.W. Effect of air voids on salt scaling and internal freezing. Cem. Concr. Res. 2010, 40, 260–270. [Google Scholar] [CrossRef]
- Penttala, V. Strains and pressures induced by freezing mortars exposed in sodium chloride solution. Mater. Struct. 1999, 1, 2–14. [Google Scholar]
- Wu, Z.; Shi, C.; Gao, P.; Wang, D.; Cao, Z. Effects of deicing salts on the scaling resistance of concrete. J. Mater. Civ. Eng. 2014, 27, 4014160. [Google Scholar] [CrossRef]
- Valenza, J.J.; Vitousek, S.; Scherer, G.W. Expansion of hardened cement paste in saline solutions. Creep Shrinkage Durab. Concr. Concr. Struct. Concreep 2005, 7, 12–14. [Google Scholar]
- Farnam, Y.; Bentz, D.; Sakulich, A.; Flynn, D.; Weiss, J. Measuring freeze and thaw damage in mortars containing deicing salt using a low temperature longitudinal guarded comparative calorimeter and acoustic emission (ae-lgcc). J. Adv. Civ. Eng. Mater. 2014, 3, 316–337. [Google Scholar] [CrossRef]
- Zeng, Q.; Fen-Chong, T.; Li, K. Freezing behavior of cement pastes saturated with nacl solution. Constr. Build. Mater. 2014, 59, 99–110. [Google Scholar] [CrossRef]
- Wang, Y.; Gong, F.; Ueda, T.; Zhang, D. Meso-scale mechanical degradation of mortar under freeze thaw cycles and sodium chloride attack. In Proceedings of the 11th fib International PhD Symposium in Civil Engineering, Tokyo, Japan, 29–31 August 2016. [Google Scholar]
- Sato, T.; Beaudoin, J.J. Coupled ac impedance and thermomechanical analysis of freezing phenomena in cement paste. Mater. Struct. 2011, 44, 405–414. [Google Scholar] [CrossRef]
- Kim, J.; Suryanto, B.; McCarter, W.J. Conduction, relaxation and complex impedance studies on portland cement mortars during freezing and thawing. Cold Reg. Sci. Technol. 2019, 166, 102819. [Google Scholar] [CrossRef]
- Whittington, H.; McCarter, J.; Forde, M. The conduction of electricity through concrete. Mag. Concr. Res. 1981, 33, 48–60. [Google Scholar] [CrossRef]
- Shi, M.; Chen, Z.; Sun, J. Determination of chloride diffusivity in concrete by ac impedance spectroscopy. Cem. Concr. Res. 1999, 29, 1111–1115. [Google Scholar] [CrossRef]
- McCarter, W.; Starrs, G.; Chrisp, T. Electrical conductivity, diffusion, and permeability of portland cement-based mortars. Cem. Concr. Res. 2000, 30, 1395–1400. [Google Scholar] [CrossRef]
- Peled, A.; Torrents, J.M.; Mason, T.O.; Shah, S.P.; Garboczi, E.J. Electrical impedance spectra to monitor damage during tensile loading of cement composites. ACI Mater. J. 2001, 98, 313–322. [Google Scholar]
- Ranade, R.; Zhang, J.; Lynch, J.P.; Li, V.C. Influence of micro-cracking on the composite resistivity of engineered cementitious composites. Cem. Concr. Res. 2014, 58, 1–12. [Google Scholar] [CrossRef]
- Rajabipour, F.; Weiss, J.; Shane, J.D.; Mason, T.O.; Shah, S.P. Procedure to interpret electrical conductivity measurements in cover concrete during rewetting. J. Mater. Civ. Eng. 2005, 17, 586–594. [Google Scholar] [CrossRef]
- Hallaji, M.; Seppänen, A.; Pour-Ghaz, M. Electrical resistance tomography to monitor unsaturated moisture flow in cementitious materials. Cem. Concr. Res. 2015, 69, 10–18. [Google Scholar] [CrossRef]
- Villagrán Zaccardi, Y.A.; Di Maio, Á.A. Electrical resistivity measurement of unsaturated concrete samples. Mag. Concr. Res. 2014, 66, 484–491. [Google Scholar] [CrossRef]
- Weiss, J.; Snyder, K.; Bullard, J.; Bentz, D. Using a saturation function to interpret the electrical properties of partially saturated concrete. J. Mater. Civ. Eng. 2012, 25, 1097–1106. [Google Scholar] [CrossRef]
- Merioua, A.; Bezzar, A.; Ghomari, F. Non-destructive electrical methods for measuring the physical characteristics of porous materials. J. Nondestruct. Eval. 2015, 34, 1–12. [Google Scholar] [CrossRef]
- Archie, G.E. The electrical resistivity log as an aid in determining some reservoir characteristics. Trans. AIME 1942, 146, 54–62. [Google Scholar] [CrossRef]
- Chrisp, T.; Starrs, G.; McCarter, W.; Rouchotas, E.; Blewett, J. Temperature-conductivity relationships for concrete: An activation energy approach. J. Mater. Sci. Lett. 2001, 20, 1085–1087. [Google Scholar] [CrossRef]
- Spragg, R.; Bu, Y.; Snyder, K.; Bentz, D.; Weiss, J. Electrical testing of cement-based materials: Role of testing techniques, sample conditioning, and accelerated curing. Jt. Transp. Res. Program Indiana Dep. Transp. Purdue Univ. West Lafayette Indiana 2013, 1–23. [Google Scholar]
- Liu, Y.; Presuel-Moreno, F.J. Normalization of temperature effect on concrete resistivity by method using arrhenius law. ACI Mater. J. 2014, 111, 433–442. [Google Scholar] [CrossRef]
- Weiss, W.J.; Amirkhanian, A.N.; Suraneni, P.; Spragg, R.P.; Coyle, A.T. Comparison of linear temperature corrections and activation energy temperature corrections for electrical resistivity measurements of concrete. Adv. Civ. Eng. Mater. 2018, 7, 174–187. [Google Scholar]
- Snyder, K.A.; Feng, X.; Keen, B.D.; Mason, T.O. Estimating the electrical conductivity of cement paste pore solutions from oh−, k+ and na+ concentrations. Cem. Concr. Res. 2003, 33, 793–798. [Google Scholar] [CrossRef]
- Qiao, C.; Coyle, A.T.; Isgor, O.B.; Weiss, W.J. Prediction of chloride ingress in saturated concrete using formation factor and chloride binding isotherm. Adv. Civ. Eng. Mater. 2018, 7, 206–220. [Google Scholar] [CrossRef]
- AASHTO. Standard Practice for developing Performance Engineered Concrete Pavement Mixtures; American Association of State and Highway Transportation Officials: Washington, D.C., USA, 2019. [Google Scholar]
- Sengul, O.J.C.; Materials, B. Use of electrical resistivity as an indicator for durability. Constr. Build. Mater. 2014, 73, 434–441. [Google Scholar] [CrossRef]
- Gong, F.; Jacobsen, S. Modeling of water transport in highly saturated concrete with wet surface during freeze/thaw. Cem. Concr. Res. 2019, 115, 294–307. [Google Scholar] [CrossRef]
- Cai, H.; Liu, X. Freeze-thaw durability of concrete: Ice formation process in pores. Cem. Concr. Res. 1998, 28, 1281–1287. [Google Scholar] [CrossRef]
- McCarter, W.; Starrs, G.; Chrisp, T.; Basheer, P.; Nanukuttan, S.; Srinivasan, S. Conductivity/activation energy relationships for cement-based materials undergoing cyclic thermal excursions. J. Mater. Sci. 2015, 50, 1129–1140. [Google Scholar] [CrossRef]
- Wang, Y.; Gong, F.; Zhang, D.; Ueda, T. Estimation of ice content in mortar based on electrical measurements under freeze-thaw cycle. J. Adv. Concr. Technol. 2016, 14, 35–46. [Google Scholar] [CrossRef]
- Wang, Y.; Gong, F.; Zhang, D.; Ueda, T. Estimation of ice formation in mortar saturated with sodium chloride solutions. Constr. Build. Mater. 2017, 144, 238–251. [Google Scholar] [CrossRef]
- Fabbri, A.; Fen-Chong, T. Indirect measurement of the ice content curve of partially frozen cement based materials. Cold Reg. Sci. Technol. 2013, 90, 14–21. [Google Scholar] [CrossRef]
- Wang, Z.; Zeng, Q.; Wang, L.; Yao, Y.; Li, K. Electrical resistivity of cement pastes undergoing cyclic freeze-thaw action. J. Mater. Civ. Eng. 2014, 27, 4014109. [Google Scholar] [CrossRef]
- Grubeša, I.; Marković, B.; Vračević, M.; Tunkiewicz, M.; Szenti, I.; Kukovecz, A. Pore structure as a response to the freeze/thaw resistance of mortars. Materials 2019, 12, 3196. [Google Scholar] [CrossRef]
- Wang, Z.; Zeng, Q.; Wang, L.; Yao, Y.; Li, K. Characterizing blended cement pastes under cyclic freeze–thaw actions by electrical resistivity. Constr. Build. Mater. 2013, 44, 477–486. [Google Scholar] [CrossRef]
- Farnam, Y.; Todak, H.; Spragg, R.; Weiss, J. Electrical response of mortar with different degrees of saturation and deicing salt solutions during freezing and thawing. Cem. Concr. Compos. 2015, 59, 49–59. [Google Scholar] [CrossRef]
- ACI 211.1-91. Strandard Practice for Selecting Proportions for Normal, Heavyweight, and Mass Concrete; American Concrete Institute: Farmington Hills, MI, USA, 2002. [Google Scholar]
- Sicat, E.; Gong, F.; Zhang, D.; Ueda, T. Change of the coefficient of thermal expansion of mortar due to damage by freeze thaw cycles. J. Adv. Concr. Technol. 2013, 11, 333–346. [Google Scholar] [CrossRef]
- Liu, J.; Tang, K.; Qiu, Q.; Pan, D.; Lei, Z.; Xing, F. Experimental investigation on pore structure characterization of concrete exposed to water and chlorides. Materials 2014, 7, 6646–6659. [Google Scholar] [CrossRef] [PubMed]
- Nguyen Thi, H.Y.; Yokota, H.; Hashimoto, K. Effects of electrochemical chloride extraction on hydrated products of various cement paste systems. J. Adv. Concr. Technol. 2015, 13, 564–582. [Google Scholar] [CrossRef]
- Wang, Y.; Gong, F.; Zhang, D.; Ueda, T. Mesoscale study of water transport in mortar influenced by sodium chloride. J. Asian Concr. Fed. 2016, 2, 1–14. [Google Scholar] [CrossRef]
- Wang, Y.; Ueda, T.; Gong, F.; Zhang, D. Meso-scale mechanical deterioration of mortar due to sodium chloride attack. Cem. Concr. Compos. 2019, 96, 163–173. [Google Scholar] [CrossRef]
- JCI-S-001-2003. Method of Test for Fracture Energy of Concrete by Use of Notched Beam; Japan Concrete Institute (JCI): Chiyoda, Japan, 2003. [Google Scholar]
- Miura, T.; Sato, Y. Evaluation of relationships between mechanical characteristics and physico-chemical properties of mortar influenced by ca leaching at meso-scale level. Concr. Res. Technol. 2014, 25, 109–118. [Google Scholar] [CrossRef]
- C1585-04. Standard Test Method for Measurement of Rate of Absorption of Water by Hydraulic- Cement Concretes; ASTM International: West Conshohocken, PA, USA, 2004. [Google Scholar]
- Zeng, Q.; Zhang, D.; Sun, H.; Li, K. Characterizing pore structure of cement blend pastes using water vapor sorption analysis. Mater. Charact. 2014, 95, 72–84. [Google Scholar] [CrossRef]
- Zeng, Q.; Li, K.; Fen-Chong, T. Heterogeneous nucleation of ice from supercooled nacl solution confined in porous cement paste. J. Cryst. Growth 2015, 409, 1–9. [Google Scholar] [CrossRef]
- Kelham, S. A water absorption test for concrete. Mag. Concr. Res. 1988, 40, 106–110. [Google Scholar] [CrossRef]
- McCarter, W.; Garvin, S. Dependence of electrical impedance of cement-based materials on their moisture condition. J. Phys. D Appl. Phys. 1989, 22, 1773. [Google Scholar] [CrossRef]
- Jafari, A.; Erbektas, A.; Qiao, C.; Isgor, O.; Weiss, W. Relating the formation factor and chloride binding parameters to the apparent chloride diffusion coefficient of concrete. J. Mater. Civ. Eng. 2018, 31, 4018392. [Google Scholar] [CrossRef]


| Water: Cement Ratio (W/C) | Water kg/m3 | Cement kg/m3 | Fine Aggregate kg/m3 | Bulk dry Density (ρb) kg/m3 | Skeletal Density (ρ0) kg/m3 | Porosity |
|---|---|---|---|---|---|---|
| 0.3 | 292 | 974 | 1066 | 2173 | 2676 | 0.188 |
| 0.5 | 292 | 584 | 1397 | 2137 | 2688 | 0.205 |
| 0.7 | 292 | 418 | 1538 | 2125 | 2703 | 0.214 |
| Electrical Resistivity at Temperature 23 °C (Ω m) | Electrical Resistivity at Temperature −28 °C (Ω m) | ||||||
|---|---|---|---|---|---|---|---|
| W/C = 0.3 | W/C = 0.5 | W/C = 0.7 | W/C = 0.3 | W/C = 0.5 | W/C = 0.7 | ||
| DI water | 129.6 | 112.1 | 95.2 | 4622.5 | 3986.5 | 4745.5 | |
| 5 wt.% NaCl | 30.2 | 17.2 | 13.0 | 10,836.0 | 5500.6 | 1879.0 | |
| 15 wt. % NaCl | 11.0 | 11.6 | 6.2 | 762.2 | 476.9 | 296.4 | |
© 2020 by the authors. Licensee MDPI, Basel, Switzerland. This article is an open access article distributed under the terms and conditions of the Creative Commons Attribution (CC BY) license (http://creativecommons.org/licenses/by/4.0/).
Share and Cite
Wang, Y.; Ueda, T.; Gong, F.; Zhang, D.; Wang, Z. Experimental Examination of Electrical Characteristics for Portland Cement Mortar Frost Damage Evaluation. Materials 2020, 13, 1258. https://doi.org/10.3390/ma13051258
Wang Y, Ueda T, Gong F, Zhang D, Wang Z. Experimental Examination of Electrical Characteristics for Portland Cement Mortar Frost Damage Evaluation. Materials. 2020; 13(5):1258. https://doi.org/10.3390/ma13051258
Chicago/Turabian StyleWang, Yi, Tamon Ueda, Fuyuan Gong, Dawei Zhang, and Zhao Wang. 2020. "Experimental Examination of Electrical Characteristics for Portland Cement Mortar Frost Damage Evaluation" Materials 13, no. 5: 1258. https://doi.org/10.3390/ma13051258
APA StyleWang, Y., Ueda, T., Gong, F., Zhang, D., & Wang, Z. (2020). Experimental Examination of Electrical Characteristics for Portland Cement Mortar Frost Damage Evaluation. Materials, 13(5), 1258. https://doi.org/10.3390/ma13051258